Final License Application
Exhibit D: Project Cost and Financing
White Pine Pumped Storage Project
FERC Project No. 14851
White Pine Waterpower, LLC
February 2023
Final License Application – Exhibit D
White Pine Pumped Storage Project
List of Acronyms and Abbreviations
BESS Battery Energy Storage Systems
BLM Bureau of Land Management
CAES Compressed Air Energy Storage
CAISO California Independent System Operator
CCCT Combined-Cycle Combustion Turbine
DOE U.S. Department of Energy
FERC Federal Energy Regulatory Commission
FLA Final License Application
HPMP Historic Properties Management Plan
IRP Integrated Resource Plan
ITC investment Tax Credit
kW kilowatt
kWh kilowatt hour
Li-Ion Lithium-ion
MW Megawatt
NREL National Renewable Energy Laboratory
NRR Nevada Northern Railway
O&M Operation and Maintenance
Project White Pine Pumped Storage Project
PV photovoltaic (solar)
ROW right of way
SCCT Simple-Cycle Combustion Turbine
SWPPP Stormwater Pollution Prevention Plan
WPW White Pine Waterpower, LLC
1.0 Estimated Cost of New Construction
The following Exhibit discusses the cost and financing of the proposed White Pine Pumped Storage Project (Project; Federal Energy Regulatory Commission [FERC] No. 14851). White Pine Waterpower, LLC (WPW) is proposing the licensing, construction, and operation of the Project which will be located in White Pine County, Nevada
Table 1.0-1 provides a summary of total Project construction costs. The table includes the total cost for each major item, interest during construction, and other general expenses. The current estimated cost for construction of the proposed Project is approximately $2.8 billion at the time of filing this Final License Application (FLA) These costs are considered preliminary and subject to change due to market or other conditions, final Project design, inflation, and other relevant factors
Table 1.0-1. Summary of Estimated Cost of New Construction (2021$)
1.1 Estimated Direct Construction Costs
The current estimated cost of major Project works is approximately $1.49 billion, as presented in Table 1.1-1
Table 1.1-1. Estimated Direct Construction Cost (2021$)
Note: Allocated and Unallocated Growth Allowances of 30 percent are not included. A Contractor Risk Contingency of 15 percent, as well as a Project Risk Contingency of 15 percent, is included.
1.2 Estimated Indirect Construction Costs
The current estimated cost of indirect Project construction is approximately $589,896,000, as presented in Table 1.2-1
Table
1.2-1. Estimated Indirect Construction Costs (2021$)
Note: Allocated and Unallocated Growth Allowances of 30 percent are not included. A Contractor Risk Contingency of 15 percent, as well as a Project Risk Contingency of 15 percent is included.
1.3 Interest During Construction
Interest during construction is estimated at approximately $642,666,602 based on current market conditions.
1.4 Owners Costs
Owner’s Costs, including engineering, environmental measures, permitting, licensing, legal, and management are estimated at approximately $50,000,000.
1.4.1 Cost of Land and Water Rights
The Project is located largely on federal lands managed by the Bureau of Land Management (BLM). As required, proposed Project components on public lands administered by the BLM will require a right-of-way (ROW) grant. A ROW grant authorizes rights and privileges for a specific use of the land for a specific period of time. Generally, a BLM ROW is granted for a term appropriate for the life of the project. The ROWl agreements have not been finalized, but WPW has estimated land costs based on published BLM rental fees for energy projects. The 2025 cost is estimated at $3,291,000, with an annual escalation of 2.1 percent.
In February 2021, WPW entered into a water supply and option to purchase agreement with White Pine County for the supply of water to the Project for the period of construction and initial fill, and an option to purchase a water right for long-term, make-up water. The total cost for the expected amount of water required for the initial fill is $475,000.
1.5 Investment Tax Credit
The Inflation Reduction Act of 2022, which went into effect on August 16, 2022, establishes an Investment Tax Credit (ITC) for stand-alone energy storage, including pumped storage. The base credit is 6 percent, to which a 5x multiplier is applied for meeting prevailing wage and apprenticeship requirements, which potentially brings the ITC to 30 percent. There are also 10 percent bonus adders for location in what the Act defines as an Energy Community and for meeting a certain threshold for the value of domestic content used in construction of the facility. The White Pine Pumped Storage Project is expected to qualify for the 6 percent base, the 5x multiplier (bringing it to 30 percent), and the 10 percent bonus for domestic content, potentially bringing the total ITC to 40 percent. As the requirements for what constitutes locating in an “Energy Community” are still subject to IRS guidance, there remains the possibility that the Project will also qualify for the additional 10 percent bonus adder for being located in an Energy Community.
2.0 Cost of Existing Structures and Facilities
This is a new Project and does not include any previously constructed waterpower structures or facilities.
3.0 Federal Takeover
The Applicant is filing for an original license; therefore, the information required in this section is not applicable.
4.0 Estimated Annual Costs
Table 4.0-1 contains the average annual costs of the Project. The operation and maintenance (O&M) expenses for environmental measures are specified in Table 4.1-1 and included in total costs in Table 4.0-1. All costs shown are a 50-year average annual cost proxy, including cost escalation.
Environmental measures not included in the O&M costs listed in Table 4.0-1 are measures that will be enacted during construction (and are, therefore, a one-time cost) and for a specified, short period after construction, not for the life of the Project. For example, revegetation of areas disturbed during construction is not included below. The O&M costs shown in Table 4.0-1 are for the first year of operation; after the first year, an escalation rate of 2.0 percent was assumed for all annual costs.
1Does
4.1 Costs of Environmental Measures
Table 4.1-1 is a summary of the WPW’s estimated costs for the Project’s proposed environmental measures. The capital costs of environmental measures listed in Table 4.1-1 are the costs expected at the time the measures will be implemented, with sufficient contingency added for the measures to be completed. Capital costs for environmental measures are subject to change based on additional comments and consultation during the FERC licensing process.
1 The Cost of this measure is included in the Project’s estimated costs of new construction (see Section 1.0).
5.0 Estimated Annual Value of Project Power
Increasingly, solar and wind resources are supplying energy in the Nevada and greater regional market. This is evidenced by the recently voter-approved Nevada constitutional requirement for 50 percent renewable energy sourcing by 2030 and a law requiring 100 percent carbon-free resources by 2050. NV Energy has affirmed its goal for a 100 percent renewable energy future. Renewable resources have become the lowest cost sources of energy but they are non-dispatchable, intermittent, and variable in nature.
This fact, along with region-wide and nation-wide, policy-driven decarbonization of the energy supply, means that the market value of Project power for White Pine Pumped Storage will be based on the cost for future firm, dispatchable capacity. Since utilization of conventional, fossil fuel-based options for firm, dispatchable capacity (e.g., combustion turbines) is expected to decline significantly, the benchmark for dispatchable capacity becomes energy storage resources utilizing low-cost renewable energy as their charging source.
NV Energy’s resource planning documents do indicate some residual, gas-fired generation, but this is expected to be a small portion of the supply portfolio. Figure 4.1-1 indicates the significant planned reliance on new energy storage capacity in NV Energy’s system over the next two decades, whether under the “Battery” classification, “Open Position,” or “Firm Dispatchable” categories. It is also clear that significant amounts of Battery Energy Storage System (BESS) will be added to other regional utility portfolios. Therefore, in evaluating the annual value of Project power with the most likely alternative, the value of the Project can be compared with that of a large BESS using lithium-ion (Li-ion) technology, which is currently the dominant BESS chemistry. The cost comparison will be based on capital cost and fixed O&M costs.

5.1 BESS Cost Projections
Based on NV Energy’s published cost assumptions, the cost of BESS ranges from $355 to $455/kilowatt hour (kWh) for an asset with a 20-year design life. In a 2021 filing with the Nevada Public Utilities Commission, NV Energy reported a cost of $36,900,000 for a 26 megawatt (MW) BESS with 4 hours of storage installed in 2023, which indicates a cost of $1,419/kilowatt (kW), or a per-kWh capital cost of $355/kWh. PacifiCorp’s 2021 Integrated Resource Plan (IRP) uses a figure of $1,820 per kW for a 50 MW x 4-hour Li-Ion BESS, or $455/KWh, with a design life of 20 years.
The capital cost per kWh figures for BESS are higher than the estimated cost per kWh for the Project, and the Project will have a far longer lifespan.
Energy-component costs for BESS systems are expected to continue to decline through the early 2030s before leveling out. National Renewable Energy Laboratory (NREL) (2021) had projected a 2030 capital cost of ~$1,200/kW and $180/kWh (in 2020 dollars) for a 6-hour Li-ion BESS, although this was before recent supply chain issues resulted in a slower reduction in battery cost declines.
It should be noted that relying on projected costs for BESS systems incurs risks related to potential material supply shortages and environmental cost accounting (e.g., there is presently no method for recycling of spent Li-ion battery cell material), the effect of concerns about fire safety, and other factors.
5.2 Fixed O&M
Estimates for Fixed O&M costs for utility-scale BESS range up to $40/kW-yr when augmentation (maintenance of full storage capacity) is included. PacifiCorp 2021 uses a figure of $27.60/kW-yr for a 4-hour duration Li-ion BESS. NREL 2021 uses a figure of $35/kW-yr.
5.3 Adjusting BESS Costs for Comparison
5.3.1 Duration
The Project will have a full-capacity storage duration of 8 hours. Most BESS systems being installed today have storage durations of 2 to 4 hours. Duration requirements are expected to increase with renewable energy penetration. In order to compare the cost of the Project with a BESS alternative, a BESS storage duration of 8 hours should be assumed, with adequate augmentation required to maintain a full 8 hours over the operating life of the BESS. The NREL projections for 6 hours cited above can be extrapolated to ~$1,400/kW and $160/kWh for an 8-hour-duration system.
5.3.2 Lifespan
BESS systems are known to have a substantially shorter lifespan than pumped storage plants. Figures vary, but NREL’s 2021 Update of Cost Projections for Utility-Scale Battery Storage selects a figure of 15 years from among a range of estimates in other studies.
PacifiCorp’s 2021 IRP assumes a design life of 20 years, while Idaho Power’s 2021 IRP uses 15 years (Idaho Power 2021). These compare with a lifespan of over 100 years for pumped storage.
To conservatively compare the costs, a 50-year period and two BESS system replacements (i.e., three installations) should be used. Fixed O&M can be estimated at $20/kW-yr for the pumped storage and $30/kW-yr for the BESS. Applying a 5 percent discount rate, the pumped storage has a lower Project cost over the 50-year period, which is only half of its true expected life.
Pumped storage is better positioned than batteries to realize greater value from ITC tax credits, for the following reasons: (1) The capital cost for pumped storage is front-loaded at the beginning of a long lifespan, versus battery systems needing substantial recurring capital investment to provide a comparable lifespan, and (2) pumped storage has a greater ability to source its components domestically and thus is more likely to qualify for the domestic content bonus tax credit.
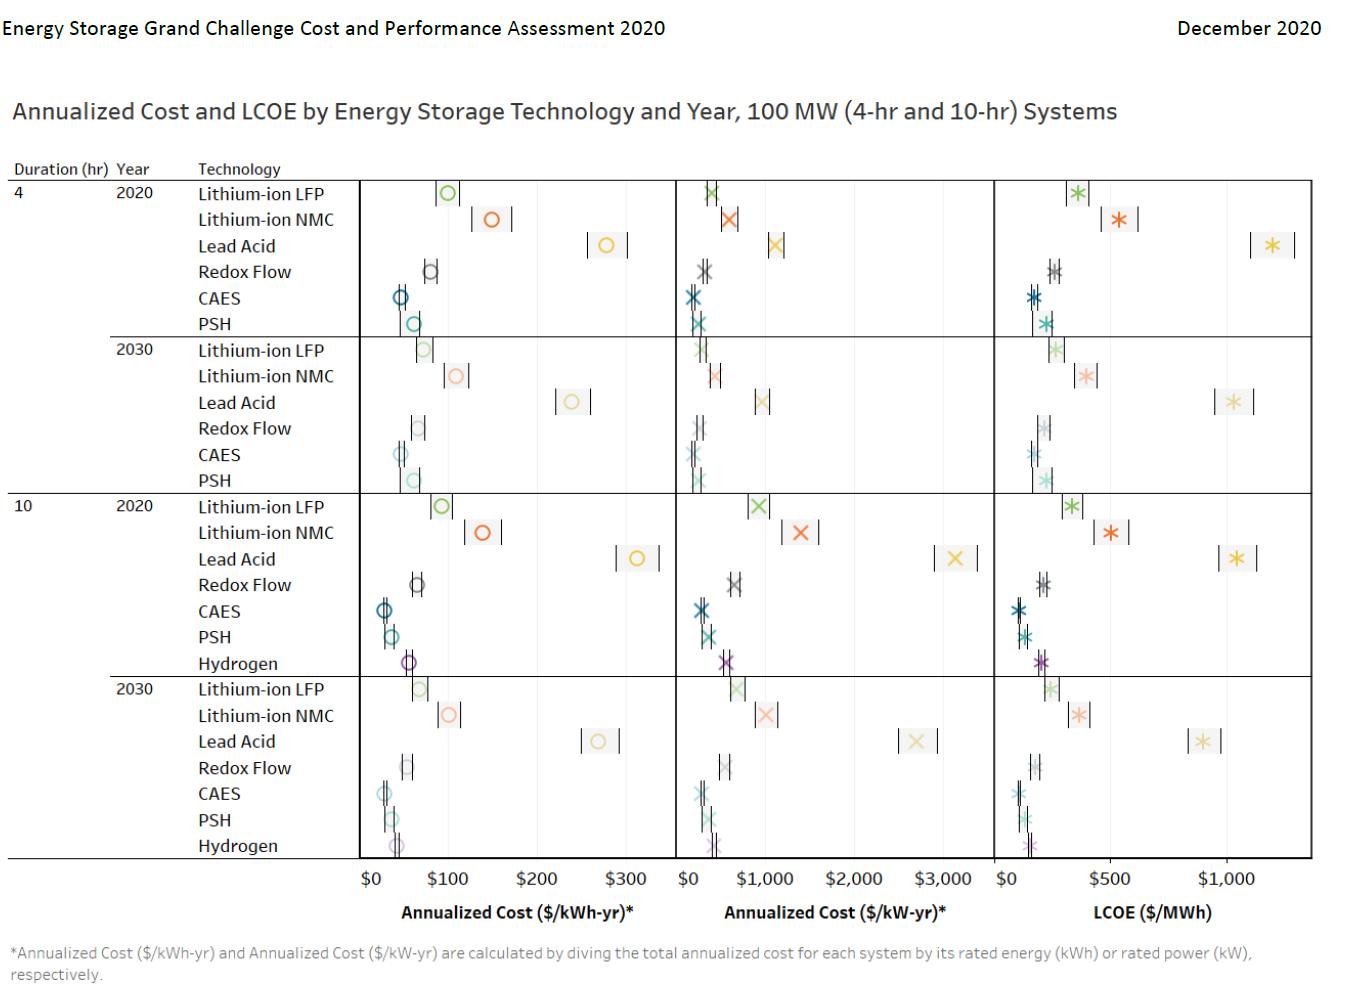
5.4 DOE 2020 Comparison
For another basis of comparison, the U.S. Department of Energy’s (DOE) 2020 Grid Energy Storage Technology Cost and Performance Assessment (Dec 2020) (DOE 2020) includes projected costs for an 8-hour Li-ion BESS, using the Lithium iron phosphate chemistry that is expected to become dominant. Total installed cost for the BESS is $2,131/kW, or $266/kWh. This cost is close to that of the Project. However, the calendar life estimated for the BESS is 10 years (2,100 cycles). In its storage technology assessment, DOE assumes the calendar life for pumped storage is given as 40 years and 13,870 cycles. Thus, when the figures are annualized, the cost for pumped storage using figures similar to those for the Project is shown to be much lower (Figure 5.4-1).
5.5 Energy Value
The cost of charging energy can be assumed to be the same for pumped storage and for BESS. Furthermore, since the differential between peak and off-peak energy value is expected to be relatively low and similar for each technology, the value of Project energy will not be separated from the value of Project capacity. Differences in efficiency will be nominal. While BESS has slightly higher round-trip efficiency than pumped storage, BESS will incur some efficiency degradation through cycling, while pumped storage will not.
5.6 Ancillary Services Value
The Project will be able to provide a wide range of ancillary services from frequency regulation and voltage support to spinning reserve. Unlike in organized markets like the California Independent System Operator (CAISO), the value of these services is not quantified in most of the rest of the western region, including Nevada. Furthermore, the total market for ancillary services is relatively small, particularly for frequency regulation, which has historically been the most lucrative of services. Therefore, the value of ancillary services provided by the Project while important is not a decisive factor in value of the Project to the region and WPW does not attempt to quantify it here.
5.7 Costs of Conventional Alternatives
Comparison to conventional peaking resources such as combustion turbines or reciprocating engines would indicate a higher capital cost for the Project than these types of resources on a $/kW basis. For example, PacifiCorp’s 2021 IRP estimates the annual fixed cost for an “F” frame simple-cycle combustion turbine (SCCT) at $73.70/kW-yr in 2025. This, of course, does not include fuel cost and variable O&M. For a reciprocating engine, which is more flexible and efficient than a gas turbine, and thus may represent a better proxy for renewable-paired dispatchable capacity, PacifiCorp IRP’s estimated cost is $1,938/kW, with total annual fixed cost at $152.62/kW-yr.
For a more accurate comparison with these types of resources, cost of energy (or a perMWh-generated) should be determined along with cost of capacity. The energy used for pumping (the “fuel”) is most likely to be solar over-generation or off-peak wind energy that is already resulting in “negative pricing” (i.e., cost of energy below zero) in many markets, and which unused may be subject to curtailment. In fact, there will usually be some net gain in value due to the shift in time of delivery and avoidance of curtailment of renewable resources through utilization for charging. Therefore, the cost of charging/pumping energy that can be assigned to the Project can be assumed to be very low for purposes of estimating total product cost and value.
PacifiCorp’s 2021 IRP calculates the first-year total resource cost of the SCCT at $73.95/MWh, assuming a 33 percent capacity factor. The figure for a reciprocating engine, assuming the same capacity factor, is $90.69/MWh. These figures do not include any cost for carbon. If the Project were operated at its full capacity 365 days a year, it would also have a capacity factor of 33 percent. At a fixed cost of $230/kW-yr and energy value set at zero, resource cost in $/MWh would be $79.50 higher than that of an SCCT but considerably lower than that of a reciprocating engine set.
Operating costs for gas-fired resources are subject to fuel price uncertainty. They also have shorter useful lives than pumped storage, at 35 and 40 years, respectively, for SCCT and reciprocating engines. More important to the analysis, however, is that their operation emits significant amounts of carbon dioxide. Concern about anthropogenic climate change has made greenhouse gas emissions a major liability and has driven sweeping energy policy changes across the US. Accounting for the cost of carbon, let alone the lifespan difference and reduced ability to manage and make more effective use of renewable sources, effectively renders a lower value option (and potentially a liability or stranded assets at best) compared to the Project.
For the foregoing reasons, gas-fired generation resources no longer represent the benchmark for new utility supply-side options. The transition to low-carbon and no-carbon futures, either though state mandate or as policy chosen by individual utilities, means that utilities are reducing or eliminating the use of fossil-fueled resource additions to meet capacity needs. This shift is being reflected in most utility resource plans.
Instead, energy storage is regarded as essential to utilizing the massive amount of variable and intermittent renewable energy primarily solar and wind that are being added to the grid. Conventional peaking resources can be dispatched when those resources are
unavailable, but cannot provide the zero-emission, time-shifting capability or flexibility of energy storage.
6.0 Cost of Energy Alternatives
Other electric energy alternatives are discussed below.
6.1 Fossil-Based Generation
Coal-fired steam generation provides large-scale baseload energy, serving a very different function in an energy supply portfolio than pumped storage. As a major source of greenhouse gas emissions, all coal-fired generation in the market region for the Project is being phased out and there are no new plans for new coal-fired capacity additions. Coal is, therefore, not a viable alternative to the Project.
Gas-fired power plants include SCCT, combined-cycle combustion turbines (CCCT), and internal combustion reciprocating engines. Gas-fired generation has provided most of the peaking and intermediate capacity in the western market since the 1990s. CCCT plants are used for intermediate-to-baseload service. SCCTs, including frame turbines and aeroderivatives, are used for peaking power and are lower in initial capital cost than pumped storage. However, they, along with CCCT plants, are significant sources of greenhouse gas emissions and their inclusion in regional resource plans is being scaled back dramatically. Furthermore, while they can be used to follow variations in solar and wind output, they do not provide the energy storage function that will be critical for integrating large amounts of renewable resources. Gas-fired generation is, therefore, not a viable alternative to the Project.
6.2 Nuclear Power
Nuclear fission power plants have been providing baseload generation in many regions of the United States since the 1970s. Several plants operate in California, Arizona, and Washington.
While being carbon-free sources of generation, nuclear power plants using existing technology have very high capital costs, long development timelines, and are usually very large capacity facilities (>2 gigawatts). Disposal of nuclear waste remains a significant concern. There are no plans for new nuclear power in regional resource plans, including that of NV Energy. New nuclear technology specifically small modular reactors and natrium reactors has been proposed at sites in Idaho and Wyoming. Cost estimates for these pilot plants are very high, and even the modular plants would need to be operated at a close to baseload capacity factor to keep the cost of energy at a reasonable level.
Nuclear generation is a baseload resource and doesn’t provide the flexible energy storage services that will be required for the integration of large amounts of renewable energy. This fact, combined with cost, ongoing concerns about waste disposal, and the experimental nature of new nuclear technology options, indicates that nuclear power is not a viable alternative to the Project.
6.3 Renewable Resources
Solar energy, particularly photovoltaic solar (PV solar), is emerging as a dominant new form of electric energy supply across the U.S., and particularly in the western U.S. and in Nevada. It is one of the lowest cost energy sources available today and entails no greenhouse gas emissions. Solar output is also fairly predictable, with only cloud cover interrupting normal patterns of generation. However, those normal patterns involve a midday output peak, which does not coincide with peak demand, and no generation at all during the night. The result is the well-known “duck curve,” entailing a steep ramp in need for generating capacity that aligns with increasing load in the early evening. Since PV solar is not a firm or dispatchable generation alternative, it is not a viable alternative to the Project. In fact, for the reasons given, PV solar is a major driver of the need for energy storage resources like the proposed Project.
Wind energy is the other leading source of carbon-free energy seeing widespread deployment today. Where the wind resource is of high quality, the cost of wind energy is very low. Wind energy viability is very site specific, and Nevada in general is a relatively weak wind regime among the western states. This is why Nevada may seek to import wind energy production from other states, as NV Energy’s regulatory filings indicate. Furthermore, like PV solar, wind energy is not dispatchable and it has a much lower ability than solar to predictably match demand. Like solar, therefore, the use of wind energy is a major driver of the need for energy storage resources like the proposed Project.
Geothermal energy is also well-established, and Nevada has a significant number of geothermal power plants. Geothermal is carbon-free and, unlike PV solar and wind, provides firm power that is relatively dispatchable. However, the economics of geothermal power requires that they operate as baseload facilities. Geothermal resources are very site specific and require significant lead times and development risk. More generally, the cost of geothermal is depressing their inclusion in most resource plans where geothermal is an option. For these reasons, and since geothermal generation is generally baseload in nature and not able to provide the energy storage services needed for integrating other renewable resources, geothermal is not a viable alternative to the Project.
Hydroelectric power has provided relatively firm, carbon-free energy in parts of the western U.S., specifically the Pacific Northwest, California, and Colorado for many decades. Nevada does not have the potential for new significant conventional hydroelectric capacity due to its arid climate. Where hydroelectric power is being utilized in the state (e.g., the Hoover Dam) that reliance may be endangered by climate change and its effects on the Colorado River. Across a wider region, there is some potential for new small hydro additions to non-powered dams, but there are no plans for major hydropower projects akin to those developed in other parts of the west in earlier generations.
The lack of viable development opportunities for new major hydroelectric power sources in the western region, along with the other reasons give here, mean that hydroelectric power is not a viable alternative to the Project.
6.4 Other Pumped Storage
The viability of pumped storage projects requires a relatively rare combination of factors to be present, including excellent topography, land availability, acceptable geology, a source of fill water, acceptable level of environmental impact, correct sizing for the market, and interconnection options. Successful development also requires a competent development team and dedicated financing. No major projects have been constructed in the U.S. since 1995 and relatively few projects proposed, as represented by preliminary permits, advance into development and subsequently receive a FERC license.
FERC licenses have been issued to only three projects in the Western Electricity Coordinating Council region: Eagle Mountain in California, Swan Lake North in Oregon, and Gordon Butte in Montana. None have commenced construction. In addition, several projects have been recently proposed in Nevada specifically, with a number of preliminary permit applications filed with FERC. Pumped storage projects at the preliminary permit stage are considered speculative, and to WPW’s knowledge, none of these concepts has advanced beyond the conceptual phase.
As of today, there are to WPW’s knowledge no pumped storage projects proposed in Nevada with an equivalent or superior level of viability as that represented by the Project, based on the factors listed above; and none have to WPW’s knowledge advanced in terms of fundamental milestones to the extent of the proposed Project. Therefore, WPW concludes that there are no other projects in Nevada that can be considered viable alternatives to the Project.
6.5 Other Energy Storage Technologies
BESS are seeing increasing deployment, primarily in the form of Li-ion batteries paired with PV solar. The cost of batteries has fallen significantly over the past several years and costs are forecast to continue to decline. Stand-alone battery projects are being constructed at the scale of hundreds of megawatts, and projects at the gigawatt scale have been proposed. These systems generally have storage durations of 2 to 4 hours.
Like pumped storage, BESS represent dispatchable capacity that helps to integrate carbon-free renewable resources and will thus see significant deployment across the market. NV Energy’s resource planning indicates planned deployments of thousands of megawatts of battery systems. Compared with pumped storage, BESS have the advantage of shorter development times, modularity, and flexibility of location. However, BESS have substantial disadvantages compared to the Project:
• Higher cost at longer durations of storage, while longer duration will be increasingly important as renewable energy penetration increases;
• Significantly shorter useful life (10-20 years, depending on cycling);
• Degradation of storage capacity and efficiency through use (resulting in a higher fixed O&M cost for augmentation);
• Environmental impacts from mining of battery materials and the lack of methods for recycling spent battery cells;
• Fire risks, as evidenced by recent events at BESS installations in Arizona and California;
• Future supply risks associated with competition for materials (lithium and other materials) and political considerations (e.g., reliance on raw materials and manufacturing in China). Evidence of this risk is seen in recent industry studies showing a slowdown in battery price decline due to rising commodity prices and reduced production.
Using Li-ion as a benchmark for comparison in Section 5.0, the Project represents a lower, long-term, long-duration cost of storage than utility-scale batteries.
Other energy storage technologies (new battery technologies, hydrogen-based systems, and mechanical systems like rail energy storage and systems that lift and lower concrete blocks) are generally only at the demonstration or research and development stage and do not represent commercially available alternatives to the Project.
Compressed Air Energy Storage (CAES) is the only other long-duration energy storage technology with an established track record, but this technology requires very specific and rare geology. The CAES technology available today also requires some combustion of natural gas, a source of greenhouse gases. A CAES project in Utah is being developed for the only known “Gulf Coast” style domal-quality salt formation in the western United States. There are no known active proposals for CAES projects in Nevada.
6.6 Conclusion
In sum, while BESS are the most likely alternative to the Project in terms of addressing utility and market needs in the emerging low-carbon market, the advantages afforded by pumped storage in general, and by the Project in particular, make the Project an exceptional opportunity for meeting the needs of Nevada and the greater regional energy market.
7.0 Consequences of Denial of License Application
If the license application is denied and the Project not constructed as a result, consequences would include the following:
• The region would be more restricted in its choice of tools for integrating and firming renewable resources, placing more reliance on a technology (batteries) that is more expensive over the long-term than the proposed Project and which entails risks for ratepayers and the environment.
• Transmission build-out planned for the area could see less effective utilization from technical and economic standpoints. The proposed Project and its point of interconnection are located at an emerging strategic crossroads of transmission development (including NV Energy’s Greenlink project and potentially the northern extension of the SWIP line and the proposed Cross-Tie line) that is intended to facilitate the movement and delivery of low-carbon energy resources both within and through the State of Nevada. License denial and consequent non-construction of the Project would eliminate the potential for a major management tool for numerous regional entities responsible for the procurement and delivery of power.
• White Pine County would lose property tax revenues in the amount of hundreds of millions of dollars over the life of the Project, along with thousands of employment jobyears in construction and operation and associated indirect income and spending. The State of Nevada would also lose significant property tax income that is specifically dedicated to the furtherance of renewable energy development in the State.
• White Pine County would lose an opportunity to put to beneficial use the industrial water rights that it was originally granted for energy project development.
If the proposed Project were not constructed, the Project site would likely remain undeveloped, with the upper reservoir area continuing to be used for hunting and grazing activity.
8.0 Financing
Project construction will be financed through a combination of debt and equity. A power sale structure with a utility off-taker would most likely take the form of a long-term tolling agreement that covers fixed costs and O&M. Under a utility ownership structure, the utility off-taker will most likely rate-base the asset based on a justified ratio of cost and benefit compared with alternatives in the future market environment.
9.0 Cost to Develop the License Application
The estimated cost to develop the license application is $3 million.
10.0 On-Peak and Off-Peak Value of Project Power
As described in Section 5 of this exhibit, the primary value stream for a new pumped storage project in a high-renewable/low-carbon system is expected to be the ability to dispatch firm generation on demand (i.e., capacity) rather than the direct capture of the difference in value between peak and off-peak energy (arbitrage). Part of the reason for this has been a declining spread between peak and off-peak over the past two decades. Another factor driving the emphasis on capacity value rather than arbitrage is that the cost
of wind and solar energy today is below $30/MWh, and this low cost of energy is expected to be consistent throughout the future market environment of the Project.
That said, the recent significant shift away from carbon-based generation and toward solar and wind has had the effect, in some markets, of increasing the difference between hourly values, driven by the well-known “duck curve.” Excess mid-day solar production drives value down at this time of day, increasing the occurrence of “negative pricing,” i.e., market prices falling below zero. This is well documented in CAISO market reports, for example. Prices then rise steeply during the higher-demand period.
The best available recent reference to on-peak and off-peak values of Project power likely would be the CAISO market. Figure 10-1 through Figure 10-3 are drawn from the three most recent CAISO quarterly market reports for 2022. (Note: Scaling is different on the charts) (CAISO 2022a, 2022b, 2022c). These are only snapshots, and price spreads vary from year to year. These quarterly snapshots indicate maximum price differentials of up to $50/MWh across the day in the first quarter, $50 to $120/MWh in the second quarter of 2022, and up to $140/MWh in the third quarter. For longer duration storage, it is more appropriate to average the price spread across a broader portion of the day (i.e., longer periods for storage charging and discharging). In this case, the differential was closer to $40 to $50/MWh.


To reiterate, while the “duck curve” may increase these price spreads in the future WPW estimates that the primary market value of the Project will derive from capacity value rather than from arbitrage.
11.0 Literature Cited
California Independent System Operator (CAISO). 2022a. ISO Q1 2022 Report on Market Issues and Performance. September 6, 2022.
_____. 2022b. ISO Q2 2022 Report on Market Issues and Performance. October 14, 2022
_____. 2022c. ISO Q3 2022 Report on Market Issues and Performance. December 14, 2022.
Idaho Power 2021. 2021 Integrated Resource Plan. December 2021.
National Renewable Energy Laboratory (NREL) 2021. Cost Projections for Utility-Scale Battery Storage, 2021. Update, June 2021
NV Energy. 2022. 2022-2041 Integrated Resource Plan.
PacifiCorp. 2021. 2021 Integrated Resource Plan. September 1, 2021.
U.S. Department of Energy (DOE). 2020. Grid Energy Storage Technology Cost and Performance Assessment. December 2020.