Royal Life Saving Summer Drowning Report 2022/23
An investigation into drowning deaths across Australia between 1 December 2022 and 28 February 2023


SUPPORTED BY

Royal Life Saving Society - Australia (RLSSA) is focused on reducing drowning and promoting healthy, active and skilled communities through innovative, reliable, evidence based advocacy; strong and effective partnerships; quality programs, products and services; underpinned by a cohesive and sustainable national organisation.
Royal Life Saving is a public benevolent institution (PBI) dedicated to reducing drowning and turning everyday people into everyday community lifesavers. We achieve this through: advocacy, education, training, health promotion, aquatic risk management, community development, research, sport, leadership and participation and international networks.
© 2023 Royal Life Saving Society – Australia
This publication is copyright. Except as expressly provided in the Copyright Act 1968 and the Copyright Amendment Act 2006, no part of this publication may be reproduced, stored in any retrieval system or transmitted by any means (including electronic, mechanical, microcopying, photocopying, recording or otherwise) without prior permission from Royal Life Saving Society – Australia. For enquiries concerning reproduction, contact RLSSA on: Phone 02 8217 3111; Email: info@rlssa.org.au
Every attempt has been made to trace and acknowledge copyright, but in some cases this may not have been possible. Royal Life Saving apologises for any accidental infringements and would welcome any information to redress the situation.
Printed copies of this document are available upon request. Please contact: PO Box 558 Broadway
NSW 2007 Australia
Phone: 02 8217 3111

Email: info@rlssa.org.au
The drowning prevention research of the Royal Life Saving Society – Australia is proudly supported by the Australian Government.


Suggested Citation: Pickles, K., Pidgeon S. (2023) Summer drowning report 2022/23: An investigation into drowning deaths in Australia between 1 December 2022 and 28 February 2023, Royal Life Saving Society – Australia. Sydney.
OUR VISION
ABOUT ROYAL LIFE SAVING
RoyalLifeSaving.com.au
A water-loving nation free from drowning.
CONTENTS
3 About Royal Life Saving
4 Summer Drowning Report 2022/23 Snapshot
6 Summer 2022/23 – key insights
6 Summer 2022/23 Drowning Trends
7 Background
8 Part 1: Summer drowning deaths 2022/23
12 In focus: Peak drowning period –25 December 2022 – 2 January 2023
14 In focus: Heatwave-related drowning deaths –February 15-19, 2023
16 In focus: Historical summer drowning trends
18 State breakdown: New South Wales
19 State breakdown: Queensland
20 State breakdown: Victoria
21 State breakdown: South Australia
22 State breakdown: Western Australia
24 Part 2: Influencing factors to drowning risk over the summer
28
32
34 Appendix 1: Historical summer drowning trends
35
ACKNOWLEDGEMENT OF COUNTRY
Royal Life Saving Society – Australia acknowledges the Traditional Owners of our national office in Ultimo, Sydney are the Gadigal people of the Eora nation. We pay our respects to Australia’s First Nations cultural and spiritual connections to water, and acknowledge the land where we work, live, and play always was and always will be Aboriginal land.
3
Awareness campaigns
So what? Recommendations
30 31
Methods
Limitations
33
References
90 Drowning Deaths
This is a 20% decrease on 2021/22
112 Drowning Deaths
77%
79% 23% 21% 1%
0-17 YEARS (11%)
18-34 YEARS (21%)
35-64 YEARS (43%)
65+ YEARS (18%)
UNKNOWN (8%)
INLAND (37%)
COASTAL (51%)
HOME SWIMMING POOL (7%)
PUBLIC & PUBLICLY ACCESSIBLE SWIMMING POOLS (4%)
OTHER (2%)
35-64 YEARS (45%)
65+ YEARS (20%)
UNKNOWN (4%)
INLAND (51%)
COASTAL (45%)
HOME SWIMMING POOL (1%)
PUBLIC & PUBLICLY ACCESSIBLE SWIMMING POOLS (0%)
OTHER (4%)
4 SUMMER DROWNING REPORT 2022/23 SNAPSHOT SUMMER 2022/23 1 December 2022 to 28 February 2023 SUMMER 2021/22 1 December 2021 to 28 February 2022 10 12 33 57 18 24 45 50 39 50 6 1 16 22 4 0 2 4 7 4
0-17 YEARS (11%) 18-34 YEARS (20%)
Month Month Sex Sex Age Age Location Location December (32%) January (33%) February (34%) December (38%) January (38%) February (25%) 29 42 30 42 31 28
SUMMER 2022/23
SUMMER 2021/22
1 December 2021 to 28 February 2022
DIVING (7%)
Definitions
Inland – includes rivers, creeks, lakes and dams
Coastal – includes beaches, coastal rocks and ocean/harbour locations
Home swimming pools – includes home pools, portable/temporary swimming pools
Public and publicly accessible pools – includes aquatic facilities, resorts, hotel/motels and caravan parks
Other - includes rescue, jumped in, fishing and rock fishing, swept away and swept in
Disclaimer – Media Analysis Only
2022/23 figures shown are derived from media reports only. As such, they should be considered interim, pending the outcome of ongoing coronial investigations.
2021/22 figures are derived from media reports and may vary from coronial statistics.
These numbers are likely to be different when final drowning deaths are reported in the National Drowning Report released in September
5 3% Activity Activity
39 31 14 15 6 5 8 15 14 38 9 8 SWIMMING AND RECREATING (43%) SWIMMING AND RECREATING (28%)
FLOOD-RELATED FLOOD-RELATED BOATING AND WATERCRAFT (16%) BOATING AND WATERCRAFT (13%)
DIVING (4%)
(7%)
FALLS (9%) FALLS (13%) OTHER (16%) OTHER (34%) UNKNOWN (10%) UNKNOWN
2 1 7 7 36 41 2 3 0 2 22 17 14 35 7 6 ACT (2%) NSW (40%) NT QLD (16%) ACT (1%) NSW (37%) NT (2%) QLD (31%) SA (8%) TAS (2%) VIC (25%) WA (8%) SA (6%) TAS (3%) VIC (15%) WA (5%) State or Territory State or Territory
1 December 2022 to 28 February 2023
20%
90 people drowned in summer 2022/23
25%
occurred between Christmas Day and 2nd January
19%
This is a 20% decrease from the previous summer
22%
occurred on a public holiday
occurred during heatwave/ extreme weather
Summer 2022/23 Drowning Trends
Swimming pool closures during the COVID-19 pandemic and lockdowns are continuing to impact on children’s and adults’ swimming skills and fitness. Seven male adults lost their lives during an attempted rescue of children at beach and lake locations. This reinforces the importance for adults and children to continue building on their swimming and water safety skills, as well as their swimming fitness levels. Our research has shown that up to 40% of children are leaving primary school unable to achieve the minimum National Benchmark for swimming and water safety skills. Overestimation of swimming ability and an underestimation of the risk often leads to inaccurate risk perception by adults, which may have also been a factor in these drownings. More people swimming and recreating at unpatrolled locations has led to an increase in coastal drownings.
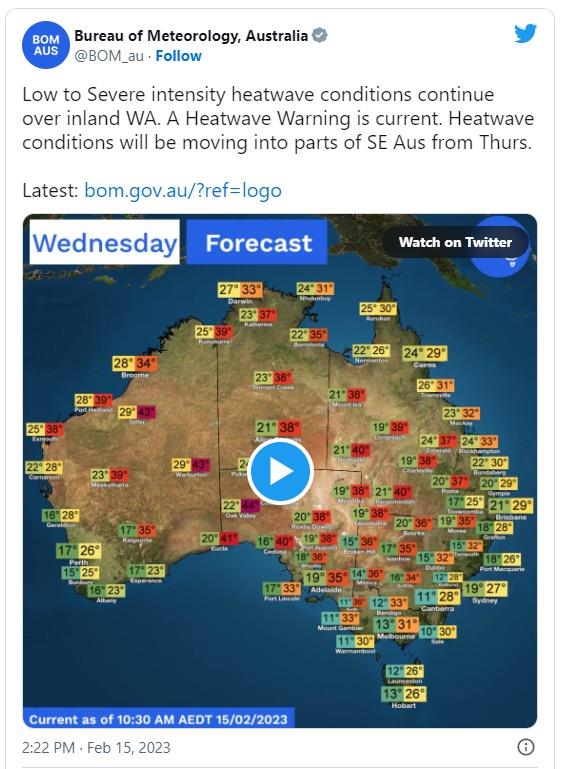
Extreme heat across the country on the weekend of February 15th – 19th led to 15 drowning deaths, in inland and coastal locations.
During the month of December, people aged 0 – 17 years were at the highest risk of drowning. The locations where people in this age group were most at risk of drowning were lakes and swimming pools.
During the month of January and February, people aged 35 – 64 years were at the highest risk of drowning. The locations where people in this age group were most at risk of drowning were beaches and rivers/creeks.
6 SUMMER 2022/23 – KEY INSIGHTS
BACKGROUND
Royal Life Saving has been running a Summer Drowning Toll website since summer 2018/19 in response to the number of drowning deaths that occur almost daily over the summer months and various media collating their own records of people drowning The purpose of the website is to inform media and the public of drowning deaths in real time.
The website is publicly accessible on the Royal Life Saving website and updated daily from the 1st December to 28th February and is a record of all drowning deaths that are reported in media reports during the summer months. This is also informed by the Victorian Coroners Prevention Unit through Life Saving Victoria, and Surf Life Saving Australia incident reports.
The deaths reported on the Summer Drowning Toll website are not yet under investigation from the coroner, therefore numbers are considered interim and will be different to the confirmed drowning deaths published in the National Drowning Report released in September
The Summer Drowning Toll has informed a number of water safety media stories and awareness campaigns to increase public awareness of water safety and drowning during the summer months and informs prevention strategies and advocacy for the following year.
Aims
Analyse summer drowning deaths that were reported in the media between 1 December 2022 and 28 February 2023
Compare trends of drowning deaths reported in the media from the previous five years (2017/18 up to 2022/23)
PART 1: SUMMER DROWNING DEATHS 2022/23
Coastal waterways (beaches, oceans/ harbour and rocks)
Inland waterways (rivers, creeks, lakes and dams)
(swimming pools, tanks,)
8
Between 1 December 2022
February
Environment Age breakdown 77% of summer drowning deaths were males people drowned in Australia 90 Recreational 59 Heatwave/ extreme weather 20 11% 20% 43% 18% 8% 0-17 years18-34 years35-64 years65+ yearsAge un kn own 50%
13%
and 28
2023
36%
Other
7% DIVING/SNORKELLING


9 WA NT ACT 2% SA TAS QLD NSW VIC 16% 8% 0% 24% 8% 40% 2%
Territory breakdown
Location Activity
State and
42% BEACH 23% RIVER/CREEK
11% LAKE/DAM 2% OCEAN/HARBOUR 4% ROCKS 12% SWIMMING POOL 43% SWIMMING AND RECREATING 9% FALL
1% ROCK FISHING 6% OTHER 16% BOATING AND WATERCRAFT 10% ATTEMPTED RESCUE
10 Time of drowning 16%16% 11% 7% 10% 20%20% 0% 5% 10% 15% 20% MondayTuesday WednesdayThursdayFridaySaturdaySunday
Day of drowning on the weekend The three days that recorded the highest number of drowning deaths 36% occurred on a public holiday 19% occurred during the two weeks from Christmas Day to Sunday 2nd January 25% Afternoon Morning 20% Evening 13% Early Morning 1% Unknown 11% 55% 7 5 5 Saturday 18 February Monday 26 December Tuesday 27 December
WHEN DID PEOPLE DROWN?
01-December-202203-December-202205-December-202207-December-202209-December-202211-December-202213-December-202215-December-202217-December-202219-December-202221-December-202223-December-202225-December-202227-December-202229-December-202231-December-202202-January-202304-January-202306-January-202308-January-202310-January-202312-January-202314-January-202316-January-202318-January-202320-January-202322-January-202324-January-202326-January-202328-January-202330-January-202301-February-202303-February-202305-February-202307-February-202309-February-202311-February-202313-February-202315-February-202317-February-202319-February-202321-February-202323-February-202325-February-202327-February-2023
Risk Factors*
*Based on the information available at the time of writing
Swimming at unpatrolled coastal locations or after lifeguard patrols had finished for the day.
Sadly, 9 people drowned while attempting to rescue others, all drowning victims were males.
The public holidays between December 25th and New Year (January 2nd, observed public holiday) continue to be the highest risk for drowning, with 22 people drowning in this period.
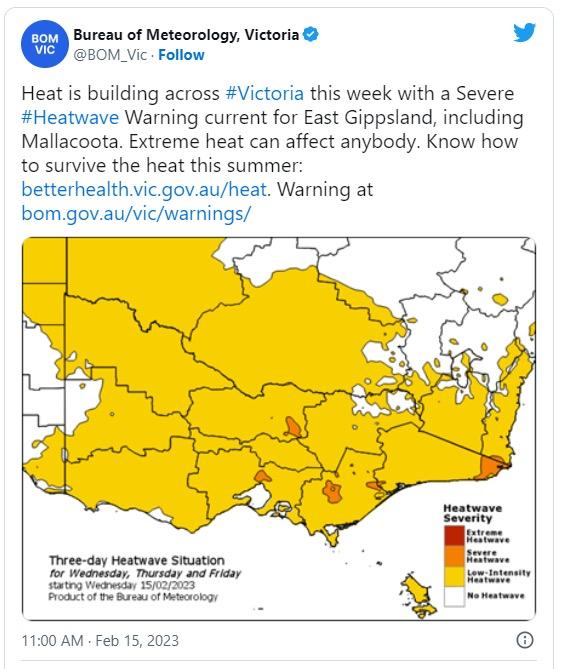
15 people drowned between February 15th – 19th when a heatwave warning was in place for New South Wales, Victoria, Queensland, Western Australia, South Australia and Tasmania.
Some people who drowned were alone at the time of the incident –were either alerted by a member of the public at the time, or the person was notified as being missing hours or days later.
Involvement of alcohol and drugs unknown at this stage
11 Number of drowning deaths by date 1-December-2021 to 28-February-2022 0 1 2 3 4 5 6 7 8
Between Sunday 25th December and Monday 2nd January of total drowning over summer occurred 25%
30%
25%
20%
15%
10%
Age
Of the two children aged 0-5 years who drowned this summer, both drowned during this period breakdown
100% 5%
0-17 years18-34 years35-64 years65 years+Unknown
12
FOCUS:
DECEMBER
TO
IN
PEAK DROWNING PERIOD - 25
2022
2 JANUARY 2023
of children 0-5 years who drowned during summer 23% 27%27% 19% 4% 0%
73% of drowning deaths during the peak period were males
The two days that recorded the highest number of drowning deaths over the entire summer period:
This period was Inclusive of:
13 Environment Activity
Drowning deaths that occured on public holidays Where of drowning deaths during this period were in Victoria of drowning deaths during this period were in New South Wales 5 2 5 36% 31% 5 Monday 26th December Weekends Tuesday 27th December public holiday days 3 55 22 25-Dec-2226-Dec-2227-Dec-2228-Dec-2229-Dec-2230-Dec-2231-Dec-221-Jan-232-Jan-23 11 2 1 45% Inland 36% Swimming & recreating 33% Coastal 23% Boating and watercraft 22% Other 18% Attempted rescue of others or object
IN FOCUS: HEATWAVE-RELATED DROWNING DEATHS - FEBRUARY 15TH-19TH, 2023
Between Wednesday 15th February and Sunday 19th February 15 people drowned during a heatwave
of total drowning over summer occurred 17%
87% of heatwave-related drowning deaths were males
0-17 years18-34 years35-64 years65 years+Unknown
14 0% 15% 56% 23% 6% 0% 10% 20% 30% 40% 50% 60%
Age breakdown
56%
of all drowning incidents during this period were people aged 35 – 64 years
was the average age of drowning deaths during this heatwave period people drowned on Saturday February 18
40% 33% 13%
of drowning deaths during this heatwave were in New South Wales
of drowning deaths during this heatwave were in Victoria
of drowning deaths during this heatwave were in South Australia
33% Inland
60% Coastal
47% Swimming & recreating
20% Diving and snorkeling 7% Other
13% Boating and watercraft
15 Environment Activity
Where
52 7
IN FOCUS: HISTORICAL SUMMER DROWNING TRENDS
Historical summer drowning trends 2017/18 to 2022/23
Historical summer drowning trends 2017/18 to 2022/23 by general location
Historical summer drowning trends 2017/18 to 2022/23 by age groups
16
0 20 40 60 80 100 120 2017-182018-192019-202020-212021-22 2022-23 NSW QLD VIC SA WA Australia 0% 5% 10% 15% 20% 25% 30% 35% 40% 45% 50% 2017/182018/192019/202020/212021/222022/23 0-17 years 18-34 years 35-64 years 65+ years unknown 0% 10% 20% 30% 40% 50% 60% 70% 2017/18 2018/19 2019/20 2020/21 2021/22 2022/ 23 Inland Coa stal Swimming pool (a ll) Other
Summer drowning deaths for 2022/23 were the highest for the last 3 years.
And a 8% increase from the previous summer
Drowning deaths in summer among people aged 35–64 years continues to rise
Non-fatal drowning
Flooding - no Flooding - yes
In comparison, drowning deaths among people aged 18-34 years are decreasing
Children aged 0-17 years consistently account for the lowest numbers of summer drowning deaths
The burden of drowning unfortunately reaches far beyond the impact of those that lose their lives. Many survivors of drowning have lasting and sometimes severe disability These injuries can have profound effects on the families and carers of these survivors as well as those injured. The Australian Non-Fatal Drowning Advisory Group (NFDAG) has been created to address this issue. The NFDAG combines the expertise of patient and family advocates, safety and injury prevention researchers and advocates, drowning prevention organizations (RLSSA, SLSA, SLSQ) and drowning researchers.
The aim of the advisory group is to explore the issues surrounding non-fatal drowning. These include advocating for improved access to ongoing services and support for survivors and their families, addressing knowledge gaps in drowning prevention and treatment and establishing the true extent (number of drowning survivors and the severity of their injuries) of non-fatal drowning in Australia.
17
Recreational drowning deaths only (swimming and recreating, boating and watercraft, diving and snorkelling)
Historical flooding-related summer drowning trends 2017/18 to 2022/23
Gender and Age breakdown
0 20 40 60 80 100 120 2018/172019/182019/202020/212021/222022/ 23
36 drowning deaths occurred in NSW over 2022/23
78% of
drowning
This is a 12% decrease from the previous summer
16% were heatwave-related
deaths in New South Wales were male
Age breakdown
and
56% BEACH 47% SWIMMING AND RECREATING 14% RIVER/CREEK 5% FALL
18 36 39 34 28 41 36 2018/172019/182019/202020/212021/222022/23 8% 14% 47% 20% 11% 0-17 years18 - 34 years35-64 years65 years+Unknown
11%
OCEAN/HARBOUR
STATE BREAKDOWN: NEW SOUTH WALES
LAKE/DAM 2%
14% BOATING AND WATERCRAFT 5% DIVING/SNORKELLING
2017/18 to 2022/23
Summer drowning deaths in New South Wales
summer
When Location Activity 72% in the afternoon 41% in February 19% occurred
19%
on a public holiday
occurred between 25th December
2nd January 11% ROCKS 25% OTHER
7%
19 15 28 10 20 35 14 2017/182018/192019/202020/212021/222022/23 0% 43% 57% 0% 0% 0-17 years18-34 years35-64 years65 years+ Unknown 21% RIVER/CREEK 72% SWIMMING AND RECREATING 14% BOATING AND WATERCRAFT 7% LAKE/DAM 7% UNKNOWN 21% PUBLIC SWIMMING POOL 7% OTHER QUEENSLAND
drowning deaths
Queensland 2017/18 to 2022/23
breakdown
of drowning deaths
Queensland
14 drowning deaths occurred in QLD over 2022/23 summer This is a 60% decrease from the previous summer When Location Activity 36% on a weekend 43% in January 7% occurred on a public holiday 14% occurred between 25th December and 2nd January
Summer
in
Age
71%
in
were male
7% were flood-related were heatwave-related 51% BEACH
18% UNKNOWN
14% DIVING/SNORKELLING
14% BOATING AND WATERCRAFT
9% FALL
20
41% SWIMMING AND RECREATING
VICTORIA Summer drowning deaths in Victoria 2017/18 to 2022/23 Age breakdown 73% of drowning deaths in Victoria were male 22 drowning deaths occurred in VIC over 2022/23 summer This is a 29% increase from the previous summer 23% were heatwave-related When Location Activity 36% on a weekend 36% occurred in December 32% occurred on a public holiday 36% occurred between 25th December and 2nd January 17 26 8 20 17 22 2017/182018/192019/202020/212021/222022/23 18% 14% 32%32% 4% 0-17 years18-34 years35-64 years65 years +Unknown 37% BEACH
RIVER/CREEK
LAKE/DAM
BATHTUB
27%
14%
4%
18% PRIVATE SWIMMING POOL
43% RIVER/CREEK
14% BEACH
14% PRIVATE SWIMMING POOL
14% BATHTUB
14% OCEAN/HARBOUR
29%
43% UNKNOWN
29% OTHER
14% BOATING AND WATERCRAFT
14% DIVING/SNORKELLING
21
SOUTH AUSTRALIA Summer drowning deaths in South Australia 2017/18 to 2022/23 Age breakdown 86% of drowning deaths in South Australia were male 7 drowning deaths occurred in SA over 2022/23 summer This is EQUAL to the previous summer When Location Activity 29% on a weekend 57% occurred in December 14% occurred on a public holiday 14% occurred between 25th December and 2nd January 5 7 5 2 77 2017/182018/192019/202020/212021/222022/23 29% 0% 13% 29%29% 0-17 years18-34 years35-64 years65 years+ Unknown
29% were flood-related were heatwave-related
22
BEACH
SWIMMING AND RECREATING
LAKE/DAM
& WATERCRAFT
AUSTRALIA Summer drowning deaths in Western Australia 2017/18 to 2022/23 Age breakdown 71% of drowning deaths in Western Australia were male 7 drowning deaths occurred in WA over 2022/23 summer This is a 16% increase from the previous summer 29% were flood-related When Location Activity 14% PRIVATE SWIMMING POOL 666 11 6 7 2017/182018/192019/202020/212021/222022/23 14% 29% 57% 0% 0% 0-17 years 18-34 years35-64 years65 years +Unknown 57% on a weekend 42% occurred in January 14% occurred on a public holiday 29% occurred between 25th December and 2nd January 29% RIVER/CREEK 29% BAY
14%
42%
14%
29% FALL 29% BOATING
WESTERN
PART 2: INFLUENCING FACTORS TO DROWNING RISK OVER THE SUMMER

Impacts of weather
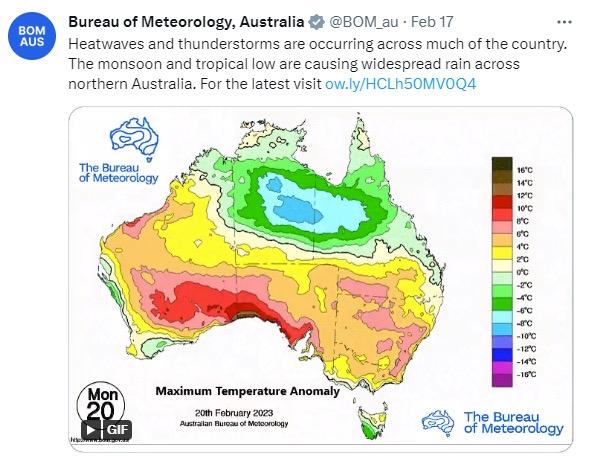
Last summer (2021/2022) was punctuated by extreme weather and natural events that can be linked to drowning risk. This summer (2022/23) saw a number of extreme weather events, including a tropical cyclone and heatwave warnings.
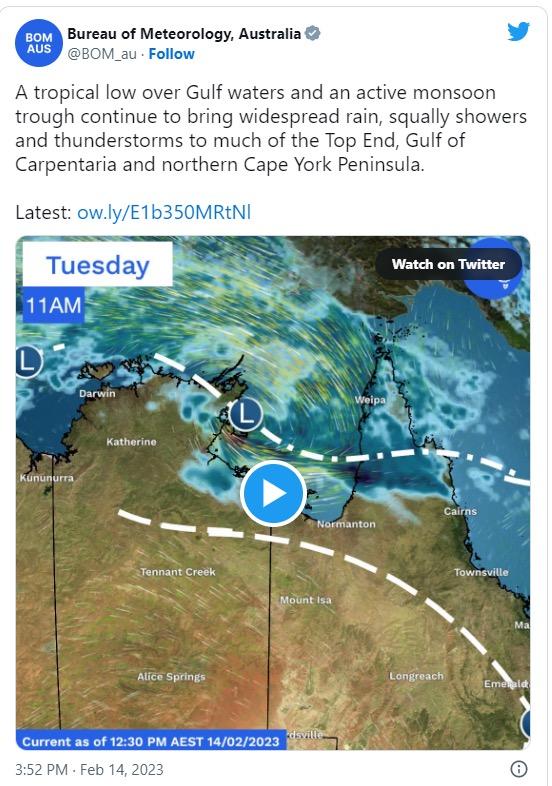
Tropical cyclone Ellie created monsoonal rainfall over the Northern Territory and the Kimberley Region of Western Australia. Enormous rainfall led to significant flooding on the Fitzroy River, central parts of the Northern Territory and several regions across northern Queensland. Major flooding also resulted along the Georgina River in northern Queensland, as well as the Leichhardt River systems. In the first half of January, severe storms across Victoria and parts of New South Wales brought strong winds, rain and hail. Flash flooding in Geelong and surrounds was recorded on January 24th.
Heatwave warnings were issued by the Bureau of Meteorology from February 15th – 19th.
24
December
For Australia as a whole, December rainfall was 33% above average.
Rainfall was above or very much above average for most of the Northern Territory, western Queensland and the Cape York Peninsula, the eastern half of the Kimberley and the Gascoyne in Western Australia.
Rainfall was below average for parts of the southern half of Australia, particularly in south-west Western Australia, eastern New South Wales, and western Tasmania.
Australia’s national areaaverage mean temperature was 0.21 °C below average for December.
Area-average mean maximum temperature for December was 0.33 °C below average nationally. The national mean minimum temperature was 0.11 °C below average.
Both mean maximum and mean minimum temperatures were below or very much below average across much of the eastern mainland states, and above average for the north-west and northern coast of Western Australia, and some areas around the top of the Great Australian Bight and Top End coast.
January
For Australia as a whole, January rainfall was 35% above average.
The mean maximum temperature for January was below average across most of northern Australia, and a pocket of the south coast of Western Australia; and above average for much of the South West Land Division in Western Australia, Tasmania, eastern South Australia, western Victoria, western New South Wales, parts of southern Queensland, and the New South Wales South West Slopes and Plains District.
Mean minimum temperatures were below average for the south coast of Western Australia, across the southern Kimberley and northern Interior District in Western Australia, extending into the south-west of the Northern Territory, and for pockets of the central coast of Queensland and north-eastern New South Wales; and above average for the northern tropics, Tasmania and most of Victoria away from the northwest and northern border, inland to coastal north-west Western Australia, and a large area around north-west New South Wales, north-east South Australia, and south-west Queensland.
February
For Australia as a whole, February rainfall was close to average.
Rainfall was above average for most of the Northern Territory away from the southern districts, most of north-western Queensland and the Cape York Peninsula, and for south-west Victoria, and a pocket of the coastal Pilbara in Western Australia.
Rainfall was below average for much of eastern and southern Queensland, New South Wales extending into adjacent eastern South Australia, most of northern and eastern Victoria, the South West Land Division and much of the interior of Western Australia, extending to the Nullarbor coast and coastal South Australia.
Australia’s national areaaverage mean temperature was 0.41 °C above the 1961–1990 average for February.
Area-average mean maximum temperature for February was 0.75 °C above average nationally. The national mean minimum temperature was 0.07 °C above average.
25
State breakdown
Western Australia:
Tropical Cyclone Ellie was a category 1 system that began as a tropical low north of Australia and formed as a named storm on 22 December 2022 before decaying below tropical cyclone strength. But as a tropical low it spent two weeks over the Northern Territory and the Kimberley region of Western Australia, where it generated enormous rainfall, leading to significant flooding on the Fitzroy River which continued into January 2023, with significant damage to transport infrastructure.
Queensland:
Several days of locally heavy falls of rain and thunderstorms affected many areas of Queensland at the start of January, including the Gulf Country, Peninsula, northern interior, and the tropical east coast, with daily rainfall totals generally in the range of 20 to 70 mm, and isolated falls of more than 100 mm over the southern Cape York Peninsula.
New South Wales and Victoria: On 2 January severe storms were observed across parts of Victoria, including around Maryborough and Bendigo. Large hail around 4 cm in diameter was reported south of Bendigo, with large quantities of small hail covering the ground in Bendigo
Moderate to major flooding continued along the Murray–Darling River system, with major flooding along the Darling River continuing well into January 2023.
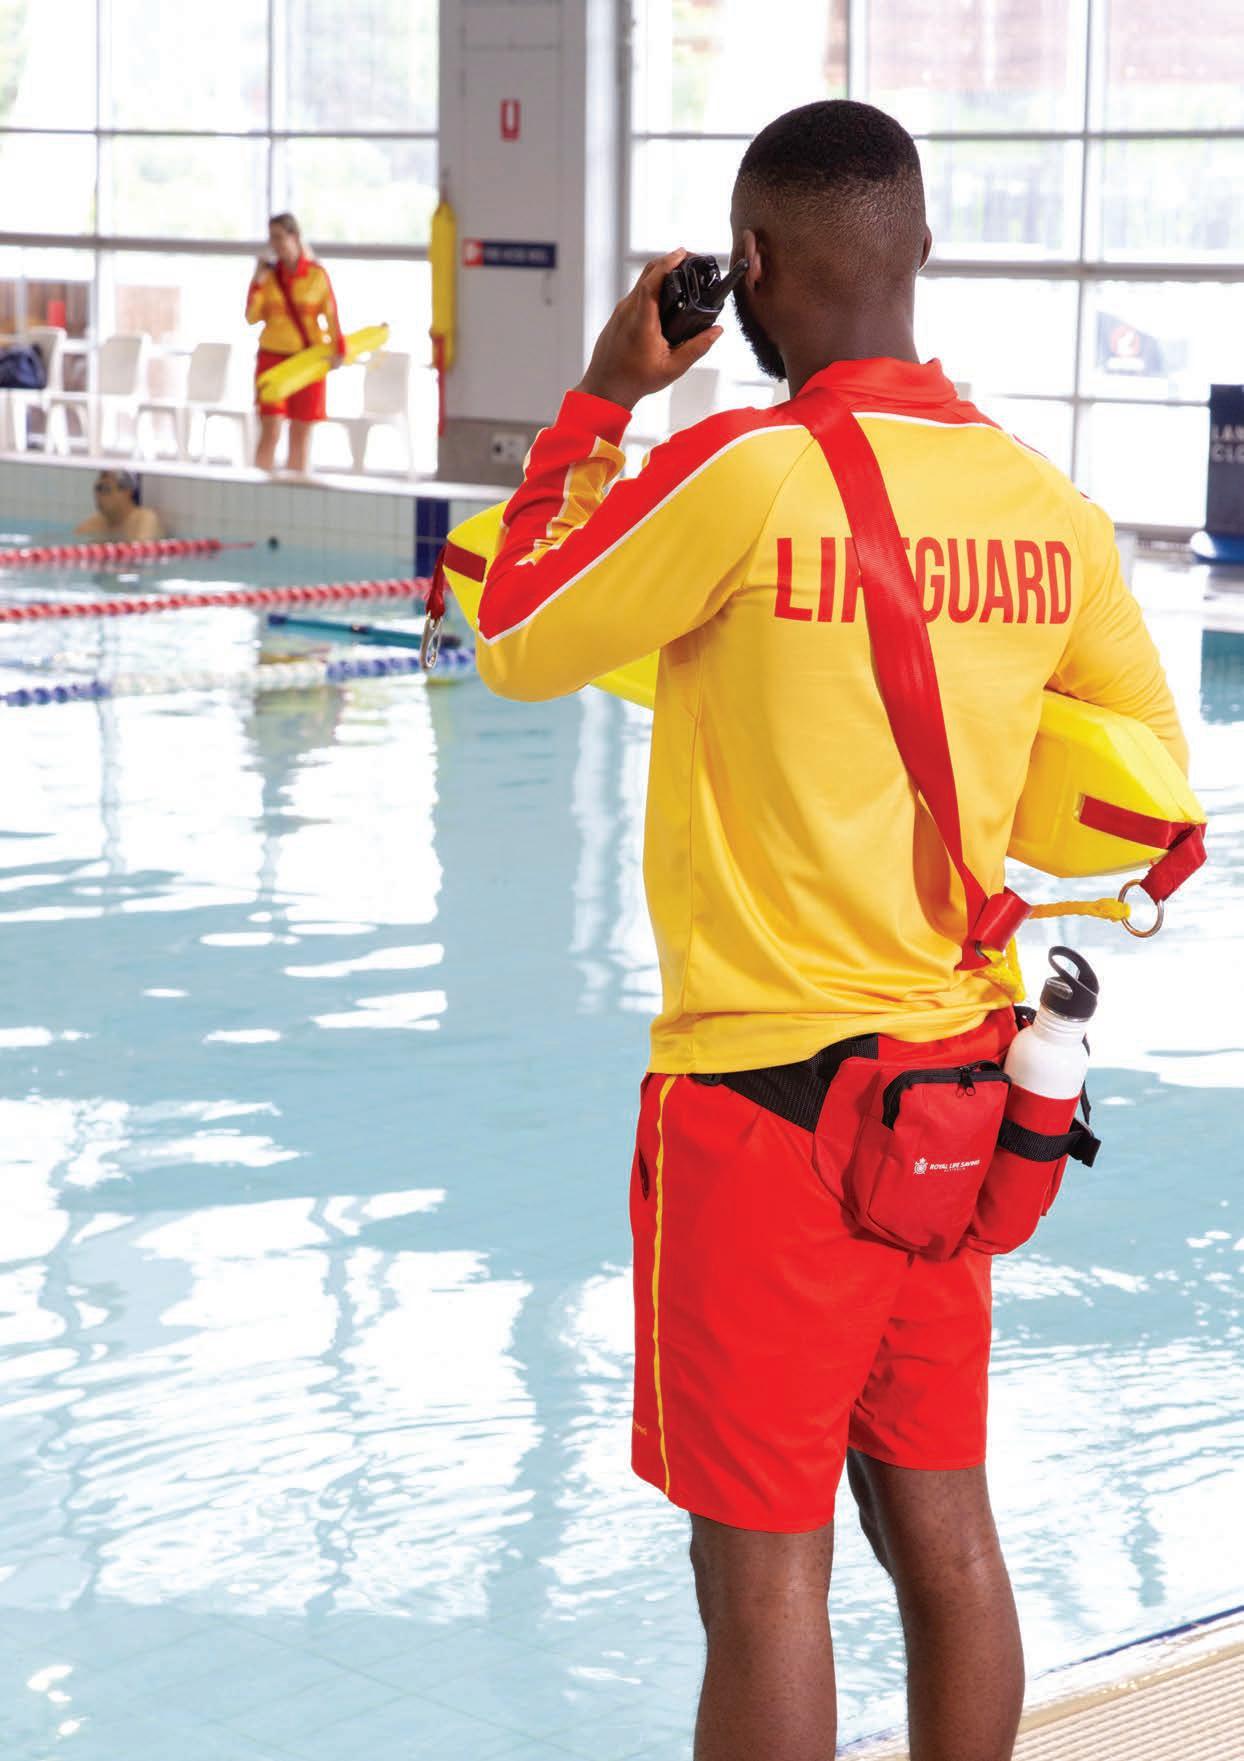
Impacts of lifeguard shortage on aquatic industry
This summer saw the highest number of public pool drownings compared with the previous five summer periods.
Systemic factors which may be contributing to an increase in drownings in publicly-accessible swimming pools:
Lack of swimming and water safety skills across the population following two years of pool closures
Lack of parent/guardian supervision and awareness of hazards and risks
Lack of appropriate lifeguard supervision in resort / hotel pools
Lack of adoption of public pool industry safety guidelines in resort / hotel pools (typically operate only in compliance with domestic standard (AS1926), which does not sufficiently address risk associated with public-access)
Systemic staffing shortages in industry contributing to a reduction in quality of lifeguard supervision
How Royal Life Saving is responding:
Advocacy on swimming and water safety skills
Reviewing child supervision program implementation across the public pool industry
Promoting child supervision campaigns with hotel / resort partners (NRMA)
Working with Work Health Safety and Tourism regulators to encourage the development of a Code of Practice for hotel / resort pool safety Workforce development initiatives and advocacy
26
AWARENESS CAMPAIGNS
National Water Safety Day
With the start of summer on 1 December 2022 marking National Water Safety Day, Australia’s political leaders and peak water safety authorities Royal Life Saving and Surf Life Saving urged Australians to make water safety awareness a priority. Vigilance around the water was especially important given the tragic events of last summer 2021/22, which had the highest ever recorded Summer Drowning Toll.
Minister for Aged Care and Minister for Sport, the Hon Anika Wells, said National Water Safety Day helped reinforce an important message:
“Australians love our summer days at the beach and by the pool but I urge families to be cautious and take a safety-first approach to water”, Minister Wells said.
Key messages
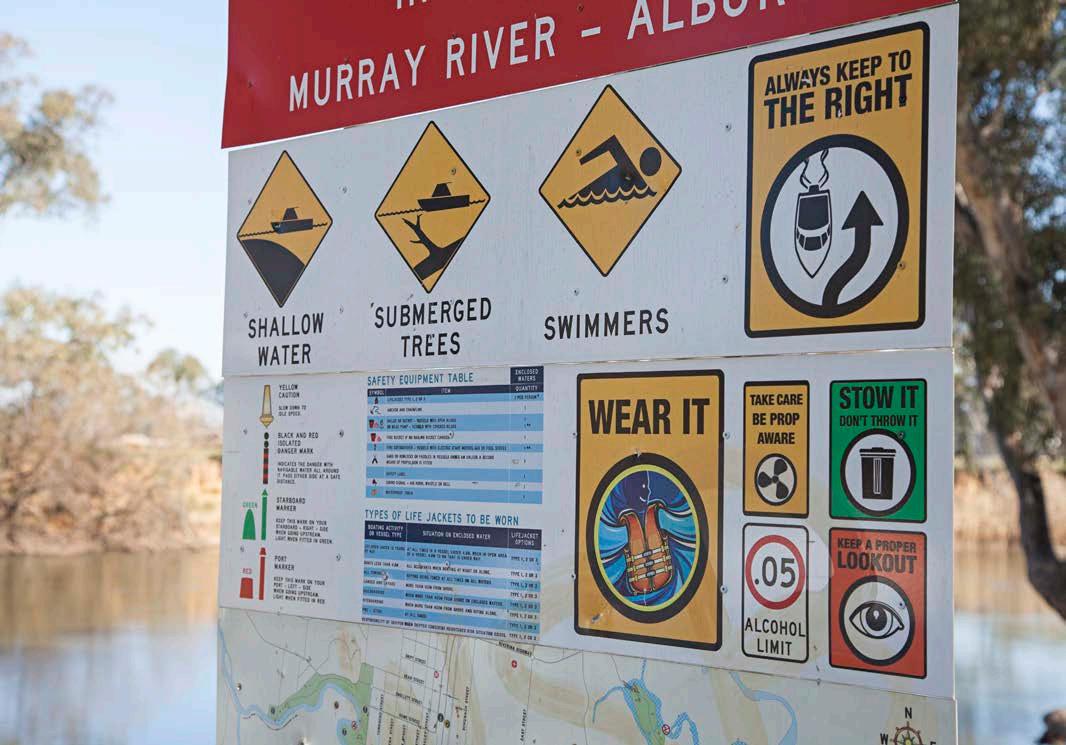
Swim at a patrolled beach between the red and yellow flags
Wear a lifejacket if you are going boating, rock fishing, or on watercraft
Avoid alcohol and drugs while undertaking water activities
Always supervise children on, in and around water at all times
Check weather conditions before heading out
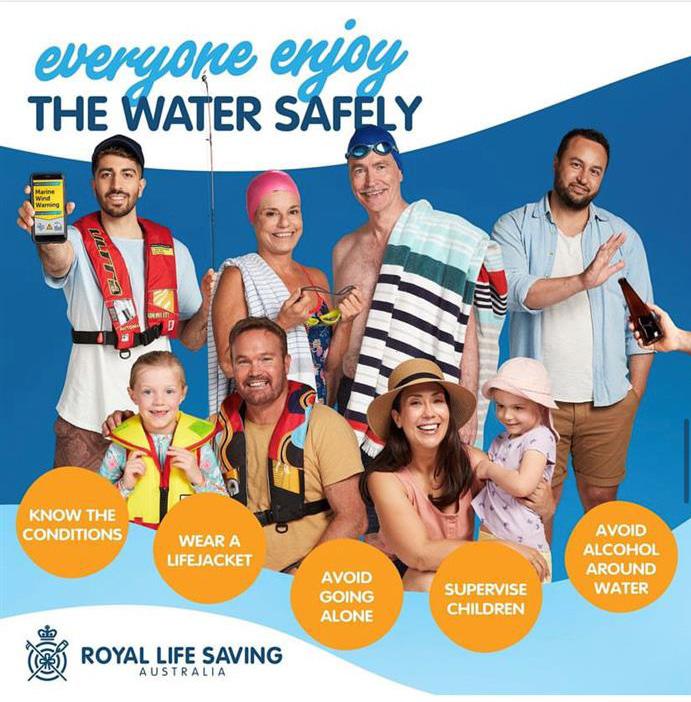
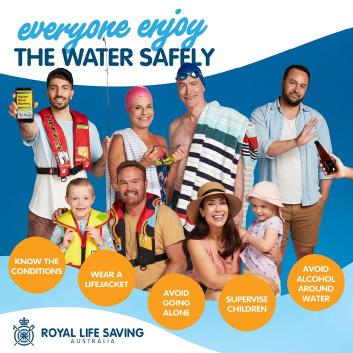
Royal Life Saving Summer Safety Campaign
This campaign launched prior to the Christmas holiday break and was promoted across December, January and February. It focused on looking out for friends and family around water, and urged people to enjoy the water safely over summer.
In 20 years of fatal drowning data, last summer (2021/22) had the highest number of deaths on record, with 145 people losing their lives to drowning across Australia. Royal Life Saving highlighted the need for everyone to prepare and brush up on safety precautions, especially in unfamiliar locations.
Key messages
Know the conditions
Avoid alcohol around water
Wear a life jacket
Avoid going alone
Always supervise children around water
The Summer Water Safety Messages were translated into 17 languages and shared via multicultural media channels including SBS Radio in-language.
Languages: Arabic, Bengali, Burmese, Chinese Simplified, Traditional Chinese, Dari, Farsi, Hazaragi, Hindi, Korean, Kurdish, Nepali, Pashto, Philipino, Swahili, Ukrainian and Vietnamese.
https://www.royallifesaving.com.au/about/campaignsand-programs/Summer-Water-Safety
28
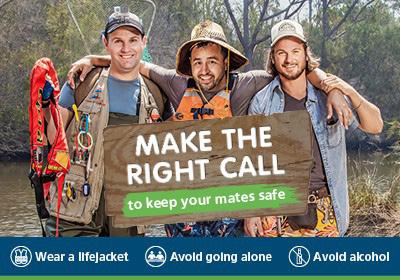
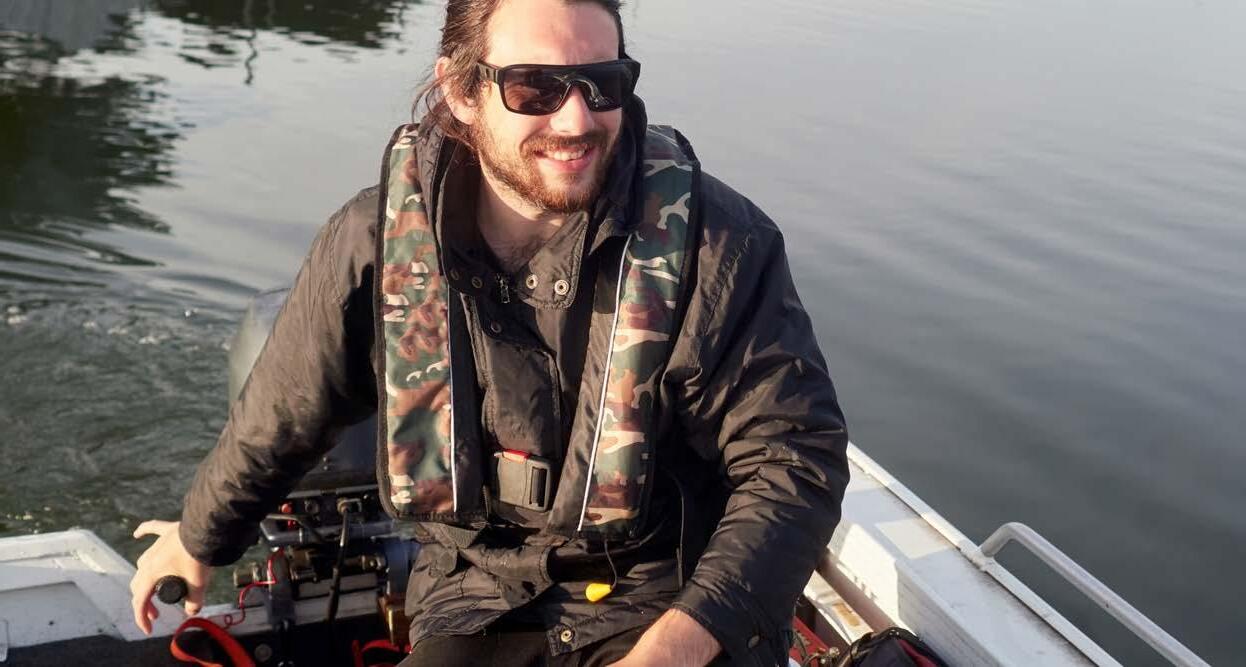
Make the Right Call
Men taking risks and overestimating their abilities continues to be our greatest challenge in drowning prevention, with males continuing to account for more than 80% of drowning deaths in Australia.
Make the Right Call, now in its fourth year, highlights the dangers of risk-taking behaviour around aquatic environments. The campaign specifically targets males aged 25 – 45 years to raise awareness of the issues and educate them on the risks and consequences of their actions when recreating in, on and around water. It advocates a commonsense approach by asking men to ‘Make the Right Call’ and look out for themselves and their mates when around water.
https://www.royallifesaving.com.au/about/campaignsand-programs/make-the-right-call
Key messages
Avoid alcohol around water
Wear a lifejacket when boating and fishing
Avoid going alone
Keep Watch
Royal Life Saving’s Keep Watch campaign has made significant inroads in helping to reduce drowning in children aged 0-4 since it was launched nearly 30 years ago. Drowning deaths however remain the leading cause of preventable death in this age group. Royal Life Saving launched the Keep Watch campaign in November in time for summer to remind parents and carers about the risks of child drowning.
Research figures showed that over the past 20 years, 549 children aged zero to four years drowned. Of these, 40 per cent were children aged one-year-old when they drowned. For every fatal drowning in this age group, a further eight children are admitted to hospital following a non-fatal drowning. Some of these children sustain life-long brain injuries.
Keep Watch key actions
Other summer water safety awareness campaigns (selected examples only)

• Surf Life Saving Australia –Swim between the Flags and the Think Line campaign
• Victorian Government stakeholdersPlay it Safe by the Water
• Victorian Government stakeholdersUnsinkable campaign targeting males
• Marine Safety organisationsBoating safety messages
• Lawrie Lawrence - Kids Alive
• Bureau of Meteorology –Dangerous weather, surf, wind and flooding warnings
29
Supervise Restrict access Teach Respond
Extreme weather-related events, including a tropical cyclone and heatwaves across the country have affected drowning rates over the summer.
Rescue-related drowning deaths increased this summer compared with last summer, with seven families experiencing the loss of a father, uncle, brother or friend this summer. We acknowledge the devastating impact that drowning can have on individuals but also their families and communities. The Summer Drowning Toll website and report is a key advocacy tool that can be used by individuals, drowning prevention advocates and policy makers to ensure we all take responsibility in realising a nation free from drowning.
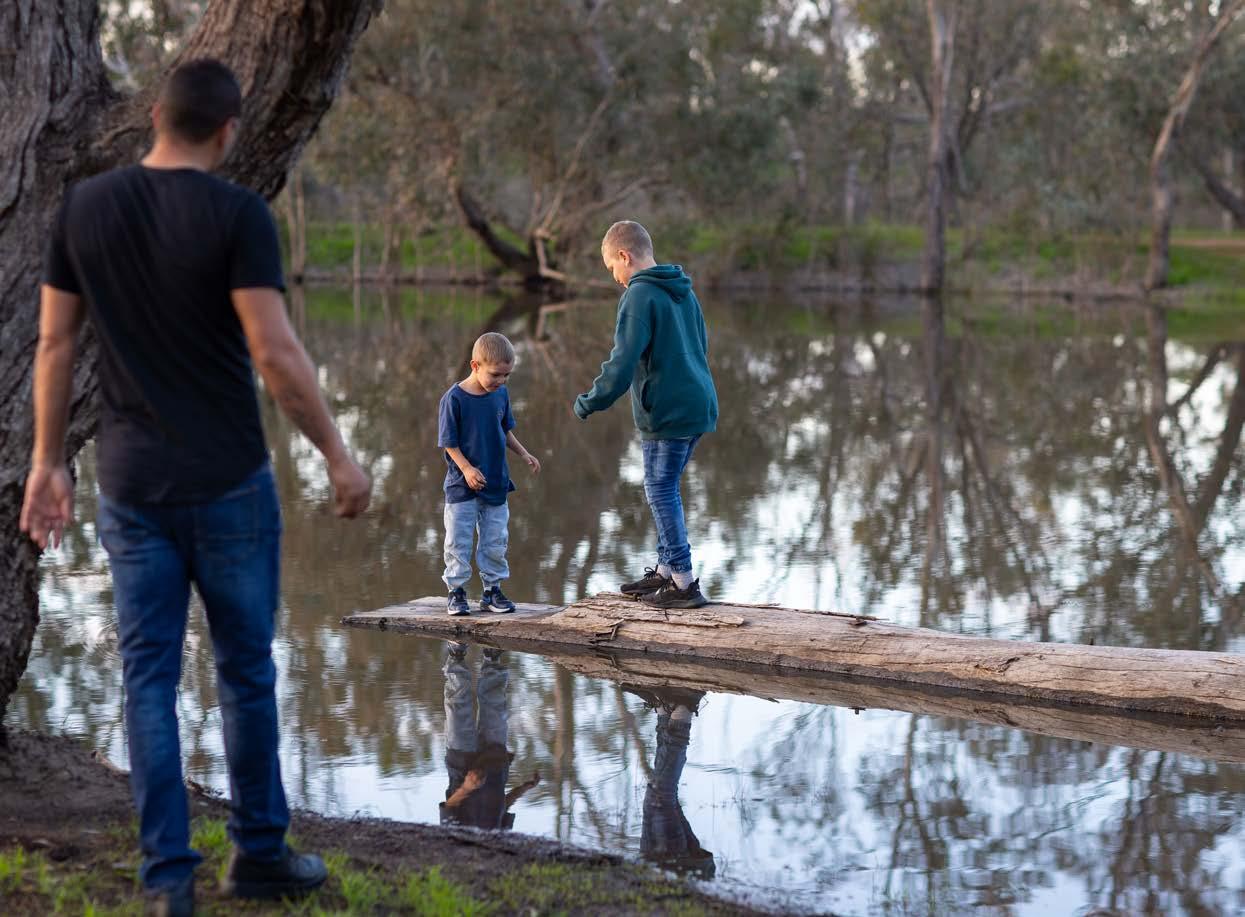
While this summer has seen a reduction in drowning deaths from the severe drowning rates of last summer, on average, one person drowned every day over summer. The drowning rates across each age group are not reducing. Drowning rates for children aged 0 – 17 years remain around 11% of all summer drowning deaths. Although the number of children drowning remain the lowest in comparison to other age groups, it is essential that supervision messages are constantly promoted over the summer period, especially during the Christmas –New Year period when the highest number of children drowned. Lakes were the location where the highest number of children drowned, followed by swimming pools. Boating and watercraft followed by swimming and recreating were the top two activities that resulted in drowning.
Drowning rates for adults aged 18 – 34 years remain around 27% of all summer drowning deaths. This summer, people in this age group were most at risk of drowning at beaches and rivers/creeks. Swimming and recreating, followed by falls into water were the top activities that led to drowning for this age group. Water safety messaging that reminds adults in this age group of the dangers of swimming in open water environments, as well as the importance of building on swimming fitness skills prior to summer, is recommended.
Drowning rates for adults aged 35 – 64 years continue to represent an average of 40% of all summer drowning deaths. People in this age group were most at risk of drowning at beaches and rivers/creeks. Swimming and recreating, followed by an attempted rescue were the top two activities that led to drowning for this age group. Further partnerships with local community groups and radio stations may enhance the reach of existing water safety campaigns targeting people in this age group.
Older adults aged 65 years and older remain at 17% of all summer drowning deaths. The top locations for people in this age group this summer were beaches and private swimming pools. Swimming and recreating and unknown activities was the leading activity that resulted in a drowning death in this age group. A specific campaign targeting older people aged 65 and over may also support the reduction in drowning for people in this age group. We know that Australia has an ageing population, with the proportion of Australians aged 65 and older increasing from 12% to 16% in the previous 20 years.
SO WHAT?
RECOMMENDATIONS
Complete a detailed analysis of summer safety awareness campaigns, and explore the potential consolidation of key messages
Extend partnerships with local councils, tourist agencies and accommodation providers to raise awareness of water safety among domestic tourists, specifically during the Christmas and New Year holiday period
Continue integration of water safety and drowning prevention strategies into flood awareness, heatwave and disaster resilience programs in collaboration with key agencies
Development of comprehensive local government water safety plans or strategies
Conduct research into the role of weather and climate change on drowning in Australia Review campaigns and programs targeting Australians over the age of 65 years
Implement measures to address generation of children who have missed out on learning to swim and survive
Deliver water safety awareness
activations on-site at key locations during the summer, in the afternoon, when people are most likely to visit
Evaluate the feasibility, effectiveness and sustainability of lifeguard based responses at high use or high risk inland waterways locations
Collaborate with local aquatic facilities (council and privately run) to offer reduced rates for pool entry during summer and public holidays
Pilot and evaluate the use of publicaccess rescue equipment at inland waterways and unpatrolled beaches
Develop and promote a rescuer drowning prevention campaign with key safety messages

31
METHODS
Collation of summer drowning cases
The data collated for this report are derived primarily from media reports of drowning deaths that occurred between 1 December 2022 and 28 February 2023. As such, these numbers should be considered interim, pending the outcome of ongoing coronial investigations. Drowning data for Victoria are drawn from a combination of media reports and data from the Coroners Prevention Unit. Historical drowning numbers used for this report have been derived from previous years Summer Drowning Tolls for comparative purposes, which are also from media monitoring, therefore numbers will not the same as that reported in National Drowning Reports. Consistent with all Royal Life Saving drowning reports, where deaths were known to be a result of suicide or homicide, deaths from natural causes, shark and crocodile attack were excluded. The data included in this report are to the best of the authors knowledge and as per the information available at the time. At the time of completing this report, 90 per cent of cases were under coronial investigation.
Definitions
The circumstances of the drowning incident were coded into defined variables related to age, sex, location, day of drowning incident, time of drowning, activity being undertaken. The time of drowning was coded into four bands: early morning (12:01am to 6am), morning (6:01am to 12pm), afternoon (12:01pm to 6pm) and evening (6:01pm to 12am).
Flood-related
Any drowning death that has been attributed to a flooding event, e.g., swept away, driving a vehicle or playing / swimming in flood water. This includes people who went missing prior to and inclusive of 28th February and were recovered as of 1st March 2023.
Recreational
All other drowning related deaths over summer that have occurred in a recreational or home context, including bathing. Note: underlying cause of death, such as a medical condition, is usually unknown until the coronial investigation has been completed and therefore all non-flood-related deaths have been included as recreational for the purposes of this analysis. As such, factors such as medical conditions, alcohol and drug involvement are unknown and not included in this report.
Location and activity definitions
• Inland: includes rivers, creeks, lakes and dams
• Coastal: includes beaches, coastal rocks and ocean / harbour locations
• Home swimming pools: includes home pools, portable / temporary swimming pools
• Public and publicly accessible pools: includes aquatic facilities, swimming pools at resorts, motels / hotels and caravan parks
• Other: includes rescue, jumped in, fishing and rock fishing, swept away and swept in
Weather patterns
Information related to the weather during this period was sourced from the Australian Bureau of Meteorology (BOM). BOM supplies publicly available climate summaries for both individual months and seasons for all States/Territories. The December 2022, January 2023 and February 2023 summaries were utilised to extract information related to temperature and rainfall, including any new records set during the course of the month.
32
LIMITATIONS
As indicated throughout the report, the figures regarding drowning deaths over summer 2022/23 should be regarded as interim until ongoing coronial investigations have been finalised. Following the conclusion of formal investigations, relevant documentation will be assessed, including autopsy reports, toxicology reports and coroner’s findings.
It is possible that the formal investigation of some cases may result in a change in the assigned cause of death. For example, a case may be determined to be due to natural causes, rather than drowning. This is why the final number of drowning deaths that occurred in summer reported in the Royal Life Saving National Drowning Report (released in September) will differ.
Risk factors commonly reported in Royal Life Saving National Drowning Report, such as the presence of alcohol and drugs, lifejackets, swimming ability were unknown at the time of writing and unlikely to be known until the coronial investigation has been conducted.
33
APPENDIX 1: HISTORICAL SUMMER DROWNING TRENDS
34
2017/18 2018/19 2019/20 2020/21 2021/22 Total 82 114 66 86 112 Flooding related 0 2 1 1 22 Month December 39% 40% 38% 35% 38% January 32% 35% 39% 45% 38% February 29% 25% 23% 20% 25% Male 74% 87% 91% 80% 79% Female 26% 13% 9% 17% 21% 0-17 years 15% 11% 9% 15% 11% 18-34 years 33% 33% 30% 29% 21% 35-64 years 38% 31% 38% 40% 45% 65 years+ 13% 19% 17% 10% 20% Unknown 1% 6% 6% 6% 4% State ACT 1% 3% 0% 2% 1% NSW 44% 34% 52% 33% 37% NT 0% 1% 2% 2% 2% QLD 18% 25% 15% 23% 31% SA 6% 6% 8% 2% 6% TAS 2% 2% 3% 1% 3% VIC 21% 23% 12% 23% 15% WA 7% 7% 9% 13% 5% Location Inland 29% 38% 44% 32% 51% Coastal 57% 56% 48% 59% 45% Home Swimming Pool 6% 6% 3% 7% 1% Publicly accessible swimming pool 2% 1% 3% 3% 0% Other 3% 0% 1% 1% 4% Activity Swimming 45% 46% 41% 28% 28% Boating & watercraft 13% 11% 23% 15% 13% Falls 9% 7% 5% 7% 13% Diving 5% 8% 9% 7% 4% Other 9% 11% 12% 16% 7%
References
1. Bureau of Meteorology (2022) Australia in summer 2022–23. Bureau of Meteorology March 2023. Available from: http://www.bom.gov.au/climate/ current/season/aus/summary.shtml

2. Bureau of Meteorology (2023). Australia in December 2022: Bureau of Meteorology; March 2023 Available from: http://www.bom.gov.au/clim_data/ IDCKGC1AR0/202212.summary.shtml
3. Bureau of Meteorology (2022). Australia in January 2023: Bureau of Meteorology; March 2023. Available from: http://www.bom.gov.au/clim_data/ IDCKGC1AR0/202301.summary.shtml

FOR MORE INFORMATION Call 02 8217 3111 Email info@rlssa.org.au CONNECT WITH US RoyalLifeSaving RoyalLifeSaving RoyalLifeSaving RoyalLifeSavingAust RoyalLifeSaving.com.au
