NATIONAL DROWNING REPORT 2023
people drowned in Australian waterways


IN PARTNERSHIP WITH

SNAPSHOT 1 JULY 2022 TO 30 JUNE 2023 IN PARTNERSHIP WITH
281
TOP 3 LOCATIONS TOP 3 ACTIVITIES 27% River/Creek 33% Swimming & Recreating 27% Beach 15% Fall 12% Ocean/Harbour 8% Boating
1% increase
Drowning Deaths in 2022/23 279 10-Year Average 77% OF ALL DROWNING DEATHS WERE MALES 57% WERE ADULTS AGED 45 YEARS AND OLDER 44% OCCURED IN MAJOR CITIES


3 Snapshot 2022/23 02 Foreword 04 Section One: When and how does drowning happen? 06 Section Two: People - Who drowns? 11 Children aged 0-4 years 16 Children aged 5-14 years 18 Young people aged 15-24 years 19 Adults aged 25-64 years 20 Older people aged 65 years and over 22 Section Three: Places - Where do people drown? 25 Coastal Environments 26 Inland Waterways 36 Swimming Pools 42 Section Four: Insights by State and Territories 46 Australian Capital Territory 48 New South Wales 50 Northern Territory 52 Queensland 54 South Australia 56 Tasmania 58 Victoria 60 Western Australia 62 Methods 64 Acknowledgments 65 Research and Policy Highlights 2022/23 66 References 76 CONTENTS ACKNOWLEDGEMENT OF COUNTRY Royal Life Saving Society – Australia and Surf Life Saving Australia acknowledge the Aboriginal and Torres Strait Islander people of this nation. We pay our respects to their Elders past, present and emerging recognising their continued connection to land, waters and communities.
The National Drowning Report 2023 provides an analysis of fatal drowning across Australia between 1 July 2022 and 30 June 2023.

This year’s report, the 29th edition, is the first National Drowning Report developed by Royal Life Saving Society – Australia and presented in partnership with Surf Life Saving Australia.
We are mindful of the devasting impact that drowning has on everyone affected: those who have died or had their lives forever altered by a non-fatal drowning incident, their families, friends, communities, and those who put their own lives at risk to save others.
This analysis is designed to help water safety organisations, community members, and those who manage water spaces to reduce the risk of drowning.
Tragically 281 people lost their lives to drowning between 1 July 2022 and 30 June 2023. We conservatively estimate that several hundred additional people were directly affected by non-fatal drowning, which often requires hospitalisation and can leave people with lifelimiting disabilities.
Drowning fatalities in young children continue to decrease
The number of drowning fatalities in young children (0-4 years) was 33 per cent below the 10-year average, highlighting the ongoing success of legislative changes to pool fencing regulations and water safety messages directed at the carers of young children.

Older adults are a growing concern
Adults 45 years or older represented 57 per cent of 2022/23 drowning deaths. Drowning was above the 10-year average for all age groups 45 years and older except for 65-74, where there was no change.
A range of factors contribute to drowning in adults including underlying heart or other medical conditions, especially while boating or using watercraft (including kayaking and surfing), bystander rescuer drowning deaths, and falls into water. Changing employment patterns, increased recreation by older adults, and decreased swimming fitness may all have contributed to this concerning increase in fatal drowning for older adults.
Poor swimming skills compound drowning risk
Swimming is the leading activity prior to drowning in all age groups and locations, except young children. We continue to be concerned about falling swimming and water safety skills among children and adults. The effects of missed swimming and water safety lessons throughout the COVID-19 pandemic will have generational impacts on safety if left unaddressed.

04 National Drowning Report 2023
FOREWORD
Justin Scarr
Chief Executive Officer
Royal Life Saving Society – Australia
Adam Weir
Chief Executive Officer
Surf Life Saving Australia
Coastal drowning deaths
Drowning deaths in coastal environments including those occurring at beaches, the ocean or harbours, and off rocky locations accounted for almost half of the national fatal drowning toll. While a decrease was observed compared to the previous year, the 125 coastal drowning deaths recorded was still three per cent above the 10-year average.

Rip currents remain the number one coastal hazard contributing to 28 drowning deaths this year, which equals one in five coastal drowning deaths. A significant increase was also recorded in drowning deaths involving bystanders who attempted rescues, but unfortunately, had no flotation device with them.
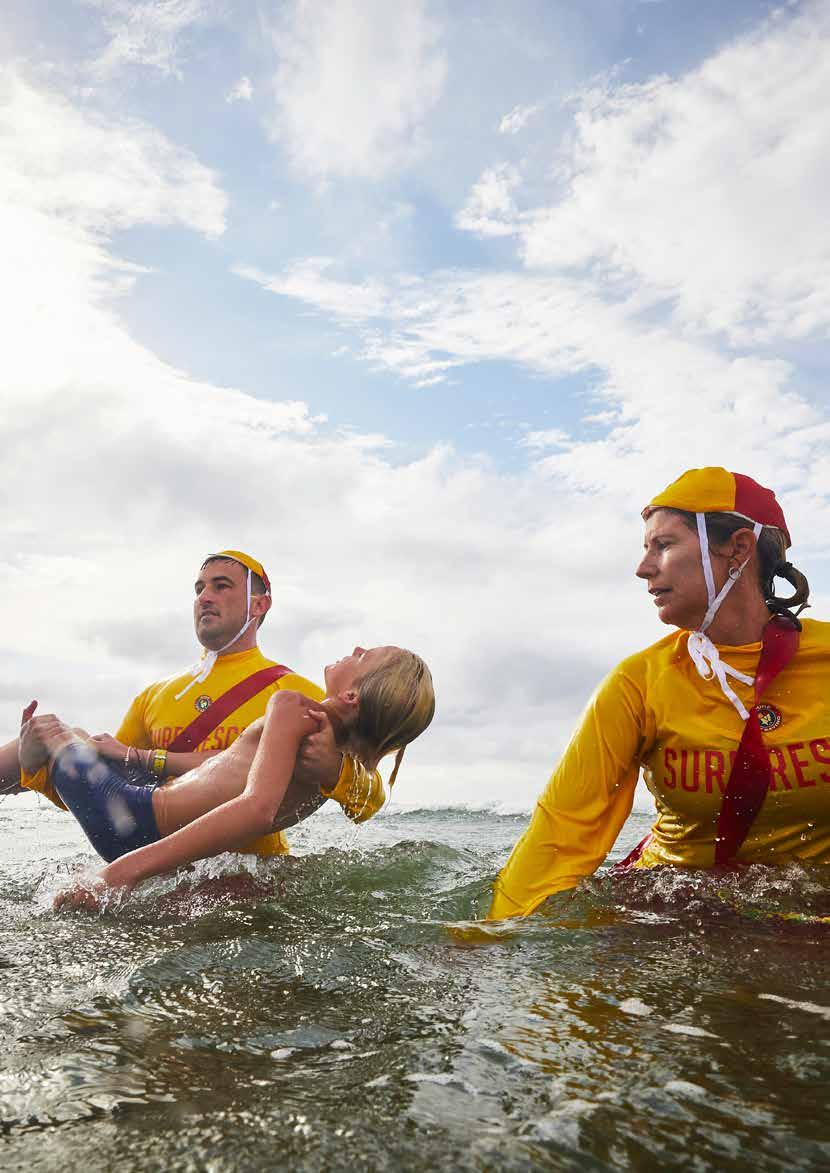
No one plans to get into trouble, so we reinforce the importance of swimming at patrolled beaches, between the red and yellow flags. When visiting locations where that is not possible, we urge the community to check conditions and prioritise safety when heading out to the beach, offshore, or for a fish.
Boating deaths decline by 40 per cent
There was a marked decrease in drowning deaths associated with boating: compared to the 10-year average, boating related drowning deaths were down by around 40 per cent. We acknowledge the preventative efforts of state and territory governments, which include implementation of boating safety plans that focus on increasing lifejacket wear and targeting responsible boating.
Regional and remote communities drown at higher rates
While 59 per cent of the people who drowned in 2022/23 resided in major cities, the drowning rate was 1.77 times higher for those living in outer regional, remote, and very remote areas. Ensuring all communities have access to swimming and water safety education, as well as safe places to swim, is a key priority.
Drowning is increasingly an issue of social inequities
The drowning rate for residents of the most disadvantaged areas was 71 per cent higher than the drowning rate for the most advantaged areas. Financial barriers can have long-term consequences for children who grow up in families unable to access swimming and water safety education and skills.
Summer is fast approaching
While there has been some improvement in the number of drowning deaths in the past year, we are concerned about summer fast approaching. The Bureau of Meteorology is forecasting higher than average temperatures across Australia from early September and into 2024, which is more reason to be proactive with water safety. An early start to summer and prolonged hot weather increases use of coastal and inland waterways and swimming pools, which will place greater pressure on lifeguards and surf lifesavers. We urge everyone to keep water safety front of mind as you enjoy time in, on and around the water this summer.
We love the water
We love the water, and want everyone to enjoy the nation’s beautiful rivers, lakes, beaches, bays, community pools and backyard swimming pools. Water activities, whether boating, surfing, snorkelling, fishing, or swimming with friends, provide joy and unforgettable memories.
FOLLOWING SOME SIMPLE WATER SAFETY ADVICE CAN AND DOES SAVE LIVES.
Always supervise children in, on and around water
Learn swimming, water safety and lifesaving skills
Wear a lifejacket when boating, rock fishing or paddling
Swim at a patrolled beach between the red and yellow flags
Avoid alcohol and drugs around water
Know your limits, the conditions, check the weather
We urge you to join us in sharing water safety messages with family, friends, and people in your community. Together we can prevent drowning and save lives.
IN PARTNERSHIP WITH
Section One: When and how does drowning happen?
26% of drowning deaths occurred in December and January. Drowning deaths occurred most frequently during the summer months, similar to previous years, with January having the highest number of drowning deaths in the 2022/23 financial year (14%); a 27% decrease from last financial year.
Weekends (Saturday and Sunday) were the highest for drowning incidents, with Sunday having the highest proportion of drowning deaths. Drowning deaths occurred most frequently in the afternoon (12:01pm to 6pm), similar to previous years.
6
Jul Aug SepOct NovDec JanFeb MarApr MayJun 9% 5% 6% 9% 6% 13% 14% 12% 9% 10% 6% 4% 6% 5% 14% 5% 14% 8% 8% 7% 9% 6% 8% 10% 2022/23 drowning deaths 10-year average drowning deaths (2012/13 - 2021/22)
MONTH 2022/23 drowning deaths by month compared to the 10-year average
DAY OF THE WEEK
2022/23 drowning deaths by day of the week compared to the 10-year average
TIME OF THE DAY
drowning deaths 10-year average drowning deaths (2012/13 - 2021/22)
Drowning deaths by time of day, 2022/23
7
Sunday Monday TuesdayWednesday Thursday Friday Saturday 22% 15% 13% 13% 13% 10% 15% 19% 18% 11% 13% 13% 14% 13% 2022/23
Afternoon (12:01pm to 6pm) 44% Morning (6:01am to 12pm) 25% Early Morning (12:01am to 6am) 5% Unknown 9% Evening (6:01pm to 12am) 17%
Swimming and recreating was the leading activity prior to drowning (33%) in 2002/23. Swimming and water safety skills are highlighted in the Australian Water Safety Strategy 2030 as a priority focus and, while widely recognised as the key to preventing drowning, reaching each new generation of parents and children is a continued challenge.
While millions of Australians swim regularly [1], barriers in access to swimming and water safety programs and education make future populationlevel skill attainment uncertain. Research shows that approximately 40% of children do not achieve the National Benchmark of swimming 50m by the time they are 12 years old [2]. For this reason, prioritising swimming skills and water safety remains a major priority for the drowning prevention sector.
Falls into water were the second leading activity prior to drowning (15%) in 2022/23, a quarter of which were children 0-4 years of age. Boating was the activity associated with 8% of drowning deaths, a 40% decrease from the 10-year average. While all activities have risk, swimming skills, water safety knowledge, appropriate use of safety equipment, environmental awareness, and experience, can improve safety behaviour in and around water.
33% of drowning deaths occurred while swimming/recreating.
69% of drowning deaths in children
0-4 years and 22% of drowning deaths in adults aged 75 years and older were from falling into water
40%
Compared to the 10-year average, boating related drowning deaths were down by approximately 40%.
9
2022/23 drowning deaths by activity category
Swimming and Recreating 33% Boating 8% Fall 15% Non-aquatic Transport 6% Unknown 11% Diving 5% Watercraft 6% Fishing 3% Bathing 6% Rescue 5% ACTIVITIES:
DROWNING
HOW DOES
HAPPEN?
Section Two: People - Who drowns?
Drowning prevention strategies are most effective when tailored to specific populations and age groups. This National Drowning Report provides details on the people who drowned in 2022/23 to improve understanding of who is at an increased risk and ultimately to help prioritise and direct prevention efforts.
Drowning in children 0-4 years has seen an incredible shift in the past 20 years, having decreased by 51% when comparing baseline averages from 2002/07 to 2017/22 [3]. This financial year (2022/23) showed a drowning rate of 1.06 per 100,000 population in the 0–4-year age group, a 25% decrease compared to the 10-year average of 1.41 per 100,000 population.
Those aged 65 years and older are a priority focus of the Australian Water Safety Strategy 2030, and an age group of growing concern. Drowning deaths in this age group represented 27% of fatal drownings this financial year (2022/23) and has shown a 43% increase in the number of drowning deaths in the past 20 years [3].
The Australian population is aging, and as people live longer and continue participating in aquatic activities later in life, the risk profile for drowning changes. Swimming is encouraged for older people as an excellent way to stay fit, however promoting swimming and water safety skills and prioritising tailored prevention interventions in this age group, is a major priority.
KEY FINDINGS:
Males continue to account for the majority of drowning deaths, representing 77% of fatal drownings in 2022/23
Drowning deaths in the 0-4 year age group this financial year was 27% below the 10-year average
The drowning rate in the 75+ age group has increased since 2017/18, reaching 1.81 per 100,000 this financial year
People residing in socio-economically disadvantaged areas drowned at higher rates compared to those living in more socio-economically advantaged areas
11
27% OF ALL DROWNING DEATHS WERE AGED 65 YEARS AND OLDER
SOCIO-ECONOMIC ADVANTAGE AND DISADVANTAGE
The Index of Relative Socio-economic Advantage and Disadvantage (IRSAD) is a score assigned to geographic areas by the Australian Bureau of Statistics [4]. While a simplification of the realities Australians face every day, the score summarises information about the economic and social conditions of people and households to provide a relative measure of disadvantage (lower score) and advantage (higher score).
The resident areas of people who drowned in 2022/23 were more or less evenly distributed across the socio-economic spectrum, 19% from the most disadvantaged areas versus 21% from the most advantaged areas. However, the drowning rates per 100,000 population show that those in the most disadvantaged areas drown at rates 71% higher than those from the most advantaged areas.
Crude fatal drowning rate per 100,000 population by IRSAD decile, 2022/23
*Note: Unknown IRSAD decile in 10% of cases
12
19% 20% 15% 15% 21% Advantage Disadvantage 1.40 1.39 0.84 Advantage Disadvantage 0.76 0.82
Drowning deaths by IRSAD decile, 2022/23
REMOTENESS OF HOME RESIDENCE
The majority of those who died from drowning in 2022/23 lived in major cities, but those who were from outside major cities drowned at higher rates. The crude fatal drowning rate per 100,000 population was 15% higher for those from inner regional areas, and 77% higher for those from outer regional, remote, and very remote areas, compared to major cities.
Crude fatal drowning rate per 100,000 population by residence remoteness classification, 2022/23
Drowning by residence remoteness classification, 2022/23
Remote
Very Remote
*Note: Unknown remoteness classification of residence in 10% of cases
13
Major Cities Inner RegionalOuter Regional,
59%
Major Cities Inner RegionalOuter Regional, Remote and Very Remote 1.57 1.03 0.89
and
17% 14%
TOP 3 AGE GROUPS
15%
YEARS

15% 55-64 YEARS
14% 65-74 YEARS
45-54
2022/23
fatal age-specific drowning rate compared to 10-year average fatal age-specific drowning rate
Number of drowning deaths by age group in 2022/23 compared with the 10-year average
15 AGE GROUPS
0-4 Years 5-9 Years 10-14 Years 15-17 Years 18-24 Years 25-34 Years 35-44 Years 45-54 Years 55-64 Years 65-74 Years 75+Years 2022/23 crude fatal drowning rate per 100,000 10-year average crude fatal drowning rate (2012/13 - 2021/22) 1.81 1.60 1.42 1.31 0.88 0.94 1.16 0.43 0.06 0.37 1.06 1.65 1.60 1.23 1.12 1.16 1.14 1.20 0.52 0.29 0.41 1.41 0-4 Years 5-9 Years 10-14 Years 15-17 Years 18-24 Years 25-34 Years 35-44 Years 45-54 Years 55-64 Years 65-74 Years 75+ Years 6% 2% 1% 1% 9% 12% 12% 15% 15% 14% 13% 8% 10% 15% 2% 2% 13% 2% 13% 10% 13% 14% 2022/23 drowning deaths 10-year average drowning deaths (2012/13 - 2021/22)
Fatal drowning numbers and rates for children aged 0-4 years has reduced in recent years. Drowning deaths in the 0-4 year age group represented 6% of drowning cases this financial year (2022/23); a 6% decrease from last year (2021/22) and a 33% decrease from the 10-year average. The crude fatal drowning rate of the 0-4 year age group this financial year (2022/23) has also decreased by 32% compared to the 10-year average, and by 59% compared to 20 years ago [3].
56% of all drowning deaths in this age group were males. The majority of drowning deaths occurred in the afternoon (50%) and either in a bathtub (25%) or a swimming pool (25%). The leading activity prior to drowning was a fall into water (69%) followed by bathing (19%). Drowning locations for this age group have also seen a decline in the past 20 years [3], with a 60% decrease in drowning rates for swimming pools and a 77% decrease in drowning rates for rivers and creeks.
Successful decreases in drowning number and rates in this age group have occurred over the years due to increased public awareness and education, advocacy and research, government policy and enforcement [5]. However, this age group remains a priority area in the Australian Water Safety Strategy 2030 as rates of childhood drowning deaths remain high relative to other age groups. Clear and effective drowning prevention measures for this age group exist, and continued focus is required to maintain the successful trends observed over the past two decades [6].
16
33% decrease
24
32% decrease
16
Drowning Deaths in 2022/23
1.06 2022/23 Fatal Drowning Rate per 100,000
Drowning deaths of children aged 0-4 years by activity, 2022/23
10-Year Average
1.55 10-Year Average Fatal Drowning Rate per 100,000
69%
19%
13%
INSIGHTS BY LIFE STAGES: CHILDREN AGED 0-4 YEARS
Fall
Bathing
Unknown
56% OF ALL DROWNING DEATHS IN THIS AGE GROUP WERE MALES
Campaign Highlight Children aged 0-4: Keep Watch
Royal Life Saving’s Keep Watch campaign has made significant inroads in helping to reduce drowning in children aged 0-4 since it was launched nearly 30 years ago. Drowning deaths however remain the leading cause of preventable death in this age group.
Keep Watch reminds parents and carers about the risks of child drowning, encouraging they undertake four simple actions:
Supervise. Actively supervise children around water.
Restrict . Restrict children’s access to water.
Teach. Teach children water safety skills.
Respond. Learn how to respond in the case of an emergency.
17
Bathtub / Spa Bath 25% Swimming Pool 25% Lake / Dam 13% Other 13% River / Creek 13% Beach 6% Unknown 6%
Drowning deaths of children aged 0-4 years by location, 2022/23
INSIGHTS BY LIFE STAGES: CHILDREN AGED 5-14 YEARS
Drowning in the 5-14 year age group represented 2% of drowning cases this financial year (2022/23); a 53% decrease from last year (2021/22), and a 35% decrease when compared to the 10-year average. The leading activity prior to drowning was swimming and recreating (43%) followed by bathing (29%) and occurred mainly in the afternoon (12:01pm to 6pm) (100%).
The crude fatal drowning rate in this age group has decreased in the past 20 years by 38% when comparing baseline years 2002/07 to 2017/22 for the 5-14 year age group [3]. This year (2022/23) the crude fatal drowning rate was 0.22 per 100,000 population, a 37% decrease compared to the 10-year average.
71% of all drowning deaths in this age group were males and occurred in either a bathtub (29%) or a lake/dam (29%). Drowning rates by locations have also seen a decline over the past 20 years, with a 25% decrease for swimming pools and 48% for rivers/creeks [3].
11
10-Year Average
0.35
10-Year Average Fatal Drowning Rate per 100,000
18 Drowning deaths of children
5-14 years
Drowning Deaths in 2022/23 0.22 2022/23 Fatal Drowning Rate per 100,000 Bathtub / Spa Bath 29% Swimming Pool 14% Lake / Dam 29% River / Creek 14% Beach 14%
aged
by location, 2022/23 35% decrease 37% decrease 7
deaths of children aged 5-14 years by activity, 2022/23 43% Swimming and Recreating 14% Non-aquatic Transport 29% Bathing 14% Fall
Drowning
Drowning deaths in the 15-24 year age group represented 11% of all drowning cases this financial year (2022/23); a 17% decrease from last year (2021/22) and a 7% decrease compared to the 10-year average.
Drowning deaths in this age group were mostly among males (83%), and occurred either at a beach (30%) or at a river/creek (30%). The leading activity prior to drowning was swimming and recreating (47%) followed by a fall into water (13%).
The drowning rate was 0.95 per 100,000 population this financial year (2022/23), a 7% decrease compared to the 10-year average, similar to trends from the past 20 years [3]. No change in overall drowning numbers were seen over the past 20 years when comparing baseline years 2002/07 to 2017/22 for this age group [3].
32 10-Year Average
1.02
Average Fatal Drowning Rate per 100,000
19
decrease 7%
Drowning Deaths in 2022/23 0.95 2022/23 Fatal Drowning Rate per 100,000 Swimming Pool 13% Ocean / Harbour 10% Rocks 3% Lake / Dam 13% River / Creek 30% Beach 30%
Drowning deaths of young people aged 15-24 years by location, 2022/23 7%
decrease 30
47% Swimming and Recreating 7% 3% Boating Watercraft 7% Diving 13% 7% Fall Non-aquatic Transport 3% Rescue 13% Unknown
10-Year
INSIGHTS BY LIFE STAGES: YOUNG PEOPLE AGED 15-24 YEARS Drowning deaths of young people aged 15-24 years by activity, 2022/23
Drowning deaths in the 25-64 year age group represented 54% of total drowning deaths this financial year (2022/23); a 1% increase compared to the 10-year average. The drowning rate for this age group was 1.12 per 100,000 population; a 33% decrease compared to the 10-year average. Fatal drowning rates over the past 20 years have decreased by 27% and the number of drowning deaths decreased by 9% when comparing baseline years from 2002/07 to 2017/22 [3].
This financial year (2022/23), the leading activity prior to drowning was swimming and recreating (35%). 77% of drowning deaths in this age group were males and occurred mainly at river/ creek locations (29%) followed by beaches (25%).
Breaking down this life stage by age group, the 2022/23 crude fatal drowning rate was 24% below the 10-year average in the 25-34 year age group, 17% below the 10-year average in the 35-44 year age group, 17% above the 10-year average in the 45-54 year age group, and 15% above the 10-year average in the 5564 year age group.
There were more drowning deaths among the 45-64 year old age group compared to 25-44 year old age group this financial year (2022/23), consistent with trends from the past 20 years. Specific drowning prevention focus on older adults is warranted.
153
1% increase
1.12
151 10-Year Average
1.18
33% decrease
10-Year Average
Drowning deaths of adults aged 25-64 years by activity, 2022/23
20
Drowning Deaths in 2022/23
2022/23 Fatal Drowning Rate per 100,000
INSIGHTS BY LIFE STAGES: ADULTS AGED 25-64 YEARS
Fatal Drowning Rate per 100,000
35% Swimming and Recreating 9% 7% Boating Watercraft 7% Diving 10% 7% 4% Fall Non-aquatic Transport Bathing 7% 3% Rescue Fishing 10% Unknown
Drowning deaths of adults aged 25-64 years by location, 2022/23
Program Highlight Respect The River
Royal Life Saving Australia, with the support of the Australian Government are educating the public about inland waterway safety through the “Respect the River” program.
Australia has many beautiful inland waterways including rivers, lakes, dams, lagoons, channels, and creeks, however they can pose safety risks. The flat, still surface of an inland waterway can give a false sense of security. Currents, undertows or submerged objects –even in seemingly tranquil waterways – can prove to be very dangerous.
It’s important to be aware of the dangers and always take care around water. Remembering that water conditions which may have been suitable one day can change hourly with the current.
The program provides a range of resources for inland water safety with the key Respect the River messages.
21
Bathtub / Spa Bath 4% Swimming Pool 7% Ocean / Harbour 16% Rocks 6% Lake / Dam 12% Other 1% River / Creek 29% Beach 25%
Drowning deaths in this age group represented 27% of total drowning deaths this financial year; a 62% decrease from last year (2021/22) but a 19% increase compared to the 10-year average. The 2022/23 crude fatal drowning rate was 1.69 per 100,000 population; a 20% decrease from last year (2021/22), and 4% increase compared to the 10-year average.
The Australian Water Safety Strategy 2030 acknowledges people over 65 years as a priority age group for drowning prevention, and identifies areas in which water safety awareness, swimming skills, and campaigns around medical check-ups and fall prevention, need to be implemented to promote and strengthen water safety behaviour [6].
A concerning increase in the number of drowning deaths in the past 20 years justifies continued focus on those over 65 years as a priority age group [3]. Data from the past 20 years indicate that 70% of the drowning deaths among those aged 65 years and older involved people with a pre-existing medical condition [3]. This financial year (2022/23), 77% of all drowning deaths of people aged 65 and older were males and occurred mainly at beaches (35%) followed by rivers/creeks (25%). Swimming and recreating were the highest activity prior to drowning (32%) followed by a fall into water, representing 16% of drowning cases in this age group. Drowning deaths for people over the age of 75 years has increased by 10% this financial year (2022/23) compared to the 10-year average.
75
19% increase
4% increase
62 10-Year Average
1.62
Average
Drowning deaths of older people aged 65 years and over by activity, 2022/23
22
Drowning Deaths in 2022/23
1.69 2022/23 Fatal Drowning Rate per 100,000
INSIGHTS BY LIFE STAGES: OLDER PEOPLE AGED 65 YEARS AND OVER
10-Year
Fatal Drowning Rate per 100,000
32% Swimming and Recreating 9% 4% Boating Non-aquatic Transport 8% Bathing 16% 8% Fall Watercraft 4% Diving 4% Rock Fishing 3% Rescue 12% Unknown
Drowning deaths of older people aged 65 years and over by location, 2022/23
Practice Highlight
Aquaskills 55+ (Western Australia)
For older people, participating in aquatic activities is a great way to stay healthy and active. Swimming can improve cardiovascular fitness, balance/coordination, muscle strength and endurance. Unfortunately, half of all drowning deaths recorded in WA are adults aged 45 years and over.
Aquaskills 55+ helps adults to develop essential lifesaving and water safety skills to participate in aquatic recreation activities safely. Participants in this practical program learn skills to deal with emergency situations, water safety knowledge and personal survival techniques. Participants have also credited the program for boosting their social interactions, with many saying they’ve forged new friendships which support an active lifestyle and a deeper connection to the community.
Last year, the Aqua Skills 55+ program was delivered in eight locations across WA with a total of 86 participants and was funded by the Western Australian Department of Health.
Bathtub / Spa Bath 8% Swimming Pool 12% Ocean / Harbour 8% Rocks 9% Lake / Dam 1% Other 1% River / Creek 29% Beach 35% 23
Section Three: Places - Where do people drown?
Understanding where drowning events happen is critical for prevention efforts and to target environment-specific hazards.
The Australian Water Safety Strategy 2030 aims to target high-risk drowning locations and identify specific water safety strategies tailored to each location.
Fatal drowning rates in high-risk aquatic locations have decreased over the past 20 years despite beaches still being a challenge for drowning prevention, with little change over time [3]. Swimming pool drowning rates specifically, have decreased by 45%, with ocean and harbour locations having decreased by 44% in the past 20 years when comparing baseline drowning rates, between 2002/07 to 2017/22 [3].
Both rivers/creeks (27%) and beaches (27%) had the highest number of drowning deaths this financial year (2022/23), with a 30% increase for beaches and a 2% increase for rivers/creeks compared to the 10-year average. Beach drowning deaths had a 7% increase from last year (2021/22) whereas rivers/creeks had a 33% decrease compared to last year (2021/22). In part, this was due to an increased number of flood-related drowning deaths as the result of intense rainfall in 2022/23.
KEY FINDINGS:
The majority of drowning deaths occurred in major cities (44%) followed by inner regional areas (27%), and 25% occurred in outer regional, remote and very remote locations.
Beaches, ocean/harbours, and rocks represented 44% of drowning deaths, 38% of which were swimming and recreating prior to drowning.
Swimming and recreating was the most frequent activity prior to fatally drowning in river/creek locations (28%). The age groups most frequent to fatally drown in rivers and creeks were adults aged 35-44 years (17%) and adults aged 45-54 years (17%).
Falls into water were the most frequent activity prior to drowning in lake/dam locations (30%). The age group most frequent to fatally drown in lakes and dams were adults aged 45-54 years (26%).
25
River / Creek BeachOcean / Harbour Swimming Pool Lake / DamBathtub / Spa Bath Rocks OtherUnknown 27% 27% 12% 10% 10% 6% 6% 2% 26% 1% 5% 8% 13% 15% 3% 9% 21% 2022/23 drowning deaths 10-year average drowning deaths (2012/13 - 2021/22)
Percent of 2022/23 drowning deaths by location compared to the 10-year average
Anyone can drown, no one should! These words have never been more true and this is why we are passionate about doing whatever it takes to ensure visitors can enjoy our coastline safely.
ADAM WEIR CEO, SURF LIFE SAVING AUSTRALIA
INSIGHTS BY KEY DROWNING LOCATIONS: COASTAL ENVIRONMENTS Beaches, Ocean/Harbours, and Rocks
Australians love the beach and, as an island destination, the coast is central to the Australian identity. Domestic and international visitors travel to the many incredible locations along the 52,000km of coastline, including our ~12,000 beaches.
Coastal experiences are among the greatest drivers of tourism due to their uniqueness and appeal, with Australian beaches and the Great Barrier Reef identified as the most attractive destinations [7,8]. As beautiful as the coast may be, there are also many risks and hazards that can be hard to recognise.
Drowning deaths in coastal waterways are not uncommon [9] with 125 coastal drowning deaths recorded in 2022/23, representing 44% of the national drowning burden. Males continue to be overrepresented – accounting for eight in ten coastal drowning deaths. Older Australians are identified as a high-risk population, with 65-74 year olds accounting for 21% of the coastal drowning burden.
Six in ten coastal drowning deaths occurred at beaches (60%), followed by the broad groups of ocean/harbour (26%) and rocks (14%). Rip currents are the number one coastal hazard and are common features on Australian beaches. This year rip currents were involved in 28 coastal drowning deaths, 12% above the 10-year average.
ALL COASTAL LOCATIONS: 44% of 2022/23 Drowning Deaths
125
3% increase
Coastal Drowning Locations
121 10-Year Average
KEY 2022/23 FINDINGS FOR COASTAL DROWNING LOCATIONS
82% OF COASTAL DROWNING DEATHS WERE MALE
21% WERE ADULTS AGED 65-74 YEARS
44% OCCURRED DURING SUMMER
22% 56% 66%
Rip current -related Regional / Remote Areas
>1km from SLS service
27
Drowning Deaths in 2022/23
Beach 60% Ocean/Harbour 26% Rocks 14% Offshore 14% Port/Marina 6% Bay 2% Estuary 2% Jetty 2% Rock/Cliff 12% Coastal Pool 2%
27% OF ALL DROWNING DEATHS OCCURRED AT BEACHES
Beaches are Australia’s leading coastal drowning location. In 2022/23, 75 drowning deaths were recorded at beaches, a 29% increase from the 10-year average. More than half had been swimming or wading prior to the incident (56%), followed by bystanders attempting to rescue someone in distress.
Rip currents remain the number one hazard at beach locations, known to be a causal factor in at least 37%of beach drowning deaths. More than half occurred during summer months, and 39% were locals, living within 10km from the drowning location.
Beaches are large, dynamic environments, that create diverse opportunities for fun and recreation. Often visitors fail to observe or underestimate present hazards, unnecessarily exposing themselves and others to danger.
28
Drowning deaths at beaches by month, 2022/23 JulAug SepOct NovDec JanFeb MarApr MayJun 7% 1% 1% 4% 1% 10 %2 1% 21 %1 5% 15 %4 % 29% increase 75 Drowning Deaths in 2022/23 58 10-Year Average Drowning deaths at beaches by activity, 2022/23
Swimming/Wading
Beaches
56%
9% Snorkelling 3% Fall 13% 1% Attempting a Rescue Boating & PWC 12% 5% Watercraft Unknown
Male Rip current -related >1km from SLS service 81%
55% Summer
37%
52%
Drowning deaths at beaches by age group, 2022/23
Remoteness
29 <10KM UNKNOWN >50KM >50KM 10 - 50KM LOCAL INTERSTATE VISITOR INTERNATIONAL VISITOR INTRASTATE VISITOR RESIDENT
0-4 Years 5-9 Years 10-14 Years 15-17 Years 18-24 Years 25-34 Years 35-44 Years 45-54 Years 55-64 Years 65-74 Years 75+ Years 1% 1% 1% 11 %8%1 2% 13%1 7% 24% 11 %
classification
Residence distance to beach drowning location, 2022/23 39% 5% 12% 33% 5% 5% Major Cities Offshore Inner Regional Outer Regional Remote Very Remote 51% 32% 7% 7% 4%
of beach drowning location, 2022/23
12%
OF ALL DROWNING DEATHS OCCURRED AT OCEAN / HARBOUR
Ocean and harbour locations encompass various coastal waterways including bays, offshore waters, ports, marinas, and jetties. Each enable a variety of recreation options, but also carry their own unique hazard, risk and prevention profiles.
In 2022/23, 33 drowning deaths were recorded at ocean/harbour locations, a 13% decrease from the 10-year average. Almost half had been boating or using a personal watercraft (i.e. PWC or jet ski) prior to the incident (45%), followed by those who had been snorkelling.
Three in four were found to have occurred in regional, remote, and offshore locations. One in three occurred during winter, and 30% were intrastate visitors to the drowning location, living more than 50km away but within the same state.
82% 91% 12% 3% 3% 15%
33% Snorkelling Land-based Fishing Fall Unknown
73%
Regional/ Remote Areas
30
Drowning deaths at ocean / harbour by month, 2022/23 JulAug SepOct NovDec Jan FebMar AprMay Jun 12 %9 %3 %15% 12 %6 %9 %3 %6 %12% 12 % 20% decrease 33 Drowning Deaths in 2022/23 41 10-Year Average
Ocean / Harbour
Male
Winter
>1km from SLS service Drowning deaths at ocean / harbour locations by activity, 2022/23 46% Boating & PWC 9% Watercraft 6% Scuba Diving 6% Swimming/Wading
Drowning deaths at ocean / harbour locations by age group, 2022/23
Remoteness classification of ocean / harbour drowning locations, 2022/23
31
<10KM UNKNOWN >50KM >50KM 10 - 50KM LOCAL INTERSTATE VISITOR INTERNATIONAL VISITOR INTRASTATE VISITOR RESIDENT
Residence distance to ocean
harbour drowning location,
18% 27% 12% 30% 9% 3% Major Cities Offshore Inner Regional Outer Regional Remote Very Remote 27% 3% 9% 36% 18% 6% 0-4 Years 5-9 Years 10-14 Years 15-17 Years 18-24 Years 25-34 Years 35-44 Years 45-54 Years 55-64 Years 65-74 Years 75+ Years 9% 15%9% 24% 24% 12%6%
/
2022/23
6% OF ALL DROWNING DEATHS OCCURRED AT ROCKS
Rock locations include rocky land formations and cliffs as well as coastal pools. In 2022/23, 17 drowning deaths were recorded at rock locations, a 23% decrease from the 10-year average. Nine out of ten occurred at rock platform or cliff locations.
Rock fishing and fall-related incidents were equal at 41%, often swept in by a wave overtopping the rock platforms. One in two intrastate visitors to the drowning location, living more than 50km away but within the same state, while three in five occurred in regional or remote locations.
Lifejackets and other safety equipment are known to save lives when recreating around rocky areas. Education and awareness approaches that lead to behaviour changes that increase lifejacket usage within these environments is integral to decreasing drowning rates across these areas.
41% Rock Fishing
12% Swimming/Wading
6% Attempting a Rescue
32
Drowning deaths at rocks by month, 2022/23 Proportion of drowning deaths at rock locations,
Rocks
2022/23 41% Fall
JulAug SepOct NovDec JanFeb MarApr MayJun 18%6%1 2% 18%1 2% 18%1 2% 6% 23% decrease 17 Drowning Deaths in 2022/23 22 10-Year Average
Male Regional/ Remote Areas >1km from SLS service 88% 59% 65% Summer 41%
Drowning deaths at rocks by age group, 2022/23
Remoteness classification of rock drowning locations, 2022/23
Residence distance to rock drowning location, 2022/23
33
Major Cities Offshore Inner Regional Outer Regional Remote Very Remote 41% 35% 12% 12% 0-4 Years 5-9 Years 10-14 Years 15-17 Years 18-24 Years 25-34 Years 35-44 Years 45-54 Years 55-64 Years 65-74 Years 75+ Years 6% 24%18% 12% 24% 18% <10KM UNKNOWN >50KM >50KM 10 - 50KM LOCAL INTERSTATE VISITOR INTERNATIONAL VISITOR INTRASTATE VISITOR RESIDENT 24% 18% 47% 12%
Research Highlight: Rip Current Drowning Deaths, 2013-2023
RIP-RELATED DROWNING DEATHS 2013-2023
Rip currents are strong, narrow, and often channelised currents of water that flow offshore through the surf zone and varying distances beyond. They are common features on Australian beaches, with an estimated 17,000 rips occurring on any given day around the coast.
Rip currents are the number one coastal hazard known to be involved in 20% of coastal drowning deaths since 2013/14. They contributed to 28 drowning deaths this year, 12% above the 10-year average.
Males and young adults are identified as populations of concern, with eight in ten rip current drowning deaths occurring among males, and one in four among 20-29 year olds. Most rip current drowning deaths occurred away from surf lifesaving services, at unpatrolled locations.
Education and raising awareness continue to be the best approach to tackle this national drowning concern. We will continue to explore new ways to increase awareness of the rip current hazard, particularly within young men, to work towards all beachgoers having a fun and safe day out.
34
12% increase 28 Rip-Related Drowning Deaths in 2022/23 25 10-Year Average
247
Male >1km from SLS service 84% 65% 66% Summer 58% Regional/ Remote Areas Water depth of rip-related drowning death, 2013-2023 48% Overhead 28% Shoulder-deep 16% Waist-deep 8% Knee High 48% OVERHEAD 28% SHOULDER-DEEP 16% WAIST-DEEP 8% KNEE HIGH
66% Swimming/Wading 5% Watercraft 2% 1% Fall Rock Fishing 14% 2% 1% Attempting a Rescue Land-based Fishing Scuba Diving 5% 1% Snorkelling Boating & PWC
Rip-related
drowning deaths by activity, 2013-2023
Rip-related drowning deaths by age group, 2013-2023
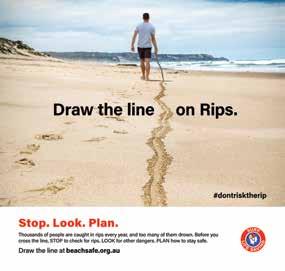
Campaign Highlight The Think Line – a behaviour change safety campaign
Surf Life Saving Australia implemented a five-year coastal safety campaign to address rip current drowning.
The campaign had two phases – the first aims to increase awareness and knowledge about rip currents while the second was designed to influence beachgoer behaviour. Specifically, we challenged beachgoer perceptions of their understanding of rip currents and how to identity and escape them, and provided general guidance on how to swim safely at the beach. The ‘Think Line Campaign’ introduced the concept of a line in the sand to remind beachgoers to STOP and check for rips before entering the water, LOOK for other dangers, and PLAN how to stay safe.
35
<10KM UNKNOWN >50KM >50KM 10 - 50KM LOCAL INTERSTATE VISITOR INTERNATIONAL VISITOR INTRASTATE VISITOR RESIDENT Residence distance to rip-related drowning location, 2013-2023 21% 1% 10% 41% 19% 9% 0 - 4 Years 5 - 9 Years 10 - 14 Years 15 - 24 Years 25 - 34 Years 35 - 44 Years 45 - 54 Years 55 - 64 Years 65 - 74 Years 75+ Years 2% 1% 4% 1 9% 20% 1 8% 1 5% 1 2% 7% 3%
When enjoying inland waterways it’s important to be aware of the risks. Whether you’re swimming, boating, or even just relaxing on the bank, there are many hidden dangers that you may not be aware of. The flat, still surface of an inland waterway can give a false sense of security. Currents, undertows or submerged objects – even in seemingly tranquil waterways – can prove to be very dangerous. It’s important to be aware of the dangers and always take care around water.
 JUSTIN SCARR CEO, ROYAL LIFE SAVING SOCIETY – AUSTRALIA
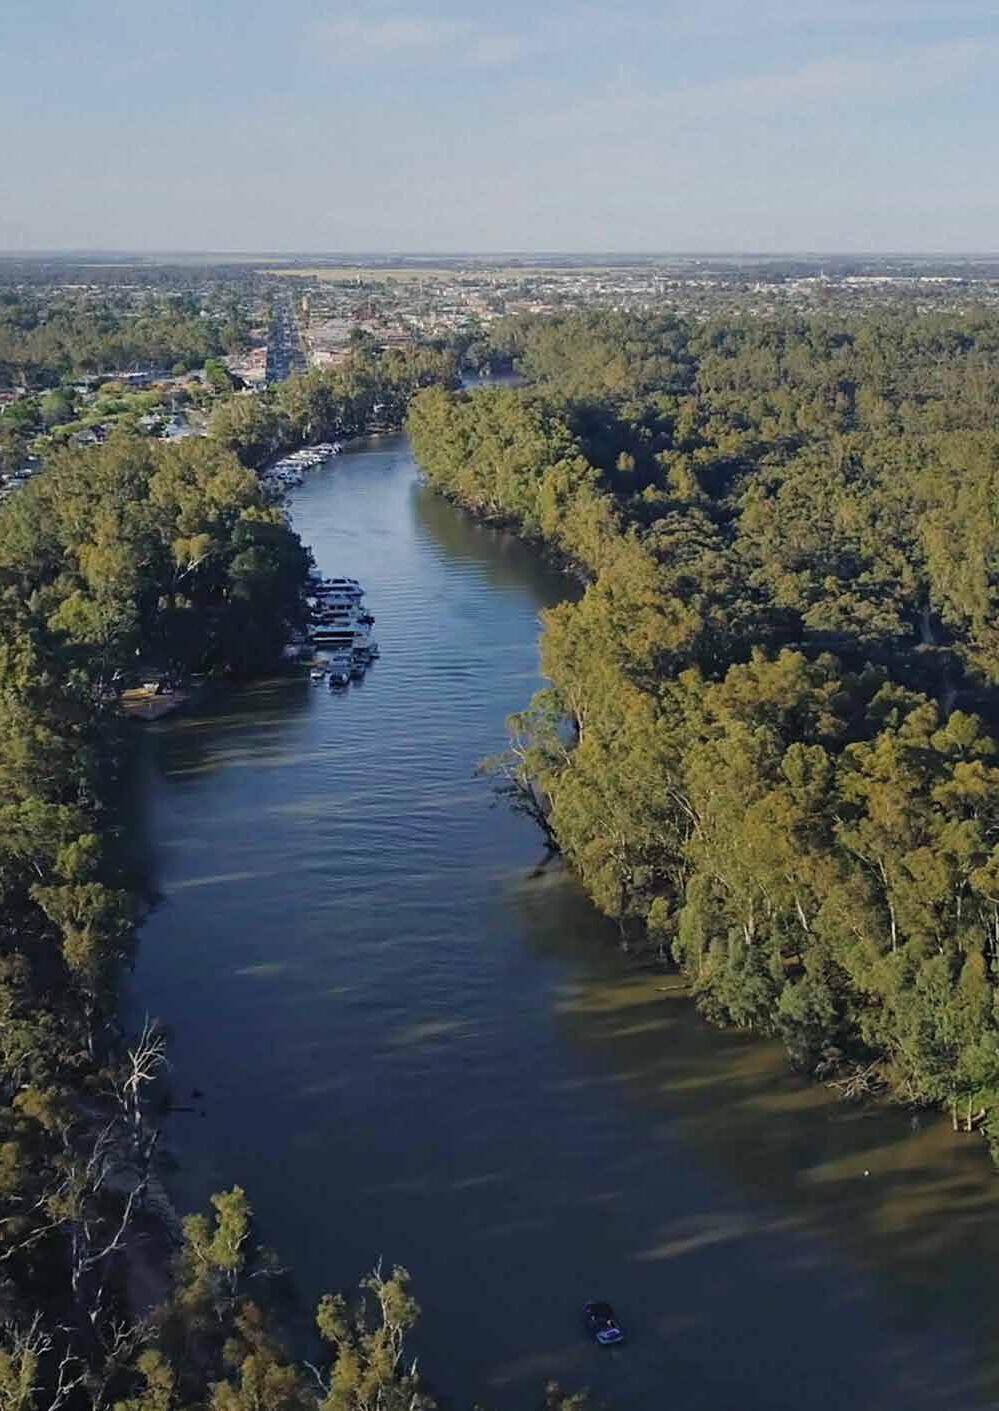
INSIGHTS BY KEY DROWNING LOCATIONS: INLAND WATERWAYS Rivers and Lakes
The top ten river drowning blackspots across Australia have remained over the last ten years, with the Murray River, the Yarra River, Hawkesbury River, Murrumbidgee River and the Swan River accounting for the top 5 deadliest rivers in Australia. Despite continued drowning prevention efforts targeting visitors to inland waterways, especially rivers, the overall rates of drowning at inland waterways remain unchanged [9].
Inland waterways continue to account for more than one third of total drowning deaths in Australia, and men continue to account for more than 80% of drowning deaths at these locations. A greater awareness of water safety and practical tips for swimming and recreating in and around rivers and lakes in Australia, with a specific focus before and during the summer for all communities is recommended. Flood-related drowning at inland waterway locations is also a key water safety concern with increased flooding disasters expected to impact communities along these waterways [10, 11].
Better understanding of visitor demographics and rates will enhance our water safety messaging and target groups. Land management professionals will need to prepare water safety plans for their waterways in anticipation of increasing severe weather and flooding events.
INLAND WATERWAYS: 37% of 2022/23 Drowning Deaths
103 Drowning Deaths at Inland waterways in 2022/23
KEY 2022/23
FINDINGS FOR INLAND
WATERWAY DROWNING LOCATIONS
83% OF INLAND WATERWAY DEATHS WERE MALE
19% WERE ADULTS AGED 45-54 YEARS
6% increase
97 10-Year Average
Locations
60% OCCURRED IN SPRING (30%) & SUMMER (30%)
25% 61% 37%
Swimming & Recreating Regional / Remote Areas During Weekends
37
Inland Waterways Drowning
Lake / Dam 27% River / Creek 73%
Rivers/Creeks
27%
Since 2002, more drowning deaths have occurred in rivers/creeks than any other body of water, approximately 26% of all fatal drowning cases [3]. However, drowning rates in rivers/creeks have decreased by 22% over the years, marked by 77% decrease in 0-4 year age group [3].
In 2022/23, rivers/creeks were the leading drowning location again with 76 drowning deaths, 6% above the 10-year average. Most river/creek drowning deaths this financial year (2022/23) occurred in the 33-44 year and 45-54 year age groups and occurred while swimming and recreating. Nearly one third (32%) of river/creek drowning deaths occurred in the springtime months of September, October, and November, and two thirds occurred in regional and remote areas.
Drowning deaths at river/creek locations by activity, 2022/23
76
6% increase
83%
72 10-Year Average
Spring 32%
Male During Weekends Regional/ Remote Areas
32% 66%
Drowning deaths at river/creek locations by month, 2022/23
38
OF ALL DROWNING DEATHS OCCURRED AT RIVERS/CREEKS
28% Swimming and Recreating 17% 1% Non-aquatic Transport Fishing 7% Boating 18% 7% Fall Watercraft 4% Rescue 17% Unknown JulAug SepOct NovDec Jan FebMar AprMay Jun 8% 4% 9% 14%9%8 %1 2% 8% 11 %1 1% 1% 5%
Drowning
Deaths at Rivers / Creeks in 2022/23
Drowning deaths at river/creek locations by age group, 2022/23
Research Highlight Rivers and Creeks
Qualitative research conducted by Jasmine Williams, Professor Faye McMillan, and Dr Amy Peden in collaboration with an Aboriginal Reference Group and First Nations residents of Wiradjuri land provided deep and important insights into water safety beliefs and practices [12].
Theme 1: Family as the key source of water safety knowledge
Theme 2: Story telling as an important component of water safety education
Theme 3: The river as being central to culture, preferred but requiring respect
Theme 4 : The power of experiential learning
Six recommendations aligning with these themes emerged from the research to support water safety education at schools and inland waterways, through experiential learning opportunities and ensuring public swimming pools are culturally safe and welcoming spaces.
To read more about this important research published in the Health Promotion Journal of Australia, please see: https://doi.org/10.1002/hpja.792
39
0-4 Years 5-9 Years 10-14 Years 15-17 Years 18-24 Years 25-34 Years 35-44 Years 45-54 Years 55-64 Years 65-74 Years 75+ Years 3% 1% 1% 11 %1 3% 17 %1 7% 12%1 2% 13%
Lakes/Dams
10% OF ALL DROWNING DEATHS OCCURRED AT LAKES/DAMS
Lakes/dams represented 10% of drowning deaths this financial year (2022/23); a 5% decrease from the 10-year average. In the past 20 years drowning rates at lakes/dams have seen a decrease of 29% between average baseline years 2002/07 to 2017/22, and a 14% decrease in the number of drowning deaths.
This financial year (2022/23), most drowning deaths occurred in the 45-54 year age group (26%) and occurred following a fall into water (30%).
Drowning deaths at lake / dam locations by activity, 2022/23
30% Fall
Swimming and Recreating
Drowning deaths at lake / dam locations by month, 2022/23
11%
Non-aquatic Transport
Boating
40
Male Afternoon (12:01pm to 6pm) Regional/ Remote Areas 81% 48% 46% Summer 37%
4%
Watercraft 7%
19% 7%
Rescue 4%
JulAug SepOct NovDec Jan FebMar AprMay Jun 7% 7% 15%7 % 22% 7% 7% 7% 11 %7 % 19%
4% decrease 27 Drowning Deaths at Lakes / Dams in 2022/23 26 10-Year Average
Diving
Unknown
Drowning deaths at lake / dam locations by age group, 2022/23
0-4 Years 5-9 Years 10-14 Years 15-17 Years 18-24 Years 25-34 Years 35-44 Years 45-54 Years 55-64 Years 65-74 Years 75+ Years 7% 7% 4% 11 %1 5% 7% 26% 19%4%
INSIGHTS BY KEY DROWNING LOCATIONS: SWIMMING POOLS
Publicly accessible pools (including council-owned indoor or outdoor pools, and commercial pools or fitness centres, university/school pools and commercial learn to swim centres) offer a safe place to swim and learn water safety skills, providing an estimated $174 million in avoided child drowning costs per year in Australia [13]. Tragically, despite the design expertise and skilled management of these spaces, child and adult drowning deaths at publicly accessible pools do occur.
Caregiver supervision of children is still the best way to prevent child drowning, regardless if professional lifeguards are present. Public pools with sudden drops in depth pose a risk to nonswimmers and weak swimmers. Older adults are at risk of falling into backyard pools or not being able to get to safety if experiencing a medical incident while in a pool.
Recent research has found that one in seven Australians live in a house with a swimming pool or spa. Regional Queensland (including Gold Coast, Sunshine Coast, Bundaberg, Mackay, Townsville and Cairns) leads the nation with nearly one in four regional Queenslanders living in a house with a swimming pool or spa [14].
29
Drowning Deaths at Swimming Pools in 2022/23
17% decrease
35 10-Year Average
Drowning deaths at swimming pools by type of pool
*Note: Temporary residence swimming pools are generally used by multiple people who don’t have primary responsibility for maintenance. For example, swimming pools at a motel, hotel, resort, caravan park, hostel, retirement village, private business, and/or an apartment building.
KEY
2022/23 FINDINGS FOR SWIMMING POOL DROWNING LOCATIONS
62% OF SWIMMING POOL DEATHS WERE MALE
14% WERE CHILDREN AGED 0-4 YEARS
56% 59% 42%
45% WERE ADULTS AGED 55+ Summer Major Cities Weekends
43
Swimming Pool - Home 45% Swimming Pool - Temporary Residence 31% Swimming Pool - Public 17% Swimming Pool - Unknown 7%
Swimming Pools
10% OF ALL DROWNING DEATHS OCCURRED AT SWIMMING POOLS
Drowning deaths at swimming pools by activity, 2022/23
69% Swimming and Recreating
21% Fall
3% Diving
7% Unknown
Drowning deaths at swimming pools by month, 2022/23
Drowning deaths at swimming pools by age group, 2022/23
44
JulAug SepOct NovDec Jan FebMar AprMay Jun 3% 3% 3% 7% 10 % 28% 14 %1 4% 3% 3% 7% 3%
0-4 Years 5-9 Years 10-14 Years 15-17 Years 18-24 Years 25-34 Years 35-44 Years 45-54 Years 55-64 Years 65-74 Years 75+ Years 14% 3% 3% 10%1 0% 10% 3% 14%7 % 24%
Practice Highlight
Evacuees water safety at the Centre for National Resilience
A water safety program supported the 700 evacuees from Daguragu, Kalkarindji, Pigeon Hole and Palumpa stay cool and enjoy the water at the Howard Springs Centre for National Resilience in March 2023.
Operated by the Royal Life Saving Society – Northern Territory, the pool program provided some relief for the evacuees as they waited for the floodwater to recede so they could return to their homes and begin the process of rebuilding their communities. The program was staffed by qualified lifeguards, and welcomed 150 people through on its first day of operation.
Royal Life Saving Society – Northern Territory Executive Director Floss Roberts said the 25m, six-lane pool was proving very popular, especially the after-school sessions.
“The children were really excited that the pool was open. We thought we’d do a soft launch on the first Sunday and 150 people showed up, which was wonderful,” Ms Roberts said.
“We all want the community to return home with more swimming and water safety skills, more lifesaving skills in particular. So that’s our focus now.
“None of the affected communities have pools, so this is an opportunity to run these programs, do some swimming assessments and make it fun and engaging.
“Their water access at home is the Victoria River and the creeks that flow from it, so we are offering programs that help in that environment: rope rescue, wearing a life jacket and recognising people in difficulty in a fast flowing creek.
“They are so far away from home, which is difficult for the whole community. The Government Emergency Services Department is doing a great job working with community leaders and setting up access to education, sport, and other activities to keep them active, engaged and having fun.”
“We are very proud to be involved in the relief effort, and we hope that we’re making it a little easier for all three communities, who are missing home. There’s a lot of rebuilding to be done, and critical infrastructure to be reinstated over the weeks ahead,” Ms Roberts said.
Section Four: Insights by State and Territories
New South Wales recorded the most unintentional drowning deaths (107), a 13% increase in unintentional fatal drowning from the 10-year average.
Queensland recorded the second largest number of unintentional drowning deaths (61).


There were no unintentional drowning deaths in the Australian Capital Territory between 1 July 2022 and 30 June 2023.
31 14%
Arrows reflect 2022/23 progress against the 10-year average.


61 8% 107 13% 59 26% 0 100% 4 56% 2 75% 17 21%
AUSTRALIAN CAPITAL TERRITORY
There were 0 unintentional drowning deaths in the ACT between 1 July 2022 and 30 June 2023.

However, our 20-year report found there have been 43 drowning deaths in the ACT over the past 20 years and an average crude rate of 0.56 drowning incidents per 100,000 people; a 25% decrease when comparing baseline years 2002/07 to 2017/22 [3].
0
100% decrease 100% decrease
2
Average
0.59
Average
48
0 Drowning Deaths in 2022/23
2022/23 Fatal
Drowning Rate per 100,000
10-Year
10-Year
Fatal Drowning Rate per 100,000
20-YEAR ANALYSIS OF DROWNING IN THE AUSTRALIAN CAPITAL TERRITORY

43 TOTAL NUMBER OF DROWNING DEATHS BETWEEN 1 JULY 2002 AND 30 JUNE 2022
0% No change in the number of drowning deaths compared to baseline years (2002/07 to 2017/22)
25% Decrease in the crude fatal drowning rate compared to baseline years (2002/07 to 2017/22)
Drowning deaths and rates per 100,000 population, in the ACT (2002/03 to 2021/22) and the 20-year average
Number of drowning deaths Annual crude rate per 100,000 Baseline avg 02/07 Baseline avg 07/12 Baseline avg 12/17 Baseline avg 17/22 25% Decrease 2 3 5 1 1 4 2 1 4 2 1 2 4 3 2 1 4 1 2 0.56 0.66 0.44 0.65 0.49 2002-20032003-20042004-20052005-20062006-20072007-20082008-20092009-20102010-20112011-20122012-20132013-20142014-20152015-20162016-20172017-20182018-20192019-20202020-20212021-202220-yearaverage
There were 107 drowning deaths that occurred in NSW between 1 July 2022 and 30 June 2023.
In the past 20 years, there has been a 25% decrease in drowning rates and a 10% decrease in the number of drowning deaths when comparing baseline years 2002/07 and 2017/22; averaging a crude rate of 1.64 deaths per 100,000 population [3]. Despite this change, the drowning rate was found to increase by 7% this financial year (2022/23) compared to the 10-year average.
Drowning deaths mainly occurred in the 65–74-year age group (18%), reaching a crude rate of 2 drowning deaths per 100,000 population in this age group.
OF ALL DROWNING DEATHS IN NEW SOUTH WALES WERE MALES
107 Drowning Deaths in 2022/23
1.31 2022/23 Fatal Drowning Rate per 100,000
13% increase
95 10-Year Average
7% increase
1.23
10-Year Average Fatal Drowning Rate per 100,000
New South Wales drowning deaths by activity, 2022/23
50 NEW SOUTH WALES
34% Swimming and Recreating 8% 3% Rescue Boating 7% Non-aquatic Transport 6% 3% Rock Fishing Diving 13% 6% 2% Fall Watercraft Bathing
18% Unknown
78%
New South Wales drowning deaths by location, 2022/23
New South Wales drowning deaths by season, 2022/23
New South Wales drowning deaths by age group, 2022/23
51
0-4 Years 5-9 Years 10-14 Years 15-17 Years 18-24 Years 25-34 Years 35-44 Years 45-54 Years 55-64 Years 65-74 Years 75+ Years 3% 1% 1% 1% 9% 11 %1 5% 13%1 4% 18%1 4% Summer 40% Autumn 24% Winter 15% Spring 21% Swimming Pool 9% Ocean / Harbour 4% Other 2% Bathtub / Spa Bath 2% Unknown 1% Rocks 12% Lake / Dam 7% River / Creek 35% Beach 29%
There were 2 drowning deaths that occurred in the NT between 1 July 2022 and 30 June 2023. Both drowning deaths were males, between 0-4 years of age, and related to falls into water.
In the past 20 years, there has been a 31% decrease in drowning rates and a 13% decrease in the number of drowning deaths between 2002/07 and 2017/22, averaging a crude rate of 3.68 per 100,000 population [3].
The recent drowning rate of 0.80 deaths per 100,000 population was found to decrease by 76% this financial year (2022/23) compared to the 10-year average. This was also the same for the number of drowning deaths, which decreased by 75% when compared to the 10-year average.
2
0.80
140
TOTAL NUMBER OF DROWNING DEATHS BETWEEN 1 JULY 2002 AND 30 JUNE 2022
13%
Decrease in number of drowning deaths compared to baseline years (2002/07 to 2017/22)
31%
Decrease in the crude fatal drowning rate compared to baseline years (2002/07 to 2017/22)
75% decrease
8 10-Year Average
3.39
76% decrease
52
NORTHERN TERRITORY
Northern Territory drowning deaths by location, 2022/23
Drowning Deaths in 2022/23
2022/23 Fatal Drowning Rate per 100,000
Other 50% Beach 50%
10-Year Average Fatal Drowning Rate per 100,000
20-YEAR ANALYSIS OF DROWNING IN THE NORTHERN TERRITORY
There were 61 drowning deaths that occurred in QLD between 1 July 2022 and 30 June 2023.
In the past 20 years, there has been a 27% decrease in drowning rates and a 4% decrease in the number of drowning deaths when comparing baseline years 2002/07 and 2017/22; averaging a crude rate of 1.54 deaths per 100,000 population [3].
The drowning rate was found to decrease by 15% this financial year (2022/23) when compared to the 10-year average. Drowning deaths mainly occurred in the 45-54-year age group (20%), reaching a crude rate of 1.74 deaths per 100,000 population in this age group.
61 Drowning Deaths in 2022/23
1.15 2022/23 Fatal Drowning Rate per 100,000
8% decrease
66
10-Year Average
1.35
15% decrease
10-Year Average Fatal Drowning Rate per 100,000
Queensland drowning deaths by activity, 2022/23
54 QUEENSLAND
39% Swimming and Recreating 5% Watercraft 7% Bathing 16% 5% 3% Boating Non-aquatic Transport Diving 8% 5% 3% Fall Rescue Fishing 70%
DEATHS
QUEENSLAND WERE MALES 8% Unknown
OF ALL DROWNING
IN
Queensland drowning deaths by location, 2022/23
Queensland drowning deaths by season, 2022/23
Queensland drowning deaths by age group, 2022/23
55
0-4 Years 5-9 Years 10-14 Years 15-17 Years 18-24 Years 25-34 Years 35-44 Years 45-54 Years 55-64 Years 65-74 Years 75+ Years 10%3% 2% 13%1 6% 10% 20% 13%5%8% Summer 26% Autumn 31% Winter 21% Spring 21% Swimming Pool 13% Ocean / Harbour 21% Bathtub / Spa Bath 8% Lake / Dam 7% River / Creek 28% Beach 23%
There were 17 drowning deaths that occurred in SA between 1 July 2022 and 30 June 2023.
In the past 20 years, there has been a 37% decrease in drowning rates and a 28% decrease in the number of drowning deaths when comparing baseline years 2002/07 and 2017/22; averaging a crude rate of 0.92 deaths per 100,000 population [3].
The drowning rate was found to increase by 27% this financial year (2022/23) when compared to the 10-year average. Drowning deaths mainly occurred in the 45-54-year age group (24%), reaching a crude rate of 1.77 deaths per 100,000 population in this age group.
17
Drowning Deaths in 2022/23
21% increase
14
10-Year Average
82% OF ALL DROWNING DEATHS IN SOUTH AUSTRALIA WERE MALES
0.93 2022/23 Fatal Drowning Rate per 100,000
0.79
27% increase
10-Year Average Fatal Drowning Rate per 100,000
South Australia drowning deaths by activity, 2022/23
56 SOUTH AUSTRALIA
29% Fall 12% 6% Diving Unknown 6% Bathing 24% 6% Swimming and Recreating Non-aquatic Transport 12% 6% Boating Watercraft
South Australia drowning deaths by location, 2022/23
South Australia drowning deaths by season, 2022/23
South Australia drowning deaths by age group, 2022/23
57
0-4 Years 5-9 Years 10-14 Years 15-17 Years 18-24 Years 25-34 Years 35-44 Years 45-54 Years 55-64 Years 65-74 Years 75+ Years 6% 12%6%6% 24% 18%1 2% 18% Summer 47% Autumn 12% Winter 6% Spring 35% Swimming Pool 12% Ocean / Harbour 18% Bathtub / Spa Bath 6% Lake / Dam 18% River / Creek 29% Beach 18%
There were 4 drowning deaths that occurred in TAS between 1 July 2022 and 30 June 2023.
In the past 20 years, there has been a 29% decrease in drowning rates and a 18% decrease in the number of drowning deaths when comparing baseline years 2002/07 and 2017/22; averaging a crude rate of 2.05 deaths per 100,000 population [3].
The drowning rate was found to decrease by 56% this financial year (2022/23) when compared to the 10-year average. Drowning deaths mainly occurred in the 45-54-year age group, reaching a crude rate of 2.87 deaths per 100,000 population in this age group.
100% OF ALL DROWNING DEATHS IN TASMANIA WERE MALES
4 Drowning Deaths in 2022/23
0.70 2022/23 Fatal Drowning Rate per 100,000
56% decrease
9
10-Year Average
1.77
56% decrease
10-Year Average Fatal Drowning Rate per 100,000
Tasmania drowning deaths by activity, 2022/23
25% Boating
25% Fall
25% Swimming and Recreating
25% Unknown
58 TASMANIA
Tasmania drowning deaths by location, 2022/23
Tasmania drowning deaths by season, 2022/23
Tasmania drowning deaths by age group, 2022/23
59
0-4 Years 5-9 Years 10-14 Years 15-17 Years 18-24 Years 25-34 Years 35-44 Years 45-54 Years 55-64 Years 65-74 Years 75+ Years 25% 50%25% Summer 50% Autumn 25% Spring 25% Ocean / Harbour 50% Lake / Dam 25% Beach 25%
There were 59 drowning deaths that occurred in VIC between 1 July 2022 and 30 June 2023.
In the past 20 years, there has been a 20% decrease in drowning rates and a 7% increase in the number of drowning deaths when comparing baseline years 2002/07 and 2017/22; averaging a crude rate of 0.77 deaths per 100,000 population [3].
The drowning rate was found to increase by 19% this financial year (2022/23) when compared to the 10-year average. Drowning deaths mainly occurred in the 75+ year age group (19%), reaching a crude rate of 2.20 deaths per 100,000 population in this age group.
71% OF ALL DROWNING DEATHS IN VICTORIA
59 Drowning Deaths in 2022/23
26% increase
47
10-Year Average
0.89 2022/23 Fatal Drowning Rate per 100,000
0.75
19% increase
10-Year Average Fatal Drowning Rate per 100,000
Victoria drowning deaths by activity, 2022/23
60 VICTORIA
36% Swimming and Tecreating 7% 3% Diving Watercraft 20% 5% 2% Fall Boating Rescue 15% 5% Bathing Non-aquatic Transport
WERE MALES 7% Unknown
Victoria drowning deaths by location, 2022/23
Victoria drowning deaths by season, 2022/23
Victoria drowning deaths by age group, 2022/23
61
5% 2% 3% 7% 14%12% 10%17% 12%19% 0-4 Years 5-9 Years 10-14 Years 15-17 Years 18-24 Years 25-34 Years 35-44 Years 45-54 Years 55-64 Years 65-74 Years Unknown 75+ Years Summer 41% Autumn 19% Winter 20% Spring 20% Swimming Pool 12% Ocean / Harbour 5% Other 3% Bathtub / Spa Bath 15% Rocks 3% Lake / Dam 15% River / Creek 22% Beach 24%
There were 31 drowning deaths that occurred in WA between 1 July 2022 and 30 June 2023.
In the past 20 years, there has been a 22% decrease in drowning rates and a 3% decrease in the number of drowning deaths when comparing baseline years 2002/07 and 2017/22; averaging a crude rate of 1.71 deaths per 100,000 population [3].
The drowning rate was found to decrease by 22% this financial year (2022/23) when compared to the 10-year average. Drowning deaths mainly occurred in the 65-74 year age group (26%), reaching a crude rate of 3.17 deaths per 100,000 population in this age group.
87% OF ALL DROWNING DEATHS IN WESTERN
31 Drowning Deaths in 2022/23
14% decrease
1.11
22% decrease
36
10-Year Average
1.43
10-Year Average Fatal Drowning Rate per 100,000
Western Australia drowning deaths by activity, 2022/23
62 WESTERN
AUSTRALIA
2022/23 Fatal Drowning Rate per 100,000
26% Swimming and Recreating 13% 3% Diving Bathing 13% Fall 16% 6% 3% Watercraft Non-aquatic Transport Rescue 13% Boating
AUSTRALIA
6% Unknown
WERE MALES
Western Australia drowning deaths by location, 2022/23
Western Australia drowning deaths by season, 2022/23
Western Australia drowning deaths by age group, 2022/23
63
0-4 Years 5-9 Years 10-14 Years 15-17 Years 18-24 Years 25-34 Years 35-44 Years 45-54 Years 55-64 Years 65-74 Years 75+ Years 3% 10%6%13% 16%19% 26%6% Summer 39% Autumn 32% Winter 16% Spring 13% Swimming Pool 6% Ocean / Harbour 26% Bathtub / Spa Bath 3% Rocks 6% Lake / Dam 10% River / Creek 13% Beach 35%
Fatal drowning
The information presented in the National Drowning Report 2023 has been collated from the National Coronial Information System (NCIS), State and Territory Coronial offices and year-round media monitoring. Cases are collated in partnership with Royal Life Saving State and Territory Member Organisations (STMOs) and Surf Life Saving Australia and analysed by Royal Life Saving Society – Australia. The data presented in in the Insights by Key Drowning Locations: Coastal Environments section were analysed by Surf Life Saving Australia. Information contained within the NCIS is made available by the Victorian Department of Justice and Community Safety.
Royal Life Saving uses a media monitoring service for broadcast, print and online all year round to identify drowning deaths reported in the media. This information is then corroborated with information from the NCIS, police reports, Royal Life Saving STMOs, and Surf Life Saving Australia before being included in the National Drowning Report.
Great care is taken to ensure that the information in this report is as accurate as possible. Figures may change depending on ongoing coronial investigations and findings, as 83% of cases are still under investigation (i.e., open) as this report went to press. Royal Life Saving regularly publishes ongoing studies, which provide detailed information on long-term data trends.
Information on drowning cases is correct as of 15 August 2023. Historical drowning data are correct as of 1 July 2023 in accordance with Royal Life Saving’s ongoing data quality assurance policy. All cases in the Royal Life Saving National Fatal Drowning Database are checked against those in the NCIS on a regular basis and figures are updated in annual National Drowning Reports as cases close. The 10-year averages in this report are calculated from drowning death data from 2012/13 to 2021/22 inclusive.
Drowning rates per 100,000 population are calculated using population data from the Australian Bureau of Statistics (ABS) publication ‘Australian Demographic Statistics’ (Cat 3101.0). Percentages and averages are presented as whole numbers and have been rounded up or down accordingly. Some graphics may not add to 100% due to rounding.
Socio-Economic Indexes for Areas (SEIFA)
The Index of Relative Socio-economic Advantage and Disadvantage (IRSAD) summarises information about the economic and social conditions of people and households within an area, including both relative advantage and disadvantage measures [4].
For SEIFA 2016, the concept of relative socio-economic advantage and disadvantage is the same as that used for SEIFA 2011. That is, the ABS broadly defines relative socio-economic advantage and disadvantage in terms of people’s access to material and social resources, and their ability to participate in society.
A low score indicates relatively greater disadvantage and a lack of advantage in general. For example, an area could have a low score if there are:
• many households with low incomes, or many people in unskilled occupations, AND
• few households with high incomes, or few people in skilled occupations.
A high score indicates a relative lack of disadvantage and greater advantage in general. For example, an area may have a high score if there are:

• many households with high incomes, or many people in skilled occupations, AND
• few households with low incomes, or few people in unskilled occupations.
Data for socio-economic status was determined using the socio-economic index for advantage and disadvantage (SEIFA) for an individual’s usual place of residence.
64
METHODS
Exclusions and categorisations
Drowning deaths as a result of suicide or homicide, deaths from natural causes, shark and crocodile attacks, or hypothermia have been excluded from this report. All information presented in this report relates to drowning deaths or deaths where drowning is a contributory cause of death.
‘Non-aquatic transport’ relates to drowning deaths involving a means of transport that is not primarily designed or intended for aquatic use such as cars, motorbikes, bicycles and aeroplanes among others. Means of transport primarily used for aquatic purposes are categorised under ‘boating’ (waterbased wind or motor-powered vessels, boats, ships and personal watercraft, such as boats, jet skis, sail boats and yachts). ‘Watercraft’ refer to water-based non-powered recreational equipment such as those that are rowed or paddled (e.g., rowboats, surfboats, kayaks, canoes, boogie boards).
Acknowledgements
This report was compiled and written by William Koon, Lauren Miller, and Dr Katrien Pickles from Royal Life Saving SocietyAustralia; and Dr Jasmin Lawes, Sean Kelly, and Shane Daw from Surf Life Saving Australia.
Royal Life Saving would like to thank the following organisaitons for their role in producing the National Drowning Report 2023:
• Surf Life Saving Australia (SLSA)
• Royal Life Saving State and Territory Member Organisations (STMOs)
• The National Coronial Information System (NCIS)

• The Queensland Family and Child Commission (QFCC)
• Victorian Department of Justice and Community Safety
Royal Life Saving would like to thank the following individuals for their role in producing the National Drowning Report 2023:
• Monique Sharp (RLSSA)
• Belinda Lawton (RLSSA)
• Andrea Washington (SLSA)
• Jo Banning (SLSA)
• Michelle Bainbridge (SLSA)
• Bernadette Matthews (LSV)
• Hannah Calverley (LSV)
• Lauren Nimmo (RLSSWA)
• Rick Carter (Studio One Another)
• Melissa Conchar (SLSA)
The drowning prevention research of the Royal Life Saving Society - Australia is supported by the Australian Government.
65
RESEARCH AND POLICY 2022/23 HIGHLIGHTS

Royal Life Saving’s research and policy contribution in 2022/23 has been diverse and continues to impact drowning prevention policy and programs.


May 2023 Review of pool fencing legislation in Australia Drowning in Rivers, Creeks, Lakes and Dams A 10-year analysis: 2011/12 to 2020/21 Analysis of unintentional drowning in Australia 2002-2022 PROGRESS, CHALLENGES AND DATA TO INFORM PREVENTION National Aquatic Industry Workforce Report 2023 Data collected and collated from the National Aquatic Industry Workforce Survey.
ANALYSIS OF UNINTENTIONAL DROWNING IN AUSTRALIA 2002-2022
Progress over the 20 year period
Over the 20-year period, there has been some encouraging progress in reducing the drowning rate across all Australian states and territories. The biggest gains were in the 0-4 age group, which recorded a substantial decrease in drowning deaths. Changes to the population size and in key demographics, climate change, ongoing effects of the COVID-19 pandemic and increased use of waterways for recreation are all significant headwinds which must be countered if we are to maintain the progress made over the past two decades.
DROWNING RATE IN
26% DECREASE
Australia States & Territories *
20%
DECREASE
68 Swimming pools Ocean/Harbours Lakes/Dams Rivers/Creeks 45% DECREASE 44% DECREASE 29% DECREASE 22% DECREASE Children Adults Older age (65+ years)
59% DECREASE 27% DECREASE 11% DECREASE BY AT LEAST
* All States and Territories had at least a 20% decrease in drowning rate.
Challenges over the 20 year period
Males still drown more frequently than females; representing over 70 per cent of drowning cases each year
The biggest gap between the genders occurs in the 25-34 year age group, where 87 per cent of all drowning deaths were males
Reducing drowning in this group of young men is a priority
While there has been progress in reducing the number of children who drown each year, drowning deaths are still unacceptably high and a reduction in swimming and water safety lessons due to COVID-19 lockdowns is expected to have flow on effects in future years
Older age groups (65 years+) had an increase in the number of drowning events by 43 per cent when comparing baseline years
70 per cent of those who drowned in these age groups had a pre-exisiting medical condition
Reducing beach drowning rates has been a major challenge
The beach is a hazardous and dynamic environment, a changing climate and growing population has made keeping people safe even more difficult
Contributing Factors Population growth
Since 2002 the Australian population has grown by 34 per cent; reaching more than 26 million in 2022 2
Aging population
One in every six Australians was over the age of 65 years (4.2 million); representing 16 per cent of the Australian population
Pre-exisiting medical conditions are common among the older age groups, requiring surveillance when taking part in aquatic activities
Projections show that older people will make up 23 per cent of the Australian population by 2066 4
Population diversity
Net migration has increased by 250 per cent, reaching 395,000 migrant arrivals since 2002, despite a decline during the COVID-19 pandemic 5
Swimming ability and experience are not always known when drowning deaths are reported. Many migrants have never swum before coming to Australia and are unfamiliar with water safety, swimming and lifesaving
Environmental impacts
Extreme weather events, including flooding, are rising in frequency and severity across the world due to climate change. The most recent significant flooding occurred across Australia in 2021/22 6
COVID-19 pandemic
10 million swimming classes were cancelled due to the COVID-19 pandemic lockdowns 7
Two years of swimming and water safety education was missed for children, with a disproportinate effect on children who relied on primary school-based classes for fundamental water safety skills
Increase use of water spaces
When COVID-19 lockdowns lifted, there was a rebound in visitor numbers increasing the risk of drowning
Ongoing shortages of qualified lifeguards and swimming and water safety are a critical challenge
69
Drowning in Australia
Drowning is a significant public health issue in Australia, with an average of 282 people losing their lives each year (1). For each one of these fatal drowning incidents, three people are admitted to hospital following a non-fatal drowning (2). This ratio increases to eight hospitalisations for each fatality among children aged 0-4 years (2). The 2022 Royal Life Saving National Drowning report found 339 people fatally drowned in 2020/21, an increase of 24% on the 10-year average and 17 children aged 0-4 years fatally drowned (3).
Drowning in Australia occurs year-round, among all age groups and in all aquatic environments. However, trends are apparent which demonstrate areas of high risk among the population. For example, 11% of all drowning deaths occur in private swimming pools, including portable pools and private spas (1). However, among children aged 0-4 years this figure rises to 50%, the highest of any age group (1). Market research suggests nearly three million Australians reside in a house with a swimming pool, with the largest number of pools found in Queensland (4). Alongside inground swimming pools, these may include above ground pools, outdoor spas or portable pools.
Risk factors for child drowning
Young children are the age group at the highest risk of drowning (5). Curious and naturally attracted to water, children are at increased risk of drowning once they become more mobile (6, 7). Data from the Australian Bureau of Statistics shows drowning is the number one cause of death in one-, two- and three-year-old children (8).
Previous research has identified the risk factors for drowning among children, including lapses in adult supervision and a lack of appropriate barriers around water (5, 7). Lapses in adult supervision are commonly causes by distractions such as indoor and outdoor household duties, talking or socialising, electronic distractions and childcare (5). In situations where a distraction leads to a lapse in supervision, a barrier between a child and water can prevent unaccompanied access and thus, prevent child drowning. Pool fencing functions as an environmental intervention, averting unintended access to water (7).
The Australian Water Safety Strategy 2030 (AWSS 2030) acknowledges the complexity of reducing drowning in Australia, identifying children aged 0-4 years as a priority population (9). Existing interventions include public awareness campaigns, jurisdictional pool fencing legislation, swimming and water safety education for children and first aid training for parents and carers (9). It is encouraging to note that progress has been made, with fatal child drowning reducing by 50% over the last ten years (9). Despite this improvement, one-yearolds still record the highest fatal drowning rate of any age group at 3.47 deaths per 100,000 population (9). Programs such as Royal Life Saving’s Keep Watch aim to reduce child drowning by educating parents and carers of children aged 0-4 years (6).
The program advocates four strategies to keep children safe around water:
Supervise: Actively supervise children around water at all times,
Restrict: Restrict children’s access to water by placing a barrier between the child and water, Teach: Teach children basic swimming and water safety skills and
Respond: Learn how to respond in an emergency and make sure first aid skills are up to date (6).
70 REVIEW OF POOL FENCING LEGISLATION IN AUSTRALIA REPORT
Pool fencing
Previous research has examined the effectiveness of pool fencing to reduce child drowning. For example, a study investigating pool fencing legislation in Queensland found the number of children drowning in private pools decreased over the study period (2005-2015) (10). Midway through this period in 2009, legislation was revised to introduce a regular inspection program alongside strengthened policy regarding non-climbable zones and fencing materials (10).
A Cochrane review found that pool fencing significantly reduces the risk of drowning, specifying that isolation fencing was more effective than perimeter fencing (7). Isolation fencing refers to a fence which isolates the swimming pool from the house by completely enclosing it, such as four-sided fencing, whereas perimeter fencing encloses the house with the swimming pool, meaning access can be gained through the house, such as threesided fencing (7). The review recommended legislation require all pools be fenced, whether newly constructed or existing, as well as noting the importance of enforcement of any legislation to ensure increased rates of compliance (7).
The Australian Water Safety Strategy 2030 highlights the vital role of partnerships across all areas of water safety, including State, Territory and local governments (9). In Australia, legislation regarding pool fencing requirements is governed at a jurisdictional level, with each state or territory responsible for their own compliance laws, swimming pool registers and inspection regimes.
Case study: A 15-year analysis of drowning deaths among children aged 0-4 years in New South Wales (NSW)
This research has identified the most common means of unaccompanied access to private pools and spas.
38% of children accessed the pool through a faculty fence or gate,
26% due to the lack of a pool fence,
24% due to the gate being deliberately propped open and
6% due to the child climbing over the fence (11).
In the remaining 6% of cases, the child was already in the pool area when the drowning incident occurred (11). The cases which involved a faulty fence or gate included structures which had fallen into disrepair, faulty gates which did not close and latch as designed and loose fence palings (11).
71
ACT* NSW NT QLD SA TAS VIC WA Uses current Australian standard for new pools Old Version Modified Version Pool registration required Regular inspections required # Requirements when selling property with pool Requirements on landlord when renting property with a pool Signage (CPR / first aid) required
Summary of key pool fencing requirements by State / Territory
*ACT legislation is currently under review as at March 2023. # Required by some councils.
The industry is mostly female
58% 40%
1% NON-BINARY
1% PREFER NOT TO SAY
Approximately one in every 25 workers identify as Aboriginal or Torres Strait Islander
3.2% of the population identify as either Aboriginal or Torres Strait Islander (ABS 2022)1
Most workers were born in Australia and speak English at home
27.6% of Australians are born overseas (ABS 2022)2
90%
Speak English at home
87%
Born in Australia
4% are Indigenous
62% of workers on an hourly rate are paid between $26-$35 per hour
The median national hourly wage across all industries is $37 per hour, and $31.25 in community and personal service sectors2
Lifestyle and career were important factors to taking up work in the aquatic industry
User of facilities prior to employment
It suited my lifestyle Career opportunity
The workforce has a broad and evenly spread age spectrum
72 NATIONAL AQUATIC INDUSTRY WORKFORCE REPORT 2023
39% 34% 30% 6% 16% 20% 18% 19% 17% 4% 65+ 55-64 45-54 35-44 25-34 18-24 <18
There is a significant casual workforce
More than half perform more than 1 role
Most workers work at a public swimming pool managed by Government or private operator A little less than two-thirds work less than 24 hours per week.
Workers ranked the following as most important:
Good management and leadership
Child-safe environment
Positive and collegial work environment
Water safety and drowning prevention
Improved pay and work conditions
Diversity and inclusion
Workers gain enjoyment and satisfaction from
Making a positive impact on people’s lives
Helping make people safe around water
Interaction with customers
73
*20% of the Australian workforce works casually (ABS 2022)4
Other 12% Part time 12% *Casual 34% Full time 42%
#1 #1 #4 #2 #2 #5 #3 #3 #6 Yes 61% No 39% Public swimming pool managed by Council or State Govt 43% Public swimming pool managed by private operator 24% 8-15 hrs 16-23 hrs 20% >23 hrs 37% <8 hrs 18% 25%
PEOPLE DROWNED IN RIVERS, CREEKS, LAKES AND DAMS
74 DROWNING IN RIVERS, CREEKS, LAKES AND
REPORT
DAMS
2011/12 TO 2020/21
Distance travelled 34% of all drowning deaths in Australia 92 people every year 80% of all drowning deaths were males Top age groups Where 18% 73% 25-34 years 40% drowned within 0-20km of where they lived River/Creek 14% 27% 35-44 years Lake/Dam 12% 5% 45-44 years National Parks/State Conservation Areas
924
75 When Top inland locations for drowning Activity 39% Summer 22% Swimming & Recreating 44% Afternoon 19% Fall Into Water 32% During School Holidays 7% During Public Holidays 17% Boating & Watercraft 8% Flood-related Western Australia South Australia Queensland Victoria Tasmania New South Wales Northern Territory Australian Capital Territory Goulburn River Murrumbidgee River Brisbane River Ross River Clarence River Hawkesbury River Lake Macquarie St Georges Basin Lake Eildon Parramatta River Nepean River Swan River Murray River Yarra River
REFERENCES
1. Roy Morgan, Walking, swimming and gym training are the most popular sports and activities Australians do regularly. 2023: Sydney, Australia.
2. Pidgeon, S., et al., Benchmarking Australian childrens’ swimming and water safety skills: swim school data. Part 1: Primary school children aged 512 years. 2018, Royal Life Saving Society - Australia: Sydney.
3. Miller, L., Analysis of unintentional drowning in Australia 2002-2022: progress, challenges, and data to inform prevention. 2023, Royal Life Saving Society - Australia: Sydney, Australia.
4. Australian Bureau of Statistics. Census of Population and Housing: Socio-Economic Indexes for Areas (SEIFA), Australia, 2016. 2018 [cited 2023 22 August]; Available from: https:// www.abs.gov.au/ausstats/abs@.nsf/Lookup/ by%20Subject/2033.0.55.001~2016~Main%20 Features~IRSAD~20#:~:text=The%20Index%20 of%20Relative%20Socio,relative%20advantage%20 and%20disadvantage%20measures.
5. Peden, A., Mahony, A, Trends in Child Drowning Over The Last 25 Years. 2018, Royal Life Saving Society – Australia,: Sydney.
6. Australian Water Safety Council, Australian Water Safety Strategy 2030. 2021, Australian Water Safety Council: Sydney.
7. Lawes, J., Tourism and recreation. In: Clark G, Fischer M, Hunter C, editors. Australia state of the environment 2021: Coasts, independent report to the Australian Government Minister for the Environment: Commonweath of Australia, Canberra; 2021.
8. Tourism Australia, Research underpins new push to promote Australia’s aquatic and coastal experiences. 2015 [cited 2023 16 February]; Available from: http:// www.tourism.australia.com/content/dam/assets/ document/1/6/w/s/z/2002067.pdf.
9. Koon, W., Peden, A., Lawes, J., Brander, R., Coastal drowning: A scoping review of burden, risk factors, and prevention strategies. PLos One. 2021 Feb 1;16(2):e0246034
10. Pidgeon-Willcox, S.M., Drowning in Rivers, Creeks, Lakes and Dams: A 10-year analysis 2011/12 to 2020/21. 2023, Royal Life Saving Society - Australia: Sydney, Australia.
11. Peden, A. and A.C. Queiroga, Drowning Deaths in Australian Rivers, Creeks and Streams: A 10 Year Analysis. 2014, Royal Life Saving Society - Australia.
12. Williams, J., F. McMillan, and A. Peden, Yarning about water safety: Qualitative research about water safety with First Nations residents of Wiradjuri land. 2023, UNSW Sydney: Sydney, Australia.
13. Sherry, E., et al., The Social Impact of the National Aquatic Industry. 2021, Swinburne Sport Innovation Research Group and Royal Life Saving Society: Victoria, Australia.
14. Roy Morgan, One-in-seven Australians (3.1 million) live in a house with a swimming pool or spa. 2023: Sydney, Australia.
76
Suggested citation
Royal Life Saving Society – Australia (2023)
National Drowning Report 2023, Sydney Australia.


Royal Life Saving Society – Australia Online royallifesaving.com.au Call 02 8217 3111 Surf Life Saving Australia Online sls.com.au Call 02 9215 8000 SHOW YOUR SUPPORT #NationalDrowningReport2023 IN PARTNERSHIP WITH
