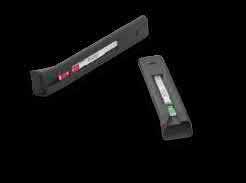
The 4 Types of Testers
Mycotoxins: What Do You Expect from a Rapid Testing Solution? ppm
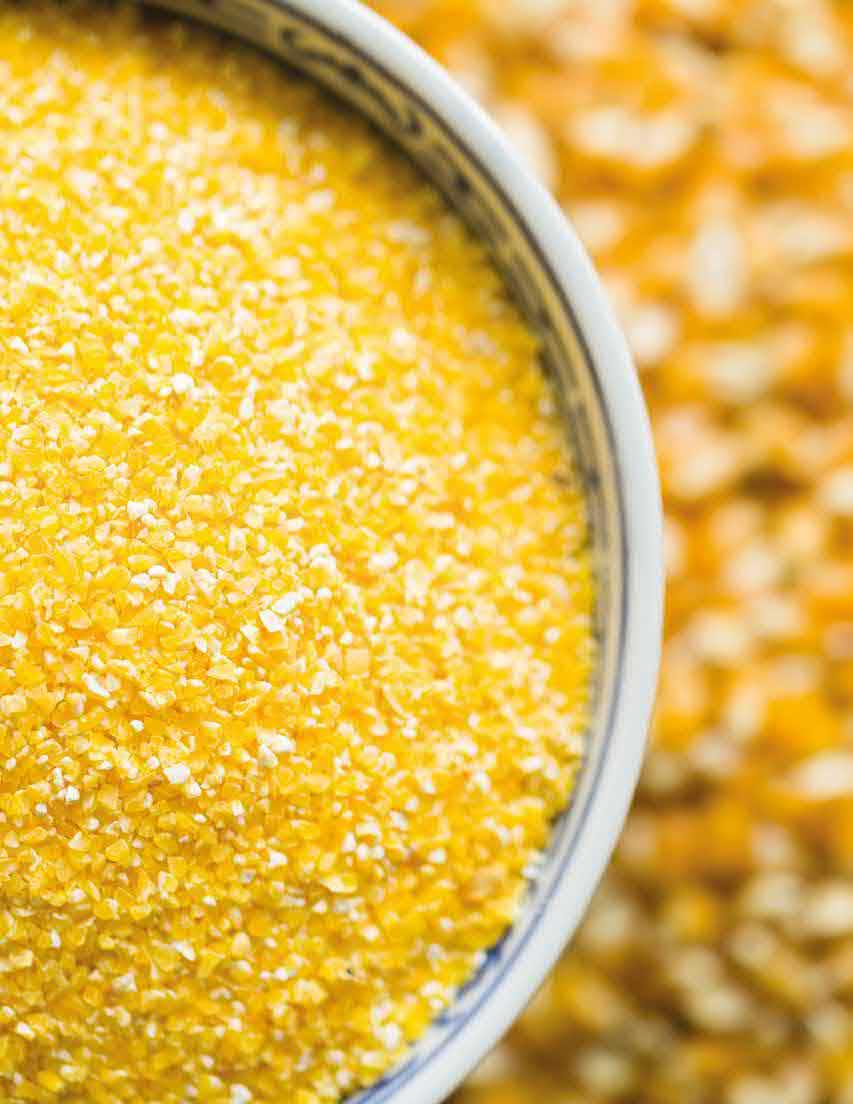
Grain Size: A Simple Way to Improve Your Extraction and Results
Issue 13 A Romer Labs® Publication
Spot On is a publication of Romer Labs Division Holding GmbH, distributed free-of-charge.
ISSN: 2414-2042
Editors:
Joshua Davis, Cristian Ilea
Contributors:
Joshua Davis, Henriette Hobbs, Nora Kogelnik, Ervin Tanyi
Graphic: GraphX ERBER AG
Research: Kurt Brunner
Publisher:
Romer Labs Division Holding GmbH

Erber Campus 1
3131 Getzersdorf, Austria
Tel: +43 2782 803 0 www.romerlabs.com
©Copyright 2021, Romer Labs®
All rights reserved. No part of this publication may be reproduced in any material form for commercial purposes without the written permission of the copyright holder.
All photos herein are the property of Romer Labs or used with license.
Romer Labs is part of DSM.
ppm
What Kind of Mycotoxin Tester Are You? 4 Types of Testers and What They Expect from a Rapid Solution
Economic losses, risks to the health of humans and animals, increasingly complex regulatory frameworks: the reasons that producers of grain, food and animal feed need to test for mycotoxins are manifold. Romer Labs communications manager Joshua Davis and key account manager Ervin Tanyi look at a few common situations in which rapid tests can help.
By Joshua Davis, Communications Manager, Romer Labs, and Ervin Tanyi
Smaller is Better: Improve Mycotoxin Analysis Results by Reducing Particle Size
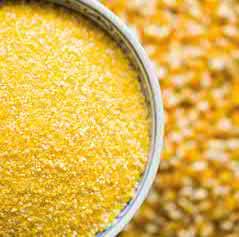
The latest research is showing that particle size in a sample has a considerable effect on the accuracy of mycotoxin analytical methods. Mycotoxin experts Henriette Hobbs and Nora Kogelnik size up the problem and offer a few recommendations to keep your mycotoxin testing operations accurate and reliable.
By Nora Kogelnik, Product Manager, and Henriette Hobbs, Senior Scientist
2
Contents
Photo: BJI
Photo: Sebastian LeeschEyeEm
Fast and Accurate – and User-Friendly: Responding to the Needs of Mycotoxin Testers
Since our founding in 1982, we at Romer Labs have made the analysis of mycotoxins central to our business.
This lengthy record has given us unparalleled understanding not only of the ins and outs of analytics, but also of the varied needs of the market. It’s not enough just to develop a product or service that works. It has to work towards fulfilling the specific requirements of the customer. Or, to put this another way: precision should not have to come at the cost of usability.
When we began to work on the AgraStrip® Pro WATEX® system, we turned to those who use our products on a daily basis: our service labs, our technical support teams, and, of course, our customers. We asked them, “What do you need a rapid test to do on site? What are the challenges that you’re confronted with on a daily basis?” From testing circumstances as diverse as grain silos in Brazil, corn starch factories in Europe and pet food producers in the USA, there was one answer we kept hearing: “Why can’t testing for mycotoxins be more userfriendly?” So, while ensuring that we improved on standards for sensitivity and speed, we devoted ourselves to optimizing the process and addressing the issues
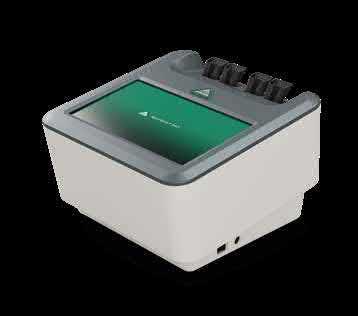
The result? LFDs with low LODs and the new AgraVision™ Pro reader which does a lot of the work that testers used to do, controlling timing, temperature and test flow. With a 7-inch touchscreen and 4 independently operating test slots, the AgraVision™ Pro reader is our way of giving mycotoxin testers high performance
, we confront some of the issues that keep mycotoxin testers up at night. Our key account manager Ervin Tanyi draws from his years of experience to pinpoint four different types of mycotoxin hunters, the challenges that confront them, and what they expect from a rapid testing solution.
Product manager Nora Kogelnik then teams up with senior scientist Henriette Hobbs to look at a specific problem relating to sample preparation: grain size and its effect on sample extraction and mycotoxin recovery. They cast new light on this often-overlooked topic and show how a just a few adjustments can improve
I hope that you enjoy this issue of Spot On
Klaus Hasler Managing Director, Romer Labs Diagnostic GmbH

3 Editorial
A Romer Labs ® Publication
4 Spot On Issue 13
ppm
What Kind of Mycotoxin Tester Are You?
4 Types of Testers and What They Expect from a Rapid Solution
Economic losses, risks to the health of humans and animals, increasingly complex regulatory frameworks: the reasons that producers of grain, food and animal feed need to test for mycotoxins are manifold.
Romer Labs communications manager
Joshua Davis and key account manager
Ervin Tanyi look at a few common situations in which rapid tests can help.
 By Joshua Davis, Communications Manager, Romer Labs, and
Tanyi, Key Account Manager, Romer Labs
By Joshua Davis, Communications Manager, Romer Labs, and
Tanyi, Key Account Manager, Romer Labs
A Romer Labs ® Publication 5
Ervin
Mycotoxins: a growing threat
The economic damage that can be attributed to mycotoxins is growing: the FAO estimates that 25% of global agricultural production is contaminated with mycotoxins. These toxic compounds can trigger health problems in both humans and animals, ranging from cancer to diseases of the liver, kidney, nervous system, hormonal system, and much more. Some mycotoxins are even known to suppress the immune system.
As our knowledge about mycotoxins increases, so do regulatory restrictions on them in raw materials, animal feed and food. These restrictions have in turn unleashed a multitude of strategies and products designed to detect mycotoxins and prevent the damage they cause to health and business. Of the tools at our disposal, rapid mycotoxin detection solutions based on lateral flow device (LFD) technology have proven themselves to be versatile and robust enough to be used onsite and accurate enough, in many cases, to supplant the need for laboratory methods.
For years now, we have worked with grain and feed producers and traders throughout the world, helping them to implement mycotoxin detection tools at their raw material reception points, grain silos, feed mills and other locations where they need mycotoxin results that are both fast and accurate. In this article, we discuss four different types of testers who need rapid testing solutions for related but different reasons. It’s our hope that those of you who read this and recognize yourselves in one of these four roles might learn a bit about how rapid testing solutions can help you in your mycotoxin detection program.
load their shipments and if so, where they should be unloaded. Those further down the supply line, such as those waiting to store or further process the materials, are likewise relying on the grain wrangler to make a quick and accurate decision.
The testing method should also be simple, so grain wranglers can easily learn and perform with confidence. This simplicity is essential, as they already have their hands full with other parameters that need measuring: moisture, cleanliness, and protein content are just a few others aside from mycotoxins that they need to measure within a short period of time.
Raw material reception also demands a robust design from the tests and equipment. Grain reception and the grinding that goes on there generates far more dust compared to a standard laboratory environment. Furthermore, the ambient temperature can vary widely, depending on weather conditions when grain is harvested. Testing equipment needs to be correspondingly resistant to these harsh conditions.
Confronted with all these challenges, the grain wrangler needs a convenient way to manage results. It used to be enough to read results from test strips or a reader display and record it manually. These days, connectivity is a must: results must be easily transferrable to computer systems, including LIMS and ERP platforms.
#1: The grain wrangler (incoming raw materials)
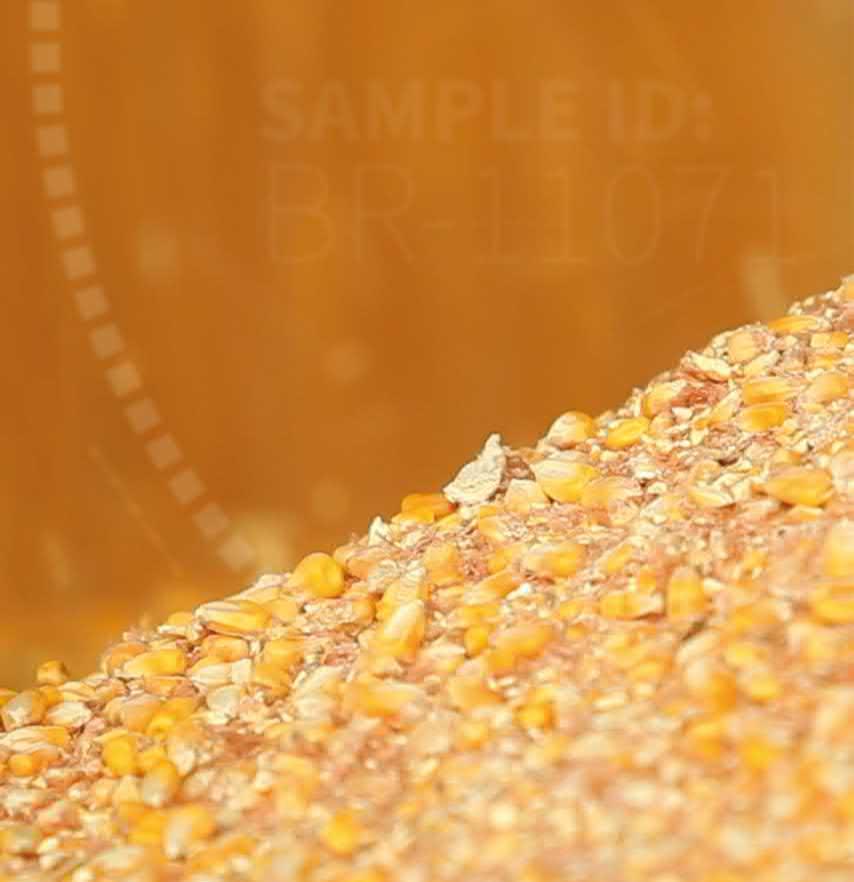
One of the most significant critical testing points within the food chain is raw material reception; we like to think of those playing this crucial role as “grain wranglers.” The grain wrangler decides whether to accept, reject or otherwise segregate ingredients, most often raw grains, based on their levels of mycotoxin contamination. Grain wranglers need testing methods that fulfill very specific, local requirements.
For the grain wrangler, time-to-result is of critical importance, as everyone in the supply chain is waiting for his or her decision. Within minutes, truck drivers or rail operators need to know whether they can un-
#2: The artisan tester (QC for highly refined products)
Like grain wranglers, those carrying out quality control for highly refined products such as citric acid, starch, high fructose corn syrup and other biodegradable ingredients of natural origin need reliable and fast solutions to test for mycotoxins.
Yet their initial situation couldn’t be more different: they typically don’t have the time pressure that comes with trucks waiting to unload their goods at reception points, and often have the benefit of a laboratory environment and trained staff. Chiefly concerned with the exacting demands of ingredient production, they have an eye for precision; we call them “artisan testers.”
Although they may have access to analytical methods such as HPLC or mass spectrometry, artisan testers often prefer a mycotoxin rapid test for its simplicity and its flexibility. Increasing testing volume with rapid test kits frees up more complex equipment and labor time for other necessary lab work.
6 Spot On Issue 13
Lateral flow device (LFD) technology has proven to be versatile and robust enough to be used on site and accurate enough, in many cases, to supplant the need for laboratory methods.
#3: The mycotoxin cop (compliance with regulations and thresholds)
Both the grain wrangler and the artisan tester typically ply their trade for a business trading raw materials or producing goods out of those raw materials. Those playing our third role typically aren’t paying attention to the bottom line of a business; they’re making sure regulations are being followed as they should be. Often employed by certification companies or regulatory agencies, their job is the enforcement of mycotoxin thresholds and the certification of shipments by train or truck. We like to call those playing this essential role “mycotoxin cops.”
Mycotoxin cops are almost always working far from a traditional lab environment; if anything, their lab is limited to what they can fit in the trunk of their car. They service trains bound to remote locations to ensure compliance with regulations. Often working far from centers of commerce, internet connection is a luxury not always available to them. They often lack the grinding equipment available to the grain wrangler and have to rely on coffee grinders to get their test samples.
While complex lab equipment is not an option for the mycotoxin cop, not just any rapid test solution will do. Aside from the basic requirements of sensitivity, accuracy and usability, test strips and readers must be able to maintain quality performance despite always being on the move. Mobility is a chief concern, with special equipment such as power adaptors and batteries enabling mycotoxin cops to go where they are most needed.
about the species of animal for which it can be used— or whether it can be used at all. In our experience, the animal guardian can’t always wait for mycotoxin results to come in before deciding how to use a lot or whether a feed additive, such as a mycotoxin deactivator, is indicated. Rapid tests help the animal guardian keep livestock safe from the harmful effects of mycotoxins while ensuring that the nutritional needs of livestock are met in a timely fashion.
Conclusion: A universal need for speed (and sensitivity and usability and precision)
Grain wrangler, artisan tester, mycotoxin cop, animal guardian: all of these kinds of mycotoxin hunters share a few basic expectations of a mycotoxin rapid testing solution.
SPEED Testers have no time to lose. Maybe you’re the grain wrangler with trucks waiting for you to tell them whether or where to unload, or maybe you’re the freelancer mycotoxin cop who has to test, certify (or not) and rush to the next location. All the same, you need a system that puts the “rapid” in rapid testing.
SENSITIVITY . All testers need a system that can deliver results down to the low levels of concentration demanded by regulators. Some testers may be dealing with internal thresholds more stringent than those of regulators. If this describes you, then you’ll need to make sure that any system you’re considering has an LOD that meets your needs and is validated for the matrix or matrices you need to test.
What makes a rapid test system userfriendly? A large and intuitively built user interface on the reader goes a long way.
#4: The animal guardian (mycotoxin risk management program)
For those playing this last rapid test role under discussion, the health of the animals in their care is paramount. “Animal guardians” ensure that the feed their animals receive is wholesome and within acceptable regulatory thresholds for mycotoxin concentration. Yet regulations are only part of the story; recommendations from veterinarians can often result in thresholds far stricter than official ones.
The animal guardian knows that to manage mycotoxin risk in feed, he or she first has to measure that risk. The mycotoxin concentration of a specific lot of feed or feed ingredients will give useful information
USABILITY What makes a rapid test system userfriendly? Clients keep mentioning one thing that makes a kit usable: a streamlined workflow. When you consider the needs of, say, the animal guardian who has to juggle several different kinds of tasks, a workflow with as few steps as possible is a must. We would only add that the workflow is only part of the story: a large and intuitively built user interface on the reader also goes a long way to making life easier for all testers.
PRECISION For obvious reasons, no one in any of these roles can accept a rapid test system that delivers unreliable results. For example, the highly specialized work that goes into the production of refined materials like DDGS can’t afford to be soured by unacceptable levels of mycotoxins.
Ultimately, regardless of the role we might play in mycotoxin detection, we are guided by one imperative: keeping our food and feed within acceptable levels. Rapid mycotoxin testing solutions will continue to be indispensable tools in fulfilling this mission.
A Romer Labs ® Publication 7
8 Spot On Issue 13
Smaller is Better:
Improve Mycotoxin Analysis Results by Reducing Particle Size
The latest research is showing that particle size in a sample has a considerable effect on the accuracy of mycotoxin analytical methods. Mycotoxin experts Henriette Hobbs and Nora Kogelnik size up the problem and offer a few recommendations to keep your mycotoxin testing operations accurate and reliable.
By Henriette Hobbs, Ph.D., Senior Scientist, and Nora Kogelnik, Ph.D., Product Manager
Photo: BJI A Romer Labs ® Publication 9
Sampling and sample preparation are complex processes, rife with potential pitfalls; each step within the sample preparation process introduces a level of variability that contributes to the total variability within a single analytical result.
In the mycotoxin analytical community, we generally work with three main procedural steps when it comes to agricultural commodities such as corn, wheat, and barley: sampling, sample preparation and analysis. To determine the mycotoxin concentration present in a bulk lot, we must analyze a smaller but still representative portion of the lot; this means that reliable results are impossible without a proper sampling plan, which includes taking incremental samples of the lot and combining them into a subsample (also known as a bulk sample). This forms a basis that ensures that the sample to be tested is truly representative of the lot.
From here, our focus moves to sample preparation. For grain-based products, sample preparation consists of two important steps, grinding the sample and subsampling: 1) a mill or other device is used to grind the grain in the bulk sample to reduce particle size and to ensure uniformity; 2) from this sample, we obtain a subsample representative of the whole lot, which we then test. This test sample is subsequently prepared for extraction according to a defined protocol [10]
Yet sampling and sample preparation are complex processes, rife with potential pitfalls; each step within the sample preparation process introduces a level of variability that contributes to the total variability within a single analytical result [2, 5]. Numerous studies have shown that two thirds of the observed variability result from the method of sampling, with one third attributable to the way the sample is prepared. A much smaller percentage of variability relates to the analytical method being applied (figure 1).
Accordingly, accurate results depend on the degree to which we take these three factors into account. While numerous studies discuss the importance of sampling methods and analytical solvents on the effect of mycotoxin detection (see [1, 2, 4] for prominent examples), this article will consider the importance of sample preparation, i.e. grinding and sample size, and, in summarizing recent research on the matter, discuss the effect sample preparation has on accurate mycotoxin analysis and sample variance [10]
Select a representative sample
When a commodity is naturally contaminated with mycotoxins, contaminated kernels are generally distributed unequally throughout a certain lot; these groupings of contaminated kernels are known as “hot spots.” To provide an accurate view of the degree of contamination in a lot, a sampling plan must account for the random distribution of such hot spots. This is done by taking a large number of small, incremental samples from various locations distributed throughout the lot in order to obtain a representative sample (figure 2) [8]. The selection of incremental samples from a bulk lot is crucial to give all grains an equal chance of being selected, thus reducing bias [10]
10 Spot On Issue 13
Sampling 61% Sample preparation 36% Analysis 3% 3 Total variation observed for a 20 ppb AFLA corn sample Analysis 3% Sample preparation 36% Sampling 61%
Figure 1. Variance observed during sampling (61%), sampling preparation (36%) and analysis (3%) for a sample contaminated with 20 ppb AFLA. Adapted from [2]
Bulk Sample Divider Test Sample Increments Lot
Figure 2: Sample selection procedure for obtaining a representative test sample from a bulk lot, where the bulk sample is the accumulation of many smaller incremental portions taken from different locations. The “divider” further segments the bulk sample into individual test samples [10]
Grind to ensure a uniform particle size
The molds that produce mycotoxins have several different routes of contamination; as a result, mycotoxins can be found both inside of grains and on the surface. The route of infection is dependent on the mycotoxin and the grain in question. It is well known that certain mycotoxin-producing fungi, such as Fusarium , are present within the grain or kernel while others, such as Aspergillus, are present on the surface. Grinding a sample uniformly solves this problem by breaking open contaminated kernels and allowing for an even distribution of particles. This ultimately improves the detection of contaminated particles [3]
Homogenize potential mycotoxin distribution by passing the grain through a mesh and mixing
After selecting the sample to be representative of the lot and grinding it to ensure uniform particle size, the sample needs to be homogenized by mixing it thoroughly; this also helps to make it representative of the bulk sample [3]
Grains segregate according to size, reducing the degree to which the sample is representative and leading to an inaccurate analytical result. For this reason, prior to mixing, we confirm that the uniformity of the grind is adequate by passing the ground sample through a mesh or sieve. The goal is not to filter out larger particles as they may also contain mycotoxins; on the contrary, these larger particles must be included in the sample. Rather, we ensure the uniformity of the grind by checking that a certain percentage of particles is able to pass through. The USDAFGIS, for example, has
established specifications for sample size, sample grinding, and subsampling for aflatoxin, deoxynivalenol, fumonisin, ochratoxin, and zearalenone [9]. USDAFGIS recommends that a sample be ground such that 60-75% of the particles pass through a no. 20 sieve and that 50 g test sample (including the particles that do not pass through the sieve) be used for the extraction of the mycotoxin.
Keep your grain size small, your sample size large, and your mycotoxin results accurate
We use the terms “accuracy” and “precision” throughout this article, so a quick definition of these terms is in order here: accuracy and precision signify uncertainties associated with analysis that can be introduced from the initial sample preparation method or plan. Accuracy is defined as the closeness of a measured value to the true value, while precision is defined as the closeness of measured values to each other. The ultimate goal should be to implement a process which ensures both high accuracy and high precision [10].
Studies show that the precision of a mycotoxin detection method and hence the variance of results depend greatly on the size of the particles within the sample. To demonstrate the measurement variability associated with the size of particles within the sample and the size of the sample under analysis, we refer to several studies that evaluated it (figure 3 and figure 4). In the first study performed by Whitaker et al. (shown in figure 3), corn samples naturally contaminated by aflatoxin were characterized. The samples of differently sized grains were subsequently passed through a no. 20 sieve: 1) a
The goal of passing the ground sample through a mesh is not to filter out larger particles as they may also contain mycotoxins; on the contrary, these larger particles must be included in the sample.
A Romer Labs ® Publication 11
Sample Number 60% 20 mesh sample 99% 20 mesh sample Hammer mill Ground Sample 10 g 50 g 10 g 50 g 10 g 1 91 151 140 149 160 2 222 125 154 148 154 3 167 136 136 135 151 4 217 110 138 144 155 5 135 123 155 151 156 6 95 139 141 140 153 7 86 111 147 148 162 8 108 115 167 149 171 Average (ppb) 140 126 147 145 158 SD (ppb) 56 15 11 5 7 RSD (%) 40 12 7 4 4
Table 3: The effect of particle and sample size on aflatoxin levels in naturally contaminated corn samples [9]
coarse grind (60% of the particles passed through), 2) a fine grind (99% of the particles passed through) and 3) powdered (with a hammer mill). Eight samples from each grinding interval were then analyzed using a modified HPLC reference method to demonstrate inter-sample variance within a single ground state [9]
As you can see in table 3 , there is variation in analytical results depending on both sample size and grind size. Yet how can we quantify this variation in a way that is useful to us? The relative standard deviation (RSD) or coefficient of variation (CV) are often used to determine how dissimilar results in a particular data set are. The RSD is often declared as a percentage and is defined by the ratio of the standard deviation to the mean. The lower the standard deviation, the less variation within the data set and the more reliable the result. In the data from the study depicted in table 3, significant variability was observed between samples of 10 g
consisting of different particle sizes. The 10 g of coarsely ground samples show at 40% the highest RSD when compared to the more finely ground sample (99% 20mesh sample), with a calculated RSD of 7%. The lowest RSD, 4%, was be reached with powdered samples from the hammer mill. Although a hammer mill may not typically be financially feasible for the average tester, the study by Whitaker et al. demonstrates that the best way to avoid variance coming from sample preparation is to grind finely and to use a mesh to ensure the uniformity of particle size [9].

To further demonstrate the impact of particle size (grinding) and sample size on analytical variability among different mycotoxins, Brunkhorst et al performed an analysis on corn samples naturally contaminated with either total aflatoxin (sum of B1, B2, G1 and G2), total fumonisin (sum of B1, B2 and B3) or zearelenone (figure 4). For this study, 10 corn samples
Furthermore, the CV in % was determined and represented as a line graph in figure B, D and F. (Adapted with permission from the authors of [2, 7, 12].)

12 Spot On Issue 13
Figure 4: The effect of grind size (grinding) and sample size (1 g, 5 g, 10 g, 25 g) on analytical variability. Individual extracts (n=10) of different combinations of mesh and sample size were analyzed for total aflatoxin (A, B), total fumonisin (C, D), and zearalenone (E, F) in naturally contaminated corn. Reference methods were used for sample characterization. The results were averaged, standard deviation was calculated and represented in graph A, C and E.
B A
Total Aflatoxin
Total Aflatoxin concentration[in ppb] CV [in%] for Total Aflatoxin 400 350 300 250 200 150 100 50 0 200 180 160 140 120 100 80 60 40 20 0 52.8 % pass through 10 mesh 51.3 % pass through 20 mesh 97.1 % pass through 20 mesh 100 % pass through 30 mesh n 1 gram n 5 grams n 10 grams n 25 grams 10 mesh 52.8 % pass through 20 mesh 97.1 % pass through 20 mesh 51.3 % pass through 30 mesh 100 % pass through Coefficient of Variation (CV) 1 gram 5 grams 10 grams 25 grams GRAMS of SAMPLE used for EXTRACTION
Studies show that the precision of a mycotoxin detection method and hence the variance of results depend greatly on the size of the particles within the sample.
Total Fumonisin
n 1 gram n 5 grams n 10 grams n 25 grams
The lower the standard deviation, the less variation within the data set and the more reliable the result.
Coefficient of Variation (CV)
10 mesh 50 % pass through
20 mesh 50 % pass through
20 mesh 95 % pass through
30 mesh 95 % pass through
grams
grams
Coefficient of Variation (CV) 1 gram
n 1 gram n 5 grams n 10 grams n 25 grams
10 mesh 50 % pass through
20 mesh 50 % pass through
20 mesh 95 % pass through
30 mesh 100 % pass through
A Romer Labs ® Publication 13
C D Zearalenone E F Total Fumonisin concentration [in ppm] CV [in %] for Total Fumonisin CV [in %] for Zearalenone Zearalenone concentration [in ppb] 9 8 7 6 5 4 3 2 1 0 120 100 80 60 40 20 0 50 45 40 35 30 25 20 15 10 5 0 2500 2000 1500 1000 500 0 50 % pass through 10 mesh 50 % pass through 10 mesh 50 % pass through 20 mesh 50 % pass through 20 mesh 95 % pass through 20 mesh 95 % pass through 20 mesh 95
30 mesh
mesh
% pass through
100 % pass through 30
5
10
EXTRACTION
5
10
25
EXTRACTION
grams
grams 25 grams GRAMS of SAMPLE used for
1 gram
grams GRAMS of SAMPLE used for
for each mycotoxin were ground to different particle sizes to allow them to pass through either a no. 10 sieve, a no. 20 sieve or a no. 30 sieve. The variance of different sample sizes (1 g, 5 g, 10 g and 25 g) for extraction were also further investigated. The aflatoxin samples were extracted with acetonitrile/water (84/16) and analyzed using an AOAC method and a KOBRA cell for post column bromination. Fumonisin samples were extracted with methanol/water (3/1) and also analyzed according to the method of AOAC. Zearealenone samples were also extracted with acetonitrile/water and analyzed using LCMS/MS.
Note: The data shown in each pair of graphs is some-
what redundant. However, we find it useful to represent the coefficient of variation in a separate graph.
The results clearly show that the grind size and sample size impact the accuracy of the analysis. The study suggests that AFLA and ZON exhibit a higher degree of dependency (i.e. a higher CV) on sample volume and grind size than FUM, though we hesitate to draw a firm conclusion from these individual studies; more research is needed to confirm our observation.
For sample sizes of 1 g and 5 g, the RSDs for AFLA, FUM, and ZON were higher compared to sample sizes of 10 g and 25 g. The variability observed for a 10 g sample of corn contaminated with AFLA declined from 58.9%
14 Spot On Issue 13
A B Deoxynivalenol Concentration in ppm CV [in %] for Deoxynivalenol in Barley 4.50 4.00 3.50 3.00 2.50 2.00 1.50 1.00 0.50 0.00 50 45 40 35 30 25 20 15 10 5 0 50 % pass through 10 mesh 50 % pass through 20 mesh 95 % pass through 20 mesh 95 % pass through 30 mesh n 1 gram n 5 grams n 10 grams n 25 grams 10 mesh 50 % pass through 20 mesh 95 % pass through 20 mesh 50 % pass through 30 mesh 95 % pass through Coefficient of Variation (CV) 1 gram 5 grams 10 grams 25 grams GRAMS of SAMPLE used for EXTRACTION
Figure 5: The effect of grind and sample size on the analytical variability of deoxynivalenol in barley. Individual extracts (n= 10) at different combinations of mesh and sample size were analyzed using LC-MS/MS. The results where averaged, standard deviation was determined represented in the graph (A) and the CV in % was calculated and represented as line graph (B) [6].
Results clearly demonstrate that the analytical variability can be reduced when samples are ground to pass through a finer mesh size.
Deoxynivalenol
(coarsely ground) to 9.3% (finely ground), for FUM from 39.8% (coarsely ground) to 4.6% (finely ground), and for ZON from 21% (coarsely ground) to 2% (finely ground). These results further affirm the effect of grind size on analytical variance and accuracy with regards to mycotoxin extraction and analysis from grains.
Finally, Brunkhorst et al. further elucidated their findings and determined deoxynivalenol levels in naturally contaminated barley samples with the same study outline. Barley samples were ground to four different mesh sizes, extracted (10 individual extracts at each mesh and sample size) using acetonitrile/water (84/16) and analyzed by LCMSMS (figure 5) [6]
The results clearly demonstrate that the analytical variability can be reduced when samples are ground to pass through a finer mesh size. Furthermore, increasing the sample size further helps to reduce the analytical variability. The coefficient of variation was able to be reduced from 11% to just 5% when using a 10 g sample with a no. 10 mesh. A sample size of 10 g and 25 g in combination with a no. 20 mesh (95%) and no. 30 mesh (95%) provides accurate and precise results, reducing the CV to 5% and 3%, respectively. As this study used barley instead of corn, it suggests that the effect of the sample size and grinding on the analytical variability of mycotoxins may not be matrix-dependent. Further study is necessary to confirm this [6]
References
Conclusion: Mesh, mix, repeat as needed
The importance of sample grinding and sample size, as well as the impact these factors have on reducing variability and minimizing errors during mycotoxin analysis, is evident. In the studies presented, significant variation was observed between coarsely and finely ground samples from the same source and contamination level. Beyond simple observation of variation, the data from these studies suggest some initial approaches to sample size and grinding. As for sample size, 10 g has proven to be sufficient, while 25 g may provide even greater accuracy. When using a no. 20 mesh, 95% of the sample should pass through. When using a no. 30 mesh, 100% should pass through.
The main goal of mycotoxin analysis is to obtain accurate and reliable results despite the difficulties of sampling and the complexities of sample preparation for grain and crops. Yet even the best technology, whether it be in the form of cutting-edge rapid tests or highly precise mass spectrometry equipment, will be of no avail if your sample isn’t representative of the lot under examination. There’s more to a representative sample than just the sampling; sample preparation is key. If you adhere to the three key factors of sample preparation (grind size, sample size and homogeneity), you can keep your RSD at <10%, increasing the trustworthiness of your analytical result.
1) E. Pilcher: Sampling for mycotoxins – do we care enough? Romer Labs. 2016, https://www.romerlabs.com/en/ knowledge-center/knowledge-library/articles/news/sampling-for-mycotoxins-do-we-care-enough/
2) J. Brunkhorst: Effects of particle size and extraction size for effective mycotoxin analysis, Trilogy Analytical Laboratory, presented at AAFCO 2017 Collin L. The effect of grind and extraction size on aflatoxin variability. Trilogy Analytical Laboratory, Washington, MO 63090
3) J. Richard: Sampling and Sample Preparation for Mycotoxin Analysis. . In: Romer Labs Guide to Mycotoxins, 2. 2000
4) T.B. Whitaker ABS, M.B. Doko, B.M. Maestroni, A. Cannavan: Sampling Procedures to Detect Mycotoxins in Agricultural Commodities: Springer; 2011.
5) T.B. Whitaker FED, W. M. Hagler, F. G. Giesbrecht, J. Wu: Variability Associated with Sampling, Sample Preparation, and Chemical Testing for Aflatoxin in Farmers' Stock Peanuts. Journal of AOAC International 1994, 77(1):107 - 116.
6) V. Brunkhorst, C. Maune, J. Brunkhorst, J. Bierbaum, R. Niemeijer: Effect of grind and extraction size on deoxynivalenol result variability, Trilogy Analytical Laboratory
7) V. Brunkhorst, C. Maune, J. Brunkhorst, J. Bierbaum, R. Niemeijer: Effect of grind and extraction size on zearalenone result variability, Trilogy Analytical Laboratory
8) MFood Standards Agency. Mycotoxin sampling guide, 2016.
9) Whitaker, T.B; Slate, A.B; and Johansson, A.S. Sampling feeds for mycotoxin analysis. In: The Mycotoxin Blue Book. D.Durat, ed. Nottingham University Press, Bath, England, 2005]
10) Whitaker T.B;, Sampling Foods for Mycotoxins, Food Additives & Contaminations, 2007.
11) United States Department of Agriculture. Mycotoxin Handbook, 2015
12) Carrie K. Maune, Thomas Maune, Jordan Bierbaum, Julie Brunkhorst, Ronald Niemeijer. The effect of grind and extraction size on Fuinsin Result Variablity. Washington, MO 63090
A Romer Labs ® Publication 15
As for sample size, 10 g has proven to be sufficient, while 25 g may provide even greater accuracy.