
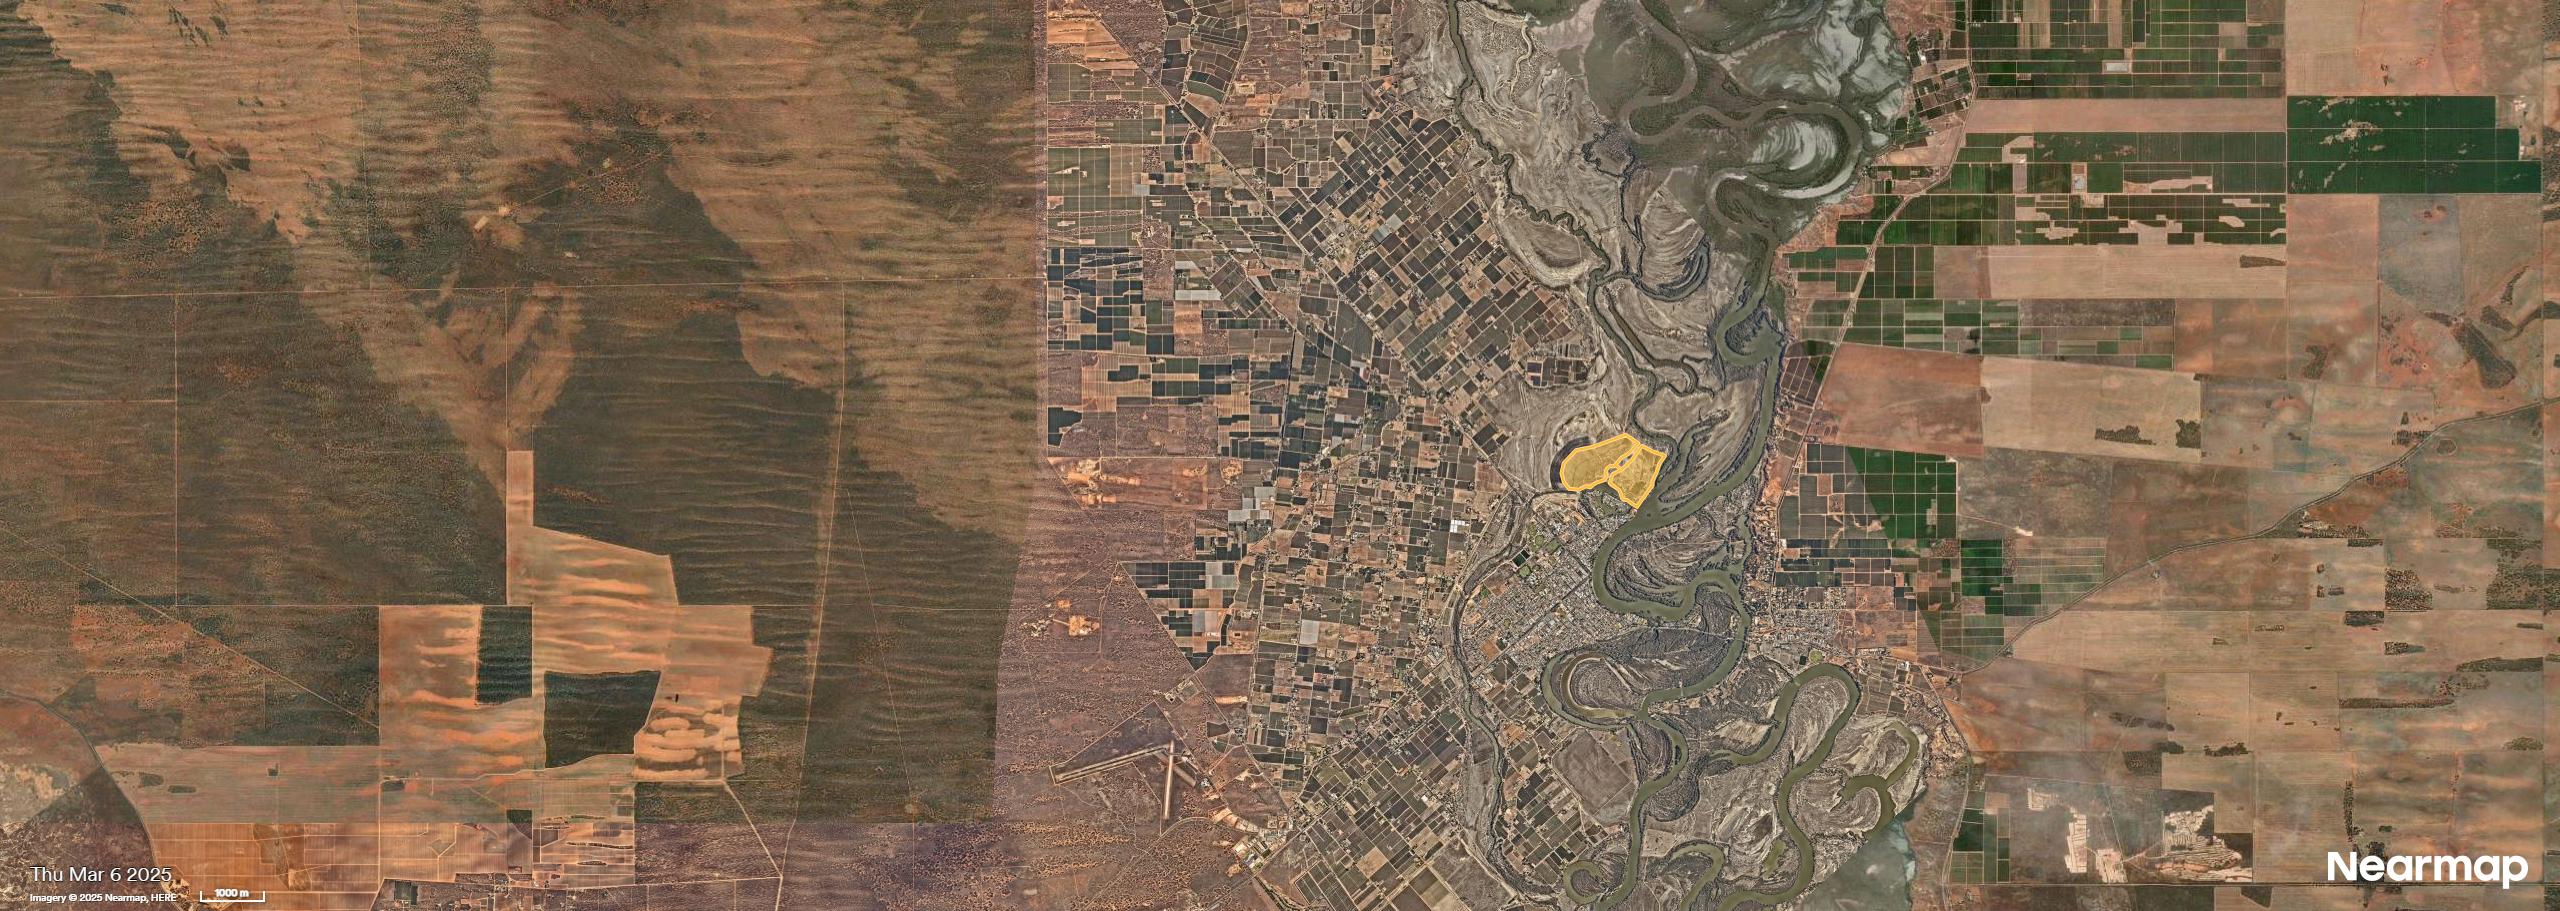
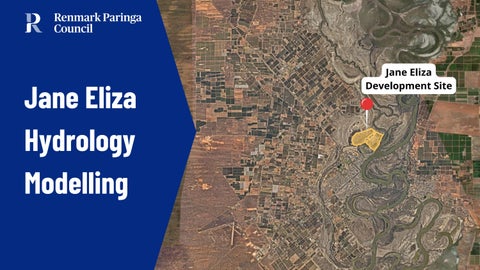
Renmark Paringa Council has commissioned engineering experts to undertake assessments to ensure the extension of the Jane Eliza development does not significantly alter flood risk to the existing township and surrounds. Through these assessments it has modelled scenarios of 186GL (2022 Flood), 250GL and 341GL (1956 Flood) events, with the levee network operating as intended. The modelling indicates that the Jane Eliza Development has very little impact on river heights.
“The volume of water displaced in the 341Gl a day event represents about 2.5 per cent of the total floodplain volume in the Renmark vicinity alone, without even considering the massive flood plains to the north and the south of the township. Even replicating the largest flood event on record the effects due to the development are predicted to be less than 5.8 centimetres.” - Neilly Group spokesperson
The following images outline the changes in water heights at different locations around the development site and wider township.

The below imagery depicts the changes in water heights in a similar event to the 2022 Flood with the Jane Eliza Development.
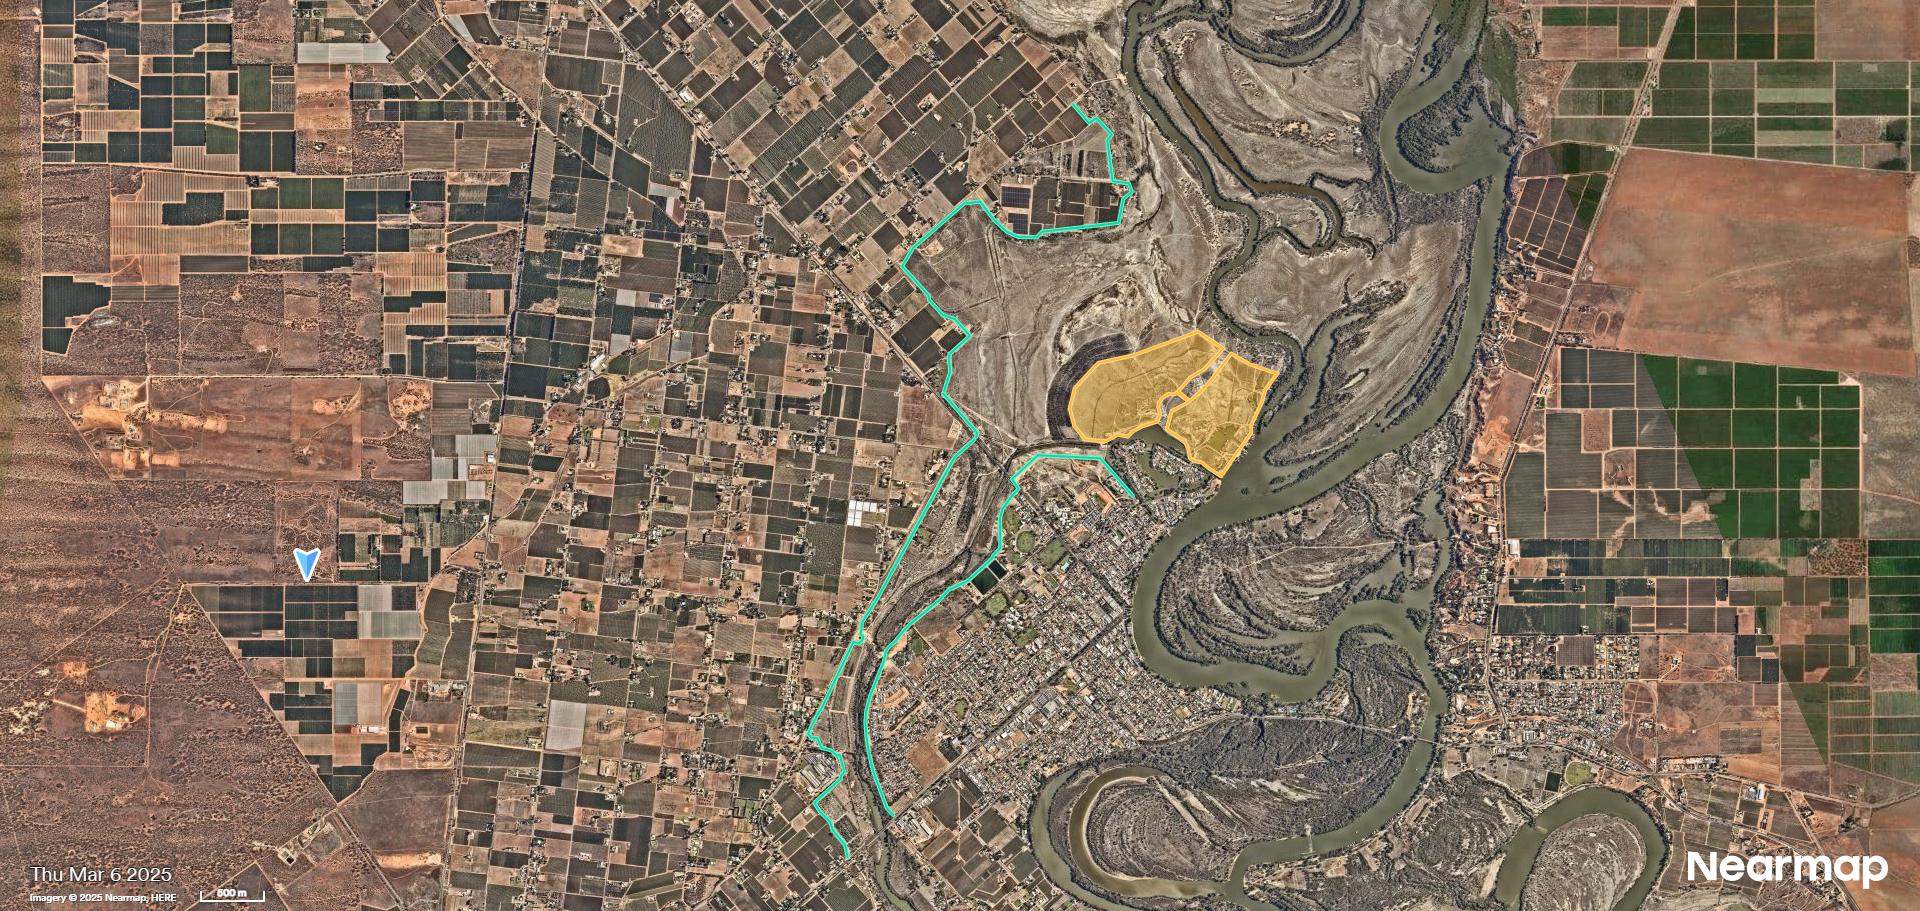
BlockDBank: +3.3cm
RalRalAvenueGunClub: +3.1cm
Goolwa Street: +2.1cm
DavidStreet:+2.6cm
BlockDBank:+3.3cm
DevelopmentSite: +4.6cm
RalRalAvenue/OntarioSt: +2.7cm
RalRalAveBridge: +2.4cm
MarraraStreet(WWTP): +2.3cm
RITPumpStation: -0.4cm
RenmarkVIC: -0.5cm
GL (2022 Flood)
The below imagery depicts the changes in water heights in a 250GL event with the Jane Eliza Development.
BlockDBank: +4.0cm
RalRalAvenueGunClub: +3.7cm
GoolwaStreet: +2.4cm
DavidStreet:+3.5cm
BlockDBank:+4.1cm
DevelopmentSite: +5.5cm
RalRalAvenue/OntarioSt: +3.4cm
RalRalAveBridge: +2.9cm
MarraraStreet(WWTP): +2.7cm
RITPumpStation: -0.6cm
RenmarkVIC: -0.6cm
The below imagery depicts the changes in water heights in a similar event to the 1956 Flood Event with the Jane Eliza Development.
BlockDBank: +4.4cm
RalRalAvenueGunClub: +3.9cm
GoolwaStreet: +2.7cm
DavidStreet:+3.8cm
BlockDBank:+4.4cm
DevelopmentSite: +5.8cm
RalRalAvenue/OntarioSt: +3.7cm
RalRalAveBridge: +3.0cm
MarraraStreet(WWTP): +2.9cm
RITPumpStation: -0.7cm
RenmarkVIC: -0.7cm
341GL (1956 Flood)

Post development
Flood Heights modelled
The hydrology modelling indicates the small increases in water heights across the levee network
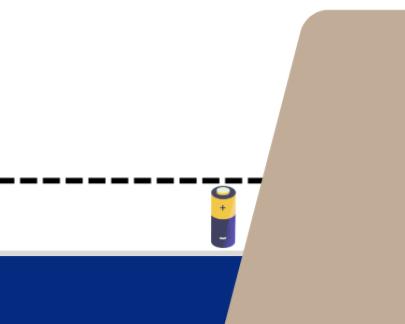
The maximum increase in these heights is the size of a AA battery!
Pre-development
Flood Heights modelled
The report says that “the impacts of the development for flows up to the 186 GL/day flow rate have little impact on properties. While larger events are contained within the Council maintained levees around town, the extents of flooding outside these areas show little change, with only minimal increases to flood extents upstream around Calperum station, and no observable differences downstream – including the areas to the south and southeast of Kulnine St”. The full report is available on Council’s website.