


Our responsibility Our business Corporate Governance Financial statements Appendix 1 Reitan Retail 2022 Annual and sustainability report
retail
Responsible
1. Our business


2 Content
2. Our responsibility
32 42 50 56 66 2.1 2.2 2.3 2.4 2.5 6 8 14 20 1.1 1.2 1.3 1.4 Our role and responsibility Environment Health People Value chain Reitan Retail at a glance Letter from the CEO Business overview Our business areas


Our responsibility Our business Corporate Governance Financial statements Appendix 3 5. Appendix 4. Financial statements 3. Corporate governance 188 204 208 210 224 5.1 5.2 5.3 5.4 5.5 84 104 168 182 4.1 4.2 4.3 4.4 76 77 80 81 3.1 3.2 3.3 3.4 Performance measures and definitions Transparency Act EU Taxonomy Carbon accounting GRI Board of Directors’ report Consolidated financial statements Parent company financial statements Auditor´s report Letter from the Chair Governing bodies Risks and risk management Governing documents

4
Our business
1.1 Reitan Retail at a glance
1.2 Letter from the CEO

1.3 Business overview
1.4 Our business areas
5 Our responsibility Our business Corporate Governance Financial statements Appendix
1.1 Reitan Retail at a glance
6
EQUITY IN % OF TOTAL ASSETS* NUMBER OF SALES OUTLETS EMPLOYEES PEOPLE1 THOUSAND tCO2e SCOPE 1, 2 AND 3 6,567 43,444 8,643 0 20000 40000 60000 80000 100000 2018 2019 2020 2021 2022 94,367 0 20000 40000 60000 80000 100000 120000 2018 2019 2020 2021 2022 115,767 0 1000 2000 3000 4000 5000 2018 2019 2020 2021 2022 3,597 0 5 10 15 20 25 2018 2019 2020 2021 2022 24.5% 0 500 1000 1500 2000 2500 3000 2018 2019 2020 2021 2022 1,845 0 500 1000 1500 2000 2500 3000 3500 4000 2018 2019 2020 2021 2022 3,801 REVENUE NOK in millions OPERATING PROFIT NOK in millions PROFIT FOR THE YEAR NOK in millions SYSTEMWIDE SALES* NOK in millions
SEGMENT CONTRIBUTION ON KEY FIGURES
REVENUE
SYSTEMWIDE SALES*
OPERATING PROFIT
94,367 NOK in millions
115,767 NOK in millions
3,597 NOK in millions
* Alternative performance measure. For more information see Performance measures and definitions
Systemwide sales’ represents sales in all sales outlets under concepts and banners controlled by the Group, whether operated by the franchisees, the Group, dealers or commission-based retailers. Sales from franchise operated sales outlets are not recorded as revenue by Reitan Retail and are not included in the Group’s consolidated financial statements.
1 People (systemwide employees), includes all employees of Reitan Retail AS and its subsidiaries, as well as all people being employed or self-employed in the stores operated by independent third parties (e.g. franchisees) under the Group’s concepts and brands (e..g pursuant to a franchise agreement).
7 Our responsibility Our business Corporate Governance Financial statements Appendix NOK in millions 2018 2019 2020 2021 2022 Result Revenue 68,601 71,651 79,157 81,502 94,367 EBITDA* 7,529 7,554 8,892 8,216 8,262 Operating profit 3,406 3,024 4,386 3,840 3,597 Profit before taxes 2,586 2,049 3,346 3,296 2,456 Profit for the year 2,012 1,635 2,634 2,645 1,845 Systemwide sales* and no. of sales outlets Systemwide sales* 92,574 95,740 104,159 104,406 115,767 Growth in systemwide sales* 5.4% 0.6% 8.6% -0.4% 5.2% Like-for-like growth in systemwide sales* 2.8% -0.5% 7.7% -1.2% 4.1% Number of sales outlets 3,909 3,907 3,847 3,843 3,801 Margins Operating profit as % of revenue* 5.0% 4.2% 5.5% 4.7% 3.8% Operating profit as % of systemwide sales* 3.7% 3.2% 4.2% 3.7% 3.1% Selected balance sheet items Total assets 45,914 48,414 51,619 52,785 57,529 Equity 9,799 9,932 10,906 12,190 14,096 Equity in percent of total assets* 21.3% 20.5% 21.1% 23.1% 24.5% Borrowings 4,595 5,093 4,505 3,984 5,141 Sum of borrowings and lease liabilities 19,484 20,549 22,605 22,547 23,865 Our people Number of employees 5,206 5,662 5,726 5,715 6,567 Number of people1 38,835 39,598 40,539 42,079 43,444 Climate (thousand tCO2e) CO2 Scope 1 and 2 - - 55 50 47 CO2 Scope 1, 2 and 3 - - - 8,764 8,643
REMA 1000 NO REMA 1000 DK Reitan Convenience Uno-X Mobility Real Estate Elim/other
1.2 Responsible retail
2022 marked another extraordinary year, as war in Europe shook the world, causing severe human suffering and a new era of social, political and economic uncertainty. As Covid-19 restrictions were gradually lifted and customers returned, a surge in global food and energy prices sparked new challenges and opportunities. As always, our response was rooted in our values and DNA – efficient and responsible operations, putting the customer first.
In our second year as one Reitan Retail with four strong business areas, we have further prepared the group to strengthen, renew and grow as a leading Nordic and Baltic retail flagship with exciting growth opportunities. Despite turbulent external conditions, we managed to balance short-term operational focus and growth investments. The definite highlight was the agreement to acquire German ALDI’s Danish grocery network, making REMA 1000 Denmark’s number-one discount banner. The deal, providing access to attractive locations and boosting market share in the Danish grocery market, illustrates the scalability and growth potential of our business model and the REMA 1000 concept.
With a network of 3,800 outlets across the Nordic and Baltic regions, supplying food and energy to two million people every day, we have a critical role to play. 2022 was an encouraging demonstration of our 43,500 positive and proactive people manoeuvring a highly competitive environment, showing impressive organisational resilience while making major strategic steps towards future growth.
Strategic steps in turbulent times
Our people quickly mobilised and adapted to the new situation that arose following Russia’s invasion of Ukraine on February 24. Franchisees and employees prepared to welcome and care for Ukrainian refugees, providing food, shelter, jobs and security. Stories of refugees finding purpose in a job at one of our sales
8 Reitan Retail Responsible retail 2022
With our large footprint and impact, we have both an opportunity and a responsibility to make a positive contribution
1.2 Letter from the CEO
outlets were a strong reminder of the importance of work, inclusion and belonging.
In our region, global inflation weighed on national economies, on businesses and on people’s private economies. For Reitan Retail, it underpinned the importance of our strategic foundation – close, simple and responsible. The customer is our ultimate boss, and we are close to local communities through empowered franchisees. We take pride in keeping it simple and efficient. That way, we deliver discount groceries, convenience and mobility solutions according to our promise. We do so in a responsible manner, striving for transparency and sustainability across the value chain.
2022 performance
All our business areas – REMA 1000 Norway, REMA 1000 Denmark, Reitan Convenience and Uno-X Mobility –have managed volatile market conditions throughout the year, to the best of the customer, our ultimate boss and main priority.
In the grocery market, broad-based inflation led to changing customer behaviour, both through a shift towards discount stores, including REMA 1000, and as more customers chose low-price or campaign products. As always, and particularly in this environment, we have done our utmost to deliver on our customer promise to offer the lowest prices on high-quality products produced and sold in a responsible way. It has been encouraging to see that customers have responded positively, leading to growth above the general grocery market both in Norway and in Denmark, thanks to our positive and proactive franchisees, committed to our business model and customer promise.
Systematic sustainability efforts in REMA 1000 Norway have been crowned with an A-rating from the Carbon Disclosure Projects (CDP) for the fifth year in a row,
2022 key accomplishments:
February
Kolly made its first delivery in the Norwegian HoReCa market
March
REMA 1000 ranked most sustainable brand in Denmark
April
Uno-X Mobility opened its first ultrafast EV charging location in Denmark
May
Innom launched as new city format, combining convenience and grocery
Rune Bjerke appointed new Chair of the Board of Directors
June
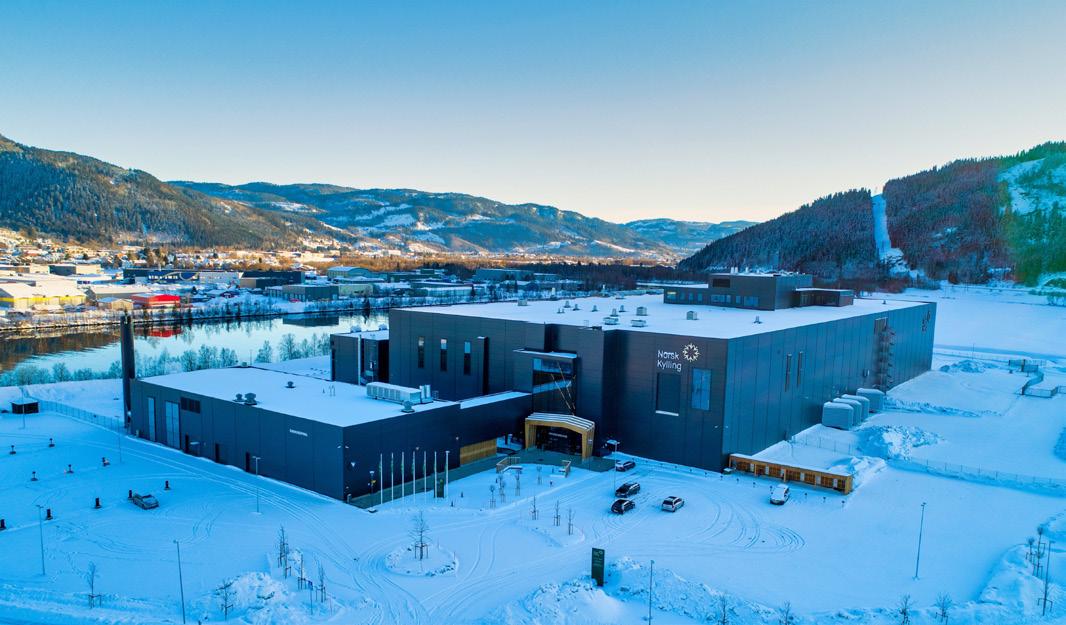
Norsk Kylling became world’s first largescale chicken producer with new animal welfare standard ECC
October
Reitan Convenience awarded Brand Leadership in Denmark and sustainability award in Sweden by 7-Eleven International
November
Uno-X Mobility opened its first ultrafast EV charging facility in Norway
The number of Caffeine coffee shops in the Baltics passed 100
December
REMA 1000 Norway awarded CDP A-rating for climate leadership
Uno-X Mobility opened Nordic Swan Ecolabelled car wash number 52
Historic ALDI agreement marked major step for REMA 1000 Denmark
9 Our responsibility Our business Corporate Governance Financial statements Appendix
recognising our ambitious climate work and leadership. In addition, our work for more sustainable food value chains reached a milestone as Norsk Kylling (Norwegian Chicken) became the first poultry producer in the world to deliver large-scale production in accordance with the animal welfare standard European Chicken Commitment (ECC). REMA 1000 was yet again ranked the most sustainable brand in Denmark by the Sustainable Brand Index and reinforced its solid position among customers with a top ranking for customer loyalty for the seventh year in a row by the Loyalty Group. Both recognitions exemplify the solid foundation for further growth in the attractive Danish grocery market.

The “Æ” loyalty app in REMA 1000 Norway continued to attract new users, with the number of users reaching more than two million in 2022, meaning more than one-third of the Norwegian population have downloaded the app. We are exploring ways to develop our digital customer tools to capitalise on the vast number of customer interfaces across our brands and businesses. In Denmark, the online solution Vigo continued to draw attention from REMA 1000 shoppers, enabling home delivery by one customer to another, saving time and energy. Via web or an app, a customer can place an order from home, which is picked up by another customer and delivered to the doorstep for a small fee.
In convenience, traffic and mobility among our customers in central locations resumed during 2022,
along with the gradual lifting of Covid-19 restrictions. In Denmark, 7-Eleven performed strongly, despite a sophisticated cyber-attack. Due to a solid response, putting the customer first, systems and sales recovered quickly. Learnings from the cyber-attack have been a valuable basis for further resilience efforts across Reitan Retail. Convenience also showed solid performance in Sweden, led by Pressbyrån and 7-Eleven. The PBX lab spearheaded innovation towards the ambition to make convenience sustainable and sustainability convenient. In the Baltics, our organic coffee brand Caffeine grew its position, while in Norway and Finland, our convenience business has embarked on an ambitious turn-around process. The aim is to lift profitability by closing or upgrading less attractive outlets while investing in convenient food and coffee on the go.
In Uno-X Mobility, we have strengthened our foothold within more sustainable mobility solutions, most importantly with the launch of ultrafast EV charging, which now operates alongside our strong-performing liquid fuel business. At the end of the year, we opened seven new EV stations, including two stations in Denmark and five in Norway. Making life easier for the customer, we were the first supplier to offer easy credit-card payments at all EV charging locations, and we were the first in Norway to flag the charging price on the pylon outside the charging location. We have also continued the roll-out of Nordic Swan Ecolabelled car wash in Norway and Denmark, with a
10
1.2 Letter from the CEO
total of 52 locations up and running at the end of the year. Supporting our efforts to promote sustainable mobility, our Uno-X Pro-Cycling Team has been invited to participate in the world’s biggest annual cycling event, Tour de France 2023, providing interesting opportunities for engagement and global visibility of the Uno-X brand.
Value-based value creation
We have always played a critical role in society, from the first Narvesen outlet opened in 1894, followed by Pressbyrån and R-kioski, all making life a little bit easier for people on the move and always promoting the free word, freedom of expression and freedom of speech. The value and importance of dialogue in business and society at large are also the basis for our long-term partnership with the Norwegian Nobel Peace Centre.
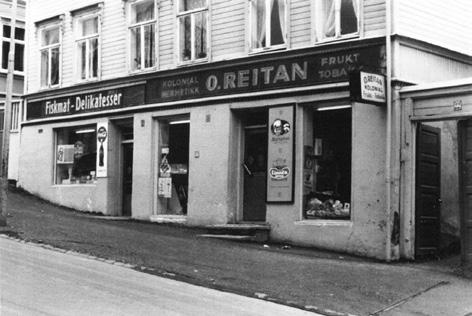
Freedom and dialogue are at the core of the Reitan philosophy, which has guided our operations since Ole and Margit Reitan opened their first store in Trondheim in 1948. Since then, our business has developed based on trust and an almost unlimited belief that competent individuals, given freedom and opportunity, have the potential to move mountains. That belief is still at the heart of our culture and philosophy, in which employees and franchisees are systematically trained to learn, live and breathe the Retain DNA.
The values are ingrained in all our decision-making and are also the basis for our sustainability strategy, which rests on four pillars: Climate, health, people and the value chain, tied together by a principle that sustainability and transparency need to be considered in a value-chain perspective.
Even if our history is long, 2022 was only our second year in operation as a Nordic and Baltic retail group operating under the Reitan Retail umbrella. In 2022, our focus has been to further integrate our sustainability
work into our business strategy, align the different parts of our business around common ambitions and ensure transparent and systematic documentation of our performance and progress in prioritised areas.
Framing our sustainability work, the UN Climate Goals and EU Green Deal set out clear targets for cutting greenhouse gas emissions in Europe by 55 percent by 2030 and further down to carbon neutrality in 2050. According to the EU’s Fit for 55 policy, Europe will phase out the use of fossil-fueled cars by 2035, meaning Europe will need massive e-mobility infrastructure development.
As a business involved in food chains and energy sales, we have both a responsibility and an opportunity to make a difference. We recognise that the food sector and road transport together account for close to 40 percent of global greenhouse gas emissions, according to Our World in Data. We also know that the choices we make in everyday life have a profound impact on our planet, and we know that businesses have a major role to play. Based on this acknowledgement, our ambition is to make a difference in people’s everyday lives.
30-40-50
We aim to strengthen the integration of sustainability in our business strategy when we develop a roadmap for the path to 2030, 40 and 50
11 Our responsibility Our business Corporate Governance Financial statements Appendix
Freedom and dialogue are at the core of the Reitan philosophy, which has guided our operations since Ole and Margit Reitan opened their first store in Trondheim in 1948
Sustainability across the value chain Climate: In 2022, we continued to work towards our zero-emission 2050 target, including all emissions across our value chain. As we know that 99.5 percent of our greenhouse gas emissions stem from suppliers and customers, our scope 3 emissions from all four business areas are at the core of our efforts. For the first time in 2022, we report on scope 3 emissions, which lay a foundation for systematic work going forward. We aim to strengthen the integration of sustainability in our business strategy when we develop a roadmap for the path to 2030, 40 and 50.
Health: To help our customers make healthier and more sustainable choices, we promote and increase the sale of healthier products. Last year, 29 percent of food
and drinks sales in our grocery outlets were healthier alternatives such as fruits, vegetables, wholegrain and keyhole-labelled products, fish and seafood. We run marketing campaigns with fruits and vegetables at exceptionally low prices, and we use apps providing easy and affordable recipes for healthy meals. Better-planned purchases help reduce food waste and replace red meat with plant-based options.
People: All business areas prioritise inclusion and diversity, including gender, age, background and competence. The threshold for entering the job market through our stores is low, also for those with a weaker starting point. Knowing the impact of exclusion from a meaningful job, our franchisees are committed to inclusion and work closely with public institutions to help
12
1.2 Letter from the CEO
onboard people to the professional world. That way, our 3,800 outlets can be integration facilitators and promote inclusion and diversity in society. Our efforts to increase gender diversity continues, with a focus on increasing the number of women franchisees through internal awareness programs, talent development and training. We have a gender-balanced workforce overall, with 51 percent women and 49 percent men. However, the share is less balanced among franchisees and managers. In 2022, we collected salary data indicating a pay gap between women and men, which provides a valuable basis for our efforts going forward, as we strive for equal pay and opportunities for all.
Value chain: Based on the principle that we are responsible for the impact of our entire value chain, transparency and human rights issues are tracked and handled according to the Norwegian Transparency Act (Åpenhetsloven), in line with the OECD framework. REMA 1000 Norway has implemented systematic management for data handling. We widen the use of value chain management systems across our organisation, also including own brands and private label. To deliver on our sustainability ambitions, we are aware that we need to work internally to create a common understanding and ownership of the challenges and openly discuss the dilemmas, so that we can drive our work forward together.
Improvement and growth on the agenda
Summing up 2022, we navigated a challenging and highly competitive environment while making concrete steps on our strategy, which will be the foundation for 2023. Our 2023 focus will be on improvement and growth, including:
• Efficiency and simplification
• Restructuring of convenience in Norway and Finland
• Conclude the ALDI acquisition and incorporate new stores into REMA 1000 Denmark
• Open and renew REMA 1000 stores in Norway
• Open new distribution centre in Horsens, Denmark
• Further develop ultrafast EV charging and Swan Ecolabelled car wash
• Innovate and invest in next-generation retail –“Retail 2050”
In 2022, our family grew to involve 43,500 people in seven countries, including direct employees, franchisees and their respective employees, serving 2 million customers daily, from the first cup of coffee
13 Our responsibility Our business Corporate Governance Financial statements Appendix
1.3 Business overview
Reitan Retail is a leading retail company in the Nordic and Baltic region with operations in discount grocery, convenience and mobility across seven countries. We are a family of 43,500 positive and proactive people and strong brands, including REMA 1000, Innom, 7-Eleven, Narvesen, R-kioski, Pressbyrån, Caffeine, Uno-X and YX. Based on strong values, efficient operations and local ownership, we share a common goal: to create the best customer experiences in people’s everyday lives and contribute to a more sustainable future. Our unique franchise model is at the heart of our business, and the customer is our boss. We are part of everyday life – at home, on the go and on the road. We are close, simple and responsible. At Reitan Retail, we are committed to responsible retail, and we share strong values and a common purpose: to make everyday life a little bit easier and the world a little bit better.
Reitan Retail consists of four retail segments, also referred to as business areas: REMA 1000 Norway, REMA 1000 Denmark, Reitan Convenience and Uno-X Mobility. In addition, Reitan Retail holds a portfolio of retail properties in Norway and Denmark presented as a separate segment, Real Estate. Reitan Retail is headquartered in Oslo, Norway. The business areas are operated from Oslo (Norway), Stockholm (Sweden), Copenhagen and Horsens (Denmark), Helsinki (Finland), Riga (Latvia), Tallinn (Estonia) and Vilnius (Lithuania).
REMA 1000 Norway is a Norwegian pioneer in franchise-based retailing. As the inventor of discount grocery in Norway, REMA 1000 was in, 2022, the country’s number one grocery banner in terms of market share.
Based on the same franchise model as REMA 1000 Norway, REMA 1000 Denmark is a fast-growing discount grocer, ranked among Denmark’s strongest and most sustainable brands.
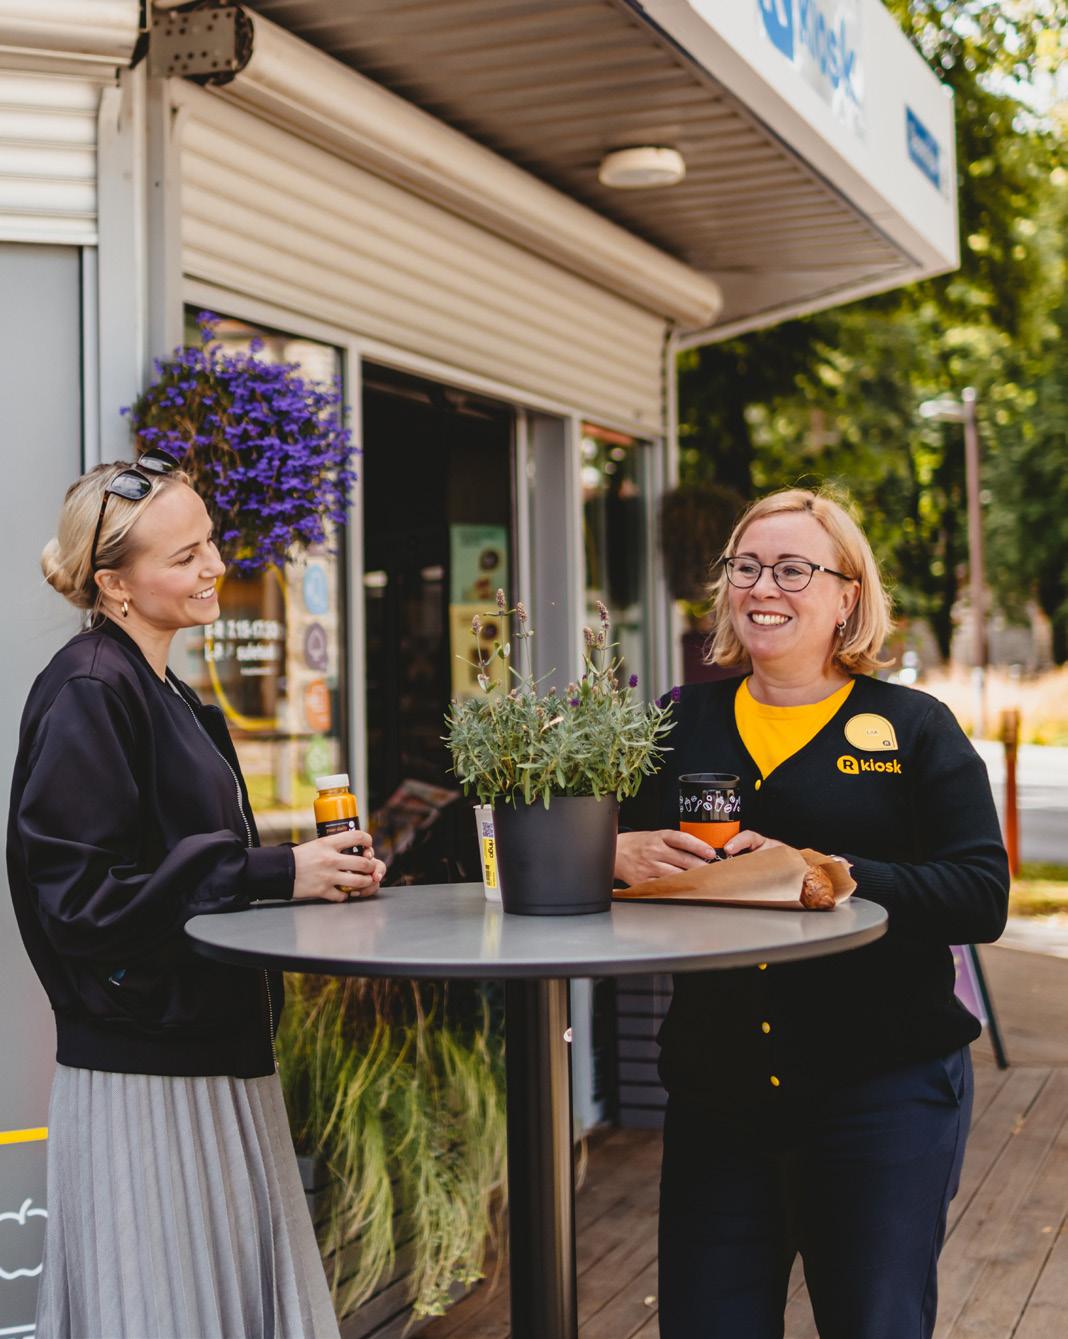
Reitan Convenience is a leader in operating franchisebased convenience and has number one positions in most markets in the Nordic and Baltics, operating a range of well-known kiosk and convenience brands.
Uno-X Mobility has a leading mobility platform in Norway and Denmark, with operations in liquid fuels, lubricants, Nordic Swan ecolabelled car wash and ultrafast EV charging.
Real Estate consists of an actively managed real estate portfolio within the retail segment in Norway and Denmark. Its overall mission is to secure access to strategically important locations, thus being an important enabler for the growth of Reitan Retail and its franchisees.
14
REMA 1000 REMA 1000 1.3 Business overview
Reitan Retail AS is a wholly owned subsidiary of REITAN AS.
OUR STRATEGY
Through our strategy, we aim to create sustainable and profitable growth based on three strategic pillars
Close - The customer is our boss, and we want to be relevant and present in the local community. Our franchisees know their customers’ preferences, and their outlets are welcoming hubs. It is local ownership. It is close.
Simple - We don’t create complicated solutions to impress others. We focus on the right things –and we keep it simple.
Responsible - We aim to contribute to good health, reduce climate emissions, foster diversity and equality, and ensure transparency across the value chain to secure human rights. We seek accountability in our operations and want to be held accountable for our actions. We are responsible.
OUR BUSINESS IDEA
15 Our responsibility Our business Corporate Governance Financial statements Appendix
OUR PURPOSE
Together, we make everyday life a little bit easier and the world a little bit better.
Through strong values, efficient operations and local ownership, we create the best customer experiences.
Our history
Building on years of proud retail history, Reitan Retail was established at the beginning of 2021 as a result of REITAN’s decision to organise all its retail operations as one business area. Since the opening of the first grocery store in Trondheim in 1948, the retail business has today grown into 3,800 sales outlets across seven countries. The strong growth has come through both organic expansion and selective mergers and acquisitions.
2008
Acquisition of Lidl’s store network in Norway
1948
Ole and Margit Reitan open the family’s first grocery store in Trondheim

2006
Acquisition of Hydro Texaco (Norway and Denmark)
1979
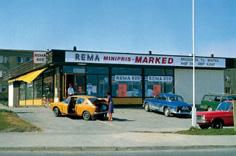
Opening of the first REMA store in Trondheim, Norway
2000
Reitan Narvesen created, adding Narvesen (Norway, established 1894), Pressbyrån (Sweden, established 1899) and 7-Eleven (licence in Norway, Sweden and Denmark, established 1927) to the Group
1990
REMA 1000 goes nationwide in Norway
1994
REMA 1000 established in Denmark
16
1.3 Business overview
2011
REMA 1000 Denmark reaches 200 stores
2012
Acquisition of R-Kioski, more than 1,000 outlets in Finland, Estonia and Lithuania


2014
REMA 1000 Norway commits ESG to its purpose
2016
Launch of digital journey through “Vigo” in REMA 1000 Denmark and “Æ” in REMA 1000 Norway
2022
REMA 1000 Denmark signs agreement with ALDI with the intention to acquire 114 of ALDI’s stores in Denmark

2022
REMA 1000 Denmark ranked by YouGov as the #1 sustainable brand in Denmark for the seventh consecutive year
2022
Uno-X Mobility opened its first ultrafast EV charging location
2022
Entering the HoReCa wholesale business in Norway through Kolly
2021
Uno-X Mobility launches the innovative Nordic Swan Ecolabelled car wash in Norway and Denmark


2021
Redefining sustainability for poultry production through opening of our new poultry factory at Orkanger (Norway)

2019
Opening of highly automated distribution center at Vinterbro (Norway)
2019
Acquisition of Caffeine (Baltics)
17 Our responsibility Our business Corporate Governance Financial statements Appendix
Our philosophy
We believe in enthusiastic and skilled individuals with the ability and commitment to getting things done. Reitan Retail follows REITAN´s philosophy, and we organise our activities in a way that makes the distance between accountability/authority and operational execution as short as possible. Building a logical structure and defining clear areas of responsibility ensures that we don’t create unnecessary work for each other.
At Reitan Retail, we treat employees, suppliers, partners and customers with respect. We like to keep it simple – and we want to be the very symbol of common sense, commerce, a down-to-earth mindset and skill. We encourage everyone to be proud of their own accomplishments while at the same time admiring others for their achievements and success.
Our philosophy brings us together, and our strong values define us and lead us forward. We know where we are going without forgetting where we came from.
Our values
We are a value-driven company. Our values are the foundation for making customers, employees and partners feel valuable, creating long-term financial value and conducting our activities with integrity.
We have eight values that define and guide us:
1. We stick to our business model
2. We keep high moral standards
3. We are committed to being debt-free
4. We encourage a winning culture
5. We are positive and proactive
6. We talk with each other, not about each other
7. The customer is our ultimate boss
8. We work for fun and profit
Our values describe what we believe is worth striving for. These values are our internal compass, guiding our mindset, emotions and decisions. Clearly defined values are the basis for a strong culture.
Reitan Retail is owned by REITAN AS. Our values have evolved through REITAN’s extensive history and are a natural part of Reitan Retail’s DNA. Our eight values are carved in rocks and obelisks placed at REITAN’s cultural and financial heart at Lade Gaard and several of our locations in the Nordics and the Baltics.
We use our philosophy, mindset and our values to build as many champions and jobs as possible, where people thrive and are engaged. Value-based leadership is part of our philosophy and involves building great people who create action through trust.
Conducting business in an ethical and transparent manner aligned with our values to inspire trust is essential for us. Being a value-driven company, we depend on trusting each other throughout our organisation, and we are dependent on trust from our customers, suppliers, partners, owners, authorities and from society at large.

18
1.3 Business overview
Our business model
Franchise – Our main competitive advantage
The Reitan Format Franchise model has been the heart and key driver of the Group’s successful development since the first REMA 1000 store opened in Norway in 1979. Reitan Retail was the first grocery company in Norway to implement franchising and streamlined this model of operation through the business area REMA 1000. REMA 1000 is the only purely franchise-based grocery player in the Nordics. Franchise is also the main operating model for Reitan Convenience.
At Reitan Retail, we have a strong belief in the individual’s desire to create. The franchise model is a win-win partnership, enabling us to benefit from largescale economies, but also from agility and small-scale economies due to a decentralised decision-making structure with aligned performance incentives for the franchisor and franchisees. The customer is our boss, and our goal is to create the best customer experiences in people’s everyday lives. We believe the franchise model is the winning recipe for achieving this.
Franchising represents a close collaboration between two independent parties, the franchisor and the franchisee. Franchising is about striking a balance between freedom and systems operations. The franchisee is self-employed but must comply with the concept and philosophy established by the franchisor. Done correctly, we believe there are no other systems that provide better returns on invested capital and risk.
Our strategic measures
The franchisor delivers a turnkey store concept to the franchisee, and consistency across various brands and outlets comes from The Reitan Format Franchise model. The franchisor holds the rental contract and facilitates investments in the sales outlet. The franchisor develops standards for the operation of businesses with certain goods and/or services under a common brand name. The turnkey model allows for recruitment based on skills and motivation rather than financial ability.
As a franchisee, you are a local entrepreneur. Together with your employees, you make a difference for your customers and your community. Being a franchisee requires a great sense of responsibility both for the franchisee and the franchisor. A franchisee who manages a brand also has a special responsibility towards the brand itself. At Reitan Retail, we have a high degree of internal recruitment and pride ourselves on building long relations with our franchisees.
The franchisor negotiates terms for and decides upon the distribution of goods and/or services to the franchisee. In principle, the work is divided between the parties so that the franchisor performs services in areas where it is more efficient to do it centrally, both with regard to time and cost, while the franchisee performs tasks in areas where it is more efficient to do it locally. The franchise system imposes great mutual demands on the parties, which results in a continuous development of skills in the organisation. Based on close collaboration, the franchisor has the ability and responsibility to coach the individual franchisee.
To create value in the years to come, we have defined six strategic measures:
Strengthen our culture and develop our franchise system
Strengthen competitiveness through lower costs and better terms
Establish new sales outlets and renew existing portfolio to boost average systemwide sales
Strengthen and renew formats to meet growing customer needs
Strengthen and renew the digital customer experience
Implement ambitious sustainability measures across the entire organisation
19 Our responsibility Our business Corporate Governance Financial statements Appendix
1.4 Our business areas
REMA 1000 Norway
Introduction
REMA 1000 Norway is the franchisor for REMA 1000 sales outlets run by franchisees. REMA 1000 Norway is the only retail operator in the Norwegian grocery market with franchise as the main operating model. The franchisor distributes and sells goods to the REMA 1000 sales outlets in Norway. The distribution activities also include external customers, which in 2022 has been expanded to include deliveries to the HoReCa market (hotels, restaurants and catering companies). In addition, the Group has ownership in selected companies producing a range of own private labels. REMA 1000 Norway is headquartered in Oslo, Norway.
REMA 1000 Norway’s business idea is that customers prefer us because we always offer the lowest prices on high-quality products – produced and sold in a responsible way. REMA 1000 Norway has a proud history as the pioneer of discount grocery offerings in Norway. Since the opening of the first REMA sales outlet in 1979, REMA 1000 has been a significant contributor to the maturity of the discount segment in Norway. Over the past 40 years, REMA 1000 Norway has seen steady growth in revenue, number of sales outlets and market share.
2022 results
REMA 1000 Norway’s systemwide sales* in 2022 was NOK 47,401 million (47,642), corresponding to a growth of -0.5 percent. Like-for-like growth in systemwide sales* was -1.7 percent. Revenue in 2022 was NOK 34,986 million (34,764), corresponding to a growth in revenue of 0.6 percent. Both revenues and systemwide sales were impacted by high levels of inflation as well as a normalisation following two years strongly impacted by pandemic-related restrictions, in addition to strong momentum for REMA 1000 Norway, gaining market share during the year (total traditional grocery market from Nielsen IQ, Dagligvarerapporten 2023, and internal data). The number of sales outlets at the end of 2022 was 668, up from 657 at the end of 2021.
REMA 1000 Norway has a proud history as the pioneer of discount grocery offerings in Norway
Operating profit was NOK 1,699 million (1,841) in 2022. The results in 2022 are somewhat below the previous year, mainly due covid effects tapering off negatively impacting systemwide sales growth*, strong competition in the Norwegian grocery market, and general cost inflation. Improved performance at Norsk Kylling (Norwegian Chicken) contributed positively to operating profit in 2022.
Outlook
REMA 1000 is the largest grocery banner in Norway. Continuous development of the REMA 1000 concept through assortment, digitalisation and simplification will contribute to an improved shopping experience for customers and increased efficiency throughout the entire value chain. Establishing new stores in attractive locations will also be a strategic priority.
2023 has started off with fierce price competition in the Norwegian grocery market, putting pressure on earnings and margins. REMA 1000 Norway always targets to deliver the lowest price to our customers and will do our utmost to deliver on this promise by ensuring we maintain our position as the leanest and most costefficient grocery player.
The close collaboration with fully and partially owned and exclusive suppliers will be further developed through REMA Industrier, and we expect further improved operations at Norsk Kylling (Norwegian Chicken) following the start-up of the plant in 2021, making sure we deliver high-quality and sustainable poultry at low prices to our customers.
20
1.4 Our business areas
* Alternative performance measure. For more information see Performance measures and definitions
Systemwide sales’ represents sales in all sales outlets under concepts and banners controlled by the Group, whether operated by the franchisees, the Group, dealers or commission-based retailers. Sales from franchise operated sales outlets are not recorded as revenue by Reitan Retail and are not included in the Group’s consolidated financial statements.
1 People (systemwide employees), includes all employees of Reitan Retail AS and its subsidiaries, as well as all people being employed or self-employed in the stores operated by independent third parties (e.g. franchisees) under the Group’s concepts and brands (e..g pursuant to a franchise agreement).
Our responsibility Our business Corporate Governance Financial statements Appendix 2,272 15,308 1,9 mill. tCO2e SYSTEMWIDE SALES* NOK in millions EMPLOYEES PEOPLE1 CO2 SCOPE 1, 2 AND 3 NOK in millions 2018 2019 2020 2021 2022 Result Revenue 28,885 28,876 34,421 34,764 34,986 EBITDA* 3,449 3,348 4,248 3,896 3,840 Operating profit 1,663 1,146 2,201 1,841 1,699 Systemwide sales* and no. of sales outlets Systemwide sales* 41,861 41,457 48,411 47,642 47,401 Growth in systemwide sales* 4.4% -1.0% 16.8% -1.6% -0.5% Like-for-like growth in systemwide sales* 1.9% -2.6% 16.1% -2.4% -1.7% Number of sales outlets 633 644 648 657 668 Margins Operating profit as % of revenue* 5.8% 4.0% 6.4% 5.3% 4.9% Operating profit as % of systemwide sales* 4.0% 2.8% 4.5% 3.9% 3.6% 0 10000 20000 30000 40000 50000 2018 2019 2020 2021 2022 47,401 0 5000 10000 15000 20000 25000 30000 35000 2018 2019 2020 2021 2022 34,986 0 500 1000 1500 2000 2500 2018 2019 2020 2021 2022 1,699
NOK in millions
NOK in millions 21
REVENUE
OPERATING PROFIT
REMA 1000 Denmark
Introduction
REMA 1000 Denmark is the franchisor for REMA 1000 sales outlets run by franchisees. REMA 1000 Denmark is the only retail operator in the Danish grocery market with franchise as the main operating model. In addition, REMA 1000 Denmark also sells and distributes goods to the REMA 1000 sales outlets in Denmark and to several convenience stores, including the 7-Eleven stores in Denmark. REMA 1000 Denmark is headquartered in Horsens, Denmark
REMA 1000 Denmark’s business model is based on high sales productivity and low costs. REMA 1000 Denmark has had a presence in the Danish grocery store market since 1994, when the first two sales outlets were opened. REMA 1000 Denmark’s profile and customer-centric mindset is inherited from REMA 1000 Norway, and the two share the same ambition of offering quality products while selling them at a low price, in Denmark branded as “Much more discount” and “Discount with value”.
2022 results
Systemwide sales*´´ in 2022 was NOK 28,301 million (25,752), corresponding to a growth of 10.4 percent. Like-for-like growth in systemwide sales* was 9.5 percent. REMA 1000 Denmark’s revenue in 2022 was NOK 32,799 million (29,541), corresponding to a growth in revenue of 11.6 percent. Both systemwide sales and revenues were impacted by a strong momentum for REMA 1000 Denmark, in addition to high levels of food price inflation. In 2022, REMA 1000 Denmark had an estimated market share of around 17 percent of the traditional Danish grocery market, well above the estimated around 16 percent in 2021. The number of sales outlets at the end of 2022 was 363, up from 360 at the end of 2021.
Operating profit was NOK 1,248 million (1,059) in 2022. The increased result in 2022 is mainly explained by higher revenue, partially offset by general inflationary pressure.
REMA 1000 Denmark’s business model is based on high sales productivity and low costs
Outlook
REMA 1000 Denmark will continue to focus on and strengthen the business idea “Discount med holdning” (“Discount with value”) and “Meget mere discount” (“Much more discount”), which means that goods are sold at a low price and with clear requirements towards the goods’ quality and impact on people and the environment. This includes a continued focus on organic and sustainable groceries and reduced food waste.
In December 2022, an agreement was signed with German discount grocer ALDI to acquire the majority of ALDI’s grocery store network in Denmark. The agreement, dependent on regulatory approval, gives access to attractive locations and will further accelerate growth and boost market share in the Danish grocery market. Successful integration and opening of new stores is a key focus area for 2023.
In addition we will, in 2023, open our new highly automated dry goods distribution centre in Horsens, Denmark, targeting increased efficiency and capacity to handle additional growth.
22
1.4 Our business areas
* Alternative performance measure. For more information see Performance measures and definitions
Systemwide sales’ represents sales in all sales outlets under concepts and banners controlled by the Group, whether operated by the franchisees, the Group, dealers or commission-based retailers. Sales from franchise operated sales outlets are not recorded as revenue by Reitan Retail and are not included in the Group’s consolidated financial statements.
1 People (systemwide employees), includes all employees of Reitan Retail AS and its subsidiaries, as well as all people being employed or self-employed in the stores operated by independent third parties (e.g. franchisees) under the Group’s concepts and brands (e..g pursuant to a franchise agreement).
Our responsibility Our business Corporate Governance Financial statements Appendix 1,388 15,161 EMPLOYEES PEOPLE1 NOK in millions 2018 2019 2020 2021 2022 Result Revenue 23,208 25,584 30,510 29,541 32,799 EBITDA* 1,472 1,656 2,126 1,971 2,185 Operating profit 783 865 1,207 1,059 1,248 Systemwide sales* and no. of sales outlets Systemwide sales* 19,846 22,128 26,931 25,752 28,301 Growth in systemwide sales* 11.2% 8.8% 11.5% 0.8% 10.4% Like-for-like growth in systemwide sales* 5.0% 2.8% 6.6% -1.2% 9.5% Number of sales outlets 326 343 357 360 363 Margins Operating profit as % of revenue* 3.4% 3.4% 4.0% 3.6% 3.8% Operating profit as % of systemwide sales* 3.9% 3.9% 4.5% 4.1% 4.4% 0 5000 10000 15000 20000 25000 30000 2018 2019 2020 2021 2022 28,301 0 5000 10000 15000 20000 25000 30000 35000 2018 2019 2020 2021 2022 32,799 0 300 600 900 1200 1500 2018 2019 2020 2021 2022 1,248 1,4 mill. tCO2e SYSTEMWIDE SALES* NOK in millions REVENUE NOK in millions OPERATING PROFIT NOK in millions CO2 SCOPE 1, 2 AND 3
23
Reitan Convenience
Introduction
Reitan Convenience is a leader in the convenience market in Norway, Sweden, Denmark, Finland and the Baltics. With limited exceptions, the portfolio is based on franchising. Reitan Convenience consists of leading international brands and national inheritance brands in local markets, including Narvesen in Norway, Latvia and Lithuania, Pressbyrån in Sweden, 7-Eleven in Norway, Sweden and Denmark, R-kioski in Finland, R-kiosk in Estonia, Lietuvos Spauda in Lithuania, Northland in Norway and Caffeine in Lithuania, Latvia and Estonia.
Reitan Convenience holds a proud more than 100-year-long history in convenience retailing. The convenience retail operations aim to meet consumer demand for convenient solutions “on the go”. Reitan Convenience aims to make convenience sustainable and sustainability convenient.
2022 results
Systemwide sales* in 2022 was NOK 14,688 million (12,853), corresponding to a growth of 16.1 percent. Like-for-like growth in systemwide sales* was 15.0 percent. Reitan Convenience’s revenue in 2022 was NOK 4,829 million (3,987), corresponding to a growth in revenue of 22.5 percent. Both systemwide sales and revenues were impacted by high levels of inflation as well as normalisation following Covid-19 with increased mobility and traffic in stores, although with mobility restrictions and lockdown measures in January and February of 2022. With a large number of outlets in high-traffic areas where people normally travel and gather, such as airports, railway stations and metros, the customer base has gradually returned to our convenience stores, although not fully back to the levels seen prior to the Covid-19 outbreak. The number of sales outlets at the end of 2022 was 1,953, down from 2,002 at the end of 2021.
Reitan
Operating profit was NOK -1 million (-89) in 2022. The improved result in 2022 is mainly explained by increased revenues from franchise services and a solid development in Denmark and Sweden. This was partly offset by more challenging markets in Norway and Finland, as well as general inflationary pressure.
Outlook
Reitan Convenience is a specialist in developing and operating franchise-based convenience concepts. Organic growth in existing stores and new store openings are a core part of Reitan Convenience’s business. Reitan Convenience will continue its focus on food to go, hot and cold beverages, and bakery through continued innovation and digital solutions to improve the customer offering and attract existing and new customers.
On the back of changing regulations and changes in customer patterns, strengthened by Covid-19, we see the need for a more forward-leaning approach in Finland and Norway through active portfolio management and improved customer offering, targeting improved performance and increased customer traffic and satisfaction.
24
1.4 Our business areas
Convenience is a specialist in developing and operating franchise-based convenience concepts
* Alternative performance measure. For more information see Performance measures and definitions
Systemwide sales’ represents sales in all sales outlets under concepts and banners controlled by the Group, whether operated by the franchisees, the Group, dealers or commission-based retailers. Sales from franchise operated sales outlets are not recorded as revenue by Reitan Retail and are not included in the Group’s consolidated financial statements.
1 People (systemwide employees), includes all employees of Reitan Retail AS and its subsidiaries, as well as all people being employed or self-employed in the stores operated by independent third parties (e.g. franchisees) under the Group’s concepts and brands (e..g pursuant to a franchise agreement).
Our responsibility Our business Corporate Governance Financial statements Appendix 2,517 12,585 EMPLOYEES PEOPLE1 NOK in millions 2018 2019 2020 2021 2022 Result Revenue 4,776 4,908 4,142 3,987 4,829 EBITDA* 1,881 1,655 1,182 1,006 1,110 Operating profit 512 421 -51 -89 -1 Systemwide sales* and no. of sales outlets Systemwide sales* 15,748 15,008 13,124 12,853 14,688 Growth in systemwide sales* 1.4% -5.8% -18.1% 1.2% 16.1% Like-for-like growth in systemwide sales* 2.6% 1.1% -13.7% 3.2% 15.0% Number of sales outlets 2,173 2,098 2,017 2,002 1,953 Margins Operating profit as % of revenue* 10.7% 8.6% -1.2% -2.2% 0.0% Operating profit as % of systemwide sales* 3.2% 2.8% -0.4% -0.7% 0.0% 0 5000 10000 15000 20000 2018 2019 2020 2021 2022 14,688 0 1000 2000 3000 4000 5000 2018 2019 2020 2021 2022 4,829 -100 0 100 200 300 400 500 600 2018 2019 2020 2021 2022 -1 0.2 mill. tCO2e SYSTEMWIDE SALES* NOK in millions REVENUE NOK in millions OPERATING PROFIT NOK in millions CO2 SCOPE 1, 2 AND 3
25
Uno-X Mobility
Introduction
Uno-X Mobility has operations in liquid fuels, lubricants, Nordic Swan ecolabelled car wash and ultrafast EV charging, with the mission to develop and promote solutions for sustainable mobility. Uno-X Mobility has operations in Norway and Denmark under the Uno-X and YX brands. Uno-X in Norway and Uno-X in Denmark offer liquid fuels from nationwide networks of self-service stations and launched the roll-out of Nordic Swan ecolabelled car wash in 2021. In 2022 Uno-X Mobility launched Ultrafast EV charging, placed at locations operated by Reitan Retail in Norway and Denmark. Uno-X Mobility also owns and operates Uno-X Pro Cycling Team to promote more everyday cycling as an important measure for sustainable mobility.
YX in Norway is a fuel supplier to dealer-owned and dealer-operated YX service stations and a supplier and forecourt partner to YX 7-Eleven locations. Self-service YX Truck locations complement the network in the truck market. YX in Denmark operates a nationwide network of YX Truck stations like YX in Norway and operates the sales divisions YX Landbrug (agriculture) and YX Fyringsolie (heating oil). High-quality Texaco, Anderol and Panolin lubricants are offered to the business market by YX Smøreolje in Norway and Denmark.
2022 results
Uno-X Mobility’s systemwide sales* in 2022 was NOK 25,340 million (18 169), while revenue in 2022 was NOK 21,756 million (13,251). Total volume sold (measured in 1,000 m³) was 1,785 (1,785). Both revenues and systemwide sales increased in 2022 compared to 2021, primarily related to prices for oil products being higher in 2022 than in 2021. The number of mobility locations at the end of 2022 was 816, compared to 824 at the end of 2021.
Operating profit was NOK 723 million (972) in 2022. The results in 2022 are at a high level historically, impacted by strong performance and positive inventory effects from increasing oil prices, but somewhat below 2021, which was even more positively impacted by positive inventory effects.
Outlook
Uno-X Mobility will continue to develop and promote solutions for sustainable mobility. While adapting to changes in demand from customers, Uno-X Mobility will work towards reducing dependence on fossil fuels, acknowledging all solutions contributing to reducing emissions as well as technologies that help to conserve and protect the environment. Uno-X Mobility will focus on maintaining an efficient and profitable fuels network while launching and rolling out both Nordic Swan ecolabelled car wash and ultrafast EV charging.
26
1.4 Our business areas
Uno-X Mobility will continue to develop and promote solutions for sustainable mobility
PEOPLE1
* Alternative performance measure. For more information see Performance measures and definitions
Systemwide sales’ represents sales in all sales outlets under concepts and banners controlled by the Group, whether operated by the franchisees, the Group, dealers or commission-based retailers. Sales from franchise operated sales outlets are not recorded as revenue by Reitan Retail and are not included in the Group’s consolidated financial statements.
1 People (systemwide employees), includes all employees of Reitan Retail AS and its subsidiaries, as well as all people being employed or self-employed in the stores operated by independent third parties (e.g. franchisees) under the Group’s concepts and brands (e..g pursuant to a franchise agreement).
2 Volume is defined as liquid fuel volumes sold from all mobility locations, in addition to certain volumes from sale of heating oil, lubricants and liquid fuels for agriculture and commercial use.
Our responsibility Our business Corporate Governance Financial statements Appendix 299 299 EMPLOYEES
NOK in millions 2018 2019 2020 2021 2022 Result Revenue 11,789 12,326 10,134 13,251 21,756 EBITDA* 746 832 1,156 1,336 1,191 Operating profit 449 512 803 972 723 Systemwide sales* and no. of mobility locations Systemwide sales* 15,142 17,164 15,708 18,169 25,340 Volume sold 1,708 1,816 1,768 1,785 1,785 Growth in volume sold (1,000 m3)2 1.7% 6.3% -2.6% 1.0% 0.0% Number of mobility locations 777 822 825 824 816 Margins Operating profit as % of revenue* 3.8% 4.2% 7.9% 7.3% 3.3% Operating profit as % of systemwide sales* 3.0% 3.0% 5.1% 5.4% 2.9% 0 5000 10000 15000 20000 25000 30000 2018 2019 2020 2021 2022 25,340 0 5000 10000 15000 20000 25000 2018 2019 2020 2021 2022 21,756 0 200 400 600 800 1000 2018 2019 2020 2021 2022 723 5.2 mill. tCO2e SYSTEMWIDE SALES* NOK in millions REVENUE NOK in millions OPERATING PROFIT NOK in millions CO2 SCOPE 1, 2 AND 3
27
Real Estate
Introduction
Real Estate consists of an actively managed real estate portfolio with the aim to meet Reitan Retail’s long-term need for properties in the right locations and cater for further growth. Its overall mission is to secure access to strategically important locations, thus being an important enabler for the growth of Reitan Retail and its franchisees.
2022 results
Operating profit in the Real Estate segment in 2022 was NOK 141 million (479). Included in the segment’s operating profit was the revaluation of investment properties of NOK -24 million (258) and the share of profit from associates of NOK 43 million (125). The carrying amount of the real estate portfolio at fair value at the end of 2022 was NOK 4,573 million (4,288).
Outlook
The Real Estate segment will continue to secure access to strategically important locations, being an important enabler for the growth of Reitan Retail and its franchisees.
28
The Real Estate segment will continue to secure access to strategic important locations, being an important enabler for the growth of Reitan Retail and its franchisees
1.4 Our business areas
Our responsibility Our business Corporate Governance Financial statements Appendix FAIR VALUE OF PORTFOLIO NOK in millions NOK in millions 2018 2019 2020 2021 2022 Result Operating profit 100 171 342 479 141 Rental income 156 184 232 164 202 Revaluation of investment property -3 -21 117 258 -24 Share of profit of associates 39 89 45 125 43 Selected balance sheet items Total assets 4,971 5,962 7,681 5,045 5,272 Investment property 3,555 4,186 3,525 3,843 4,054 Associates 240 234 200 154 212 Financial investments 0 82 280 291 307 Fair value of Real Estate portfolio 3,795 4,502 4,005 4,288 4,573 Square meters, engaged in 176,900 174,500 150,800 110,300 116,600 Square meters, ownership adj. 153,700 165,500 143,400 101,300 96,500 0 1000 2000 3000 4000 5000 2018 2019 2020 2021 2022 4,573 EMPLOYEES SQUARE METERS, ENGAGED IN 27 116,600 29

30
Our responsibility
2.1 Our role and responsibility
2.2 Environment
2.3 Health
2.4 People
2.5 Value chain

31 Our responsibility Our business Corporate Governance Financial statements Appendix
2.1 Our role and responsibility
As a family-owned company with a long history, our perspective is longterm. We seek to meet the needs of the current generation without reducing the opportunities for future generations.
Ever since 1948, when the Reitan family opened their first grocery store in Trondheim, our values have made us conduct business responsibly and with integrity. Our approach to responsibility has always been local, caring for our customers, suppliers and the local community.
Now, three generations later, we are still genuinely concerned with sustainability and clearly aware of our responsibility. Over time, as the world has gone through drastic changes, we have changed with it. With 3,800 sales outlets in seven countries, we are present in thousands of local communities through our franchisees and even more through our suppliers. We have grown into a major player in society. Hence, we are able to make a difference, and we have the responsibility to care for the future of our people and the planet.
3,800 sales outlets in seven countries
As a part of the food and fuel sectors – combined accounting for almost 40 percent of global carbon dioxide emissions and with extensive impact on nature and public health1 – we have a great responsibility to minimise our footprint and maximise the value we add to people and the planet. We consider it our responsibility to address, act and report our progress as we strive to operate sustainably. We are driven by our values and responsibility as we work throughout our value chains to highlight the importance of good health, human relations and decent working conditions, as well as operating with less environmental impact.
For Retain Retail, this requires continued focus on innovation and making it easier for our customers to make healthier and more sustainable choices. Our goal is to create the best customer experiences in people’s everyday lives and contribute positively to a sustainable society, now and for generations to come.

32
1 The World Bank, Our World in Data
2.1 Our role and responsibility
~ 40% of global carbon dioxide emissions come from food and fuel
33 Our responsibility Our business Corporate Governance Financial statements Appendix
Value and impact along our value chain
Reitan Retail creates value for customers and different stakeholders in our operations. As a leading retail company in the Nordic and Baltic regions with operations in discount grocery, convenience and mobility across seven countries, we acknowledge our impact throughout the value chain, both positive and negative.
Suppliers
1
Suppliers Customers
Our production sites
3
3,800 sales outlets
Customers
Transportation and distribution
2
8 industry companies
2
43,500 people
~ 710 mill. customers
14 distribution centers Food Fuel
34
5
Reitan Retail
SUPPLY CHAIN
Impact: Our supply chain is complex and global. Negative environmental impacts and unjust effects on people occur, for example, through deforestation and human rights violations.
Value creation: By implementing our code of conduct and due diligence processes, we can be an active partner to our suppliers, find long-term solutions and source in a more sustainable way. We create job opportunities in local communities throughout our supply chain.
TRANSPORTATION AND DISTRIBUTION
Impact: Transportation is a great source of emissions in our market, and our distribution requires energy. Our sales outlets rely on the supply of goods ranging from food and fuel. We must have control over the footprint of our transport, distribution and logistics.
Value creation: Our distribution and transports keep goods safe and ensure quality. Through investment in EVC, electrical and bio transportation and renewable energy sources we lessen emissions. With data and technology, we can plan our distributions and transports more efficiently.
OUR PRODUCTION SITES
Impact: Our production sites rely on energy, water supply and raw materials and emits CO2
Value creation: We reduce our energy consumption systematically, investing in new technology and moving to a more renewable energy mix. We find solutions to prevent waste in our own operations and use sustainable and ethical methods when producing food and fuel.
SALES OUTLETS, OFFICES AND EMPLOYEES
Impact: Our sales outlets and offices rely on energy supply, and they generate waste from packaging and food. Our business travels contribute to increased CO2 emissions.
Value creation: Being a responsible employer and creating job opportunities contributes to local welfare and integration. Conducting a critical societal service by bringing food and fuel to the communities. Managing waste and increasing the efficiency of energy and transportation at the sales outlets.
CUSTOMERS
Impact: Unsustainable consumption patterns impacts the planet’s resources and peoples’ health, which comes at a great societal cost.
Value creation: We want to help customers to make informed and sustainable consumption choices. We contribute to healthy habits with as little impact on the environment as possible. We also strive to be local heroes that contribute to making the local communities vibrant.
WASTE
Impact: Throughout our value chain, waste from packaging is generated, which adds to the total supply of CO2 emissions even though it is a very limited impact in total. The local situations and preconditions to manage sorting and recycling differ a lot between markets and regions. In many cases, waste cannot be avoided due to a lack of recycling infrastructure or non-existing availability for sorting.
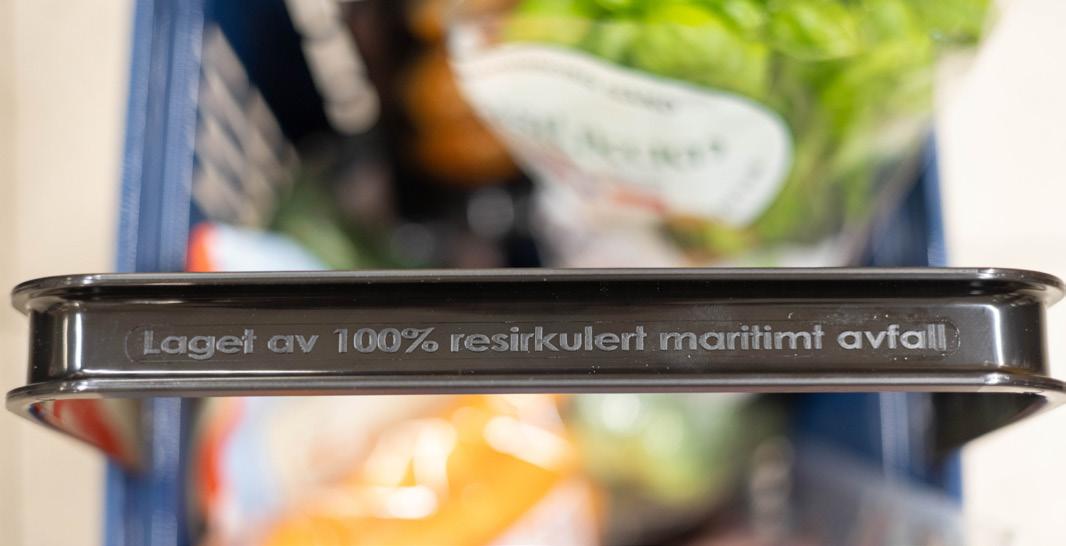
Value creation: Reitan Retail is reducing waste and emissions from our product portfolio by awareness building, communication, product offerings, sourcing practices and applying circular models. With a better understanding and mapping of where waste is produced in our value chain, we can tackle this challenge. Information to customers about recycling is key to preventing waste. Just as important is collaborating with producers and suppliers to develop packaging solutions and labelling that provide a higher rate of sorting and recycling. Also, legislation has an important role to play when it comes to pushing innovation to find broader solutions and shifts in markets.
35 Our responsibility Our business Corporate Governance Financial statements Appendix Sales outlets, offices and employees Waste Fuel Convenience 4 6
49.6% of our total emissions 0.1% of our total emissions 1.8% of our total emissions 47.1% of our total emissions 0.3% of our total emissions 0.2% of our total emissions 1 4 2 5 3 6
Materiality analysis
To guide sustainability efforts at Reitan Retail, our materiality assessment process has defined the most material topics for us and our stakeholders. The first and most recent materiality analysis for Reitan Retail was conducted in 2020. The process started by identifying the positive and negative impacts that our business and operations have on the economy, environment and people, including our impacts on human rights. The Global Reporting Initiative (GRI) has guided our work in this process and in our stakeholder engagement. In 2022 we verified our materiality assessment, including the material topics for our long-term value creation.
The process involved four steps taken to identify that our material topics are in line with GRI recommendations:
1. Understanding Reitan Retail’s sustainability context
2. Identify actual and potential impacts
3. Assess the significance of the impacts
4. Prioritise the most significant impacts
Material topics in Reitan Retail
The materiality analysis is constantly reviewed as we want our impact, both positive and negative, to be aligned with our risk management. We monitor and assess our impact on an ongoing basis, and the material topics are reviewed at least annually in workshops with stakeholders. Reitan Retail Executive Management Team has an ongoing dialogue on the material topics, assuring that we are up to date on new regulations and stakeholder expectations.
Continuously updated understanding of the risks and opportunities associated with sustainability in general and climate change in particular is important when validating the materiality of our strategy, acting responsive towards stakeholders and executing our strategy. Assessing and acting on sustainability risks are an integrated part of our risk management process (read more on page 80). Strategic and operational risks, financial risks and sustainability risks are often merely different perspectives of the same risk.
36 Strategic focus areas Economy Environment Social Human rights Material topics Most significant impacts ENVIRONMENT X X X Climate emissions X X X Food waste X X Circularity and waste management HEALTH X Healthier products PEOPLE X X Safe employer X X Equality, diversity and inclusion VALUE CHAIN X X X X Responsible business X X X Sustainable food production X X X X Traceability and transparency
2.1 Our role and responsibility
Top three sustainability risks
Sustainability risk
Energy, climate and geopolitical impact on supply security: Increasing levels of electrification in society, combined with continued interruptions in supply chains (mainly due to geopolitics and climate changes), will cause a major impact on the supply security of materials, energy and products. This, in turn, will cause prices to become more volatile and may create challenges for the distribution, transportation and logistics of goods. The risk of being “last-in-line” and of ending up with stranded energy assets increases. Already today, we use existing infrastructure to supply renewable energy, such as EVC, which we have the ambition to expand further.
Regulations that hinder progress on environmental, climate and health targets and consumer trust: A successful regulation to ban single-use packaging and plastics will push the circularity transformation of society. Retailers, producers and the packaging industry needs to work together with regulators to find solutions that, in the end, gain people’s trust in order to change today’s consumption behaviour. A nonbalanced regulation could be cost-intensive to customers and market actors, with low or no environmental benefit that, therefore, might be ignored by consumers. There’s a risk of increased lack of food security and increased food waste due to shorter shelf life of products in lower quality packaging solutions.
Harmful developments in the value chain by exploiting and misusing nature: Stressed supply chains may cause further exploitation of natural resources such as land, forests, water, biodiversity and renewable energy. Displacement effects caused by harmful usage of natural resources may threaten societal stabilisation by causing starvation, scarcity of water, decreased resilience to climate changes, etc.
Mitigating actions
• Continue the transition to fossil-free energy sources within our own operations.
• Continue energy-efficiency improvements.
• Create market-neutral incitements to transform to energy-efficient, low-carbon operations through dialogue with industry and authorities.
• Risk management of suppliers, more transparency in the value chain.
• Capacity building and supplier management through Supplier Code of Conduct (SCoC) to mobilise the supply chain towards energy efficient, low carbon operations.
• Climate and energy assessment of business cases.
• Energy efficiency and climate criteria for M&As.
• Collaboration with industry on an industry-owned non-profit solution to avoid bringing in commercial players who drive up prices to increase the sorting rate/recycling.
• Setting management methods for more sustainable and environmentally friendly circular solutions and products through the purchase of goods and products, labelling and packaging.
• Capacity-building actions for employees, franchisees, suppliers, customers and stakeholder dialogue with authorities.
• Keep up focus on minimising food waste and work on reducing household waste.
• Integrate in risk evaluation and business reviews.
• Capacity-building actions for suppliers and employees/franchisees.
• Risk management and supply chain management for suppliers and sub-contractors, where CoC and SCoC are implemented and followed up on. Audits by a third party.
• Strengthen the work on sustainable and healthy products and/or own brands and private labels (locally produced, lower usage of water, certified suppliers, etc.).
37 Our responsibility Our business Corporate Governance Financial statements Appendix
Stakeholder engagement
At 3,800 sales outlets across the Nordic and Baltic regions, our franchisees and their personnel supply food and energy to our customers, our key stakeholders. These two million daily encounters provide valuable input and knowledge through interaction and dialogue. To ensure our business areas meet these stakeholders’ and other stakeholders’ expectations, they regularly conduct stakeholder engagement processes. Knowing our customers is key to a prosperous business and long-term trust and loyalty. Engaging with stakeholders is also our way of ensuring that we focus on the topics deemed as most relevant while at the same time mapping risks and opportunities.
We have different approaches and methods when speaking to internal and external stakeholders. When engaging with external stakeholders, such as financial institutions, suppliers, farmers, NGOs, authorities and customers, we use questionnaires, in-depth interviews and inte grated forms in loyalty applications and conversations.
We reach our employees, franchisees and employees in franchise-operated sales outlets through dialogue, workshops, forums and digital tools such as questionnaires and employer surveys to discuss priorities within the sustainability area.
Our stakeholders include:
• Customers
• Business areas: REMA 1000 Norway, REMA 1000 Denmark, Reitan Convenience, Uno-X Mobility
• Owners
• Suppliers
• Financial institutions
• Sector-specific organisations
• NGOs
• Government
• Media
38
Read more about the
on page 224 in the
2.1 Our role and responsibility
stakeholder input
appendix
Our sustainability strategy
Reitan Retail is a value-based company guided by our eight values in our everyday life and operations. These values, together with our culture and philosophy, are the foundation for making customers, employees and partners feel appreciated, creating financial value and conducting our activities with integrity and responsibility. Our joint sustainability work in Reitan Retail is proactively encouraged by our business areas and together. We seek solutions that optimally make use of our connectivity and position Reitan Retail for the future. We work purposefully with four strategic areas that are of the highest material importance to us and our stakeholdersEnvironment, Health, People and Value chain. These areas are Reitan Retail’s threshold for sustainability aspects becoming sufficiently important and hence, should be reported on. Our responsibility strategy reflects and showcases our clear sustainable stance in the green shift as well as the importance of good health, human relations and decent working conditions for all, including human rights throughout our value chains.
Our strategy aligns with GRI to help us report in a transparent and accessible way.
Through Retain Retail’s sustainability strategy, we aim to contribute to the UN’s Agenda 2030 and the 17 Sustainable Development Goals. Though we support all 17 goals, six have been prioritised as they best reflect our impact in the value chain. With these six goals in mind, we can make a difference and invest resources to do our part in making sure the goals are achieved by 2030. Our business areas also report separately on their progress towards the goals.
PRIORITISED SUSTAINABLE DEVELOPMENT GOALS
39 Our responsibility Our business Corporate Governance Financial statements Appendix
Reitan Retail will contribute to good public health, reduce greenhouse emissions, create greater diversity and equality in working life, and ensure sustainability and transparency throughout the value chain.
Environment
We aim to lead the green transition in our industries via our sustainability initiatives, helping our customers make climate-friendly choices and working towards a sustainable value chain that protects soil and biodiversity
1. By 2030, the ambition is to become net zero in our own companies (Scope 1 and 2)
2. By 2050, the ambition is to become net zero in the entire value chain
3. By 2030, the ambition is to cut food waste in our value chain by 50%
4. By 2030, the ambition is to have a total sorting rate of 90% of all waste
Health
We aim to offer healthier products at affordable prices for everyone. We inspire a healthier, active and sustainable lifestyle through our products, services and sponsorships
5. By 2025, the ambition is for 18% of sales in REMA 1000 to be fruit, vegetables, berries, whole grains, fish and seafood
6. We will increase our efforts for physical and mental health through our collaborations within grassroots sports, activities and organisations
40
PLEDGE AMBITION TARGET
2.1 Our role and responsibility
People Value chain
We aim to lead by example in equal opportunity and firmly believe in an inclusive work environment where people from all backgrounds are given the opportunity to succeed
7. By 2025, we will have at least 40% representation per gender among new franchisees in Reitan Retail
8. By 2025, the ambition is for there to be at least a 40% gender balance for new hires in top and middle management combined in Reitan Retail
9. All companies must have conducted internal employee surveys or use tools that measure how employees experience our diversity work
We have a high level of business morale and hold our suppliers accountable to our rigorous ethical code of conduct in order to offer responsibly produced products to our customers
10. We want to help prevent deforestation and work to reduce soy in feed and palm oil in the products sold in our companies
11. We will integrate the OECD Due Diligence Guidelines for responsible business conduct into our risk management processes. Our ambition is to screen 100% of our suppliers based on environmental and social criteria. Reitan Retail has a zero-tolerance approach to any breach of human rights, and we strive to minimise our environmental impact across the value chain
41 Our responsibility Our business Corporate Governance Financial statements Appendix
2.2 Environment
The impacts of climate change are coming closer to home around the world, and with extreme weather conditions occurring more often and a rising sea level, we are now facing the biggest challenges of our time1 .

AMBITION
With our ambition to lead the green transition in our industries and to meet our ambitious targets, we need to act throughout our value chain. Reitan Retail is dedicated to reducing negative impacts as we progress towards net zero emissions together with suppliers and customers.
To deliver on our ambitious targets, we have considered the challenges we face as we transition, such as climate-related risks and opportunities. Another key aspect is to integrate climate into our business strategy by having clear roles and responsibilities in our operations. The chief executive officer (CEO) acts as the highest-level management position responsible for climate-related issues. The CEO further delegates the operational authority of climate-related issues to the chief operating officer. Learn about our corporate governance structure in Chapter 3, page 74
Challenges and opportunities
Our business and subsidiaries acknowledge that we need to minimise our negative impact and that we operate in complex sectors, such as food and fuel. The emissions from food and road transport are responsible for almost 40 percent of the global
CO 2 emissions 2. For us, it is key to decarbonise our operations and value chain, and for that, we need to collaborate across business areas and with the local communities. For Reitan Retail, finding sustainable solutions that will reduce emissions, waste, and pollution is also what will attract both customers and young talent to work with us. The work we do also helps us prepare for upcoming regulations and new stricter climate reporting requirements.
We aim to lead the green transition in our industries via our sustainability initiatives, helping our customers make climate-friendly choices and working towards a sustainable value chain that protects soil and biodiversity.
World Economic Forum
The World Bank, Our World in Data
UN environment
1
2
3
programme https://www.unep.org/news-and-stories/press-release/ our-global-food-system-primary-driver-biodiversity-loss
The global food system is the primary driver of biodiversity loss.3
2022 highlights
REMA 1000 Denmark - In collaboration with the Danish Society for Nature Conservation, more than 22,000 Danes signed up for the ”Slip haverne fri” (Release the gardens) campaign with the goal of making more gardens in Denmark wild to support biodiversity.
REMA 1000 Norway – Achieved an in-store sorting rate of 84 percent and reduced total waste by more than 7,250 tons.
Uno-X Mobility – The first location with ultrafast EV charging opened in Denmark in April, followed by six additional openings of the concept in Norway and Denmark.
Reitan Convenience Latvia – Started a collaboration with Wingo, who collects and reuses used e-cigarette and battery waste and transfers the collected lithium to power banks for the Ukrainian army to charge communication devices on the battlefields.
Reitan Convenience Sweden – Reducing energy consumption by installing doors and lids on store coolers, together with 1,200 timers for temperature reduction during nights.
TARGETS
By 2030, the ambition is to become net zero in our own companies (Scope 1 and 2)
By 2030, the ambition is to cut food waste in our value chain by 50 percent

By 2030, the ambition is to have a total sorting rate of 90 percent of all waste
By 2050, the ambition is to become net zero in the entire value chain
43 Our responsibility Our business Corporate Governance Financial statements Appendix
EMISSIONS FROM MAIN CATEGORIES SOLD AND PURCHASED PRODUCTS
PRODUCTS SOLD IN SALES OUTLETS OTHER
-5.2%
recycable rate of waste generated
7,500 ton
food waste in our sales outlets
CO2 in our own operations compared to 2021
1.7%
76% increase of energy used in own operations scope 2
44
REMA 1000 NORWAY REMA 1000 DENMARK REITAN CONVENIENCE UNO-X MOBILITY 22 % 16 % 2 % 60 % 3% SCOPE 3 EMISSIONS PER BUSINESS AREA
60% 37% 2.2 Environment
FUEL
Net zero – in own companies and value chain
TARGET
Reitan
Our 3,800 sales outlets house our core operations within the grocery, convenience and mobility sectors, so we are reliant on efficient transportation, refrigerants and energy supply. For us to decarbonise our operations and reduce emissions, we have to act with urgency to reduce our emissions in scopes 1 and 2.
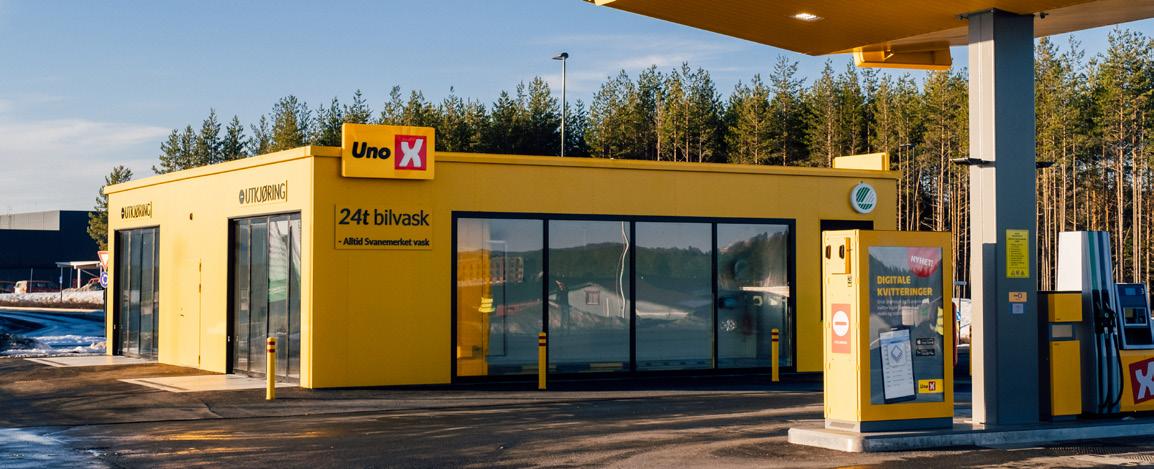
UNO-X MOBILITY CERTIFIED CAR WASH
Operating 52 Nordic Swan Ecolabelled car washes in Denmark and Norway is just the start of an ambitious plan. The washers offer a simple and efficient customer experience and a smaller environmental footprint. The wastewater is about 90 percent better cleaned for oil and heavy metals, and water consumption is reduced by about 80 percent compared to an ordinary car wash. The service and capacity at the car washes give customers a seamless experience, such as the ability to process payment from phones so you can stay in your car.
It is inspiring to follow a major player such as Uno-X Mobility setting the direction and pace for green transition. The investment in more environmentally friendly car washes is an example of compliance. A Swan-labelled car wash uses significantly less water and captures hazardous emissions, and cleans the water so well that it can be used wash after wash. It is a circular economy in practice and provides an enormous environmental achievement.
Cathrine Pia Lund Managing director of the Nordic Ecolabel
45 Our responsibility Our business Corporate Governance Financial statements Appendix
Retail is working towards two net zero targets. First, by 2030, to become net-zero in our own companies (Scope 1 and 2) and, by 2050, the ambition is to become net zero in the entire value chain (Scope 3)
UNO-X
ULTRAFAST EV CHARGING IN NORWAY AND DENMARK
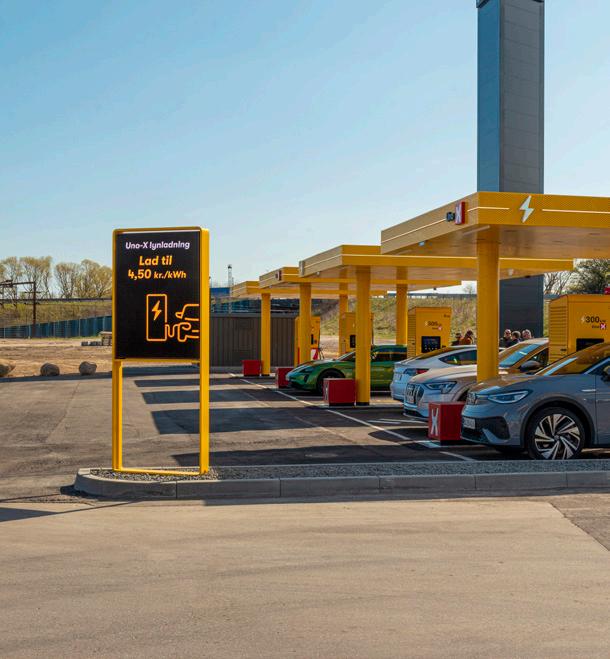
Uno-X offers customers a simpler and more efficient experience when charging their electrical vehicle (EV) at an Uno-X location. The first location for ultrafast EV charging opened in April 2022 in Nyborg, Denmark, with Minister of Transport Trine Bramsen and Ole Robert Reitan attending the opening. In November, the first charging location in Norway was opened in Drammen, with Minister of Transport Jon-Ivar Nygård and Ole Robert Reitan attending the opening. In total during 2022, two locations have been opened in Denmark and five in Norway. The technology development and capacity for faster charging increases and there is a growing number of electric vehicles across the Nordics.
Our mission is to develop and promote solutions for sustainable mobility. We want to offer our customers great value while doing what we can in the shift to electric and green energy. We set a state-of-the-art standard in customer experience when it comes to speed of charging, smooth payments and price info of fuels and electricity together – all to create good customer experiences that are simple, efficient and at a good price.
Ole Johannes Tønnessen CEO at UNO-X E-Mobility
In 2022 we reduced our emissions in scopes 1 and 2 by 5.1 percent from 2021. In total, we had 47,000 tons of CO2 from our own operations, which equals 0.5 percent of our total emissions. In scope 1, we have reduced emissions by 1.2 percent compared to 2021. Focus on reducing stationary combustion fuels and propane usage reduced scope 1 emissions, even though emissions from refrigerants and transportation increased. The transition to less pollutant refrigerant continues. In scope 2, we reduced our emissions by 7.4 percent in 2022 compared with 2021. With operations in the Nordics and Baltics, we use seven country-specific energy mixes when calculating emissions from energy use in scope 2. In 2022 our consumption of energy increased by 1.7 percent, indicating that the emissions reduction solely comes from the changes in the national energy mixes. Generally, the increase in consumption comes from the use of electricity to heat and cool our sales outlets, locations, and the usage of machinery.
By using cleaner energy sources in 2022, we have decreased the emissions overall, the exception of the business areas REMA 1000 Denmark and Uno-X
46
Ole Johannes Tønnessen CEO UNO-X E-mobility
MOBILITY
2.2 Environment
Mobility, where the emissions in scope 2 have increased. Looking ahead, we will continue to work for more energy-efficient solutions with renewables and smarter transport and phase out activities that have a negative impact. We need to be more efficient with the energy we source and produce.
In our scope 3, we have continued to gather data to get more accurate numbers as we calculate emissions in our value chain. Now we have a baseline for our collective CO2 emissions in scope 3. In 2022 we emitted 8,600,000 tCO2. That equals 99.5 percent of our total emissions. The main sources of emissions are purchased goods and services and the use of sold products (fossil fuels).
Science-Based Target initiative
In 2023, Reitan Retail as a group will work towards setting both near-term and net zero (2050) targets according to Science Based Targets initiative (SBTi), a global coalition with an approach to set emissions reduction targets grounded in climate science. We will build upon the efforts made by REMA 1000 Norway, who got their near-term and net zero targets validated in 2022 and Reitan Convenience Sweden, who validated their near-term targets in 2021 and are committed to net zero. Encouraging suppliers to commit to SBTi is an essential part of our climate reduction journey in line with the 1.5°C pathway, which will progress in 2023.
Biodiversity
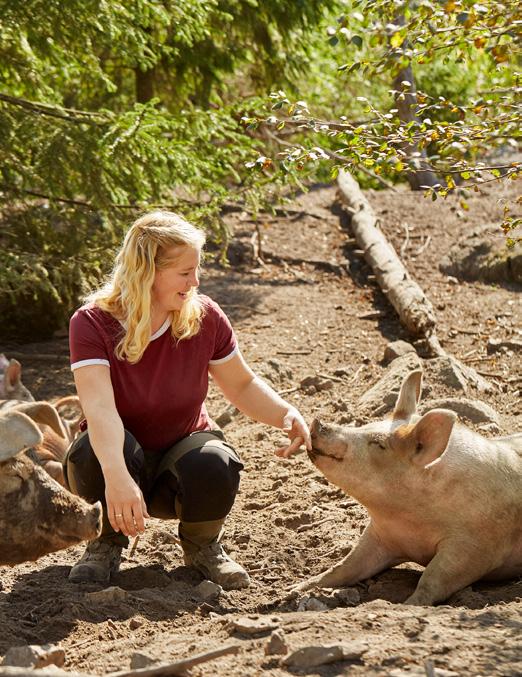
As climate change is one of the main drivers behind biodiversity loss, protecting biodiversity is of great importance. It is when ecosystems disappear that we hinder nature’s ability to regulate greenhouse gas (GHG) emissions. In our operations, we need to consider nature and work with resource efficiency. With a new global framework for biodiversity agreed upon at COP15 in 2022, the importance of our continued work to restore nature to achieve a secure and sustainable food production is clearer than ever. As we operate in sectors that rely on biodiversity, we look to important components in our food system, such as topsoil, which is a scarce resource crucial to growing enough nutritious food. Norsk Kylling has implemented a policy to not build on topsoil, and the factory in Orkanger
required the largest soil relocation project in Norwegian history. The factory was built with several floors to increase resource efficiency.
Sustainable transportation
To cut our emissions, all parts of Reitan Retail need to lower emissions in our transportation and distribution channels. Road transport makes up 72 percent of global transport emissions, and much of our assortment relies on efficient local and global transportation. We have looked at new solutions and introduced biogas trucks and electric vehicles (EVs). Through smarter logistics and better routes, we can reduce transportation and increase efficiency when we collect and drop.
Throughout 2022, Uno-X Mobility’s concept for ultrafast EV charging has opened in seven locations. The offer focuses on creating a simple and efficient customer experience at the lowest price as we push the electrification agenda forward and look to open more EV charging locations.
47 Our responsibility Our business Corporate Governance Financial statements Appendix
Waste
TARGET
As the world generated 2 billion tons of municipal solid waste last year, there is a need for a new approach and better recycling of materials1. We need to look at a more circular approach for waste handling. In 2022, we recycled 72 thousand tons of waste equalling a recyclable rate of 76 percent of total waste generated.

The remaining 24 percent of unsorted waste was incinerated, and its emissions count for 89 percent of total CO2 emissions from waste in Reitan Retail.
Waste management in Reitan Retail corresponds with the differentiating regulations in our markets of materials, such as plastics. There are several local initiatives, like replacing plastic in packaging as well as using an increased share of recycled plastics. As the Sustainable Development Goal “Sustainable consumption and production” is one of the most crucial development goals to us, we consider the packaging as important as the product itself to be considered “sustainable”.
While ensuring that our waste is managed properly and according to local standards, we encourage our customers to recycle by providing higher shares of circular packaging. As we continue the work of reducing waste, having quantitative data from all business areas is needed to track progression and is part of the mandatory Scope 3 mapping for the annual carbon accounting reporting for all companies.
REITAN CONVENIENCE
“GRÖNA BILAGAN” (GREEN ANNEXE) – CONSTRUCTION TOOLS FOR A MORE SUSTAINABLE CONVENIENCE STORE
Reitan Convenience Sweden has developed a sustainability annexe, “Gröna Bilagan”, to have better impacts on building construction projects. The annexe is a tool for dialogue and cooperation and is signed by our construction contractors. It includes requirements for the companies to set scienced-based climate targets and clear guidelines regarding, for example, building materials, waste management and the work environment for construction workers.
During 2022, our construction contractors have set climate targets with The Science Based Targets initiative, and we have started to follow up on how the construction contractors live up to the annexe’s requirements in the major construction projects. It’s important to do what we can to ensure that our construction projects are responsible towards the environment as well as towards people’s health and safety.
Isak Wondimu Director of Establishment and Construction at Reitan Convenience Sweden
48
2.2 Environment
By 2030 our ambition is to have a total sorting rate of 90 percent of all waste.
Food waste
Food waste is a big global challenge; it is believed that 40 percent of the food produced for people is wasted or lost. Today, food retailers waste around two percent, and more than ten percent of the food waste comes from households3. In our operations in discount grocery and convenience, we can address this issue and help find solutions that minimise food waste and reduce emissions from our product portfolio. Our focus on food waste has been on product offerings and packaging, as well as on how we can build awareness around the issue through communication.
Through studies, we have quantified our waste and calculated its impact. We use these findings in reporting and setting targets, and to prepare ourselves for upcoming food waste regulations. We know through our operations that surging sales and reducing write-offs lead to less of a negative impact and save costs for franchisees. We do this by optimising our assortment and controlling the delivery frequency and sales quantity to provide fresh products to our customers and avoid overstocking. There are several local initiatives fighting food waste in our sales outlets, giving our customers the option to be part of the solution through apps and partnerships.
REMA 1000 DENMARK FIGHTING FOOD WASTE
REMA1000 Denmark has a long history of fighting food waste. Already in 2008, a collaboration was started with the Danish organisation Stop Wasting Food Denmark. In-store food waste lies at a steady 1.7 percent but continues to be a focus area. The major discard categories are fresh bakery, fruit and vegetables. In 2022, a training program on food waste reduction in stores was introduced, which we hope will lead to positive results.
Other successful actions over the past years include ending quantity discounts, collaborations with local charity organisations, end-of-day price reductions and smaller packages on bread and meat.
We have focused on training every one of our fruit and vegetable managers in a new replenishment method, which should reduce food waste while customers still get an experience of a fresh and inspiring fruit and vegetable department. We hope to be able to read a positive effect of the training in our 2023 data.
Mads Nysted Head of Sales at REMA 1000 Denmark
49 Our responsibility Our business Corporate Governance Financial statements Appendix
1 The World Bank 3 WWF 2 www.unep.org
TARGET
By 2030, Reitan Retail’s ambition is to cut food waste in our value chain by 50 percent.
2.3 Health
With a well-balanced diet, we don’t just look after our health. We can also reduce environmental impacts. With 1.8 million daily encounters in REMA 1000 and Reitan Convenience, we do our best to promote healthier food at affordable prices.
AMBITION
At Reitan Retail, we see it as our responsibility to contribute to better public health, and we want to inspire people to make healthier and more sustainable choices.
With a proactive approach to achieving environmental and public health benefits, we support organic agriculture to produce food while establishing an ecological balance preventing soil infertility and pest problems. Organic agriculture has been shown to have health benefits for farmers and consumers by reducing exposure to toxic and persistent chemicals in soil, air, and water. For consumers, organic products are found to have a higher share of healthy fats and less to no antibiotics or synthetic hormones1
The Keyhole label is a joint Nordic nutrition label supported by the Nordic Council of Ministers and owned by the National Food Administration. The label certifies that the products meet specific salt, sugar, fat, and fibre content requirements within the product group. The aim is to make
it easier for consumers to find and choose healthier foods. We will continue to expand and promote healthier products and make those options more accessible in our sales outlets.
Challenges and opportunities
There is a need to shift our global food system in a more sustainable direction, where our diets have less impact on the planet’s resources. A system that provides more plantbased nutrition and is less reliant on animal protein. Too many people are eating unhealthily, and both obesity and malnutrition are growing global problems leading to cost increases for society and negative impacts on individuals’ life quality.
Throughout Reitan Retail’s subsidiaries, we work with partners and support organisations that push for healthy habits and lifestyles. We do this through our products, services, sponsorships and by supporting the EU’s Farm to Fork Strategy.

1 European Parliament
We aim to offer healthier products at affordable prices for everyone. We inspire a healthier, active and sustainable lifestyle through our products, services and sponsorships.
We will continue to expand and promote healthier products and make these options more accessible in our stores.
2022 highlights
Reitan Convenience Sweden – In the PBX outlet in Stockholm, a QR code directs customers to a mindfulness app.
REMA 1000 Denmark – Facilitated sending 33,878 children and adults to food schools and sports camps.
REMA 1000 Norway - Was named the best “5 a day-grocery chain” by the foundation “Fruit and Vegetable Information Office”.
Reitan Convenience Sweden - Sugar and substances used as food additives, so-called “E-numbers”, were removed from all animal sausages sold at Pressbyrån and 7-Eleven.
TARGETS
By 2025, the ambition is for 18% of sales in REMA 1000 to be fruit, vegetables, berries, whole grains, fish and seafood.
We will increase our efforts for physical and mental health through our collaborations within grassroots sports, activities and organisations.

51 Our responsibility Our business Corporate Governance Financial statements Appendix
Healthier options
and extended the category by adding frozen fruits, berries, and vegetables. The updated definition explains why we have over-delivered on our target, with 29.1 percent of sales in 2022 coming from healthier products compared to 15.3 percent in 2021. The share of units sold of healthier products in 2022 was 32.3 percent, down from 32.7 percent the year before. Share of sales from healthier products is unchanged, whilst the share of units sold is reduced by 0.4 percent points.
TARGET
To tackle the issue of current nutritional weaknesses in the Norwegian and Danish diets, we work to increase the sales of healthier options in REMA 1000. In 2022, we updated our method for measuring healthier products. In the updated definition, we measure the share of healthier products compared to edible and drinkable products, whereas we previously measured healthier products compared to systemwide sales from REMA 1000. In addition, we added keyhole-labelled products
Reitan Convenience works to align the assortment with the Planetary Health Diet. A planetary health diet is a flexitarian diet created by the EAT-Lancet Commission, where whole grains, fruits, vegetables and nuts comprise a greater proportion of foods consumed.
With our 3,800 sales outlets, we have a great opportunity to make healthier options more accessible. Through product development of our own products and through dialogue with suppliers, we improve product recipes. The focus is to reduce salt, sugar, saturated fat, and food additives while still ensuring that they taste great. We only use food additives if there is a technological need, such as preserving the nutritional quality of the food or enhancing the food’s stability. By working with our manufacturers, we have removed several additives in all food categories.
Our proactive approach to improving our supply chain is also part of our support of the European Commission’s climate action of increasing organic farming, with its aim to reduce the world’s use of pesticides and fertilisers and combat antimicrobial resistance.

52
By 2025, the ambition is for 18 percent of sales in REMA 1000 to be fruit, vegetables, berries, whole grains, fish and seafood.1
2.3 Health
1000 DENMARK
LESS WASTE AND COST SAVINGS FOR FAMILIES
In 2022 REMA 1000 Denmark started a strategic partnership with Mambeno, a food planning app. The app is developed to make it easier for families to eat healthier and more varied food at discount prices. With the app, users can design a meal plan based on the current REMA 1000 offers, often under 500 DKK for five family meals. The recipes promote healthier meals with vegetables and whole grains, and the recipes are created to involve children in cooking. By better-planned purchases, food waste can be reduced, and meat can be replaced by plant-based options.
At REMA 1000 Denmark, we want to make it easy and affordable for families to eat healthier meals that the whole family can prepare together. We are, therefore, very happy that we in Mambeno have found a partner with the same shared vision.
Anders Jensen Buying and Marketing director at REMA 1000 Denmark
53 Our responsibility Our business Corporate Governance Financial statements Appendix
REMA
29.1% healthier products 15.3% healthier products1 REMA 1000 2022 2021 Fruit, berries and vegetables Keyhole-labelled products Whole grains Fish and sea food 14.1% 9.3% 2.6% 3.1% 1We are in the process of updating the target related to healthier products to be aligned with the updated method for measuring healthier products.
Improved health

TARGET
In addition to providing healthier options to eat and drink, we promote a well-balanced and active lifestyle aiming to improve both physical and mental health. An important part of our work in promoting a healthy lifestyle has, throughout our history, been our involvement in local communities. We continuously collaborate with organisations and promote initiatives within our markets that focus on well-being, exercise, and mental health. With many sponsorships and collaborations, we promote and boost teams, athletes, and associations, also on national and international levels. Through Reitan Retail’s franchisees, we support hundreds of sports and cultural events all over the Nordics and Baltics.
54
2.3 Health
We will increase our efforts for physical and mental health through our collaborations within grassroots sports, activities, and organisations.
REMA 1000 NORWAY
MAKING HEALTHIER OPTIONS AVAILABLE
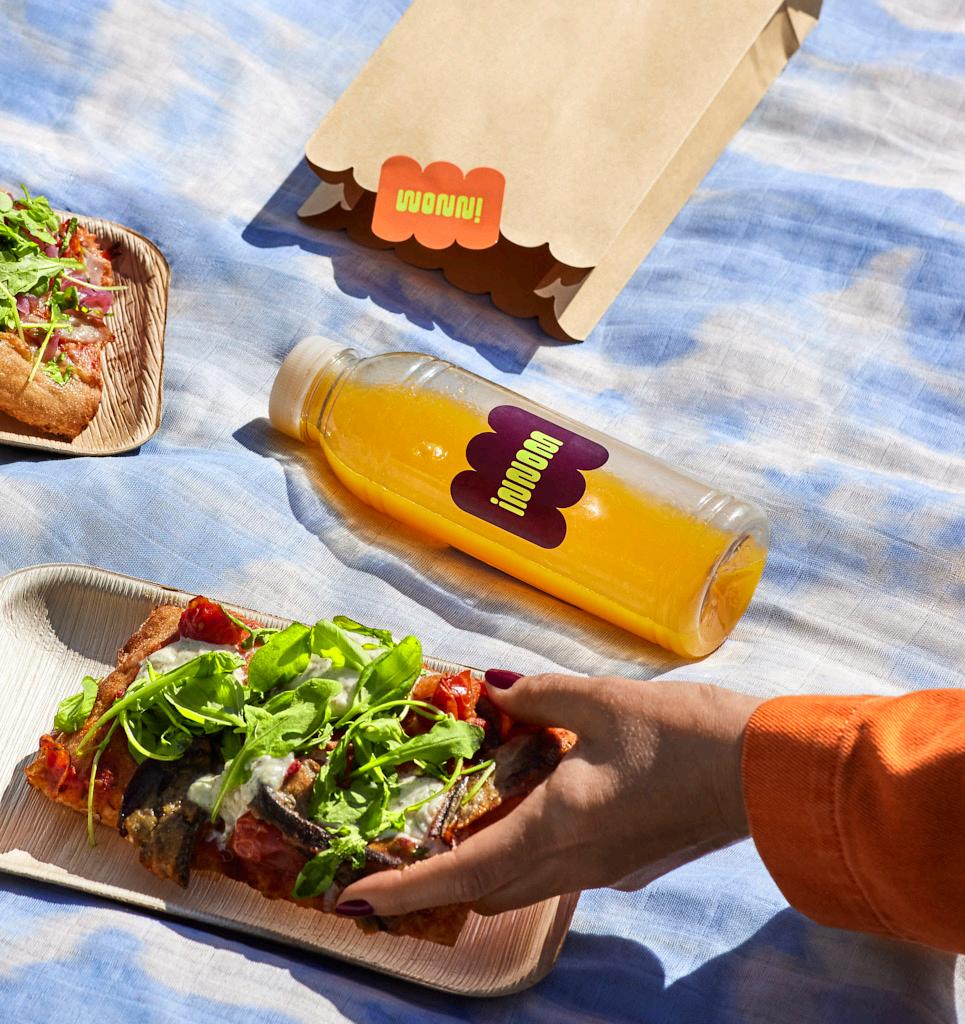
REMA 1000 Norway has been offering healthier food options at sporting events like the Oslo Marathon and different youth clubs around Norway. Actively promoting fruit and vegetables at events has produced results. For instance, the promotion of discounted fruit and vegetables at weekend sporting events then sold for a discounted price on Monday and Tuesday in stores, which in turn led to an average 38.9 percent increase in sales for those healthier products. That’s what we call a win-win! REMA 1000 Norway has also attended events together with Narvesen and 7-Eleven to help make wholegrain bread, smoothies, and sugar-free soft drinks more available. The message is simple: making healthier choices is better for both people’s and the planet’s health.
We are continuously working on decreasing salt and sugar in products and nudging our customers to add more fruit and vegetables to their shopping baskets. At the same time, we want to communicate healthier choices and make them more available. We can see that when we attend events and bring healthier options, we have given out and sold 7,000 kg of fruit in 2022. There are great opportunities for us to offer tastier and healthier food.
Ingvill Måkestad Bovim Clinical nutritionist at
55 Our responsibility Our business Corporate Governance Financial statements Appendix
REMA 1000 Norway
1
2.4 People
Our people are at the heart of everything we do, embodying our values and making us different and unique. Our value-based leadership is part of our philosophy to build great people and local heroes.
We recognise people for who they are and believe that diversity is a driver for success. With 43,500 people working across our operations in seven countries, we have both the opportunity and the responsibility to build inclusive workplaces. Treating colleagues, customers, business partners, and others with respect, no matter cultural differences and other individual characteristics, is at the core of our leadership philosophy. At Reitan Retail, we have a zero tolerance for discrimination of any kind. In our policy work, this includes, but is not limited to, any unequal treatment, preference, or exclusion based on age, gender identity or expression, disability, sexual orientation, ethnicity, political or religious belief, or any other individual characteristics. We don’t allow any form of harassment or offensive, threatening, or degrading behaviour, including any form of unwanted attention of a sexual nature. We believe that diversity is a positive attribute, reflecting who we are.
Challenges and opportunities
As a major employer of young people, it is crucial to understand the values and motivations of the generation now entering the labour market. Gen Z (born between 1997-2010) want to work in companies where there is a high level of transparency, equality and diversity and that take a clear stand in the fight against climate change1. In society at large there is an experience of exclusion, and we know it is a fundamental human need to feel included2
AMBITION
We believe that the search for purpose and belonging at work, rapidly accelerated during covid, fundamentally has changed the attitude to working life. This presents new challenges but, at the same time, opportunities for us as a value-driven company.
Our company purpose and deeply held values create a unique starting point for navigating the people-purpose paradigm shift, and attracting and retaining the talents of tomorrow.

Depending on markets, women generally have lower incomes as well as poorer pension rights and fewer leadership positions than men3. In our diversity work, we also see some differences in conditions across the group and geography. Closing the gender gap among our franchisees in Denmark and Latvia is an area we specifically focus on.
To increase gender equality, we need to focus on securing a better work-life balance for one thing, and minimising physically heavy work that can be excluding. Our general and fundamental approach to equality is ensuring individuals an equal opportunity to develop.
https://www.weforum.org/agenda/2023/03/gen-z-workplace-equity/ 2 University of Columbia
We aim to lead by example in equal opportunity and firmly believe in an inclusive work environment where people from all backgrounds are given the opportunity to succeed.
3 International Labour Organization
We
2022 highlights
REMA 1000 Denmark - 95.9 percent of stores include people from marginalised groups on the labour market.
REMA 1000 Norway – Specifically targeted women when recruiting new talents to the Franchisee Talent School to achieve better gender distribution.
Reitan Convenience Latvia – Won an award from the “Diversity is strength” movement and was recognised as one of Latvia’s most Family-Friendly workplaces.
Uno-X Mobility - Uno-X Pro Cycling women’s team participated in the world’s first Tour de France Femmes. They will return in 2023, then joined by the men’s team. They will be the first NorwegianDanish team to compete in the men’s Tour de France, which is one of the world’s largest sporting events.
Reitan Convenience Sweden – Has participated in a project with the mission to include and welcome students that are interested in our field for an internship. This is a great stepping stone into the job market.
TARGETS
By 2025, we will have at least 40 percent representation per gender among new franchisees in Reitan Retail.
By 2025, the ambition is for there to be at least a 40 percent gender balance for new hires in top and middle management combined in Reitan Retail.
All companies must have conducted internal employee surveys or use tools that measure how employees experience our diversity work.

57 Our responsibility Our business Corporate Governance Financial statements Appendix
look at people for what they are and what they can become, and that´s why we believe that diversity is a driver for success and engagement.
40%
22% of the franchisees in Reitan Convenience Sweden have minority backgrounds of franchisees are between ages of 20 and 29
58 PEOPLE IN REITAN RETAIL OUR PEOPLE NEW FEMALE MANAGERS AND MANAGEMENT NEW FEMALE FRANCHISEES Female 51% Male 49%
64% female 2021 2021 2022 31% female 39% female 2022 42% female 46% female 46% female 64% female 30% female REMA 1000 NO REMA 1000 DK REITAN CONVENIENCE UNO-X MOBILITY 54% male 54% male 36% male 70% male AGE EMPLOYEES 34% 40% 26% <30 30-49 >50 2.4 People
Responsible employer
Ever since the first REMA 1000 store opened in Norway in 1979, our franchise model has been a key driver of our success. Our franchisees are an integrated part of their local communities and know their customers best. Therefore, they are given a lot of freedom to shape their operations while following the company’s concept and philosophy. They are also free to form their teams, by recruiting and employing the best candidates for their stores and customers.
Our 2,200 franchisees are employers that attract talented people from all parts of society, thereby diversifying the workplaces and our everyday operations. The most important criteria when recruiting, training, or reorganising are skills, competence, drive, and potential, disregarding age, gender, or ethnic origins. To ensure we hire the best-qualified candidate, our recruitment processes have requirements specifications and thorough assessments, evaluations, interviews, test tools, and reference checks. By doing so, we promote equal opportunities for all employees and prevent actions contrary to the Anti-discrimination Act.
Our people include many young first-time employees and other employees who need work practice or training for different reasons. We want to be a place where people are safe to be themselves and grow with responsibility.
Across Retain Retail, vacancies are first advertised internally to promote internal career development. To ensure employee development, several programs and tools are available, such as relevant skill development courses. Through individual employee evaluation and development interviews, we identify and define individual career goals and development plans for those with ambitions to advance to management positions.
Our responsibility Our business Corporate Governance Financial statements Appendix 59
GENDER FRANCHISEES PER COUNTRY Norway 25% women and 75% men Sweden 56% women and 44% men Denmark 10% women and 90% men Baltics 82% women and 18% men Finland 68% women and 32% men 25% 56% 10% 82% 68% 75% 44% 90% 18% 32% GENDER FRANCHISEES 2022 37% women and 63% men 2021 39% women and 61% men 37% 39% 63% 61%
MEET OUR FRANCHISEES
Our values
Our value-based culture is the cornerstone of our operations throughout all our companies and concepts in the Nordics and Baltics. Our values and culture are the foundation for making customers, employees and partners feel valued. It is our basis for creating financial value and conducting our activities with integrity and responsibility.
Our eight values guide us in our work:
1. We stick to our business model
2. We keep high moral standards
3. We are committed to be debt-free
4. We encourage a winning culture
5. We are positive and proactive
6. We talk with each other, not about each other
7. The customer is our ultimate boss
8. We work for fun and profit
These are even carved in stones and obelisks placed at Lade Gaard and at several offices, stores and other locations in the Nordics and the Baltics.
Our values describe what we believe is worth striving for, and guide our way of working as our internal compass. With our value-based leadership, we aim to support our great people and build pride across our organisation.
The managing director in each Reitan Retail business area is responsible for operating and developing the business area according to the REITAN philosophy. Respective managers are responsible for the cultural development of their subsidiaries.
Reitan’s Verdiskole, our “Value Academy”, is our internal leadership academy. It aims to raise awareness and provide training in our philosophy, culture, and value-based leadership. In 2022, 406 colleagues from Reitan Retail in total participated in the Value Academy.
REMA 1000 DENMARK
LISE AT REMA 1000 STAVTRUP
Lise Leander became a REMA 1000 franchisee in her hometown of Stavtrup, south of Aarhus in 2006. At the time, she was one of very few female REMA 1000 franchisees in Denmark. Part of the success of the store is the focus on employee well-being and finding a suitable work-life balance. It’s a welcoming place to those that might have struggled to get into or back to working. At the REMA 1000 in Stavtrup there are over 50 employees with different backgrounds and capabilities. Many young people have their first job experience at REMA 1000, where they learn to take on responsibility and gain experiences that help them grow. One thing that Lise appreciates as part of Reitan Retail is that although it is a big organisation, it still is a family-orientated one. There is a closeness to the top management with short decision paths, and an understanding in the management of the little things that happen in the store.
Employees have always been and remain our most important resource. It means a lot that they get involved and make sure everything works, for me, we’re like a family. This is a workplace where people can balance their everyday life with their job. There is a sense of community mixed with professionalism in the store, with the goal to make sure customers smile at least twice when they visit the store.
Lise Leander franchisee at REMA 1000 Stavtrup
60
2.4 People
40 percent representation per gender in new franchisees
TARGET
We have implemented several initiatives in order to reach our goal of at least 40 percent representation per gender by 2025. In 2022 this included our annual talent programs for select sales personnel, as well as encouragement to becoming franchisees. Through these targeted talent and training programmes, we work to secure a healthy work-life balance while promoting craftsmanship and franchising.
In 2022 we engaged 298 new franchisees of which 31 percent were female. This is a negative development from last year, when the female share was 43 percent. Onwards we will address the variances between our business areas, as we, historically, have not attracted enough women in Denmark while our Baltic operations are run by predominantly female franchisees.
In 2023 we will continue to focus on identifying ways to increase interest in the profession among all genders, especially women. By strengthening our culture and providing training programmes and value-based leadership we want to attract highly motivated people who run their own businesses as franchisees. Among other measures to promote diversity and reduce discrimination, we focus on
minimising physically heavy work and finding the right balance between full-time and part-time employees. We and our franchisees are invested in creating opportunities to work, and strive to adapt working conditions to the needs of employees.
61 Our responsibility Our business Corporate Governance Financial statements Appendix
By 2025, 40 percent representation per gender in new franchisees.
Gender balance in management
TARGET
Our efforts to increase gender diversity continue, with focus on increasing the number of female franchisees and female managers through internal awareness programs, talent development and training. We have a fairly gender-balanced workforce overall, with 51 percent women and 49 percent men. However, the share is less balanced among franchisees and managers. To achieve better gender balance in all our business areas, we must avoid any bias. By using professional tools in recruitment processes, we target gender balance in new hires for top and middle management positions.
In 2022, 37 new hires were female, which equals 42 percent of all new leaders. Besides managers and management, the gender split for employees working in our offices with assigned responsibility areas of highlevel importance to our operations was 40 percent women and 60 percent men. In 2021 64 percent of new managers and management were women.
The Reitan Retail Executive Management Team are gender balanced with four women and four men. For the board, 64 of 195 members across all Reitan Retail companies are women (33 percent).
We have invested significantly in resources and training programmes for all employees and leaders. In 2023 we will continue our work to secure that we find the best-qualified candidates for top and middle management positions to maintain our 40 percent gender balance target in all management teams in Reitan Retail. We will continue emphasising the importance of fair hiring processes, training, and employee development. We have collected data on differences in pay between genders, and will address these as we move forward striving for equal pay and opportunities for all.
62
NEW FEMALE MANAGERS AND MANAGEMENT REMA 1000 NO 40% (39% 2021) REMA 1000 DK 50% (50% 2021) REITAN CONVENIENCE 57% (75% 2021) UNO-X MOBILITY 29% (45% 2021) REITAN RETAIL 42% (64% 2021) 40% 50% 57% 29% 2.4 People 42% 42%
By 2025, the ambition is for there to be at least a 40 percent gender balance for new hires in top and middle management combined in Reitan Retail.
REMA 1000 NORWAY TALENT DEVELOPMENT
In 2022, REMA 1000 Norway’s Talent School focused specifically on targeting women through internal communication. The work included interviewing female franchisees and spreading their stories in internal advertising for the Franchisee Talent School during the process of admission. The communication highlighted that the job suits all genders. By searching internally, the recruited talents already know the REMA culture and understand the daily work well. By improving the gender distribution at the Talent School, we hope to gain the same results among our franchisees.
We want to attract women to improve our gender distribution among franchisees. It is not a quick fix, and we must think long-term about our measures and initiatives to achieve our goal.
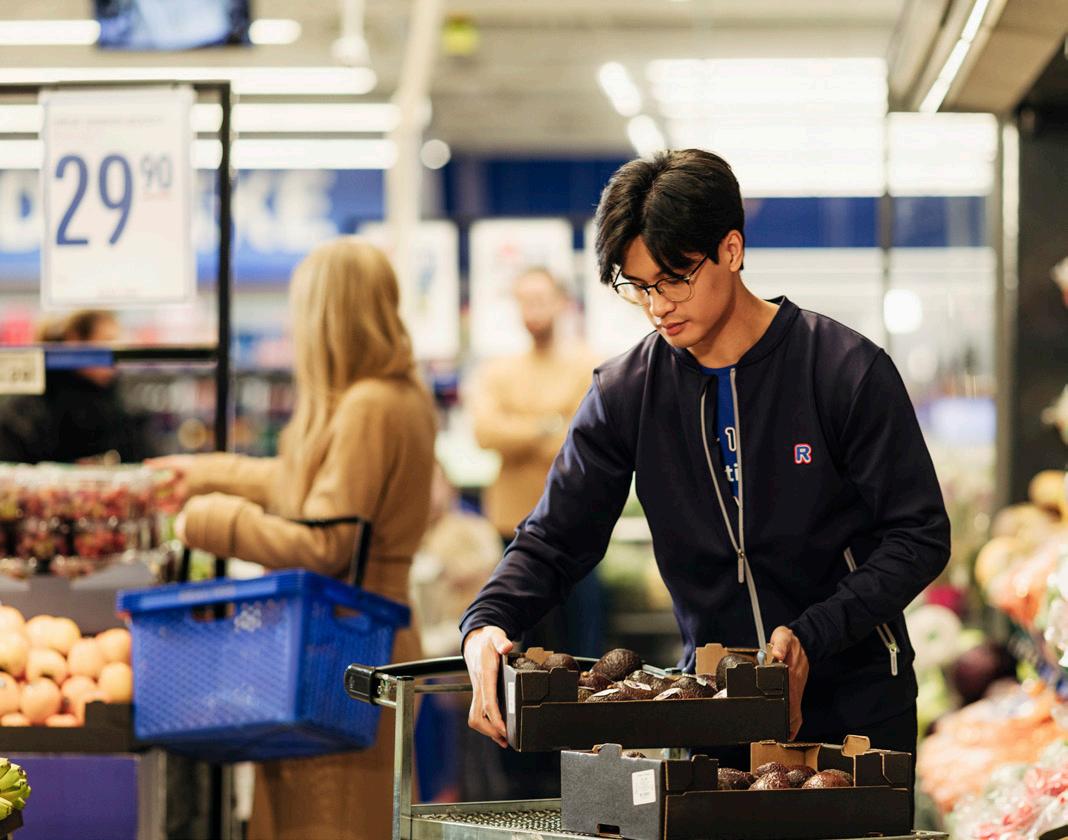 Marit Sælid Johannessen Chief people officer at Reitan Retail
63 Our responsibility Our business Corporate Governance Financial statements Appendix
Employee surveys
TARGET
By conducting surveys, we can measure the perception of our work on diversity and manage ways to keep and attract people. In 2022 we conducted a Great Place to Work survey, and 666 people working in our Norwegian parts of the organisation participated. The participation rate is considered high.
Looking ahead, we will continue to conduct internal employee surveys to measure how employees experience our diversity work. We want to increase the response rate and ensure the business areas’ management teams develop actions for better and diversified teams. We are also improving our way of communicating the importance of diversity.
2022 employee survey results
The results from our annual employee survey1 tell us that as many as 94 percent of our employees feel they are given significant responsibility. This shows that our confidence in our employees and value-based management is paying off.
The survey also highlights that employees experience a high degree of fairness regardless of cultural or ethnic affiliation, gender, or sexual orientation.
93% 90% of employees feel that they can be themselves at work of employees feel that their work means something special
64
All companies must have conducted internal employee surveys or use tools that measure how employees experience our diversity work.
2.4 People
1 The Great Place to Work survey with 666 participants from the Norwegian part of the organisation
• Employees here are treated fairly regardless of cultural or ethnic affiliation: 97 percent
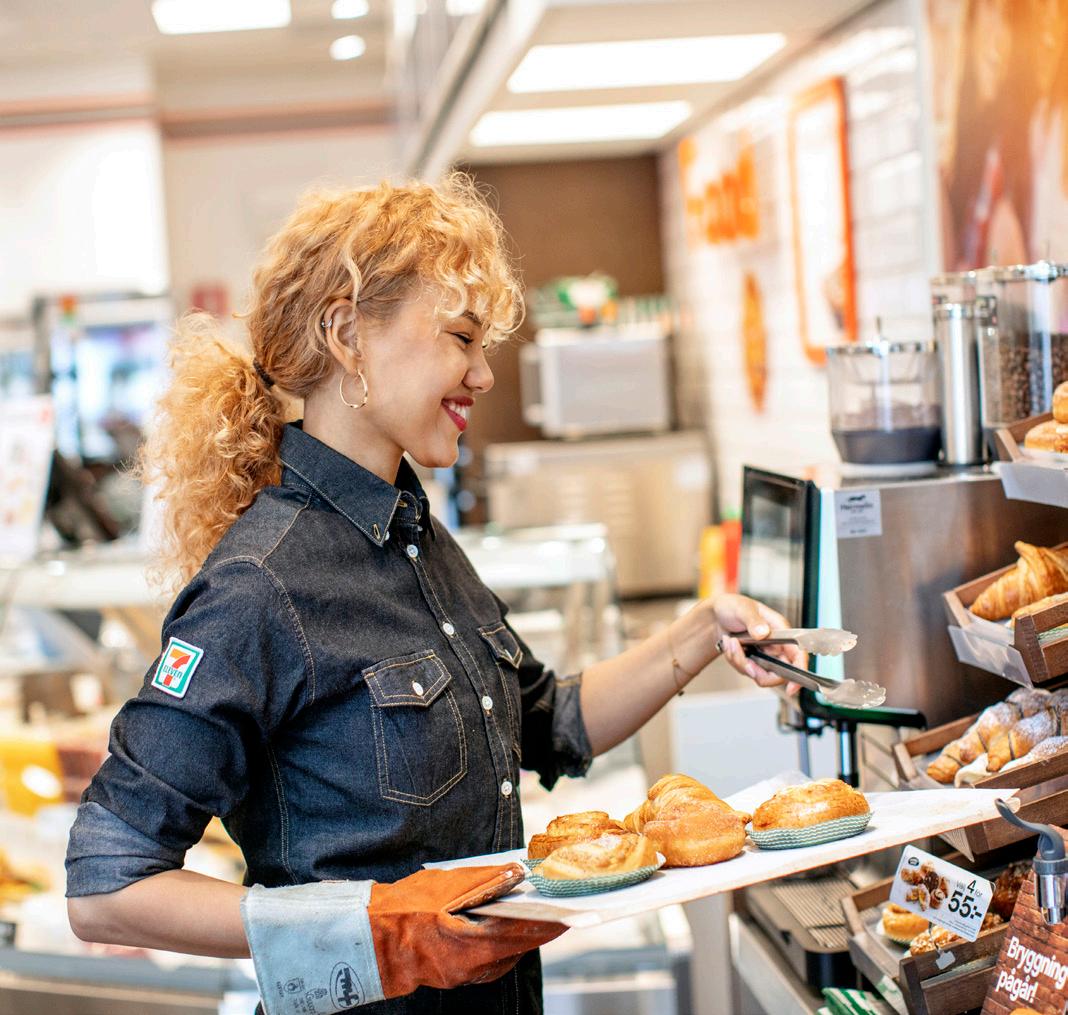
• Employees here are treated fairly regardless of gender: 95 percent
• Employees here are treated fairly regardless of sexual orientation: 99 percent
Another great result is that 90 percent feel that their work means something special. A sense of purpose and feeling of contributing to something bigger is important to us as people and employees.
Furthermore, 93 percent feel they can be themselves at work. This is an important result for us, because we believe in the individual, and want everyone to feel acknowledged and included.
The survey results also identified improvement areas for us going forward. We want to improve our co- operation between business areas and bring a sense of “togetherness” throughout our organisation. By looking at our organisational structure, we want to better utilise synergies and work smarter across departments.
65 Our responsibility Our business Corporate Governance Financial statements Appendix
2.5 Value chain
Our value chain is complex and includes large multinational conglomerates and smaller-scale farmers in different parts of the world. Conducting business ethically and transparently aligned with our values is essential for us.

AMBITION
Climate change and a growing pressure on natural resources, which furthermore creates issues in regard to human rights and corruption, is a serious concern to us and our partners and stakeholders. We promote responsible and sustainable supply chains, and in all parts of our value chain, we do what we can to prevent negative impacts on people, the environment, and society. We want our customers to be confident that our products are sourced and produced responsibly.
At Reitan Retail one of eight fundamental business values is “keep high moral standards”. This entails promoting responsible trade and collaboration across our value chain, and contributing to making local communities prosper. It is our job to ensure that all workers throughout our supply chains face fundamental human rights and decent working conditions. Hence, we follow the UN Guiding Principles on Business and Human Rights that set expectations of states and companies on how to prevent and address negative impacts on human rights by businesses. Furthermore, the environment and surrounding communities should be protected and cared for during the production of the goods we sell, and animal welfare should be assured throughout the whole supply chain.
Challenges and opportunities
Our sectors have an impact on the environment and people that contribute to climate change and risks of human rights violations. We need to reduce the overuse of natural resources and emissions while addressing any instances of forced or child labour. By consistently evaluating and assessing our value chain, we are getting better at identifying human rights challenges and collaborating to promote better practices for people and the planet.
We remain committed to tackling sustainability and human rights challenges in our value chain by continuously ensuring our sourcing promotes the wellbeing of people and the planet.
We have a high level of business morale and hold our suppliers accountable to our rigorous ethical code of conduct in order to offer responsibly produced products to our customers.
2022 highlights
REMA 1000 Denmark - Offers 113 animal welfare labelled products in the basic assortment, which is an increase of 31 percent.
REMA 1000 Norway, Reitan Convenience Norway and Uno-X Mobility - All Norwegian business areas have improved processes and routines to ensure that fundamental human rights and decent working conditions are in place at sites where our products or services are produced. This is in accordance with the new Åpenhetsloven (The Transparency Act) that came into force on the 1st of June 2022. See more on page 204
Reitan Convenience - During 2022 all markets worked together with suppliers to map the assortment. This will enable a systematic approach to enhance a more sustainable assortment, with less red meat and more vegetarian options in our food products in all countries.
TARGETS
We want to help prevent deforestation and work to reduce the use of soy in feed and palm oil in the products sold in our companies.
We will integrate the OECD Due Diligence Guidelines for responsible business conduct into our risk management processes. Our ambition is to screen 100 percent of our suppliers based on environmental and social criteria. Reitan Retail has a zero-tolerance approach to any breach of human rights, and we strive to minimise our environmental impact across the value chain.

67 Our responsibility Our business Corporate Governance Financial statements Appendix
At Reitan Retail one of eight fundamental business values is “keep high moral standards”.
Responsible sourcing
In order to be a responsible business, we must look beyond our own direct impacts and find ways to play a bigger role. Through a circular approach to our value chain, we must work closely with our stakeholders. We need to address our impact from a more holistic perspective by including the impact on the local environment and suppliers’ income security. There are many interesting initiatives and projects that can create more sustainable, renewable, and circular solutions in our value chain.
For Reitan Retail animal welfare is a priority. Animal welfare is becoming more regulated and has a growing customer awareness. When it comes to chicken welfare, we have made a lot of progress in improving living conditions for chickens in Norway. Our welfare standards were fully approved by the European Chicken Commitment (ECC) and we are now the first company to globally transform 100 percent of our production.
We want to go further than regulatory requirements to improve animal welfare in our value chain and have set ambitious environmental targets towards more sustainable food systems so that we can help lead our industry.
REMA 1000 NORWAY
NORSK KYLLING MEETS STRICTER ANIMAL WELFARE STANDARDS
In 2022, all chickens in REMA 1000 Norway owned Norsk Kylling’s (Norwegian Chicken) value chain, began to be produced in accordance with animal welfare requirements in the European Chicken Commitment (ECC). The ECC production is sold under the two popular brands Solvinge and Stange exclusively for REMA 1000 Norway. Norsk Kylling is a food manufacturer of broiler chickens and the first industrial producer in the world to transform 100 percent of the production to meet the new, stricter animal welfare standards in the chicken industry. The standard was developed in collaboration with animal welfare organisations. Norsk Kylling has continued to work for improved animal welfare after they switched to a slower-growing chicken breed in 2018, and the aim is to create the world’s best value chain for food production. In close cooperation with the 136 central Norwegian farmers who supply the chicken, Norsk Kylling wants to ensure sustainable and responsible production of chicken, thereby providing our customers with healthy and safe food of the highest quality at the best price.
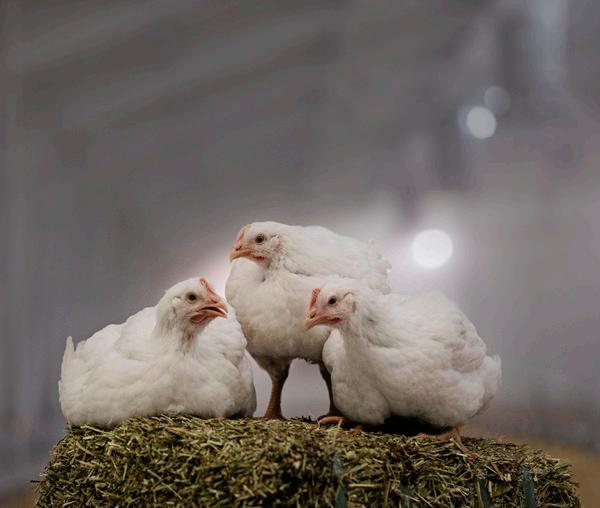
We have put our heart and soul into this project, not least investing time and money. We are delighted that we are now getting the desired result, namely a value chain for white meat entirely different from the one we experienced just a few years ago in our system, with best-in-class animal welfare.
Ole Robert Reitan CEO of Reitan Retail
68
2.5 Value chain
NORSK KYLLING VISION
Our ambition is to create a green value chain which sets a new environmental standard for all future food industries. We will achieve this with the following executive goals:
Climate positive. We will not contribute to an increase of greenhouse gases in the atmosphere but contribute to a reduction.
Nature neutral. We will not reduce biodiversity but have a positive impact.
Renewable. We will develop a value chain which uses clean energy, mainly self-produced or excess energy from others.
Area. We will reduce our footprint by 30 percent while still meeting our customers’ increased demand for sustainable chicken.
Circular economy. We will be world-leading in resource efficiency.

69 Our responsibility Our business Corporate Governance Financial statements Appendix
Reducing impacts in our supply chain
finding science-based solutions to more sustainable food production systems. We have a responsibility as a business to continue making our value chain and sourcing practices more sustainable.
As the majority of deforestation is linked to risk products such as meat, soya beans, and palm oil, we need to focus on reducing these and finding source options with a smaller impact on nature. Besides meat and dairy, palm oil is found in nearly 50 percent of supermarket packaged products, and when not produced sustainably, it can have a destructive and damaging impact on forests1. Through certifications and collaboration with suppliers, as well as a total ban on palm oil in biofuels and in some of the markets, we work to reduce the use of soy in feed and palm oil in the products sold in our companies and help prevent deforestation.
Reitan Retail business areas have for many years worked for supply chain transparency and to prevent deforestation. Enhanced collaboration with suppliers and a continued effort across the group is essential in order to achieve these goals. Innovation is key to
Looking ahead we will continue collaborating with suppliers on better ways to use soy and new protein sources. We will calculate the impact by identifying products that depend on soy and palm oil. Another approach we apply is to use certifications and documentation across all business areas and implement a minimum deforestation policy across business areas.
REMA 1000 NORWAY
REMA DISTRIBUTION – AI TO MAXIMISE ENERGY USE
The Vinterbro distribution center in Østlandet, Norway is a vast premise with over 60,000 square meters. It also has 13,000 square meters of solar cell panels on the roof, which contributes to annual CO2 savings of 230 tons in REMA 1000’s value chain. By working with automation and AI, REMA Distribution has developed an algorithm that understands when there is high activity at the center and electricity prices are increasing to even out our energy consumption and avoid expensive power peaks.
We have an energy-demanding business, and much is being done to find the best energy sources. The first thing we want to do is to reduce energy consumption and even it out. In our value chain, we are working to find a good mix to reduce energy consumption, source renewable energy and increase our green goods transport.
Synnøve Gautesen Berg Head of Sustainability at REMA Distribution Norway
70
TARGET
We want to help prevent deforestation and work to reduce the use of soy in feed and palm oil in the products sold in our companies.
1 WWF 2.5 Value chain
REMA 1000 DENMARK
ORGANIC COW FEED
The current soy production in the world is a contributing factor to the global threat of deforestation and loss of biodiversity. The threat to natural vegetation is also connected with irresponsible use of pesticides and other sustainability issues. Gram Castle, one of the biggest organic farms in Denmark and co-owned by REMA 1000 Denmark, has stopped the use of imported soybeans as an ingredient in organic cow feed. The 1,200 cows now eat plants from the local ecosystem, like clover grass, peas, lupins, rape, and beans in addition to hay and corn, all grown locally in the fields surrounding Gram.
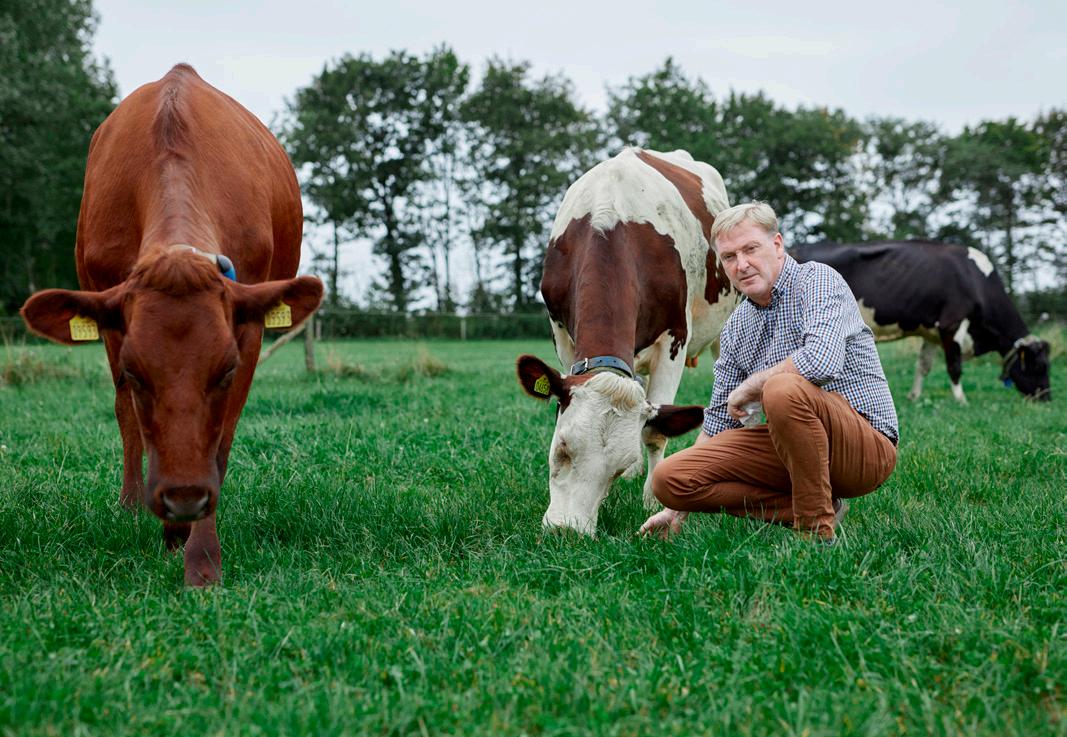
In the past, the animals were fed with locally grown crops. We would like to return to that. We believe that the local connection is good for the animals and the environment, and therefore, in the long run, produce far better quality at the same price.
Svend Brodersen Farmer and landowner at Gram Slot
71 Our responsibility Our business Corporate Governance Financial statements Appendix
Integrating due diligence
There is a growing global focus on gaining a better understanding and insight into the impacts on people and the environment in companies’ value chains. We at Reitan Retail believe it is a welcome and needed push. We are convinced it will lead to increased transparency and a reduced risk for people that work in and contribute to our value chain to be treated badly, or for nature to be exploited or misused.
For us at Reitan Retail, being a responsible business is key, and new demands are constantly placed on us as a major player. We have prioritised responsible business conduct and practices by building awareness in our business – internally as well as externally. Mandatory training is given to everyone who works with purchasing within relevant topics. In the purchase process, we use criteria to identify and make us pay attention to suppliers that source products or raw materials from areas with strained conditions for land and forests, biodiversity and water, as well as higher risk of child labour, corruption and forced labour.
Our approach is to align with internal frameworks and local regulations. One part of this is to integrate the OECD Due Diligence Guidelines for responsible business conduct into our risk management processes. By basing our work on the UN Guiding Principles on Business and Human Rights, we set expectations to prevent and address negative impacts on human rights by businesses in our value chain. With our Supplier Code of Conduct (SCoC) used in Reitan Retail’s business areas, and their subsidiaries’ we set a standard for ethical business manners.
The Transparency Act (Åpenhetsloven)
Reitan Retail’s business areas with operations in Norway and Uno-X Mobility’s Danish organisation have assessed their needs for initiating processes to ensure compliance with the Act. Based on sector, in which the business areas operate, there are different perceptions of risk handling, need for technical solutions and involvement of colleagues. A compliance plan is established in our Norwegian companies and Uno-X Mobility’s Danish
72
TARGET
We will integrate the OECD Due Diligence Guidelines for responsible business conduct into our risk management processes. Our ambition is to screen 100 percent of our suppliers based on environmental and social criteria. Reitan Retail has a zerotolerance approach to any breach of human rights, and we strive to minimise our environmental impact across the value chain.
2.5 Value chain
To meet the purpose and demands of the Act, prioritised risk evaluation and due diligence assessments has given us a first valuable context of Reitan Retail’s operations in Norway. With operations in the sectors food and agriculture, fuel and mobility, our supply chains are global, complex and not least exposed to climate change. Challenges linked to forced labour, child labour, corruption, freedom of association, discrimination, living wage and environmental
destruction are great in this sector, and with the consequences of climate change they are destined to increase in the years to come. Risk mapping and prioritisation is a continuous process for conducting due diligence assessments to cease, prevent and mitigate adverse impact on fundamental human rights and decent working conditions. Read more about our initial findings on page 204.
Reitan Retail’s account of the due diligence assessments carried out according to the Transparency Act will be published on reitanretail.no by 30 June, 2023.

73 Our responsibility Our business Corporate Governance Financial statements Appendix DUE DILIGENCE PROCESS AND SUPPORTING MEASURES Communicate how impacts are addressed Identify and assess adverse impacts in operations, supply chains and business relationships Provide for or cooperate in remediation when appropriate Cease, prevent og mitigate adverse impacts Track implementation and results Embed responsible business conduct into policies and management systems 1 5 2 3 4
organisation, anchored in their respective boards and the business area’s board.

74
Corporate governance
3.1 Letter from the Chair
3.2 Governing bodies
3.3 Risks and risk management
3.4 Governing documents

75 Our responsibility Our business Corporate Governance Financial statements Appendix
3.1 Letter from the Chair
My first year as Chair of Reitan Retail has been an encouraging introduction to a fascinating company with a proud past and exciting opportunities ahead.
A strong culture with highly engaged people at all levels of the organization, driven by a relentless focus on cost and efficiency, provides a firm platform for competitiveness and growth. The year was marked by steady progress on the company’s growth agenda, despite a turbulent external environment, hit by war in Europe, global inflation and a highly competitive landscape.
2022 was only the second year in operation for Reitan Retail as one combined Nordic and Baltic retail group, with a broad portfolio within discount grocery, convenience and mobility. I’m pleased by the progress in developing a governance structure and systems combining all business areas in one group with common goals and culture. The company is well-positioned to take advantage of opportunities across the value chain.
The Board of Directors has overseen the processes to develop and gradually implement systems necessary to comply with governance, values and strategy. Thanks to tremendous efforts by a committed and resilient organisation and management, the company has come a long way in preparing for a potential initial public offering when the time is right. Work remains, but I am confident that Reitan Retail is on the right track for its next chapter.
Throughout the year, the company has made important strategic moves based on its commercial and value-driven mindset and strategic framework. A highlight was REMA 1000 Denmark’s agreement to acquire German ALDI’s Danish discount grocery network.
The planned acquisition, conditional on regulatory approval, is an excellent example of the scalability of Reitan Retail’s business model, illustrating a promising future growth potential.
Looking ahead, Reitan Retail has embarked on an exciting plan for improvement and growth, including a focus on efficiency and profitability across all business areas, while preparing to grow in areas with long-term potential in a zero-emission future, such as EV charging. I am pleased to see the balance between short-term improvement efforts and long-term strategic focus, building resilience and robustness for 2023 and beyond.
I am impressed with the progress made in the past year. I would like to complement dedicated franchisees, employees and management for their efforts and commitment to preparing Reitan Retail for the future. I’m looking forward to the next year and the next chapter.
Rune Bjerke Chair of the Board of Directors
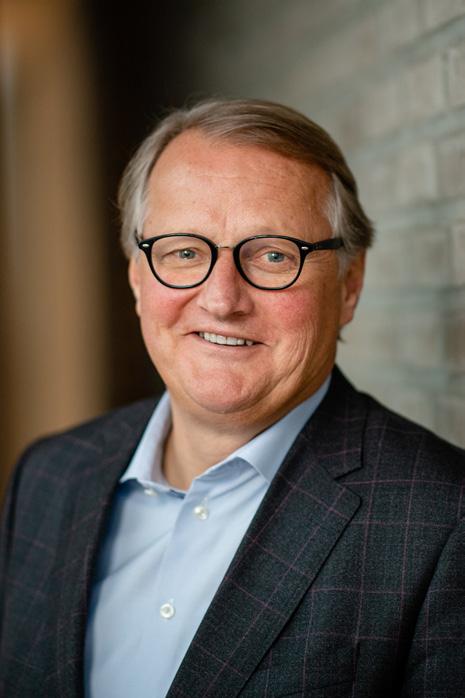
76
3.1 Letter from the Chair
3.2 Governing bodies
Reitan Retail AS is a fully owned subsidiary of REITAN AS, owned by the Reitan family. Odd Reitan, Ole Robert Reitan, and Magnus Reitan, with his family, each own 33.3 percent of the shares in REITAN AS through their individually owned holding companies.
Reitan Retail is organised with a parent company, Reitan Retail AS, responsible for overall corporate governance. Subsidiaries that are defined as core business areas are referred to as business areas (BA). These are REMA 1000 Norway, REMA 1000 Denmark, Reitan Convenience and Uno-X Mobility. Each business

area is led by an executive vice president and chief executive officer (CEO). In addition, the Group holds a portfolio of retail properties in Norway and Denmark presented as a separate segment, Real Estate, being reported separately to the CFO of Reitan Retail.
Reitan Retail follows REITAN´s philosophy and organises its activities in a way that makes the distance between accountability/authority and operational execution as short as possible. This involves establishing and complying with routines and internal control in all areas of the organisation. Robust routines ensure ongoing and continuous follow-up of the Group and that the management is always provided with the best available information for decision-making. Read more about our business on pages 14-19, Business overview
77 Our responsibility Our business Corporate Governance Financial statements Appendix
Management model
Reitan Retail is led by Chief Executive Officer (CEO) Ole Robert Reitan. The CEO is responsible for the day-to-day management of Reitan Retail AS in accordance with applicable legislation and the guidelines, instructions and authorisations given by the Board of Directors of Reitan Retail AS. The CEO is also responsible for the Executive Management Team of Reitan Retail. The Board of Directors oversees the overall management of Reitan Retail AS.
Executive Management Team
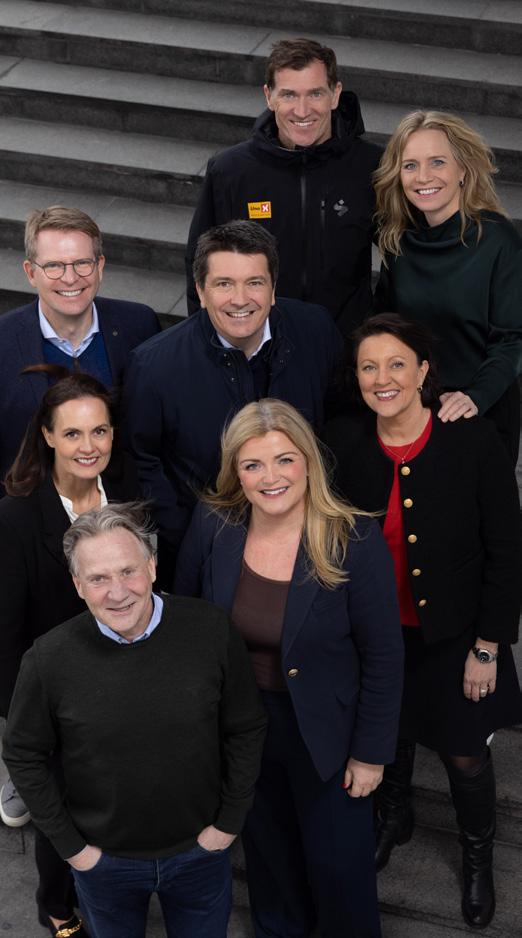
Reitan Retail has an executive management team which acts as an advisory management body for the CEO and assist and support the CEO in carrying out the day-to-day management and decision-making of Reitan Retail. The Group CEO appoints and determines the composition of the Executive Management Team. The board of each business area appoints the CEO for the respective business area.
The Executive Management Team of Reitan Retail consists of Group CEO Ole Robert Reitan, Executive Vice President (EVP) and Chief Financial Officer (CFO) Kristin S. Genton, EVP and Chief Operations Officer (COO) Monica Ødegaard, EVP and Chief Communications Officer (CCO) Inger Sethov, EVP and CEO of REMA 1000 Norway Tom Kristiansen, EVP and CEO of REMA 1000 Denmark Henrik Burkal, EVP and CEO of Reitan Convenience Mariette Kristenson, and EVP and CEO of Uno-X Mobility Vegar Kulset.
The members of the executive management team have a collective duty to safeguard and promote the corporate interest of Reitan Retail and to promote Reitan Retail’s strategic, financial, and other objectives and targets. In addition, the role of the Executive Management Team is to:
• Provide support and advice to the Group CEO regarding overall leadership, strategic development, and the annual planning and reporting cycle.
• Provide governance and strategic support to the BAs in respect of finance, accounting, tax, sustainability, HR, compliance, communication, and investor relations.
• Ensure that Reitan Retail is properly organised and that adequate steering, risk management and control systems are in place to provide a sufficient basis for an overview of risk exposures and compliance with applicable laws and regulations.
78
3.2 Governing bodies
Board of Directors
The Board of Directors is obliged to ensure that the activities of Reitan Retail are properly organised, approve plans, keep itself informed about Reitan Retail’s financial position and ensure that the operations, accounts and asset management are subject to adequate control. The Board issues guidelines for the activities of Reitan Retail AS. The Board meets as often as required by operations or when any board member or the CEO so demands.
The current Board of Directors will be complemented in due time. The planned expansion will aim to reflect diversity in competence, age, gender and background.
The Board of Directors of Reitan Retail consists of:
Rune Bjerke (b. 1960), Chair of the Board
Education: Social economics from the University of Oslo and a master’s degree (MPA) from Harvard University.
Former experience: Finance counsellor in Oslo and business leader, most recently as CEO of DNB from 2007-2019.
Current assignments: Chairman of the board of Wallenius Wilhelmsen and Deputy Chairman of the boards of Norsk Hydro and Schibsted.
Eilert Giertsen Hanoa (b. 1970), member of the Board
Education: Economics from BI Business School, Oslo.
Former experience: He started his first IT company as a 15-year-old. He founded and led Mamut until the company became part of Visma in 2011, where he was head of Visma SMB until 2018.


Current assignments: CEO of the global learning platform company Kahoot. Hanoa has a true passion and understanding of entrepreneurship.
Magnus Reitan (b. 1975), member of the Board
Education: Economics from NHH Norwegian School of Economics, Bergen, and BI Business School, Oslo.
Former experience: CEO, Reitan Convenience, CFO, Reitangruppen.
Current assignments: CEO of Reitan Kapital.
79 Our responsibility Our business Corporate Governance Financial statements Appendix
3.3 Risks and risk management
Risk management
Identifying and managing risks is an integral part of strategic planning as well as control and management of the business.
Risk management and internal controls are given high priority by the Board of Directors, which is responsible for ensuring that adequate systems for risk management and internal controls are in place. Reitan Retail’s management is responsible for establishing and maintaining sufficient internal controls.

Reitan Retail’s internal control and systems for risk management aim to ensure compliance with the corporate values, ethical guidelines and guidelines for corporate social responsibility. The Code of Conduct describes Reitan Retail’s ethical commitments and requirements related to business practice and personal conduct. If employees experience situations or matters that may be contrary to rules and regulations or the Code of Conduct, they are urged to raise their concerns with their immediate superior or another manager or through the whistle-blowing function.
The Chief Executive Officer and Chief Financial Officer supervise and oversee the external reporting and internal reporting processes. This includes assessing financial reporting risks and internal controls over financial reporting within the Group. The consolidated external financial statements are prepared in accordance with International Financial Reporting Standards (IFRS) and International Accounting Standards as adopted by the EU.
Financial risks are presented in Note 3 – Financial risk management in the notes to the consolidated financial statements.
80
3.3 Risks and risk management
The Code of Conduct describes Reitan Retail’s ethical commitments and requirements related to business practice and personal conduct
3.4 Governing documents
Governing documents
Reitan Retail follows a set of governance documents providing a foundation for sound operations and decentralised decision-making.
Reitan Retail´s global governance documents set out mandatory requirements for Reitan Retail AS and all Reitan Retail companies and employees. Local governance documents set out mandatory requirements within a specified entity, business area, organisational unit or geographical area.
The most central governance document for Reitan Retail is the Code of Conduct, which is aligned with our values and mandatory for everyone who works on behalf of Reitan Retail and our subsidiaries.
Compliance with the Code of Conduct is followed up annually by the Executive Management Team, and the Board follows up on deviations from the code. All employees can report any deviations from the Code of Conduct using the whistleblowing function.
Read more about our governance documents on our website.
Sustainability governance
The highest-level management position responsible for sustainability-related issues is the CEO, and the Executive Management Team has a collective responsibility to deliver upon the sustainability goals for Reitan Retail.
Responsibility and sustainable business development are part of strategic business planning that is decided and followed up by both the Executive Management Team and the Board of Directors. Follow-up and analysis of how the business develops take place at different levels and with different frequencies. The Board of Directors reviews the current status of the sustainability group targets and follows up on progress and governance on a regular basis.
Regular status meetings and quarterly sustainability forums are held with sustainability managers in the business areas together with the group head of sustainability, group ESG controller and other relevant contributors. These forums represent arenas for sharing knowledge and best practices, as well as collaborating across business areas and geographical borders. In addition, the forums provide guidance on policy orientation and annual strategy activities in the respective business areas to the Executive Management Team and the Board of Directors.
Responsibility and sustainable business development are part of strategic business planning that is decided and followed up by both the Executive Management Team and the Board of Directors
81 Our responsibility Our business Corporate Governance Financial statements Appendix

82
Financial statements
4.1 Board of Directors’ report
4.2 Consolidated financial statements
4.3 Parent company financial statements
4.4 Auditor´s report

83 Our responsibility Our business Corporate Governance Financial statements Appendix
4.1 Board of Directors’ report
Introduction
Reitan Retail (the Group) is a leading retail company in the Nordic and Baltic regions. Reitan Retail’s operating model is based on a unique franchise model, the Reitan Format Franchise Model.
The core business is within retail operations, including REMA 1000 Norway, REMA 1000 Denmark, Reitan Convenience and Uno-X Mobility, in addition to a real estate portfolio in Norway and Denmark to support the core business.
REMA 1000 is a Norwegian pioneer in franchise-based retailing. As the inventor of discount grocery in Norway, REMA 1000 Norway is the country’s number one discount grocer in terms of market share (total traditional grocery market from Nielsen IQ, Dagligvarerapporten 2023, and internal data).
Based on the same franchise model, REMA 1000 Denmark is a fast-growing discount grocer, ranked among Denmark’s strongest and most sustainable brands.
Reitan Convenience is a leader in operating franchisebased convenience and has number one positions in most markets in the Nordic and Baltics, operating a range of well-known kiosk and convenience brands.
Uno-X Mobility has a leading mobility platform in Norway and Denmark, with operations in liquid fuel, lubricants, Nordic Swan ecolabelled car wash and a recent launch of ultrafast EV charging.
The real estate business operates a portfolio with the aim of meeting Reitan Retail’s long-term need for properties in the right locations and catering for further growth.
At the end of 2022, Reitan Retail spanned 3,801 sales outlets, of which 2,375 were operated by franchisees, 481 by dealers and commission-based retailers and 945 by the Group. Reitan Retail and our franchisees together employed around 43,500 people in seven countries. We are present in people’s everyday lives – at home, on the go and on the road – with around 2 million transactions every day. Through strong values, efficient operations and local ownership, our aim is to create the best customer experiences and contribute to a more sustainable future. Our purpose is to make everyday life a little bit easier and the world a little bit better.
Reitan Retail AS (The Company) is a wholly owned subsidiary of REITAN AS. From 1 January 2021, all retail activity in REITAN was combined in one company, Reitan Retail. A more coordinated retail company will ensure that REMA 1000 can offer even lower prices, that the convenience stores can offer an even better selection of food, drinks and other products to people on the go, and that Uno-X Mobility can strengthen its position as the most efficient and uncomplicated player in liquid fuel, ultrafast EV charging and Nordic Swan Ecolabelled car wash.
In November 2020, REITAN AS announced an intention to explore the possibility of publicly listed shares in Reitan Retail AS, making a minority of the shares available to other shareholders.
84
4.1 Board of Directors’ report
Reitan Retail’s strategy, together with its franchisees, is to create profitable and sustainable growth by strengthening our competitive position and renewing our portfolio through the following measures:

Strengthen our culture and develop our franchise system
Strengthen competitiveness through lower costs and better terms
Establish new sales outlets and renew existing portfolio to boost average systemwide sales
Strengthen and renew formats to meet growing customer needs
Strengthen and renew the digital customer experience
Implement ambitious sustainability measures across the entire organisation
85 Our responsibility Our business Corporate Governance Financial statements Appendix
Franchise – our main competitive advantage
The Reitan Format Franchise Model has been the heart and key driver of the Group’s successful development since the first REMA 1000 store opened in Norway in 1979. Reitan Retail was the first grocery company in Norway to implement franchising and streamlined this model of operation through the business area REMA 1000. REMA 1000 is the only purely franchise-based grocery player in the Nordics. Franchise is also the main operating model for Reitan Convenience.
The franchise model is a win-win partnership, enabling us to benefit from large-scale economies, but also agility and small-scale economies due to a decentralised decision-making structure with aligned performance incentives for the franchisor and franchisees.
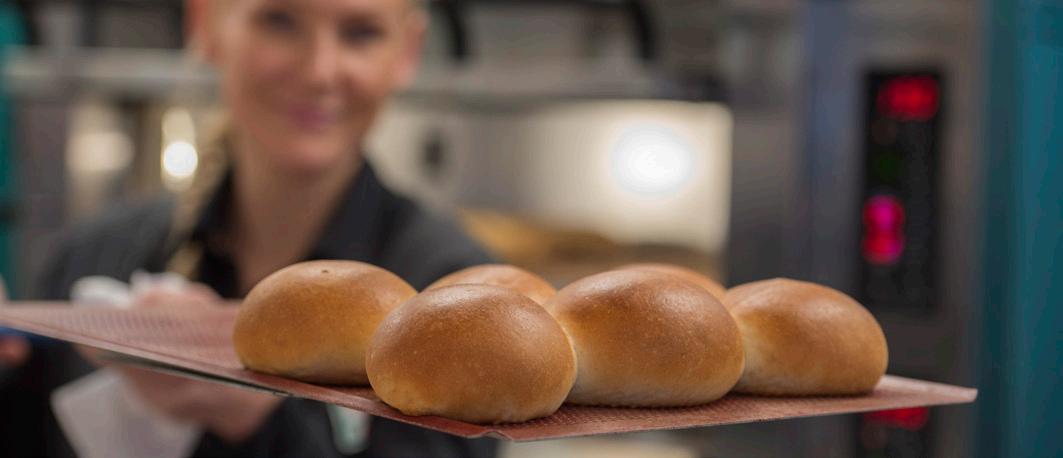
Franchising represents a close collaboration between two independent parties, the franchisor and the franchisee. Franchising is about striking a balance between the freedom to make individual choices and the obligation to follow defined systems operations. The franchisee is self-employed but must comply with the concept and philosophy established by the franchisor.
For more information about our Reitan Format Franchise Model, see page 19.
The Reitan values
Reitan Retail is a value-driven company. Our values are the foundation for making customers, employees and partners feel valuable, creating long-term financial value and conducting our activities with integrity.
We have eight values that define and guide us:
1. We stick to our business model
2. We keep high moral standards
3. We are committed to be debt-free
4. We encourage a winning culture
5. We are positive and proactive
6. We talk with each other, not about each other
7. The customer is our ultimate boss
8. We work for fun and profit
Our values describe what we believe is worth striving for. These values are our internal compass, guiding our mindset, emotions and decisions. Clearly defined values are the basis for a strong culture.
For more information about our Values, see Page 18.
86
4.1 Board of Directors’ report
Financial position of the group
Reitan Retail’s financial statements are prepared in accordance with the International Financial Reporting Standards (IFRS) as adopted by the EU.
In the view of the Board of Directors, the Group has a solid financial position. In accordance with Section 3-3a of the Norwegian Accounting Act, the Board confirms that the prerequisites for the going-concern assumption exist and that the financial statements have been prepared based on a going-concern basis.
The Group’s result and financial position are affected by uncertainty, especially related to accounting estimates when determining the impairment of nonfinancial assets and incremental borrowing rate to measure lease liabilities and contingent liabilities.
Profit or loss
The Group’s revenue in 2022 was NOK 94,367 million, an increase compared to NOK 81,502 million in 2021 and corresponding to a growth of 6.7 percent in 2022 and 1.4
percent in 2021. Growth in revenue is calculated using a constant foreign exhange rate, please see the section Performance measures and definitions for further details and reconciliation. Operating profit before amortisation, depreciation and impairment (EBITDA) was 8,262 million in 2022, compared to NOK 8,216 million in 2021. Operating profit was NOK 3,597 million in 2022, compared to NOK 3,840 million in 2021. Development in key figures of the Group’s segments is discussed in more detail below.
Net financial items in 2021 amounted to NOK -1,141 million in 2022, compared to NOK -554 million in 2021. Net interest expenses in 2022 amounted to NOK 960 million and NOK 890 million in 2021. Net interest expenses include interest expenses on lease liabilities with NOK 811 million in 2022 and NOK 799 million in 2021. Net losses on financial investments amounted to NOK 246 million in 2022 compared to a net gain of NOK 200 million in 2021, and includes unrealised losses on financial assets of NOK 249 million in 2022 compared to an unrealised gain of NOK 195 million in 2021. Net other financial items amounted to NOK 65 million in 2022 and NOK 146 million in 2021. Net other financial items include mainly unrealised currency gains on financing activities, with NOK 65 million in 2022 and NOK 138 million in 2021.
Profit before taxes amounted to NOK 2,456 million in 2022 and NOK 3,296 million in 2021. The Group’s profit for the year was NOK 1,845 million in 2022, compared to NOK 2,645 million in 2021.
94,367 mill. in revenue in 2022
Comprehensive income
Net other comprehensive income for the year, net of tax, was NOK 286 million compared to a loss of NOK 250 million in 2021, of which foreign currency translation effects amounted to a gain of NOK 304 million in 2022 and a loss of NOK 312 million in 2021. Total comprehensive income, net of tax in 2022 amounted to NOK 2,131 million compared to NOK 2,395 million in 2021.
87 Our responsibility Our business Corporate Governance Financial statements Appendix
Profit for the year attributable to: 2022 2021 Equity holders of the parent 1,831 2,612 Non-controlling interests 14 33
Comprehensive income attributable to: 2022 2021 Equity holders of the parent 2,116 2,363 Non-controlling interests 15 32
Cash flow and investments
Cash flow from operating activities (before interest and income tax) in 2022 amounted to NOK 5,846 million, compared to NOK 6,855 million in 2021. Cash flow from operating activities differs from Operating profit before amortisation, depreciations and impairments (EBITDA) in the statement of profit or loss as EBITDA includes net gains (losses), share of profit of associates, and revaluation of investment properties.
Net cash flow from investing activities in 2022 amounted to NOK -2,045 million, compared to NOK -2,145 million in 2021. The Group invested a total of NOK 3,042 million in intangible assets, investment property and property, plant and equipment in 2022 compared to NOK 3,252 million in 2021. Of total investments in investment property and property, plant and equipment, NOK 915 million relates to real estate investments in 2022 and NOK 937 million in 2021. Proceeds from sale of intangible assets, investment property and property, plant and equipment amounted to NOK 899 million in 2022 and NOK 889 million in 2021, of which NOK 793 million relates to real estate in 2022 compared to NOK 743 million in 2021. Net purchase of associated companies amounted to NOK 51 million in 2022, compared to net proceeds of NOK 61 million in 2021. Dividends received from financial investments and associates in 2022 amounted to NOK 72 million and NOK 152 million in 2021.
Net cash flow from financing activities amounted to NOK -2,608 million in 2022, compared to NOK -4,857 million in 2021. The Group’s ability to finance its own investments is considered good.
Balance and liquidity
As of 31 December 2022, total assets amounted to NOK 57,529 million compared to NOK 52,785 million as of 31 December 2021.
Cash and cash equivalents as of 31 December 2022 amounted to NOK 1,220 million compared to NOK 1,097 million as of 31 December 2021. In 2022, NOK 105 million relates to restricted cash, as described in Note 21 – Cash and cash equivalents. As of 31 December 2022, undrawn borrowing facilities amounted to NOK
6,353 million compared to NOK 7,471 million as of 31 December 2021.
By the end of 2022, total equity amounted to NOK 14,096 million compared to NOK 12,190 million as of 31 December 2021. This is equal to an equity ratio of 24.5 percent as of 31 December 2022 and 23.1 percent as of 31 December 2021.
Normalisation after Covid-19
The outbreak of Covid-19 and the measures adopted by governments in countries worldwide to mitigate the pandemic’s spread impacted our business significantly in 2020 and 2021, and to a lesser extent in 2022. While mobility restrictions and lockdown measures led to closed stores and a steep reduction in customers within convenience, grocery experienced a strong volume growth compared to pre-pandemic levels.
In the first months of 2022, mobility restrictions and lockdown measures were again implemented across the countries where Reitan Retail operates, but during the remainder of the year, we experienced a gradual normalisation with customer behaviour moving towards pre-Covid-19 patterns.
Throughout the pandemic, our primary focus has been the safety of our colleagues and customers, while at the same time delivering on our critical role in society of distributing food and fuel and ensuring business continuity. A task we have been able to deliver on through the tireless efforts of 43,500 people across our organisation.
Reitan Retail is a robust and resilient company, well equipped to handle challenging times. No direct effects of the Covid-19 pandemic have resulted in any significant impairment loss on carrying amounts of property, plant and equipment or intangible assets. Nor have any material effects of the Covid-19 pandemic affected the carrying amounts of financial assets.
The war in Ukraine
Our people quickly mobilised and adapted to the new situation that arose following Russia’s invasion of Ukraine on February 24, 2022. As always, our top
88
4.1 Board of Directors’ report
priority has been and is the safety and security of our people, especially employees and franchisees in Finland and the Baltic countries, where uncertainty is particularly high due to the proximity to the war.
Reitan Retail does not have people, assets or operations in Russia or Ukraine and hence is not directly affected by the invasion of Ukraine, and the share of direct purchases from Ukraine is very low in Reitan Retail’s supply chain. However, Reitan Retail is, together with the entire industry, impacted by the overall inflationary situation, including more challenging sourcing and logistics and increased prices for the majority of products. In addition, the war has also resulted in increased energy prices, which is also impacting Reitan Retail and Reitan Retail’s suppliers.
Statement of objections from the Norwegian competition authority
On 15 December 2020, The Norwegian Competition Authority sent statements of objections to REMA 1000 and the two other main grocery players in Norway related to the chains’ use of “price hunters”. The Competition Authority in considering imposing a fine of NOK 7,371 million to REMA 1000 Norway AS and REITAN AS, where the companies will be jointly and severally liable for the entire amount. The Company has made no provision in respect of the statement of objections as of 31 December 2022, as it considers not to have any liability. See Note 33 – Contingent liabilities.
Our segments´ performance
The key figures for the Group’s business areas consist of both IFRS measures and alternative performance measures (APMs). The following APMs are referred to in the next sections: Systemwide sales, growth in systemwide sales, like-for-like growth in systemwide sales, total systemwide and distribution sales, and growth in revenue. In addition, the Group closely monitors the non-financial performance measure number of sales outlets. See the section Performance measures and definitions for further details on all of the Group’s APMs and non-financial performance measures.
Systemwide sales represents sales in all sales outlets under concepts and banners controlled by the Group, whether operated by the franchisees, the Group, dealers or commission-based retailers.

Total systemwide and distribution sales consists of systemwide sales and distribution sales. Distribution sales is the Group’s sale of goods to other external customers not included in systemwide sales.
To exclude the impact of foreign currency translation, growth in systemwide sales, like-for-like growth in systemwide sales and growth in revenue is measured in local currency.
Sales from franchise-operated sales outlets are reported by the franchisees and represent their revenues from sales at franchise-operated sales outlets. Sales from franchise-operated sales outlets are not recorded as revenue by Reitan Retail and are not included in the Group’s consolidated financial statements. However, the Group’s revenue from sale of franchise services is computed based on the sales made by the franchisees and, as a result, sales from franchise-operated sales outlets have a direct effect on the Group’s revenue from sale of franchise services and profitability. The systemwide sales measure allows management to assess changes in the Group’s overall system performance, the health of our concepts and brands, the financial health of the franchisee base and the strength of our market position relative to our competitors.
89 Our responsibility Our business Corporate Governance Financial statements Appendix
Sales outlets includes all stores and mobility locations under concepts and banners controlled by the Group, whether operated by franchisees, the Group, dealers, or commission-based retailers.
REMA 1000 Norway
Systemwide sales in 2022 were NOK 47,401 million and NOK 47,642 million in 2021, corresponding to a growth of -0.5 percent in 2022 and -1.6 percent in 2021. Like-forlike growth in systemwide sales was -1.7 percent in 2022 and -2.4 percent in 2021, following a 15.7 percent growth in 2020. Total systemwide and distribution sales in 2022 were 51,990 million compared to NOK 51,309 million in 2021. Both systemwide sales and total systemwide and distribution sales in 2022 were impacted by high levels of inflation as well as a normalisation following two years strongly impacted by pandemic-related restrictions, with increasing cross-border trade with Sweden and recovery of sales in channels like cafes and restaurants. In addition, REMA 1000 Norway had a strong momentum during 2022, increasing its market share in the Norwegian grocery market by 0.6 percent, from 22.9 percent in 2021 to 23.5 percent in 2022 (total traditional grocery market from Nielsen IQ, Dagligvarerapporten 2023, and internal data). The number of sales outlets at the end of 2022 was 668, up from 657 at the end of 2021.
REMA
1000 Norway’s revenue in 2022
was NOK
34,986 mill, compared to NOK 34,764 million in 2021, corresponding to a growth in revenue of 0.6 percent in 2022 and 1.0 percent in 2021. This reflects the similar development as for systemwide sales and distribution sales mentioned above, with the addition of increased volumes from Kolly in the HoReCa (Hotels, Restaurants, Catering) market, having its first deliveries in February 2022. Operating profit before amortisation, depreciation and impairment (EBITDA) was NOK 3,840 million in 2022, compared to NOK 3,896 million in 2021. Operating profit was NOK 1,699 million in 2022, compared to NOK 1,841 million in 2021. The results in 2022 are somewhat below the previous year, mainly due to covid effects tapering off and negatively impacting systemwide sales growth, strong competition in the Norwegian grocery market and general cost inflation. Improved performance at the Norsk Kylling (Norwegian Chicken) plant contributed positively to operating profit in 2022.
REMA 1000 is the largest grocery banner in Norway. Continuous development of the REMA 1000 concept through assortment, digitalisation and simplification will contribute to an improved shopping experience for customers and increased efficiency throughout the entire value chain. Establishing new stores in attractive locations will also be a strategic priority.
2023 has started off with fierce price competition in the Norwegian grocery market, putting pressure on earnings. REMA 1000 Norway always targets to deliver the lowest price to our customers and will do our utmost to deliver on this promise by ensuring we maintain our position as the leanest and most cost efficient-grocery player.
The close collaboration with fully and partially with owned and exclusive suppliers will be further developed through REMA Industrier, and we expect further improved operations at Norsk Kylling (Norwegian Chicken) following the start-up of the plant in 2021, making sure we deliver high-quality and sustainable poultry at low prices to our customers.
In addition, we will continue developing our HoReCa business through Kolly, having its first deliveries to the hotels, restaurants and catering market in February 2022, with the aim of recruiting more customers and increasing volume.
REMA 1000 Denmark
Systemwide sales in 2022 amounted to NOK 28,301 million and NOK 25,752 million in 2021, corresponding to a growth of 10.4 percent in 2022 and 0.8 percent in 2021. Like-for-like growth in systemwide sales was 9.5 percent in 2022 and -1.2 percent in 2021. Total systemwide and distribution sales in 2022 were NOK 35,137 million and NOK 31,964 million in 2021. The level of systemwide sales and total systemwide and distribution sales in 2022 were impacted by a strong momentum for REMA 1000 Denmark, in addition to high levels of food price inflation. In 2022, REMA 1000 Denmark had an estimated market share of around 17 percent of the traditional Danish grocery market, well above the estimated around 16 percent in 2021. The number of sales outlets at the end of 2022 was 363, up from 360 at the end of 2021.
90
4.1 Board of Directors’ report
REMA 1000 Denmark’s revenue in 2022 was NOK 32,799 million, compared to NOK 29,541 million in 2021, corresponding to a growth in revenue of 11.6 percent in 2022 and 2.1 percent in 2021. This reflects the similar development as mentioned above, leading to higher revenue from sale of franchise services and revenues from sale of goods compared to 2021. Operating profit before amortisation, depreciation and impairment (EBITDA) was NOK 2,185 million in 2022 compared to NOK 1,971 million in 2021. Operating profit was NOK 1,248 million in 2022 and NOK 1,059 million in 2021. The increased result in 2022 is mainly explained by higher revenue, partially offset by general inflationary pressure.
REMA 1000 Denmark will continue to focus on and strengthen the business idea “Discount med holdning” (“Discount with value”) and “Meget mere discount” (“Much more discount”), which means that goods are sold at a low price and with clear requirements towards the goods’ quality and impact on people and the environment. This includes a continued focus on organic and sustainable groceries and reduced food waste.
In December 2022, an agreement was signed with German discount grocer ALDI to acquire the majority of ALDI’s grocery store network in Denmark. The
agreement, dependent on regulatory approval, gives access to attractive locations and will further accelerate growth and boost market share in the Danish grocery market. Successful integration and opening of new stores is a key focus area for 2023.

In addition, we will, in 2023, open our new highly automated dry goods distribution centre in Horsens, Denmark, targeting increased efficiency and capacity to handle additional growth.
Reitan Convenience
Systemwide sales in 2022 were NOK 14,688 million and NOK 12,853 million in 2021, corresponding to a growth of 16.1 percent in 2022 and 1.2 percent in 2021. Likefor-like growth in systemwide sales was 15.0 percent in 2022 and 3.2 percent in 2021. Total systemwide and distribution sales in 2022 were NOK 15,082 million and NOK 13,260 million in 2021. The level of systemwide sales and total systemwide and distribution sales in 2022 were impacted by high levels of inflation as well as normalisation following Covid-19 with increased mobility and traffic in stores, although with mobility restrictions and lockdown measures in January and February of 2022. With a large number of outlets in high-traffic areas where people normally travel
91 Our responsibility Our business Corporate Governance Financial statements Appendix
and gather, such as airports, railway stations and metros, the customer base has gradually returned to our convenience stores, although not fully back to the levels seen prior to the Covid-19 outbreak. The number of sales outlets at the end of 2022 was 1,953, down from 2,002 at the end of 2021, reflecting active portfolio management with the opening of new stores in attractive locations while at the same time closing marginal and small stores, mainly in Norway, Finland and the Baltics.
Reitan Convenience’s revenue in 2022 was NOK 4,829 million compared to NOK 3,987 million in 2021, corresponding to a growth in revenue of 22.5 percent in 2022 and 0.1 percent in 2021. Higher sales in sales outlets resulted in an increase in both revenues from sale of franchise services and revenues from sale of goods compared to 2021. Operating profit before amortisation, depreciation and impairment (EBITDA) was NOK 1,110 million in 2022 and NOK 1,006 million in 2021. Operating profit was NOK -1 million in 2022 and NOK -89 million in 2021. The improved result in 2022 is mainly explained by increased revenues from franchise services and a solid development in Denmark and Sweden. This was partly offset by more challenging markets in Norway and Finland, as well as general inflationary pressure.
Reitan Convenience is a specialist in developing and operating franchise-based convenience concepts. Organic growth in existing stores and new store openings are a core part of Reitan Convenience’s business. Reitan Convenience will continue its focus on food to go, hot and cold beverages, and bakery through continued innovation and digital solutions to improve the customer offering and attract existing and new customers.
On the back of changing regulations and changes in customer patterns, strengthened by Covid-19, we see the need for a more forward-leaning approach in Finland and Norway through active portfolio management and improved customer offering, targeting improved performance and increased customer traffic and satisfaction.
Uno-X Mobility
Systemwide sales in 2022 amounted to NOK 25,340
million, compared to NOK 18,169 million in 2021. Total systemwide and distribution sales were NOK 30,887 million in 2022 and NOK 22,010 million in 2021. Total volume sold (measured in 1,000 m³) for the corresponding years was 1,785 and 1,785. Both systemwide sales and total systemwide and distribution sales increased in 2022, primarily related to prices for oil products being higher in 2022 than in 2021 (Average Brent Blend was USD 99 and 71 per barrel in 2022 and 2021, respectively). As systemwide sales and total systemwide and distribution sales in NOK fluctuate with the oil price, growth in systemwide sales and systemwide and distribution sales are not calculated for this business area. The number of mobility locations at the end of 2022 was 816, compared to 824 at the end of 2021.
Uno-X Mobility’s revenue in 2022 was NOK 21,756 million, compared to NOK 13,251 million in 2021. Operating profit before amortisation, depreciation, and impairment (EBITDA) was NOK 1,191 million in 2022 and NOK 1,336 million in 2021. Operating profit was NOK 723 million in 2022 and NOK 972 million in 2021. The results in 2022 are at a high level historically, impacted by strong performance and positive inventory effects from increasing oil prices, but somewhat below 2021, which was even more positively impacted by positive inventory effects.
Going forward, Uno-X Mobility will continue to develop and promote solutions for sustainable mobility. While adapting to changes in demand from customers, Uno-X Mobility will work towards reducing dependence on fossil fuels, acknowledging all solutions contributing to reducing emissions as well as technologies that help to conserve and protect the environment. Uno-X Mobility will focus on maintaining an efficient and profitable fuels network while launching and rolling out both Nordic Swan ecolabelled car wash and ultrafast EV charging.
Real Estate
The Real Estate’s revenue in 2022 was NOK 21 million, compared to NOK 35 million in 2021. Other income, consisting of rental income, net gains (losses) and revaluation of investment properties, was NOK 183 million in 2022, compared to NOK 423 million in 2021.
92
4.1 Board of Directors’ report
Operating profit before amortisation, depreciation, and impairment (EBITDA) was NOK 149 million in 2022 and NOK 488 million in 2021. Operating profit was NOK 141 million in 2022 and NOK 479 million in 2021. Revaluation of investment properties is included in the segment’s profit with NOK -24 million in 2022 compared to NOK 258 million in 2021. Share of profit from associates was NOK 43 million in 2022 and NOK 125 million in 2021. Carrying amount of the real estate portfolio at fair value was NOK 4,573 million as of 31 December 2022 and NOK 4,288 million as of 31 December 2021.
The Real Estate segment will continue to secure access to strategically important locations, thus being an important enabler for the growth of Reitan Retail and its franchisees.
Financial risk and risk management
Reitan Retail has its core activities in the grocery and convenience market and in the marketing and sale of oil products. The Group is exposed to ordinary financial and operational risks related to these types of activities. Reitan Retail believes that focused operational risk is outweighed by the benefits of investing in businesses where the Group has expertise.
Reitan Retail’s ambition regarding financing and capital structure is referred to in our value principle no. 3: “We aim to be debt-free”. This value principle should be read as a guidance and target to have a robust financial position, with a capital structure allowing us to balance risk and flexibility to act on opportunities. The Group has a solid balance and significant liquidity reserves, including undrawn borrowing facilities, providing the Group with the strength and capacity to handle unforeseen operational challenges and market fluctuations.
In December 2021, Reitan Retail AS established a multicurrency credit facility with a bank syndicate consisting of six banks. The facility is a revolving credit of NOK 9,000 million, of which NOK 4,500 million matures in 2024 and NOK 4,500 million matures in 2026, and both tranches include two one-year extension options. In 2022, the first extension option for both tranches was utilised, extending the maturity date to 2025 and 2027, respectively. For further details, please see Note 26 –Loan Agreements.
Reitan Retail operates in markets with high sales and large volumes. Annual cash flows are high and relatively stable but can be volatile within a week/ month. The Group handles its liquidity risk by ensuring sufficient liquidity reserves combined with sufficient available overdraft facilities.
The systemwide sales come from franchise-operated, dealer-operated, and company-operated units. The franchisor has deep insight into the individual

93 Our responsibility Our business Corporate Governance Financial statements Appendix
franchisee’s financial situation. The Group has established routines for credit assessment and follow-up of commercial customers. Historically, defaults and losses on receivables have been low in relation to total trade receivables and revenues.
Reitan Retail’s activity is located in the Nordic and Baltic countries. Currency risk associated with the Group’s total debt portfolio is limited by adjusting the currency composition of the debt portfolio to the expected free cash flow in the operating companies with currency exposure. Uno-X Mobility’s operations are also exposed to currency risk in USD. The risk is limited through the ongoing establishment of foreign exchange trades.
Today, Uno-X Mobility has its main business in the marketing and sale of oil products, and the Group is consequently exposed to risk relating to oil price changes.
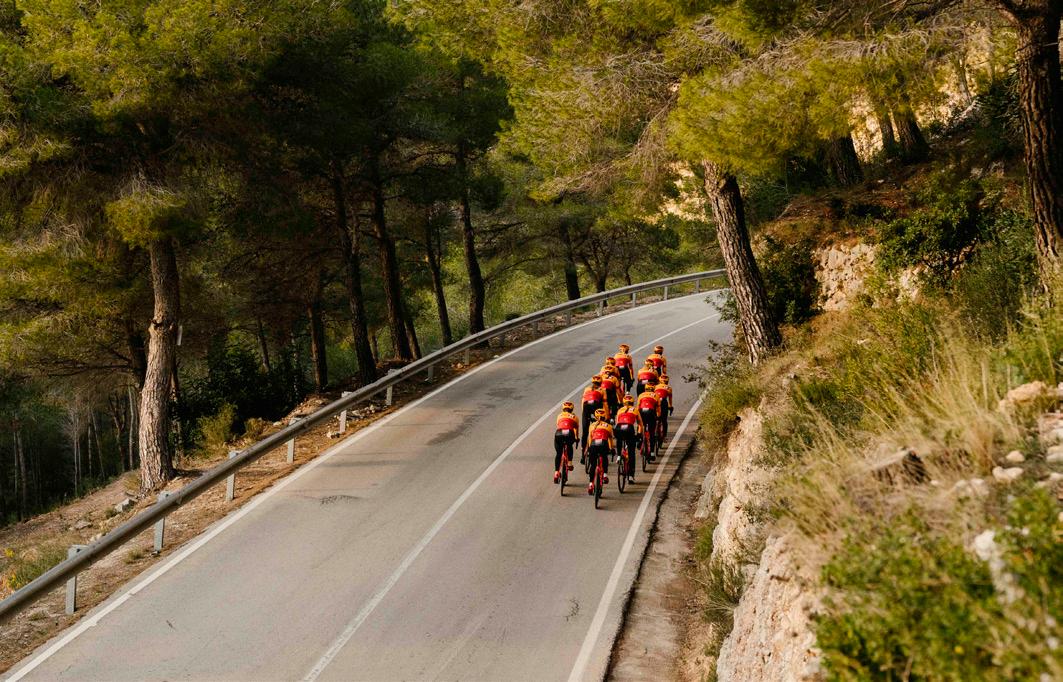
The Group has established strategies and guidelines for managing both operational and financial market risk. Reitan Retail’s financial market risk includes interest rates, foreign exchange, credit and price risk on financial assets and inflation. Strategies, including the scope and degree of hedging, vary between the different business areas.
Climate-related risk and risk management
Our core activities have a strong presence in the food and fuel sectors, areas with an impact on the climate as well as being affected by climate changes. Therefore, Reitan Retail acknowledges the need to assess, reduce and manage substantive risks and opportunities related to climate change.
Reitan Retail’s business strategy is clearly rooted in the society we live in and has sustainable development as a top priority. Hence, there is no distinction between assessing and managing climate-related risks versus other operational managerial tasks.
A continuously updated understanding of the risks and opportunities associated with climate change is important when executing our strategy. As of last year, we implemented mandatory carbon accounting for all subsidiaries in a common system. Additionally, we finalised the comprehensive scope 3 calculation, establishing a baseline for the entire Reitan Retail. The calculations include the identification of emissions
94
4.1 Board of Directors’ report
according to GHG protocol per subsidiary and goods categories providing a valuable understanding of significant areas for climate mitigation and risk minimising. Emissions from own operations (scope 1 and 2) are reduced by 5.1 percent in 2022 compared to 2021 and 14.3 percent from the base year, 2020.
We have mapped the most significant sustainability and governance risks, including climate-related risks and opportunities, across our four business areas. The physical and social effects of climate change are the result of a complex interplay between weather systems, political action, consumption patterns and demographic trends, to name a few drivers. Understanding how these factors will interact and what effect they will bring along is challenging, given the associated uncertainties. By gradually mapping and ongoingly gaining knowledge about our own operations’ impact on climate – as well as understanding the effects climate has on us, we set a solid foundation for our risk management process, and, in the years to come, onboarding the guidelines and methods of TCFD (Taskforce on Climate-related Financial Disclosures) and TNFD (Taskforce on Naturerelated Financial Disclosures).
Our businesses within the food sector are experiencing increased risk in the supply chains. Crops and raw materials are at risk of being damaged during seasons due to climate changes, as extreme weather patterns are hard to predict. Physical climate risks influence Reitan Retail indirectly through our suppliers of selected agricultural products that are affected by acute or chronic weather patterns in the long-term perspective. We have started the analysis of extreme weather events such as heavy rainfall and will monitor physical changes such as sea-level rise, salinity, and temperature rise. These are all factors that could potentially affect raw material production in a long-term perspective for our global suppliers.
Our liquid fuel and mobility business believes increased use of biofuels/renewable liquid fuels to be one of several important tools to reduce emissions from transportation and combat climate change. In addition, we have a zero-tolerance policy on the usage of palm oil and soy oil in our biofuel to prevent
deforestation and the release of stored carbon into the atmosphere.
Electrification is an important measure for reducing CO2 emissions from road transport, as well as in other parts of the transport sector. Multiple car manufacturers, EU legislation and national and regional legislation have set an end date on the use of vehicles with combustion engines. We will gradually transfer Uno-X Mobility’s operations from liquid fuels to electricity, and efforts are made to build ultrafast EV charging stations in Norway and Denmark on Reitan Retail locations. The first Uno-X ultrafast EV charging location opened in Denmark in April 2022, with the subsequent opening of one more location in Denmark and five in Norway in 2022. The state-of-theart solutions for the best possible customer experience, including clear and simple price information, 150 kW output and a tap-and-drive payment solution, have quickly been adopted by the customer. Expanding the EV charging locations as planned is challenging both when it comes to getting the necessary energy supply and due to longer processing times for permit reviews. As the demand for EV charging is rising in Norway and Denmark, the demand for energy has risen, as well as the number of permit applications, prolonging the permit process.
95 Our responsibility Our business Corporate Governance Financial statements Appendix
5.1% reduction in emissions from own operations (scope 1 and 2)
Financial position of the parent company
The separate financial statements of Reitan Retail AS have been prepared in accordance with the simplified IFRS pursuant to the Norwegian Accounting Act, section 3-9, subsection 5 (“Regulations on simplified use of international accounting standard”) issued by the Norwegian Ministry of Finance on 21 January 2008.
In 2022, other income amounted to NOK 1,811 million, compared to NOK 1,843 million in 2021. Other income consists of dividends and group contributions from subsidiaries. Profit for the year amounted to NOK 1,540 million in 2022 and NOK 1,655 million in 2021.
As of 31 December 2022, total assets amounted to NOK 11,411 million, compared to NOK 9,190 million as of 31 December 2021. At the end of 2022, investments in subsidiaries amounted to NOK 4,094 million and NOK 3,692 million at the end of 2021. Total equity as of 31 December 2022 was NOK 7,182 million, compared to NOK 5,644 million as of 31 December 2021. This is equal to an equity ratio of 62.9 percent as of 31 December 2022 and 61.4 percent as of 31 December 2021. As of 31 December 2022, total liabilities were NOK 4,229 million, compared to NOK 3,546 million as of 31 December 2021.
6,567 employees in Reitan Retail in 2022
In December 2021, Reitan Retail AS established a multi-currency credit facility with a bank syndicate consisting of six banks. The facility is a revolving credit of NOK 9,000 million, of which NOK 4,500 million matures in 2024 and NOK 4,500 million matures in 2026, and both includes two one-year extension options. For further details, please see Note 9 – Liabilities in the separate financial statements of Reitan Retail AS. In 2022 the first extension option for both tranches was utilised, extending the maturity date to 2025 and 2027, respectively.
Organisation
Ownership and group organisation
Reitan Retail AS is a wholly owned subsidiary of REITAN AS, owned by the Reitan family. Odd Reitan, Ole Robert Reitan and Magnus Reitan, with his family, each own 33.3 percent of the shares in REITAN AS through their individually owned holding companies.
Reitan Retail is organised with a parent company, Reitan Retail AS, responsible for overall corporate governance. Subsidiaries that are defined as core business areas are referred to as business areas. These are REMA 1000 Norway, REMA 1000 Denmark, Reitan Convenience and Uno-X Mobility. Each business area is led by an executive vice president and chief executive officer (CEO). In addition, the Group holds a portfolio of retail properties in Norway and Denmark presented as a separate segment, Real Estate, being reported separately to the CFO of Reitan Retail.
Management model
Reitan Retail is led by the Chief Executive Officer (CEO), Ole Robert Reitan. The CEO is responsible for the day-to-day management and the Executive Management Team of Reitan Retail, in accordance with applicable legislation and as authorised by the Board of Directors of Reitan Retail AS.
The CEO reports to the Board of Directors of Reitan Retail AS. The Board of Directors oversees the overall management of Reitan Retail AS.
Executive Management Team
The Executive Management Team of Reitan Retail
96
4.1 Board of Directors’ report
consists of Group CEO Ole Robert Reitan, Executive Vice President (EVP) and Chief Financial Officer (CFO) Kristin S. Genton, EVP and Chief Operations Officer (COO) Monica Ødegaard, EVP and Chief Communications Officer (CCO) Inger Sethov, EVP and CEO of REMA 1000 Norway Tom Kristiansen, EVP and CEO of REMA 1000 Denmark Henrik Burkal, EVP and CEO of Reitan Convenience Mariette Kristenson, and EVP and CEO of Uno-X Mobility Vegar Kulset.
The Group CEO appoints and determines the composition of the Executive Management Team. The board of each business area appoints the CEO for the respective business area.
Board of Directors
The Board is obliged to ensure that the activities of the Company are properly organised, approve plans, keep itself informed about the Company’s financial position and ensure that the operations, accounts and asset management are subject to adequate control. The Board issues guidelines for the activities of Reitan Retail AS.
The Board meets as often as required, or when any board member or the CEO so demands.
Working environment
Reitan Retail shall be a safe and attractive workplace for the employees, with diversity and opportunities in focus. Great emphasis is placed on motivating and developing employees in line with the Group’s values and culture. Reitan Retail wants to give all employees a common platform and build common pride across the business areas. Hence, employee development is central to the Group and the business areas, and Reitan Retail have several development programs, including philosophy courses and value training, talent, and trainee programs, offers of trade certificates and various individual programs.
In total, Reitan Retail had 6,567 employees at the end of 2022, compared to 5,715 as of 31 December 2021. The number of systemwide employees, including franchisees and their store personnel, was 43,444 at the end of 2022, compared to 42,079 as of 31 December 2021.
Gender equality and diversity
Employees in company
Among the Group’s employees, there are 3,424 women and 3,143 men, compared to 2,961 women and 2,754 men in 2021. Of the employees in 2022, two percent were below the age of 18, 32 percent aged 19-29, 21 percent aged 30-39, 19 percent aged 40-49, 17 percent aged 50-59 and 9 percent age 60 and above.
The Group’s executive management level consists of eight employees, of which four men and four women. Among 539 employees in top and middle management in 2022, 41 percent are women and 59 percent are men. In 2021, the share was the same among 500 top and middle management. Efforts are being made to ensure gender equality and diversity at all levels of the organisation.
Among the 6,567 employees in Reitan Retail in 2022, 5,860 are permanently employed. 1,955 of our employees work in company-operated sales outlets, 2,483 work in distribution or production facilities, 2,091 work in administrative positions and 38 are cyclists in the Uno-X Pro Cycling team.
1,515 work part-time, of which 56 percent were women in 2022. In 2021, the number of part-time workers was 1,958, of which 57 percent were women.
Out of the total employees, 707 are temporarily employed or working as non-guaranteed hours employees, most of whom are in company-operated sales outlets.
Flexible working hours, home office solutions and opportunities for parental leave for both genders promote both women’s and men’s opportunities to balance career and family life. In 2022, 179 employees were on parental leave, whereof 43 percent were men and 57 percent were women. The return-to-work rate was 81 percent for women and 96 percent for men. The retention rate one calendar year after parental leave is 77 percent for women and 74 percent for men. The total retention rate is 75 percent.
97 Our responsibility Our business Corporate Governance Financial statements Appendix
Employee sick leave in 2022 was 5.9 percent compared to 5.1 percent in 2021. A total of 61 injuries resulted in sick leave in 2021. In 2022, one of our companies had a serious incident involving personal injury. The company followed its regular emergency preparedness routines, with the company’s emergency team handling the incident, and following up with the affected employee, family, colleagues, and relevant authorities. The affected employee is still recovering, and both the employee and family will be followed up by the company for as long as needed.
As large employers, we have an important role to both the employees and the society to facilitate employees on sick leave to return to work. Cooperation with local authorities (e.g., NAV, the Norwegian Labour and Welfare Administration in Norway) is important in this work. The needs of employees with reduced work capacity due to age and/or illness are met, as well as the opportunity to work in reduced positions (partly without sick pay / no reduction of pay). Most sites in the Group are of modern standard, facilitated for employees with physical disabilities.
Franchisees and store personnel
We hold great pride in our franchisees and the diversity they represent. In 2022, 37 percent of our franchisees were women, and 63 percent were men. The share of female franchises decreased from 39 percent in 2021. Of the total 2,200 franchisees, 12 percent were between the age of 19-29, 32 percent aged 30-39, 33 percent aged 40-49, 20 percent age 50-59 and 3 percent aged 60 and above. The number of store personnel was 34,677 in 2022, of which 52 percent were women and 48 percent were men.
A large part of the franchisees in 7-Eleven has a non-ethnic Scandinavian background, and in total, a significant number of countries are represented among the employees in the various business areas.
Our sales outlets serve as the first entry, as well as a possibility to return to working life, for both youth and people who experience challenges and need work practice or training.
Recruitment
Reitan Retail uses professional tools in the recruitment process. Vacancies shall be advertised internally to promote internal career opportunities and internal advancement.
In the recruitment processes, requirements specifications are prepared for the positions, which, together with thorough assessments, evaluations, interviews, test tools, and reference checks, will ensure that the Group finds the best qualified candidate.
98
4.1 Board of Directors’ report
Responsibility
At Reitan Retail, we can and should make a difference –both for the planet and for our customers. We recognise our responsibility as a major player in society.
Our joint responsibility work in Reitan Retail is encouraged proactively by our business areas, and together, we seek solutions that optimally make use of our connectivity and position Reitan Retail for the future.
We focus on four strategic areas that are of most material importance to us and to our stakeholdersEnvironment, Health, People, and Value chain. The materiality assessment is Reitan Retail’s threshold for sustainability aspects becoming sufficiently important
and hence, should be reported on. Our responsibility strategy reflects and showcases our clear stance on the green shift as well as the importance of good health, human relations, and decent working conditions for all, including human rights, throughout our value chains.
Together, we make everyday life a little bit easier and the world a little bit better.
Below are some highlights from the responsibility work in 2022. Chapter 2 – Our responsibility provides more information and additional work from 2022, which is given in accordance with GRI Standards. Our business areas also publish sustainability reports for the year 2022 with their contextual journeys toward sustainable development. Please see reitanretail.no for the abovementioned reports.
Environment

We aim to lead the green transition in our industries via our sustainability initiatives, helping our customers make climate-friendly choices and working towards a sustainable value chain that protects soil and biodiversity
In a time marked by climate change and rapid loss of biodiversity, and misuses of natural resources, the need to manage businesses in line with nature’s resilience is extensively growing. In Reitan Retail, we work to reduce our CO2 emissions and minimise negative environmental effects in our own operations, as well as in the value chain. We want to help our customers make sustainable choices and provide products that contribute to more responsible value chains.
Our businesses have a presence in the food and fuel sectors, which together negatively impacts climate by being responsible for almost 40 percent of the total CO2 emissions globally, according to Our World in data. We acknowledge our emissions and work continuously to develop and promote
solutions for sustainable mobility together with solutions that reduce food waste, promote effective waste management, increase the use of renewable energy, and replace GHG gases with more environmentally friendly CO2 gases, amongst many other topics.
For the year 2022, Reitan Retail reduced total carbon emissions from its own operations (scope 1 and 2) by 5,1 percent from 2021. Reporting of carbon emissions from scope 3 has been completed for all four business areas in 2022. Scope 3 emissions for Reitan Retail was 8.6 million CO2e, which equals 99,5 percent of our total emissions from all scopes. The main sources of emissions come from the categories of purchased goods and services and the use of sold products (fossil fuels).
99 Our responsibility Our business Corporate Governance Financial statements Appendix
We aim to offer healthier products at affordable prices for everyone. We inspire a healthier, active and sustainable lifestyle through our products, services and sponsorships
The ongoing climate change is the greatest health threat facing humanity, according to World Health Organization. Food is the single strongest lever to optimise human health and environmental sustainability on Earth. Our customers should be confident that we care about their health and well-being. We will inspire more people to make healthier and more sustainable choices through our products, services, and sponsorship work. We support the UN’s Farm to Fork Strategy and applaud their aim to ensure affordable, safe, nutritious, and sustainable food to everybody. There is great potential for us to contribute to this ambition.
Multiple Directorates of Health point out the correspondence between a diet that promotes
health and a diet that is more sustainable. Such a diet is characterised, among other things, by a higher intake of fruits, vegetables, fish, and whole grains and a lower intake of red and processed meat. REMA 1000 in Norway and Denmark are targeting an increase in sales from “healthier products” - fruit, vegetables, berries, whole grains, fish and seafood, and Keyhole labeled products. In 2022, 29.1 percent of sales came from “healthier products.”
Health is not just about the food we eat. Health is also about well-being and healthy communities. Therefore, we work together with like-minded organisations to offer initiatives within our markets that focus on good health, exercise, and mental well-being.

100 Health
4.1 Board of Directors’ report
People
We aim to lead by example in equal opportunity and firmly believe in an inclusive work environment where people from all backgrounds are given the opportunity to succeed
People are the most important asset in Reitan Retail. Showing trust and confidence in people is a key element of our culture. We look at people for what they are and what they can become. That is why we believe diversity is a driver for success and engagement. With 43,500 people working across our operations, it is a great opportunity and responsibility for us to be an inclusive employer. The working environment is built on treating colleagues, customers, business partners, and others with respect, no matter cultural differences and other individual characteristics. In 2022, 42 percent of the recruitment for manager and management positions were women, and 31 percent of all new franchisees in 2022 were women.

101 Our responsibility Our business Corporate Governance Financial statements Appendix
Value chain
We have a high level of business morale and hold our suppliers accountable to our rigorous ethical code of conduct in order to offer responsibly produced products to our customers
With the combination of rapid climate changes and great pressure on natural resources, we see a wide range of risks affecting Reitan Retail’s value chain, e.g., more limited transparency, increased corruption and fraud, and an ever-increasing risk of human rights violations and hence deterioration of people’s livelihoods.

We have a high level of business ethics founded in our values and are committed to working with suppliers to make our customers sure that our products are produced in a responsible manner.
We will publish a statement in accordance with the Norwegian Transparency Act by July 1, 2023. At the heart of the Transparency Act is the duty to carry out due diligence assessments of basic human rights and decent working conditions in the value chains by prioritising our efforts based on the potential for impact. Read more about the Transparency Act in Chapter 2 – Our responsibility. The ongoing effort will ensure that Reitan Retail contributes to creating responsible and sustainable value chains throughout our organisation and pull the world in a better direction.
102
4.1 Board of Directors’ report
Events after the reporting period
Acquisition of a majority of ALDI’s Danish grocery store network
REMA 1000 Denmark signed an agreement to acquire the majority of German discount grocer ALDI’s grocery store network in Denmark in December 2022. The Group will acquire a portfolio of real estate locations, including 114 store locations and three distribution centers. The agreement excludes ALDI’s head office and remaining stores in Denmark.
The transaction gives access to locations well-suited for the REMA 1000 format, paving the way for accelerated growth in an attractive market. Total investments, including the purchase price, investments to convert sales outlets to the REMA 1000 concept and other
required investments – are considered to range between NOK 3.5 billion and NOK 4 billion. The acquisition will be financed through the Group’s existing credit facilities.
The transaction is subject to approval by Danish competition authorities and is expected to close during 2023.
Outlook
Reitan Retail aims to be a good owner and contribute to developing all its business areas in a positive direction. Reitan Retail has had a solid value creation through long-term investments over many years.
Reitan Retail continuously assesses opportunities for its businesses, and at the beginning of 2023, Reitan Retail has a strong financial position for further growth and development.

Oslo, 19 April 2023
Rune Bjerke Chairman of the Board
Magnus Reitan Board Member
Ole Robert Reitan CEO Eilert Hanoa Board Member
103 Our responsibility Our business Corporate Governance Financial statements Appendix

104 Reitan Retail Responsible retail 2022 4.2 Consolidated financial statements Profit or loss Comprehensive income Financial position Changes in equity Cash flows Notes to the consolidated financial statements 105 106 107 109 110 111
Consolidated statement of profit or loss
*EBITDA, or earnings before interest, taxes, depreciation and amortisation, is an alternative performance measure. For more information, see section Performance measures and definitions.
105 4.2 Consolidated financial statements 4.3 Parent company financial statements Our responsibility Our business Corporate Governance Financial statements Appendix
4
Consolidated financial statements | Annual report 2022
NOK in millions except per share data Note 2022 2021 Revenue 6 94,367 81,502 Other income 7, 13 1,001 898 Share of profit of associates 16 97 229 Cost of goods sold 20 -77,395 -65,565 Salaries and personnel costs 8 -4,003 -3,784 Other operating expenses 9 -5,805 -5,064 EBITDA* 8,262 8,216 Amortisation and impairment of intangible assets 12 -281 -200 Depreciation and impairment of property, plant and equipment 14 -1,257 -1,157 Depreciation and impairment of right-of-use assets 15 -3,127 -3,019 Operating profit 3,597 3,840 Interest income 10 79 21 Interest expenses on lease liabilities 10, 15 -811 -799 Other interest expenses 10 -228 -112 Net gains (losses) on financial investments 10 -246 200 Net other financial items 10 65 146 Net financial items -1,141 -544 Profit before taxes 2,456 3,296 Income tax expenses 11 -611 -651 Profit for the year 1,845 2,645 Attributable to: Equity holders of the parent 1,831 2,612 Non- controlling interests 17 14 33 Earnings per share, NOK Basic earnings per share 22 17.44 24.88 Diluted earnings per share 22 17.44 24.88
Consolidated statement of comprehensive income

106 5
NOK in millions Note 2022 2021 Profit for the year 1,845 2,645 Other compr. income (loss) that will not be reclassified to profit or loss: Remeasurement gain/(loss) on defined benefit plans 8, 11 2 -4 Share of other comprehensive income of associates 1 11, 16 9Net other compr. income that will not be reclassified to profit or loss 11 -4 Other comprehensive income (loss) that may be reclassified to profit or loss: Share of other comprehensive income of associates 11, 16, 23 -11 4 Net gain/(loss) on cash flow hedges 11, 23 -18 62 Foreign currency translation effects 11, 23 304 -312 Net other compr. income that may be reclassified to profit or loss 275 -246 Net other compr. income (loss) for the year, net of tax 286 -250 Total compr. income for the year, net of tax 2,131 2,395 Attributable to: Equity holders of the parent 1 2,116 2,363 Non- controlling interests 1 17 15 32
Consolidated statement of financial position
107 4.2 Consolidated financial statements 4.3 Parent company financial statements Our responsibility Our business Corporate Governance Financial statements Appendix Consolidated financial statements | Annual report 2022 6
NOK in millions Note 31.12.22 31.12.21 ASSETS Deferred tax assets 11 591 571 Intangible assets 12 3,928 3,789 Investment properties 13 48 326 Property, plant and equipment 14 12,402 11,255 Right-of- use assets 15 22,297 20,966 Investments in associates 16 1,102 1,018 Financial investments 18 475 715 Pension assets 8 4 3 Derivative financial instruments (AM) 28 2 10 Receivables 19 400 471 Total non -current assets 41,249 39,124 Inventories 20 5,169 4,392 Trade and other receivables 19 9,860 8,136 Derivative financial instruments (OM) 28 31 36 Cash and bank balances 21 1,106 1,035 Restricted cash 21 114 62 Total current assets 16,280 13,661 Total assets 57,529 52,785
Consolidated statement of financial position
108 7
NOK in millions Note 31.12.22 31.12.21 EQUITY Share capital and premium 2,035 2,035 Other reserves 23 1,464 1,190 Retained earnings 10,462 8,815 Equity attributable to equity holders of the parent 13,961 12,040 Non- controlling interests 17 135 150 Total equity 14,096 12,190 LIABILITIES Deferred tax liabilities 11 677 549 Pension obligations 8 82 94 Provisions (LG) 24 540 556 Borrowings (LG) 25 4,017 3,269 Lease liabilities (LG) 15, 25 20,004 18,901 Other liabilities 29 4 6 Total non -current liabilities 25,324 23,375 Provisions 24 86 67 Income tax payable 11 124 195 Borrowings 25 1,124 715 Lease liabilities 15, 25 3,861 3,646 Derivative financial instruments 28 - 3 Trade and other payables 29 12,914 12,594 Total current liabilities 18,109 17,220 Total liabilities 43,433 40,595 Total equity and liabilities
Consolidated statement of changes in equity
Attributable to equity holders of Reitan Retail AS
109 4.2 Consolidated financial statements 4.3 Parent company financial statements Our responsibility Our business Corporate Governance Financial statements Appendix Consolidated financial statements
Annual report 2022 8
|
NOK in millions Share capital and premium Other reserves Retained earnings Total Noncontrolling interests Total equity 2021 Equity as at 1 January 2021 2,035 1,435 7,309 10,779 127 10,906 Profit for the year - - 2,612 2,612 33 2,645 Other comprehensive income for the year - -245 -4 -249 -1 -250 Total comprehensive income for the year, net of tax - -245 2,608 2,363 32 2,395 Dividends - - -1,100 -1,100 -9 -1,109 Change in non- controlling interests - - -2 -2 - -2 Transactions with owners in their capacity as owners - - -1,102 -1,102 -9 -1,111 Equity as at 31 December 2021 2,035 1,190 8,815 12,040 150 12,190 2022 Profit for the year - - 1,831 1,831 14 1,845 Other comprehensive income for the year - 274 11 285 1 286 Total comprehensive income for the year, net of tax - 274 1,842 2,116 15 2,131 Dividends - - -195 -195 -30 -225 Transactions with owners in their capacity as owners - - -195 -195 -30 -225 Equity as at 31 December 2022 2,035 1,464 10,462 13,961 135 14,096 See note 23 - Other reserves for further details.
Consolidated statement of cash flows
110 9
NOK in millions Note 2022 2021 Profit before taxes 2,456 3,296 Net gains (losses) excl. currency gains (losses) on operating act. 7 -75 -26 Share of profit of associates 16 -97 -229 Revaluation of investment properties 13 -51 -57 Depreciation and impairment of property, plant and equipment 14 1,257 1,157 Amortisation and impairment of intangible assets 12 281 200 Depreciation and impairment of right-of-use assets 15 3,127 3,019 Net financial items 10 1,141 544 Change in pension obligations 8 -10 -5 Change in inventories -777 -983 Change in trade and other receivables -1,716 -624 Change in trade and other payables 310 563 Cash flow from operating activities 5,846 6,855 Interest paid 10,15 -1,027 -896 Income taxes paid -537 -679 Net cash flow from operating activities 4,282 5,280 Purchase of intangible assets 12 -333 -143 Proceeds from sale of intangible assets 12 4 3 Purchase of investment properties 13 -19 -38 Proceeds from sale of investment properties 13 347 1 Purchase of property, plant and equipment 14 -2,690 -3,071 Proceeds from sale of property, plant and equipment 14 548 885 Purchase of associated companies 16 -85 -29 Proceeds from sale of associated companies 16 34 90 Purchase of financial assets 18 -3 -42 Proceeds from sale of financial assets 18 1 26 Interest received 10 79 21 Dividends received 11,12,16 72 152 Net cash flow from investing activities -2,045 -2,145 Proceeds from borrowings 25, 26 2,671 4,114 Repayments of borrowings 25, 26 -1,904 -2,664 Proceeds from borrowings from parent company 8, 25 - 16 Repayments of borrowings from parent company 8, 25 - -3,298 Payment of principal portion of lease liabilities 15, 25 -3,095 -3,016 Dividend paid to parent company -250Dividends paid to non-controlling interests in subsidiaries -30 -9 Net cash flow from financing activities -2,608 -4,857 Change in cash and cash equivalents -371 -1,722 Cash and cash equivalents as of 1 January 21 397 2,122 Effects of exchange rate changes on cash and cash equivalents 7 103 -3 Cash and cash equivalents as at 31 December 21 129 397
Notes to the consolidated financial statements
Note 1 – General information
Note 2 – General accounting policies
Note 3 – Financial risk management
Note 4 – Significant accounting judgements, estimates and assumptions
Note 5 – Segment information
Note 6 – Revenue
Note 7 – Other income
Note 8 – Salaries and personnel costs
Note 9 – Other operating expenses
Note 10 – Net financial items
Note 11 – Income taxes
Note 12 – Intangible assets
Note 13 – Investment properties
Note 14 – Property, plant and equipment
Note 15 – Leases
Note 16 – Investments in associates
Note 17 – Investments in subsidiaries
Note 18 – Financial investments
Note 19 – Trade and other receivables
Note 20 – Inventories
Note 21 – Cash and cash equivalents
Note 22 – Earnings per share
Note 23 – Other reserves
Note 24 – Provisions
Note 25 – Borrowings
Note 26 – Loan agreements
Note 27 – Guarantees
Note 28 – Derivative financial instruments
Note 29 – Trade and other payables
Note 30 – Classification of financial instruments
Note 31 – Fair value measurement
Note 32 – Related party transactions
Note 33 – Contingent liabilities
Note 34 – Events after the reporting period
111 4.2 Consolidated financial statements 4.3 Parent company financial statements Our responsibility Our business Corporate Governance Financial statements Appendix
112 112 114 116 118 121 123 124 126 126 127 130 133 134 136 142 145 146 147 149 149 150 150 151 153 156 157 158 158 159 163 165 166 167
Note 1 – General information
Reitan Retail AS (the Company) is registered and domiciled in Norway. The head office is located in Gladengveien 2, Oslo. Reitan Retail is a retail company and the principal activities of the Company and its subsidiaries (the Group) are described in note 5 – Segment information.
The Group consists of five segments, of which four retail segments (also referred to as business areas): REMA 1000 Norway, REMA 1000 Denmark, Reitan Convenience and Uno-X Mobility. In addition, the Group holds a portfolio of retail properties presented as a separate segment; Real Estate. The group companies operate from Oslo, Stockholm, Copenhagen, Helsinki, Riga, Tallinn and Vilnius.
Note 2 – General accounting policies
2.1 Basis of preparation
The consolidated financial statements of Reitan Retail AS and its subsidiaries have been prepared in accordance with International Financial Reporting Standards (IFRSs) as issued by the International Accounting Standards Board (IASB) and endorsed by the European Union, effective at 31 December 2022.
The financial statements have been prepared on a historical cost basis, except for investment properties and certain financial instruments that are measured at fair value as explained in the accounting policies
The financial statements are presented in Norwegian Kroner (NOK), rounded to the nearest million unless otherwise stated. The financial statements have been prepared on a going concern basis.
Significant accounting policies have been included in the relevant notes to which the policies relate, and those relating to the financial statements as a whole can be read further below. Significant accounting policies have been applied consistently to all periods presented in the financial statements.
2.2 Basis of consolidation
The consolidated financial statements comprise the financial statements of Reitan Retail AS and its subsidiaries.
2.2.1 Subsidiaries
Subsidiaries are all entities over which the Group has control. This is when the Group is exposed to, or has rights to, variable returns from its involvement with the entity and has the ability to affect those returns through its power over the entity. The
Reitan Retail AS is a wholly owned subsidiary of REITAN AS. REITAN AS is 100 percent owned by the Reitan family through three holding companies. REITAN AS’ head office is located at Lade Gaard in Trondheim. Reitan Retail AS is included in the consolidated financial statements of REITAN AS. The ultimate parent of the Group is Odd Reitan Private Holding AS.
The consolidated financial statements of Reitan Retail AS were approved by the Company’s Board of Directors on 19 April 2023.
results of subsidiaries are included in the consolidated statement of profit or loss from the date of acquisition or, in the case of disposals, up to the effective date of disposal. Intercompany transactions and balances between Group companies are eliminated upon consolidation.
Non-controlling interests in subsidiaries are presented within equity separately from the equity attributable to the owners of Reitan Retail AS. Non-controlling interests consist of the proportionate fair value of net identifiable assets, and the non-controlling interests’ share of changes in equity at the date of the business combination.
A change in ownership interest of a subsidiary, without a loss of control, is accounted for as an equity transaction. Consideration in excess of, or lower than, the carrying amount of non-controlling interests is recognised against the equity attributable to the owners of the parent. If the Group loses control over a subsidiary, it derecognises the related assets (including goodwill), liabilities, non-controlling interest and other components of equity, while any resultant gain or loss is recognised in the consolidated statement of profit or loss. Any investment retained is recognised at fair value.
2.2.2 Associates
Associates are entities over which the Group has significant influence but not control. Where the Group transacts with an associate, profits and losses are eliminated to the extent of the Group’s interest in the associate. The Group’s share of the post-tax results of its associates is included in the consolidated statement of profit or loss using the equity method of accounting. Investments in associates are carried in the Group balance sheet at historical cost plus post-

112 11
Note 2 – General accounting policies (continued)
acquisition changes in the Group’s share of net assets of the entity, less any provision for impairment. Share of profit of associates is presented as part of operating profit as investments in companies engaged in retail, fuel or real estate-related business activities are considered to be part of Reitan Retail’s main operating activities.
2.2.3 Foreign currencies
The Group’s consolidated financial statements are presented in NOK, which is the parent company’s functional currency.
Foreigncurrencytransactions
Transactions denominated in foreign currencies are translated at the exchange rate at the date of the transaction. Monetary assets and liabilities denominated in foreign currencies at the balance sheet date are translated at the exchange rate ruling at that date.
Foreign exchange differences related to the Group’s working capital are recognised within operating profit for the period. Differences related to financing activities are included in net financial items. Fair value changes in hedging derivatives are recognised within operating profit or net financial items dependent on whether the hedge relates to operating- or financing activities.
Foreignoperations
The Group has foreign entities with functional currency other than NOK. On consolidation, assets and liabilities of foreign operations are translated into NOK at year-end exchange rates. The results of foreign operations are translated into NOK at average rates of exchange each month during the reporting year. Foreign exchange differences arising on translation are recognised in other comprehensive income (OCI). The financial statements of foreign operations are translated into NOK on an individual basis, and not using the step-by-step method.
2.3 Cash flow statement
The cash flow statement is prepared using the indirect method.
2.4 Changes in accounting policies
2.4.1 New and amended standards and interpretations adopted by the Group
There are no new or amended IFRSs or IFRS Interpretation Committee ("IFRIC") interpretations effective as of 1 January 2022 that had a material impact on the Group’s consolidated financial statements.
2.4.2 Standards and revisions effective for future periods
Disclosure ofaccountingpolicies:AmendmentstoIAS1and IFRS PracticeStatement 2
The IASB has issued an amendment to IAS 1 Presentation of FinancialStatements to require entities to disclose their material rather than their significant accounting policies. They further clarify that immaterial accounting policy information does not need to be disclosed. To support this amendment, the IASB also amended IFRS Practice statement 2 Making MaterialityJudgements to provide guidance on how to apply the concept of materiality to accounting policy disclosures. When implementing the amendment, even though some additions to the disclosures may be introduced to present even more Reitan Retail-specific accounting policies, the disclosure of accounting policies is expected to be somewhat reduced in scope, disclosing only those policies that are deemed necessary to understand other material information in the consolidated financial statements of Reitan Retail. The amendment to IAS 1 is effective as of 1 January 2023 and the impact is expected in the annual financial statements for 2023.
Other standards, amendments to standards, and interpretations of standards, issued but not yet effective, are not expected to materially impact the Group’s consolidated financial statements
113 4.2 Consolidated financial statements 4.3 Parent company financial statements Our responsibility Our business Corporate Governance Financial statements Appendix Financial statments Consolidated financial statements | Annual report 2022 12
Note 3 – Financial risk management
The Group’s core operations are in the market of discount grocery stores (REMA 1000 Norway and REMA 1000 Denmark), convenience (Reitan Convenience), and mobility (Uno-X Mobility). In addition, the Group holds a portfolio of real estate in Norway and Denmark.
The Group's activities involve various financial risks: market risk (including currency risk, interest rate risk and price risk), credit risk and liquidity risk. The Group's overall risk management plan focuses on the capital markets' unpredictability and represents an attempt to minimise potential negative effects on the Group's financial performance. The Group makes use of financial derivatives to hedge against certain risks.
The Group's risk management is performed by a central finance department, in accordance with instructions which have been presented to and approved by the Board of Directors. The Group's finance department identifies, evaluates and manages financial risk in close cooperation with the different operational units. The Board of Directors approves the principles for overall risk management, and provides guidelines for specific areas such as currency risk, credit risk, use of financial derivatives and use of surplus cash.
3.1 Market risk
3.1.a Currency risk
The Group’s operations are located in Scandinavia, Finland and the Baltics, and the Group is exposed to currency risk in several currencies. The risk is particularly related to Swedish kroner, Danish kroner and Euro. Currency risk arises from future retail transactions, assets and liabilities recognised in the balance sheet, and net investments in international operations. This risk is still limited, as our operational units mainly have their revenue and costs and keep their accounts in local currency. The Group has investments in foreign subsidiaries, where net assets are exposed to currency risk in foreign currency translation. The Group tries to limit this exposure by ensuring an overall debt portfolio composition which to the greatest possible extent is adapted to the individual currency's and country's relative importance in the Group's activities.
The effect of a 10 percent weakening of Norwegian kroner is shown in the table below. A 10 percent strengthening will have the opposite effect. The effects are calculated on the basis of the Group's net assets (liabilities) in each currency at 31 December 2022 and at 31 December 2021.
3.1.b Security price risk
The Group’s exposure to changes in prices of securities investments is limited, as financial assets at fair value through profit and loss represents a small proportion of total assets.
3.1.c Interest rate risk
The Group’s interest rate risk is related to borrowings, lending and bank deposits. Borrowings within the Group are entered with floating interest rate and represent an interest rate risk for the Group’s cash flow. Interest rate swaps have been established to minimise the interest rate risk related to borrowings in both NOK and foreign currency. The Group's borrowings are in NOK, DKK, SEK and EUR. The Group’s borrowings amounted to NOK 5,141 million as at 31 December 2022 (NOK 3,984 million as at 31 December 2021) with corresponding interest rate swaps with par value of NOK 151 million as at 31 December 2022 (NOK 155 million as at 31 December 2021). A two percentage point increase1 in market interest rates will have the following effects related to borrowings:
The Group’s interest-bearing receivables and cash and cash equivalents amounted to NOK 1,569 million as at 31 December 2022 (NOK 1,533 million as at 31 December 2021), see section Performance measures and definitions for further details A two percentage point increase1 in market interest rates will have the following effects related to interestbearing receivables and bank deposits:
3.2 Credit risk
The most significant part of the Group's operating revenues comes from the sale of goods and services to franchisees. The
114 13
31 December 2022 NOK in millions DKK SEK EUR Currency gain (loss) -38 -93 -97 Effect on OCI 547 91 75 Effect on post-tax profit 518 18 -1 31 December 2021 NOK in millions DKK SEK EUR Currency gain (loss) -23 -46 -104 Effect on OCI 441 80 149 Effect on post-tax profit 423 44 67
December NOK in millions 2022 2021 Decrease (increase) in interest expenses -100 -77 Effect on OCI - -
31
December NOK in millions 2022 2021 Decrease (increase) in interest expenses 31 31 Effect on OCI
31
- -
1Updated to a two percentage point increase in 2022 to reflect the current macroeconomic environment.
Note 3 – Financial risk management (continued)
Group, as franchisor, has a good overview of each franchisee's financial situation. The Group also has established routines for credit assessment and follow-up of business customers other than franchisees such as hotels, restaurants, catering and grocery companies Historically, the Group’s losses on accounts receivables have been low. A certain credit risk also arises from committed transactions with customers, as well as from derivatives and deposits with financial institutions. Counterparties in derivative contracts and financial deposits are limited to financial institutions with high creditworthiness. Uno-X Mobility is exposed to credit risk through its receivables from end customers. Thorough analysis of the credit quality of new customers, and corresponding routines have been implemented for assessment of existing customer relations.
3.3 Liquidity risk
The Group operates in markets with high turnover and large volumes. Cash flows are high and relatively stable, but volatile within a week/month. The Group manages its liquidity risk by ensuring a sufficient amount of cash in combination with sufficient availability of undrawn borrowing facilities Management monitors the Group's liquidity reserves consisting of various borrowing facilities (Note 25) and cash equivalents (Note 21) through rolling forecasts based on expected cash flow. Management follows its liquidity reserves separately for each main currency (NOK, DKK, SEK and EUR). The table below specifies the Group’s borrowings and netsettled derivative financial liabilities into relevant maturity groups based on the remaining period at the balance sheet date to the contractual maturity date. The amounts are undiscounted contractual cash flows. Interest payments are estimated based on the terms at the balance sheet date.
3.4 Risk related to financing and capital structure
In December 2021 Reitan Retail AS established a revolving multi-currency credit facility of NOK 9,000 million, of which NOK 4,500 million matures in 2024, and NOK 4,500 million matures in 2026, and both tranches include two one-year extension options. In addition, Uno-X Mobility AS holds a working capital facility agreement including an overdraft facility of NOK 1,400 million Please see Note 26 – Loan Agreements for further details.
Reitan Retail’s ambition regarding financing and capital structure is referred to in our value principle no. 3: “We aim to be debt-free”. This value principle should be read as a guidance and target to have a robust financial position, with a capital structure allowing us to balance risk and flexibility to act on opportunities.
To improve capital structure, the Group may adjust its investment level, exploit available credit facilities, sell financial investments or adjust the amount of dividend paid to shareholders.
3.5 Inflation risk
The Group is exposed to the general inflationary pressure which affects the prices on goods we purchase for resale to our customers as well as salaries, supply costs (including freight), energy costs and rental costs. 2022 was a year with significant inflation across all countries in which the Group operates, as well as the majority of input factors. See table below for general inflation in the seven countries in which we operate.
The Group seeks to mitigate this risk by strict focus on cost and by being the most streamlined and efficient player in the market, as well as working proactively with suppliers, landlords and other partners/stakeholders to mitigate price increases. Historically, the Group has been able to show resilient margins throughout inflationary cycles, due to the strong operational efficiencies and benefit of scale.
115 4.2 Consolidated financial statements 4.3 Parent company financial statements Our responsibility Our business Corporate Governance Financial statements Appendix Financial statments Consolidated financial statements | Annual report 2022 14
31 December 2022 NOK in millions <1 yr 1-2 yrs 2-5 yrs >5 yrs Total Borrowings 1,124 9 3,991 17 5,141 Estim. interest paym. 194 151 154 - 499 Lease liabilities 3,874 3,536 8,301 12,817 28,528 Trade and other payables 12,913 - 4 - 12,917 Total 18,105 3,696 12,450 12,834 47,085 31 December 2021 NOK in millions <1 yr 1-2 yrs 2-5 yrs >5 yrs Total Borrowings 715 9 3,239 21 3,984 Estim. interest paym. 63 52 53 - 168 Lease liabilities 3,712 3,349 7,759 12,186 27,006 Derivatives 3 - - - 3 Trade and other payables 12,588 - 6 - 12,594 Total 17,081 3,410 11,057 12,207 43,755
31 December Harmonized consumer price index 2022 2021 Norway 6.2 % 3.9 % Denmark 8.5 % 1.9 % Sweden 8.1 % 2.7 % Finland 7.2 % 2.1 % Latvia 17.2 % 3.2 % Estonia 19.4 % 4.5 % Lithuania 18.9 % 4.6 % (Source: Eurostat)
Note 4 – Significant accounting judgements, estimates and assumptions
The preparation of financial statements in accordance with IFRS requires management to make use of judgements, estimates and assumptions that affect the reported amounts of assets and liabilities at the date of the financial statements and the reported amounts of revenues and expenses during the reporting period. Those which are significant to the Group are discussed separately below.
4.1 Significant accounting estimates and assumptions
4.1.a Impairment of non-financial assets
At each reporting date, the Group reviews the carrying amounts of its non-financial assets to determine whether there is any indication of impairment. If any such indication exists, the recoverable amount is estimated. Furthermore, the Group assesses goodwill and other intangible assets with an indefinite useful life annually for impairment.
Impairment exists when the carrying value of an asset or cash-generating unit (CGU) exceeds its recoverable amount, which is the higher of its fair value less costs of disposal and its value in use. The fair value less costs of disposal calculation is based on available data from binding sales transactions, conducted at arm’s length, for similar assets or observable market prices less incremental costs of disposing of the asset. The value in use calculation is based on a discounted cash flow model (DCF). The cash flows are derived from budgets for the next three to five years. The recoverable amount is sensitive to the discount rate used for the DCF model as well as the expected future cash-inflows and the growth rate used for extrapolation purposes. These estimates are most relevant to goodwill and other intangibles with indefinite useful lives recognised by the Group Key assumptions used to determine the recoverable amount for the different CGUs are expected growth in sale of goods and services to franchisees (driven by overall expected growth in systemwide sales*), EBITDA* (earnings before interest, taxes, depreciation and amortisation) and number of sales outlets. See note 12 - Intangible assets for further information.
4.1.b Leases - Estimating the incremental borrowing rate
The Group cannot readily determine the interest rate implicit in its leases, therefore, it uses its incremental borrowing rate (IBR) to measure lease liabilities. The IBR is the rate of interest that the Group would have to pay to borrow over a similar term, and with a similar security, the funds necessary to obtain an asset of a similar value to the right-of-use asset in a similar economic environment. The IBR therefore reflects what the Group ‘would have to pay’, which requires estimation when no observable rates are available (such as
for subsidiaries that do not enter into financing transactions) or when they need to be adjusted to reflect the terms and conditions of the lease. The Group estimates the IBR using observable inputs (such as market interest rates) when available and is required to make certain entity-specific estimates (such as the subsidiary’s stand-alone credit rating). For more information, see note 15 - Leases.
4.2 Judgements
In the process of applying the Group’s accounting policies, management has made the following judgements, which have the most significant effect on the amounts recognised in the consolidated financial statements:
4.2.a Agreements with franchisees
The Group operates franchise-based businesses in the markets of discount grocery stores and convenience under the Reitan Format Franchise model.
Whether the franchisees are agents acting on behalf of the Group as the principal is an important factor to consider when assessing the overall question of how the Group should recognise revenue from the sale of goods, as the assessment determines which party is the Group’s customer and when the Group transfers control of the goods. The Group has determined that the franchisees obtain control of the goods upon delivery to stores and are thus the Group’s customers. This is based on several factors, including the fact that the franchisees obtain formal ownership of goods upon receipt at the sales outlets, and they can determine their use (such as determining which end-customer to sell to and pledging the goods while held in inventory). In contrast, the Group cannot require a franchisee to return or send those goods to other franchisees or instruct the franchisee to sell a good to a specific customer and therefore no longer controls the goods upon delivery to the franchisee.
According to IFRS 10 Consolidated Financial Statements the Group is required to consolidate the franchises if it controls these entities. For an investor to have control over an investee, the investor must have power, be exposed to variable return and have the ability to use its power to influence the variable return. Within the franchise agreement, the franchisee controls the majority, or in some cases all, of the activities related to efficient store operations, hiring and training employees, obtaining financing and investment activities. The Group has power to direct other activities, however, the rights to direct those activities are to a large extent protective rather than substantive. Therefore, the franchisees have power over the
116 15
*Systemwide sales and EBITDA are APMs. For more information, see section Performance measures and definitions.
Note 4 – Significant accounting judgements, estimates and assumptions (continued)
investee. Both parties have the ability to direct different relevant activities, however, it is the Group’s opinion that the franchisee is subject to greater exposure with regard to variable return and to a greater extent has the ability to use its power to influence the variable return. Based on a judgement of the criteria in IFRS 10, the Group has determined that it does not control its franchisees and the franchises are therefore not consolidated.
4.2.b The franchisees’ access to the Group’s store premises
The Group’s franchise agreements may grant a franchisee access to one of the Group’s store premises, provided that the franchisee applies the terms of the agreement and follows any further or changed instructions on the use of the premises as given by the franchisor. Based on a judgment of the criteria in IFRS 16 Leases regarding the identification of a lease, the Group have evaluated and concluded that the franchisee does not have the right to direct the use of the store premises. This mainly relies on the fact that it is the franchisor who controls the decision-making rights that most affect how and for what purpose the premises are used, such as the mix and pricing of goods. Hence, the store access is not considered to represent a lease component in scope of IFRS 16. Rather, it represents a service accounted for in the same way as the remaining revenue from sale of franchise services.
4.2.c Classification of investment in BAMA Gruppen AS
The Group has a 19.8 percent interest in BAMA Gruppen AS. Through the shareholder agreement, the Group is entitled to one seat on the board of BAMA Gruppen AS and participates in significant financial and operating decisions. The Group has therefore determined that it has significant influence over this entity, even though it holds less than 20 percent of the voting rights. BAMA Gruppen AS is classified as an associated company in the Group’s consolidated financial statements.
4.2.d Classification of excise duties
Excise duties are duties which relate to the Group’s sale of refined oil products, sugar sweetened and alcoholic beverages. They are determined and paid directly to the tax authorities and then invoiced to customers by being included in the sales price.
The analysis of the criteria set by IFRS 15 led the Group to determine that it was acting as an agent in these transactions. This conclusion mainly relies on the fact that the Group can reclaim the excise duty in cases where the products
are eventually not sold, and the fact that the excise duties are not considered levied until the moment of the sales transaction. As such, the excise duties are effectively considered sales-related and recoverable from the tax authorities. In markets where products are purchased excluding these excise duties, revenues are reported net of excise duties. In markets where the products are purchased including excise duties, revenues and cost of goods sold are reported including these excise duties.
4.2.e Claims and litigation
The Norwegian Competition Authority has issued a statement of objections to REMA 1000, indicating that it intends to impose an administrative fine of NOK 7,371 million. The Company’s assessment is that it is not likely that a liability exists as at 31 December 2022 (nor at the time of signing the financial statements), and the matter is accordingly treated as a contingent liability for which no provision shall be made. See note 33 - Contingent liabilities for further information.
4.2.f Determining the lease term of contracts with renewal options
The Group has several lease contracts that include extension options. The Group applies judgement in evaluating whether it is reasonably certain whether or not to exercise the option to renew the lease. That is, it considers all relevant factors that create an economic incentive for it to exercise the renewal options. After the commencement date, the Group reassesses the lease term if there is a significant event or change in circumstances that is within its control and affects its ability to exercise or not to exercise the option to renew.
4.2.g Allocation of goodwill to cash-generating units
Judgements are required when allocating goodwill to cashgenerating units. The significant part of the Group’s goodwill is allocated to the Group’s retail segments REMA 1000 Norway, REMA 1000 Denmark and Reitan Convenience, and followed up and tested collectively for the group of cashgenerating units that constitute these retail segments
Goodwill has been allocated to these segments as this is the level where synergies are expected and goodwill is monitored for internal management purposes. For more information, see note 12 - Intangible assets
117 4.2 Consolidated financial statements 4.3 Parent company financial statements Our responsibility Our business Corporate Governance Financial statements Appendix Financial statments Consolidated financial statements | Annual report 2022 16
Note 5 – Segment information
Segment information for 2022 and 2021 is reported in accordance with the reporting to the CEO (Reitan Retail’s chief operating decision maker) and is consistent with financial information used for assessing performance, profitability and capital allocation.
Segment presentation
The Group consists of four reportable retail segments (also referred to as business areas): REMA 1000 Norway, REMA 1000 Denmark, Reitan Convenience and Uno-X Mobility In addition, the Group holds a portfolio of retail properties in Norway and Denmark presented as a separate reportable segment; Real Estate. Other units include the parent companies Reitan Retail AS and REMA 1000 AS. No operating segments have been aggregated to form the above reportable operating segments.
Reitan Retail generates revenues from franchise-based retailing (REMA 1000 Norway and REMA 1000 Denmark), franchise-based convenience services (Reitan Convenience), sale of fuels, lubricants, EV charging and car wash services (Uno-X Mobility) and real estate activities (Real Estate).
Transfer prices between operating segments are on an arm’s length basis in a manner similar to transactions with third parties. Group contribution and dividends within Reitan Retail are not included in the consolidated statement of profit or loss for the segments.
Accounting policies
The segment information is presented in accordance with the Group’s accounting policies, with an exception for measurement of properties owned by the Real Estate segment and used by another business areas in the Group. These properties are in the consolidated financial statements measured at cost applying the requirements in IAS 16 Property,PlantandEquipment. For the Real Estate segment, these properties are carried at fair value pursuant to IAS 40 InvestmentProperties The effect of the measurement differences on the consolidated accounts is illustrated in a separate column in the presentation of financial information per operating segment.
118 17
Note 5 – Segment information (continued)
earnings before interest, taxes, depreciation and amortisation, is an alternative performance measure. For more information, see section Performance measures and definitions.
2Total investments are the sum of purchase of intangible assets, investment properties and property, plant and equipment as presented in the consolidated statement of cash flow, see section Performance measures and definitions for further details.
119 4.2 Consolidated financial statements 4.3 Parent company financial statements Our responsibility Our business Corporate Governance Financial statements Appendix Financial statments Consolidated financial statements | Annual report 2022 18 Financial information per operating segment 2022 NOK in millions REMA 1000 NO REMA 1000 DK Reitan Conv. Uno-X Mob. Real Estate Other units Meas. diff. Elim. Reitan Retail Revenue from sale of franchise services 3,188 1,974 1,682 - - - - - 6,844 Revenue from sale of goods 31,543 30,820 2,412 21,632 - 38 - -61 86,384 Revenue from sale of other services 255 5 735 124 21 89 - -90 1,139 Revenue 34,986 32,799 4,829 21,756 21 127 - -151 94,367 Other income 412 275 256 16 183 29 124 -294 1,001 Share of profit of associates 43 4 - 7 43 - - - 97 Cost of goods sold -27,590 -28,755 -1,755 -19,393 - -32 - 130 -77,395 Other operating exp. incl. salaries -4,011 -2,138 -2,220 -1,195 -98 -284 - 138 -9,808 EBITDA1 3,840 2,185 1,110 1,191 149 -160 124 -177 8,262 Amort. and imp. of intangible assets -161 -14 -11 -96 - 1 - - -281 Depr. and imp. of prop., plant and equipment -454 -194 -297 -213 -1 -9 -89 - -1,257 Depr. and imp. of right-of-use assets -1,526 -729 -803 -159 -7 -23 - 120 -3,127 Operating profit (segment profit) 1,699 1,248 -1 723 141 -191 35 -57 3,597 Total investments2 709 216 398 779 915 25 - - 3,042 Total assets 28,737 14,838 7,426 8,163 5,272 17,329 -112 -24,124 57,529 Revenue - external customers 34,924 32,799 4,829 21,727 - 86 - 2 94,367 Revenue - inter -segment 62 - - 29 21 41 - -153Revenue 34,986 32,799 4,829 21,756 21 127 - -151 94,367 2021 NOK in millions REMA 1000 NO REMA 1000 DK Reitan Conv. Uno-X Mob. Real Estate Other units Meas. diff. Elim. Reitan Retail Revenue from sale of franchise services 3,223 1,798 1,341 - - - - - 6,362 Revenue from sale of goods 31,346 27,739 2,001 13,172 - - - -23 74,235 Revenue from sale of other services 195 4 645 79 35 33 - -86 905 Revenue 34,764 29,541 3,987 13,251 35 33 - -109 81,502 Other income 378 251 281 17 423 26 -198 -280 898 Share of profit of associates 97 3 - 3 125 - - 1 229 Cost of goods sold -27,320 -25,927 -1,525 -10,905 - - - 112 -65,565 Other operating exp. incl. salaries -4,023 -1,897 -1,737 -1,030 -95 -204 - 138 -8,848 EBITDA1 3,896 1,971 1,006 1,336 488 -145 -198 -138 8,216 Amort. and imp. of intangible assets -141 -16 -11 -33 - - - - -201 Depr. and imp. of prop., plant and equipment -448 -197 -296 -176 -2 -6 -32 - -1,157 Depr. and imp. of right-of-use assets -1,466 -699 -788 -155 -7 -22 - 119 -3,063 Operating profit (segment profit) 1,841 1,059 -89 972 479 -173 -230 -19 3,795 Total investments2 941 473 331 560 937 10 - - 3,252 Total assets 27,968 13,905 6,981 6,159 5,045 14,509 -171 -21,611 52,785 Revenue - external customers 34,732 29,541 3,987 13,228 9 - - 5 81,502 Revenue - inter -segment 32 - - 23 26 33 - -114Revenue 34,764 29,541 3,987 13,251 35 33 - -109 81,502 1EBITDA, or
Note 5 – Segment information (continued)
Specification of revenue from sale of goods
The business areas REMA 1000 Norway and REMA 1000 Denmark sell goods to franchisees within REMA 1000 and Reitan Convenience in Norway and Denmark. In the specification of revenue from sale of goods above, sales to franchisees within the business area are included in the line item Revenue from sale of goods to franchisees, while sales to franchisees outside each business area are included in the line item Revenue from sale of goods to other external customers. For the Group, these revenues represent sales to franchisees, with reclassification reflected in the elimination column.
Financial information per geographical area
Non-current assets as presented in the table below does not include financial instruments, deferred tax assets or pension assets.
120 19
2022 NOK in millions REMA 1000 NO REMA 1000 DK Reitan Conv. Uno-X Mob. Other/ Elim. Reitan Retail Rev. from sale of goods to franchisees 26,643 23,874 - - 3,475 53,992 Rev. from sale of goods in dealer and commission op. sales outlets - - 810 5,102 -40 5,872 Rev. from sale of goods in company operated sales outlets 312 110 1,208 11,626 38 13,294 Rev. from sale of goods to other external customers 4,588 6,836 394 4,904 -3,496 13,226 Revenue from sale of goods 31,543 30,820 2,412 21,632 -23 86,384 2021 NOK in millions REMA 1000 NO REMA 1000 DK Reitan Conv. Uno-X Mob. Other/ Elim. Reitan Retail Rev. from sale of goods to franchisees 27,420 21,425 - - 3,044 51,889 Rev. from sale of goods in dealer and commission op. sales outlets - - 1,048 3,098 -22 4,124 Rev. from sale of goods in company operated sales outlets 259 102 541 6,876 - 7,778 Rev. from sale of goods to other external customers 3,667 6,212 412 3,198 -3,045 10,444 Revenue from sale of goods 31,346 27,739 2,001 13,172 -23 74,235
2022 NOK in millions Norway Denmark Sweden Finland Baltics Elim. Reitan Retail Revenue – external customers 49,683 40,996 786 744 2,154 4 94,367 Non- current assets 25,161 11,542 981 1,411 707 - 39,802 2021 NOK in millions Norway Denmark Sweden Finland Baltics Elim. Reitan Retail Revenue – external customers 43,599 34,810 592 730 1,766 5 81,502 Non- current assets 23,687 10,631 1,037 1,373 626 - 37,354
Note 6 – Revenue
Revenue is income arising from the sale of goods and services in the ordinary course of the Group’s activities.
When the Group enters into an agreement with a customer, the goods and services promised in the contract are identified as separate performance obligations to the extent that the customer can benefit from the goods or services either on their own or together with other resources that are readily available to the customer, and that the goods and services are separately identifiable from other promises in the contract.
The Group determines the transaction price to be the amount of consideration which it expects to be entitled in exchange for transferring the promised goods and services to the customer, net of discounts and sales related taxes. In markets where products are purchased excluding excise duties, revenues from sales to customers are reported net of excise duties. In markets where products are purchased including excise duties, revenues and costs of goods sold are reported including these duties.
In determining the transaction price, the Group considers the effect of variable income, and whether there is a significant financing element in the transaction.
If the consideration promised in a contract includes a variable amount, the Group estimates the amount of consideration which it expects to be entitled. An amount of variable consideration is included in the transaction price to the extent that it is highly probable that a significant reversal in the amount of cumulative revenue recognised will not occur when the uncertainty associated with the variable consideration is subsequently resolved.
A trade receivable is recognised if an amount of consideration that is unconditional is due from the customer. See note 19Receivables for the opening and closing balances of trade receivables, and note 30 – Classification of financial instruments for accounting policies of financial assets. Payment for revenue transactions is typically due within 30 days.
Set out below is an overview of the Group’s revenue from contracts with customers:
Revenue from sale of franchise services
The Group’s retail concepts are based on franchising within the market of discount grocery stores and convenience. Services promised in a franchise agreement typically include license to one of the Group’s trade names and operating methods, store access, as well as franchising leadership and support. The store access does not represent a lease component as the franchisee does not have the right to direct the use of the store premises. The store access represents a service accounted for in the same way as the other revenue from sale of franchise services.
The franchise fee is based on a percentage of a store’s sales or contribution margin. The promised franchise services are acc ounted for as a single performance obligation. Agreed franchise fees are recognised over time as the services are rendered in accordance with the franchise agreements.
121 4.2 Consolidated financial statements 4.3 Parent company financial statements Our responsibility Our business Corporate Governance Financial statements Appendix Financial statments Consolidated financial statements | Annual report 2022 20
NOK in millions 2022 2021 Revenue from sale of franchise services 6,844 6,362 Revenue from sale of goods 86,384 74,235 Revenue from sale of other services 1,139 905 Revenue from contracts with customers 94,367 81,502
Note 6 – Revenue (continued)
Revenue from sale of goods
Sale of goods to franchisees
The Group sells goods to franchisees in the market of discount grocery stores and convenience stores. Revenue and a trade receivable are recognised on delivery to the franchisee.
Sale of goods in dealer and commission operated sales outlets
The Group sells goods in dealer and commission operated sales outlets in the market of convenience stores and mobility locations. Dealer and commission operated sales outlets are based on commission sales where the Group own the inventory and pay a commission fee to the dealer or commission-based retailer Revenue is recognised when the end customer obtains control of the goods, which is when the transaction is completed in-store.
Sale of goods in company operated sales outlets
The Group sells goods directly to retail customers in company operated sales outlets. Revenue is recognised when the customer obtains control of the goods, which is when the transaction is completed in-store.
Sale of goods to other external customers
In addition to the above, the Group sells goods directly to external business customers such as hotels, restaurants, catering and grocery companies. The Group also sells liquid fuel to external business customers. Revenue and a trade receivable are recognised on delivery of the goods at the customer’s location.
Revenue from sale of other services
Revenue from sale of other services includes marketing income, agent income and revenue from sale of car wash services.
Marketing income is recognised as revenue when the Group provides a distinct good or service to a supplier. To the extent that a payment from a supplier is related to a specific ad or campaign that the supplier has agreed to cover its share of, the payment is deducted from the period's marketing costs. Other payments from suppliers that are not made in exchange for a specified good or service are recognised as a reduction in cost of goods sold.
The Group recognises agent income related to sale of transport tickets, lotteries, telephone cards and gift cards through company operated sales outlets. In these agreements, the Group acts as an agent and as such, only the commission is reported as revenue. Agent income is recognised as it is earned, i.e. when sold to end customers.
Excise duties
Excise duties are duties which relate to the Group’s sale of refined oil products, sugar sweetened and alcoholic beverages. They are determined and paid directly to the tax authorities and then invoiced to customers by being included in the sales price.
The following table summarises the Group’s excise duties which are collected on behalf of third parties and excluded from revenue.
122 21
NOK in millions 2022 2021 Excise duties on refined oil products 9,253 8,762 Excise duties on sugar sweetened and alcoholic beverages 433 343
Note 7 – Other income
Note 8 – Salaries and personnel costs
Key management compensation
The table below outlines the compensation paid to the CEO for 2022 and 2021.
The table below outlines key management compensation for 2022 and 2021 for all key management except the CEO. Cost of hiring the CFO from REITAN is not included in the table. See note 32 – Related party transactions in regards of fee paid for key management personnel services to REITAN.
NOK 32 million in payment due to termination of previous long-term agreement in 2021
123 4.2 Consolidated financial statements 4.3 Parent company financial statements Our responsibility Our business Corporate Governance Financial statements Appendix Financial statments Consolidated financial statements | Annual report 2022 22
NOK in millions Note 2022 2021 Rental income 15 590 561 Net gains (losses) 89 23 Revaluation of investment property 13 51 57 Other 271 257 Total other income 1,001 898 Specification of net gains (losses) NOK in millions 2022 2021 Gains on sale of property, plant and equipment 47 13 Gains (losses) on termination of lease agreements 28 -5 Foreign currency exchange gains (losses) from operating activities 14 -3 Fair value changes on financial instruments related to operating activities - 18 Other gains (losses) -Net gains (losses) 89 23
Salaries NOK in millions 2022 2021 Salaries and holiday pay1 -3,373 -3,162 Social security tax -330 -329 Pension costs 1 -213 -195 Other personnel costs1 -87 -97 Total salaries and personnel costs -4,003 -3,784 Average number of employees 6,141 5,721 Number of full-time equivalents in the year 5,229 4,877
NOK in millions 2022 2021 Salary and other short-term employee benefits -8.3 -5.2 Pension costs 2 -1.0 -0.1 Total compensation paid to the CEO -9.2 -5.3
NOK in millions 2022 2021 Salary and other short-term employee benefits -65 -61 Other long -term benefits1 -7 -39 Pension costs 2 -8 -7 Termination benefits - -19 Total compensation paid to key management personnel, excl. CEO -80 -126 1
Includes
Note 8 – Salaries and personnel costs (continued)
Loans and security for loans to employees, executives, etc.
The Group had no loans to employees as at 31 December 2022 or at 31 December 2021. No loans have been granted to, nor security pledged for, the chief executive officer, chairman of the board or other close associates.
Remuneration to the Bo ard of Directors
Information about the individual remuneration to the members of the Board of Directors is provided in the table below.
NOK in millions
Rune Bjerke (Chairman of the Board from May 2022) -0.5 -
Magnus Reitan (Board Member from May 2010) -
Eilert Giertsen Hanoa (Board Member from May 2022) -0.3
Odd Reitan (Chairman of the Board until May 2022)-
Ole Robert Reitan (Board Member until May 2022)-
Shares in the company owned by directors; executives and their related parties
Ole Robert Reitan, CEO of Reitan Retail, and Magnus Reitan, Board Member of Reitan Retail, own 67 percent of the shares in REITAN AS, which is the parent company of Reitan Retail AS.
Pensions
The Group has several pension schemes for its employees. There are various schemes in the different countries that Reitan Retail operates in, and the schemes also vary between companies within the same country. The majority of the companies within the Group offer their employees defined contribution plans. The Norwegian companies in the Group are subject to, and complies with, the requirements of the Norwegian Mandatory Company Pensions Act.
As per 31 December 2022 the Group has defined contribution plans with 4,462 members (3,979 members as per 31 December 2021) and defined benefit plans with 386 members (423 members as per 31 December 2021).
For defined contribution plans, the Group pays contributions to privately administered pension insurance plans on a mandatory, contractual or voluntary basis. The Group has no further payment obligations once the contributions have been paid. The contributions are recognised as employee benefit expense when they are due.
A defined benefit plan typically defines an amount of pension benefit that an employee will receive on retirement, usually dependent on one or more factors such as age, years of service and compensation. In addition to funded defined benefit plans funded through insurance companies, the Group also has unfunded pension liabilities covered by operations.
The net assets and net obligations recognised on the consolidated balance sheet for defined benefit plans represent the actual surplus or deficit in the Group’s defined benefit plans measured as the present value of the defined benefit obligations less the fair value of plan assets.
The defined benefit obligation is calculated annually by independent actuaries using the projected unit credit method. Actuarial gains and losses arising from experience adjustments and changes in actuarial assumptions are charged or credited to equity i n other comprehensive income in the period in which they arise.
Due to group level materiality considerations, further description of characteristics, risks and assumptions in regards of the defined benefit plans is not considered necessary for a sufficient understanding of the consolidated financial statements of Reitan Retail.
124 23
2022
2021
-
-
Note 8 – Salaries and personnel costs (continued)
Defined benefit plans
The Group has several defined benefit plans. Net assets relating to one plan are not offset against obligations of another plan, resulting in the following presentation in the consolidated balance sheet:
All amounts relating to audit fees specified above are exclusive of VAT. Audit fees covered on behalf of franchisees are not included in total fees to auditors.
125 4.2 Consolidated financial statements 4.3 Parent company financial statements Our responsibility Our business Corporate Governance Financial statements Appendix Financial statments Consolidated financial statements | Annual report 2022 24 Specification of pension costs NOK in millions 2022 2021 Defined benefit plans -2 -5 Defined contribution plans -211 -190 Pension costs (incl. in salaries and personnel costs) -213 -195 Net interest expenses - defined benefit plans (incl. in other interest expenses) -1 -1 Remeasurement of defined benefit plans (incl. in other compr. income) 1 -5 Total pension costs -213 -201
Netpensionobligations NOK in millions 2022 2021 Defined benefit obligations -133 -148 Fair value of plan assets 51 54 Net pension obligations as at 31 December -1 -82 -94 Netpensionasset NOK in millions 2022 2021 Defined benefit obligations 2 -69 -75 Fair value of plan assets2 73 78 Net pension asset as at 31 December 4 3 Fees to auditors NOK in millions 2022 2021 Statutory audit services -15 -14 Assurance services -1 -1 Other non -audit services -9 -2 Tax advisory services -1 -1 Total fees to auditors -26 -18 Audit fees covered on behalf of franchisees -11 -11
Note 9 – Other operating expenses
See note 15 - Leases for more information on lease expenses not capitalised.
Note 10 – Net financial items
Reconciliation of interest paid as presented in the consolidated statement of cash flow:
126 25
NOK in millions 2022 2021 Lease expenses not capitalised -412 -220 Maintenance expenses -1,042 -916 Distribution -1,280 -1,096 IT -685 -664 Loss on receivables -64 -42 Other -2,322 -2,126 Total other operating expenses -5,805 -5,064
NOK in millions 2022 2021 Interest income - cash and cash equivalents 61 5 Interest income - customers 10 6 Interest income - other 8 10 Total interest income 79 21 Interest expense - lease liabilities -811 -799 Interest expense - borrowings from banks -187 -54 Interest expense - borrowings from parent company - -7 Net interest expense - interest rate swaps - -3 Interest expense - provisions for liabilities -12 -8 Interest expense - other -29 -40 Total other interest expenses -228 -112 Dividend income, received from financial investments 2 2 Realised gains (losses) on financial investments 1 3 Unrealised gains (losses) on financial investments -249 195 Net gains (losses) on financial investments -246 200 Net foreign currency exchange gains (losses) on financing activities 65 138 Fair value gains (losses) on derivative financial instruments 3 5 Net other financial income (expenses) -3 3 Net other financial items 65 146 Net financial items -1,141 -544
NOK in millions 2022 2021 Interest expense - lease liabilities -811 -799 Total other interest expenses -228 -112 Total interest expenses -1,039 -911 Less: Interest expense - borrowings from parent company - 7 Less: Interest expense - provisions for liabilities 12 8 Interest paid -1,027 -896
Note 11 – Income taxes
The income tax expenses for a period consists of current taxes and change in deferred taxes. Tax payable is calculated in accordance with the tax laws and regulations that apply to the accounting period.
Deferred tax is recognised on temporary differences between the tax bases of assets and liabilities and their carrying amounts in the consolidated financial statements. Changes in net deferred tax are included in the income tax expense for the period. The determination of deferred tax is based on tax rates (and laws) that have been enacted or substantially enacted by the balance sheet date, and which are assumed to be used when the deferred tax asset is realised or when the deferred tax liability is settled.
Deferred tax assets are recognised only to the extent that it is probable that future taxable income will exist and available so the temporary differences can be utilised.
The tax effect on items recognised in comprehensive income are included in the comprehensive income statement. The same applies to any tax effects of equity transactions that are entered directly against equity.
Deferred tax assets and liabilities are offset to the extent that the deferred taxes relate to the same fiscal authority, and there is a legally enforceable right to offset current tax assets against current tax liabilities.
The nominal tax rates in the countries in which the Group operates were as follows in 2022 and 2021; 22.0 percent in Norway, 20.6 percent in Sweden, 22.0 percent in Denmark, 20.0 percent in Finland, 15.0 percent in Lithuania, 0.0 percent in Latvia, and 0.0 percent in Estonia. In Latvia and Estonia, a tax rate of 20.0 percent is payable on dividend payments.
The Group is working on a project to conclude on the impact of the OECD’s BEPS Pillar 2.
127 4.2 Consolidated financial statements 4.3 Parent company financial statements Our responsibility Our business Corporate Governance Financial statements Appendix Financial statments Consolidated financial statements | Annual report 2022 26
Income tax expenses and income tax payable NOK in millions 2022 2021 Current tax on profit for the year -605 -605 Adjustments in current tax previous years -8 -3 Changes in deferred tax 2 -43 Income tax expenses -611 -651 Current tax on profit for the year 1 605 605 Prepaid taxes -416 -394 Effect of group contribution -139 -55 Acquisition and disposal of subsidiaries and other effects -11 -4 Net income tax payable as at 31 December 39 152 Income tax payable (liability) 124 195 Prepaid taxes (receivable) -85 -43 Net income tax payable as at 31 December 39 152 Reconciliation of Norwegian corporate income tax rate to effective tax rate NOK in millions 2022 2021 Profit before taxes 2,456 3,296 Expected corporate income tax rate in Norway 22 % -540 -725 Effect of different tax rates outside Norway -22 -12 Effect of changes in tax rates -1 -1 Effect of non-deductible expenses -65 -17 Effect of share of profit of associates reported net of tax 19 51 Effect of non-taxable income 6 58 Effect of adjustments in taxes previous years -8 -3 Other - -2 Income tax expenses -611 -651 Effective tax rate in % 25% 20%
Note 11 – I ncome taxes (continued)
Tax effect of temporary differences

Deferred tax assets (DTA)
Deferred tax liabilities (DTL)
128 27
NOK in millions Intangible assets Investment prop. Property, plant and equipm. Right-of-use assets / lease liab. Provisions Tax losses carried forward Other Total DTA as at 1 Jan. 2021 - 11 105 445 143 30 79 813 Recognised in profit or loss - -1 -33 - -2 -5 27 -14 Recognised in OCI - - - - - - -Acquisition / disposal of subs. - - -5 - - - - -5 Translation differences - - - -4 -3 -1 -2 -10 DTA as at 31 Dec. 2021 - 10 67 441 138 24 104 784 Recognised in profit or loss - 1 34 -2 3 49 -31 54 Recognised in OCI - - - - - - -Acquisition / disposal of subs. - - - - - 1 - 1 Translation differences - 1 1 4 3 2 - 11 DTA as at 31 Dec. 2022 - 12 102 443 144 76 73 850
NOK in millions Intangible assets Investment prop. Property, plant and equipm. Right-of-use assets / lease liab. Provisions Tax losses carried forward Other Total DTL as at 1 Jan. 2021 -219 -14 -313 -1 -5 -94 -49 -695 Recognised in profit or loss - 6 -57 -3 1 16 7 -30 Recognised in OCI - - - - - - -17 -17 Acquisition / disposal of subs. - - -28 - - - -1 -29 Effect of group contribution - - - - - - -11 -11 Translation differences 6 - 7 -1 - 6 2 20 DTL as at 31 Dec. 2021 -213 -8 -391 -5 -4 -72 -69 -762 Recognised in profit or loss 1 - -53 - -1 - 1 -52 Recognised in OCI - - - - - - 5 5 Acquisition / disposal of subs. 7 - -16 - - - - -9 Effect of group contribution - - - - - - -85 -85 Translation differences -21 - -13 - - 2 -1 -33 DTL as at 31 Dec. 2022 -226 -8 -473 -5 -5 -70 -149 -936
Note 11 – I ncome taxes (continued)
Net deferred tax assets (liabilities)
Deferred tax assets related to tax losses carried forward are recognised if there is convincing evidence that sufficient taxable income will be available through future taxable income. As at 31 December 2022, the Group has
million as at 31 December 2021) deferred tax assets that have not been recognised.
Deferred tax assets and deferred tax liabilities recognised in the statement of financial position
129 4.2 Consolidated financial statements 4.3 Parent company financial statements Our responsibility Our business Corporate Governance Financial statements Appendix Financial statments Consolidated financial statements | Annual report 2022 28
NOK in millions Intangible assets Investment prop. Property, plant and equipm. Right -of-use assets / lease liab. Provisions Tax losses carried forward Other Total Net DTA (DTL) as at 1 Jan. 2021 -219 -3 -208 444 138 -64 30 118 Recognised in profit or loss - 5 -90 -3 -1 11 34 -44 Recognised in OCI - - - - - - -17 -17 Acquisition / disposal of subs. - - -33 - - - -1 -34 Effect of group contribution - - - - - - -11 -11 Translation differences 6 - 7 -5 -3 5 - 10 Net DTA (DTL) as at 31 Dec. 2021 -213 2 -324 436 134 -48 35 22 Recognised in profit or loss 1 1 -19 -2 2 49 -30 2 Recognised in OCI - - - - - - 5 5 Acquisition / disposal of subs. 7 - -16 - - 1 - -8 Effect of group contribution - - - - - - -85 -85 Translation differences -21 1 -12 4 3 4 -1 -22 Net DTA (DTL) as at 31 Dec. 2022 -226 4 -371 438 139 6 -76 -86
NOK 36 million (NOK 10
NOK in millions 2022 2021 Deferred tax assets, not offset within the same taxation auth. 850 784 Effect of deferred tax assets offset against deferred tax -259 -213 Deferred tax assets in the balance as at 31 December 591 571 Deferred tax liabilities, not offset within the same tax auth. 936 762 Effect of deferred tax liabilities offset against deferred tax assets -259 -213 Deferred tax liabilities in the balance as at 31 December 677 549 Net deferred tax assets (liab.) as at 31 December -86 22 Income tax expenses recognised in other comprehensive income NOK in millions 2022 Before tax 2022 Tax 2022 After tax 2021 Before tax 2021 Tax 2021 After tax Share of OCI of associates -2 - -2 4 - 4 Foreign currency translation effect 304 - 304 -312 - -312 Net gain/(loss) on cash flow hedges -23 5 -18 76 -14 62 Remeasurement gain (loss) on defined benefit plans 2 - 2 -4 - -4 Other comprehensive income 281 5 286 -236 -14 -250
Note 12 – I ntangible assets
Goodwill
Goodwill acquired through business combinations has been allocated to individual cash-generating units (CGUs). Goodwill is tested for impairment annually and when circumstances indicate that the carrying value may be impaired. It is carried at cost less any provision for impairment. Impairment is determined by assessing the recoverable amount of CGU, or group of CGUs, to which the goodwill relates.
Trademarks, licences and IT
The Group’s trademarks include trademarks such as R-kioski (Finland), R-kiosk (Estonia) and Lietuvos Spauda (Lithuania). The Rkioski, R-kiosk and Lietuvos Spauda trademarks are considered to have indefinite useful lives. Trademarks that have indefinite lives, since they are expected to provide economic benefits to the Group indefinitely, are not amortised, but tested for impairment annually or more frequently should events or changes in circumstances indicate that they might be impaired.
Licences and IT systems are amortised on a straight-line basis over their useful economic lives of 5 to 10 years. Carrying amounts are reviewed at each reporting date to determine whether there is any indication of impairment.
Research and development costs
Costs relating to development of IT systems for internal use are capitalised once the recognition criteria of IAS 38 IntangibleAssets are met, i.e. that it is probable that the expected future economic benefits that are attributable to the asset will flow to the entity, management has committed itself to complete the asset, the technical feasibility of completing the asset has been demonstrated and the cost can be measured reliably. Other development expenditures that do not meet these criteria are expensed as incurred. When the asset is available for its intended use, these costs are amortised on a straight-line basis over their useful economic lives of 5 to 10 years. Research costs are expensed as incurred.
Impairment of intangible assets
Intangible assets with finite useful lives are considered for impairment when there is an indication that the asset has been impaired. Goodwill and other intangible assets with indefinite useful lives are tested annually for impairment and whenever there is an indication of impairment.
Any impairment loss is recognised in the consolidated statement of profit or loss in the year in which it occurs. Where an impairment loss, other than an impairment loss on goodwill, subsequently reverses due to a change in the original estimate, the carrying amount of the asset is increased to the revised estimate of its recoverable amount, or its original carrying value less notional accumulated depreciation if lower.
130 29
Note 12 – I ntangible assets (continued)
The Group has not recognised any significant impairments in 2022 or 2021. The impairment of goodwill in 2022 relates to an acquisition in the Uno-X Mobility segment (acquisition of Ipart Group in November 2022), which is considered immaterial to the Group.
131 4.2 Consolidated financial statements 4.3 Parent company financial statements Our responsibility Our business Corporate Governance Financial statements Appendix Financial statments Consolidated financial
| Annual report 2022 30 Intangible assets NOK in millions Goodwill Trademarks, licences and IT Development Total Cost price 2,813 2,659 33 5,505 Accumulated amortisation and impairment charges -198 -1,431 - -1,629 Carrying amount as at 1 January 2021 2,615 1,228 33 3,876 Additions - 94 49 143 Additions from acquisition of subsidiaries - - -Reclassifications - 64 3 67 Disposal - -4 - -4 Amortisation - -200 - -200 Impairment loss - -Foreign currency translation effects -66 -29 - -94 Carrying amount as at 31 December 2021 2,550 1,154 86 3,789 Cost price 2,738 2,621 86 5,445 Accumulated amortisation and impairment charges -188 -1,468 - -1,656 Carrying amount as at 31 December 2021 2,550 1,154 86 3,789 Additions - 139 91 230 Additions from acquisition of subsidiaries 60 36 7 103 Reclassifications - 71 -55 16 Disposal - -4 - -4 Amortisation - -221 - -221 Impairment loss -60 - - -60 Foreign currency translation effects 57 18 - 75 Carrying amount as at 31 December 2022 2,607 1,193 129 3,928 Cost price 2,851 2,865 106 5,822 Accumulated amortisation and impairment charges -244 -1,673 23 -1,894 Carrying amount as at 31 December 2022 2,607 1,193 129 3,928
statements
Note 12 – I ntangible assets (continued)
Estimate for measuring recoverable amount
Impairment is determined by assessing the recoverable amount of each CGU to which the goodwill or trademarks relates. If the recoverable amount of a CGU is less than its carrying amount, an impairment loss is recognised.
The recoverable amount is determined based on value in use calculations using cash flow projections from financial prognosis approved by management, covering a three to five year period. A terminal value is calculated for the period beyond the initial prognosis period, using a constant nominal growth rate, corresponding to country specific expected long-term inflation
The cash flow projections are based on past performance, expected market development and strategic plans, with the three most important parameters being expected growth in sale of goods and services to franchisees (driven by overall expected growth in systemwide sales*), EBITDA* (operating profit before amortisation, depreciation and impairment) and number of sales outlets.
The Group constantly monitors the latest government legislation in relation to climate-related matters. At the current time, no legislation has been passed that will impact the Group. The Group will adjust the key assumptions used in value in use calculations and sensitivity to changes in assumptions should a change be required.
The Group uses observable market data, such as risk-free rates and market risk premiums obtained from recognised financial data services, for the calculation of discount rates. In the recoverable amount assessment, the Group has applied estimated cash flows after tax and corresponding discount rates after tax. The recoverable amounts would not change significantly if pre-tax cash flows and pre-tax discount rates had been applied instead.
Goodwill and trademarks are allocated to CGUs or groups of CGUs as shown in the following table:
Sensitivity
Goodwill and trademarks with indefinite useful lives are related to financially strong business areas. The Group has carried out sensitivity analyses on the reasonably possible changes in key assumptions in the impairment tests for each group of CGUs to which goodwill or trademarks have been allocated. Neither a reasonably possible increase of 2.0 percentage point in discount rates, nor a decrease of 2.0 percentage point in long-term growth rates would indicate impairment in any group of cashgenerating units to which goodwill has been allocated.
*Systemwide sales and EBITDA are APMs. For more information, see section Performance measures and definitions.
132 31
NOK in millions WACC Goodwill Trademarks Total REMA 1000 Norway 6.5 % 1,039 - 1,039 REMA 1000 Denmark 6.1 % 158 - 158 Reitan Convenience 8.5 % 1,406 309 1,715 Uno-X Mobility - 4 - 4 Carrying amount as at 31 December 2022 2,607 309 2,916 NOK in millions WACC Goodwill Trademarks Total REMA 1000 Norway 4.6 % 1,039 - 1,039 REMA 1000 Denmark 4.1 % 150 - 150 Reitan Convenience 7.8 % 1,357 285 1,642 Uno-X Mobility - 4 - 4 Carrying amount as at 31 December 2021 2,550 285 2,835
Note 13 – I nvestment properties
Investment property comprises completed property and property under construction that is held, or to be held, to earn rentals or for capital appreciation or both.
Investment property is initially measured at acquisition cost, including related transaction costs. After initial recognition, investment property is carried at fair value. Changes in fair value of investment properties are included in other income in the consolidated statement of profit or loss in the period in which they arise.
The Group’s investment property comprises retail property that is not occupied substantially for use by, or in the operations of, the Group, nor for sale in the ordinary course of business, but is held primarily to earn rental income and capital appreciation.
1Relates to sale of a shopping center in Denmark, July 2022.
Fair value of investment properties
Investment property, both completed and under construction, is valued at its fair value based on a valuation update at the end of each reporting period. The valuation method is included at level 3 in the valuation hierarchy. See note 31 – Fair value measurement. The Group’s valuation process is based on internal analysis and is approved by the Board of Directors.
Properties are valued by discounting future cash flows, and the assessment depends largely on significant unobservable inputs related to market rents, discount rates and ownership costs. Market rents are based on individual assessments of each property and on segmentations of different areas within the properties if relevant. To the extent that a specific development potential is associated with a property, an assessment is made of whether this supports or influences fair value. Updated macroeconomic assumptions for interest-rate levels, inflation expectations and so forth are applied in the calculations. Inflation expectations are based on consensus views from banks and public statistical agencies. Based on an assessment of the properties, tenants and macroeconomic conditions at the balance sheet date, cash flows are discounted using discount rates based on individual assessments of each property.
The following table summarises the quantitative information about the significant unobservable inputs used in level 3 fair value measurements:
133 4.2 Consolidated financial statements 4.3 Parent company financial statements Our responsibility Our business Corporate Governance Financial statements Appendix Financial statments Consolidated financial statements | Annual report 2022 32
NOK in millions 2022 2021 Carrying amount as at 1 January 326 243 Additions 19 38 Reclassifications -7Disposals1 -347 -1 Revaluation 51 57 Foreign currency translation effects 6 -11 Carrying amount as at 31 December 1 48 326 Of which classified as completed investment property 48 326 Of which classified as investment property under construction -Carrying amount as at 31 December 2 48 326 Carrying amount of
-Carrying amount of contingent assets
-Carrying amount of investment
-Carrying amount of investment
-Rental income from investment property 26 23 Operating expenses related to leased out investment property -2 -3 Operating expenses related to vacant investment property - -
investment property held as collateral for debt
related to investment property
property held for sale
property held under a finance lease
2022 202 1 Market rent per m2 (average, NOK in thousands) 3.1 2.3 Discount rate (range) 1.6 % - 11.9 % 6.0 % - 8.8 % Ownership costs (NOK in millions) -3 -3
Note 14 – Property, plant and equipment
Property, plant and equipment are held at historical cost less accumulated depreciation and any recognised provision for impairment. Subsequent costs are included in the asset’s carrying amount. Repair and maintenance are expensed as incurred. Where applicable, estimated asset retirement costs and costs relating to environmental restoration are added to the cost of the relevant asset. See note 24 – Provisions for further information on asset retirement obligations and environmental obligations.
Depreciation is calculated using the straight-line method to allocate the cost of the assets, net of their residual values, over their estimated useful lives as follows:
The assets' residual values and useful lives are reviewed, and adjusted if appropriate, at the end of each reporting period.
Property, plant and equipment are tested for impairment if an event or circumstance indicates that the carrying amount may not be recoverable. If an asset’s carrying amount exceeds its recoverable amount, an impairment loss is recognised. When testing for impairment, assets are grouped at the lowest level where it is possible to establish separate cash flows (cash-generating units). Reversals of previous impairments are considered at the end of each reporting period.
Gains and losses on disposal are recognised in the consolidated statement of profit or loss under Net gains (losses) and constitute the difference between net proceeds and carrying amount.
134 33
Buildings and plants 10-25 years Fixtures 5-10 years Vehicles 5-25 years Office equipment 3-5 years Land -
Note 14 – Property, plant and equipment (continued) –
Purchase of property, plant and equipment as presented in the cash flow statement
Proceeds from sale of property, plant and equipment as presented in the cash flow statement
Assets pledged as security
As at 31 December 2022, properties with a carrying amount of NOK 224 million (NOK 192 million as at 31 December 2021) were subject to borrowings secured by collateral. See note 25 – Borrowings for further details
The Group had no assets classified as restricted or held for sale as at 31 December 2022, or as at 31 December 2021.
135 4.2 Consolidated financial statements 4.3 Parent company financial statements
Our
34 Property, plant and equipment NOK in millions Land, buildings and plants Fixtures Vehicles Office eq. Constr. in progr. Total Cost 4,378 11,117 91 3,085 1,872 20,543 Accumulated depreciation and impairment -1,100 -6,993 -33 -1,928 -21 -10,075 Carrying amount as at 1 January 2021 3,278 4,124 58 1,157 1,851 10,468 Additions 1,032 1,219 12 191 609 3,063 Additions from acquisition of subsidiaries 7 - - 1 - 8 Reclassifications 1,058 908 -1 17 -2,051 -69 Disposal -744 -101 -4 -21 -2 -872 Depreciation -131 -831 -8 -183 - -1,153 Impairment -1 -2 - -1 - -4 Reversals of impairment - - - - -Foreign currency translation effects -90 -73 - -13 -10 -186 Carrying amount as at 31 December 2021 4,409 5,244 57 1,148 397 11,255 Cost 5,430 12,015 91 3,050 416 21,002 Accumulated depreciation and impairment -1,021 -6,771 -34 -1,902 -19 -9,747 Carrying amount as at 31 December 2021 4,409 5,244 57 1,148 397 11,255 Additions 1,153 988 7 232 174 2,554 Additions from acquisition of subsidiaries 127 5 - 4 - 136 Reclassifications 85 69 2 20 -187 -11 Disposal -403 -80 -2 -2 -14 -501 Depreciation -194 -861 -8 -189 - -1,252 Impairment -2 -7 - -2 -6 -17 Reversals of impairment - 12 - - - 12 Foreign currency translation effects 125 77 - 17 7 226 Carrying amount as at 31 December 2022 5,300 5,447 56 1,228 371 12,402 Cost 6,506 12,539 95 3,334 394 22,868 Accumulated depreciation and impairment -1,206 -7,092 -39 -2,106 -23 -10,466 Carrying amount as at 31 December 2022 5,300 5,447 56 1,228 371 12,402
Our responsibility
business Corporate Governance Financial statements Appendix Financial statments Consolidated financial statements | Annual report 2022
Land, buildings and plants Fixtures Vehicles Office eq. Constr. in progr. Total NOK in millions 2022 1,280 993 7 236 174 2,690 2021 1,039 1,219 12 192 609 3,071
Land, buildings and plants Fixtures Vehicles Office eq. Constr. in progr. Total NOK in millions 2022 442 87 3 2 14 548 2021 757 101 4 21 2 885
Note 15 – Leases
The Group as a lessee
The Group operates franchise-based businesses in the markets of discount grocery stores and convenience. As such, it has a longterm need for appropriate properties in the right locations – for sales outlets as well as warehouses and logistics operations. The large number of leases with options to extend the lease ensure flexibility and future performance.
At the lease commencement date, the Group recognises a lease liability and corresponding right-of-use asset for all lease agreements in which it is the lessee, except for the following exemptions applied:
• Short-term leases (defined as 12 months or less)
• Low-value assets
For these exempted leases, the Group recognises the lease payments as other operating expenses in the consolidated statement of profit or loss when they are incurred.
Right-of-use assets
Right-of-use assets are recognised at the commencement date of the lease (i.e. the date the underlying asset is available for use)
Separating components in the lease contract
For contracts that constitute, or contain a lease, the Group separates lease components if it benefits from the use of each underlying asset either on its own or together with other resources that are readily available, and the underlying asset is neither highly dependent on, nor highly interrelated with, the other underlying assets in the contract. The Group then accounts for each lease component within the contract as a lease separately from non-lease components of the contract.
Measuring right-of-use assets
The Group measures the right-of-use asset at cost, less any accumulated depreciation and impairment losses, adjusted for any remeasurement of lease liabilities. The cost of the right-of-use asset comprise:
• The amount of the initial measurement of the lease liability recognised
• Any lease payments made at or before the commencement date, less any incentives received
• Any initial direct costs incurred by the Group (for example key money)
• An estimate of the costs to be incurred by the Group in dismantling and removing the underlying asset, restoring the site on which it is located or restoring the underlying asset to the condition required by the terms and conditions of the lease, unless those costs are incurred to produce inventories
The Group applies the depreciation requirements in IAS 16 Property,PlantandEquipmentin depreciating the right-of-use asset, except that the right-of-use asset is depreciated from the commencement date to the earlier of the lease term and the remaining useful life of the right-of-use asset.
The Group assesses, at each reporting date, whether there is an indication that a right-of-use asset may be impaired. If any indication exists, the Group estimates the right-of-use asset’s recoverable amount. When the carrying amount exceeds its recoverable amount, the right-of-use asset is considered impaired and is written down to its recoverable amount.
136 35
Note 15 – Leases (continued)
Right-of-use assets
The remeasurements of right-of-use assets relating to sales outlets are mainly resulting from changes in lease terms as well as changes in indexes used to determine the lease payments Increase in remeasurements compared to last year mainly relates to the current macroeconomic environment and inflationary pressure, refer to note 3 – Financial risk management, section 3.5.
137 4.2 Consolidated financial statements 4.3 Parent company financial statements
Our business Corporate Governance Financial
Appendix Financial
36
Our responsibility
statements
statments Consolidated financial statements | Annual report 2022
NOK in millions Land Sales outlets Warehouse and prod.fac. Offices Vehicles and offices eq. Total Carrying amount as at 1 January 2021 412 17,065 2,851 302 349 20,979 Reclassifications - - -2 - - -2 Additions 71 909 29 2 157 1,168 Disposals -4 -2 -2 - - -8 Remeasurements 67 1,830 267 23 3 2,190 Impairment - -11 - - - -11 Reversal of impairment - 68 - - - 68 Depreciation -70 -2,497 -332 -60 -117 -3,076 Foreign currency translation effects -3 -294 -35 -5 -5 -342 Carrying amount as at 31 December 2021 473 17,068 2,776 262 387 20,966 Reclassifications - - - - -Additions 132 796 846 1 116 1,891 Disposals - -13 - - -2 -15 Remeasurements 41 1,972 109 108 4 2,234 Impairment - -4 - - - -4 Reversal of impairment - 19 - - - 19 Depreciation -80 -2,611 -271 -54 -126 -3,142 Foreign currency translation effects 4 277 63 -1 5 348 Carrying amount as at 31 December 2022 570 17,504 3,523 316 384 22,297 Remaining lease term 1-30 1-45 years 1-25 years 1-10 years 1-7 years Depreciation method Straight Straight Straight Straight Straight
Number of leases Land Sales outlets Warehouse and prod.fac. Offices Number of lease contracts as at 31 December 2021 188 3,069 86 49 Number of lease contracts as at 31 December 2022 218 3,081 87 37 Number of lease contracts containing options to extend the lease as at 31 December 2022 17 1,404 13 10
Note 15 – Leases (continued)
Lease liabilities
The Group measures the lease liability at the present value of the lease payments to be made over the lease term. The lease payments include:
• Fixed lease payments (including in-substance fixed payments), less any lease incentives receivable
• Variable lease payments that depend on an index or a rate
• Amounts expected to be paid under residual value guarantees
• The exercise price of a purchase option, if the Group is reasonably certain to exercise that option
• Payments of penalties for terminating the lease, if the lease term reflects the Group exercising an option to terminate the lease
The lease term represents the non-cancellable period of the lease, together with periods covered by an option to extend the lease if it is reasonably certain to exercise the option, or any periods covered by an option to terminate the lease, if it is reasonably certain not to exercise the option.
After the commencement date, the amount of lease liabilities is increased to reflect the accretion of interest and reduced for the lease payments made. In addition, the Group remeasures the lease liability upon the occurrence of certain events (e.g. a change in the lease term, a change in future lease payments, or other modifications).
The discount rate used to calculate the present value of future lease payments is the interest rate implicit in the lease, if available. This interest rate is not readily determinable for most of the Group's leases. As such, the Group uses the incremental borrowing rate at the lease commencement date. To arrive at the incremental borrowing rate the Group applies the respective country’s (economic environment) risk-free rate for the term corresponding to the lease term, and a credit premium. The credit premium corresponds to the market credit premium for companies with similar credit ratings as the tenant.
Interest expenses related to the lease liability is recognised in a separate line in the consolidated statement of profit or loss
Variable lease payments that do not depend on an index or a rate are recognised as an expense in the period in which the event or condition that triggers the payment occurs.
138 37
Note 15 – Leases (continued)
The remeasurements of lease liabilities relating to sales outlets are mainly resulting from changes in lease terms as well as changes in indexes used to determine the lease payments. Increase in remeasurements compared to last year mainly relates to the current macroeconomic environment and inflationary pressure, refer to note 3 – Financial risk management, section 3.5.
Variable lease payments
Some property leases contain variable payments that are linked to sales generated from a sales outlet. Variable payment terms are used for a variety of reasons, including linking rental payments to store cash flows and reducing fixed cost.
The following table provides information on the Group’s variable lease payments, including the magnitude in relation to fixed payments:
139 4.2 Consolidated financial statements 4.3 Parent company financial statements
Our business Corporate Governance Financial
Appendix Financial
38 Lease liabilities NOK in millions Land Sales outlets Warehouse and prod.fac. Offices Vehicles and office eq. Total Carrying amount as at 1 January 2021 434 18,456 3,103 320 292 22,605 Reclassifications - - - - -Additions 68 902 29 2 141 1,142 Disposals -5 -2 -2 - - -9 Remeasurements 66 1,817 267 23 3 2,176 Payments -87 -3,157 -392 -68 -112 -3,816 Interest expense 15 666 105 8 5 799 Foreign currency translation effects -2 -303 -35 -5 -5 -350 Carrying amount as at 31 December 2021 489 18,379 3,075 280 324 22,547 Current liabilities 87 3,029 363 59 108 3,646 Non- current liabilities 402 15,350 2,712 221 216 18,901 Carrying amount as at 31 December 2021 489 18,379 3,075 280 324 22,547 Reclassifications - - - - -Additions 131 788 846 1 98 1,864 Disposals - -19 - - - -19 Remeasurements 40 1,959 95 108 9 2,211 Payments -96 -3,228 -399 -62 -121 -3,906 Interest expense 19 663 116 7 6 811 Foreign currency translation effects 3 286 64 -1 5 357 Carrying amount as at 31 December 2022 586 18,828 3,797 333 321 23,865 Current liabilities 106 3,185 393 61 116 3,861 Non- current liabilities 480 15,643 3,404 272 205 20,004 Carrying amount as at 31 December 2022 586 18,828 3,797 333 321 23,865
Our responsibility
statements
statments Consolidated financial statements | Annual report 2022
NOK in millions 2022 2021 Variable lease payments -331 -141 Fixed lease payments -3,987 -3,895 Total lease payments -4,318 -4,036
Note 15 – Leases (continued)
Lease expenses that are not capitalised
With respect to rent concessions received in response to the Covid-19 pandemic, IFRS 16 includes a temporary practical expedient whereby the lessee may elect not to assess whether a Covid-19 related lease concession is a lease modification. When applying this practical expedient, there are several potential approaches and Reitan Retail has opted to account for the rent concessions as negative variable lease payments, i.e. to recognise them in the consolidated statement of profit or loss as they arise. The Group has applied this practical expedient to all rent concessions that meet the conditions in IFRS 16. Reitan Convenience received rent concessions in the form of reduced lease payments amounting to NOK 42 million in 2021. The amount is recognised in the consolidated statement of profit or loss in the year of the concession and included in expenses related to variable lease payments in the table above. No rent concessions were received in 2022.
cash flow related to leases
140 39
NOK in millions 2022 2021 Variable lease payments -331 -141 Expenses related to short-term leases -33 -35 Expenses related to leases of low-value assets -48 -43 Total lease expenses -412 -219
Total
NOK in millions Land Sales outlets Warehouse and prod.fac. Offices Vehicles and office eq. Total Total cash flow related to leases 2022 -115 -3,552 -412 -64 -175 -4,318 Total cash flow related to leases 2021 -107 -3,290 -401 -67 -169 -4,034 Reconciliation of lease payments
in consolidated
flow NOK in millions 2022 2021 Total lease expenses, included in profit before taxes -412 -219 Paid and expensed interest on lease liabilities -811 -799 Payment of principal portion of lease liabilities, presented on a separate line -3,095 -3,016 Total cash flow related to leases -4,318 -4,034
presented
statement of cash
Note 15 – Leases (continued)
The Group as a lessor
The Group has operating lease arrangements in which it is a lessor, mainly related to lease of fixture to stores and lease of fuel infrastructure. The Group has classified these leases as operating leases since substantially all the risks and rewards of ownership are retained by the Group. Lease payments for operating leases are treated as income and distributed over the life of the lease on a straight-line basis.
141 4.2 Consolidated financial statements 4.3 Parent company financial statements Our responsibility Our business Corporate Governance Financial statements Appendix Financial statments Consolidated financial statements | Annual report 2022 40 Maturity analysis of undiscounted lease liabilities NOK in millions 31.12.22 31.12.21 Within 1 year 3,874 3,712 Within 1 - 2 years 3,536 3,349 Within 2 - 3 years 3,138 2,955 Within 3 - 4 years 2,736 2,569 Within 4 - 5 years 2,427 2,235 Within 5 - 10 years 8,623 7,989 Within 10 - 15 years 3,169 3,125 Within 15 - 20 years 861 810 More than 20 years 164 262 Total undiscounted lease liabilities 28,528 27,006 Effect of discounting -4,663 -4,459 Present value of lease liabilities 23,865 22,547
Lease income NOK in millions 2022 2021 Total rental income 590 561 Of which variable rental income 111 108 Maturity analysis of undiscounted fixed lease payments to be received NOK in millions 2022 2021 Within 1 year 330 222 Within 1 - 2 years 251 208 Within 2 - 3 years 214 145 Within 3 - 4 years 173 121 Within 4 - 5 years 131 79 More than 5 years 266 212 Total undiscounted lease payments 1,365 987
Note 16 – Investments in associated companies
Associates are entities over which Reitan Retail has significant influence but not control. Significant influence is the power to participate in the financial and operating policy decisions of the investee but without the ability to have control over those policies. Significant influence normally exists when the Group has 20 percent to 50 percent voting power through ownership or agreements. For more information on the management’s judgements in relation to classification of investments, see note 4 – Significant accounting judgements, estimates and assumptions, section 4.2.c.
Investments in associates are accounted for using the equity method.
At each reporting date, the Group reviews the carrying amounts of its associates to determine whether there is any indication that those assets may be impaired. If any such indication exists, the recoverable amount is estimated in order to determine the extent of the impairment loss. Any impairment loss is recognised within ‘Share of profit of associates’ in the consolidated statement of profit or loss in the year in which it occurs.
None of the Group's associates are publicly listed. The associates had no contingent liabilities as at 31 December 2022 or 31 December 2021.
The Group had no material investments in joint ventures as at 31 December 2022 or 31 December 2021.
companies
The list shows direct ownership.
142 41
Associated
NOK in millions 2022 2021 Carrying amount as at 1 January 1,018 997 Additions 85 29 Disposals -34 -90 Profit for the year 97 229 Other comprehensive income/(loss) for the year, net of tax -2 4 Dividend received -70 -151 Foreign currency translation effects 8Carrying amount as at 31 December 1,102 1,018 Material associates Company name Office address Ownership Business BAMA Gruppen AS Oslo, Norway 19 8 % Wholesale of fruit and vegetables
Note 16 – Investments in associated companies (continued)
The Group has a 19.8 percent interest in BAMA Gruppen AS, which is involved in wholesale distribution of fresh produce in fruits and vegetables. BAMA Gruppen AS is a private entity that is not listed on any public exchange. The Group’s interest in BAMA Gruppen AS is accounted for using the equity method in the consolidated financial statements. See note 4 for the Group’s judgements made in determining that it has significant influence over BAMA Gruppen AS.
BAMA Gruppen AS prepares its financial statements in accordance with the Norwegian Accounting Act and generally accepted accounting principles in Norway. In the consolidated financial statements of Reitan Retail, the figures of BAMA Gruppen AS are restated to comply with IFRS. Adjustments primarily relates to amortisation of goodwill and actuarial gains/(losses) not recognised in profit or loss.
The following tables set forth summarised financial information of BAMA Gruppen AS, and reconciliation with the carrying amount of the investment for the Group:
Statement of financial position
143 4.2 Consolidated financial statements 4.3 Parent company financial statements Our responsibility Our business Corporate Governance Financial statements Appendix Financial statments Consolidated financial statements | Annual report 2022 42
BAMA Gruppen AS NOK in millions 2022 2021 Current assets 3,344 3,581 Non- current assets 5,290 4,535 Total assets 8,634 8,116 Current liabilities 3,491 3,584 Non- current liabilities 2,102 1,451 Total liabilities 5,593 5,035 Total equity 3,041 3,081 Total equity and liabilities 8,634 8,116 Statement of comprehensive income BAMA Gruppen AS NOK in millions 2022 2021 Revenues 21,460 20,796 Profit for the year 215 523 Other comprehensive income/(loss) for the year, net of tax -9 18 Total comprehensive income for the year, net of tax 206 542 Statement of changes in equity BAMA Gruppen AS NOK in millions 2022 2021 Net assets as at 1 January 3,081 2,822 Profit for the year 215 523 Other comprehensive income/(loss) for the year, net of tax -9 18 Dividend -246 -282 Net assets as at 31 December 3,041 3,081
Note 16 – Investments in associated companies (continued)
144 43 Reconciliation of carried amounts BAMA Gruppen AS NOK in millions 2022 2021 Percentage ownership interest 19.8 % 19.8 % Share of profit for the year 43 103 Share of other comprehensive income/(loss) for the year, net of tax -2 4 Share of total comprehensive income for the year, net of tax 41 107 Ownership interest as at 31 December 602 610 Goodwill 15 15 Carrying amount as at 31 December 617 625 Immaterial associates NOK in millions 2022 2021 Profit for the year 54 126 Other comprehensive income/(loss) for the year, net of tax -Total comprehensive income for the year, net of tax 54 126 NOK in millions Ownership 31.12.22 2022 2021 Gram og Nybøl Godser A/S 49.4 % 73 67 Scanlube AB 50.0 % 25 34 Skanol A/S 50.0 % 68 56 Samtank A/S 50.0 % 99 73 Other real estate investments - 216 159 Other - 4 4 Carrying amount as at 31 December 485 393
Note 17 – Investments in subsidiaries
The consolidated financial statements comprise the financial statements of Reitan Retail AS and its subsidiaries.
Subsidiaries are all entities over which the Group has control. This is when the Group is exposed to, or has rights to, variable returns from its involvement with the entity and has the ability to affect those returns through its power over the entity. The results of subsidiaries are included in the consolidated statement of profit or loss from the date of acquisition or, in the case of disposals, up to the effective date of disposal. Intercompany transactions and balances between Group companies are eliminated upon consolidation.
Material subsidiaries
The list shows direct ownership and voting rights in 2022 and 2021
Total non-controlling interests as at 31 December 2022 was NOK 135 million (NOK 150 million as at 31 December 2021) and originate from immaterial subsidiaries
145 4.2 Consolidated financial statements 4.3 Parent company financial statements Our responsibility Our business Corporate Governance Financial statements Appendix Financial statments Consolidated financial statements | Annual report 2022 44
Entity Office location Share of ownership Share of voting rights REMA 1000 AS Oslo, Norway 100 % 100 % REMA 1000 Norge AS Oslo, Norway 100 % 100 % REMA 1000 Danmark A/S Horsens, Denmark 100 % 100 % Reitan Convenience AS Oslo, Norway 100 % 100 % Uno-X Mobility AS Oslo, Norway 100 % 100 %
Note 18 – Financial investments
Financial investments are measured at fair value with changes in fair value recognised in the consolidated statement of profit or loss as net gains (losses) on financial investments, see note 30 - Classification of financial instruments.
When no quoted market price is available, fair value is estimated using different valuation techniques such as discounted cash flow models or valuations based on prices derived from transactions with external parties. The fair value measurement hierarchy of all the Group’s financial assets and liabilities is provided in note 31 - Fair value measurement
In 2022, the Group recognised a loss on the financial investment in Oda Group Holding AS of NOK 260 million. The valuation of the investment is based on the latest funding round completed in December 2022, which also led to dilution in ownership.
146 45
NOK in millions 2022 2021 Carrying amount as at 1 January 715 512 Additions 3 42 Disposals -1 -26 Net gains (losses) through other comprehensive income -Net unrealised gains (losses) through profit or loss -248 195 Foreign currency translation effects 6 -6 Carrying amount as at 31 December 475 715 Of which classified as non-current assets 475 715 Of which classified as current assets -Carrying amount as at 31 December 475 715 Financial investments consist of NOK in millions Ownership 31.12.22 Ownership 31.12.21 2022 2021 Oda Group Holding AS 1.0 % 3.9 % 35 295 Urban Property Holding AS 10.0 % 10.0 % 217 204 Nebo Topco AS 5.0 % 5.0 % 65 65 Other real estate investments - - 123 125 Other financial assets - - 35 26 Total financial investments as at 31 December 475 715
Note 19 – Trade and other receivables
Trade and other receivables are initially recognised at the transaction price and subsequently measured at amortised cost
Trade and other receivables are adjusted for provision for impairment in accordance with the expected credit loss model. The Group applies the simplified approach, measuring the loss allowance at an amount equal to lifetime expected credit losses. Impairment for expected credit losses is recognised in the consolidated statement of profit or loss and reassessed at each reporting date. The impairment is calculated by considering the historic evidence of the level of bad debt experienced for customer types and the ageing of the receivable balance.
are mainly arising from contracts with customers.
The Group's provision for losses on trade receivables were NOK 133 million as at 31 December 2022 (NOK 92 million as at 31 December 2021).
147 4.2 Consolidated financial statements 4.3 Parent company financial statements Our responsibility Our business Corporate Governance Financial statements Appendix Financial statments Consolidated financial statements | Annual report 2022 46
Current receivables NOK in millions 2022 2021 Trade receivables 8,066 6,986 Accrued income 209 157 Current receivables, franchisees 221 98 Current interest-bearing receivables 58 63 Other non -interest-bearing current receivables 1,306 832 Current receivables as at 31 December 9,860 8,136
receivables
Non-current receivables NOK in millions 2022 2021 Other non -current interest-bearing receivables 291 373 Other non -current receivables 109 98 Non -current receivables as at 31 December 400 471 Total receivables as at 31 December 10,260 8,607 Nominal value, provision and carrying amount NOK in millions 2022 2021 Nominal value of receivables 10,393 8,699 Provision for expected credit losses -133 -92 Carrying amount as at 31 December 10,260 8,607 Provision for expected
and other receivables NOK in millions 2022 2021 Provision as at 1 January -92 -150 Movements in provision -41 58 Provision as at 31 December -133 -92
Trade
credit losses on trade
Note 19 – Trade and other receivables (continued)
Age distribution of overdue trade receivables
The Group’s provision for losses on trade receivables include provision for overdue receivables of NOK 117 million as at 31 December 2022 (NOK 24 million as at 31 December 2021).
The effective interest rate on interest-bearing receivables was 2.90 percent at 31 December 2022.
Non-current interest-bearing receivables due in more than five years, mainly consist of start-up loans related to funding of inventories for new franchisees and loans to associated companies.
148 47
NOK in millions 2022 2021 Less than 3 months 542 453 More than 3 months 27 79 Overdue receivables as at 31 December 569 532
Maturity distribution of non-current receivables NOK in millions 2022 2021 1 - 2 years 93 71 2 - 5 years 188 270 More than 5 years 119 130 Non -current receivables as at 31 December 400 471
Trade and other receivables
NOK in millions 2022 2021 NOK 5,529 5,043 DKK 3,851 2,987 SEK 183 97 EUR 463 444 Other currencies 234 36 Total current and non -current receivables as at 31 December 10,260 8,607
are in the following currencies
Note 20 – Inventories
Inventories are valued at the lower of cost and net realisable value. Cost is determined using the first-in, first-out (FIFO) method. For goods for resale and work in progress, cost consists of costs for product design, cost of materials, direct labour costs, other direct costs and indirect production costs (based on normal capacity). Net realisable value is the estimated selling price in the ordinary course of business, less applicable variable sales expenses. Payments from suppliers, others than those related to a specific ad or campaign that the Group has expensed and for which the supplier has agreed to cover its share of, are recognised as a reduction in cost of goods sold.
Note 21 – Cash and cash equivalents
Cash and cash equivalents in the statement of financial position comprise cash at banks and on hand and other short-term highly liquid investments with original maturity of three months or less.
The amount of cash placed in escrow accounts as at 31 December 2022 is related to sale of real estate portfolios at the end of the year. Escrow accounts are classified as cash equivalents as the amount is subject to an insignificant risk of changes in fair value and have a maturity of less than three months from the acquisition date.
Cash and cash equivalents as presented in the statement of cash flows
For the purpose of the consolidated statement of cash flows, cash and cash equivalents consist of cash and cash equivalents, as defined above, net of outstanding bank overdrafts as they are considered an integral part of the Group’s cash management.
149 4.2 Consolidated financial statements 4.3 Parent company financial statements Our responsibility Our business Corporate Governance Financial statements Appendix Financial statments Consolidated financial statements | Annual report 2022 48
NOK in millions 2022 2021 Raw materials 183 111 Work in progress 26 9 Goods for resale 4,988 4,299 Total inventories as at 31 December 5,197 4,419 Provision for obsolescence -28 -27 Carrying amount of inventories as at 31 December 5,169 4,392 Carrying amount of inventories pledged as security for liabilities 463 378 Provision for obsolescence NOK in millions 2022 2021 Provision for obsolescence as at 1 January -27 -24 Change in provisions -1 -3 Provision for obsolescence as at 31 December -28 -27
NOK in millions 2022 2021 Cash at bank and on hand 1,106 1,035 Tax withholdings 8 11 In escrow accounts 51 3 Other restricted funds 55 48 Restricted cash 114 62 Cash and cash equivalents as at 31 December 1,220 1,097
NOK in millions 2022 2021 Cash and cash equivalents 1,220 1,097 Bank overdrafts -1,091 -700 Total cash and cash equivalents in the statement of cash flows as at 31 December 129 397
Note 22 – Earnings per share
Earnings per share is calculated by dividing the profit for the year attributable to owners of the parent by the weighted average number of outstanding shares during the year. There are no instruments that could result in dilution.
The table below shows the number of shares used when calculating earnings per share:
Note 23 – Other reserves
150 49
NOK in millions 2022 2021 Profit for the year attributable to owners of the parent 1,831 2,612 Weighted average number of ordinary shares outstanding (number) 105,000,000 105,000,000 Weighted average number of ordinary shares outstanding, diluted (number) 105,000,000 105,000,000
NOK in millions Associates Financial assets Foreign currency translation effects Total Other reserves as at 1 January 2021 1 -16 1,450 1,435 Share of other comprehensive income of associates 4 - - 4 Net gain/(loss) on cash flow hedges - 62 - 62 Foreign currency translation effects - - -311 -311 Other reserves as at 31 December 2021 5 46 1,139 1,190 Share of other comprehensive income of associates -11 - - -11 Net gain/(loss) on cash flow hedges - -18 - -18 Foreign currency translation effects - - 303 303 Other reserves as at 31 December 2022 -6 28 1,442 1,464
Note 24 – Provisions
Provisions for asset retirement obligations, environmental obligations, restructuring costs, legal claims, employee benefits and deferred payments are recognised when there is a present legal obligation as a result of a past event, for which it is probable that an outflow of economic benefit will be required to settle the obligation and where the amount can be reliably estimated.
Provisions are measured at the present value of the expenditures expected to be required to settle the obligation using a pre-tax rate that reflects current market assessments of the time value of money and the risks specific to the obligation. The increase in the provision due to passage of time is recognised as a financial expense.
The discount rate used in the calculation of the asset retirement obligations and the environmental obligations is a pre-tax riskfree rate based on the applicable currency and time horizon of the underlying cash flows, and equalled 1.5 percent as at 31 December 2022 (1.5 percent as at 31 December 2021).
Expected maturity structure
151 4.2 Consolidated financial statements 4.3 Parent company financial statements Our responsibility Our business Corporate Governance Financial statements Appendix Financial statments Consolidated financial statements | Annual report 2022 50
NOK in millions Asset retirement obligations Environ. obligations Employee benefits Deferred payments Other Total Carrying amount as at 1 January 2021 422 170 17 10 33 652 Used during the year -15 2 -14 - -5 -32 Unused amounts reversed -13 -6 - -5 -11 -35 Provisions made in the year 31 10 1 - - 42 Interest costs 5 2 - 1 - 8 Foreign currency translation effects -8 -4 - - - -12 Carrying amount as at 31 December 2021 422 174 4 6 17 623 Used during the year -41 4 - - -22 -59 Unused amounts reversed -4 -16 - 2 - -18 Provisions made in the year 32 16 1 - 7 56 Interest costs 7 5 - - - 12 Foreign currency translation effects 7 5 - - - 12 Carrying amount as at 31 December 2022 423 188 5 8 2 626
NOK in millions Asset retirement obligations Environ. obligations Employee benefits Deferred payments Other Total Due in less than 1 year 39 45 - - 2 86 Due in 1 - 2 years 48 25 5 - - 78 Due in 2 - 5 years 94 28 - 8 - 130 Due in more than 5 years 242 90 - - - 332 Carrying amount as at 31 December 2022 423 188 5 8 2 626 Discount rate 2.6 % 3.3 % 3.2 % 6.6 % - -
Note 24 – Provisions (continued)
Asset retirement obligations
Asset retirement obligations exist where the Group has a legal obligation to remove an asset and restore the site. The Group has asset retirement obligations relating primarily to energy stations. Where the Group is required to settle an asset retirement obligation, the Group has estimated and capitalised the net present value of the obligations and increased the carrying value of the related asset. Provisions for asset retirement obligations are based on management’s estimates of the reasonably possible outcomes in terms of both the range of settlement dates and amount of expenses, as well as probabilities to be assigned to each of the reasonably possible outcomes.
Environmental liabilities
The Group purchases, stores and sells petroleum products through its business in Uno-X Mobility. This represents a potential exposure towards environmental consequences. The Group performs regular environmental inspections in order to assess the need for provisions relating to environmental restoration.
The Group performs a comprehensive environmental review of the operations in both Norway and Denmark annually. This forms the basis for estimating existing environmental liabilities. The outcome of the review, combined with knowledge of how environmental liabilities arise, give the Group a basis for estimating further development of environmental liabilities. Total estimated environmental liabilities are based on estimated environmental liabilities per location. The calculations make use of specific information for each service station, such as age, number of tanks, as well as a specific assessment of the stations’ environmental conditions and factors, such as the distance to drinking water sources. The estimates are uncertain as they are based on average costs and timing. The estimations have been performed with assistance from third-party experts. There is no assurance that future changes in environmental regulation, if any, will not adversely affect the Group’s accounting for environmental liabilities.
152 51 Classification of total provisions NOK in millions 2022 2021 Current 86 67 Non- current 540 556 Total provisions for other liabilities as at 31 December 626 623
Note 25 – Borrowings
Borrowings are initially recognised at fair value, net of transaction costs incurred. Borrowings are subsequently carried at amortised cost; any difference between the proceeds (net of transaction costs) and the redemption value is recognised in the consolidated statement of profit or loss over the period of the borrowings using the effective interest method.
Fees paid on the establishment of loan facilities are recognised as transaction costs of the loan to the extent that it is probable that some or all of the facility will be drawn down. In this case, the fee is deferred until the draw-down occurs. To the extent there is no evidence that it is probable that some or all of the facility will be drawn down, the fee is capitalised as a pre-payment for liquidity services and amortised over the period of the facility to which it relates.
Borrowings are classified as current liabilities unless the Group has an unconditional right to defer settlement of the liability for at least 12 months from the balance sheet date.
Assets pledged as security is related to collateral borrowings and the working capital facility agreement of NOK 1,400 million in Uno-X Mobility.
153 4.2 Consolidated financial statements 4.3 Parent company financial statements Our responsibility Our business Corporate Governance Financial statements Appendix Financial statments Consolidated financial statements | Annual report 2022 52
NOK in millions 2022 2021 Collateral borrowings 53 49 Syndicated bank loans 3,949 3,202 Other bank loans - 3 Other borrowings 15 15 Total non -current borrowings as at 31 December 4,017 3,269 Bank overdraft 1,091 700 Collateral borrowings 33 15 Total current borrowings as at 31 December 1,124 715 Total borrowings as at 31 December 5,141 3,984 Carrying amount of assets pledged as security NOK in millions 2022 2021 Property, plant and equipment 224 192 Inventories 463 378 Current trade and other receivables 1,066 800 Other net assets in pledged subsidiaries 224 455 Total carrying amount of assets pledged as security as at 31 December 1,977 1,825
Maturity structure NOK in millions 2022 2021 Within 1 year 1,124 715 1-2 years 9 9 2-3 years 3,958 3,210 3-4 years 24 22 4-5 years 9 7 After 5 years 17 21 Total borrowings as at 31 December 5,141 3,984
Note 25 – Borrowings (continued)
The exposure of the Group's borrowings to interest rate changes and contractual re-pricing dates at the end of the reporting period is as follows:
The re-pricing structure includes interest rate swaps.
Carrying amount of the Group's borrowings is in the following currencies:
Undrawn borrowing facilities
The interest rates do not include interest rate swaps, commitment fees and arrangement fees. See Note 28 – Derivative financial instruments for more information about interest rate swaps.
154 53
NOK in millions 2022 2021 Within 1 year 5,129 3,981 1-2 years 2 1 2-3 years 2 1 3-4 years 24-5 years 2After 5 years 4 1 Total borrowings as at 31 December 5,141 3,984
Amounts in millions Amounts in currency 2022 2021 NOK 3,552 3,552 2,808 DKK 570 805 343 SEK 983 929 613 EUR 5 54 309 USD -20 -199 -89 Total borrowings as at 31 December 5,141 3,984
NOK in millions 2022 2021 Expires within 1 year (floating interest rates) 1,300 1,656 Expires after more than one year (floating interest rates) 5,053 5,815 Total undrawn borrowing facilities as at 31 December 6,353 7,471 Interest rates as at 31 December 2022 NOK in millions NOK DKK SEK EUR Bank overdraft 4.4 % 3.4 % 3.5 % 3.3 % Collateral borrowings 5.0 % - -Syndicated bank loans 3.9 % 2.8 % 2.9 % 2.7 % Other borrowings 4.3 % - -Average interest rates 4.1 % 3.0 % 3.0 % 2.7 % Interest rates as at 31 December 2021 NOK in millions NOK DKK SEK EUR Bank overdraft 2.2 % 1.1 % - 1.7 % Collateral borrowings 2.7 % 2.1 % -Syndicated bank loans 1.6 % 0.9 % 0.9 % 0.9 % Other borrowings 2.7 % - -Average interest rates 1.8 % 0.9 % 0.9 % 0.9 %
Note 25 – Borrowings (continued)
Fair value of borrowings
The Group’s borrowings are mainly at floating interest rates. The carrying amount is a reasonable approximation of the fair value for all borrowings. Interest rate swaps are booked at fair value and are not considered in the assessment of fair value of borrowings.
Changes in the carrying amount of borrowings are distributed as follows:
Bank overdraft, borrowings from parent company and other borrowings are in the statement of financial position presented as current and non-current borrowings.
155 4.2 Consolidated financial statements 4.3 Parent company financial statements Our responsibility Our business Corporate Governance Financial statements Appendix Financial statments Consolidated financial statements | Annual report 2022 54
NOK in millions Lease liabilities Bank overdraft Borrowings from parent company Other borrowings Total borrowings Carrying amount as at 1 January 2021 22,605 400 2,132 1,973 27,110 Proceeds, included in cash flow from financing activities - - 16 4,114 4,130 Repayments, included in cash flow from financing activities -3,016 - -3,298 -2,664 -8,978 Net cash effect, included in cash and cash equivalents - 300 - - 300 New leases 1,142 - - - 1,142 Dividends/group contributions declared - - 1,144 - 1,144 Foreign currency translation effects -350 - - -138 -488 Other changes 2,166 - 6 -1 2,171 Carrying amount as at 31 December 2021 22,547 700 - 3,284 26,531 Proceeds, included in cash flow from financing activities - - - 2,671 2,671 Repayments, included in cash flow from financing activities -3,095 - - -1,904 -4,999 Net cash effect, included in cash and cash equivalents - 391 - - 391 New leases 1,864 - - - 1,864 Dividends/group contributions declared - - - -Foreign currency translation effects 357 - - -1 356 Other changes 2,192 - - - 2,192 Carrying amount as at 31 December 2022 23,865 1,091 - 4,050 29,006
Note 26 – Loan agreements
The Group has the following material loan agreements:
Multi-currency credit facility - Reitan Retail AS
In December 2021 Reitan Retail AS established a multi-currency credit facility. The loan is financed by a bank syndicate consisting of six banks. The facility is a revolving credit of NOK 9,000 million, of which NOK 4,500 million matures in 2024, and NOK 4,500 million matures in 2026, and both tranches include two one-year extension options. In 2022 the first extension option for both tranches was utilized, extending maturity date to 2025 and 2027 respectively. The drawn amounts as at 31 December 2022 are included in "Other bank loans" in note 25 - Borrowings.
The following financial covenants apply to the revolving credit facility in Reitan Retail AS:
Net interest-bearing debt and equity share are measured excluding IFRS 16 leases. EBITDA is adjusted for IFRS 16 lease payments. During 2022 and 2021, Reitan Retail AS was in compliance with these covenants, and there is significant headroom also going forward
Working capital facility agreement - Uno -X Mobility
In 2010, Uno-X Mobility AS and DNB entered into a credit and corporate account agreement with collateral in subsidiaries, receivables and inventories, the latter limited to Norwegian subsidiaries only. The agreement includes an overdraft facility of NOK 1,400 million, limited to a percentage of the Group’s outstanding receivables and the Norwegian companies’ inventories. Uno-X Mobility AS is the owner of the facility. Drawn amounts as at 31 December 2022 was NOK 966 million (NOK 681 million as at 31 December 2021) and are included in "Bank overdraft" in note 25 - Borrowings
All subsidiaries are members of the credit and corporate account agreement and have provided an on-demand guarantee as collateral for Uno-X Mobility AS and its obligations according to the working capital facility agreement.
The following financial covenants apply to the working capital facility agreement in Uno-X Mobility AS:
During 2022 and 2021, Uno-X Mobility AS was in compliance with these covenants, and there is significant headroom also going forward
156 55
NOK in millions 2022 2021 Revolving credit 9,000 9,000 Total available credit as at 31 December 9,000 9,000 Drawn amount in NOK 2,550 2,000 Drawn amount in DKK (in NOK) 396 269 Drawn amount in SEK (in NOK) 898 633 Drawn amount in EUR (in NOK) 105 300 Total drawn amount as at 31 December 3,949 3,202 Undrawn credit amount as at 31 December 5,051 5,798
Time of measurement Net interest -bearing debt/ EBITDA (maximum) Equity share (minimum) Q4 2021 and later 3.50 25.0 %
Receivables/ Debt (minimum) EBITDA 12 months rolling basis (minimum) Equity to be (minimum) Equity share (minimum) Covenants (Q4 2010 and later) 1.00 NOK 220 million NOK 900 million 20.0 % Reporting frequency Monthly Quarterly Quarterly Quarterly
Note 26 – Loan agreements (continued)
Other material loan agreements
The Group has cash pooling arrangements with legally enforceable rights to offset cash and overdraft balances. Where there is an intention to settle on a net basis, cash and overdraft balances relating to the cash pooling arrangements are reported on a net basis in the consolidated statement of financial position.
Most subsidiaries in REMA 1000 Norway and REMA 1000 Denmark are members of a cash pool agreement entered into between REMA 1000 AS and Danske Bank. The agreement includes an overdraft facility of NOK 500 million. Drawn amounts as at 31 December 2022 was NOK 0 million (NOK 0 million as at 31 December 2021) and are included in "Bank overdraft" in note 25Borrowings. No financial covenants apply to this agreement.
Within the Reitan Convenience segment, there are several cash pool agreements in the various countries where it is represented. They include overdraft facilities of NOK 200 million in Norway, SEK 150 million in Sweden, DKK 30 million in Denmark and EUR 7 million in Finland. Drawn amounts of all these overdraft facilities as at 31 December 2022 was NOK 106 million (NOK 18 million as at 31 December 2021) and are included in "Bank overdraft" in note 25 - Borrowings. No financial covenants apply to any of these
Note 27 – Guarantees
The Group provided guarantees for off-balance sheet liabilities limited to NOK 313 million as at 31 December 2022 (NOK 318 million as at 31 December 2021). The guarantees are mainly provided on behalf of associated real estate companies.
157 4.2 Consolidated financial statements 4.3 Parent company financial statements Our responsibility Our business Corporate Governance Financial statements Appendix Financial statments Consolidated financial statements | Annual report 2022 56
Note 28 – Derivative financial instruments
Note 29 – Trade and other payables
Trade and other payables are recognised in the statement of financial position at fair value, and subsequently measured at amortised cost. Both current and non-current trade and other payables are non-interest-bearing.
Other current non-interest-bearing liabilities mainly includes accrued expenses related to goods and services delivered and not invoiced to the Group.
158 57
NOK in millions 2022 2021 Foreign exchange forward contracts - expire within 1 year (eiendeler) 2 2 Other derivative financial instruments - expire within 1 year (eiendeler) 29 34 Interest rate swaps - expire in 1-5 years (eiendeler) 2Other derivative financial instruments - expire in 1- 5 years (eiendeler) - 10 Total derivative financial instruments as at 31 December - assets 33 46 Foreign exchange forward contracts - expire within 1 year - 1 Other derivative financial instruments - expire within 1 year - 2 Total derivative financial instruments as at 31 December - liabilities - 3 Total net financial derivative instruments as at 31 December - assets (liabilities) 33 43 2022 2021 Lowest fixed rate in interest rate swaps at 31 December 1.578 % 0.320 % Highest fixed rate in interest rate swaps at 31 December 1.775 % 1.775 % NOK in millions Amount in currency 2022 Notional principal amount of interest rate swaps in NOK 151 151 Total notional principal amount of interest rate swaps as at 31 December 151 151 NOK in millions Amount in currency 2022 Notional principal amount of foreign exchange forward contracts in EUR 7 69 Notional principal amount of foreign exchange forward contracts in USD 3 33 Total notional principal amount of foreign exchange forward contracts as at 31 December 102 All interest rate swaps are floating-to-fixed and related to the Group's borrowings.
Current trade and other payables NOK in millions 2022 2021 Trade payables 9,258 8,968 Social security and other taxes 2,008 1,794 Liabilities to franchisees 55 338 Other current non -interest-bearing liabilities 1,593 1,494 Current trade and other payables as at 31 December 12,914 12,594
Non-current trade and other payables NOK in millions 2022 2021 Due in 1 -2 years - 1 Due in 2 -5 years 4 5 Non -current trade and other payables as at 31 December 4 6
Note 30 – Classification of financial instruments
Financial assets
At initial recognition, financial assets are classified as:
• Financial assets at fair value through profit or loss
• Financial assets at amortised cost
• Derivatives designated as hedging instruments at fair value through other comprehensive income
To determine their classification and measurement category, IFRS 9 Financial Instruments requires all financial assets, except equity instruments and derivatives, to be assessed based on a combination of the entity’s business model for managing the assets and the instruments’ contractual cash flow characteristics.
Financial assets at fair value through profit or loss
Financial assets at fair value through profit or loss include equity instruments and derivatives with a positive value.
A financial asset measured at fair value through profit or loss is recognised initially at fair value and its transaction cost is recognised in the consolidated statement of profit or loss when incurred. A gain or loss on a financial asset measured at fair value through profit or loss is recognised in the consolidated statement of profit or loss for the reporting period in which it arises.
Financial assets at amortised cost
The Group’s financial assets at amortised cost include trade receivables, other receivables and cash and cash equivalents.
A financial asset is measured at amortised cost if both of the following conditions are met:
• it is primarily held for the collection of contractual cash flows and;
• its contractual terms give rise on specified dates to cash flows that are solely payments of principal and interest on the principal amount outstanding
With the exception of trade receivables that do not contain a significant financing component, the Group initially measures these financial assets at fair value plus transaction costs. Subsequently, these assets are measured at amortised cost less impairm ent using the effective interest (EIR) method. Gains and losses are recognised in the consolidated statement of profit or loss when the asset is derecognised, modified or impaired.
The Group applies the simplified approach for trade receivables, measuring loss allowance at an amount equal to lifetime expected credit losses.
Impairment for expected credit losses is recognised in the consolidated statement of profit or loss and updated at each reporting date.
Derivatives designated as hedging instruments at fair value through other comprehensive income
A few hedging instruments are recognised at fair value through other comprehensive income.
Financial liabilities
At initial recognition, financial liabilities are classified as:
• Financial liabilities at fair value through profit or loss
• Financial liabilities at amortised cost
• Derivatives designated as hedging instruments at fair value through other comprehensive income
159 4.2 Consolidated financial statements 4.3 Parent company financial statements Our responsibility Our business Corporate Governance Financial statements Appendix Financial statments Consolidated financial statements | Annual report 2022 58
Note 30 – Classification of financial instruments (continued)
Financial liabilities at fair value through profit and loss
Financial liabilities at fair value through profit or loss mainly include derivatives. Derivatives are carried as assets when the fair value is positive and as liabilities when the fair value is negative. Such derivative financial instruments are initially recognised at fair value on the date on which a derivative contract is entered into and are subsequently re-measured at fair value through profit and loss. Gains or losses are recognised in the consolidated statement of profit or loss for the reporting period in which it arises.
Financial liabilities at amortised cost
Interest-bearing loans and borrowings are initially recognised at fair value net of directly attributable transaction costs. Subsequently, these liabilities are measured at amortised cost using the EIR method. Gains and losses are recognised in the consolidated statement of profit or loss when the liabilities are derecognised. The EIR amortisation is included as finance costs in the consolidated statement of profit or loss. Liabilities are measured at their nominal amount if the effect of discounting is immaterial.
Derivatives designated as hedging instruments at fair value through other comprehensive income
The effective portion of the gain or loss on the hedging instrument is recognised in other comprehensive income (OCI) in the cash flow hedge reserve, while any ineffective position is recognised immediately in the consolidated statement of profit or loss.
Derecognition
A financial asset is primarily derecognised when:
• the rights to receive cash flows from the asset have expired, or
• the Group has transferred its rights to receive cash flows from the asset or has assumed an obligation to pay the received cash flows in full without material delay to a third party under a “pass-through” arrangement; and either (a) the Group has transferred substantially all the risks and rewards of the asset, or (b) the Group has neither transferred nor retained substantially all the risks and rewards of the asset, but has transferred control of the asset
A financial liability is derecognised when the obligation under the liability is discharged or ceased or expired.
160 59
Note 30 – Classification of financial instruments (continued)
Carrying amount of financial assets and liabilities divided into categories:
161 4.2 Consolidated financial statements 4.3 Parent company financial statements Our responsibility Our business Corporate Governance Financial statements Appendix Financial statments Consolidated financial statements | Annual report 2022 60
31 December 2022 Financial assets at fair value through profit or loss Financial assets at amortised cost Financial liabilities at fair value through profit or loss Financial liabilities at amortised cost Derivatives designated as hedging instruments through OCI Total NOK in millions Note Financial investments 18 475 - - - - 475 Derivative financial instruments 28 - - - - 2 2 Non- current receivables 19 - 400 - - - 400 Total non -current financial assets 475 400 - - 2 877 Trade and other receivables 19 - 9,860 - - - 9,860 Derivative financial instruments 28 - - - - 31 31 Cash and bank balances 21 - 1,106 - - - 1,106 Restricted cash 21 - 114 - - - 114 Total current financial assets - 11,080 - - 31 11,111 Total financial assets 475 11,480 - - 33 11,988 Borrowings 25 - - - 4,017 - 4,017 Other liabilities 29 - - - 4 - 4 Total non -current financial liabilities - - - 4,021 - 4,021 Borrowings 25 - - - 1,124 - 1,124 Trade and other payables 29 - - - 12,913 - 12,913 Total current financial liabilities - - - 14,037 - 14,037 Total financial liabilities - - - 18,058 - 18,058 Total net financial assets (liabilities) 475 11,480 - -18,058 33 -6,070
Note 30 – Classification of financial instruments (continued)
162 61 31 December 2021 Financial assets at fair value through profit or loss Financial assets at amortised cost Financial liabilities at fair value through profit or loss Financial liabilities at amortised cost Derivatives designated as hedging instruments through OCI Total NOK in millions Note Financial investments 18 715 - - - - 715 Derivative financial instruments 28 - - - - 10 10 Non- current receivables 19 - 471 - - - 471 Total non -current financial assets 715 471 - - 10 1,196 Trade and other receivables 19 - 8,136 - - - 8,136 Derivative financial instruments 28 - - - - 36 36 Cash and bank balances 21 - 1,035 - - - 1,035 Restricted cash 21 - 62 - - - 62 Total current financial assets - 9,233 - - 36 9,269 Total financial assets 715 9,704 - - 46 10,465 Borrowings 25 - - - 3,269 - 3,269 Other liabilities 29 - - - 6 - 6 Total non -current financial liabilities - - - 3,275 - 3,275 Borrowings 25 - - - 715 - 715 Derivative financial instruments 28 - - 3 - - 3 Trade and other payables 29 - - - 12,594 - 12,594 Total current financial liabilities - - 3 13,309 - 13,312 Total financial liabilities - - 3 16,584 - 16,587 Total net financial assets (liabilities) 715 9,704 -3 -16,584 46 -6,122
Note 31 – Fair value measurement
All assets and liabilities for which fair value is measured or disclosed in the financial statements are categorised within the fair value hierarchy, described as follows, based on the lowest level of input that is significant to the fair value measurement as a whole:
Level 1 – Quoted (unadjusted) market prices in active markets for identical assets or liabilities.
Level 2 – Valuation techniques for which the lowest level input that is significant to the fair value measurement is directly or indirectly observable.
Level 3 – Valuation techniques for which the lowest level input that is significant to the fair value measurement is unobservable.
31 December 2022
The Group has assessed that the fair values of cash and cash equivalents, trade and other receivables, and trade and other payables approximate their carrying amounts largely due to the short-term maturities of these instruments.
163 4.2 Consolidated financial statements 4.3 Parent company financial statements Our responsibility Our business Corporate Governance Financial statements Appendix Financial statments
financial
Annual
2022 62
Consolidated
statements |
report
Level 1 Level 2 Level 3 Total NOK in millions Note Investment properties 13 - - 48 48 Financial investments 18 - 35 440 475 Derivative financial instruments 28 - 33 - 33 Total assets measured at fair value - 68 488 556 Derivative financial instruments 28 - - -Total liabilities measured at fair value - - -Net assets (liabilities) measured at fair value - 68 488 556 31 December 2021 Level 1 Level 2 Level 3 Total NOK in millions Note Investment properties 13 - - 326 326 Financial investments 18 - - 715 715 Derivative financial instruments 28 - 46 - 46 Total assets measured at fair value - 46 1,041 1,087 Derivative financial instruments 28 - 3 - 3 Total liabilities measured at fair value - 3 - 3 Net assets (liabilities) measured at fair value - 43 1,041 1,084
Note 31 – Fair value measurement (continued)
Reconciliation of fair value measurement of non-listed financial investments classified as financial assets at fair value through profit or loss (level 3):
Reconciliation of fair value measurement of investment properties (level 3):
164 63
NOK in millions 2022 2021 Carrying amount as at 1 January 715 512 Additions 3 41 Reclassifications -295Disposals -1 -26 Net unrealised gains (losses) through profit or loss 12 195 Foreign currency translation effects 6 -7 Carrying amount as at 31 December 440 715
NOK in millions 2022 2021 Carrying amount as at 1 January 326 243 Additions 19 38 Reclassifications -7Disposals -347 -1 Net unrealised gains (losses) through profit or loss 52 57 Foreign currency translation effects 5 -11 Carrying amount as at 31 December 48 326
Note 32 – Related party transactions
Reitan Retail is a wholly owned subsidiary of REITAN AS and included in the consolidated financial statements of REITAN AS (REITAN). REITAN AS is owned by the Reitan family through three holding companies.
Reitan Retail’s related parties include its management personnel, subsidiaries, associates, group companies in REITAN and parent company. The Group has ownership interests in 55 associated companies, see note 16 Investment in associated companies. For benefits to key management, see note 8 – Salaries and personnel costs For guarantees to related parties, see note 27Guarantees.
The related party transactions disclosed consist of transactions carried out with related parties that are not eliminated in the consolidated financial statements.
The following transactions were carried out with related parties, excluding key management personnel compensation:
Transactions with parent company REITAN AS
1Of which fee paid for key management personnel services amounts to NOK 4.5 million (NOK 4.5 million in 2021).
Transactions between the group and other companies in the REITAN AS group
165 4.2 Consolidated financial statements 4.3 Parent company financial statements Our responsibility Our business Corporate Governance Financial statements Appendix Financial statments Consolidated financial statements | Annual report 2022 64
NOK in millions 2022 2021 Sale of goods and services 2 2 Purchase of goods and services1 -13 -10 Interest expenses - -7 Borrowings as at 31 December - -
NOK in millions 2022 2021 Sale of goods and services 2 2 Purchase of goods and services -13 -7 Lease payments -498 -455 Non- current receivables as at 31 December -Current receivables as at 31 December 11 15 Non- current liabilities as at 31 December -Current liabilities as at 31 December 6 4 Non- current lease liabilities as at 31 December 4,502 3,789 Current lease liabilities as at 31 December 513 459 Transactions with associated companies NOK in millions 2022 2021 Sale of goods and services 18 12 Purchase of goods and services -623 -447 Interest income 6 7 Lease payments -Non- current receivables as at 31 December 147 208 Current receivables as at 31 December 3 2 Non- current liabilities as at 31 December 15 14 Current liabilities as at 31 December 29 18 Provision for losses made as at 31 December -Realised loss in the year - -
Note 32 – Related party transactions (continued)
Non-current receivables from related parties are unsecured and interest-bearing. The interest rate is determined based on market rates including a premium
Current receivables from related parties are unsecured and non-interest-bearing. These are receivables arising from purchases and sales of goods and services, as well as accrued interest on loans.
Lease liabilities are related to leases of outlets and warehouses from other group companies in REITAN.
Note 33 – Contingent liabilities
Statement of objections from The Norwegian Competition Authority
On 15 December 2020, The Norwegian Competition Authority (NCA) issued a statement of objections to REMA 1000, NorgesGruppen and Coop, indicating that it intends to impose administrative fines. The preliminary assessment of the Competition Authority is that the joint understanding between the companies regarding the implementation of the “Industry Norm for Comparative Advertising in the Grocery Sector” and not to hinder access to each other’s stores for observing prices was in breach of the Competition Act, Section 10 and the corresponding EEA Agreement Article 53. The Competition Authority informed that it considers imposing a fine of NOK 7,371 mill. to REMA 1000 Norge AS and REITAN AS, where the companies will be jointly and severally liable for the entire amount.
REMA 1000 Norge AS submitted its preliminary comments to the statement of objections in June 2021. In November 2021 REMA 1000 Norge AS was given access to all the evidence in the statement of objections. REMA 1000 Norge AS submitted supplementary comments to the NCA 31 January 2022 which was within the deadline 28 February 2022 set by the NCA. A possible decision from the Competition Authority is expected during 2023. A possible decision may be appealed to the Competition Appeal Tribunal, and further to the Court of Appeal, the Supreme Court, and may also be referred the EFTA Court for an advisory opinion by either of the appellate bodies. The case may be ongoing until 2025-2026, unless an earlier solution is found. An obligation to pay the fine will not be in force until a final decision or judgement is reached. Interest (if any) will accrue from the due date pursuant to the Norwegian Competition Act section 29 fifth paragraph.
REMA 1000 Norge AS’s judgment is that it is not likely that a liability exists as of 31 December 2022 or at the time of signing the financial statements, and the matter is accordingly treated as a contingent liability for which no provision shall be made. In REMA 1000 Norge AS’s opinion, neither the Industry Norm nor the joint understanding of implementation of the Industry Norm, has an anticompetitive object or effect.
166 65
Note 34 – Events after the reporting period
Acquisition of a majority of ALDI’s Danish grocery store network
REMA 1000 Denmark signed an agreement to acquire the majority of German discount grocer ALDI’s grocery store network in Denmark in December 2022. The Group will acquire a portfolio of real estate locations, including 114 store locations and three distribution centers. The agreement excludes ALDI’s head office and remaining stores in Denmark.
The transaction gives access to locations, well-suited for the REMA 1000 format, paving the way for accelerated growth in an attractive market. Total investments, including the purchase price, investments to convert sales outlets to the REMA 1000 concept and other required investments, are considered to range between NOK 3.5 billion and NOK 4 billion. The acquisition will be financed through the Group’s existing credit facilities.
The transaction is subject to approval by Danish competition authorities and is expected to close during 2023.
167 4.2 Consolidated financial statements 4.3 Parent company financial statements Our responsibility Our business Corporate Governance Financial statements Appendix Financial statments Consolidated financial statements | Annual report 2022 66

168 Our responsibility Our business Corporate Governance Financial statments Appendix 168 Reitan Retail Responsible retail 2022 168 4.3 Parent company financial statements Comprehensive income Financial position Changes in equity Cash flows Notes to the financial statements 169 170 171 172 173
Statement of comprehensive income
169 4.2 Consolidated financial statements 4.3 Parent company financial statements Our responsibility Our business Corporate Governance Appendix Financial statements Financial Statements | Annual R eport 2022 68
NOK in millions Note 2022 2021 Revenue 49 1 Other income 2 1,811 1,843 Operating expenses 3,4 -213 -63 Depreciation of property, plant and equipment -1Operating profit 1,646 1,781 Interest income from group companies 131 13 Other interest income 3Interest expenses to parent company - -7 Other interest expenses -99 -2 Net financial items 35 4 Profit before taxes 1,681 1,785 Income tax expenses 5 -141 -130 Profit for the year 1,540 1,655 Remeasurement gain/(loss) on defined benefit plans 4 -2 1 Other comprehensive income/(loss) for the year, net of tax -2 1 Total comprehensive income for the year, net of tax 1,538 1,656
Statement of financial position
170 69
NOK in millions Note 31.12.22 31.12.21 ASSETS Property, plant and equipment 5Investments in subsidiaries 6 4,094 3,692 Pension assets 1 1 Receivables 7,10,11 4,894 3,615 Total non -current assets 8,994 7,308 Receivables kortsiktig 7,10,11 1,930 1,852 Cash and cash equivalents 487 30 Total current assets 2,417 1,882 Total assets 11,411 9,190 EQUITY AND LIABILITIES Share capital 8 106 106 Share premium 8 1,929 1,929 Retained earnings 5,147 3,609 Total equity 7,182 5,644 Pension obligations 4 1 1 Borrowings 9,10,11 3,949 3,202 Total non -current liabilities 3,950 3,203 Income tax payable 5 - 47 Other payables 9,10,11 279 296 Total current liabilities 279 343 Total liabilities 4,229 3,546 Total equity and liabilities
Statement of changes in equity
171 4.2 Consolidated financial statements 4.3 Parent company financial statements Our responsibility Our business Corporate Governance Appendix Financial statements Financial Statements | Annual R eport 2022 70
NOK in millions Share capital Share premium Retained earnings Total equity Equity as at 1 January 2021 106 1,929 2,148 4,183 Profit for the year - - 1,655 1,655 Remeasurement gain/(loss) on defined benefit plans - - 1 1 Total comprehensive income for the year, net of tax - - 1,656 1,656 Dividend and group contribution as of year end - - -195 -195 Equity as at 31 December 2021 106 1,929 3,609 5,644 Profit for the year this year - - 1,540 1,540 Remeasurement gain/(loss) on defined benefit plans this year - - -2 -2 Total comprehensive income for the year, net of tax this year - - 1,538 1,538 Equity as at 31 December 2022 106 1,929 5,147 7,182
Statement of cash flows
172 71
NOK in millions Note 2022 2021 Profit before taxes 1,681 1,655 Income taxes paid 5 -50 -86 Dividend and group contribution recognised in profit or loss, not paid 2 -1,810 -1,843 Change in current trade and other receivables -55Change in current trade and other payables 67Net cash flow from operating activities -167 -274 Purchase of property, plant and equipment -5Proceeds from sale of property, plant and equipment 1Investments in subsidiaries 6 -400Proceeds from subsidiaries 7,11 538 384 Net cash flow from investing activities 134 384 Proceeds from borrowings 9 2,642 3,202 Repayment of borrowings -1,902Proceeds from borrowings from parent company 9,11 - 16 Repayments of borrowings from parent company 9,11 - -3,298 Dividend paid to parent company -250Net cash flow from financing activities 490 -80 Net change in cash and cash equivalents 457 30 Cash and cash equivalents as at 1 January 30Cash and cash equivalents as at 31 December 7 487 30
Notes to the financial statements of the parent company
173 4.2 Consolidated financial statements 4.3 Parent company financial statements Our responsibility Our business Corporate Governance Appendix Financial statements Reitan Retail Responsible retail 2022 173
Note 1 – General information and summary of significant accounting policies Note 2 – Other income Note 3 – Salaries and personnel costs Note 4 – Pension obligations Note 5 – Income taxes Note 6 – Investments in subsidiaries Note 7 – Receivables Note 8 – Share capital and shareholder information Note 9 – Liabilities Note 10 – Financial instruments Note 11 – Related party transactions 174 174 174 175 177 178 178 179 179 180 181
Note 1 – General information and summary of significant accounting policies
Reitan Retail AS (the Company) is the parent company in the Reitan Retail group.
The separate financial statements of Reitan Retail AS have been prepared in accordance with the simplified IFRS pursuant to the Norwegian Accounting Act, section 3-9, subsection 5 (“Regulations on simplified use of international accounting standard”) issued by the Norwegian Ministry of Finance on 21 January 2008.
Reitan Retail AS’ accounting policies are consistent with the accounting principles for the Group, as described in note 2 of the consolidated financial statements. Where the policies for the parent company are substantially different from the policies for the Group, these are described below. Otherwise, refer to the notes to the consolidated financial statements.
Shares in subsidiaries
Shares in subsidiaries are recognised at cost in Reitan Retail AS’ financial statements.
Dividend and group contribution
Entities that are required to keep accounts and prepare company accounts in accordance with the regulations pursuant to Section 3.9 of the Norwegian Accounting Act can choose to, regardless of other provisions in these regulations, recognise dividends and group contributions in accordance with the provisions of the Norwegian Accounting Act. Reitan Retail AS has chosen to make use of this exception. This means that dividends and group contributions received and paid by the parent company will be recognised the year prior to when the receipt or payment is adopted. The same applies to any tax effect of such transactions.
Note 2 - Other income
Note 3 – Salaries and personnel costs
174 73
NOK in millions 2022 2021 Dividend and group contribution 1,810 1,843 Gain on sale of property, plant and equipment 1Other income 1,811 1,843
Salaries NOK in millions 2022 2021 Salaries and holiday pay -57 -22 Social security tax -7 -3 Pension costs -3 -1 Other personnel costs -6Total salaries and personnel costs -73 -26 Number of employees, end of year 24 15 Average number of employees during the year 20 8
Note 3 – Salaries and personnel costs (continued)
Remuneration of the CEO and Board of Directors
In 2022, the CEO received a total compensation of NOK 9.2 million (NOK 5.3 million in 2021), of which NOK 8.2 million is salary and other short-term benefits and NOK 1 0 million is pension costs.
The CEO is entitled to severance pay equal to twelve months of the annual base salary from the expiry of the notice period. Any severance pay entitlement is conditional upon the CEO waiving the employee protection rights under local law and is applied in situations where the resignation is requested by the Company. The CEO’s own resignation will not trigger severance payment, and the severance payment is also forfeited in cases of summary dismissal from the company.
Information about the individual remuneration to the members of the Board of Directors is provided in the table below.
Rune Bjerke (Chairman of the Board from May 2022)
Magnus Reitan (Board Member from May 2010)
Eilert Giertsen Hanoa (Board Member from May 2022)
Odd Reitan (Chairman of the Board until May 2022)
Ole Robert Reitan (Board Member until May 2022)
The Chairman has no agreements regarding bonus or severance pay upon termination of office.
Note 4 – Pension obligations
As at 31 December 2022, Reitan Retail AS had 24 employees (15 employees as at 31 December 2021). The Company is obligated to provide an occupational pension scheme in accordance with the Mandatory Occupational Pension Act. The Company’s pension scheme satisfies the requirements of the Act.
The Company has a defined contribution plan for its employees with a contribution rate of 6 percent for salary from 1G to 7.1G and 9 percent for salary from 7.1G to 12G. A separate pension scheme has been established for pensions for salaries above 12G. Total pension costs for 2022 are NOK 2 7 million (NOK 0.5 million in 2021). G is the basic amount of the Norwegian National Insurance Scheme. 1G per 31 December 2022 equals NOK 111,477.
In addition, Reitan Retail AS has several defined benefit plans arising from operations in previous years. The defined benefit plans primarily consist of secured pension plans financed through insurance companies.
There are no active members in the defined benefit plan as at 31 December 2022.
175 4.2 Consolidated financial statements 4.3 Parent company financial statements Our responsibility Our business Corporate Governance Appendix Financial statements Financial Statements | Annual R eport 2022 74
2022 2021
NOK in millions
-0.5 -
-
-0.3 -
-
-
Fees to auditors (exclusive of VAT) NOK in thousands 2022 2021 Statutory audit services -1,500 -1,200 Total fees to auditors -1,500 -1,200
Financial assumptions 2022 2021 Discount rate 3.20% 1.50% Expected rate of pension increase 2.00% 1.50% Expected increase of social security base amount 0.00% 0.00% Number of retirees covered by the defined benefit plan 2022 2021 Secured pension plan 209 229 Unsecured pension plan 6 8
Note 4 – Pension obligations (continued)
Return on pension funds
Actual return on plan assets was -3.7 percent in 2022 (3.7 percent in 2021).
176 75
Pension obligations recognised in the balance sheet NOK in millions 2022 2021 Defined benefit obligation (secured pension plan) -57 -66 Fair value plan assets 60 67 Net pension obligations (secured pension plan) 3 1 Defined benefit obligation (unsecured pension plan) -3Net pension obligations - 1 Pension obligations -1 -1 Pension assets 1 1 Net pension obligations recognised as at 31 December -Reconciliation of the pension obligations NOK in millions Defined benefit obligation Fair value plan assets Net pension obligation As at 1 January 2021 -74 72 -2 Net interest -1 1Actuarial changes arising from changes in financial assumptions 1 1 1 Benefits paid 8 -7 1 As at 31 December 2021 -66 67Net interest -1 1Actuarial changes arising from changes in financial assumptions 3 - 3 Benefits paid 7 -7As at 31 December 2022 -57 61 3 Asset categories 31 December 2022 31 December 2021 Equity securities 4.0 % 12.0 % Loan 15.0 % 14.9 % Short-dated bonds 6.0 % 7.4 % Long-dated bonds 41.0 % 39.4 % Money market 16.0 % 9.3 % Real estate 14.0 % 13.1 % Other 4.0 % 3.9 % Total 100.0 % 100.0 %
Expected premium payments for 2023
NOK
million
Expected premium payment
is
0.1
Note 5 – Income taxes
177 4.2 Consolidated financial statements 4.3 Parent company financial statements Our responsibility Our business Corporate Governance Appendix Financial statements Financial Statements | Annual R eport 2022 76
Income tax expenses and income tax payable NOK in millions 2022 2021 Current tax on profit for the year -140 -130 Income tax expenses -140 -130 Current tax on profit for the year -140 -130 Effect of group contribution 140 83 Net income tax payable as at 31 December - -47 Reconciliation of Norwegian corporate income tax rate to effective tax rate NOK in millions 2022 2021 Profit before taxes 1,681 1,785 Corporate income tax rate (22 %) -370 -393 Effect of non-taxable income1 229 263 Income tax expenses -141 -130 Effective tax rate in % 8% 7% 1Effect of group contribution Changes in deferred tax liabilities (deferred tax assets) NOK in millions 2022 2021 Net deferred tax (deferred tax assets) as at 1 January -Recognised in the period -Net deferred tax (deferred tax assets) as at 31 December -Income tax expense recognised in other comprehensive income NOK in millions 2022 2021 Before tax Tax After tax Before tax Tax After tax Remeasurement gain/(loss) on defined benefit plans -3 1 -2 1 - 1 Other comprehensive income/(loss) - - - 1 - 1
Note 6 – Investments in subsidiaries
Note 7 – Receivables
Reitan Retail AS has provided loans to subsidiaries maturing on 31 December 2027. Effective interest rate is 4.0 percent as at 31 December 2022 (2.0 percent as per 31 December 2021). The company has not made any provisions for losses on receivables as at 31 December 2022 or 31 December 2021, nor have any such losses been reali sed in 2022 or 2021
178 77
NOK in millions Year of acquisition Office Share of ownership Share of voting rights 2022 2021 REMA 1000 AS 2001 Oslo, Norway 100% 100% -REMA 1000 Norge AS 1997 Oslo, Norway 100% 100% -REMA 1000 Danmark A/S 1994 Horsens, 100% 100% -Reitan Convenience AS 2001 Oslo, Norway 100% 100% 1,747 1,747 Uno-X Mobility AS 2020 Oslo, Norway 100% 100% 2,330 1,930 Gladengen Drift AS 2002 Oslo, Norway 100% 100% 17 15 Reitan Handel AS 2020 Oslo, Norway 100% 100% -Verde AS 2021 Oslo, Norway 100% 100% -Total investments in subsidiaries as at 31 December 4,094 3,692
Non-current receivables NOK in millions 31.12.22 31.12.21 Receivables from subsidiaries langsiktig 4,870 3,587 Other non -current receivables 24 28 Total non -current receivables 4,894 3,615
Current receivables NOK in millions 31.12.22 31.12.21 Receivables from subsidiaries 1,875 1,845 Other current receivables 55 7 Total current receivables 1,930 1,852
Note 8 – Share capital and shareholder information
The share capital consists of 105,000,000 shares of NOK 1,01 each. All shares are owned by REITAN AS.
Note 9 – Liabilities
Reitan Retail AS has the following loan agreement as at 31 December 2022:
Multi-currency credit facility - Reitan Retail
In December 2021 Reitan Retail AS established a multi -currency credit facility. The loan is financed by a bank syndicate consisting of six banks. The facility is a revolving credit of NOK 9,000 million, of which NOK 4,500 million matures in 2024, and NOK 4,500 million matures in 2026, and both tranches include two one-year extension options. In 2022 the first extension option for both tranches was utilized, extending maturity date to 2025 and 2027 respectively.
179 4.2 Consolidated financial statements 4.3 Parent company financial statements Our responsibility Our business Corporate Governance Appendix Financial statements Financial Statements | Annual R eport 2022 78
Share capital and premium 31.12.22 31.12.21 Share capital 106,050,000 106,050,000 Share premium 1,929,021,000 1,929,021,000 Share capital and premium as at 31 December 2,035,071,000 2,035,071,000
Borrowings NOK in millions 31.12.22 31.12.21 Syndicated bank loans 3,949 3,202 Total borrowings as at 31 December 3,949 3,202
NOK in millions 2022 2021 Revolving credit 9,000 9,000 Total available credit as at 31 December 9,000 9,000 Drawn amount in NOK 2,550 2,000 Drawn amount in DKK (in NOK) 396 269 Drawn amount in SEK (in NOK) 898 633 Drawn amount in EUR (in NOK) 105 300 Total drawn amount as at 31 December 3,949 3,202 Undrawn credit amount as at 31 December 5,051 5,798
Note 9 – Liabilities (continued)
The following financial covenants applies to the multi-currency revolving credit facility in Reitan Retail AS:
Net interest-bearing debt and equity share are measured excluding IFRS 16 leases. EBITDA is adjusted for IFRS 16 lease payments. During 2022 and 2021, Reitan Retail AS was in compliance with these covenants, and there is significant headroom also going forward.
Note 10 – Financial Instruments
180 79
Time of measurement Net interest -bearing debt/ EBITDA (maximum) Equity share (minimum) Q4 2021 and later 3.50 25.0 %
Other payables NOK in millions 31.12.22 31.12.21 Current liabilities to parent company 140 250 Current liabilities to subsidiaries 56 29 Trade payables 20 1 Social securities and other taxes 3 1 Accrued expenses 60 15 Total other payables as at 31 December 279 296
NOK in millions 2022 2021 Assets Non- current receivables 4,894 3,615 Current receivables 1,930 1,852 Total financial assets at amortised cost 6,824 3,949 Liabilities Non- current borrowings 3,949 3,202 Other payables 279 296 Total financial liabilities at amortised cost 4,228 3,498 Net financial instruments as at 31 December 2,596 451
Note 11 – Related party transactions
Guarantees
The Company has issued guarantees on behalf of subsidiaries of NOK 29 million as at 31 December 2022 (NOK 31 million on behalf of subsidiaries as at 31 December 2021).
181 4.2 Consolidated financial statements 4.3 Parent company financial statements Our responsibility Our business Corporate Governance Appendix Financial statements Financial Statements | Annual R eport 2022 80
Receivables NOK in millions 31.12.22 31.12.21 REMA 1000 AS 3,121 2,135 Reitan Convenience AS 1,749 1,452 Total non -current receivables 4,870 3,587 REMA 1000 AS 1,810 1,844 Reitan Convenience AS 7 1 Uno-X Mobility AS 52Other group companies 6Total current receivables 1,875 1,845 Liabilities NOK in millions 31.12.22 31.12.21 REITAN AS -Total non -current borrowings -REITAN AS 140 250 Reitan Convenience AS 51 29 Other group companies 4Total other payables 195 279 Total liabilities 195 279 Interest income NOK in millions 2020 2019 REMA 1000 AS 92 35 Reitan Convenience AS 38 1 Uno-X Mobility AS 1Total interest income 131 36 Interest expenses NOK in millions 2020 2019 REITAN AS - -7 Total interest expenses - -7
4.4 Auditor’s report

182 Our responsibility Our business Corporate Governance Financial statments Appendix 182 Reitan Retail Responsible retail 2022 182
INDEPENDENT AUDITOR'S REPORT
To the Annual Shareholders' Meeting of Reitan Retail AS Opinion
We have audited the financial statements of Reitan Retail AS (the Company) which comprise the financial statements of the Company and the consolidated financial statements of the Company and its subsidiaries (the Group). The financial statements of the Company comprise the statement of financial position as at 31 December 2022 and the statement of comprehensive income, statement of cash flows and statement of changes in equity for the year then ended and notes to the financial statements, including a summary of significant accounting policies. The consolidated financial statements of the Group comprise the consolidated statement of financial position as at 31 December 2022, the consolidated statement of profit and loss, the consolidated statement of comprehensive income, the consolidated statement of cash flows and the consolidated statement of changes in equity for the year then ended and notes to the financial statements, including a summary of significant accounting policies.
In our opinion
the financial statements comply with applicable legal requirements, the financial statements give a true and fair view of the financial position of the Company as at 31 December 2022 and its financial performance and cash flows for the year then ended in accordance with simplified application of international accounting standards according to section 3-9 of the Norwegian Accounting Act, the consolidated financial statements give a true and fair view of the financial position of the Group as at 31 December 2022 and its financial performance and cash flows for the year then ended in accordance with International Financial Reporting Standards as adopted by the EU.
Basis for opinion
We conducted our audit in accordance with International Standards on Auditing (ISAs). Our responsibilities under those standards are further described in the Auditor’s responsibilities for the audit of the financial statements section of our report. We are independent of the Company and the Group in accordance with the requirements of the relevant laws and regulations in Norway and the International Ethics Standards Board for Accountants’ International Code of Ethics for Professional Accountants (including International Independence Standards) (IESBA Code), and we have fulfilled our other ethical responsibilities in accordance with these requirements. We believe that the audit evidence we have obtained is sufficient and appropriate to provide a basis for our opinion.
Other information
Other information consists of the information included in the annual report other than the financial statements and our auditor’s report thereon. Management (the board of directors and the general manager) is responsible for the other information. Our opinion on the financial statements does not cover the other information, and we do not express any form of assurance conclusion thereon.
In connection with our audit of the financial statements, our responsibility is to read the other information, and, in doing so, consider whether the board of directors’ report contains the information required by legal requirements and whether the other information is materially inconsistent with the financial statements or our knowledge obtained in the audit, or otherwise appears to be materially misstated. If, based on the
183 Our responsibility Our business Corporate Governance Financial statements Appendix Statsautoriserte revisorer Ernst & Young AS Dronning Eufemias gate 6a, 0191 Oslo Postboks 1156 Sentrum, 0107 Oslo Foretaksregisteret: NO 976 389 387 MVA Tlf: +47 24 00 24 00 www.ey.no Medlemmer av Den norske Revisorforening A member firm of Ernst & Young Global Limited
work we have performed, we conclude that there is a material misstatement of this other information or that the information required by legal requirements is not included, we are required to report that fact.
We have nothing to report in this regard, and in our opinion, the board of directors’ report is consistent with the financial statements and contains the information required by applicable legal requirements.
Responsibilities of management for the financial statements
Management is responsible for the preparation and fair presentation of the financial statements of the Company in accordance with simplified application of international accounting standards according to section 3-9 of the Norwegian Accounting Act and of the consolidated financial statements of the Group in accordance with International Financial Reporting Standards as adopted by the EU, and for such internal control as management determines is necessary to enable the preparation of financial statements that are free from material misstatement, whether due to fraud or error.
In preparing the financial statements, management is responsible for assessing the Company’s and the Group’s ability to continue as a going concern, disclosing, as applicable, matters related to going concern and using the going concern basis of accounting unless management either intends to liquidate the Company or the Group, or to cease operations, or has no realistic alternative but to do so.
Auditor’s responsibilities for the audit of the financial statements
Our objectives are to obtain reasonable assurance about whether the financial statements as a whole are free from material misstatement, whether due to fraud or error, and to issue an auditor’s report that includes our opinion. Reasonable assurance is a high level of assurance, but is not a guarantee that an audit conducted in accordance with ISAs will always detect a material misstatement when it exists.
Misstatements can arise from fraud or error and are considered material if, individually or in the aggregate, they could reasonably be expected to influence the economic decisions of users taken on the basis of these financial statements.
As part of an audit in accordance with ISAs, we exercise professional judgment and maintain professional scepticism throughout the audit. We also:
Identify and assess the risks of material misstatement of the financial statements, whether due to fraud or error, design and perform audit procedures responsive to those risks, and obtain audit evidence that is sufficient and appropriate to provide a basis for our opinion. The risk of not detecting a material misstatement resulting from fraud is higher than for one resulting from error, as fraud may involve collusion, forgery, intentional omissions, misrepresentations, or the override of internal control.
Obtain an understanding of internal control relevant to the audit in order to design audit procedures that are appropriate in the circumstances, but not for the purpose of expressing an opinion on the effectiveness of the Company’s and the Group’s internal control.
Evaluate the appropriateness of accounting policies used and the reasonableness of accounting estimates and related disclosures made by management.
Conclude on the appropriateness of management’s use of the going concern basis of accounting and, based on the audit evidence obtained, whether a material uncertainty exists related to events or conditions that may cast significant doubt on the Company’s and the Group’s ability to continue as a going concern. If we conclude that a material uncertainty exists, we are required to draw attention in our auditor’s report to the related disclosures in the financial statements or, if such disclosures are inadequate, to modify our opinion. Our conclusions are based on the audit evidence obtained up to the date of our auditor’s report. However, future events or conditions may cause the Company and the Group to cease to continue as a going concern.
184 2 Independent auditor's report - Reitan Retail AS 2022 A member firm of Ernst & Young Global Limited
Evaluate the overall presentation, structure and content of the financial statements, including the disclosures, and whether the financial statements represent the underlying transactions and events in a manner that achieves fair presentation.
Obtain sufficient appropriate audit evidence regarding the financial information of the entities or business activities within the Group to express an opinion on the consolidated financial statements. We are responsible for the direction, supervision and performance of the group audit. We remain solely responsible for our audit opinion.
We communicate with the board of directors regarding, among other matters, the planned scope and timing of the audit and significant audit findings, including any significant deficiencies in internal control that we identify during our audit.
Oslo, 19 April 2023
185 Our responsibility Our business Corporate Governance Financial statements Appendix 3 Independent auditor's report - Reitan Retail AS 2022 A member firm of Ernst & Young Global Limited
ERNST &YOUNG AS
Asbjørn Ler State Authorised Public Accountant (Norway)

186

187 Our responsibility Our business Corporate Governance Financial statements Appendix Appendix 5.1 Performance measures and definitions 5.2 Transparency Act 5.3 EU Taxonomy 5.4 Carbon accounting Carbon accounting principles and reporting methodology Carbon account verification statement 5.5 GRI Stakeholder input General Environment Health People Index
5.1 Performance measures and definitions
188 Reitan Retail Responsible retail 2022
1. Alternative performance measures 1.1 Systemwide sales 1.2 Growth in systemwide sales 1.3 Like-for-like growth in systemwide sales 1.4 Total systemwide and distribution sales 1.5 Growth in revenue 1.6 EBITDA, or earnings before interest, taxes, depreciation and amortisation 1.7 Equity ratio 1.8 Interest-bearing receivables and bank deposits 1.9 Operating profit 1.10 Operating profit as a percentage of revenue 1.11 Operating profit as a percentage of systemwide sales 1.12 Total investments 2. Definitions and non-financial performance measures 2.1 Sales outlets 2.2 Systemwide employees 189 190 193 194 196 197 198 198 199 200 200 200 201 202 202 202
Performance measures and definitions | Annual report 2022
1. Alternative performance measures
In the reporting of financial information, Reitan Retail (“the Group”) has adopted various so-called alternative performance measures (APMs). These measures are not defined by International Financial Reporting Standards (IFRS) and may not be directly comparable to other companies’ APMs, including those in the Group’s industry. APMs should be considered in addition to, and are not intended to be a substitute for, or superior to, IFRS measurements. The Group believes that these APMs assist in providing additional useful information on the underlying trends, performance and position of the Group. Consequently, APMs are used by the management for performance analysis, planning and reporting.
The following sections contain definitions and reconciliations of the Group’s APM’s to the closest IFRS measure. Due to rounding, numbers presented may not add up precisely to the totals provided in the consolidated financial statements.
Performance measures per retail segment1
189 Our responsibility Our business Corporate Governance Financial statements Appendix
2022 NOK in millions REMA 1000 NO REMA 1000 DK Reitan Conv. Uno-X Mob. Elim. Reitan Retail Total systemwide and distribution sales 51,990 35,137 15,082 30,887 -3,463 129,633 Systemwide sales 47,401 28,301 14,688 25,340 38 115,767 Growth in systemwide sales -0.5 % 10.4 % 16.1 % - - 5.2 % Like-for-like growth in systemwide sales -1.7 % 9.5 % 15.0 % - - 4.1 % Number of sales outlets 668 363 1,953 816 1 3,801 Number of employees 2,284 1,403 2,517 299 64 6,567 Number of systemwide employees 15,320 15,176 12,585 299 64 43,444 2021 NOK in millions REMA 1000 NO REMA 1000 DK Reitan Conv. Uno-X Mob. Elim. Reitan Retail Total systemwide and distribution sales 51,309 31,964 13,260 22,010 -3,054 115,489 Systemwide sales 47,642 25,752 12,853 18,169 -10 104,406 Growth in systemwide sales -1.6 % 0.8 % 1.2 % - - -0.4 % Like-for-like growth in systemwide sales -2.4 % -1.2 % 3.2 % - - -1.2 % Number of sales outlets 657 360 2,002 824 - 3,843 Number of employees 2,088 1,261 2,125 206 35 5,715 Number of systemwide employees 14,599 15,190 12,049 206 35 42,079 1These performance measures relate to the Group’s retail segments. As such, measures for the Real Estate segment are not presented. Performance measures per geographical area 2022 NOK in millions Norway Denmark Sweden Finland Baltics Elim. Reitan Retail Total systemwide and distribution sales 73,435 47,683 3,563 2,821 2,132 - 129,633 Systemwide sales 67,028 40,618 3,563 2,821 1,738 - 115,767 Sales outlets 1,579 838 397 451 536 - 3,801 Number of employees 2,675 1,626 106 580 1,580 - 6,567 Number of systemwide employees 18,611 17,211 2,971 2,360 2,291 - 43,444 2021 NOK in millions Norway Denmark Sweden Finland Baltics Elim. Reitan Retail Total systemwide and distribution sales 66,258 41,622 2,972 2,898 1,739 - 115,489 Systemwide sales 61,692 35,512 2,972 2,898 1,332 - 104,406 Sales outlets 1,587 840 400 462 554 - 3,843 Number of employees 2,369 1,404 106 432 1,404 - 5,715 Number of systemwide employees 18,039 17,015 2,610 2,271 2,144 - 42,079
1.1 Systemwide sales
Definition: ‘Systemwide sales’ represents sales in all sales outlets under concepts and banners controlled by the Group, whether operated by the franchisees, the Group, dealers or commission-based retailers.
Sales from franchise operated sales outlets are reported by the franchisees and represents their revenues from sales at franchise operated sales outlets. Sales from franchise operated sales outlets are not recorded as revenue by Reitan Retail and are not included in the Group’s consolidated financial statements. However, the Group’s revenues from sale of franchise services are computed based on the sales made by the franchisee’s and, as a result, sales from franchise operated sales outlets have a direct effect on the Group’s revenue from sale of franchise services and profitability.
The systemwide sales measure allows management to assess changes in our overall system performance, the health of our brand, the financial health of the franchisee base and the strength of our market position relative to our competitors
The Group believes this APM is an important supplemental measure of operating performance because it highlights trends in the Group’s business that may not otherwise be apparent when relying solely on GAAP financial measures.
‘Systemwide sales’ includes excise duties and excludes VAT.
The closest IFRS measure to ‘Systemwide sales’ is the line item ‘Revenue’ as recorded in the consolidated statement of profit or loss.
1.1.1 Components of ‘systemwide sales’
1 Not recorded as revenue by the Group.
2 Incl. excise duties reported net by the Group, see note 6 - Revenue in Reitan Retail's consolidated financial statements.
190
2022 NOK in millions REMA 1000 NO REMA 1000 DK Reitan Conv. Uno-X Mob. Other Reitan Retail Sale of goods and services in franchise operated sales outlets1 47,089 28,192 12,584 - 40 87,904 Sale of goods and serv. in Group, dealer and comm. op. s. outlets2 312 110 2,104 25,340 -2 27,863 Systemwide sales 47,401 28,301 14,688 25,340 38 115,767 2021 NOK in millions REMA 1000 NO REMA 1000 DK Reitan Conv. Uno-X Mob. Other Reitan Retail Sale of goods and services in franchise operated sales outlets1 47,383 25,650 11,142 - 12 84,187 Sale of goods and serv. in Group, dealer and comm. op. s. outlets2 259 102 1,711 18,169 -22 20,219 Systemwide sales 47,642 25,752 12,853 18,169 -10 104,406
5.1 Performance measures and definitions
Performance measures and definitions | Annual report 2022
1.1 Systemwide sales (continued)
1.1.2 Revenue included in ‘Systemwide sales’
1 'Revenue from sale of other services' (ref. note 5 in Reitan Retail's consolidated financial statements) is for the purpose of this reconciliation split between 'Revenue from sale of services in Group, dealer and commission operated sales outlets' and 'Revenue from sale of services to other external customers'.
191 Our responsibility Our business Corporate Governance Financial statements Appendix
2022 NOK in millions Ref. REMA 1000 NO REMA 1000 DK Reitan Conv. Uno-X Mob. Other /elim. Reitan Retail Rev. from sale of goods in Group operated sales outlets Note 5 312 110 1,208 11,626 38 13,293 Rev. from sale of goods in dealer and commission op. sales outlets Note 5 - - 810 5,102 -40 5,873 Rev. from sale of services in Group, dealer and comm. op. s. outlets1 Note 5 - - 85 3 - 88 Revenue recorded by the Group, incl. in systemwide sales (A) 312 110 2,104 16,731 -2 19,254 Rev. from sale of goods to franchisees Note 5 26,643 23,874 - - 3,475 53,992 Rev. from sale of goods to other external customers Note 5 4,589 6,836 394 4,904 -3,497 13,226 Rev. from sale of franchise services Note 5 3,188 1,975 1,682 - - 6,844 Rev. from sale of services to other external customers1 Note 5 255 4 649 121 21 1,051 Revenue recorded by the Group, not incl. in systemwide sales (B) 34,674 32,689 2,725 5,025 -1 75,112 Revenue recorded by the Group (= A + B) Note 5 34,986 32,799 4,829 21,756 -2 94,367 2021 NOK in millions Ref. REMA 1000 NO REMA 1000 DK Reitan Conv. Uno-X Mob. Other /elim. Reitan Retail Rev. from sale of goods in Group operated sales outlets Note 5 259 102 541 6,876 - 7,778 Rev. from sale of goods in dealer and commission op. sales outlets Note 5 - - 1,048 3,098 -22 4,124 Rev. from sale of services in Group, dealer and comm. op. s. outlets1 Note 5 - - 122 76 - 198 Revenue recorded by the Group, incl. in systemwide sales (A) 259 102 1,711 10,050 -22 12,100 Rev. from sale of goods to franchisees Note 5 27,420 21,425 - - 3,044 51,889 Rev. from sale of goods to other external customers Note 5 3,667 6,212 412 3,198 -3,045 10,444 Rev. from sale of franchise services Note 5 3,223 1,798 1,341 - - 6,362 Rev. from sale of services to other external customers1 Note 5 195 4 523 3 -18 707 Revenue recorded by the Group, not incl. in systemwide sales (B) 34,505 29,439 2,276 3,201 -19 69,402 Revenue recorded by the Group (= A + B) Note 5 34,764 29,541 3,987 13,251 -41 81,502
5.1 Performance measures and definitions
1.1 Systemwide sales (continued)
1.1.3 Reconciliation of ‘Systemwide sales’ to revenue
1 Revenue is reported net of these excise duties by the Group, see note 6 - Revenue. Excise duties on sugar sweetened beverages and alcohol reported net by the Group are included in line 'Sale of goods and services - franchise operated sales outlets'.
2 Not recorded as revenue by the Group.
3 Revenue for Reitan Retail excl. Uno-X Mobility' and 'Systemwide sales for Reitan Retail excl. Uno-X Mobility' are used when calculating growth in revenue and systemwide sales, see section 1.5 and 1.2 respectively.
192
NOK in millions Ref. REMA 1000 NO REMA 1000 DK Reitan Conv. Uno-X Mob. Other / elim. Reitan Retail Less: Uno-X Mob. Reitan Retail excl. Uno-X Mob.3 Revenue Note 5 34,986 32,799 4,829 21,756 -2.5 94,367 -21,756 72,611 Less: Revenue not included in systemwide sales Section 1.1.2 -34,674 -32,689 -2,725 -5,025 0.6 -75,113 5,025 -70,088 Add: Excise duties on refined oil products 1 Note 6 - - - 8,609 - 8,609 -8,609Sale of goods and serv. in franchise op. sales 47,089 28,192 12,584 - 39.9 87,904 - 87,904 Systemwide sales 47,401 28,301 14,688 25,340 38 115,767 -25,340 90,427 2021 NOK in millions Ref. REMA 1000 NO REMA 1000 DK Reitan Conv. Uno-X Mob. Other / elim. Reitan Retail Less: Uno-X Mob. Reitan Retail excl. Uno-X Mob.3 Revenue Note 5 34,764 29,541 3,987 13,251 -41 81,502 -13,251 68,251 Less: Revenue not included in systemwide sales Section 1.1.2 -34,505 -29,439 -2,276 -3,201 19 -69,402 3,201 -66,201 Add: Excise duties on refined oil products 1 Note 6 - - - 8,119 - 8,119 -8,119Sale of goods and serv. in franchise op. sales 47,383 25,650 11,142 - 12 84,187 - 84,187 Systemwide sales 47,642 25,752 12,853 18,169 -10 104,406 -18,169 86,237
2022
Performance measures and definitions | Annual report 2022
1.2 Growth in systemwide sales
Definition: ‘Growth in systemwide sales’ refers to the percentage change in systemwide sales in one period from the same period in the prior year measured at constant currency.
To exclude the impact of foreign currency translation ‘Growth in systemwide sales’ is measured in local currency at constant foreign exchange rates, using the currency rate from prior comparable period. The Group believes excluding the impact of foreign currency translation provides a better year over year comparability.
To eliminate fuel price volatility in the comparison, ‘Growth in systemwide sales’ is not calculated for Uno-X Mobility and hence not included in the growth figure of Reitan Retail excl. Uno-X Mobility.
‘Growth in systemwide sales’ is a ratio that measures year-on-year movement in systemwide sales. It is considered a good indicator of how rapidly the business is growing.
1.2.1 Calculation of ‘Growth in systemwide sales’
1 'Systemwide sales' is recalculated based on previous period's currency rates, refer to table below.
Recalculation of systemwide sales based on constant currency rates
1 'Systemwide sales' is recalculated based on previous period's currency rates, refer to table below.
Recalculation of systemwide sales based on constant currency rates
193 Our responsibility Our business Corporate Governance Financial statements Appendix
6
NOK in millions REMA 1000 NO REMA 1000 DK Reitan Conv. Elim. Reitan Retail excl. Uno-X Mob. Systemwide sales 2022, based on constant currency rates1 (A) 47,401 28,441 14,918 38 90,798 Systemwide sales 2021 (B) 47,642 25,752 12,853 -11 86,237 Growth in systemwide sales (= A/B-1) -0.5 % 10.4 % 16.1 % - 5.2 %
2022
NOK in millions REMA 1000 NO REMA 1000 DK Reitan Conv. Elim. Reitan Retail excl. Uno-X Mob. Systemwide sales 2022 47,401 28,301 14,688 38 90,427 Effect using exchange rates for 2021 - 140 230 - 370 Systemwide sales 2022, based on constant currency rates 47,401 28,441 14,918 38 90,798 2021 NOK in millions REMA 1000 NO REMA 1000 DK Reitan Conv. Elim. Reitan Retail excl. Uno-X Mob. Systemwide sales 2021, based on constant currency rates1 (A) 47,642 27,156 13,281 -10 88,069 Systemwide sales 2020 (B) 48,411 26,931 13,124 -15 88,451 Growth in systemwide sales (= A/B-1) -1.6 % 0.8 % 1.2 % -0.4 %
NOK in millions REMA 1000 NO REMA 1000 DK Reitan Conv. Elim. Reitan Retail excl. Uno-X Mob. Systemwide sales 2021 47,642 25,752 12,853 -10 86,237 Effect using exchange rates for 2020 - 1,404 428 - 1,832 Systemwide sales 2021, based on constant currency rates 47,642 27,156 13,281 -10 88,069
1.3 Like-for-like growth in systemwide sales
Definition: ‘Like-for-like growth in systemwide sales’ is calculated as the percentage growth of comparable systemwide sales from last year.
Only sales outlets that operate under the same conditions in two comparing periods are considered to be comparable and hence included in the like-for-like growth figure. Exemption is made for sales outlets which are temporarily closed for less than 30 days.
To exclude the impact of foreign currency translation like-for-like growth in systemwide sales is measured in local currency at constant foreign exchange rates. The Group believes excluding the impact of foreign currency translation provides a better year over year comparability.
As the consolidated growth figure consists of companies with different local currencies, growth is weighted based on the companies' relative share of systemwide sales last year (in NOK).
To eliminate fuel price volatility in the comparison, like-for-like growth in systemwide sales is not calculated for Uno-X Mobility and hence not included in calculation of like-for-like growth in systemwide sales for the Group.
The Group believes that disclosing ‘Like-for-like growth in systemwide sales’ provides additional useful analytical information to investors regarding the operating performance of Reitan Retail as it neutralizes the impact of, for example, newly acquired or closed sales outlets, in the calculation of systemwide sales growth.
1.3.1 Calculation of ‘Like-for-like growth in systemwide sales’
(C = A/B-1)
1 'Systemwide sales' is recalculated based on previous period's exchange rates, refer to section 1.2.
2 Only sales outlets that operate under the same conditions in two comparing periods are considered to be comparable and hence included in likefor-like growth in systemwide sales.
Reitan Retail excl. Uno-X Mobility
1 As the consolidated growth figure consists of companies with different local currencies, it is weighted based on the companie s' relative share of systemwide sales last year (in NOK).
194
2022 Business areas excl. Uno-X Mobility NOK in millions REMA 1000 NO REMA 1000 DK Reitan Conv. Systemwide sales 2022, based on constant currency rates1 47,401 28,441 14,918 Like-for-like adjustment2 -970 -232 -783 Like-for-like adj. systemwide sales 2022 (A) 46,430 28,209 14,135 Systemwide sales 2021 47,642 25,752 12,853 Like-for-like adjustment2 -398 - -566 Like-for-like adj. systemwide sales 2021 (B) 47,245 25,752 12,286 Like-for-like growth in systemwide sales 2022
-1.7 % 9.5 % 15.0 %
NOK in millions REMA 1000 NO REMA 1000 DK Reitan Conv. Percentage share of systemwide sales 2021, excl. Uno -X Mobility (D) 55.2 % 29.9 % 14.9 % Like-for-like growth in systemwide sales 2022 (C) -1.7 % 9.5 % 15.0 % Weighted like-for-like growth in systemwide sales 2022 (E = C*D) -1.0 % 2.8 % 2.2 % Like-for-like growth in systemwide sales 2022 for Reitan Retail excl. Uno-X Mobility1 (=
of E) 4.1 %
sum
5.1 Performance measures and definitions
Performance measures and definitions | Annual report 2022
1.3 Like-for-like growth in systemwide sales (continued)
1 'Systemwide sales' is recalculated based on previous period's exchange rates, refer to section 1.2.
2 Only sales outlets that operate under the same conditions in two comparing periods are considered to be comparable and hence included in likefor-like growth in systemwide sales. Reitan
1 As the consolidated growth figure consists of companies with different local currencies, it is weighted based on the companie s' relative share of systemwide sales last year (in NOK).
195 Our responsibility Our business Corporate Governance Financial statements Appendix
2021 Business areas excl. Uno-X Mobility NOK in millions REMA 1000 NO REMA 1000 DK Reitan Conv. Systemwide sales 2021, based on constant currency rates1 47,642 27,156 13,281 Like-for-like adjustment2 -1,283 -620 -547 Like-for-like adj. systemwide sales 2021 (A) 46,359 26,536 12,734 Systemwide sales 2020 48,411 26,931 13,124 Like-for-like adjustment2 -935 -75 -784 Like-for-like adj. systemwide sales 2020 (B) 47,476 26,856 12,340 Like-for-like growth in systemwide sales 2021
= A/B-1) -2.4 % -1.2 % 3.2 %
(C
Retail excl.
NOK in millions REMA 1000 NO REMA 1000 DK Reitan Conv. Percentage share of systemwide sales 2020, excl. Uno -X Mobility (D) 54.7 % 30.4 % 14.8 % Like-for-like growth in systemwide sales 2021 (C) -2.4 % -1.2 % 3.2 % Weighted like-for -like growth in systemwide sales 2021 (E = C*D) -1.3 % -0.4 % 0.5 % Like-for-like growth in systemwide sales 2021 for Reitan Retail excl. Uno-X Mobility1 (= sum of E) -1.2 %
Uno-X Mobility
5.1
1.4 Total systemwide and distribution sales
Definition: ‘Total systemwide and distribution sales’ consists of systemwide sales and distribution sales. Distribution sales is the Group’s sale of goods to other external customers not included in systemwide sales.
The Group uses ‘Total systemwide and distribution sales’ as an internal measure of business operating performance and as a performance measure for benchmarking against the Group’s peers and competitors.
‘Total systemwide and distribution sales’ includes excise duties and excludes VAT.
The closest IFRS measure to ‘Total systemwide and distribution sales’ is the line item ‘Revenue’ as recorded in the consolidated statement of profit or loss.
1.4.1 Reconciliation of ‘Total systemwide and distribution sales’ to revenue
2022
1 Revenue is reported net of these excise duties by the Group, see note 6 - Revenue. Excise duties on sugar sweetened beverages and alcohol reported net by the Group are included in line 'Sale of goods and services - franchise operated sales outlets'. 2 Not recorded as revenue by the Group.
196
NOK in millions Ref. REMA 1000 NO REMA 1000 DK Reitan Conv. Uno-X Mob. Other / elim. Reitan Retail Revenue Note 5 34,986 32,799 4,829 21,756 -2 94,367 Revenue not included in systemwide sales Section 1.1.2 -34,674 -32,689 -2,725 -5,025 1 -75,112 Excise duties on refined oil products 1 Note 6 - - - 8,609 - 8,609 Sale of goods and services in franchise operated sales outlets2 47,089 28,192 12,584 - 40 87,904 Systemwide sales (A) 47,401 28,301 14,688 25,340 38 115,767 Rev. from sale of goods to other external customers Note 5 4,589 6,836 394 4,904 -3,501 13,222 Excise duties on refined oil products 1 Note 6 - - - 644 - 644 Distribution sales (B) 4,589 6,836 394 5,547 -3,501 13,865 Total systemwide and distribution sales (= A + B) 51,990 35,137 15,082 30,887 -3,463 129,633 2021 NOK in millions Ref. REMA 1000 NO REMA 1000 DK Reitan Conv. Uno-X Mob. Other / elim. Reitan Retail Revenue Note 5 34,764 29,541 3,987 13,251 -41 81,502 Revenue not included in systemwide sales Section 1.1.2 -34,505 -29,439 -2,276 -3,201 19 -69,402 Excise duties on refined oil products 1 Note 6 - - - 8,119 - 8,119 Sale of goods and services in franchise operated sales outlets2 47,383 25,650 11,142 - 12 84,187 Systemwide sales (A) 47,642 25,752 12,853 18,169 -10 104,406 Rev. from sale of goods to other external customers Note 5 3,667 6,212 407 3,198 -3,044 10,440 Excise duties on refined oil products 1 Note 6 - - - 643 - 643 Distribution sales (B) 3,667 6,212 407 3,841 -3,044 11,083 Total systemwide and distribution sales (= A + B) 51,309 31,964 13,260 22,010 -3,054 115,489
Performance measures and definitions
Performance measures and definitions | Annual report 2022
1.5 Growth in revenue
Definition: ‘Growth in revenue’ refers to the percentage change in revenue in one period from the same period in the prior year measured at constant currency.
To exclude the impact of foreign currency translation ‘Growth in revenue’ is measured in local currency at constant foreign exchange rates, using the currency rate from prior comparable period. The Group believes excluding the impact of foreign currency translation provides better a year over year comparability.
To eliminate fuel price volatility in the comparison, ‘Growth in revenue’ is not calculated for Uno-X Mobility and hence not included in the growth figure of Reitan Retail excl. Uno-X Mobility
1.5.1 Calculation of ‘Growth in revenue’ 2022
1 Revenue is recalculated based on previous period's currency rates, refer to table below.
Recalculation of revenues based on constant currency rates
1 Revenue is recalculated based on previous period's currency rates, refer to table below.
Recalculation of revenues based on constant currency rates
197 Our responsibility Our business Corporate Governance Financial statements Appendix
NOK in millions REMA 1000 NO REMA 1000 DK Reitan Conv. Real estate Other/ elim. Reitan Retail excl. Uno-X Mob. Revenue 2022, based on constant currency rates (A)1 34,986 32,959 4,884 21 -24 72,827 Revenue 2021 (B) 34,764 29,541 3,988 35 -78 68,250 Growth in revenue (= A/B-1) 0.6 % 11.6 % 22.5 % -39.4 % - 6.7 %
NOK in millions REMA 1000 NO REMA 1000 DK Reitan Conv. Real estate Other/ elim. Reitan Retail excl. Uno-X Mob. Revenue 2022 34,986 32,799 4,829 21 -24 72,611 Effect using exchange rates for 2021 - 161 56 - - 216 Revenue 2021, based on constant currency rates 34,986 32,959 4,884 21 -24 72,827 2021 NOK in millions REMA 1000 NO REMA 1000 DK Reitan Conv. Real estate Other/ elim. Reitan Retail excl. Uno-X Mob. Revenue 2021, based on constant currency rates (A)1 34,764 31,148 4,145 35 -76 70,016 Revenue 2020 (B) 34,421 30,510 4,142 23 -73 69,023 Growth in revenue (= A/B-1) 1.0 % 2.1 % 0.1 % 49.4 % 1.4 %
NOK in millions REMA 1000 NO REMA 1000 DK Reitan Conv. Real estate Other/ elim. Reitan Retail excl. Uno-X Mob. Revenue 2021 34,764 29,541 3,987 35 -76 68,251 Effect using exchange rates for 2020 - 1,607 158 - - 1,765 Revenue 2020, based on constant currency rates 34,764 31,148 4,145 35 -76 70,016
1.6 EBITDA, or earnings before interest, taxes, depreciation and amortisation
Definition: Operating profit before amortisation, depreciation and impairment.
EBITDA is considered to be a useful measure to understand the overall picture of profit generation in the Group’s and the Group’s segments’ operating activities.
1.7 Equity ratio
Definition: Shareholders’ equity as a percentage of total assets at the end of the period
Measures the amount of leverage used by the Group.
Calculation of equity ratio
198
NOK in millions Ref. 2022 2021 Equity 31.12 (A) Stmt. of fin. pos. 14,096 12,190 Total assets 31.12 (B) Stmt. of fin. pos. 57,529 52,785 Equity ratio as at 31 December (= A/B) 24.5 % 23.1 % 5.1 Performance measures and definitions
Performance measures and definitions | Annual report 2022
1.8
Interest-bearing receivables and bank deposits
Definition: Current interest-bearing receivables, other non-current receivables and cash and cash equivalents.
This figure is useful when evaluating the Group’s interest rate risk and liquidity needs.
The closest IFRS measure to ‘Interest-bearing receivables and bank deposits’ is the line items ‘Trade and other receivables’, ‘Receivables’ and ‘Cash and cash equivalents’.
1.8.1 Components of ‘Interest-bearing receivables and bank deposits’
1.8.2 Reconciliation of ‘Interest-bearing receivables and bank deposits’
199 Our responsibility Our business Corporate Governance Financial statements Appendix
NOK in millions Ref. 2022 2021 Cash and cash equivalents Stmt. of fin. pos. 1,220 1,097 Current interest-bearing receivables Note 19 58 63 Other non -current interest-bearing receivables Note 19 291 373 Interest -bearing receivables and bank deposits as at 31 December 1,569 1,533
NOK in millions Ref. 2022 2021 Trade and other receivables Stmt. of fin. pos. 9,860 8,136 Receivables Stmt. of fin. pos. 400 471 Cash and cash equivalents Stmt. of fin. pos. 1,220 1,097 11,480 9,704 Less: Trade receivables Note 19 -8,066 -6,986 Accrued income Note 19 -209 -157 Current receivables, franchisees Note 19 -221 -98 Current non -interest-bearing receivables Note 19 -1,306 -832 Other non -current receivables Note 19 -109 -98 Interest -bearing receivables and bank deposits as at 31 December 1,569 1,533
1.9 Operating profit
Definition: Profit before net financial items and tax.
Indicates profitability of operating activities.
1.10 Operating profit as a percentage of revenue
Definition: Operating profit as a percentage of revenue for the period
This ratio is an important indicator of the Group’s operating efficiency.
1.10.1 Calculation of ‘operating profit as a percentage of revenue’
1.11 Operating profit as a percentage of systemwide sales
Definition: Operating profit as a percentage of systemwide sales for the period
This ratio is an important indicator of the Group’s operating efficiency.
1.11.1 Calculation of ‘operating profit as a percentage of systemwide sales’
200
NOK in millions Ref. 2022 2021 Operating profit (A) Profit or loss 3,597 3,840 Revenue (B) Profit or loss 94,367 81,502 Operating profit as a percentage of revenue (= A/B) 3.8 % 4.7 %
NOK in millions Ref. 2022 2021 Operating profit (A) Profit or loss 3,597 3,840 Systemwide sales (B) Section 1.1 115,767 104,406 Operating profit as a percentage of systemwide sales (= A/B) 3.1 % 3.7 % 5.1 Performance measures and definitions
Performance measures and definitions | Annual report 2022
1.12 Total investments
Definition: Investments in intangible assets, investment properties and property, plant and equipment paid during the period according to the consolidated statement of cash flow.
‘Total investments’ is a measure of investments made in the operations in the relevant period and is considered useful in evaluating the capital intensity of the operations.
‘Total investments’ is the sum of the line items ‘Purchase of intangible assets’, ‘Purchase of investment properties’ and ‘Purchase of property, plant and equipment’ (PPE) as recorded in the consolidated statement of cash flow.
1.12.1 Reconciliation of ‘Total investments’
201 Our responsibility Our business Corporate Governance Financial statements Appendix
Total investments per segment NOK in millions Ref. 2022 2021 REMA 1000 NO Note 5 709 941 REMA 1000 DK Note 5 216 473 Reitan Conv. Note 5 398 331 Uno-X Mobility Note 5 779 560 Real Estate Note 5 915 937 Other units Note 5 25 10 Total investments Stmt. of cash flows 3,042 3,252 Total investments as recorded in the statement of cash flow NOK in millions Ref. 2022 2021 Purchase of intangible assets Stmt. of cash flows 333 143 Purchase of investment properties Stmt. of cash flows 19 38 Purchase of PPE Stmt. of cash flows 2,690 3,071 Total investments Stmt. of cash flows 3,042 3,252
2. Definitions and non-financial performance measures
The specific definitions outlined below add context to our non-financial performance measures and other metrics used in this report.
2.1 Sales outlets
Definition: ‘Sales outlets’ includes all stores and mobility locations operated under concepts and banners controlled by the Group, whether operated by franchisees, the Group, dealers or commission-based retailers
Commission operated sales outlets are also referred to as sales outlets under a franchise-light model.
2.2 Systemwide employees
Definition: ‘Systemwide employees’ includes all employees of Reitan Retail AS and its subsidiaries, as well as all people being employed or self-employed in the sales outlets operated by independent third parties (e.g. franchisees) under the Group’s concepts and brands (e.g. pursuant to a franchise agreement)
Systemwide employees are also referred to as ‘people’.
202
2022 REMA 1000 NO REMA 1000 DK Reitan Conv. Uno-X Mob. Other Reitan Retail Franchise operated sales outlets 658 361 1,356 - - 2,375 Group operated sales outlets 10 2 386 546 1 945 Dealer and commission operated sales outlets - - 211 270 - 481 Sales outlets as at 31 December 668 363 1,953 816 1 3,801 2021 REMA 1000 NO REMA 1000 DK Reitan Conv. Uno-X Mob. Other Reitan Retail Franchise operated sales outlets 648 359 1,385 - 0 2,392 Group operated sales outlets 9 1 383 535 0 928 Dealer and commission operated sales outlets - - 234 289 0 523 Sales outlets as at 31 December 657 360 2,002 824 0 3,843
5.1 Performance measures and definitions
203 Our responsibility Our business Corporate Governance Financial statements Appendix
5.2 Transparency Act
On 1 July 2022, åpenhetsloven, the Norwegian Transparency Act (the Act) came into force. The Act aims to promote enterprises’ work to respect fundamental human rights and decent working conditions in connection with the production of goods and the provision of services, as well as to ensure public access to information regarding how enterprises address adverse impact to such rights and conditions. Companies covered by the Act must report on risks in their own operations and their supply chains.
The Act imposes a duty to carry out due diligence assessments in line with the OECD’s Guidelines for Multinational Enterprises, a duty to publicly account for their due diligence, and a duty of information towards the general public.
How Reitan Retail responded to the Act in 2022
The Transparency Act applies to all companies in the Reitan Retail Group, whether they are direct or indirect subsidiaries. Reitan Retail has operations in the sectors discount grocery, convenience, fuel and mobility across the Nordic and Baltic regions. Among our subsidiaries are: • companies that individually are covered by the Act and responsible for ensuring compliance in their own operations.
• companies that are included through their affiliation with the Group and whose compliance is ensured by the holding company through due diligence and reporting
on group level, including our international subsidiaries and a small number of Norwegian companies.
It is our opinion that risk assessments and due diligence are most beneficial when carried out at the operational level, where the detailed knowledge and experience of the supply chain lies. By embedding ownership for the Act in all levels of the organisation, we promote local responsibility for mitigating the risk of negative impact. Following the supply chain risk assessments, the subsidiaries prioritise the allocation of resources where the greatest risk of adverse impact has been identified and mitigating actions can be implemented.
Reitan Retail's business areas with operations in Norway and Uno-X Mobility’s Danish organisation have evaluated their need to initiate processes to ensure compliance with the Act. There are different perceptions of risk management, needs for technical solutions and required involvement of colleagues within the sectors in which the subsidiaries operate. Procedures for complying to the Act are established in our Norwegian subsidiaries and in Uno-X Mobility’s Danish organisation, which is embedded in the boards of the business areas and of their respective subsidiaries.
Reitan Retail’s account of due diligence (“redegjørelse for aktsomhetsvurderingene”) will be published on reitanretail.no by 30 June 2023.
Due diligence assessments
Qualitative and quantitative results from the due diligence under the Act, shall be reported to Reitan Retail through the established financial reporting structure, annually and in the event of significant changes in the risk assessments. Reporting routines are communicated in our Norwegian entities and the
204
5.2 Transparency Act
comprehensive work with risk assessments and due diligence is an ongoing process.
Initial findings
Risk assessments and due diligence performed and reported as of February 2023 gives us valuable context of Reitan Retail’s operations in Norway.
• Around 4,800 suppliers have been risk assessed, equalling around 67 percent of all suppliers reported from our Norwegian companies and Uno-X Mobility in Denmark.
• 542 suppliers and production facilities are assessed with high or very high risk. These suppliers are mainly in the categories food/non-food and manufacturing.
• In 2022, Reitan Retail conducted 65 on-site visits and initiated dialogue with the aim of collaboration to secure satisfactory conditions.
• 633 initiated conversations, dialogues and selfassessments were carried out with suppliers after risk assessments
• Six of the due diligence assessments indicated particular need for further action. Two of them uncovered noncompliance, four resulted in improved conditions and two processes are still ongoing with mitigating actions.
Overall risks assessments and the evolution of identified risks are fixed discussion points at board meetings in Reitan Retail AS, our four business areas REMA 1000 Norway, REMA 1000 Denmark, Reitan Convenience, Uno-X Mobility and their respective subsidiaries.
With operations in the sectors food, agriculture, fuel and mobility, our supply chains are global, complex and exposed to climate change. Challenges linked to forced labour, child labour, corruption, freedom of association, discrimination, living wage and environmental destruction are significant in these sectors and with the expected consequences of climate change they are set to worsen in the years to come.
Food and non-food
CASE STUDY
A supplier discovered, through their due diligence assessments, a risk of violations of decent working conditions for migrant workers from Myanmar with one manufacturer at their production facility in Thailand. The challenge concerned recruitment fees and costs associated with recruitment to the production facility. According to the Sedex report, the manufacturer rejected the practice. Our supplier followed up on the challenge and engaged in dialogue with subcontractors, stakeholders and visited the factory. In Norway, we sought help from Ethical Trade Norway. The result was that the production facility quit their practice and risk for indecent working conditions were mitigated.
The substantive part of our suppliers are connected to the goods we sell in our 3,000 discount grocery stores and convenience outlets. There is a high risk for violations of human rights in the raw material market. Especially in the supply chains of products such as tea, coffee, cocoa, cane sugar and tropical fruit, where child labour and forced labour is widespread and well-documented. There are also documented cases of migrants working under slave-like working conditions for products produced in Europe1. The agricultural sector, especially in developing countries, is characterised by informal labour. There are also health risks linked to the use of pesticides2. Given this risk assessment, both raw materials and geographical production location are prioritised risk areas.
Prioritised risk areas:
Raw materials - Negative impact on people and society
Production facilities in high-risk countries – Negative impact on fundamental human rights and decent working conditions
205 Our responsibility Our business Corporate Governance Financial statements Appendix
1 Direktoratet for forvaltning og økonomistyring 2 OECD-FAO Guidance for Responsible Agricultural Supply Chains
Supply chain risk assessment –fundamental human rights and decent work conditions
CASE STUDY
REMA 1000 Norway collaborates with 500 suppliers, nationally and internationally, of which around 140 are suppliers of private label products. Through REMA 1000 Norway, we have a particular duty to secure and oversee human rights and decent working conditions in the production of these products, which are connected to around 470 production facilities around the world, of which 130 are in Norway. REMA 1000 Norway has implemented “Guidelines for due diligence assessments and responsible purchasing” to secure responsible procurement.
The due diligence assessments have identified high-risk production facilities, and from there we have identified high-risk suppliers based on geographical location and critical raw materials used.
Critical raw materials with internal policies:
• Palm oil, Soy, Scampi, Tuna fish, Cocoa, Coffee and tea, Hazelnuts and Cashew nuts
Geographical locations identified with high risk:
• Bangladesh, China, Malaysia, Morocco, Pakistan, Philippines, Sri Lanka, Thailand, Tunisia, Turkey and Vietnam.
For suppliers of branded goods that are themselves covered by the Act, Reitan Retail expect that they will provide information in line with their obligations under the Act. In addition, and also relating to suppliers in general, we have a contractual right to information as reflected in our Supplier Code of Conduct.
Fuel and biofuel
Human rights issues are central within the oil and gas industry. As a result, we trade goods mainly from large oil and gas suppliers located in Scandinavia having strict human rights policies and close monitoring of their supply chains. Biofuel on the other hand is prone to risk related to land use change. Uno-X Mobility take a strong stance towards no soy and palm oil in their purchased products and acquire sustainability certificates from certified institutes on all purchases of biofuels, further verified by a third party in accordance with official requirements in Norway and Denmark in order to mitigate this potential risk.
Other supplier categories with high risk
In addition to the risk assessments performed for the suppliers providing the goods we sell in our stores and for the fuel and energy suppliers in Uno-X Mobility, risk assessments for the products and services that are vital for our daily operations have been carried out individually by our subsidiaries, where certain categories have been identified with high and very high risk.
Textiles – The textile industry is highly concentrated in Asia. Uniforms are part of our day-to-day operations with main origin in Bangladesh, a country subject to poor working conditions, especially excessive use of overtime, unsatisfying safety and use of child labour3
Packaging – Most end-products require packaging. The production of plastic products involves the use of hazardous chemicals and risks related to the working environment.
206
HSE 3 ILO - textiles, clothing, leather and footwear sector
5.2 Transparency Act
risk is therefore high in the sector, especially in countries where the labour market is not regulated or regulated to a lesser extent. The cardboard and paper industry also involves the use of chemicals that can be harmful to workers in the production process4
Manufacturing – Building materials, inventory, office supplies etc. originate from all over the world. Due diligence assessments are carried out in the operational level of the organisation, where detailed knowledge and experience of the supply chain allow for qualified assessments. Within this category, solar panels are identified with very high risk. Solar panels are installed on several of our distribution and industry sites to reduce the carbon footprint of our operations, and additional locations have been screened for further rollout. Risks of forced labour and possible slavery of indigenous people in Xinjiang province in China has halted the rollout and intensified the due diligence assessment of the suppliers.
IT – hardware, software and services - All our points of sales, administration offices, distribution companies and industry companies are highly dependent on IT, technical solutions and electronics. The electronics market is experiencing high pressure, widespread use of subcontractors and environmental problems associated with the products5. The mineral industry is part of the supply chain for IT products, where the main risks include unsafe working environment, use of forced and child labour, impact on local communities when developing new mining areas and financing of military/ paramilitary groups6
Transportation – Growth in international trade has led to pressure in the transport and logistics sector. Global competition has led to lower wages and a high degree of informal work, especially in road transport. Workers in the sector are also exposed to a high HSE risk, related to long shifts, manual work and traffic accidents7 .
Duty to provide information
As of 1 July 2022, any person has the right to information from Reitan Retail and our subsidiaries regarding how we address actual and potential negative impacts on fundamental human rights and decent working conditions uncovered by our due diligence assessments. As of February 2023, we have received 17 requests through websites and email, which have all been provided with adequate and comprehensible responses within the three-week limit.
The requests have been related to country-of-origin of specific products and how we carry out due diligence assessments in accordance with the Act.
Work going forward
Risk mapping and prioritisation are continuously performed in the due diligence process to cease, prevent and mitigate adverse impact on fundamental human rights and decent working conditions. Implementation of the above-mentioned procedures will be completed in subsidiaries outside Norway through workshops in 2023. Additionally, environmental risks, corruption and tax risks are equally important, and we will look into implementation of such risk management going forward.
207 Our responsibility Our business Corporate Governance Financial statements Appendix
4 MVO Netherlands 5 ILO - mechanical and electrical engineering sector 6 UNEP mining and metals 7 ILO - Transport
Risk mapping and priorisatation are cointinously performed in the due dilligence process to cease, prevent and mitigate adverse impact on fundamental human rights and decent working conditions
5.3 EU Taxonomy
In Norway, the Sustainable Finance Act came into force on 1 January 2023 with reporting in 2024 for entities of publicly interest. The EU taxonomy Regulation is included in this Act. Reitan Retail, as a Norwegian non-public interest entity is out of scope for the EU taxonomy. Submission of data for 2022 is thus done on a voluntary basis.
In 2020, EU presented the European green deal, an action plan to achieve carbon neutrality by 2050. The EU taxonomy, which is an important part of this action plan, is a classification system that sets out a list of environmentally sustainable economic activities, referred to as eligible activities. The taxonomy aims to provide companies, investors, and policymakers with appropriate definitions for which economic activities can be considered environmentally sustainable. In this way, it should further create security for investors, protect private investors from greenwashing, help companies to become more climate-friendly, mitigate market fragmentation and help shift investments where they are most needed.
EU taxonomy’s environmental objectives:
• Climate change mitigation
• Climate change adaptation
• The sustainable use and protection of water and marine resources
• The transition to a circular economy
• Pollution prevention and control
• The protection and restoration of biodiversity and ecosystems
The EU taxonomy is still under development, and as of 2022 only objective 1. and 2. have been disclosed through nine sectors with associated activities, which
are considered to have significant climate impact. It is expected that several sectors and economic activities will be adopted and made public in the near term, in addition to the criteria for the taxonomy's remaining four objectives. We monitor the development of the regulation closely to ensure reporting in accordance with the framework, as our companies’ main operations within food and agriculture are not considered in the taxonomy at this point.
In 2022, we carried out a screening in our business areas to identify potentially sustainable economic activities that are eligible according to the current EU taxonomy activities. Based on the screening, Reitan Retail finds three activities that are eligible in accordance with the taxonomy across our four business areas. The activities found eligible for the taxonomy criteria are related to energy and the acquisition and ownership of buildings for business purposes. At this point, further criteria in reference to Do No Significant Harm or Minimum Safeguards for the different activities have not been analyzed nor evaluated at this point.
Uno-X Mobility introduced EV-charging as a new service to our consumers in 2022. As such, the service offer is defined as an eligible activity under activity 4.9 transmission and distribution of electricity. Furthermore, the company Norsk Kylling, has in relation to their new processing plant in Orkanger enabled distribution of district heating for utilization of residual heat and cooling to nearby industries. This is defined as an eligible activity under activity 4.15 district heating/cooling distribution. The distribution of district heating is for industry purposes. Lastly, our business areas engage in activity 7.7 acquisition and ownership of buildings in relation to the establishment of new sales outlets. For this activity, current Norwegian standards for calculation of energy is unaligned with the taxonomy criteria. Reitan Retail takes note of recent development closing the
208
5.3 EU Taxonomy
gap between Norwegian and European standards and will monitor the development to ensure reporting in accordance with the framework moving forward.
Taxonomy-eligible economic activities in 2022 in Reitan Retail's revenue, capital expenditures and operational expenditures are presented in table below.
Revenue
Figures for the fiscal year 2022 form the denominator of the Revenue KPI and can be taken from Revenue and Other income (IFRS 15) in the consolidated financial statements. EU taxonomy-eligible revenue in Reitan Retail in 2022 would relate to external sale of electricity from EV charging and external sale of district heating/ cooling. The current taxonomy criteria do not specify a requirement for revenue reporting in activity 7.7, which coincides with Reitan Retail’s purpose for these activities, which is to acquire and develop properties for future discount grocery, convenience and mobility outlets. At this point, no revenue is considered to be directly linked to activity 7.7.
Capital expenditures (Capex.)
The amounts used to calculate the Capex KPI denominator are based on the capital expenditures reported in the consolidated financial statements from addi-
tions and additions from acquisitions of subsidiaries in intangible assets excluding goodwill, investments properties, property, plant and equipment and right-ofuse assets. The EU taxonomy-eligible Capex share 2022 (19,7 percent) relates to investments in new construction and renovation of buildings, such as sales outlets and mobility locations.
Operational expenditures (Opex.)
The denominator for Opex comprises of salaries and personnel costs, other operating expenses excluding amortization, depreciation and impairment. The EU taxonomy eligible Opex share 2022 (1,4 percent) relates to direct costs of research and development, maintenance and IT costs, salaries and personnel costs.
In 2023, the work will be expanded to include an Alignment process according to the EU taxonomy's criteria, where it is assessed whether the activities make a significant contribution to one of the climate targets and do not cause significant damage to the other environmental targets. In addition, the activity must meet minimum requirements for social and governance conditions, as laid down in the OECD's guidelines for multinational companies, the UN's guiding principles for business and human rights and ILO conventions.
Percent is shown as share of total taxonomy-eligible and non-eligible for the respective economic activity in Reitan Retail.
1 Revenue and Other income (Note 6, 7)
2 Capex., capital expenditures, relates to intangible assets excluding goodwill (note 12), investments properties (note 13), property, plant and equipment (note 14), and right-of-use assets (note 15). The EU Taxonomy KPI takes also into account additions from business combinations. Capex. defined taxonomy-eligble and non-eligible includes additions from rightto-lease assets, as specified in 1.1.2.1 (f) in Annex I - Disclosures by non-financial undertakings.
3 Opex., operational expenditures refer to salaries and personnel costs, and other operating expenses excluding amortisation, depreciation and impairment (Note 8, 9).
209 Our responsibility Our business Corporate Governance Financial statements Appendix
Revenue1 Capex.2 Opex.3 NOK in millions Figures % Figures % Figures % 4.9 Total transmission and distribution of electricity 7 0.0% 63 1.3% 22 0.2% 4.15 Total district heating/cooling distribution 0 0.0% 3 0.1% 18 0.2% 7.7 Tota acquisition and ownership of buildings 0 0.0% 896 18.4% 97 1.0% Total taxonomy-eligible activities 7 0.0% 961 19.7% 138 1.4% Total taxonomy non-eligible activities 95,361 100% 3,912 80% 9,670 99% Total taxonomy-eligble and non-eligible activities 95,368 100% 4,873 100% 9,808 100%
Taxonomy-eligible economic activities in Reitan Retail’s revenue, Capex. and Opex. in 2022
5.4 Carbon accounting
305-3 Carbon emissions scope 3
Scope 3 reporting varies for the reporting year 2022 and 2021. See detailed description of the organisational boundaries and reporting principles and methodologies in the pages 212-221. Emissions from “Indirect Land Use Change” (ILUC) is included in Uno -X Mobility, Category 1 purchased goods and services. By definition, the GHG -protocol does not define this as relevant activity to report on in the carbon accounting. However, due to legislations in Norway and Denmark, these emissions must be calculated with standardised emission factors from the EU Directive.
GHG emissions data is verified by DNV Business Assurance Norway AS. Verification statement on page 222.
1 REMA 1000 Norway has 20 percent ownership in Bama Gruppen. The according emissions are not disclosed due to confidentiality r estrains.
210
Annual Report 2022 2 GRI 305-1 and 305-2 Carbon emissions scope 1 and 2 2022 2021 REMA 1000 Norway REMA 1000 Denmark Reitan Conv. Uno-X Mob. Other Reitan Retail Reitan Retail % change Refrigerants tCO2e 1,749 1,234 4,095 - - 7,078 6,559 7.9 % Transportation tCO2e 4,842 1,745 684 440 1 7,712 7,427 3.8 % Stationary combustion tCO2e 1,778 1,127 790 - - 3,694 4,719 -21.7 % Chemical process tCO2e - - - - - - 1 -100.0 % Total scope 1 tCO2e 8,368 4,106 5,569 440 1 18,484 18,706 -1.2 % Electricity (location based) tCO2e 2,052 14,147 9,765 636 2 26,602 27,938 -4.8 % District heating/cooling tCO2e 212 795 1,169 1 - 2,177 3,142 -30.7 % Total scope 2 tCO2e 2,264 14,942 10,934 637 2 28,779 31,080 -7.4 % Total scope 1 and 2 tCO2e 10,632 19,048 16,502 1,077 3 47,263 49,787 -5.1 % Electricity (market based) tCO2e 118,404 40,948 39,494 4,299 86 203,231 192,667 5.5 % Base year for calculation of scope 1 and 2 emissions is 2020 with total emissions of 55,148 tCO 2e equaling a reduction of 14.3 percent compared to 2022 emissions. Scope 1 emissions in 2020 were 19,993 tCO 2e and scope 2 emissions were 35,155 tCO2e. Restatements described in the pages 214215
GRI
2022 2021 REMA 1000 Norway REMA 1000 Denmark Reitan Conv. Uno-X Mob. Other Reitan Retail Reitan Retail % change Purchased Goods and Services tCO2e 1,783,390 1,281,238 133,372 1,085,509 1,661 4,285,170 4,503,458 -4.8 % Capital Goods tCO2e 28,890 - 1,909 - 584 31,382 29,710 5.6 % Fuel-and-energy related activities tCO2e 1,605 3,770 2,709 122 - 8,206 16,126 -49.1 % Upstream transportation and distribution tCO2e 72,972 38,738 8,606 5,801 - 126,118 115,035 9.6 % Waste tCO2e 5,597 3,936 4,400 1,220 1 15,154 16,861 -10.1 % Business Travel tCO2e 1,355 43 1,106 4,344 336 7,184 1,249 475.2 % Employee Commuting tCO2e 7,862 689 2,709 165 - 11,426 7,834 45.8 % Upstream Leased Assets tCO2e 12,344 - - - - 12,344 13,645 -9.5 % Downstream transportation and distribution tCO2e 352 159 8,977 - - 9,487 530 1691% Use of sold products tCO2e 1,335 161 1,292 4,068,920 - 4,071,708 4,002,714 1.7 % End-of-life treatment of sold products tCO2e 6,629 641 4,191 - - 11,460 3,953 189.9 % Downstream leased assets tCO2e - 826 - - - 826 5,425 -84.8 % Investments 1 tCO2e - 4,813 - - - 4,813 -Total scope 3 tCO2e 1,922,330 1,335,013 169,271 5,166,082 2,581 8,595,277 8,716,539 -1.4 % Total scope 1, 2 and 3 tCO2e 1,932,962 1,354,061 185,773 5,167,159 2,584 8,642,540 8,766,326 -1.4 %
are taken into account in the figures.
5.4 Carbon accounting
Annual Report 2022
Scope 3 break down of category 1 - Purchased goods and services
Break down and understanding of scope 3 emissions in the category - purchased goods and services are essential for our further work on reducing emissions. The table present categories ranged by size of emissions whilst lower emissions categories are group ed in Other food and Other nonfood. The exhaustive list of categories provides valuable knowledge and will be used actively in our companies in the complet ion of our road map towards net-zero emissions in the whole value chain.
2 Norsk Kylling and Stanges Gårdsprodukter, subsidiaries of REMA 1000 Norway, are the main providers of white meat in REMA 1000 's outlets in Norway. According to GHG Protocol, tCO2e from these subsidiaries are accounted for in scope 1 and 2 in their respective carbon accoun tings. As subsidiaries, their emissions, across all scopes are accounted for in accordance with the operational control methodology defined by the protocol. Production of their products are excluded from the calculation of REMA 1000 Norway’s product assortment to avoid double count ing, which provides reasoning for the significantly lower emissions presented above in the food category wh ite meat. 5,642 tCO2e for REMA 1000 Norway only represent third-party white meat products. As such, the emissions from Norsk Kylling and Stanges Gårdsprodukter must be added to the emission s from the third-party products to provide a representative picture of total emissions from the sale of white meat products.
211 Our responsibility Our business Corporate Governance Financial statements Appendix
2
2022 2021 Categories ranged by size of emissions. Residual grouped in other food and other non-food REMA 1000 Norway REMA 1000 Denmark Reitan Conv. Uno-X Mob. Other Reitan Retail Reitan Retail % change Processed meat 1 tCO2e 446,501 178,376 24,497 - 343 649,717 -Dairy products tCO2e 323,256 279,076 9,399 - 257 611,988 -Red meat tCO2e 213,230 289,918 488 - 169 503,805 -Fruit, vegetables & berries tCO2e 95,893 85,344 672 - 76 181,985 -Fish & seafood tCO2e 134,490 19,414 20 - 56 153,980 -Confectionary and snacks tCO2e 62,932 46,170 11,733 - 48 120,883 -Alcohol tCO2e 42,817 59,388 8,110 - 37 110,352 -White meat 2 tCO2e 5,642 37,393 4 - 2 43,041 -Soda & energy drinks tCO2e 19,060 12,504 9,800 - 14 41,378 -Other food categories tCO2e 333,282 214,023 20,497 - 289 568,091 -Total food categories 1,677,103 1,221,606 85,220 - 1,291 2,985,220 -Fossil fuel tCO2e 158 - 253 971,891 - 972,302 -Biofuel tCO2e - - - 78,044 - 78,044 -Packaging tCO2e 44,259 1,193 4,874 - - 50,326 -Tobacco products tCO2e 7,783 5,850 32,393 - 28 46,054 -EV charging tCO2e - - - 4 - 4 -Other non-food categories tCO2e 54,088 52,589 10,632 35,570 342 153,221 -Total non-food categories 106,287 59,632 48,152 1,085,509 370 1,299,950 -Total purchased good and services tCO2e 1,783,390 1,281,238 133,372 1,085,509 1,661 4,285,170 -1 Breakdown of processed meat Processed red meat tCO2e 393,221 115,945 12,826 - 301 522,293 -Processed white meat tCO2e 5,583 15,294 1,830 - 4 22,711 -Processed fish and seafood tCO2e 47,697 47,137 1,173 - 38 96,045 -Type of protein unavailable tCO2e - - 8,668 - - 8,668 -Processed meat tCO2e 446,501 178,376 24,497 - 343 649,717 - -
Emissions from sale of white meat REMA 1000 Norway Norsk Kylling tCO2e 68,558 Stange Gårdsprodukter tCO2e 9,301 Emissions - not white meat production tCO2e -2,608 Third party white meat suppliers tCO2e 5,642 White meat in REMA 1000 Norway tCO2e 80,893
Carbon accounting principles and reporting methodology
Reporting methodology
This report is Reitan Retail’s first combined publication of financial, environmental, social and governance (ESG) performance. The information presented covers the fiscal year of 2022 and is reported in accordance with the GRI Standards. ESG risk and the climate- related risks and opportunities we are exposed to are screened during 2022. Work on completing the identification, assessments and mitigation will be prioritised going forward. We further participate in the global mobilisation to attain the 2030 Sustainable Development Goals (SDGs) and the reporting of our greenhouse gas emissions is aligned with the GHG Protocol to manage our climate impact both from own operations and the value chain. Reitan Retail was established on 1 January 2021, and GRI indicators are presented for 2022 and 2021 where available.
GRI data in the sections General, Environment, Health and People in the following pages are presented for Reitan Retail Total, our business areas REMA 1000 Norway, REMA 1000 Denmark, Reitan Convenience and Uno-X Mobility, and Other. Other includes Reitan Retail AS, Gladengen Drift AS and Innom. In the financial statements Reitan Retail’s portfolio of retail properties in Norway and Denmark is presented separately in the segment note as Real Estate. Real Estate consists of an actively managed real estate portfolio within the retail segment in Norway and Denmark. In the GRI data the portfolio of retail properties located in Norway are presented together with REMA 1000 Norway and equally the retail portfolio with locations in Denmark are presented together with REMA 1000 Denmark.
The 2022 report is prepared on GRI standards 2021 and based on the belonging reporting principles:
• Accuracy
• Balance
• Clarity
• Comparability
• Completeness
• Sustainability context
• Timeliness
• Verifiability
Our Board of Directors have reviewed the combined financial and sustainability report including the company’s material topics. The integrated report Responsible Retail 2022 was approved by the Board of Directors on 19 April, 2023.
Carbon accounting Methodology
Reitan Retail applies greenhouse gas (GHG) inventory accounting principles throughout its reporting methodology that is consistent with the GHG Protocol Corporate Accounting and Reporting Standard (GHG Protocol). The GHG Protocol was developed by the World Resources Institute (WRI) and World Business Council for Sustainable Development (WBCSD). In alignment with the GHG Protocol, Reitan Retail takes into consideration the gases CO2, CH4, N2O HFCs, PFCs, SF6 and NF3 when converting consumption data to tons CO2-equivalents (tCO2e). The Global Warming Potential (GWP) used in the calculation of CO2e is primarily based on the fourth assessment report (Fourth Assessment Report, AR4) over a 100-year period from Intergovernmental Panel on Climate Change (IPCC). Reitan Retail uses CEMAsys.com to map and calculate all emissions for all business areas, using the same methodology approach.
212
5.4 Carbon accounting
Organisational and operational boundary
In Reitan Retail, we have operational control of the business areas: REMA 1000 Norway, REMA 1000 Denmark, Reitan Convenience and Uno-X Mobility, with a total of 3,801 sales outlets in seven countries in the Nordics and Baltics. Within each of our four business areas, Reitan Retail reports on the respective subsidiaries within each business area.
Scope 1: Includes all direct emission sources from owned, leased and rented assets, including franchises operated sales outlets and company owned sales outlets. This includes emissions from transportation and stationary combustion, such as leased company cars and owned trucks, as well as refrigerants in our sales outlets, distribution centres and trucks.
Scope 2: Accounts for GHG emissions from the generation of purchased electricity consumed by all facilities in Reitan Retail. Consistent with the scope 2 guidance from the GHG Protocol, both location-based method and market-based method has been reported. Reitan Retail uses the location-based method primarily when calculating the emissions from scope 2 with country specific emissions factors from International Energy Agency (IEA). Due to the recommendation from the Energy Department in Denmark, emissions are calculated based on these official emissions. However, Guarantees of Origin (GoOs) or Renewable Energy Certificates (RECs) has been purchased in the reporting year for parts of our operations, which is included in the market-based calculation. One of these entities is our main offices, which is accounted for in the respective emission calculation for business areas located at Reitan Retails main office, located in Oslo. The market-based emissions are calculated based on the country specific factors from Association of Issuing Bodies (AIB). Scope 1 and 2 for all business areas are calculated based on the described methodology. The calculations are defined as complete.
Scope 3: Entails emissions from Reitan Retails value chain. Each business area has conducted scope 3 screening to define which relevant categories to report on. In 2022, we increased the scope of our value chain emissions accounting for all relevant categories in scope 3 to establish 2022 as the company base year. However, there are still some differences to be addressed moving forward, as well as improving our data quality and granularity. An overview of scope 3 calculations and further description of each business areas can be seen below for the current report. We expect our emissions in scope 3 to increase in the forthcoming years.
213 Our responsibility Our business Corporate Governance Financial statements Appendix
Scope 3 Category REMA 1000 NO REMA 1000 DK Reitan Convenience Uno-X Mobility Purchased Goods and Services Complete Complete Complete Partially Capital Goods Complete Applicable, not yet calculated Based on estimate Applicable, not yet calculated Fuel-and-energy related activities Complete Complete Complete Complete Upstream transportation and distribution Complete Complete Complete Not Complete Waste Complete Complete Complete Incomplete Business Travel Complete Complete Complete Complete Employee Commuting Based on estimate Based on estimate Based on estimate Based on estimate Upstream Leased Assets Complete* Not applicable Not applicable Not applicable Downstream transportation and distribution Complete Complete Applicable, not yet calculated Not applicable Processing of sold products Not applicable Not applicable Not applicable Not applicable Use of sold products Complete Complete Complete Complete End-of-life treatment of sold products Complete Based on estimate Applicable, not yet calculated Not applicable Downstream leased assets Not applicable Complete Not applicable Not applicable Franchises Included in scope 1 and 2 Included in scope 1 and 2 Included in scope 1 and 2 Not applicable Investments ** Complete Not applicable Not applicable *
1
2
** REMA 1000 Norway has a 20 percent ownership in Bama Gruppen AS.
Norsk Kylling accounts for the emissions in the breeding of their chicken. Upstream leased assets in REMA 1000 Norway’s accounts for scope
and
emissions from these farms, whilst the farms are not owned by the company.
Due to confidentiality restraints, these emissions are not publicly disclosed, but accounted for.
Restatements of information
As our sustainability reporting matures, our carbon accounting also develops. With increased understanding and data quality the carbon accounting has experienced smaller changes compared to the carbon accounting disclosed in our 2021 Responsibility Report. In the following, we will summarise any key changes made to the organisation and key changes in the carbon accounting.
REMA 1000 Norway
In 2022, Science Based Target initiative (SBTi) validated REMA 1000 Norway near-term and net-zero reduction target. During the process, calculations on emissions from the scope 3 categories, capital goods and employee commuting, was conducted. In line with the guidelines from SBTi, REMA 1000 Norway are to disclose these figures publicly together with their carbon accounting, even though the categories are excluded from their emission reduction target in line with the latest criteria. Furthermore, end-of-life emissions from food waste was accounted for and included in the reporting and target setting, resulting in 2 percent increase in their scope 3 emissions.
During the process, new information regarding the emissions from the upstream transportation and distribution activities was retrieved. Due to double counting, estimated emissions from the transportation of goods was reduced by 80 percent as this was included in the emissions from REMA Distribution. The correction resulted in a 53 percent decrease in scope 3, category 4.
Furthermore, in the carbon accounting for 2022, a detailed waste report was retrieved from the new supplier. The report provided a higher level of data granularity compared to previous years, which allowed for the detailed calculation of disposal method in line with best practice compared to previous years. As such, the emissions from scope 3, category 5, waste generated in operations was significantly higher and not comparable with the change in methodology. As such, a recalculation of waste has been conducted for 2020 and 2021, resulting in a 70 percent increase of emissions in the category.
In the carbon accounting for 2021 REMA 1000 Norway accounted for emissions from Norsk Kylling’s utilisation of Biogon E290 (CO2), as this is often considered to be a refrigerant gas. During 2022, new information on how this liquid gas is utilised was retrieved. As the liquid gas serves as a food safety measurement to prevent food depravity, the gas has no emission during production, but in usage, when consumers open the packaging. As such, reported emissions for 2021 (575 tCO2e) are restructured and accounted for under scope 3, category 11, use-of-sold products, a category previously deemed unapplicable.
In 2022, Norsk Kylling collected information to calculate scope 1 and 2 emissions from the farms breeding their chicken, as well as emissions linked to manure production. As the farms are not owned, nor under the operational control of Norsk Kylling, these emissions are accounted for under scope 3, category 8 upstream leased assets. The emissions have been added to REMA 1000’s carbon accounting for the reporting years, 2020 and 2021, and increased their scope 3 emissions by about 1 percent. The calculation of emissions from manure contributes to the future ambition to set a FLAG-target in line with the latest guideline for land, forest, and agriculture.
Lastly, Kolly, previously Engrospartner under REMA Distribution, has become a direct subsidiary under REMA 1000. Hence, the scope of REMA 1000 Norway’s carbon accounting has increased compared to 2021. Kolly accounts for 2.5 percent of REMA 1000 Norway’s total emissions, and as such an equal increase in the total emissions.
REMA 1000 Denmark
REMA 1000 Denmark’s trailers utilise CO2 refrigerants to run the cooling system, which has previously been included
214
5.4 Carbon accounting
in the company’s scope 1 emissions. However, the CO2 is a by-product of ammonia production by a third party and is taxed accordingly. Thus, the CO2 is reported in the ammonia producer’s scope 1 emissions. Double reporting in scope 1 should be avoided, and for this reason, REMA 1000 will be excluding the emission. The correction equals 60 percent decrease in emissions.
Furthermore, REMA 1000 Denmark has significantly increased the scope of their value chain emissions. The emissions from their product range have been added for the 2021 reporting year, increasing emissions by 97 percent, as preparation for the 2022 carbon accounting.
Reitan Convenience
Since last reporting, Reitan Convenience Norway retrieved data on a significant part of their packaging data. This was included following the completion of the carbon accounting. As such, reported emissions in Reitan Convenience scope 3, category 1, purchased goods and services has increased with 5 percent since the last reporting year.
Uno-X Mobility
A small correction of water consumption was corrected in the 2021 reporting during the reporting for 2022. The correction has not been significant to Uno-X Mobility’s reported 2021 emissions.
Other
Innom, a new concept store in Oslo, is for the reporting year separated from REMA 1000 Norway’s carbon accounting in line with financial reporting. As such, emissions from Innom are reported under “Other” together with the emissions from Reitan Retail AS and Gladengen Drift AS.
Scope and boundaries
REMA 1000 Norway
The carbon accounting for REMA 1000 Norway includes their 668 sales outlets, administration, subsidiaries (industry), their distribution company REMA Distribution and Kolly. REMA 1000 Norway has conducted a scope 3 analysis and found 12 of 15 categories relevant and applicable to report on. This is an increase of 5 categories compared to 2021, based on new information retrieved during the validation of their near-term and net-zero targets and for the current carbon accounting.
Scope 1: REMA 1000 Norway includes all emissions from their operations, including fossil fuels from company cars, trucks, stationary combustion, and consumption of refrigerants. Refrigerants are reported based on refill of the refrigerant in outlets, distribution centre and in REMA Industry operations. REMA 1000 Norway utilise diesel aggregate to run the cooling systems in their trucks and trailers. Last year, no refrigerant from the trucks and trailers cooling systems were reported due to lack of information. For the 2022 carbon accounting, this gap has been closed with confirmation and consumption data from their main supplier, accounting for at least 70 percent of the refrigerant systems in company owned trucks.
Scope 2: Includes electricity for 96.7 percent of the 668 stores. For the reporting year, no subsidiaries have reported purchase of Renewable Energy Certificates (RECs) nor Guarantees of Origin (GOOs) for their consumption of electricity.
Scope 3: In the reporting year, REMA 1000 Norway has calculated the emissions from their sold products. The scope includes 96 percent of their product range, an increase of 1 percent compared to 2021, where 5 percent is
215 Our responsibility Our business Corporate Governance Financial statements Appendix
accounted for in the carbon accounting for REMA Industry. The remaining 4 percent of REMA 1000 Norway product range is for the reporting year excluded due to 1) Outside of REMA 1000s core business products; food and beverages and 2) lack of information needed to calculate the carbon emission from the product, this being either a) lack of information on weight or similar consumption data to calculate the carbon emissions, b) lack of information on LCA-analysis or similar information to map the product to an emission factor for calculation or c) lack of information of the product components to map emissions accordingly.
Item wise sales data are extracted and matched with compatible emission factors for calculation of emissions from goods sold in the sales outlets. For the reporting year 2022, REMA 1000 Norway has increased the granularity in the carbon accounting, being able to separate more products with unique emission factors compared to previous years. The increased inclusion rate of products is sourced to non-food products like cleaning products, diapers, personal care, and lighters. Where the latter triggers a calculation of emissions in the use phase, which is included. For some products the carbon emission is calculated based on the average emissions of the product category, typical for several easy-bake products and dinner kits. Additionally, some products are calculated based on general emission factors based on several samples, with increased specificity compared to 2021, to make an average emission factor, i.e., REMA ready-made meals, is then calculated with a “Ready-meal, type of protein with sauce” emission factor.
As for Kolly, 88 percent of their products based on weight is included in their first reporting year. To avoid double counting under Reitan Retail, products sold and distributed to Reitan Convenience Norway is excluded from Kolly’s carbon accounting in line with current practices in Reitan Convenience’s carbon accounting. Remaining transportation of Kolly’s goods is accounted for under REMA Distribution, as well as waste generated in operations. Moving forward, REMA 1000 Norway will continue to increase the inclusion rate for Kolly’s product range, whilst separating emissions data on transportation and waste.
In 2022 we have gathered data on barley malt utilised in Grans Bryggeri’s production and calculated emissions. Altogether, higher specification on packaging data as well as spices and other raw materials used in production of goods have been analysed and reported. Water consumption and wastewater data have been reported for all entities, except REMA Distribution and Kolly. Additionally, scope 3 includes fuel consumption from trucks not owned but operated by the company, as well as rail freight and sea cargo transportation. REMA Distribution does not report on refrigerants refilled on third-party trucks. End of life treatment of sold products is based on REMA 1000’s market share and national statistics on household waste.
In 2023 Further data quality improvements in the industry companies will be sought after. Hugaas Rugeri will finalise their new and energy efficient factory, which will reduce future emissions in scope 1 and 2. In a few cases, REMA 1000 Norway has retrieved goods-specific emissions, calculated by suppliers. In these cases, we assume that the supplier has accounted for their calculation, in line with best practices. In the forthcoming period, REMA 1000 Norway will focus on retrieving LCA analysis from suppliers on third-party products.
The carbon accounting for REMA 1000 Norway is not expected to change significantly in the coming years as the completeness of scope 3 accounting is achieved. However, the inclusion of FLAG-related emissions can affect the reporting but as of today the effect is uncertain.
REMA 1000 Denmark
The carbon accounting for REMA 1000 Denmark includes their 363 sales outlets, distribution centres, administration, subsidiaries (REMA.dk webstore and Vigo) and their ownership share of Gram Slot (49 percent). REMA 1000
216
5.4 Carbon accounting
Denmark has conducted a scope 3 analysis and found 11 of 15 categories relevant and applicable to report on. 10 out of these 11 categories are included in the 2022 carbon reporting, except for Capital Goods.
Scope 1: REMA 1000 Denmark includes all direct emissions from their operations, including fossil fuels from company cars, trucks, stationary combustion, and consumption of refrigerants. Refrigerants are reported based on refill of the refrigerant in outlets and distribution centres. REMA 1000 Denmark’s trailers utilise CO2 refrigerants to run the cooling system, which has previously been included in the company’s scope 1 emissions. However, the CO2 is a by-product of ammonia production by a third party and is taxed accordingly. Thus, the CO2 is reported in the ammonia producer’s scope 1 emissions. Double reporting in scope 1 should be avoided, and for this reason, REMA 1000 Denmark will be excluding this specific emission.
Scope 2: Includes electricity and district heating for their 363 stores, administration, distribution centres, and subsidiaries (REMA.dk webstore and Vigo).
Scope 3: A change from 2021 to 2022 is the inclusion of eight additional scope 3 categories to REMA 1000 Denmark’s value chain emissions. REMA 1000 Denmark has calculated the emissions from 94 percent of their product range. The remaining 6 percent of the product range were excluded from this year’s carbon accounting due to 1) the product being outside of REMA 1000 Denmark’s main products; food and beverage, 2) insufficient data on the product, either on the product side in terms of weight and/or content quantities or on the emissions factor side in terms of LCA or similar information necessary for the mapping of the individual product emissions.
Item wise sales data are extracted and matched with compatible emission factors for calculation of emissions from goods sold in the sales outlets. For most products, general emissions factors are applied to the product. Where a general emission factor was unavailable, the main product ingredient is used to apply a best estimate to the product. Average emissions factors have been applied where relevant. As an example of the latter, REMA 1000 Spaghetti Carbonara was calculated using the emission factor Ready-meal, pork.
Transportation of goods between REMA 1000 Denmark’s distribution centres and the sales outlets are included in scope 3, category four upstream transportation and distribution. As of 2022, additional transportation of goods 1) suppliers to the distribution centres and 2) between suppliers and sales outlets have also been added to the reporting of category four. The transportation between suppliers and distribution centres was calculated using the distance between the individual supplier and the relevant distribution centre as well as the weight of the product. The transportation between suppliers and outlets is based on data provided by the individual supplier, who delivered data either in CO2e-emissions, tons-kilometres, or fuel consumption related to their transportation of REMA 1000 Denmark products. Downstream transportation and distribution were also included this year and stems from data reported by their delivery service on the number of kilometres the goods were transported to customers in 2022.
Data related to business travels and waste was based on company specific data. Employee commuting was calculated using information on the employee count and national statistics for commuting habits. End of life treatment of sold products is based on REMA 1000’s market share and national statistics on household waste. In one distribution centre, a third party rents a part of REMA 1000’s area. The emissions from this company’s operations have been included as downstream leased assets emissions.
Finally, REMA 1000 Denmark’s ownership share of Gram Slot has been included as an investment under scope 3. Due to the ownership share, and because REMA 1000 Denmark has no operational control over the business, the emissions from Gram Slot are not considered as scope 1 and 2 emissions to REMA 1000 Denmark. Data in this
217 Our responsibility Our business Corporate Governance Financial statements Appendix
category has been supplied by Gram Slot and includes emissions from agricultural processes, livestock, heat, fuel used in vehicles and machinery, and electricity used on site.
The carbon accounting for REMA 1000 Denmark is expected to include the emissions from capital goods from 2023 and forward, as REMA 1000 Denmark strives for a higher degree of completeness in their climate accounting. In addition to these emissions, REMA 1000 Denmark will strive for greater data quality in coming years, with focus especially on product range as well as supplier to store and supplier to distribution centres transportation.
Reitan Convenience
The carbon accounting for Reitan Convenience AS includes: Reitan Convenience Norway, Reitan Convenience Sweden, Reitan Convenience Denmark, Reitan Convenience Finland, Reitan Convenience Latvia, Reitan Convenience Estonia, and Reitan Convenience Lithuania. The mentioned companies comprise of eight concepts: 7-Eleven, Narvesen, Northland, Pressbyrån, PBX, R-kiosk(i), Caffeine, and Lietuvos Spauda with a total of 1,953 sales outlets as per 31 December 2022. Additionally comes the respective administrations and press distribution units in the Baltic countries.
The following carbon accounting includes emissions from 7-Eleven outlets located at YX 7-Eleven stations, while the fossil fuels sold at these stations are accounted for in Uno-X Mobility’s carbon accounting. Reitan Convenience has conducted a scope 3 analysis and found nine of 15 categories relevant and applicable to report on for all companies. Category nine - downstream transportation and distribution is relevant to the companies collaborating with eg. Wolt or Foodora, picking up goods at the sales outlets and transporting to customers. When this information has been provided, the emissions have been accounted for.
Scope 1: Reitan Convenience includes all emissions from their operations, including fossil fuels from company cars, stationary combustion, and consumption of refrigerants. Refrigerants are reported based on refill of the refrigerant in sales outlets.
Scope 2: Includes the electricity consumption across Reitan Convenience’s 1,953 sales outlets. Data quality and gathering is a challenge for several of the companies, as their outlets often are situated in malls, airports, or other common areas. The offices of Reitan Convenience AS, Reitan Convenience Norway, Reitan Convenience Estonia and Reitan Convenience Finland have in the reporting year purchased RECs for parts of their electricity consumption, which is included in the market-based calculations. In relation to the challenges of extracting electricity consumption, the challenge also applies to extracting data on district heating. Therefore, estimations on consumption of district heating have been conducted to aggregate the data.
• Reitan Convenience Norway: District heating is only consumed by the main office and included in the carbon accounting.
• Reitan Convenience Sweden: Estimated based on Swedish statistics and m2, assuming all sales outlets utilise district heating. Also has actual usage of district heating & cooling for main office in Stockholm.
• Reitan Convenience Denmark: Less than 5 percent of the outlets utilise district heating. Because the expenses related to district heating are included in the rent, it has not been possible to determine the consumption in any of these stores.
• Reitan Convenience Finland: Estimated based on 118.9kWh/m2, assuming all outlets utilise district heating, except 18 kiosks which are known to use only electricity for heating.
• Reitan Convenience Latvia: Several sales outlets utilise district heating, and report as such.
218
5.4 Carbon accounting
• Reitan Convenience Estonia: Many sales outlets utilise district heating, and report as such.
• Reitan Convenience Lithuania: Several outlets utilise district heating, and report as such.
Scope 3: Reitan Convenience has in the reporting year calculated the emissions from nine (10) of the 15 categories in scope 3. There are variations within Reitan Convenience. Please find the overview below for the current calculations included in the reporting year.
Scope 3 emissions for Reitan Convenience are completed for the first time in the reporting year of 2022. In the forthcoming years, improvement on data quality and granularity will increase the reporting level. Purchased goods and services is deemed as the category with the most significant emissions. It has as such been divided
219 Our responsibility Our business Corporate Governance Financial statements Appendix
Scope 3 Category RC Norway RC Sweden RC Denmark RC Finland RC Latvia RC Estonia RC Lithuania Purchased Goods and Services Complete Complete Complete Complete Complete Complete Complete Capital Goods Estimated Partially completed Estimated Estimated Estimated Estimated Estimated Fuel-and-energy related activities Complete Complete Complete Complete Complete Complete Complete Upstream transportation and distribution Complete Complete Complete Complete Complete Complete Complete Waste Partial estimations Complete Complete Estimated Complete Complete Complete Business Travel Complete Complete Complete Complete Complete** Complete Complete Employee Commuting Estimated Estimated Estimated Estimated Estimated Estimated Estimated Upstream Leased Assets Not applicable Not applicable Not applicable Not applicable Not applicable Not applicable Not applicable Downstream transportation and distribution Not relevant Not relevant Complete Not relevant Applicable, not yet calculated Complete Not relevant Processing of sold products Not applicable Not applicable Not applicable Not applicable Not applicable Not applicable Not applicable Use of sold products Complete Estimated Not relevant Included, not relevant Estimated Estimated Estimated End-of-life treatment of sold products Estimated Estimated Estimated Estimated Estimated Estimated Estimated Downstream leased assets Not applicable Not applicable Not applicable Not applicable Not applicable Not applicable Not applicable Franchises Included in scope 1 and 2 Included in scope 1 and 2 Included in scope 1 and 2 Included in scope 1 and 2 Included in scope 1 and 2 Included in scope 1 and 2 Included in scope 1 and 2 Investments Not applicable Not applicable Not applicable Not applicable Not applicable Not applicable Not applicable
into multiple sub-groups for best comparison between the organisational units. The defined key categories are food, beverages, convenience goods, press and tobacco. Capital Goods and renovations are included with estimates on items purchased throughout the year where data is available. Enhanced data quality will be prioritised going forward.
Upstream transportation has been included with available data. There is a big dependency on transportation suppliers and their data, which differ significantly between the suppliers across Reitan Convenience’s markets. As such, there are differences in the reported emissions in this category as well. Continuous dialogue with transportation suppliers, as well as all suppliers is key when striving for improved reporting of emissions. Also, for the calculation of waste generated in the operations, category five, there are variations in data quality and granularity provided by suppliers. A main reason being collective waste management at locations of common area. As such, some units have measured the waste from one or a few outlets to estimate the total waste from all sales outlets.
Business travel, on the other hand, is a category that is relatively easy to collect data from due to good cooperation with travel agencies, and data availability within the financial departments. Employee commuting is a category with varied data quality. Some of the business units have sent out a survey to their employees to gather actual data from their employees, and extrapolated survey results to all employees. Other business units have chosen to utilise national statistics and applied this based on number of employees.
Use of sold products have been estimated, as there are only a few products with use-phase emissions. Emissions from the use of lighters is an example in this category that has been included, as it is tangible and easy to calculate estimated emissions from. As for end-of-life treatment emissions, an estimate based on national waste statistics have been utilised, and the market share of each business unit in their respective countries. The aim of the estimation has been to include emissions from the sale of food products that isn’t consumed in line with best practice reporting. This category can be further improved in later years with similar estimates for e.g., the packaging of products.
Uno-X Mobility
Uno-X Mobility are committed to be transparent with their carbon emissions and report emissions in own operations and value chain based on the Green House Gas Protocol. Data for carbon accounting are collected from 816 unmanned fuel stations, 52 Nordic Swan ecolabelled car wash and seven ultrafast EV charging locations, as well as offices. Uno-X Konceptdesign was acquired in Q4 2022 and is not included in the carbon accountings for 2022. The company will be included as of 2023.
All Scope 1 and 2 data is calculated using consumption data, as well as for most of Scope 3. Category 7 business travel has been estimated based on national statistics and employee data. In 2022, the scope 3 screening has been expanded, now including more categories, such as employee commuting and upstream transportation and distribution, and expanded on others such as waste. This year’s reporting has also seen the inclusion of activities in our new Uno-X ultrafast EV charging business.
Scope 1: Uno-X Mobility includes all emissions from their operations and are only related to owned company cars and leased vehicles due to the structure of the company.
Scope 2: Includes electricity consumption for Uno-X Mobility’s offices in Norway and Denmark, as most of the operations are on unmanned fuel and energy stations.
220
5.4 Carbon accounting
Scope 3: Emissions include indirect emissions related to goods and services in the value chain. Categories included in this year’s reporting is waste, business travels, lifecycle of liquid fuels, water consumption, EV charging activities and fuel- and energy related activities. Scope 3 emissions have been calculated using globally recognised DEFRA, IEA and Ecoinvent factors.
Uno-X Mobility will during 2023 ensure a detailed and complete overview of total emissions from the lubricant value chain, including packaging, and this will be added to scope 3 going forward.
221 Our responsibility Our business Corporate Governance Financial statements Appendix
Reitan Retail AS
Independent Limited Assurance Report
Scope of Engagement
Reitan Retail commissioned DNV Business Assurance Norway AS (“DNV”) to conduct a limited assurance engagement over the GHG Emissions and Energy data presented in the Reitan Retail Responsibility Report 2022 (“Report”) for the reporting period 1st January to 31st December 2022

The assurance engagement included the following subsidiaries: Reitan Retail AS, REMA 1000 Norway, REMA 1000 Denmark, Uno-X Mobility and Reitan Convenience
Selected Information
The scope and boundary of our work is restricted to the energy consu mption and greenhouse gas (GHG) emissions data included within the Report (the “Selected Information”), listed below:
• 302-1 Energy Consumption
• 305-1 Direct greenhouse gas (GHG) emissions (Scope 1)
• 305-2 Indirect greenhouse gas (GHG) emissions (Scope 2)
o Market-based
o Location-based
• 305-3 Other indirect greenhouse gas (GHG) emissions (Scope 3)
o Purchased goods and services
o Capital goods
o Fuel-and-energy-related activities
o Upstream transportation and distribution
o Waste
o Business travel
o Employee commuting
o Upstream leased assets
o Downstream transportation and distribution
o Use of sold products
o End-of-life treatment of sold products
o Downstream leased assets
o Investments
To assess the Selected Information, which includes an assessment of the risk of material misstatement in the Report , we have used the GRI Standards (2021), GHG Protocol Corporate Accounting and Reporting Standard and Corporate Value Chain (Scope 3) Standard as well as Reitan Retail own guidelines and reporting principles which can be found in the Report (the “Criteria”).
We have not performed any work, and do not express any conclusion, on any other information that may be published in the Report or on Reitan Retail website for the current reporting period.
Our conclusions
Based on the procedures we have performed and the evidence we have obtained, nothing has come to our attention that causes us to believe that the Selected Information is not fairly stated and has not been prepared, in all material respects, in accordance with the Criteria.
This conclusion relates only to the Selected Information and is to be read in the context of this Assurance Report, in particular the inherent limitations explained below.
Standard and level of assurance
We performed a limited assurance engagement in accordance with the International Standard on Assurance Engagements (ISAE) 300 0 revised – ‘Assurance Engagements other than Audits and Reviews of Historical Financial Information’ (revised), issued by the International Auditing and Assurance Standards Board. This standard requires that we comply with ethical requirements and plan and perform the assurance engagement to obtain limited assurance.
DNV applies its own management standards and compliance policies for quality control, in accordance with ISO/IEC 17021:2011 - Conformity Assessment Requirements for bodies providing audit and certification of management systems, and accordingly maintains a comprehensive system of quality control including documented policies and procedures regarding compliance with ethical requirements, professional standards, and applicable legal and regulatory requirements.
222 DNV Business Assurance (Norway) AS, Veritasveien 1, 1322 Høvik, Norway. Tel: +47 67 57 99 00. assurance.dnv.com Statement no: Valid from: Valid to: PRJN-481623 March 28, 2023 N/A
5.4 Verification statement
The procedures performed in a limited assurance engagement vary in nature and timing from and are less detailed than those undertaken during a reasonable assurance engagement, so the level of assurance obtained is substantially lower than the assurance that would have been obtained had a reasonable assurance engagement been performed. We planned and performed our work to obtain the evidence we considered sufficient to provide a basis for our opinion, so that the risk of this conclusion being in error is reduced, but not reduced completely.
Basis of our conclusion

We are required to plan and perform our work in order to consider the risk of material misstatement of the Selected Information; our work included, but was not restricted to:
• Assessing the appropriateness of the Criteria for the Selected Information;
• Conducting interviews with the persons responsible for consolidation and calculation of data to obtain an understanding of the data management systems and processes used to generate, aggregate and report the Selected Information;
• Conducting interviews with persons responsible for reporting data gathering and calculations from Reitan Retail business areas;
• Reviewing whether the evidence, measurements and their scope provided to us by Reitan Retail for the Selected Information is prepared in accordance with the Criteria; and
• Reviewing the Selected Information in the Report regarding the Criteria.
Inherent limitations
Our assurance relies on the premise that the data and information provided by Reitan Retail to us as part of our review procedures have been provided in good faith. Because of the selective nature (sampling) and other inherent limitations of both procedures and systems of internal control, there remains the unavoidable risk that errors or irregularities may not have been detected. Also, the selection of different but acceptable measurement techniques may result in materially different measurements.
DNV expressly disclaims any liability or co-responsibility for any decision a person or an entity may make based on this Independent Assurance Report.
Our competence, integrity, and quality control
DNV established policies and procedures are designed to ensure that DNV, its personnel and – where applicable – others are subject to independence requirements (including personnel of other entities of DNV) maintain independence where required by relevant ethical requirements. This engagement work was carried out by an independent team of sustainability assurance professionals, whose members have not been involved in the development of any of the Criteria. Our multi-disciplinary team consisted of professionals with a combination of environmental and sustainability assurance experience.
Responsibilities of the Management of Reitan Retail and DNV
The Management of Reitan Retail have sole responsibility for:

• Preparing and presenting the Selected information in accordance with the Criteria;
• Designing, implementing and maintaining effective internal controls over the information and data, resulting in the preparation of the Selected Information that is free from material misstatements;
• Measuring and reporting the Selected Information based on their established Criteria; and
• Contents and statements contained within the Report and the Criteria.
Our responsibility is to plan and perform our work to obtain limited assurance about whether the Selected Information has been prepared in accordance with the Criteria and to report to Reitan Retail in the form of an independent limited assurance conclusion, based on the work performed and the evidence obtained. We have not been responsible for the preparation of the Report
For and on behalf of DNV Business Assurance Norway AS Høvik, Norway 28.03.2022
Catharina Torp
Tone Rice Lead Auditor Technical reviewer
223 Our responsibility Our business Corporate Governance Financial statements Appendix DNV Business Assurance (Norway) AS, Veritasveien 1, 1322 Høvik, Norway. Tel: +47 67 57 99 00. assurance.dnv.com
5.5 GRI Stakeholder input
Stakeholders
External stakeholders Suppliers
Biodiversity
Animal welfare
Climate
Food waste
Open dialogue with stakeholders
Financial institutions
Responsible marketing and transparency
Data and privacy
Health and healthy products
Climate and responsibility in the value chain
Diversity and equality
Industry organisations and NGO’s
Health and healthy products
Climate in production and supply chain
Food waste
Circularity, waste, packaging
Government and media
Employer’s liability, (franchise model)
Health
Climate
Circularity
Gender equality
Transparency in the company and good internal control
Customers
Responsible marketing
Responsible company
Climate
Circularity
Internal stakeholders
REMA 1000 Norway
Food waste
Plastic and packaging
Healthy and sustainable food for all (democratic consumption)
Inclusive employer
Transparency in the value chain
Animal welfare
REMA 1000 Denmark
Food waste
Packaging
Climate-friendly goods transport and energy
Organic farming
Public health
Equality
Partnerships
Reitan Convenience AS
Zero waste
Zero plastic
Watt-hunt
Healthier options
Diversity
Supplier requirements
Uno-X Mobility
Sustainable mobility
Renewable energy
Good health and healthy lifestyle
Safety and safety working environment
Equality
Solid finances
224
5.5 GRI
General GRI
GRI 2-7 Employees
Employees in the company, not including franchisees and their store personnel.
1 The prerequisites that enable Non-guaranteed hours contracts are not present in REMA 1000 Denmark, and for that reason REMA 1000 Denmark does not use this form of employment.
GRI 2-8 Workers who are not employees
Workers in Reitan Retail, defined as not employees are our franchisees and their store personnel. Workers and managers in company operated outlets are counted and reported in GRI 2-7 Employees.
1 The prerequisites that enable Non-guaranteed hours contracts are not present in REMA 1000 Denmark, and for that reason REMA 1000 Denmark does not use this form of employment.
225 Our responsibility Our business Corporate Governance Financial statements Appendix Annual Report 2022 2
2022 2021 REMA 1000 REMA 1000 Reitan Uno-X Reitan Reitan NO DK Conv. Mobility Other Retail Retail Employment type Women Men Women Men Women Men Women Men Women Men Women Men Women Men Permanent 88% 85% 96% 96% 88% 89% 91% 84% 91% 93% 90% 89% 91% 90% Temporary 6% 10% 4% 4% 2% 2% 1% 1% 6% 0% 3% 6% 4% 7% Non-guaranteed hours 1 6% 5% 0% 0% 10% 9% 8% 15% 3% 7% 7% 5% 5% 3% Employment by gender 709 1,575 536 867 2,055 462 89 210 35 29 3,424 3,143 2,961 2,754 Gender in share of total 31% 69% 38% 62% 82% 18% 30% 70% 55% 45% 52% 48% 52% 48% Total employment 2,284 1,403 2,517 299 64 6,567 5,715
2022 2021 REMA 1000 REMA 1000 Reitan Uno-X Reitan Reitan NO DK Conv. Mobility Other Retail Retail Employment capacity Women Men Women Men Women Men Women Men Women Men Women Men Women Men Part time 22% 21% 23% 19% 26% 26% 17% 16% 40% 52% 25% 21% 37% 31% Fulltime 78% 79% 77% 81% 74% 74% 83% 84% 60% 48% 75% 79% 63% 69% Employment by gender 709 1,575 536 867 2,055 462 89 210 35 29 3,424 3,143 2,961 2,754 Gender in share of total 31% 69% 38% 62% 82% 18% 30% 70% 55% 45% 52% 48% 52% 48% Total employment 2,284 1,403 2,517 299 64 6,567 5,715
2022 2021 Workers who are not employees - employment type REMA 1000 REMA 1000 Reitan Uno-X Reitan Reitan NO DK Conv. Mobility Other Retail Retail Women Men Women Men Women Men Women Men Women Men Women Men Women Men Permanent 71% 65% 41% 70% 63% 59% - - - - 58% 66% 63% 56% Temporary 7% 10% 59% 30% 17% 23% - - - - 28% 21% 24% 32% Non-guaranteed hours 1 22% 23% 0% 0% 20% 18% - - - - 14% 13% 13% 12% Workers by gender 6,327 6,709 6,508 7,265 5,961 4,107 - - - - 18,796 18,081 19,142 17,222 Gender in share of total 49% 51% 47% 53% 59% 41% - - - - 51% 49% 53% 47% Total workers not employed 13,036 13,773 10,068 - - 36,877 36,364
and their store personnel
1 The prerequisites that enable Non-guaranteed hours contracts are not present in REMA 1000 Denmark, and for that reason REMA 1000 Denmark does not use this form of employment.
GRI 2-21 Annual total compensation ratio
Reitan Retail comprise of subsidiaries in seven countries with several salary- and payroll systems being used within the Group. For reporting on GRI 221 we present data on the Group's compensation ratio in intervals, average and median, compiled from input from the business areas' subsidiaries.
In 2022, 37 out of 47 companies within Reitan Retail reported their annual total compensation ratio. Nine of the companies have shared managing director with another subsidiary of Reitan Retail, and one company cannot report annual compensation ratio due to GDPR.
226
2 2022 2021 REMA 1000 REMA 1000 Reitan Uno-X Reitan Reitan Workers who are not employees - employment capacity NO DK Conv. Mobility Other Retail Retail Women Men Women Men Women Men Women Men Women Men Women Men Women Men Part time 79% 74% 91% 85% 69% 74% - - - - 80% 79% 83% 78% Fulltime 21% 26% 9% 15% 31% 26% - - - - 20% 21% 17% 22% Employment by gender 6,327 6,709 6,508 7,265 5,961 4,107 - - - - 18,796 18,081 19,142 17,222 Gender in share of total 49% 51% 47% 53% 59% 41% - - - - 51% 49% 53% 47% Total workers not employed 13,036 13,773 10,068 - - 36,877 36,364 Own GRI - Employees and workers who are not employed 2022 2021 REMA 1000 REMA 1000 Reitan Uno-X Reitan Reitan Employees and workersemployment type NO DK Conv. Mobility Other Retail Retail Women Men Women Men Women Men Women Men Women Men Women Men Women Men Permanent 73% 70% 45% 73% 70% 62% 91% 84% 91% 93% 63% 69% 67% 61% Temporary 7% 10% 55% 27% 13% 21% 1% 1% 6% 0% 24% 19% 21% 29% Non-guaranteed hours1 20% 20% 0% 0% 17% 17% 8% 15% 3% 7% 13% 12% 12% 10% Workers by gender 7,036 8,284 7,044 8,132 8,016 4,569 89 210 35 29 22,220 21,224 22,103 19,976 Gender in share of total 46% 54% 46% 54% 64% 36% 30% 70% 55% 45% 51% 49% 53% 47% Total workers not employed 15,320 15,176 12,585 299 64 43,444 42,079 Employees in the company,
Annual Report 2022
franchisees
2022 2021 REMA 1000 REMA 1000 Reitan Uno-X Reitan Reitan Employees and workersemployment capacity NO DK Conv. Mobility Other Retail Retail Women Men Women Men Women Men Women Men Women Men Women Men Women Men Part time 74% 64% 86% 78% 58% 69% 17% 16% 40% 52% 72% 70% 77% 72% Fulltime 26% 36% 14% 22% 42% 31% 83% 84% 60% 48% 28% 30% 23% 28% Employment by gender 7,036 8,284 7,044 8,132 8,016 4,569 89 210 35 29 22,220 21,224 22,103 19,976 Gender in share of total 46% 54% 46% 54% 64% 36% 30% 70% 55% 45% 51% 49% 53% 47% Total workers not employed 15,320 15,176 12,585 299 64 43,444 42,079
Annual total compensation ratio 2022 2021 Number of reporting 37 37 Compensation ratio - interval 1.4 - 26.7 1.2 - 43.2 Compensation ratio - 5.8 7.1 Compensation ratio - median 4.3 4.6 Growth CEO pay - average 5.2 %Growth CEO pay - median 0.8 %Growth median pay - 4.6 %Growth median pay - median 3.7 % -
5.5 GRI
GRI 2-28 Membership associations
Main memberships from each business area
Reitan Retail AS
NHO Service og Handel
Nobel Peace Centre
REMA 1000 NO
The Norwegian Food Center
Norwegian Food Foundation
Trade Environmental Fund
HighEFF
Food Preparedness
Retailers’ Environment Fund
Ethical Trade Norway
The grocery store's environmental forum
The packaging association
Board of Directors
Collaboration
Reitan Convenience
Finnish Commerce Federation
The Finnish Grocery Trade Association
Ethical Trade Norway
Danish Chamber of Commerce
Danish vegetarian society
Board of Directors
Board of Directors
Membership
Membership
Membership
Board of Directors
Board of Directors
Board of Directors
Board of Directors
Membership
Membership
Membership
Membership
Membership
Rainforest Foundation Norway Collaboration
Circular Packaging
Collaboration
The Norwegian Animal Protection Alliance Collaboration
REMA 1000 DK
The Food Partnership - Health and Climate
Ethical Trade Denmark
Stop Wasting Food Denmark
Whole Grain Partnership
The Danish Chamber of Commerce
Danish Alliance for Responsible Palm Oil
Danish Alliance for Responsible Soy
Board of Directors
Board of Directors
Board of Directors
Board of Directors
Board of Directors
Membership
Membership
PlantPro Collaboration
Thinktank FREJ Collaboration
GRI 2-30 Collective bargaining agreements
Estonian Traders Association
Green Tiger
Keep Norway clean
Lithuanian diversity charter
Lithuanian Trade Association
New Loop
Retailers’ Environment Fund
Science Based Targets Initiative
The Confederation of Swedish Enterprise
The Estonian Employers' Confederation
The Swedish Trade Federation
Thinktank FREJ
Latvian Diversity Charter
Reporters Without Borders
The Latvian food retailer association
The Swedish reading movement
Uno-X Mobility
Drivkraft Norge
Drivkraft Danmark
Danish preparedness forum
Norwegian preparedness forum
Membership
Membership
Membership
Membership
Membership
Membership
Membership
Membership
Membership
Membership
Membership
Membership
Collaboration
Collaboration
Collaboration
Collaboration
Board of Directors
Board of Directors
Board of Directors
Membership
Reitan Retail recognises the importance and impact of organised labour, and the freedom of individuals to organise in the wor kplace and to enter into collective bargaining agreements.
Our company and business areas are situated in a part of the world wit h a strong history and culture related to organised labour. In the Scandinavian countries, the tripartite concertation between state, labour unions and employers make up the basic framework fo r our work life. However, in the retail industry in our operating areas, the utilising of collective bargaining agreements as a tool is less common. This may relate to the relative high percentage of young and/or part-time employees working within the sector.
Reitan Retail’s sales outlets are mostly organised as franchises. Therefore, wage bargaining for most of our 43,500 employees are carried out locally, between the franchisee and the employee. Going forward, Reitan Retail will start mapping the percentage of employees covered by collective agreements. At the same time, we also work on increasing the level of awareness in our business areas, of the importance of organised labour. Not only amongst employees in our outlets, but also among the franchisees and administrative employees.
227 Our responsibility Our business Corporate Governance Financial statements Appendix Annual Report 2022 2
Environment GRI
GRI 301-1 Material used by weight or volume
Improved data quality has been a priority in 2022, in addition to the inclusion of more scope 3 data from our business area. REMA 1000 Norway has increased the granularity in their data set and more material is defined as recycled compared to 2021. This is aligned with their ambition to increase the use of recycled materials. As for Reitan Convenience, several of their units have enhanced their reporting and i ncluded packaging as part of their carbon accounting. The increase in material reporte d is 231 percent, compared to 2021. Moving forward, Reitan Retail expects increase in reported materials from REMA 1000 Denmark and Uno -X Mobility as they continue to gain data granularity.
GRI 301-2 Recycled input materials used
Our business areas continuously strive to improve the utilisation of materials, moving to recycled materials and materials th at can be recycled. In 2022, our business areas increased the use of renewable materials, whilst decreasing the utilisation of non-renewable materials. In the forthcoming years, we will strive to reduce our usage of non -renewable materials to zero.
228 Annual Report 2022 2
2022 2021 REMA 1000 Norway REMA 1000 Denmark Reitan Conv. Uno-X Mob. Other Reitan Retail Reitan Retail % change Bagasse, renewable ton - - 234 - - 234 79 198% Cardboard ton 1,320 154 243 - - 1,718 1,306 32% Cardboard, renewable ton - - 3 - - 3 -Glass, virgin ton 1,799 - - - 1,799 2,000 -10% Glass, recycled ton 675 - - - - 675 1,600 -58% Metals, virgin ton 2,158 - 32 - - 2,190 1,743 26% Metals, recycled ton 1,079 - - - - 1,079 761 42% Paper ton 14 - 3,105 - - 3,119 952 228% Paper, renewable ton - - 44 - - 44 60 -26% Plastic ton 3,129 412 369 - - 3,910 7,946 -51% Plastic, renewable ton 3,365 - 8 - - 3,373 1,734 95% Other virgin material ton 23 - 28 - - 51 -Packaging material, non-renewable ton 2,533 - 231 - - 2,764 196 1307% Total weight material used ton 16,095 567 4,297 - - 20,958 18,376 14%
2022 2021 REMA 1000 Norway REMA 1000 Denmark Reitan Conv. Uno-X Mob. Other Reitan Retail Reitan Retail % change Total weight, materials used ton 16,095 567 4,297 - - 20,958 18,376 14% Total weight, renewable materials ton 10,433 154 3,696 - - 14,284 10,234 40% share renewable materials % 65% 27% 86% - - 68% 56%Total weight, non-renewable materials ton 5,662 412 600 - - 6,674 8,143 -18% share non-renewable materials % 35% 73% 14% - - 32% 44% -
5.5 GRI
Renewable energy share is based on the specific countries' share of electricity production from renewable sources according t o IEA.
GRI 303 - Water effluents
Reitan Retail's business areas interacts with water mainly through municipality services across all business areas and countr ies. As such, water is drawn mainly from groundwater interconnected with the municipality water supply. The majority of our water withdrawal is connected to our outlets, car washes and industries. As 2022 is the first reporting year for our water withdrawal, there is room for improveme nt on data granularity and quality. In addition to the use of grou ndwater in REMA 1000 Norway's industry companies Norsk Kylling's processing plant at Orkanger utilizes seawater to cool the plant. Unfortunately, we were not successful in retaining these data for the 2022 repo rting.
There has not been reported significant impacts of the business' water withdrawal in 2022. However, parts of our business areas have a significant utilization of water, where related impacts needs to be detailed mapped out. In general, Norway and Denmark, the countries in which we have significant water consumption are seen as low risk on extensive water consumption and baseline water stress by the WWF Water Risk Index, whereas countries further south -east of the Nordic countries in Europe, in which we have operations, face a low -moderate risk. Water-related impacts are managed in our subsidiaries management approach, e.g., Uno -X Mobility have invested in a growing amount of Nordic Swan ecolabelled car wash facilities across Norway and Denmark. As per the requirements of Nordic Swan, contaminat ed water from washing is 90 percent more thoroughly rinsed and requires about 80 percent less water consumption compared to conventional ca r wash.
In reference to water discharge, Reitan Retail has reported the retained information on water discharge across business areas for the reporting year. There is room for improvement in data granularity and quality, both in reference to volume of discharge, treatment and to where the water is discharged. As the majority of our outlets, car washes and industries are connected to the municipality or local water supplier, official reports showcase that wastewater is managed before retreating back to the source, which is assumed to be the same as the source of th e withdrawal. Like water withdrawal, discharge of seawater utilized for cooling of Norsk Kyllings plant has not been confirmed for the reporting year. Reitan Retail has currently no internal water quality standards or guidelines in reference to discharge but complies with national r equirements at all facilities.
229 Our responsibility Our business Corporate Governance Financial statements Appendix
2 GRI 302-1 Energy consumption 2022 2021 REMA 1000 Norway REMA 1000 Denmark Reitan Conv. Uno-X Mob. Other Reitan Retail Reitan Retail % change Transportation MWh 22,298 7,274 2,926 1,997 5 34,501 33,353 3.4 % Stationary combustion MWh 7,904 7,574 3,646 - - 19,124 23,245 -17.7 % Total Scope 1 MWh 30,202 14,849 6,571 1,997 5 53,624 56,598 -5.3 % Electricity MWh 293,269 99,629 150,221 10,798 240 554,158 551,608 0.5 % District heating/cooling MWh 19,080 17,857 13,601 82 25 50,646 43,887 15.4 % Green electricity production MWh 3,884 761 - - - 4,646 3,701 25.5 % Total Scope 2 MWh 316,234 118,247 163,822 10,880 266 609,449 599,196 1.7 % Total scope 1 and 2 MWh 346,436 133,096 170,393 12,877 271 663,073 655,794 1.1 % 2022 2021 Renewable energy share REMA 1000 Norway REMA 1000 Denmark Reitan Conv. Uno-X Mob. Other Reitan Retail Reitan Retail % point change Scope 1 renewable energy share1 % 12.2 % 13.2 % 2.5 % 14.1 % 5.0 % 11.4 % 10.0 % 1.4 % Scope 2 renewable energy share1 % 90.2 % 72.0 % 69.9 % 86.3 % 88.0 % 81.1 % 80.0 % 1.1 % Scope 1 and 2 renewable energy shares1 % 83.4 % 65.4 % 67.3 % 75.1 % 86.3 % 75.5 % 74.0 % 1.5 % 1
Annual Report 2022
2022 2021 Groundwater REMA 1000 Norway REMA 1000 Denmark Reitan Conv. Uno-X Mob. Other Reitan Retail Reitan Retail % change 303-3 a. Water withdrawal megalitre 527 46 327 61 - 962 N/A N/A 303-4 a. Water discharge megalitre 478 13 301 61 - 853 N/A N/A 303-5 Water consumption megalitre 50 34 26 - - 109 N/A N/A
GRI 306-3 Waste generated in our operations
The table above showcase waste generated in our operations and upstream activities, producing and distributing food, beverage and fuel products (input). Waste generated in our operations have seen an increase from last year because of improved data gathering methods an d an increase in number of units reporting waste. In REMA 1000 Norway, the new waste management supplier delivers highly detailed overview on waste generated and disposal methods. Whilst the waste in ton decreased, emissions increased due to improved data granularity . As such, REMA 1000 Norway has changed their methodology in alignment with best practices. At Uno -X Mobility more units can deliver actual data on waste, e.g., reporting on removal of contaminated grounds at fuel stations. Further, for Reitan Convenience in Finland wasta data is now available with a decent degree of sorting. In general, Reitan Convenience as a business are a is largely dependent on estimations, which need to be further addressed in the upcoming years for satisfactory result. We will continue to develop our waste reporting routines for units with poorer waste reporting management to stringline reporting quality across all our subsidiaries.
1 Waste from Innom is accounted for under REMA 1000 Norway.
GRI 306-5 Waste directed to disposal
1 Organic waste generated offsite (output) is estimated based on the national statistics for food waste, multiplied by the mark et share for REMA 1000 Norway and Denmark respectively. For Reitan Convenience, it is assumed that the food waste at the consumer level is less compared to REMA 1000 due to the nature of their operations. To reflect the convenience sector, national statistics stating the amount of total waste from the Service and Convenience Goods industry in Norway was retrieved and applied as a thi rd multiplicator. The equation provides an estimate of the food waste generated at the consumer end (e.g., thrown away or not fully consumed) from Reitan Convenience's sold food pr oducts.
Whilst the three indicators were retrieved from Norwegian statistics, the three indicators were not available for all geographical locations across Reitan Convenience. As such, for most of the estimates are based on these figures multiplied with the countries market share.
230 Annual Report 2022 2
2022 2021 REMA 1000 Norway REMA 1000 Denmark Reitan Conv. Uno-X Mob. Other 1 Reitan Retail Reitan Retail % change Residual waste, incinerated ton 7,146 6,686 8,068 11 - 21,910 16,687 31% Hazardous waste, incinerated ton 2 - - 8 - 10 11 -9% Other waste, incinerated ton 1,364 - 3 6 - 1,373 -Organic waste, recycled ton 4,718 3,614 426 - - 8,758 6,454 36% Paper and cardboard, recycled ton 23,286 22,702 3,896 - - 49,884 26,657 87% Hazardous waste, recycled ton 96 - 1 - - 96 39 146% Plastic waste, recycled ton 1,142 2,280 177 2 - 3,602 1,777 103% Other waste, recycled ton 3,386 250 6,015 21 - 9,673 7,401 31% Other waste, landfill ton 19 - 73 2,497 - 2,589 -Total waste generated in operations ton 41,159 35,532 18,658 2,545 - 97,895 59,026 66% Total waste, recycled ton 32,628 28,847 10,515 23 - 72,013 42,328 70% Share recycled of total waste generated % 79.3 % 81.2 % 56.4 % 0.9 % - 75.6 % 71.7 %Total wastewater megaliter 478 13 301 61 - 853 N/A N/A
2022 2021 Offsite REMA 1000 Norway REMA 1000 Denmark Reitan Conv. Uno-X Mob. Other Reitan Retail Reitan Retail % change Organic waste, treated 1 ton 51,251 30,100 17,432 - - 98,783 89,196 11% Plastic waste, recycled ton 4,456 - - - - 4,456 4,157 7% Other waste, recycled ton 5,874 - - - - 5,874 3,740 57% Residual waste, incinerated ton 4 - - - - 4 3,744 -100% Hazardous waste, incinerated ton - - - - - - -Other waste, incinerated ton 2,239 - - - - 2,239 -Other waste, landfill ton - - - - - - -Total waste directed to disposal ton 63,824 30,100 17,432 - - 111,356 100,837 10.4 % Total waste, recycled ton 10,330 - - - - 10,330 7,897 31%
5.5 GRI
GRI 305-7 Nitrogen oxides (NOx), sulfur oxides (SOx), and other significant air emissions, Scope 1
Own GRI – Waste sorting in sales outlets
231 Our responsibility Our business Corporate Governance Financial statements Appendix
2
Annual Report 2022
2022 2021 REMA 1000 Norway REMA 1000 Denmark Reitan Conv. Uno-X Mob. Other Reitan Retail Reitan Retail % change NOx kg 20,471 6,910 1,964 1,547 1 30,893 9,302 232.1 % SOx kg 27 12 9 2 - 50 3,824 -98.7 % VOC kg 677 1,110 785 210 2 2,784 -TSP/PM kg 257 154 55 19 - 485 - -
Number of sales outlets 31.12 Number supported by a commercial or public recycling system Number of sales outlets with in-store sorting facilities REMA 1000 NORWAY 668 668 668 Share of total sales outlets 100% 100% REMA 1000 DENMARK 363 363 363 Share of total sales outlets 100% 100% REITAN CONVENIENCE 1,953 1,429 1,061 Share of total sales outlets 73% 54% Reitan Convenience Norway 392 392 392 Reitan Convenience Sweden 397 357 117 Reitan Convenience Denmark 177 177 177 R-kioski Oy 451 383 284 Reitan Convenience Estonia 94 8 8 Reitan Convenience Latvia 234 83 83 Reitan Convenience Lithuania 208 29UNO-X MOBILITY N/A N/A N/A REITAN RETAIL 2,984 2,460 2,092 Share of total sales outlets 82% 70%
Health GRI
Own GRI - Sale of healthier food and drink options in REMA 1000 Norway and REMA 1000 Denmark
Healthier options
1 REMA 1000 Norway: Includes fresh, frozen and selected canned fruit, vegetables and berries. Additionally 100 % juice and smoothies are included. REMA 1000 Denmark: Fresh fruit, vegetables and berries.
2 REMA 1000 Norway: Products labelled with Grovhetsskalaen and other whole grain products with keyhole label. REMA 1000 Denmark: Products labelled with Fuldkornsmærket.
3 REMA 1000 Norway: 100 percent fish and seafood products. REMA 1000 Denmark: Keyhole labelled fish and seafood products.
4 All keyhole labeled products not included in the rows above.
5 Other edible products includes both edible and drinkable products
Keyhole labelled products
2,324 keyhole labelled products were available in REMA 1000 Norway and Denmark during 2022. As at 31 December 2022, 1,144 keyhole labelled products were available.
Organic products
1,622 ecological products were available in REMA 1000 Norway and Denmark during 2022. As at 31 December 2022, 769 ecological products were available.
232 Annual Report 2022 2
2022 2021 Figures in thousands Systemvide sales Share Units Share Systemvide sales Share Units Share Fruit, vegetables and berries 1 9,026,916 14.1 % 604,834 19.3 % 8,680,054 14.1 % 620,000 19.8 % Whole grain products 2 1,677,126 2.6 % 88,370 2.8 % 1,609,982 2.6 % 89,012 2.8 % Fish and seafood 3 1,990,919 3.1 % 54,770 1.7 % 2,011,318 3.3 % 55,632 1.8 % Other keyhole labelled products 4 5,931,452 9.3 % 264,718 8.4 % 5,591,110 9.1 % 261,047 8.3 % Healthier options in REMA 1000 18,626,413 29.1 % 1,012,692 32.3 % 17,892,464 29.1 % 1,025,691 32.7 % Other edible products 5 45,364,107 70.9 % 2,125,174 67.7 % 43,642,321 70.9 % 2,108,339 67.3 % Total edible products 63,990,520 100.0 % 3,137,866 100.0 % 61,534,785 100.0 % 3,134,030 100.0 %
2022 2021 Figures in thousands Systemvide sales Share Units Share Systemvide sales Share Units Share Keyhole - private label 5,900,381 9.2 % 249,375 7.9 % 5,556,933 9.0 % 243,685 7.8 % Keyhole - brand label 5,947,731 9.3 % 469,816 15.0 % 5,645,764 9.2 % 476,341 15.2 % Keyhole labelled products 11,848,112 18.5 % 719,191 22.9 % 11,202,697 18.2 % 720,026 23.0 % Other edible products 52,142,408 81.5 % 2,418,675 77.1 % 50,332,088 81.8 % 2,414,004 77.0 % Total edible products 63,990,520 100.0 % 3,137,866 100.0 % 61,534,785 100.0 % 3,134,030 100.0 %
2022 2021 Figures in thousands Systemvide sales Share Units Share Systemvide sales Share Units Share Organic - private label 1,021,666 1.6 % 73,527 2.3 % 922,992 1.5 % 66,375 2.1 % Organic - brand label 2,074,070 3.2 % 116,714 3.7 % 1,999,588 3.2 % 120,581 3.8 % Total organic products 3,095,736 4.8 % 190,241 6.1 % 2,922,580 4.7 % 186,956 6.0 % Other edible products 60,894,784 95.2 % 2,947,625 93.9 % 58,612,205 95.3 % 2,947,074 94.0 % Total edible products 63,990,520 100.0 % 3,137,866 100.0 % 61,534,785 100.0 % 3,134,030 100.0 %
5.5 GRI
Own GRI - Participants on camps and schools held, promoting well-being Main collaborations and activities from each business area
camps and schools held, promoting well-
Own GRI - Campaigns promoting healthier options in Reitan Convenience
The respective Reitan Convenience subsidiaries have individually defined healthier options with associated promotions and campaigns. Examples of healthier products in campaigns include: drinks with low sugar content; and plant-based food.
233 Our responsibility Our business Corporate Governance Financial statements Appendix Annual Report 2022 2
2022 2021 REMA 1000 NO Handball schools in vacations 7,925 2,597 REMA 1000 DK Cooking schools 1,422 1,780 DBU Football schools 24,700 22,404 REMA 1000 Sports Camp 371 306 Diabetes Camp 8 9 REMA 1000 Familiy Camp 175 193 Teach Camp 241 373 Maker Camp 101GirlPower Camp 71 60 REMA 1000 Aqua Camp 6,163 6,073 REMA 1000 Tennis Camp 265 250 SSA Sports- og Sundhedsakadamiet 361 147 Day Camps - 150 Reitan Convenience Sietuvos Pro-Gimnasium Vilnius 150Medeina School Vilnius 75Uno-X Mobility Biathlethe with MOT 300 278 Reitan Retail - Participants on
42,328 34,620
2022 Total campaigns Campaigns healthier options Share healthier options Reitan Convenience Norge 156 22 14% Reitan Convenience Sweden 34 9 26% Reitan Convenience Denmark 49 34 69% Reitan Convenience Sweden 34 9 26% R-kioski Oy 100 30 30% Reitan Convenience Estonia 20 6 30% Reitan Convenience Latvia 14 5 36% Reitan Convenience Lithuania 19 4 21% Reitan Convenience - total 426 119 28%
Own GRI - Health promoting collaborations and activities
Main collaborations and activities from each business area
REMA 1000 NO
REMA 1000 Hjerteligaen
Idrett for alle-brødet
Pur Vinterglede
A Walk in the Park
Oslo Maraton
Drammen halvmaraton
Aktiv mot kreft
Norges Musikkorpsforbund
REMA 1000 Trondheim Håndballcup
Stine Sofie Stiftelsen
REMA 1000 DK
Danish Football Unions' Football Schools
Fødevarepartnerskabet - for sundhed og klima
REMA 1000 Sport Camp
REMA 1000 Aqua Camp
SSA Sports- og Sundhedsakadamiet
Cooking schools
Fuldkornspartnerskabet
Alt for Damernes Kvindeløb
MOT
The national society LEV
Smoke Free Future
Danish Cancer Society
Dementia Friend
The Danish Multiple Sclerosis Society
The Danish Diabetes Association
Reitan Convenience
Walking Festival
Kestutis Navickas Badminton Academy
R-kioski does well in sports
MOT
Pride
Danish Hospital Clowns
Families with children cancer
R-kioski does good locally
MOT
Caffeine Local Hero program
Youth Line
Uno-X Mobility
Bicycle races in Norway and Denmark
Cycling Clubs in Norway
Norwegian Cycling Union
Danish Cycling Union
Team Rytger
Norwegian gymnasts' national team
Johannes Høsflot Klæbo
Johannes Thingnæs Bø and NSSF
MOT
Physical health
Physical health
Physical health
Physical health
Physical health
Physical health
Physical health
Physical health
Physical health
Mental health
Physical health
Physical health
Physical health
Physical health
Physical health
Physical health
Physical health
Physical health
Mental health
Mental health
Disease prevention
Disease prevention
Disease prevention
Disease prevention
Disease prevention
Physical health
Physical health
Physical health
Mental health
Mental health
Mental health
Mental health
Mental health
Mental health
Mental health
Mental health
Physical health
Physical health
Physical health
Physical health
Physical health
Physical health
Physical health
Physical health
Mental health
234 3
5.5 GRI
People GRI
GRI 401 Employment
Annual Report 2022
1 Due to country specific parental leave regulations and GDPR, it is not possible to collect the exact number of employees that were entitled to parental leave
235 Our responsibility Our business Corporate Governance Financial statements Appendix
2
401-1 a. New employee hires 2022 2021 REMA 1000 REMA 1000 Reitan Uno-X Reitan Reitan NO DK Conv. Mobility Other Retail Retail Age and gender Women Men Women Men Women Men Women Men Women Men Women Men Women Men <18 14% 9% 4% 4% 7% 8% 0% 1% 14% 13% 7% 6% 5% 4% 19-29 48% 47% 70% 69% 60% 70% 35% 24% 27% 38% 59% 58% 60% 63% 30-39 19% 24% 16% 19% 11% 14% 26% 17% 36% 44% 13% 20% 13% 16% 40-49 12% 14% 6% 6% 7% 5% 21% 35% 18% 0% 8% 10% 9% 9% 50-59 6% 5% 3% 2% 10% 3% 12% 18% 5% 6% 9% 4% 9% 6% >60 1% 1% 0% 1% 5% 0% 6% 5% 0% 0% 4% 1% 3% 1% New employee hires by gender 213 440 232 464 1,309 292 34 83 22 16 1,810 1,295 1,453 935 Gender in share of total 33% 67% 33% 67% 82% 18% 29% 71% 58% 42% 58% 42% 61% 39% Total employee hires 653 696 1,601 117 38 3,105 2,388 Employees in the company, not including franchisees and their store personnel 401-1 b. Employee turnover 2022 2021 REMA 1000 REMA 1000 Reitan Uno-X Reitan Reitan NO DK Conv. Mobility Other Retail Retail Age and gender Women Men Women Men Women Men Women Men Women Men Women Men Women Men <18 6% 4% 2% 1% 6% 8% 0% 0% 0% 0% 5% 4% 3% 3% 19-29 39% 44% 67% 68% 59% 64% 0% 9% 0% 0% 57% 58% 57% 55% 30-39 27% 22% 21% 23% 9% 15% 25% 18% 0% 0% 13% 21% 13% 21% 40-49 14% 15% 7% 5% 9% 6% 33% 45% 38% 0% 10% 9% 11% 12% 50-59 8% 8% 1% 3% 10% 6% 17% 9% 50% 100% 9% 5% 11% 6% >60 6% 7% 2% 1% 7% 1% 25% 18% 13% 0% 6% 3% 6% 3% Employee turnover by gender -158 -299 -175 -379 -993 -216 -12 -11 -8 -1 -1,346 -906 -1,491 -925 Gender in share of total 35% 65% 32% 68% 82% 18% 52% 48% 89% 11% 60% 40% 62% 38% Total employee turnover -457 -554 -1,209 -23 -9 -2,252 -2,416 Employees in the company, not including franchisees and their store personnel 401-3 Parental leave 2022 2021 REMA 1000 REMA 1000 Reitan Uno-X Reitan Reitan NO DK Conv. Mobility Other Retail Retail Women Men Women Men Women Men Women Men Women Men Women Men Women Men Employees entitled to parental leave1 N/A N/A N/A N/A N/A N/A N/A N/A N/A N/A N/A N/A N/A N/A Employees on parental leave 35 38 20 25 40 3 5 11 2 0 102 77 124 96 Employees returned to work in the reporting period after parental leave ended 17 31 17 23 15 4 3 9 2 0 54 67 81 86 Return to work rate 81% 97% 85% 92% 75% 100% 100% 100% 100% - 81% 96% 89% 95% Return to work rate - total 91% 89% 79% 100% 100% 88% 92% Employees returned to work after parental leave, and still employed 12 months after their return to work 33 47 25 29 19 5 3 3 1 2 81 86 79 100 Retention rate 73% 62% 88% 90% 79% 100% 33% 67% 0% 100% 77% 74% 73% 85% Retention rate - total 66% 89% 83% 50% - 75% 80%
GRI 403 Occupational Health and Safety
403-6 Promotion of worker health
In addition to regulatory occupational injury insurance, companies may provide extended medical and healthcare services, thro ugh partnerships or insurances.
1 Employees in the company, not including franchisees and their store personnel. 2 Franchisees and their store personnel. Reitan Retail does generally not hold information on additional insurance positions provided by the frachisees to their store personnel 3 5,495 Store personnel in REMA 1000 Denmark over the age of 20 have an extra health insurance through PFA (pension fund - Gjensidige insurance). 4 Data not available for Uno-X Konceptdesign. UnoX Pro Cycling have special insurance arrangements for all cyclists.
403-8 Workers covered by an occupational health and safety management system
All Reitan Retail's subsidiaries have company-specific standards for Health, Environment and Safety together with personnel handbooks outlining the employees' and workers' rights and obligations.
1 Employees in the company, not including franchisees and their store personnel. 2 Franchisees and their store personnel. Reitan Retail includes standards for Health, Environment and Safety, including safety management systems in the fracnhise contracts.
403-9 Work-related injuries
During 2022, one of our companies had an unwanted incident involving personal injury. The affected employee received immediat e medical care and is still recovering. Both the employee and the family is cared for, and will be followed up by the company for as long as needed. The company followed its regular emergency preparedness routines, with the company's emergency team handling the incident, following up the affected e mployee, family, colleagues, and relevant authorities. The incident has been investigat ed both internally and by Arbeidstilsynet and the police. No criminal circumstances have been found. Suitable measures have been put in place to ensure that such an incident will never happen again.
Out of the 51 work-related injuries in 2022 the majority occurd as crush - and cut injuries, twisted limbs, falling i stairs and minor burns from boiling water. Number of injuries are reported in table with GRI 403 -10.
236 Annual Report 2022 2
2022 REMA 1000 REMA 1000 Reitan Uno-X Reitan NO DK 3 Conv. Mobility 4 Other Retail Share of employees 1 with access to extended medical and healthcare services thru company insurances 60% 60% 81% 100% 61% 69% Share of workers who are not employees2 with access to extended medical and healthcare services thru company insurances N/A 40% N/A N/A N/A 15%
2022 REMA 1000 REMA 1000 Reitan Uno-X Reitan NO DK Conv. Mobility Other Retail Share of employees 1 included in a Group company's occupational health and safety management system 100% 100% 100% 100% 100% 100% Share of workers who are not employees2 included in a Group company's occupational health and safety management system 100% 100% 100% 100% 100% 100%
5.5 GRI
403-10 Work-related ill health
Employees in the company, not including franchisees and their store personnel
1 Accidents resulting in injuries in the cycling sport are somewhat common, thus normally expected injuries are not reported in Uno-X Pro Cycling, Uno-X Mobility business area.
GRI 405 Diversity and Equal Opportunity
237 Our responsibility Our business Corporate Governance Financial statements Appendix
2
2022 2021 REMA 1000 REMA 1000 Reitan Uno-X Reitan Reitan NO DK Conv. Mobility 1 Other Retail Retail Work-related injuries 22 7 22 0 0 51 61 Number of sickness days 37,912 12,816 21,095 894 526 73,243 59,681 Sickness in percent of man-labour 8.0 % 5.5 % 4.6 % 1.6 % 3.4 % 5.9 % 5.1 % Full time equivalents in the year 1,982 1,047 1,904 248 49 5,230 4,877 Sickness in percent of man-labour last year 7.3 % 4.2 % 3.6 % 2.2 % 12.2 % 5.1 % -
Annual Report 2022
405-1
Diversity of governance bodies 2022 2021 REMA 1000 REMA 1000 Reitan Uno-X Reitan Reitan NO DK Conv. Mobility Other Retail Retail Age and gender Women Men Women Men Women Men Women Men Women Men Women Men Women Men 19-29 6% 1% 0% 0% 7% 3% 0% 3% 0% 0% 5% 1% 5% 1% 30-39 19% 26% 0% 5% 24% 20% 25% 6% 17% 20% 21% 19% 20% 18% 40-49 36% 35% 58% 34% 39% 51% 25% 51% 67% 40% 39% 41% 40% 44% 50-59 33% 33% 42% 50% 28% 17% 42% 29% 17% 40% 30% 31% 30% 30% >60 7% 6% 0% 11% 3% 9% 8% 11% 0% 0% 4% 8% 5% 7% Governance bodies by gender 70 159 12 44 120 76 12 35 6 5 220 319 206 293 Gender in share of total 31% 69% 21% 79% 61% 39% 26% 74% 55% 45% 41% 59% 41% 59% Total governance bodies 229 56 196 47 11 539 499 Employees in the company, not including franchisees and their store personnel. Governance bodies are presented as management teams and managers with personnel responsibility 405-1 b. Diversity of employees by gender and age 2022 2021 REMA 1000 REMA 1000 Reitan Uno-X Reitan Reitan NO DK Conv. Mobility Other Retail Retail Age and gender Women Men Women Men Women Men Women Men Women Men Women Men Women Men <18 4% 2% 4% 3% 2% 2% 0% 0% 9% 6% 3% 2% 2% 1% 19-29 24% 20% 39% 44% 37% 40% 19% 20% 17% 17% 34% 30% 29% 26% 30-39 27% 25% 21% 25% 14% 22% 28% 19% 34% 37% 18% 24% 19% 26% 40-49 22% 26% 19% 15% 13% 21% 16% 24% 29% 14% 16% 22% 18% 23% 50-59 19% 20% 13% 10% 18% 12% 26% 27% 9% 9% 18% 16% 20% 17% >60 5% 7% 5% 4% 15% 4% 11% 10% 3% 0% 11% 6% 12% 6% Employment by gender 709 1,575 536 867 2,055 462 89 210 35 29 3,424 3,143 2,961 2,754 Gender in share of total 31% 69% 38% 62% 82% 18% 30% 70% 55% 45% 52% 48% 52% 48% Total employees 2,284 1,403 2,517 299 64 6,567 5,715 Employees in the company, not including franchisees and their store personnel
a.
in the company, not including franchisees and their store personnel
in the company, not including franchisees and their store personnel 1 The prerequisites that enable non-guaranteed hours contracts are not present in REMA 1000 Denmark, and for that reason REMA 1000 Denmark does not use this form of employment.
238 3 405-1 b. Diversity of employees by gender and employment category 2022 2021 REMA 1000 REMA 1000 Reitan Uno-X Reitan Reitan NO DK Conv. Mobility Other Retail Retail Employment category Women Men Women Men Women Men Women Men Women Men Women Men Women Men Co-workers - Company operated outlets 11% 6% 5% 3% 64% 42% 0% 0% 26% 34% 42% 10% 38% 6% Managers - Company operated outlets 1% 0% 0% 1% 8% 5% 0% 0% 6% 0% 5% 1% 5% 1% Co-workers - Other 1% 0% 0% 0% 0% 0% 10% 14% 0% 0% 0% 1% 0% 1% Co-workersWarehouse/Distribution 18% 51% 53% 76% 4% 6% 0% 0% 0% 0% 14% 47% 15% 51% Co-workers - Production facilities 23% 15% 0% 0% 3% 3% 4% 19% 0% 0% 7% 9% 6% 8% Co-workers - Office 25% 9% 35% 13% 12% 14% 64% 37% 49% 34% 20% 13% 21% 12% Co-workers - With responsibility area 12% 10% 4% 3% 4% 14% 8% 13% 3% 14% 5% 9% 7% 11% Managers 7% 7% 2% 4% 4% 7% 2% 4% 6% 14% 4% 6% 5% 6% Management 2% 3% 0% 1% 2% 9% 11% 12% 11% 3% 2% 4% 2% 5% Employment by gender 709 1,575 536 867 2,055 462 89 210 35 29 3,424 3,143 2,961 2,754 Gender in share of total 31% 69% 38% 62% 82% 18% 30% 70% 55% 45% 52% 48% 52% 48% Total employees 2,284 1,403 2,517 299 64 6,567 5,715 Employees
405-1 b. Diversity of employees by gender and employment type 2022 2021 REMA 1000 REMA 1000 Reitan Uno-X Reitan Reitan NO DK Conv. Mobility Other Retail Retail Employment type Women Men Women Men Women Men Women Men Women Men Women Men Women Men Permanent employment 88% 86% 96% 96% 88% 89% 91% 84% 91% 93% 90% 89% 91% 90% Temporary employment 6% 9% 4% 4% 2% 2% 1% 1% 6% 0% 3% 6% 4% 7% Non-guaranteed hours employees1 6% 5% 0% 0% 10% 9% 8% 15% 3% 7% 7% 5% 5% 3% Employment by gender 709 1,575 536 867 2,055 462 89 210 35 29 3,424 3,143 2,961 2,754 Gender in share of total 31% 69% 38% 62% 82% 18% 30% 70% 55% 45% 52% 48% 52% 48% Total employees 2,284 1,403 2,517 299 64 6,567 5,715 Employees
405-1
Diversity of employees by gender and employment capacity 2022 2021 REMA 1000 REMA 1000 Reitan Uno-X Reitan Reitan NO DK Conv. Mobility Other Retail Retail Employment type Women Men Women Men Women Men Women Men Women Men Women Men Women Men Part time 22% 21% 23% 19% 26% 26% 17% 16% 40% 52% 25% 21% 37% 31% Fulltime 78% 79% 77% 81% 74% 74% 83% 84% 60% 48% 75% 79% 63% 69% Employment by gender 709 1,575 536 867 2,055 462 89 210 35 29 3,424 3,143 2,961 2,754 Gender in share of total 31% 69% 38% 62% 82% 18% 30% 70% 55% 45% 52% 48% 52% 48% Total employees 2,284 1,403 2,517 299 64 6,567 5,715 Employees in the company, not including franchisees and their store personnel 5.5 GRI
b.
405-2 Ratio of basic salary and remuneration of women to men
By law, all employers in Norway, regardless of size, have a duty to work actively, purposefully and plan to promote equality and prevent discrimination in the workplace. Equal pay reporting is part of the obligations related to Workplace Equality & Diversi ty Reporting (Aktivitets- og redegjørelsesplikten, ARP). Our Norwegian companies, of which are legally bound by the law, report individual ARPs.
Reitan Retail, as a group shall work systematically to correct pay differences between genders in all employme nt categories, with particular focus on management level. The companies in our organisation have various areas of improvement, and each shall continue to work with c oncrete and specific measures that address the challenges we face.
In 2022, Reitan Retail collected data on equal pay per employment category. All companies made individual calculations on equal pay based on remuneration data and gender composition and reported on relevant employment categories. Initial analysis indicates a gap bet ween women and men, providing a valuable basis for our efforts going forward, as we strive for equal pay and opportunities for all. Altogether, 4 0 companies reported 118 data points throughout the Group.
In the table below we have defined equal pay as 5 percen tile, higher and lower than 1. The column <1,05 shows the number of data points with women having higher salary than men and the column >0,95 shows the number of data points where men earn more than women.
239 Our responsibility Our business Corporate Governance Financial statements Appendix Annual Report 2022 4
Data points reported on equal pay in Reitan Retail 2022 Equal pay 0.95-1.05 Women higher pay <1.05 Men higher pay >0.95 Total Co-workers - Company operated outlets 3 0 3 6 Managers - Company operated outlets 2 1 1 4 Co-workers - Other 0 0 1 1 Co-workers - Warehouse/Distribution 3 1 5 9 Co-workers - Production facilities 3 0 5 8 Co-workers - Office 0 9 20 29 Co-workers - With responsibility area 2 5 12 19 Managers 3 3 12 18 Management 1 6 17 24 Total data points 17 25 76 118 Share of data points per pay category 14% 21% 64% 100% Shares of data points reported on equal pay in Reitan Retail Equal pay 0.95-1.05 Women higher pay <1.05 Men higher pay >0.95 Total Co-workers - Company operated outlets 50% 0% 50% 100% Managers - Company operated outlets 50% 25% 25% 100% Co-workers - Other 0% 0% 100% 100% Co-workers - Warehouse/Distribution 33% 11% 56% 100% Co-workers - Production facilities 38% 0% 62% 100% Co-workers - Office 0% 31% 69% 100% Co-workers - With responsibility area 11% 26% 63% 100% Managers 17% 17% 66% 100% Management 4% 25% 71% 100% Own GRI - Diversity in Board of Directors 2022 2021 REMA 1000 REMA 1000 Reitan Uno-X Reitan Reitan NO DK Conv. Mobility Other Retail Retail Age and gender Women Men Women Men Women Men Women Men Women Men Women Men Women Men 30-39 0% 9% 0% 0% 0% 13% 0% 19% 0% 13% 0% 12% 1% 4% 40-49 47% 34% 25% 10% 68% 33% 25% 33% 17% 25% 52% 31% 20% 24% 50-59 42% 45% 75% 80% 32% 33% 50% 42% 50% 50% 41% 45% 13% 30% >60 11% 11% 0% 10% 0% 21% 25% 6% 33% 13% 8% 11% 2% 6% Board of Directors by gender 19 53 4 10 31 24 4 36 6 8 64 131 68 124 Gender in share of total 26% 74% 29% 71% 56% 44% 10% 90% 43% 57% 33% 67% 35% 65% Total Board of Directors 72 14 55 40 14 195 192 Reitan Retail AS' Board of Directors consists of three men in the age intervals 40-49, 50-59 and >60. See pages 78-79 for more information.
GRI index
Statement of use
Reitan Retail AS has reported in accordance with the GRI Standards for the period 1 January 2021 - 31 December 2022
GRI 1 used GRI 1: Foundation 2021
Applicable GRI Sector Standard(s) No applicable GRI Sector Standards in this report. Uno-X Mobility report on GRI 11 Oil and gas. REMA 1000 Norway report on GRI 13 Agriculture, aquaculture, and fishing.
2-1 Organizational details
2-2 Entities included in the organization’s sustainability reporting
a. Reitan Retail AS
b. Business overiew pages 14-15
c. Contact p. 246
d. Business overiew pages 14-15
a.-c. Carbon accounting principles and reporting methodology pages 212-221
c. iii. Due to company structure, there are relevant sector standard disclosures. GRI 11 sector standard is reported for Uno-X Mobility and GRI 13 for REMA 1000 Norway (see REMA 1000 Norway’s materiality analysis for further details on GRI 13).
A gray cell indicates that reasons for omission are not permitted for the disclosure or that a GRI Sector Standard reference number is not available.
2-3 Reporting period, frequency and contact point
2-4 Restatements of information
2-5 External assurance
1 January 2022 - 31 December 2022
Annual reporting
Published 26 April 2023
inger.sethov@reitanretail.no
Carbon accounting principles and reporting methodology page 214
Financial assurance statement by EY page 183
Carbon account verification statement by DNV page 222-223
b. iii Reitan Retail Greenhouse Gas Emissions data (Scope 1, 2 and 3) is verified by DNV. The data has been verified according to requirements set out by the Greenhouse Gas Protocol. Retian Retails’s relationship with DNV regarding the carbon accounting is strictly related to verification, as this is considered best practise and mitigates any risk of conflicting interests.
Additional ESG reporting and GRI index is not assured by third party
2-6 Activities, value chain and other business relationships
a. Our business areas pages 20-29
Our role and responsibility page 32
b. Value and impact along our value chain page 34
b. iii Uno-X Konceptdesign was acquired in Q4 2022 and is not included in the carbon accounting 2022. The company will be included as of 2023.
d. Our business areas pages 20-29
2-6
Information unavailable/ incomplete
Data missing or unavailalbe.
2-7 Employees
2-8 Workers who are not employees
a. - d. General GRI page 225
e. No sinificant fluctuation in number of employees
a. General GRI page 225
b. Head count during the reporting period
c. No sinificant fluctuation in number of workers who are not emoloyees
240
GRI standard/ other source Disclosure Location Omission Requirement(s) omitted Reason Explanation General disclosures GRI 2: General Disclosures 2021
c.
a.-b.
2-7
Information unavailable/ incomplete Partial omission - Missing data on region.
5.5 GRI
GRI 2: General Disclosures 2021
2-9 Governance structure and composition
2-10 Nomination and selection of the highest governance body
a. Governing bodies page pages 77-79
b. - c. There are no committees in Reitan Retail in 2022
a. The board members in Reitan Retail AS are nominated and selected by the company’s owners based on the expertise they have deemed necessary for Reitan Retail at this time.
2-11 Chair of the highest governance body Chairman of the Board is Rune Bjerke. He is not a senior executive in Reitan Retail.
Governing bodies pages 77-78 Data missing or unavailable.
2-13 Delegation of responsibility for managing impacts Governing bodies pages 77-78
2-14 Role of the highest governance body in sustainability reporting
2-14 b. Not applicable Highest
is
responsible.
All critical concerns are reported to the Board of Directors Whistleblowing channel
Letter from the CEO pages 8-13 Letter from the Chair page 76 Board of Directors pages 84-103
2-18 Evaluation of the performance of the highest governance body a. Governing bodies page 77 Governing documents page 81 Evaluation process for the EMT will be applicable in 2023
2-16 b. Information unavailable/ incomplete Information unavailable or incomplete.
2-17 Information unavailable/ incomplete Partial omission
2-19 a.-b. Not applicable Partial
remuneration 2-20 a.-b. Not applicable Not
Letter from the CEO pages 8-13 letter from the Chair page 76
2-23 Policy commitments
Governing documents page 81 Governing documents approved by the Board of Directors:
- Code of Conduct
- Supplier Code of Conduct
- Whistleblowing process
- Anti fraud and anti corruption
2-24 Embedding policy commitments
Governing documents page 81 Governing documents approved by the Board of Directors:
- Code of Conduct
- Supplier Code of Conduct
- Whistleblowing process
- Anti fraud and anti corruption
2-24 a. Information unavailable/ incomplete Partial
2022.
2-27 Compliance with laws and regulations
Statement of objections from the Norwegian competition authority page 89
2-25 a. c. d. e. Information
- The BA’s CEO is responsibile for embedding policy documents in their respective organisation.
Data
missing and incomplete.
241 Our responsibility Our business Corporate Governance Financial statements Appendix GRI standard/ other source Disclosure Location Omission Requirement(s) omitted Reason Explanation
GRI 2: General Disclosures 2021
2-10 b. Information unavailable/ incomplete Partial omission
region.
- Missing data on
2-11 b. Not applicable Chairman
is not a senior executive.
2-12 Role of the highest governance body in overseeing the management of impacts 2-12 b.-c. Information unavailable/ incomplete
Materiality asessment page 36 Governing bodies pages 77-78 Carbon accounting principles and reporting methodology page 212
governing body
2-15 Information unavailable/ incomplete Information unavailable or incomplete.
2-15 Conflicts of interest
2-16 Communication of critical concerns
2-17 Collective knowledge of the highest governance body
- Missing data on specific measures.
2-18 b.-c. Not applicable All
memebers of the Board were elected May 2022.
2-19 Remuneration policies Reitan Retail Note 8 - Salaries and personnel costs pages 123-124
omissionNot a fixed policy standard in
fixed policy standard in 2022.
2-20 Process to determine
a
2-21 Annual total compensation ratio General GRI page 226
2-22 Statement on sustainable development strategy
omission
2-25 Processes to remediate negative impacts
Corporate governance pages 76-81 Whistleblowing channel
unavailable/ incomplete
2-26 Mechanisms for seeking advice and raising concerns
Whistleblowing channel Whistleblowing process
2-28 Membership associations General GRI page 228
2-29 Approach to stakeholder engagement Stakholder engagement page 38
2-30 Collective bargaining agreements
GRI page 228
3-1 Process to determine material topics Materiality assessment page 36 A gray cell indicates that reasons for omission are not permitted for the disclosure or that a GRI Sector Standard reference number is not available.
3-2 List of material topics Materiality assessment page 36 Environment GRI 3: Material Topics 2021
Climate Emissions
3-3 Management of material topics Environment page 42
302-1 Energy consumption within the organization
a. - e. Environment GRI page 228
f. Carbon accounting priciples and reporting methodology pages 212-221
g. Environment GRI page 228
302-2 Energy consumption outside of the organization Reitan Retail currently only take responsibility for energy consuption in companies where we have operational control.
302-2 Information unavailable/ incomplete
Reporting on energy consumption outside the operations will be looked into going forward.
GRI 302: Energy 2016
302-3 Energy intensity 302-3 Information unavailable/ incomplete
302-4 Reduction of energy consumption
305-1 Direct (Scope 1) GHG emissions
a. Carbon Accounting page 210
b. Carbon accounting priciples and reporting methodology page 212
d. Carbon Accounting page 210
e. - g. Carbon accounting priciples and reporting methodology pages 212-221
GRI 305: Emissions 2016
305-2 Energy indirect (Scope 2) GHG emissions
a. Carbon Accounting page 210
b. Carbon accounting priciples and reporting methodology page 212
d. Carbon Accounting page 210
e. - g. Carbon accounting priciples and reporting methodology pages 212-221
Energy intensity measurements will be established going forward.
302-4 Not applicable The overall energy consumption has increased from previous reporting. The energy reduction from intiatives are less than the need of energy spanning from oparational growth.
305-1
c. Not applicable No biogenic emissions in scope 1.
242 GRI standard/ other source Disclosure Location Omission Requirement(s) omitted Reason Explanation GRI
Disclosures
2: General
2021
General
2-30 Information unavailable/
Partial
incomplete
omissionSee location. Material topics GRI 3: Material Topics 2021
5.5 GRI
GRI 305: Emissions 2016
305-3 Other indirect (Scope 3) GHG emissions
a. Carbon Accounting page 211
b. Carbon accounting priciples and reporting methodology page 212
c. Uno-X Mobility Annual and Sustainability Report page 36-42
e. Carbon accounting priciples and reporting methodology page 211
g. Carbon accounting priciples and reporting methodology pages 212-221
305-4 GHG emissions intensity
305-5 Reduction of GHG emissions
a. Carbon Accounting pages 210-211
b. Carbon accounting priciples and reporting methodology pages 212-221
c. - d. Carbon cccounting pages 210-211
e. Carbon accounting priciples and reporting methodology pages 212-221
305-7 Nitrogen oxides (NOx), sulfur oxides (SOx), and other significant air emissions
Foodwaste/Circularity and Waste Management
Uno-X Mobility Annual and Sustainability report pages 36-42
243 Our responsibility Our business Corporate Governance Financial statements Appendix GRI standard/ other source Disclosure Location Omission Requirement(s) omitted Reason Explanation
305-3 d. 305-3 f. Confidentiality constraints Not applicable No other emissions.
305-4 Information
Emissions
unavailable/ incomplete
intensity measurements will be established going forward.
GRI
301-1
Environment
Environment
GRI
306-1
Environment
Environment
306-2 Management
Environment pages 48-49
Waste generated Environment GRI
228 306-4 Waste
disposal Environment GRI
228 306-4 d.-e. Information unavailable/ incomplete Information unavailable or incomplete. 306-5
Environment GRI
Own
303-1
Environment
301: Materials 2016
Materials used by weight or volume
GRI page 228 301-2 Recycled input materials used
GRI page 228
306: Waste 2020
Waste generation and significant waste-related impacts
pages 48-49
page 230
of significant waste-related impacts
306-3
page
diverted from
page
Waste directed to disposal
page 228
GRI Waste sorting in sales outlets GRI 303: Water effluents
Interactions with water as a shared resource
GRI page 229
Environment
Environment
303-2 Management of water dischargerelated impacts
GRI page 229 303-3 Water withdrawl
GRI page 229
Environment
Environment
Health
Health
303-4 Water discharge
GRI page 229 303-5 Water consumption
GRI page 229
GRI 3: Material Topics 2021 3-3 Management of material topics
pages 50-51 Healthier products
unavailable/ incomplete
Health GRI page 232
omission - Optimisation of recipes to contain fewer calories, less sugar, salt and saturated fat have top priority for private label products in Reitan Retail. Overall quantitative assessment is not executed. Own GRI Sale of healthier food and drink options in REMA 1000 Norway and REMA 1000 Denmark
Own GRI Participants on camps and schools held, promoting well-being People GRI page 233
Own GRI Campaigns promoting healthier options in Reitan Convenience People GRI page 233
material topics
We adhere to national and local legislations. We do not possess a full overview as detailed in the GRI Standard of this matter in our companies.
Complete
244 GRI standard/ other source Disclosure Location Omission Requirement(s) omitted Reason Explanation GRI 416: Customer Health and Safety 2016 416-1 Assessment of the health and
categories Health
416-1 Information
safety impacts of product and service
pages 52-55
Partial
People GRI 3: Material Topics 2021 3-3 Management of
People
Safe employer GRI 401: Employment 2016 401-1 New employee hires and employee turnover People GRI page 235 401-1 Information
Partial
401-2 Benefits provided to full-time employees that are not provided to temporary or part-time employees 401-2
401-3 Parental leave People GRI page 235 GRI 403: Occupational Health and Safety 2018 403-6 Promotion of worker health Responsible employer page 59 Peple GRI page 236 403-6 b. Information unavailable/ incomplete Partial omission-
list of
services
403-8 Workers covered by an occupational health and safety management system a. Poeple GRI page 236 b. No workers are excluded c. People GRI page 236 403-9 Work-related injuries People GRI page 236 403-9 b.-e. Information unavailable/ incomplete b. Data on workrelated injuries
franchisees and their store personnel are unavailable c.-e. Data not unavailable 403-10 Work-related ill health People GRI page 237 403-10 b.-d. Information unavailable/
b. Data on work-
ill health to franchisees
their store personnel are
c.-d. Data
Own GRI Health promoting collaborations and activities People GRI page 234 5.5 GRI
pages 56-57
unavailable/ incomplete
omissionData reported on business areas, not region.
Information
unavailable/ incomplete
health promoting
not proided.
to
incomplete
related
and
unavailable
unavailable.
245 Our responsibility Our business Corporate Governance Financial statements Appendix GRI standard/ other source Disclosure Location Omission Requirement(s) omitted Reason Explanation GRI 404: Training and Education 2016 404-1 Average hours of training per year per employee 404-1 Information unavailable/ incomplete Multiple Reitan Retail companies gather data on hours of training their employees undertake. Consolidated data will be considered going forward. 404-2 Programs for
employee
and
programs 404-2 Information unavailable/ incomplete Multiple Reitan Retail companies gather data on programs and transition assistance programs their employees undertake. Consolidated data will be considered going forward. Equality, diversity, and
GRI 405: Diversity and Equal Opportunity 2016 405-1 Diversity of governance bodies and employees People GRI page 238 405-1 a.iii b.iii Legal prohibitions GDPR 405-2 Ratio of basic salary and remuneration of women to men People GRI page 239 405-2 Information unavailable/ incomplete Partial omissionDoes not include data on significant location of operation. Own
People
Value Chain GRI 3: Material Topics 2021 3-3 Management of
Value
Responsible Business GRI 201: Economic Performance 2016 201-1 Direct
and
a. i.
201-1 a. ii Information unavailable/ incomplete Partial omissionDoes not include operational costs. 201-2 Financial
a.
201-2 a. iii. iv. v. Information unavailable/ incomplete Partial omission - Financial implications will be screened during 2023. Tracability,
GRI 308: Supplier Environmental Assessment 2016 308-1 New suppliers that were
using environmental
308-1 Information unavailable/ incomplete We aim to report on this indicator going forward. 308-2 Negative environmental
in the supply chain and actions taken 308-2 Information unavailable/ incomplete We aim to report on this indicator going forward. GRI 414: Supplier Social Assessment 2016 414-1 New
Transparency act
204 414-1 Information unavailable/ incomplete Partial omissionfigure included in total assessments reported on page 207. 414-2 Negative
Transparency
upgrading
skills
transition assistance
inclusion
GRI Diversity in Board of Directors
GRI page 239
material topics
Chain pages 66-67
economic value generated
distributed
Consolidated statement of profits or loss page 105 ii. Financial position of the group page 87 iii. Consolidated changes in equity page 109
implications and other risks and opportunities due to climate change
Top three sustainability risks page 37
transparency and sustainable food production
screened
criteria
impacts
suppliers that were screened using social criteria
page
social impacts in the supply chain and actions taken
act pages 205-207
Contact
Reitan Retail
Gladengveien 2, 0661 Oslo, Norway
+47 24 09 85 55
post@reitanretail.no www.reitanretail.no
REMA 1000 Norway
Gladengveien 2, 0661 Oslo, Norway
+47 24 09 85 55
kontakt@rema.no
REMA 1000 Denmark
Marsallé 32, 8700 Horsens, Denmark
+47 24 09 85 55
kontakt@rema1000.dk
Reitan Convenience
Gladengveien 2, 0661 Oslo, Norway
+47 24 09 85 55
post@reitanconvenience.no
Uno-X Mobility
Gladengveien 2, 0661 Oslo, Norway
+47 24 09 85 55
post@unox.no
246
