
Our responsibility Our business Corporate governance Financial statements Appendix 1 Reitan Retail 2023 Annual and sustainability report Responsible together


Our responsibility Our business Corporate governance Financial statements Appendix 2 3 Content 2. Our responsibility 5. Appendix 4. Financial statements 1. Our business 3. Corporate governance 32 40 50 54 66 2.1 2.2 2.3 2.4 2.5 184 200 204 206 224 5.1 5.2 5.3 5.4 5.5 86 108 164 178 4.1 4.2 4.3 4.4 6 8 14 20 1.1 1.2 1.3 1.4 74 75 79 83 3.1 3.2 3.3 3.4 Our role and responsibility Environment Health People Value chain Performance measures and definitions Transparency Act EU Taxonomy Greenhouse gas accounting Global reporting initiative standards Board of Directors’ report Consolidated financial statements Parent company financial statements Auditor’s report Reitan Retail at a glance Letter from the CEO Business overview Our business areas Letter from the Chair Governing bodies Risks and risk management Governing documents
1.1 Reitan Retail at a glance 1.2 Letter from the CEO 1.3 Business overview 1.4 Our business areas
4 5 Our responsibility Our business Corporate governance Financial statements Appendix Our business
1.1 Reitan Retail at a glance
6 7 Our responsibility Our business Corporate governance Financial statements Appendix
Million NOK 2019 2020 2021 2022 2023 Result Revenue 71,651 79,157 81,502 94,367 104,322 EBITDA* 7,554 8,892 8,216 8,262 8,638 Operating profit 3,024 4,386 3,840 3,597 3,087 Profit before taxes 2,049 3,346 3,296 2,456 1,854 Profit for the year 1,635 2,634 2,645 1,845 1,409 Systemwide sales* and no. of sales outlets* Systemwide sales* 95,740 104,159 104,406 115,767 127,684 Growth in systemwide sales* 0.6% 8.6% -0.4% 5.2% 8.1% Like-for-like growth in systemwide sales* -0.5% 7.7% -1.2% 4.1% 7.8% Number of sales outlets* 3,907 3,847 3,843 3,801 3,639 Margins Operating profit as % of revenue* 4.2% 5.5% 4.7% 3.8% 3.0% Operating profit as % of systemwide sales* 3.2% 4.2% 3.7% 3.1% 2.4% Selected balance sheet items Total assets 48,414 51,619 52,785 57,529 60,096 Equity 9,932 10,906 12,190 14,096 13,280 Equity in percent of total assets* 20.5% 21.1% 23.1% 24.5% 22.1% Borrowings 5,093 4,505 3,984 5,141 5,856 Sum of borrowings and lease liabilities 20,549 22,605 22,547 23,865 25,366 Our people Number of employees 5,662 5,726 5,715 6,567 7,159 Number of people* 39,598 40,539 42,079 43,444 45,368 Climate
CO2 Scope 1 and 2 - 55 50 47 44 CO2 Scope 1, 2 and 3 - - - 8,767 8,904 SEGMENT CONTRIBUTION ON KEY FIGURES REVENUE EQUITY IN % OF TOTAL ASSETS* NUMBER OF SALES OUTLETS* SYSTEMWIDE SALES* OPERATING PROFIT REMA 1000 NO REMA 1000 DK Reitan Convenience Uno-X Mobility Real Estate * For more information, see Performance measures and definitions Systemwide sales is an alternative performance measure and represents sales in all sales outlets under the Group’s concepts and banners, whether operated by the franchisees, Reitan Retail, dealers or commission-based retailers. Sales from franchise-operated sales outlets are not recorded as revenue by Reitan Retail and are not included in the Group’s consolidated financial statements. People (systemwide employees) includes all employees of Reitan Retail AS and its subsidiaries, as well as all people being employed or self-employed in the stores operated by independent third parties (e.g. franchisees) under the Group’s concepts and brands (e.g. pursuant to a franchise agreement). EMPLOYEES 52%/48% Women/men 50%/50% Women/men PEOPLE* MILLION tCO2e SCOPE 1, 2 AND 3 7,159 45,368 8.9 0 20000 40000 60000 80000 100000 120000 2019 2020 2021 2022 2023 104,322 0 30000 60000 90000 120000 150000 127,684 2019 2020 2021 2022 2023 0 1000 2000 3000 4000 5000 3,087 2019 2020 2021 2022 2023 0 5 10 15 20 25 22.1% 2019 2020 2021 2022 2023 0 500 1000 1500 2000 2500 3000 1,409 2019 2020 2021 2022 2023 0 500 1000 1500 2000 2500 3000 3500 4000 3,639 2019 2020 2021 2022 2023 104,322 Million NOK 127,684 Million NOK 3,087 Million NOK REVENUE Million NOK OPERATING PROFIT Million NOK PROFIT FOR THE YEAR Million NOK SYSTEMWIDE SALES* Million NOK
(thousand tCO2e)
1.2 Responsible together
We are living in a time of turbulence, posing unprecedented challenges for people and our planet, but also immense opportunities for change if we work together. In 2023, we demonstrated our commitment to our customers and a better world for all as we took further steps towards a more sustainable and resilient future.

We have established a strong organisation of 45,000 people, eager to bring us to the next strategic level.
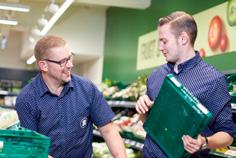
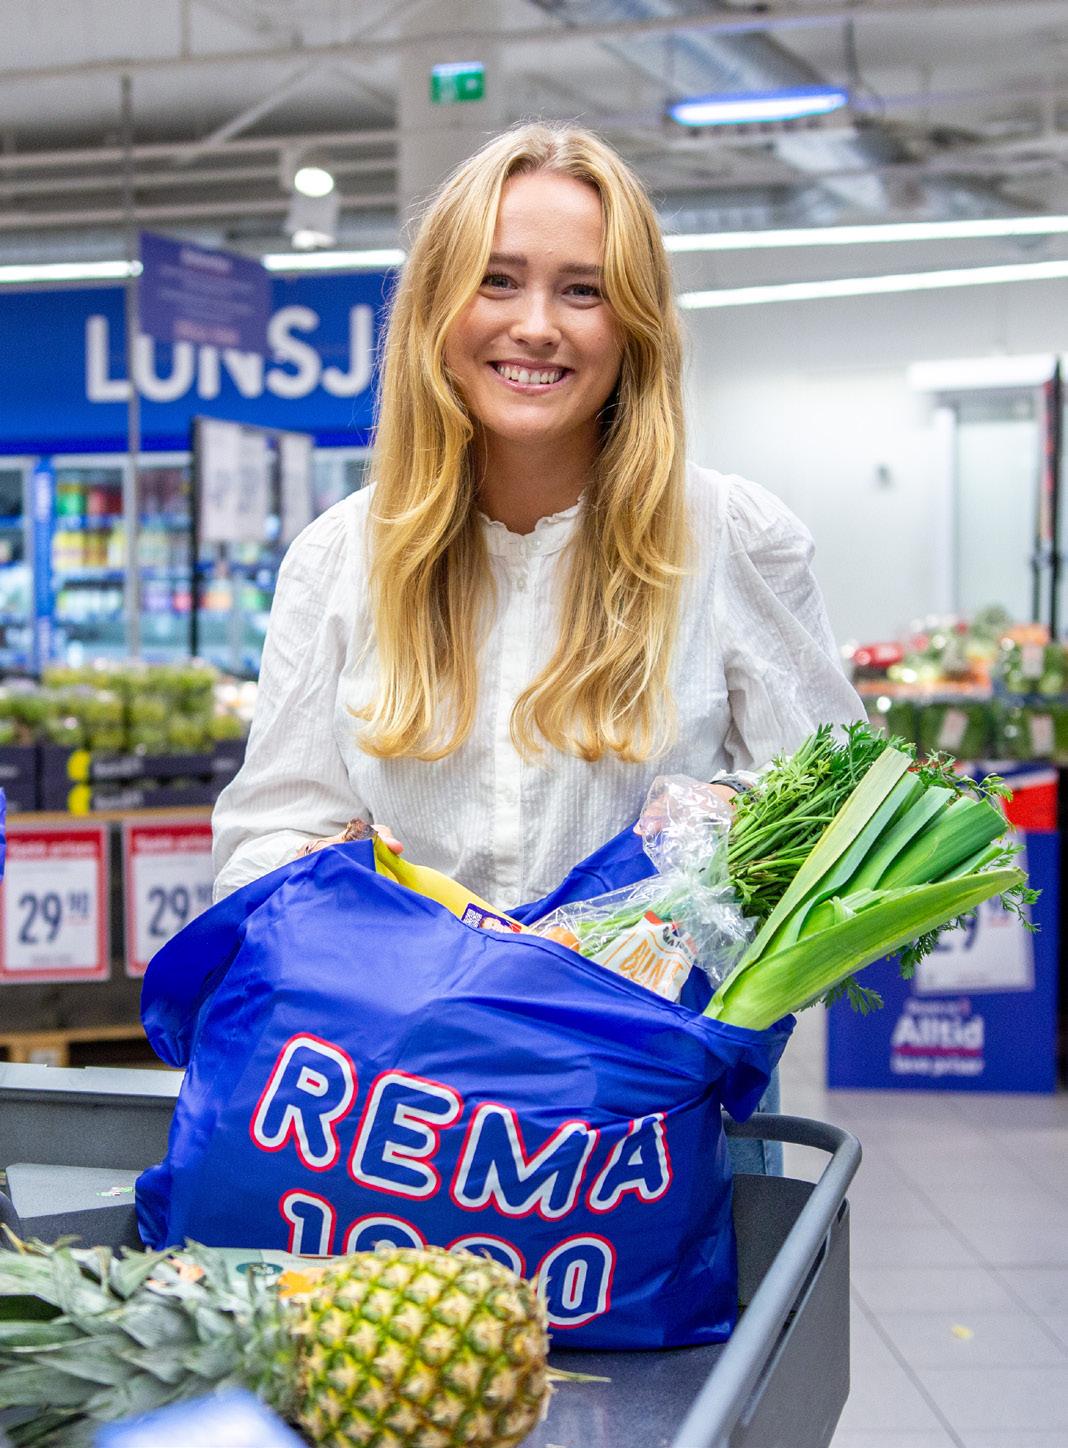
With 2 million customer meetings every day, Reitan Retail holds a unique position in the Nordic and Baltic retail market, combining concepts in discount grocery, convenience and mobility across seven countries. Founded on a deeply rooted culture and unique franchise model, we have established a strong organisation of 45,000 people eager to bring us to the next strategic level.
Despite macro-economic uncertainty and one-offs, I am pleased with our financial performance, thanks to tremendous efforts by committed, positive and proactive franchises and employees, sticking to our promise to put the customer first. I am happy to see the results of successful improvement efforts in our convenience business, combined with investments in next-generation retail in all business areas, positioning our company for the customer of the future.
REMA 1000 strengthened its position in Norway and Denmark; Reitan Convenience delivered improvements in Sweden, Denmark and the Baltics, combined with successful restructuring in Norway and Finland; Uno-X Mobility continued its investments in more sustainable mobility solutions, along with solid development in liquid fuel.
Historic milestone
The strategic highlight of the year was the approval of REMA 1000 Denmark’s acquisition of ALDI store locations in Denmark, illustrating the power and
scalability of our business model. As the REMA 1000 concept was greatly inspired by the German discount grocery chain, the ALDI deal was a milestone in REMA 1000’s 45-year history. I still remember my job as a doorman when my father opened the first franchise-driven grocery store in Norway in 1979, paving the way for the entry into the Danish market in 1994.
The acquired portfolio will complement and improve REMA 1000’s store network, contribute to growth and increased market share, in line with Reitan Retail’s strategy.
With the rising awareness of more sustainable food value chains, we are more excited than ever about our chicken production operations at Orkanger in Central Norway. In 2023, we strengthened the Norsk Kylling value chain through a hyper-modern hatchery. We also made important strategic moves in the mobility sector with further investments in simple, convenient and ultrafast EV charging.
Meanwhile, we continued to deliver on our promise: to provide high-quality, responsibly produced products at the lowest prices at REMA 1000, to offer more sustainable on-the-go offerings at Reitan Convenience, and to deliver liquid fuel to Uno-X Mobility customers while investing in more sustainable mobility, including an exciting entry into the heavy-duty EV market.
Solid growth
As markets normalised following the pandemic, customers returned to our convenience outlets, while geopolitical uncertainty and strong inflation weighed on people’s private economy. Along with the trend towards value for money and discount options, we increased our market shares in both grocery and mobility.
We delivered solid growth in systemwide sales and revenues in grocery and convenience, while broad-based cost inflation and one-off effects led to margin pressure.
8 9 Our responsibility Our business Corporate governance Financial statements Appendix Reitan Retail Responsible retail 2022
1.2 Letter from the CEO
All business areas made firm steps in line with our growth strategy:
REMA 1000 Norway
• Solid growth in systemwide sales and revenues, driven by inflation and gain in market share
• Fierce price competition and cost inflation
• Improved operations and results at Norsk Kylling, value chain strengthened with brand new chicken hatchery in Norway
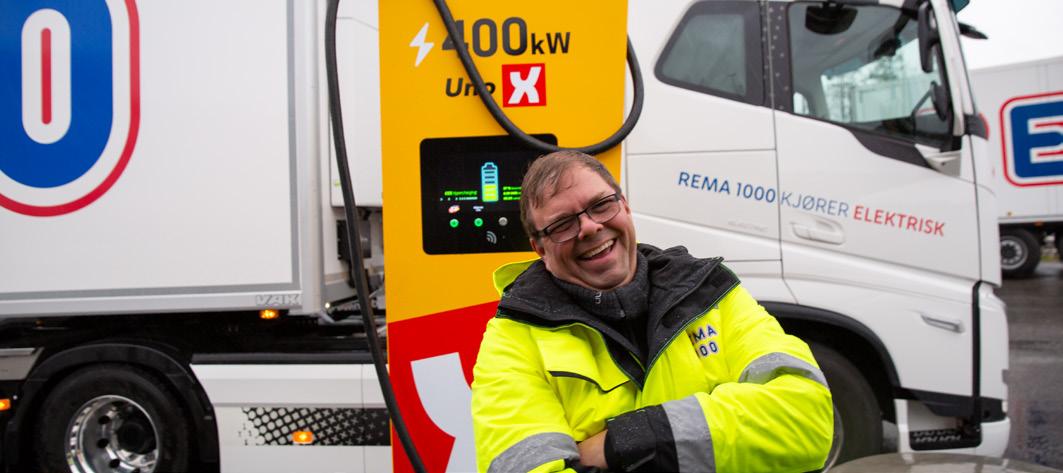
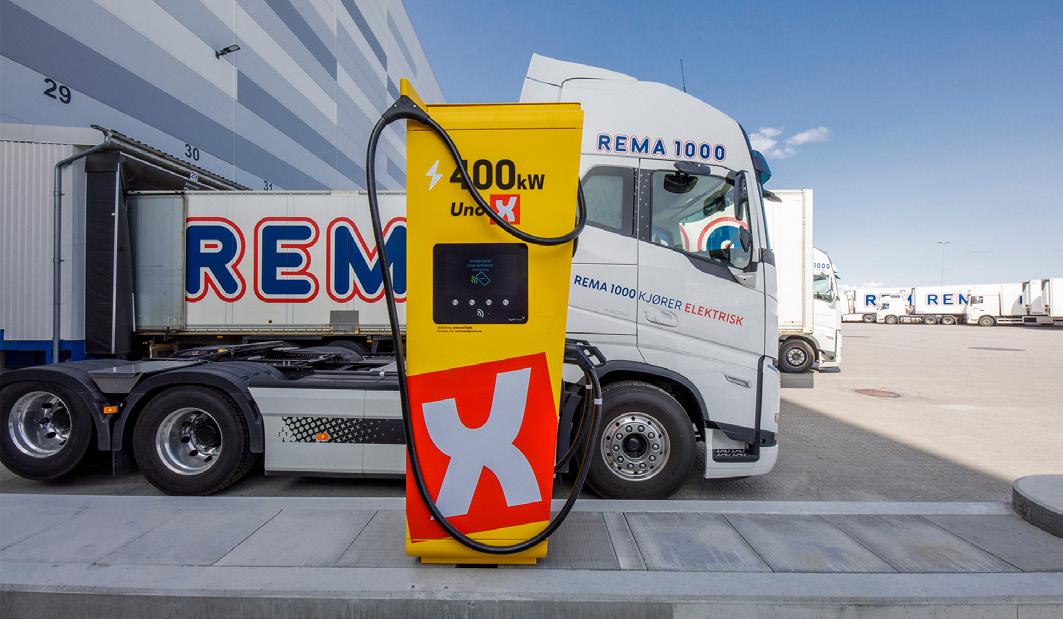
• First delivery with EV truck, an important step towards fossil-free alternatives by 2026
• Important steps in our efforts to strengthen our number one discount position, including winning by a significant margin in VG’s price competition test in December
REMA 1000 Denmark
• Solid growth in systemwide sales and revenues, driven by inflation and gains in market share
• ALDI acquisition approved by Danish competition authorities, paving the way for accelerated growth
• Ramp-up of a new distribution centre, increasing efficiency and preparing for further growth
• Improved operating profit
• Cost inflation and costs related to the ALDI acquisition and ramp-up of the new distribution centre weighed on margins
• Ranked as the strongest brand in Denmark (YouGov) and top ranking in customer loyalty for the eighth consecutive year (Loyalty Group)
• Solid growth in systemwide sales and revenues, driven by inflation and normalisation following Covid-19
• Increased store traffic, driving topline and operating profit
• Strong improvement in operating profit in Sweden, Denmark and the Baltics, successful restructuring in Norway and Finland
• Major roll-out of new 7-Eleven outlets at Copenhagen airport, including 89 vending machines
• Caffeine grew to 117 cafes, serving fully organic coffee in all cafes across the Baltics, including a new drive-through in Vilnius
Uno-X Mobility
• Solid development for liquid fuel operations in a softening market
• Continued investments in sustainable mobility solutions, including launching of heavy-duty EV charging concept
• All operations united under one brand, Uno-X, boosting the brand’s presence and impact in Norway and in Denmark
• Addition of 57 energy station locations in Denmark approved by Danish competition authorities, paving the way for Uno-X operations side by side with 7-Eleven along the road
• First-time participation for the Uno-X Mobility men’s cycling team in Tour de France, following the participation of the women’s team in 2022
About half of the world’s global climate emissions stem from food systems and transport.
Leading force
About half of the world’s global climate emissions stem from food systems and transport. With significant operations and impact in both sectors, we are part of the problem, with total carbon emissions amounting to 8.9 million tonnes in 2023.
Throughout the year, we have further incorporated sustainability work in our overall key performance indicators, ensuring that sustainability performance is an integral part of our business strategy, risk management, follow-up and reporting. We have taken concrete steps and defined clear ambitions in the following focus areas: Environment, health, people and the value chain.
Our ambition is to halve carbon dioxide emissions from our products by 2030 and to reach net zero by 2050. We want to make it easier for our customers to follow the Nordic nutrition guidelines, and we want to create safe and solid jobs for all, contributing to diversity and inclusion.
In a time of hardship and uncertainty for many people, inclusion and belonging is more important than ever. Work to promote gender balance will be a focus area in 2024. Our ambition is to ensure gender balance in recruitment processes on the management level and amongst franchisees and to have a 40-60 percent gender balance in all boards across the company by the end of 2024.

40-60% gender balance in all boards across the company by the end of 2024
10 11 Our responsibility Our business Corporate governance Financial statements Appendix
Reitan Convenience
1.2 Letter from the CEO
We strongly support the urgency and the notion that sustainability is a shared responsibility that we need to solve together through collaboration and involvement. We want to ensure that our products are traceable and responsibly produced, which is only possible through dialogue and collaboration across the value chain.
We are far from our goals, but we are on the right track. We know that the roadmap to 2030 includes a significant innovation gap, which will be a focus area going forward. We do not know exactly how to get there, but I am convinced that we have the will, cour-
age and determination to be a leading force in the transition to a more sustainable future.
Next-generation retail
We have a solid position, a deeply rooted culture and the ability to embrace and implement change. We have a history and track record that proves our eagerness and ability to always renew, embrace change and grow. We will continue to build a resilient and sustainable company by strengthening our core and expanding our business while positioning our company for further profitable and responsible growth.
Our 2024 agenda will include the following:
1. Strengthen our core
• Develop our people, culture and franchise model
• Improve competitiveness through efficiency and simplification
• Renew our concepts and assortment
2. Expand our business
• Open new REMA 1000 stores at previous ALDI locations in Denmark
• Grow market share and strengthen discount position
• Continue to revitalise and lift convenience business
• Expand e-mobility network in private and heavy-duty segments
3. Position for the future
• Take a leading sustainability position by making good choices easier
• Explore digital opportunities, including AI, facilitating the customer journey
• Innovate and test next-generation retail concepts, products and solutions

At Reitan Retail, our values put great faith in people and our ability to contribute, given freedom and opportunity to perform and excel. I am optimistic that we will play a key role in the transition to a more sustainable and resilient future, together with customers, franchisees, employees, suppliers and partners.
Based on our achievements and long-term commitment, I am more convinced than ever that our purpose will lead the way: Together, we make everyday life a little bit easier and the world a little bit better.
CEO Ole Robert Reitan
12 13 Our responsibility Our business Corporate governance Financial statements Appendix
1.2 Letter from the CEO
1.3 Business overview
Reitan Retail is a leading retail company in the Nordic and Baltic region with operations in discount grocery, convenience and mobility across seven countries. We are a family of 45,000 positive and proactive people and great brands, including REMA 1000, Narvesen, R-kioski, Pressbyrån, 7-Eleven, Caffeine, Norsk Kylling, Kolly and Uno-X Mobility. Based on strong values, efficient operations and local ownership, we aim to create the best customer experiences in people’s everyday lives and contribute to a more sustainable future. Our unique franchise model is at the heart of our business, and the customer is our ultimate boss. Our ambition is to take a leading sustainability position by making it easier to make good choices – at home and on the go. At Reitan Retail, we share strong values and a common purpose: to make everyday life a little bit easier and the world a little bit better
Reitan Retail consists of four retail segments, also referred to as business areas: REMA 1000 Norway, REMA 1000 Denmark, Reitan Convenience and Uno-X Mobility. In addition, Reitan Retail holds a portfolio of retail properties presented as a separate segment, Real Estate. Reitan Retail is headquartered in Oslo, Norway. The business areas are operated from Oslo (Norway), Stockholm (Sweden), Copenhagen and Horsens (Denmark), Helsinki (Finland), Riga (Latvia), Tallinn (Estonia) and Vilnius (Lithuania).
Reitan Retail AS is a wholly owned subsidiary of REITAN AS.
REMA 1000 Norway is a Norwegian pioneer in franchise-based retailing. As the inventor of discount grocery in Norway, REMA 1000 has contributed significantly to the maturity of the discount segment, having accomplished steady growth in systemwide sales and market share.
Based on the same franchise model as REMA 1000 Norway, REMA 1000 Denmark is a fast-growing discount grocer, ranked among Denmark’s strongest and most sustainable brands.
Reitan Convenience is a leader in operating franchise-based convenience stores and ranks number one in most markets in the Nordic and Baltic regions, operating a range of well-known kiosks and convenience brands.
Uno-X Mobility has a leading mobility platform in Norway and Denmark, with operations in liquid fuels, ultrafast EV charging and Nordic Swan Ecolabelled car wash. Its mission is to develop and promote solutions for sustainable mobility.
Real Estate consists of an actively managed real estate portfolio within the retail segment. Its overall mission is to secure access to strategically important locations, and thus, is an important enabler for the growth of Reitan Retail and its franchisees.
In Reitan Retail, we aim to create sustainable and profitable growth based on three strategic pillars
Close - The customer is our ultimate boss, and we want to be relevant and present in the local community. Our franchisees know their customers’ preferences, and their outlets are welcoming hubs. It is local ownership. It is close.
Simple - We don’t create complicated solutions to impress others. We focus on doing the right things – and we keep it simple.
Responsible - We aim to contribute to good health, reduce climate emissions, foster diversity and equality, and ensure transparency across the value chain to secure human rights. We seek accountability in our operations and want to be held accountable for our actions. We are responsible.
OUR PURPOSE
Together, we make everyday life a little bit easier and the world a little bit better.
OUR BUSINESS IDEA
Through strong values, efficient operations and local ownership, we create the best customer experiences.
14 15 Our responsibility Our business Corporate governance Financial statements Appendix REMA 1000
OUR STRATEGY
1.3 Business overview REMA 1000
Our history and accomplishments
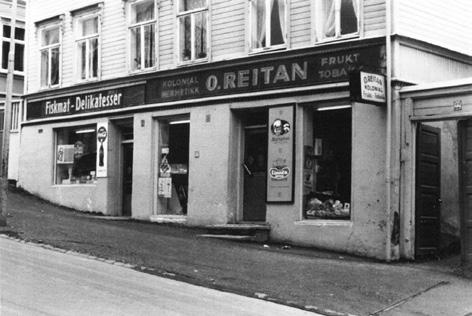
Building on years of proud retail history, Reitan Retail was established at the beginning of 2021 as a result of REITAN’s decision to organise all its retail operations in a single business area. Since the first grocery store opened in Trondheim in 1948, the retail business has today grown to 3,600 sales outlets across seven countries. The strong growth has come through both organic expansion and selective mergers and acquisitions.
1948
Ole
1979
Opening
1990
REMA 1000 goes nationwide in Norway
1994
REMA 1000 established in Denmark
2000
Reitan Narvesen created, adding Narvesen (Norway, est. 1894), Pressbyrån (Sweden, est. 1899) and 7-Eleven (licence in Norway, Sweden and Denmark, est. 1927) to the Group
2021
Uno-X Mobility launches Nordic Swan Ecolabelled car wash in Norway and Denmark
2021
Redefining sustainability for poultry production at our new poultry factory at Orkanger (Norway)
2019
Opening of highly automated distribution center at Vinterbro (Norway)
2019
Acquisition of Caffeine (Baltics)
2016
Launch of digital journey through “Vigo” in REMA 1000 Denmark and “Æ” in REMA 1000 Norway
2014
REMA 1000 Norway commits ESG to its purpose
2012
Acquisition of R-Kioski, more than 1,000 outlets in Finland, Estonia and Lithuania
2008
Acquisition of Lidl’s store network in Norway
2006
Acquisition of Hydro Texaco (Norway and Denmark)
2022
Entering the HoReCa wholesale business in Norway through Kolly

2022
Uno-X Mobility opened its first ultrafast EV charging location


2023
Major roll-out of new 7-Eleven outlets at Copenhagen airport
2023
Uno-X Mobility opened its first ultrafast heavy-duty EV charging concept in Norway and Denmark
2023
First time participation in Tour de France for Uno-X Mobility men’s cycling team
2023
Uno-X Mobility adding 57 energy stations in Denmark, Uno-X operations side by side with 7-Eleven along the road
2022
First time participation in Tour de France for Uno-X Mobility women’s cycling team

2023
ALDI acquisition approved by Danish competition authorities, first stores converted to REMA 1000
2022

REMA 1000 Denmark signs agreement with ALDI with the intention to acquire 114 of ALDI’s stores in Denmark


2023
Further strengthening the Norsk Kylling value chain through a hyper-modern hatchery
2023
Uno-X Mobility unite all operations under one brand, Uno-X, boosting the brand’s presence and impact in Norway and Denmark
2023
REMA 1000 Denmark ranked as strongest brand in Denmark and top ranking in customer loyalty
16 17 Our responsibility Our business Corporate governance Financial statements Appendix
and Margit Reitan open the family’s first grocery store in Trondheim
of the first REMA store in Trondheim, Norway
1.3 Business overview
Our philosophy
We believe in enthusiastic and skilled individuals with the ability and commitment to get things done. Reitan Retail follows REITAN´s philosophy, and we organise our activities in a way that makes the distance between accountability/authority and operational execution as short as possible. Building a logical structure and defining clear areas of responsibility ensures that we don’t create unnecessary work for each other.
At Reitan Retail, we treat employees, suppliers, partners and customers with respect. We like to keep it simple – and we want to be the very symbol of common sense, commerce, a down-to-earth mindset and skill. We encourage everyone to be proud of their own accomplishments while at the same time admiring others for their achievements and success.
Our philosophy brings us together, and our strong values define us and lead us forward. We know where we are going without forgetting where we came from.

Our values Our business model
We are a value-driven company. Our values are the foundation for making customers, employees and partners feel valuable, creating long-term financial value and conducting our activities with integrity.
We have eight values that define and guide us:
1. We stick to our business model
2. We keep high moral standards
3. We are committed to be debt-free
4. We encourage a winning culture
5. We are positive and proactive
6. We talk with each other, not about each other
7. The customer is our ultimate boss
8. We work for fun and profit
Our values describe what we believe is worth striving for. These values are our internal compass, guiding our mindset and decisions. Clearly defined values are the basis for a strong culture.
Reitan Retail is owned by REITAN AS. Our values have evolved through REITAN’s extensive history and are a natural part of Reitan Retail’s DNA. Our eight values are carved in rocks and obelisks placed at REITAN’s cultural and financial heart at Lade Gaard and several of our locations in the Nordics and the Baltics.
We use our philosophy, mindset and values to build as many champions and jobs as possible, where people thrive and are engaged. Value-based leadership is part of our philosophy and involves building great people who create action through trust.
Conducting business in an ethical and transparent manner aligned with our values to inspire trust is essential for us. Being a value-driven company, we depend on trusting each other throughout our organisation, and we are dependent on trust from our customers, suppliers, partners, owners, authorities and society at large.
Franchise – Our main competitive advantage The Reitan Format Franchise model has been the heart and key driver of the Group’s successful development since the first REMA 1000 store opened in Norway in 1979. Reitan Retail was the first grocery company in Norway to implement franchising and streamlined this model of operation through the business area REMA 1000. REMA 1000 is the only purely franchise-based grocery player in the Nordics. The franchise is also the main operating model for Reitan Convenience.
At Reitan Retail, we have a strong belief in the individual’s desire to create. The franchise model is a win-win partnership, enabling us to benefit from largescale economies, but also from agility and small-scale economies due to a decentralised decision-making structure with aligned performance incentives for the franchisor and franchisees. The customer is our ultimate boss, and our goal is to create the best customer experiences in people’s everyday lives. We believe the franchise model is the winning recipe for achieving this.
Franchising represents a close collaboration between two independent parties, the franchisor and the franchisee. Franchising is about striking a balance between freedom and systems operations. The franchisee is self-employed but must adhere to the concept and philosophy established by the franchisor. Done correctly, we believe there are no other systems that provide better returns on invested capital and risk.
Our strategic measures
The franchisor delivers a turnkey store concept to the franchisee, and consistency across various brands and outlets comes from The Reitan Format Franchise model. The franchisor holds the rental contract and facilitates investments in the sales outlet. The franchisor develops standards for the operation of businesses with certain goods and/or services under a common brand name. The turnkey model allows for recruitment based on skills and motivation rather than financial situation.
As a franchisee, you are a local entrepreneur. Together with your employees, you make a difference for your customers and your community. Being a franchisee requires a great sense of responsibility both for the franchisee and the franchisor. A franchisee who manages a brand also has a special responsibility towards the brand itself. At Reitan Retail, we have a high degree of internal recruitment and pride ourselves on building long-term relationships with our franchisees.
The franchisor negotiates terms for and decides upon the distribution of goods and/or services to the franchisee. In principle, the work is divided between the parties so that the franchisor performs services in areas where a central approach is more efficient, both with regard to time and cost, while the franchisee performs tasks in areas where a local approach is more efficient. The franchise system imposes great mutual demands on the parties, which results in a continuous development of skills in the organisation. Based on close collaboration, the franchisor has the ability and responsibility to coach the individual franchisee.
To create value in the years to come, we will strengthen our core, expand our business and position for the future through the following six strategic measures:
Strengthen our culture and develop our franchise system
Strengthen competitiveness through lower costs and better terms
Establish new sales outlets and renew existing portfolio to boost average systemwide sales
Strengthen and renew formats to meet growing customer needs
Strengthen and renew the digital customer experience
Take a leading position in sustainability by making good choices easier
18 19 Our responsibility Our business Corporate governance Financial statements Appendix
1.3 Business overview
1.4 Our business areas
REMA 1000 Norway
Introduction
REMA 1000 Norway is the franchisor for REMA 1000 stores run by franchisees. REMA 1000 Norway is the only retail operator in the Norwegian grocery market with franchise as the main operating model.
The franchisor distributes and sells goods to the REMA 1000 stores in Norway. The distribution activities also include external customers, which in 2022 was expanded to include deliveries to the HoReCa market (hotels, restaurants and catering companies). In addition, REMA 1000 Norway has ownership in selected companies producing a range of private labels, including the state-of-the-art chicken producer Norsk Kylling. REMA 1000 Norway is headquartered in Oslo, Norway.
REMA 1000 Norway’s business idea is that “customers prefer us because we always offer the lowest prices on high-quality products – produced and sold in a responsible way”. REMA 1000 Norway has a proud history as the pioneer of discount grocery offerings in Norway. Since the opening of the first REMA store in 1979, REMA 1000 has been a significant contributor to the maturity of the discount segment in Norway. Over the past 40 years, REMA 1000 Norway has seen steady growth in revenue, number of stores and market share.
2023 results
REMA 1000 Norway’s systemwide sales* in 2023 came to NOK 51,280 million (47,401), corresponding to a growth* of 8.2 percent. Like-for-like growth in systemwide sales* was 7.5 percent. Revenue in 2023 was NOK 38,276 million (34,986), corresponding to a growth* of 9.4 percent. Both revenues and systemwide sales were impacted by high levels of inflation. High inflation and pressure on the household economy have led to an increasing trend of customers seeking value for money and discount options, contributing to REMA 1000 Norway increasing its market share in the Norwegian grocery market by
REMA 1000 Norway has a proud history as the pioneer of discount grocery offerings in Norway
0.3 percentage points. Up from 23.5 percent in 2022 to 23.8 percent in 2023 (total traditional grocery market from Nielsen IQ, Dagligvarerapporten 2024, and internal data). The number of sales outlets at year-end 2023 was 674, up from 668 at year-end 2022.
Operating profit in 2023 was NOK 1,769 million (1,699). The results in 2023 are somewhat higher than the previous year, mainly due to improved performance at the Norsk Kylling plant as well as increased franchisee fees due to increased systemwide sales. This was partly offset by general cost inflation and fierce price competition in the Norwegian grocery market.
Outlook
Continuous development of the REMA 1000 concept through assortment, digitalisation and simplification will contribute to an improved shopping experience for customers and increased efficiency throughout the entire value chain. Establishing new stores in attractive locations will also be a strategic priority.
The close collaboration with fully and partially owned and exclusive suppliers will be further developed through REMA Industrier, and we expect further improved operations at Norsk Kylling following significant improvements during 2023. This will help ensure that we deliver high-quality and sustainable poultry at low prices to our customers.
Our responsibility Our business Corporate governance Financial statements Appendix 20 2,255 Total 32% Women 46% Women 22% 68% Men 54% Men 15,673 Total 1.95 mill. tCO2e
SYSTEMWIDE SALES* Million NOK EMPLOYEES Share of women/men PEOPLE* Share of women/men CO2 SCOPE 1, 2 AND 3 Share of total Reitan Retail Million NOK 2019 2020 2021 2022 2023 Result Revenue 28,876 34,421 34,764 34,986 38,276 EBITDA* 3,348 4,248 3,896 3,840 4,092 Operating profit 1,146 2,201 1,841 1,699 1,769 Systemwide sales* and no. of sales outlets* Systemwide sales* 41,457 48,411 47,642 47,401 51,280 Growth in systemwide sales* -1.0% 16.8% -1.6% -0.5% 8.2% Like-for-like growth in systemwide sales* -2.6% 16.1% -2.4% -1.7% 7.5% Number of sales outlets* 644 648 657 668 674 Margins Operating profit as % of revenue* 4.0% 6.4% 5.3% 4.9% 4.6% Operating profit as % of systemwide sales* 2.8% 4.5% 3.9% 3.6% 3.4%
0 10000 20000 30000 40000 50000 60000 51,280 2019 2020 2021 2022 2023 0 5000 10000 15000 20000 25000 30000 35000 40000 38,267 2019 2020 2021 2022 2023 0 500 1000 1500 2000 2500 1,769 2019 2020 2021 2022 2023 * For more information see Performance measures and definitions 1.4 Our business areas REVENUE Million NOK OPERATING PROFIT Million NOK 21 Corporate Governance
REMA 1000 Denmark
Introduction
REMA 1000 Denmark is the franchisor for REMA 1000 stores run by franchisees. REMA 1000 Denmark is the only retail operator in the Danish grocery market with franchises as the main operating model. In addition, REMA 1000 Denmark also sells and distributes goods to the REMA 1000 stores in Denmark and to several convenience stores, including the 7-Eleven stores in Denmark. REMA 1000 Denmark is headquartered in Horsens, Denmark.
REMA 1000 Denmark’s business model is based on high sales productivity and low costs. REMA 1000 Denmark has had a presence in the Danish grocery store market since 1994, when the first two stores were opened. REMA 1000 Denmark inherits its profile and customer-centric mindset from REMA 1000 Norway, and the two share the same ambition of offering quality products at low prices. In Denmark, this is branded as “Much more discount” and “Discount with value”.
In 2023, REMA 1000 Denmark was ranked as the strongest brand in Denmark (YouGov), the second-most sustainable brand (SB insight) and won the top ranking in customer loyalty for the eighth consecutive year (Loyalty Group). This exemplifies the solid foundation for further growth in the Danish grocery market.
2023 results
Systemwide sales* in 2023 was NOK 35,207 million (28,301), corresponding to a growth of 10.2 percent. Like-for-like growth in systemwide sales* was 8.8 percent. REMA 1000 Denmark’s revenue in 2023 was NOK 39,713 million (32,799), corresponding to a growth* of 7.2 percent. Both systemwide sales and revenues were impacted by strong momentum for REMA 1000 Denmark, in addition to high levels of food price inflation, also strengthening the trend towards value for money and discount options. In 2023, REMA 1000 Denmark had
REMA 1000 Denmark’s business model is based on high sales productivity and low costs
an estimated market share of around 18 percent of the traditional Danish grocery market, well above the estimated 17 percent in 2022. The number of sales outlets at year-end 2023 was 372, up from 363 at year-end 2022.
Operating profit in 2023 was NOK 1,347 million (1,248). The improved result in 2023 is mainly explained by increased franchisee fees due to increased systemwide sales and positive currency effects from a weakening NOK vs DKK, partially offset by general inflationary pressure, costs related to the ALDI-acquisition and ramp-up of the new distribution centre.
Outlook
REMA 1000 Denmark will continue to focus on and strengthen the business idea, which means that goods are sold at a low price and with clear requirements regarding the goods’ quality and impact on people and the environment. This includes a continued focus on organic and sustainable groceries and reduced food waste.
In December 2022, an agreement was signed with German discount grocer ALDI to acquire the majority of ALDI’s grocery store network in Denmark. Danish competition authorities approved the deal in August 2023, and the transaction was completed in January 2024. The first stores were converted to REMA 1000 in November 2023. During 2024, we will continue to convert and open new REMA 1000 stores, accelerating growth and boosting market share. Successful integration and opening of new stores are key focus areas for 2024.
Our responsibility Our business Corporate governance Financial statements Appendix 22
Million NOK 2019 2020 2021 2022 2023 Result Revenue 25,584 30,510 29,541 32,799 39,713 EBITDA* 1,656 2,126 1,971 2,185 2,462 Operating profit 865 1,207 1,059 1,248 1,347 Systemwide sales* and no. of sales outlets* Systemwide sales* 22,128 26,931 25,752 28,301 35,207 Growth in systemwide sales* 8.8% 11.5% 0.8% 10.4% 10.2% Like-for-like growth in systemwide sales* 2.8% 6.6% -1.2% 9.5% 8.8% Number of sales outlets* 343 357 360 363 372 Margins Operating profit as % of revenue* 3.4% 4.0% 3.6% 3.8% 3.4% Operating profit as % of systemwide sales* 3.9% 4.5% 4.1% 4.4% 3.8% 0 5000 10000 15000 20000 25000 30000 35000 40000 35,207 2019 2020 2021 2022 2023 0 5000 10000 15000 20000 25000 30000 35000 40000 39,713 2019 2020 2021 2022 2023 0 300 600 900 1200 1500 1,347 2019 2020 2021 2022 2023 1.52 mill. tCO2e 1.4 Our business areas SYSTEMWIDE SALES* Million NOK REVENUE Million NOK OPERATING PROFIT Million NOK 23 Corporate Governance * For more information see Performance measures and definitions 2,023 Total 42% Women 45% Women 58% Men 55% Men 17,351 Total EMPLOYEES Share of women/men PEOPLE* Share of women/men CO2 SCOPE 1, 2 AND 3 Share of total Reitan Retail 17%
Reitan Convenience
Introduction
Reitan Convenience is a leader in the convenience market in Norway, Sweden, Denmark, Finland and the Baltics. With limited exceptions, the portfolio is based on franchising. Reitan Convenience consists of leading international brands and national legacy brands in local markets, including Narvesen in Norway, Latvia and Lithuania, Pressbyrån in Sweden, 7-Eleven in Norway, Sweden and Denmark, R-kioski in Finland, R-kiosk in Estonia, Lietuvos Spauda in Lithuania, Northland in Norway and Caffeine in Lithuania, Latvia and Estonia.
Reitan Convenience has a proud history in convenience retailing going back more than 100 years. The convenience retail operations aim to meet consumer demand for convenient solutions “on the go”. Reitan Convenience aims to make convenience sustainable and sustainability convenient.
2023 results
Systemwide sales* in 2023 was NOK 16,490 million (14,688), corresponding to a growth* of 3.6 percent. Like-for-like growth in systemwide sales* was 6.7 percent. Reitan Convenience’s revenue in 2023 was NOK 5,652 million (4,829), corresponding to a growth* of 6.6 percent. The level of systemwide sales and revenues was impacted by high levels of inflation as well as a full year without Covid-19-induced mobility restrictions and lockdown measures, which impacted January and February of 2022. The number of sales outlets at the year-end 2023 was 1,769, down from 1,953 at year-end 2022, reflecting active portfolio management with the opening of new stores in attractive locations while at the same time closing marginal and small stores, mainly in Norway, Finland and the Baltics.
Operating profit in 2023 was NOK 213 million (-1). The improved result is mainly due to increased revenues
Reitan Convenience is a specialist in developing and operating franchise-based convenience concepts
from franchise services as a result of improved customer offering, optimisation of the store portfolio and more efficient operations. This was partly offset by restructuring costs in Norway and Finland, as well as general inflationary pressure.
Outlook
Reitan Convenience is a specialist in developing and operating franchise-based convenience concepts. Organic growth in existing stores and new store openings are a core part of Reitan Convenience’s business. Reitan Convenience will continue its focus on food-to-go, hot and cold beverages and bakery products through continued innovation and digital solutions to improve customer offering and performance, and to attract existing and new customers.
We have seen positive effects from the successful restructuring of our portfolio in Norway and Finland during 2023, and we will continue our active portfolio management into 2024.
Our responsibility Our business Corporate governance Financial statements Appendix 24
Million NOK 2019 2020 2021 2022 2023 Result Revenue 4,908 4,142 3,987 4,829 5,652 EBITDA* 1,655 1,182 1,006 1,110 1,422 Operating profit 421 -51 -89 -1 213 Systemwide sales* and no. of sales outlets* Systemwide sales* 15,008 13,124 12,853 14,688 16,490 Growth in systemwide sales* -5.8% -18.1% 1.2% 16.1% 3.6% Like-for-like growth in systemwide sales* 1.1% -13.7% 3.2% 15.0% 6.7% Number of sales outlets* 2,098 2,017 2,002 1,953 1,769 Margins Operating profit as % of revenue* 8.6% -1.2% -2.2% 0.0% 3.8% Operating profit as % of systemwide sales* 2.8% -0.4% -0.7% 0.0% 1.3% 0 5000 10000 15000 20000 16,490 2019 2020 2021 2022 2023 0 1000 2000 3000 4000 5000 6000 5,651 2019 2020 2021 2022 2023 -100 0 100 200 300 400 500 213 2019 2020 2021 2022 2023 0.26 mill. tCO2e 1.4 Our business areas SYSTEMWIDE SALES* Million NOK REVENUE Million NOK OPERATING PROFIT Million NOK 25 Corporate Governance * For more information see Performance measures and definitions 2,491 Total 80% Women 63% Women 20% Men 37% Men 11,954 Total EMPLOYEES Share of women/men PEOPLE* Share of women/men CO2 SCOPE 1, 2 AND 3 Share of total Reitan Retail 3%
Uno-X Mobility
Introduction
Uno-X Mobility has operations in Norway and Denmark within liquid fuels, ultrafast EV charging and Nordic Swan ecolabelled car wash, with the mission to develop and promote solutions for sustainable mobility.
For many years, Uno-X Mobility has been behind the YX and Uno-X brands in Norway and Denmark. Uno-X operates self-service locations offering liquid fuel, Nordic Swan ecolabelled car wash, and ultrafast EV charging, while self-service truck locations catering to heavy-duty transportation have been branded with the YX label in both countries. In Norway, the YX brand has also been used in co-locations with 7-Eleven convenience stores (YX 7-Eleven).
As of March 2023, Uno-X Mobility decided to dedicate focus on the Uno-X brand moving forward. This means that all YX truck facilities will be rebranded as Uno-X Truck in Norway and Denmark, and all co-locations with 7-Eleven will be rebranded as Uno-X.
In 2022 Uno-X Mobility launched Ultrafast EV charging at locations operated by Reitan Retail in Norway and Denmark. This was further developed in 2023 in both countries with 31 locations opened by the end of 2023. This was complemented during the year with a strategy to establish itself as a leading player in charging for heavy-duty transport with inauguration of the first charging points in both Norway and Denmark.
In Norway, the Nordic Swan ecolabelled car wash network was further expanded during 2023, following the launch in 2021, thus making it easier for customers to choose a more environmentally friendly car wash option. 77 Nordic Swan ecolabelled car wash locations were opened by year-end 2023.
During the year, Uno-X Mobility has facilitated a dialogue with its dealers and the dealers of another
Uno-X Mobility will continue to develop and promote solutions for sustainable mobility
network of Dealer Owned Dealer Operated locations (DODOs) in Norway, named Best. By year-end, the parties agreed to merge the two concepts organising DODOs, establishing a new company with a majority ownership held by the two group of dealers. Following the completion of this transaction, Uno-X Mobility will hold a minority ownership in the new company and be its long-term supplier of liquid fuels.
2023 results
Operating profit in 2023 was NOK 285 million (723).
The results in 2023 are down from 2022, which was at a high level in a historical context. The result in 2023 is impacted by solid development for liquid fuel operations, but with negative inventory effect compared with significantly positive inventory effect last year, due to declining prices for refined oil products during 2023.
The number of mobility locations at the end of 2023 was 823, compared with 816 at the end of 2022.
Outlook
Uno-X Mobility is strategically positioned to spearhead the transition towards more sustainable mobility in the years to come. Uno-X Mobility will continue to develop and promote sustainable mobility solutions while maintaining an efficient and profitable liquid fuel network. Moreover, it will expand the rollout of EV charging infrastructure to enhance the accessibility of renewable energy for road transportation, in alignment with both national and international climate objectives.
Our responsibility Our business Corporate governance Financial statements Appendix 26
Million NOK 2019 2020 2021 2022 2023 Result Revenue 12,326 10,134 13,251 21,756 20,780 EBITDA* 832 1,156 1,336 1,191 916 Operating profit 512 803 972 723 285 Systemwide sales* and no. of mobility locations* Systemwide sales* 17,164 15,708 18,169 25,340 24,656 Volume sold 1,816 1,768 1,785 1,785 1,749 Growth in volume sold (1,000 m3)2 6.3% -2.6% 1.0% 0.0% -2.0% Number of mobility locations* 822 825 824 816 823 Margins Operating profit as % of revenue* 4.2% 7.9% 7.3% 3.3% 1.4% Operating profit as % of systemwide sales* 3.0% 5.1% 5.4% 2.9% 1.2% 0 5000 10000 15000 20000 25000 30000 24,656 2019 2020 2021 2022 2023 0 5000 10000 15000 20000 25000 20,780 2019 2020 2021 2022 2023 0 200 400 600 800 1000 285 2019 2020 2021 2022 2023 5.17 mill. tCO2e 1.4 Our business areas SYSTEMWIDE SALES* Million NOK REVENUE Million NOK OPERATING PROFIT Million NOK 27 Corporate Governance * For more information see Performance measures and definitions 311 Total 32% Women 32% Women 68% Men 68% Men EMPLOYEES Share of women/men PEOPLE* Share of women/men CO2 SCOPE 1, 2 AND 3 Share of total Reitan Retail 311 Total 58%
Real Estate
Introduction
Real Estate consists of an actively managed real estate portfolio within the retail segment. Its overall mission is to secure access to strategically important locations, and thus an important enabler for the growth of Reitan Retail and its franchisees.
During 2023, the Real Estate segment owned real estate in both Norway and Denmark. In December 2023, Reitan Retail sold its real estate development portfolio in Norway to REBUS Handelseiendom, creating a competent and sizeable company with the aim of becoming a key player within sustainable commercial property in Norway. REBUS Utvikling, a subsidiary of REBUS Handelseiendom, will take over the responsibility for developing an attractive real estate portfolio of potential locations for Reitan Retail in Norway. Reitan Retail will participate in REBUS Utvikling through the Board of Directors and Investment Committee, and the close cooperation will be governed by a servicelevel-agreement. REBUS Handelseiendom is owned by REITAN. Reitan Retail will maintain ownership of a real estate portfolio in Denmark.
2023 results
Operating profit in the Real Estate segment in 2023 was NOK -115 million (141). Included in the segment’s
The Real Estate segment will continue to secure access to strategic important locations, being an important enabler for the growth of Reitan Retail and its franchisees
operating profit was the revaluation of investment properties of NOK -232 million (-24) and the share of profit from associates of NOK -18 million (43). The carrying amount of the real estate portfolio at fair value at the end of 2023 was NOK 3,590 million (4,573).
Operating profit for 2023 was impacted by impairment of real estate assets, reflecting higher yields in the real estate market.
Outlook
The Real Estate segment will continue to secure access to strategically important locations and will be an important enabler for the growth of Reitan Retail and its franchisees.

Our responsibility Our business Corporate governance Financial statements Appendix 28
FAIR VALUE OF PORTFOLIO Million NOK Million NOK 2019 2020 2021 2022 2023 Result Operating profit 171 342 479 141 -115 Rental income 184 232 164 202 233 Revaluation of investment property -21 117 258 -24 -232 Share of profit of associates 89 45 125 43 -19 Selected balance sheet items Total assets 5,962 7,681 5,045 5,272 4,040 Investment property 4,186 3,525 3,843 4,054 3,581 Associates 234 200 154 212 9 Financial investments 82 280 291 307 0 Fair value of real estate portfolio 4,502 4,005 4,288 4,573 3,590 Square meters, engaged in 174,500 150,800 110,300 116,600 82,400 Square meters, ownership adj. 165,500 143,400 101,300 96,500 80,500 0 1000 2000 3000 4000 5000 3,590 2019 2020 2021 2022 2023
EMPLOYEES SQUARE METERS, ENGAGED IN 16 82,400 1.4 Our business areas 29 Corporate Governance

2.1 Our role and responsibility 2.2 Environment
Health
People
Value chain
31 30 Our responsibility Our business Corporate governance Financial statements Appendix
2.3
2.4
2.5
Our responsibility
2.1 Our role and responsibility
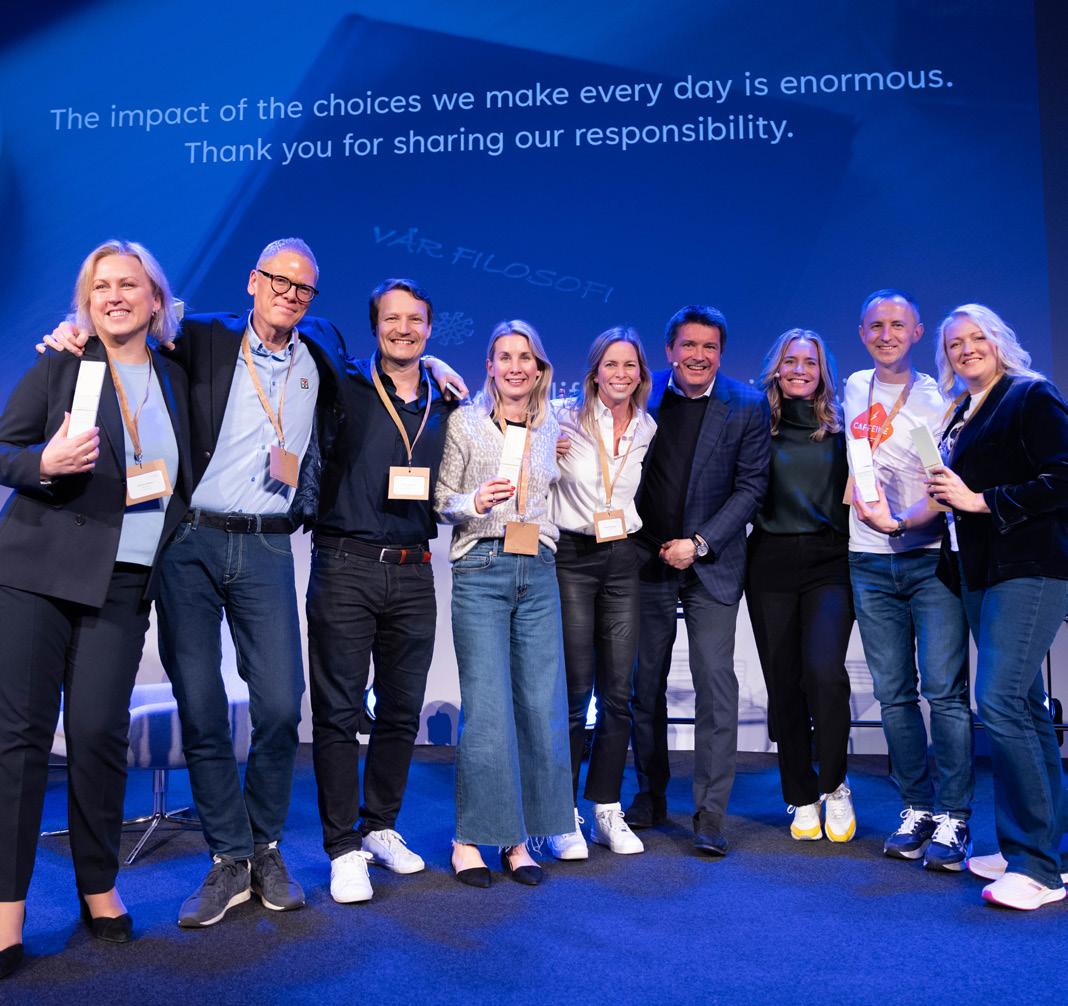
The ripple effects of the choices we make are immense. Reitan Retail and our franchisees together employ 45,000 people and encounter two million customers every single day. This means we have a great responsibility, but it also gives us great opportunities to make a difference. For the 75 years we have been in business, the company has been value-led and focused on making each other better and contributing to the local community. Doing business responsibly is integral to our culture and core values.
Once we mapped our entire climate impact for the first time in 2022, it became evident that we, like many others, are highly dependent on fossil-based
value chains. About half of the world’s global climate emissions stem from food systems and transport . With significant operations and impact in both sectors, we are most definitely part of the problem, and we recognise our responsibility to take prompt action. In 2023, Reitan Retail committed to a collective path towards net zero emissions and an ambitious near-term climate goal aiming to take on a leadership role in our industries.
Throughout the year, we have taken concrete steps and defined clear ambitions in the following focus areas: Environment, health, people and value chain. We have further incorporated sustainability in targets and key performance indicators to ensure that sustainability is an integral part of our ways of working, making decisions and following up on results.
1 Our world in data, https://ourworldindata.org/greenhouse-gas-emissionsfood#note-3) https://ourworldindata.org/co2-emissions-from-transport
45,000 people
33 32 Our responsibility Our business Corporate governance Financial statements Appendix
2.1 Our role and responsibility
OUR TOTAL CARBON FOOTPRINT
Fuels sold 58% Processed meat 7% Red meat 7% Other non-food categories 3% Upstream transportation and distribution 2% Confectionary and snacks 2% Fruit, vegetables and berries 2% White meat 1.5% Alcohol 1.4% Fish and seafood 1.3% Soda and energy drinks 0.6% Other (>0,6%) Other food categories 6% Dairy products 6%
- tCO2
Societal impact and value across the value chain
Being a significant retail company in the Nordic and Baltic regions, Reitan Retail operates in discount grocery, convenience and mobility across seven countries, through 45,000 people and with more than 10,000 producers and suppliers worldwide. We recognise our impact along the entire value chain, understanding both the positive and negative aspects.
35 34 Our responsibility Our business Corporate governance Financial statements Appendix 3,600 sales outlets 45,000 people 2 million daily transactions 50/50 men and women ~ 725 million customers Food Fuel Convenience Society Supply chain Reitan Retail Society Agriculture and food production 52,7% of our total emissions 2,3% of our total emissions Fuel and biofuel ~10 000 producers and suppliers 14 distribution centers 7 industry companies 1 2 Waste 6 2 3 4 2 Transportation and distribution Our production sites Sales outlets, offices and employees 5 Customers 0,1% of our total emissions 1,1% of our total emissions 3 4 43,5% of our total emissions 5 Positive impacts local jobs and educational opportunities societal provision of food and mobility renewable energy deployment Negative impacts supply of emissions and chemicals to water, air and land natural resources exploitation, land use change and habitat loss from land degradation waste of natural resources and raw materials supplier misconduct related to human rights health and lifestyle effects resulting from products that cause disease or unhealthy conditions Sustainability risks use of virgin materials transition climate related risk physical climate related risk availability of renewable energy 0,2% of our total emissions 6 1 1 Suppliers and producers 1 1 1 2 2 2 3 3 3 3 1 1 1 2 2 2 2 3 3 3 3 4 4 4 4 1 1 1 1 2 2 2 3 3 4 4 4 4 5 5
Double materiality analysis
We steer our sustainability initiatives for Reitan Retail and our stakeholders based on materiality and values. A materiality assessment made in 2020 has, over the years, undergone updates and quality checks through a variety of stakeholder dialogues. In 2023, we started the internal and external dialogue on a double materiality perspective, identifying our impact and value creation from and towards business activities. We conducted dialogues on key material topics according to sectors pre-defined by the CSRD (Corporate Sustainability Reporting Directive). Together, we ranked the most essential areas by probability and severity. The most material topics are presented below.
In 2024, we will finalise the double materiality analysis and have it validated by a third party. We will involve external stakeholders in a dialogue on the materiality from their perspectives, what value and impact Reitan Retail creates, and how external activities affect different parts of our value chains and business. An updated sustainability strategy based on the double materiality analysis will be adopted by the Corporate Management Board in 2024. Read more about how we integrate sustainability into our business strategy and governance in Chapter 3 .
Stakeholder dialogue
The transition towards a fossil-free society cannot be done without collaboration and partnerships. Through two million encounters every single day, our franchisees and their employees across 3,600 sales outlets are close to our customers, thereby ensuring we always stay relevant to our ultimate boss. Our business areas also engage with local society and authorities, business forums, producers and suppliers to operate as beneficially as possible for the local environment.
In addition, we keep dialogues on sustainability and responsibility matters with societal key stakeholders on a national, European and global level, and ensure close relations and dialogues internally with franchisees, employees and suppliers to stay relevant and mitigate risks or hindrances.
Founded on a wish to contribute to the wider public conversation, we have participated in political weeks in Arendalsuka in Norway, Folkemødet in Denmark and at COP28 in Dubai to raise our issues and openly discuss the dilemmas related to climate change. We have also invited external perspectives into our discussions,
giving a panel of eight fresh voices the opportunity to give us advice on how to attack our climate emissions. The Future Advisory Board came up with five highly relevant and interesting proposals, of which we will implement more than one.
Reitan Retail formed ties with UN Food and Agriculture (UN FAO) and invited a broad group of stakeholders to a round table discussion. The topic was the complex subject of supporting global trade and small-scale farmers in low-income countries while, at the same time, supporting local Nordic production and taking environmental matters in accordance.
EU regulations have a significant impact on our business activities, and we welcome competitive market regulations and sustainability standards. Establishing and maintaining relationships and dialogue with relevant stakeholders in the EU will become increasingly important in the coming years as the EU works towards achieving its goals for climate, agriculture, energy, environment and equality, while also anticipating additional national regulations.
Changed market and customer behaviours, inflation, cybersecurity, war, pandemics and population growth pose high risks of volatility throughout the value chain.

Our stakeholders:
• Customers
• Our business areas
• Our owners
• Suppliers and producers
• Government and authorities
• Financial institutions
• Sector-specific organisations
• Non-governmental organisations
• Media
37 36 Our responsibility Our business Corporate governance Financial statements Appendix
Most material topics based on impacts having a significant probability to occur and a significant severity
Retail’s
on the external world The external world’s impact on Reitan Retail’s business Positive Negative Positive Negative Local impact through tax revenues and support for community activities High CO2 emissions in the value chain Reputation - customers and employees Climate change Socially critical activities The products we sell cause deforestation and supply of microplastics and chemicals Consumer and political trends Significant increase in
coming into effect with
notice Sustainable transportation and clean energy Health effects such as obesity and lifestyle related diseases due to unhealthy products, ingredients or production processes. Increased customer demand for low prices due to tougher economic times
2.1 Our role and responsibility
Reitan
impact
regulations
short
Reitan Retail’s sustainability strategy
Based on our values, the double materiality analysis and stakeholder dialogues, our sustainability efforts are directed towards the food industry and road transportation sector, as well as the topics most important for the communities where we are present.
The four strategic areas, Environment, Health, People and Value chain, are Reitan Retail’s joint sustainability focus, wherein the business areas contribute by setting objectives, identifying activities, and following up on effects and results in ways customised to the specific market and stakeholder.
In 2023, we updated our sustainability strategy, originally from 2020, according to materiality and adjusted to the progress of business activities and strategic priorities, stakeholder dialogues, regulations and sustainability standards. An updated version will be presented in 2024, clearly reflecting our stance on the green transition and the importance of good health, diversity and inclusion, transparent value chains to secure fundamental human rights, decent working conditions, and reduced negative impact on the environment and animals.
The sustainability strategy aligns with the Global Reporting Initiative to help report in a transparent and accessible way. The business areas report separately on the progress towards the goals. In 2024, we will update our reporting scheme towards CSRD (Corporate Sustainability Reporting Directive) and report according to the new standards in 2025. We will also strengthen the integration of sustainability performance in the follow-up and forecast of financial performance to ensure that we walk the talk and take the needed actions to secure alignment of sustainable and economic goals.
Through our sustainability strategy, we aim to contribute to the UN’s 2030 Agenda and the 17 Sustainable Development Goals. We support all 17 goals and have
prioritised six of them as they best reflect our impact through the value chain and where we can make a positive contribution.
PRIORITISED SUSTAINABLE DEVELOPMENT GOALS
PLEDGE
Reitan Retail will contribute to good public health, reduce greenhouse emissions, create greater diversity and equality in working life, and ensure sustainability and transparency throughout the value chain.
Environment
We aim to lead the green transition in our industries via our sustainability initiatives, helping our customers make climate-friendly choices and working towards a sustainable value chain that protects soil and biodiversity.
Health
We aim to offer healthier products at affordable prices for everyone. We inspire a healthier, active and sustainable lifestyle through our products, services and sponsorships.
People Value chain
We aim to lead by example in equal opportunity, and firmly believe in an inclusive work environment where people from all backgrounds are given the opportunity to succeed.
We have a high level of business morale and hold our suppliers accountable to our rigorous ethical code of conduct in order to offer responsibly produced products to our customers.
39 38 Our responsibility Our business Corporate governance Financial statements Appendix
2.1 Our role and responsibility
2.2 Environment

We aim to lead the green transition in our industries via our sustainability initiatives, helping our customers make climate-friendly choices and working towards a sustainable value chain that protects soil and biodiversity.

CO2 +1.6% CO2
TARGETS
By 2030, the ambition is to become a net zero CO2 emitter in our own companies (Scope 1 and 2) and halve the CO2 emissions from products (scope 3)
By 2030, the ambition is to cut food waste in our value chain by 50 percent
By 2030, the ambition is to have a total sorting rate of 90 percent of all waste
By 2050, the ambition is to become net zero in the entire value chain
The emissions from food and transport are responsible for up to half of the global CO 2 emissions 3 . and today, we have much more knowledge about our product range and its impact. We will continue to explore and map the impacts of production and use of the products we sell, enabling us to transition towards a range with lower environmental impact.
2023 was a pivotal year for both Reitan Retail and the world regarding climate and environmental action. It was the warmest calendar year in global temperature data records going back to 1850 – and at the COP28 climate summit in Dubai, new commitments were made to accelerate the transition from fossil fuels to renewable energy sources. Additionally, 2023 was when the world started working towards becoming nature-positive by 2030, a global goal equivalent to the 1.5° C climate goal2 We are committed to contributing to these global targets and leading transitional activities in the industries in which we operate.
Challenges and opportunities
The emissions from food and transport are responsible for up to half of the global CO 2 emissions 3. We collaborate with more than 10,000 producers and suppliers dependent on fossil energy, and it remains an indispensable energy source for fundamental everyday needs. One-third of the food produced is wasted or lost, and less than 20 percent of packaging waste is recycled. These challenges are significant for us, as for society at large.
The environmental footprint of products and ingredients in the food industry is poorly documented and very complex, and transparency and traceability are challenging. However, there is great potential for making rapid progress and improvements. We believe that by working together with partners, we will discover solutions that foster engagement and yield results. We are continuously seeking activities and innovations to bridge the gaps towards 2030 and 2050. The key lies in understanding our emissions,
1 Copernicus https://climate.copernicus.eu/copernicus-2023-hottest-year-record#:~:text=Credit%3A%20C3S%2FECMWF.,-ACCESS%20TO%20DATA&text=Global%20surface%20air%20temperature%20highlights,highest%20annual%20value%20in%202016
2 Convention on Biological Diversity, https://www.cbd.int/gbf
3 Our World in Data, https://ourworldindata.org/greenhouse-gas-emissionsfood#note-3, https://ourworldindata.org/CO2-emissions-from-transport

41 Our responsibility Our business Corporate governance Financial statements Appendix
AMBITION
KEY FIGURES
70% emissions in scope 1 and 2 since 2022 emissions in scope 3 since 2022 tonnes food waste in our sales outlets recyclable rate of waste generated
-8%
9,600
Climate
Achieve net-zero CO2 emissions in our own companies (scope 1 and 2) and halve the CO2 emissions from products (scope 3) by 2030, and achieve net-zero CO2 emissions throughout the entire value chain by 2050.
To secure our goal of becoming a net-zero emitter of carbon emissions by 2050, we have committed to a shortterm climate goal for 2030 that includes our entire value chain. To align our business strategy with the global Paris Agreement and climate goals, we utilise science-based methods to set targets of limiting the temperature increase to 1.5 °C above pre-industrial levels.
To identify how to move forward in these next crucial years, we set carbon reduction plans aligned with the short-term climate goal. We also encourage our suppliers to set science-based targets in line with the 1.5° C ambition, as it will be impossible to reach the climate ambitions without their collaboration.
The carbon emissions stemming from our own operations (scope 1 and 2) primarily come from transportation, refrigerants, stationary combustion and energy supply
used to run our 3.600 sales outlets. In 2023, our CO2 emissions in scopes 1 and 2 were reduced by 8 percent compared to 2022. We emitted 44,000 tonnes of CO2 from our own operations, equalling less than 0.5 percent of total emissions when including scope 3 emissions. Since 2020, we have reduced our CO2 emissions in scopes 1 and 2 by 21.1 percent.
In scope 1, emissions have remained stable compared to 2022. The use of refrigerants has led to a 37 percent reduction in emissions due to a shift to suppliers offering less carbon-intensive fluids. However, there has been an increase of 75 percent in emissions from stationary combustion at our food preparation facilities in Lithuania due to more granular reporting compared to 2022.
In 2023, there was a 13 percent decrease in scope 2 emissions compared to 2022. Emissions in scope 2 are calculated using seven country-specific energy mixes for the Nordics and Baltics. Energy consumption decreased by 2.4 percent in 2023, reflecting the successful implementation of resource-saving measures. Moreover, Reitan Convenience experienced a net decrease of 184 sales outlets, impacting energy
requirements. The main contributors to overall consumption are electric heating and cooling in sales outlets and facilities, along with machinery usage.
Late in 2023, REMA 1000 Denmark introduced 12 electric trucks to its vehicle fleet, and we expect another 18 electric trucks will be delivered in 2024. Charging stations will also be established, and they will be powered by electricity generated from REMA 1000 Denmark’s new solar panel installation on top of their new logistics building. We expect a positive impact on emissions from our logistics in the coming years, and a decreased climate impact from our operations as energy sourcing and utilisation become increasingly efficient. The efforts are a continuation of our commitment to operating a business that utilises more renewable energy in a more efficient way.
In scope 3, we make significant efforts to collect precise data on products sold in our systemwide stores and pumps, as well as from other supply chains essential for our daily operations. In 2023, emissions rose by 1.6 percent, attributed to various factors such as enhanced data completeness, more comprehensive factor calculations including FLAG emissions (Forest, Land and
43 42 Our responsibility Our business Corporate governance Financial statements Appendix
TARGET
CARBON EMISSIONS 2023 8.9 million tCO2 8.9 million tCO2 Scope Emissions from our operations Products sold in our stores Processed meat Red meat Dairy products Confectionary and snacks Fruit, vegetables and berries Other* Scope 1+2 Fuel sold Scope 3 Products sold in stores Other 18.1% 17.2% 15.9% 5.4% 4.5% 38.9% 0.5% 58% 99.5% 38% 4%
* Other goods consist of product categories, each of which individually accounts for no more than 4 percent of emissions from the total emissions of goods sold in store. 2.2 Environment
Agriculture ) for high-risk commodities, and increased sale of total units. 99.5 percent of our emissions stem from our value chain. Collaboration with our numerous producers and suppliers, totalling more than 10,000, will need to be strengthened in the future to enable us to actively offer less carbon-intensive products to our customers. We are committed to forming partnerships to enhance our collective knowledge of producing products more sustainably in the future.
Climate reduction action plan and climate governance
Throughout the year, we have developed a climate action plan in close collaboration with external and internal stakeholders. The action plan identifies activities that will reduce our carbon emissions and dependency on fossil energy in our own operations and value chain. The activities include supplier engagement, promoting sales of food and drinks under the Nordic dietary guidelines, and collaborating with academia, market actors, and authorities to promote innovation. The complete answer is yet to be found, but we will continue to search for solutions to close the so-called “innovation gap”. The more we know about the climate footprint of our products, the closer we are to finding effective solutions targeting the most material emissions.
During the year, Reitan Retail conducted a climate risk assessment with key stakeholders in all business areas. Of the twelve total risks and opportunities we identified, nine were both risks and opportunities, highlighting the complex nature of climate-related impacts. By including climate in our risk management process, we can better grasp environmental risks and opportunities imposed upon us by a changing climate and societal transition.
Read about how Reitan Retail governs and mitigates climate-related risks in Chapter 3.3. See the full report on TCFD (the Task Force on Climate-related Financial Disclosures) at www.reitanretail.no
To further integrate environment and climate in the decision-making processes and keep focus on the climate action plan, climate was included as a key performance indicator for the management in 2023. In the coming year, we will focus on follow-up activities and the financial investment and assessment. The Chief Financial Officer (CFO) and the Chief Operating Officer (COO) will work closely on further integrating sustainability into the financial management.
Sustainable transportation
All parts of Reitan Retail must lower emissions from transportation and distribution. Road transport makes up 72 percent of global transport emissions, and much of our assortment relies on efficient local and global transportation. We continue to introduce biogas trucks and electric vehicles (EVs). Smarter logistics and better routes can help reduce transportation and increase efficiency during collection and drop-off.
Uno-X Mobility´s commitment to sustainability is underscored by ongoing efforts to develop an EV charging infrastructure for both personal EVs and heavy-duty EVs. One of the highlights this year has been the launch of a heavy-duty transport charging concept, both in Norway and Denmark. This is a strategic move that not only aligns with our dedication to reducing our carbon footprint, but it also entails an ambition to position us as a market leader in heavy-duty EV charging. As of year-end 2023, Uno-X Mobility has successfully launched EV charging at 38 locations, making it possible for 184 EVs to charge simultaneously at Reitan Retail locations in Norway and Denmark. For heavy-duty EVs, one location in Norway and two in Denmark are in operation by year-end.
45 44 Our responsibility Our business Corporate governance Financial statements Appendix
A framework for companies in land-intensive sectors such as forest, land and agriculture (FLAG), to set science-based targets that include land-based emissions reductions and removals. https://sciencebasedtargets.org/sectors/forest-land-and-agriculture
1
.
2.2 Environment
Biodiversity
To prevent deforestation and reduce the use of soybeans in feed and palm oil in products through requirements and collaboration with our suppliers.
The most significant damage we inflict on our environment is through our eating habits and the methods we use to produce food. Our global food system is the primary driver of biodiversity loss, with agriculture alone being the identified threat to 86 percent (24,000) species at risk of extinction. The global rate of species extinction today is higher than the average rate over the past 10 million years1
Today’s food production is also highly inefficient. 50 percent of all habitable land is used for agriculture, and 77 percent of agriculture is used to keep livestock and produce meat and dairy – which amounts to only 18 percent of the global protein supply2
A new global framework for biodiversity and a common global goal to become nature-positive by 2030 underlines that restoring nature and achieving 1
High-impact environmental risk commodities
Even though all palm oil used in our own products is certified, the high global demand for palm oil production has come at the expense of ecosystems in other countries. We do not wish to contribute to further deforestation of the rainforests and will cease selling products containing palm oil or palm oil derivatives. In the coming year, we will present a joint, ambitious plan that provides a realistic perspective on how to achieve this goal.
Soy is traditionally the protein source in chicken feed. Globally, soy production is harmful to the environment and biodiversity, and at Norsk Kylling, the search for the feed of tomorrow is a priority. In the spring of 2023, Norsk Kylling started developing and testing new feed through feed experiments in a specialised barn. An ultimate goal is to replace soy.

secure and sustainable food production is as critical as ever. Reitan Retail has formed ties with UN Food and Agriculture (UN FAO) to deliberate the environmental aspects of supporting global trade and food production in low-income countries versus supporting local production. Reitan Retail also partook in the COP28 Climate Change Conference in Dubai and talked about global agriculture and food production systems.
Through an ongoing supplier dialogue and risk-based procurement management, Reitan Retail identifies, mitigates and follows up on the risks to nature, such as deforestation. In 2024, we will finalise our Policy on Responsible Procurement and implement it in everyday operations. Read more about how we work with our value chain in Chapter 2.5
Waste
To achieve a total sorting rate of 90% for all waste by 2030.
The world generates two billion tonnes of garbage annually, comprising everyday items such as food packaging, clothes, bottles, leftover food, papers, electronics, and batteries. Despite all available recycling technology, less than 20 percent of waste is recycled, and the remaining 80 percent becomes part of landfill sites .
In 2023, Reitan Retail recycled 77 thousand tonnes of waste, with a recyclable rate of 70 percent of total waste generated. The remaining 30 percent of unsorted
Despite all available recycling technology, less than 20 percent of waste is recycled in the world.
waste was either incinerated or sent to landfills, and its emissions count for 87 percent of total CO2 emissions from waste in our own operations in Reitan Retail.
Waste management in Reitan Retail follows the regulations of various materials in the countries where we are present, in addition to implementing several local initiatives, such as replacing plastic in packaging and using recycled plastics. Using recyclable or recycled materials in the packaging and encouraging customers to recycle is an integral part of responsible retail.
1 Development Aid, https://www.developmentaid.org/news-stream/post/158158/world-waste-statistics-by-country
47 46 Our responsibility Our business Corporate governance Financial statements Appendix
TARGET
RECYCLED WASTE 2023 2022 2021 2020 70% 76% 73% 72%
UNEP, https://www.unep.org/news-and-stories/press-release/our-global-food-system-primary-driver-biodiversity-loss 2 Food Planet Prize
. TARGET
2.2 Environment
EXAMPLES OF MITIGATING ACTIONS
Food waste
To reduce food waste in the value chain by 50% by 2030.

Food waste is a significant global challenge; roughly one-third of the food produced for people is believed to be wasted or lost1. Food is wasted in every step of the life cycle. The largest source of food waste is in the production phase due to crop pests and diseases, inefficient harvesting methods, transportation, and storage. Food is also wasted through deliberate discarding in sales outlets and households2
Today, food retailers waste around 2 percent, and more than 10 percent of the food waste comes from households3 Our discount grocery and convenience operations work to reduce food waste by optimising product offerings and packaging, building awareness among our people and customers, and utilising technology and partnerships. For
1 https://www.fao.org/newsroom/detail/FAO-UNEP-agriculture-environment-food-loss-waste-day-2022/en
2 The World Counts, https://www.theworldcounts.com/challenges/people-and-poverty/hunger-and-obesity/food-waste-statistics
3 WWF, https://www.worldwildlife.org/stories/we-re-losing-40-of-the-food-we-produce-here-s-how-to-stop-food-waste
example, we collaborate with local producers to recycle surplus greens and transform them into ready-to-eat meals, and we use apps to promote reduced prices on short-dated items to customers.
Optimising the assortment and controlling the delivery frequency and sales quantity can enable our stores to reduce write-offs and offer fresh products to our customers without overstocking. Reducing bread prices in the last hour and utilising Artificial Intelligence (AI) has been proven to work well to improve forecasting accuracy in REMA 1000 sales outlets.
Our commitment to reducing food waste saved 3.9 million products in 2023. Together with customers, suppliers and producers, we’re making a real impact in the fight against waste, forging a brighter future where we take care of the resources we have. Although, we caused 9,600 tonnes of food waste in our sales outlets, an increase of 2,100 tonnes compared to 2022.
49 48 Our responsibility Our business Corporate governance Financial statements Appendix
TARGET
2.2 Environment
NUMBER OF SAVED PRODUCTS IN 2023 PER COUNTRY WE OPERATE IN Latvia Norway 1,792,425 318,176 782,354 508,043 114,231 162,136 245,420 3,922,785 Estonia Sweden Lithuania Denmark Total Finland 3% 46% 4% 8% 6% 20% 100% 13%
Health

To offer healthier products at affordable prices for everyone and inspire a healthier, active and sustainable lifestyle through products, services and sponsorships.

29%
45,219 of sales in REMA 1000 combined are healthier products children and youth participated in camps focusing on physical activity and health
Through the report, we are provided with scientific evidence showing that a healthy diet is often also sustainable. There are many significant synergies between health and the environment in the necessary transition of our food consumption.
Rune Blomhoff, project manager for the Nordic Nutrition Recommendations 2023 and professor at the University of Oslo.
TARGETS
The ambition is to increase sales of fruit, vegetables, berries, whole grains, fish and seafood in REMA 1000 combined.
We will increase our efforts for physical and mental health through our collaborations within grassroots sports, activities and organisations.
We have a responsibility to contribute to better public health, and we want to inspire people to make healthier and more sustainable choices. Food systems and diets are shifting globally due to multiple factors, such as war and conflicts, climate change and demographic shifts. Growing urbanisation drives the consumption of processed and fast food, leading to increased obesity, malnutrition and food crises. Child malnutrition remains a significant concern. 22 percent of children globally experience stunted growth, 6.8 percent are malnourished and 5.6 percent are obese .
It is a major challenge for the communities where we operate that public health is deteriorating, with too little physical activity combined with unhealthy eating habits leading to overweight and obesity. A well-balanced diet is not only beneficial for our health – it can also reduce environmental impacts. With two million daily encounters in REMA 1000 and Reitan Convenience, we can make healthier diets accessible and affordable to everyone and positively affect the environment.
In 2023, the sixth edition of the Nordic Nutrition Recommendations was published. These scientific guidelines address health and environmental concerns, advocating for a more plant-based diet, increased fish consumption and reduced meat intake2 .
Challenges and opportunities
We must shift our food system in a more sustainable direction, eating more plant-based protein and
1 UNICEF, https://data.unicef.org/resources/sofi-2023/
2 Nordiska Rådet, https://www.norden.org/sv/news/mindre-kott-mer-vaxtbaserat-har-kommer-de-nordiska-naringsrekommendationerna-2023
becoming less reliant on animal protein. Too many people are eating unhealthily, bringing a cost increase to society and a diminished quality of life for the individual. In times of rising food prices, consumers are buying less fruits and vegetables3 .
In our 2,800 grocery and convenience stores, we work to make healthier options more accessible through price, quality, marketing, and packaging. We continuously develop new and existing products in a healthier direction in close dialogue with our suppliers. We also wish to inspire and push for healthy habits and lifestyles by supporting local organisations and community partners through subsidiaries. In total, across our business areas, 45,219 children and youth participated in camps focusing on physical activity and health in 2023.
Inspiring healthy lifestyles
REMA 1000 Norway and the Norwegian Handball Federation cooperate to include more children in sports, and won the 2023 Sponsorship and Event Association award.
In 2023, the Uno-X Mobility men’s cycling team participated for the first time in Tour de France, following the participation of the women’s team in 2022. The purpose is to inspire to sustainable mobility and healthier lifestyles for all.
51 Our responsibility Our business Corporate governance Financial statements Appendix
2.3
AMBITION
KEY FIGURES
3 Svensk Dagligvaruhandel, Dagligvaruindex Frukt & Grönt 2023
Healthier options
The ambition is to increase
sales of fruit, vegetables, berries, whole grains, fish and seafood in REMA 1000.
on both customer demands and innovation. We continuously strive to improve the nutritional value of our existing private-labelled products and develop new ones in accordance with guidelines promoting reduced sugar, salt, saturated fat and food additives while preserving the great taste. Food additives are primarily used if there is a technological need, such as preserving the nutritional quality of the food or enhancing the food’s stability.
We aim to simplify healthier food choices for our customers. Certification labels, such as the Nordic Keyhole label, guarantee that the products meet specific salt, sugar, fat and fibre content requirements within the product group. The aim is to guide consumers to a varied diet and make it easy to make healthy choices. We will continue to develop and promote healthier products and make those options more accessible in sales outlets.
The grocery retail sector plays a significant role in shaping consumers’ consumption, and we bear a responsibility to facilitate more of the good and healthier choices. A part of offering healthier products is improving existing products and increasing the sales of more nutritious options. Our definition of healthier products includes fresh and frozen fruits, vegetables and berries, keyhole-labelled products, fish and seafood and whole grains.
We are committed to monitoring and measuring the proportion of healthier products we sell and aim to increase that share. We measure the share of healthier products compared to edible and drinkable products. In 2023, 29.0 percent of sales came from healthier products, compared to 29.1 percent of sales in 2022. We will continue to promote the sales of healthier products that are better for the environment and climate. In 2024, we will set new objectives that align with the Nordic Nutrition Recommendations.
Furthermore, we engage with suppliers to increase the availability of preferred product types based
Throughout the year, we have examined enhancing health initiatives to make healthier options more accessible for a wider range of customers. In 2024, we will introduce our revised sustainability strategy, placing health at its core and with updated targets in line with the Nordic Nutrition Recommendations.
Food knowledge
REMA 1000 Denmark launched a food challenge together with students and Madkulturen, to promote culinary joy and kitchen skills, and to raise awareness about healthy and sustainable food choices among future generations. The Food Challenge project focuses on strengthening students’ interest in sustainable ingredients, flavour experiences and culinary experiments in the school kitchen.
REMA 1000 Denmark had 1,746 children between 8-12 years participating in cooking schools in 2023.

53 52 Our responsibility Our business Corporate governance Financial statements Appendix
29% healthier products in 2023 29% healthier products in 2022 TARGET
REMA 1000 NORWAY AND DENMARK Fruit, vegetables and berries Fish and sea food 14% Keyhole-labelled products 9% Whole grains 3% 3% 2.3 Health

To lead by example in providing equal opportunities and an inclusive work environment where people from all backgrounds can succeed.

By 2025, we will have at least 40 percent representation per gender among new franchisees in Reitan Retail.
By 2025, the ambition is for there to be at least a 40 percent gender balance for new hires in top and middle management combined in Reitan Retail.
All companies must have conducted internal employee surveys or use tools that measure how employees experience our diversity work.
Our people are at the heart of everything we do, embodying our values and making it into something unique.
Our people are at the heart of everything we do, embodying our values and making it into something unique. Value-based leadership is part of our philosophy to help great people grow and develop. With 45,000 people working across operations in seven countries, Reitan Retail has the opportunity and the responsibility to build inclusive and safe workplaces.
Challenges and opportunities
Global freedom declined for the 17th year in 2022, with 35 countries facing reduced political and civil liberties.1 High levels of inequality hinder skill development, economic mobility and human development, ultimately stifling economic growth. It fosters uncertainty, insecurity and distrust in institutions, leading to social tensions and conflicts. At Reitan Retail, we take this societal challenge and development very seriously. We firmly believe that we can make a positive difference as an employer by being a unifying force in society and having close relationships with citizens in the form of customers, suppliers and partners.
There is a growing desire for purpose and belonging at work, especially among young people2. This paradigm shift is a good fit and a great opportunity for us as a value-driven company with a true commitment to sustainability and societal responsibility. Our purpose and deeply held values will help us attract and retain the talents of tomorrow and contribute to a more inclusive society.
Freedomhouse.org 2 Kairos Future, www.kairosfuture.com/se/publikationer

55 Our responsibility Our business Corporate governance Financial statements Appendix
2.4 People
TARGETS AMBITION
KEY FIGURES 50/50 32% 42% 94% gender balance among our people women among new franchisees women among new managers and management of employees feel that they are treated fairly regardless of cultural or ethnic affiliation
Responsible employer
People are our most valuable assets, and gender equality and diversity among employees are critical. The various skills, competencies, backgrounds and perspectives of our employees create new opportunities, lead to better decisions and positively impact our business.
We have several programs and tools available to ensure our employees develop and have access to lifelong learning possibilities, such as relevant skill development courses. Succession planning is a way to ensure and preserve competence, diversity and gender equality within Reitan Retail. Through individual employee evaluation and development interviews, we identify and define career goals and development plans for those with ambitions to advance. We promote internal career development and advertise vacancies internally first.
Competence and potential are valued over demographic, cultural, and socioeconomic differences. We have zero tolerance for discrimination and harassment at all workplaces, as established in our Code of Conduct 1 .
1 https://www.reitanretail.no/en/about/governing-documents
AWARD FOR INCLUSION
In 2023, REMA 1000 Norway was awarded the “Ringer i Vannet” prize (“Ripples in the Water”), recognising its commitment to advancing inclusion to a leadership level and integrating it into the company’s overall strategies and objectives. This initiative, developed by the Confederation of Norwegian Enterprise (NHO), prioritises workforce inclusion with a focus on the needs of the business sector.
“Ringer i Vannet” is an organisation dedicated to facilitating lasting connections to the workforce for individuals who are currently outside of employment and education. This is highly important work for us, for the individuals involved, and for society at large.

Values
Our value-based culture is the cornerstone of our operations throughout all companies. It is the basis for creating financial value and conducting activities with integrity and responsibility. Odd Reitan describes the REITAN philosophy in “Blåboka” (“the Blue Book”) as eight values and eleven success factors.
The Chief executive officer (CEO) in each Reitan Retail business area is responsible for operating and developing the business area according to the Reitan philosophy. Managers are responsible for the cultural development of their subsidiaries. Reitan’s “Verdiskole” (“Value Academy”) is our internal leadership academy. It aims to raise awareness and provide training in our philosophy, culture, and value-based leadership. In 2023, 102 leaders from Reitan Retail participated in the Value Academy. In addition, brief courses, training sessions and discussions about our philosophy and values were held at local meetings with franchisees, employees and leaders.
Our eight values guide us in our work:
1. We stick to our business model
2. We keep high moral standards
3. We are committed to be debt-free
4. We encourage a winning culture
5. We are positive and proactive
6. We talk with each other, not about each other
7. The customer is our ultimate boss
8. We work for fun and profit

57 56 Our responsibility Our business Corporate governance Financial statements Appendix
2.4 People
Equality
Europe has had legal equality between men and women for more than a century. However, social and economic equality is lagging, and women are still falling behind in many indicators, such as median earnings and representation in decision-making positions across the political, economic and social spheres1. The share of female members in the largest listed European companies is 33 percent2. Legislation in Norway and the EU requires that companies have at least a 40 percent share of each gender on the board3
Unfortunately, we also see a gender imbalance on boards, in management positions, and among franchisees. We have a gender-balanced workforce overall, with 50 percent women and 50 percent men. However, the share is less balanced among franchisees and managers. There seems to be no stable pattern towards increased equality, meaning we must think differently going forward. We need to turn words into action once and for all. During 2024, all 384 boards in Reitan Retail across all seven countries where we operate will secure a minimum of 40 percent representation of the underrepresented gender among board members. The legislation implemented in Norway and within the EU to improve gender distribution in listed companies helps accelerate the development we are working towards.
We have intensified our work during the year to achieve this, and among other things, reviewed the competence needs and set up internal training for new board members. We believe equal representation on the top level will have an important trickle-down effect and serve as a norm setter that helps highlight and develop more female top leadership candidates, as
1 https://eige.europa.eu/gender-equality-index/2023/domain/power
2 EIGE, Gender Statistics Database, WMID, 1st semester 2023. EIGE’s calculation.
3 https://www.regjeringen.no/no/aktuelt/historisk-enighet-om-krav-til-kjonnsbalansei-norske-styrer/id2985631/
4 Boards with three or more members
well as having an important impact on gender balance in all areas within the organisation. Over time, we have not been sufficiently successful in building up future female top leaders or female franchisees. Even though the retail profession traditionally has been maledominated, we must find new ways to attract and keep women as franchisees.
Gender equality in Reitan Retail is measured, among other things, by the proportion of women in management positions. The gender equality in each company is monitored annually and communicated in annual sustainability reports. To gain a scientific perspective on what may inhibit and promote inclusion and diversity within Reitan Retail, we will carry out a survey to get data covering all business areas in all countries. The study will be conducted through the Fafo Institute for Labor and Social Research. The results will be presented in 2024.

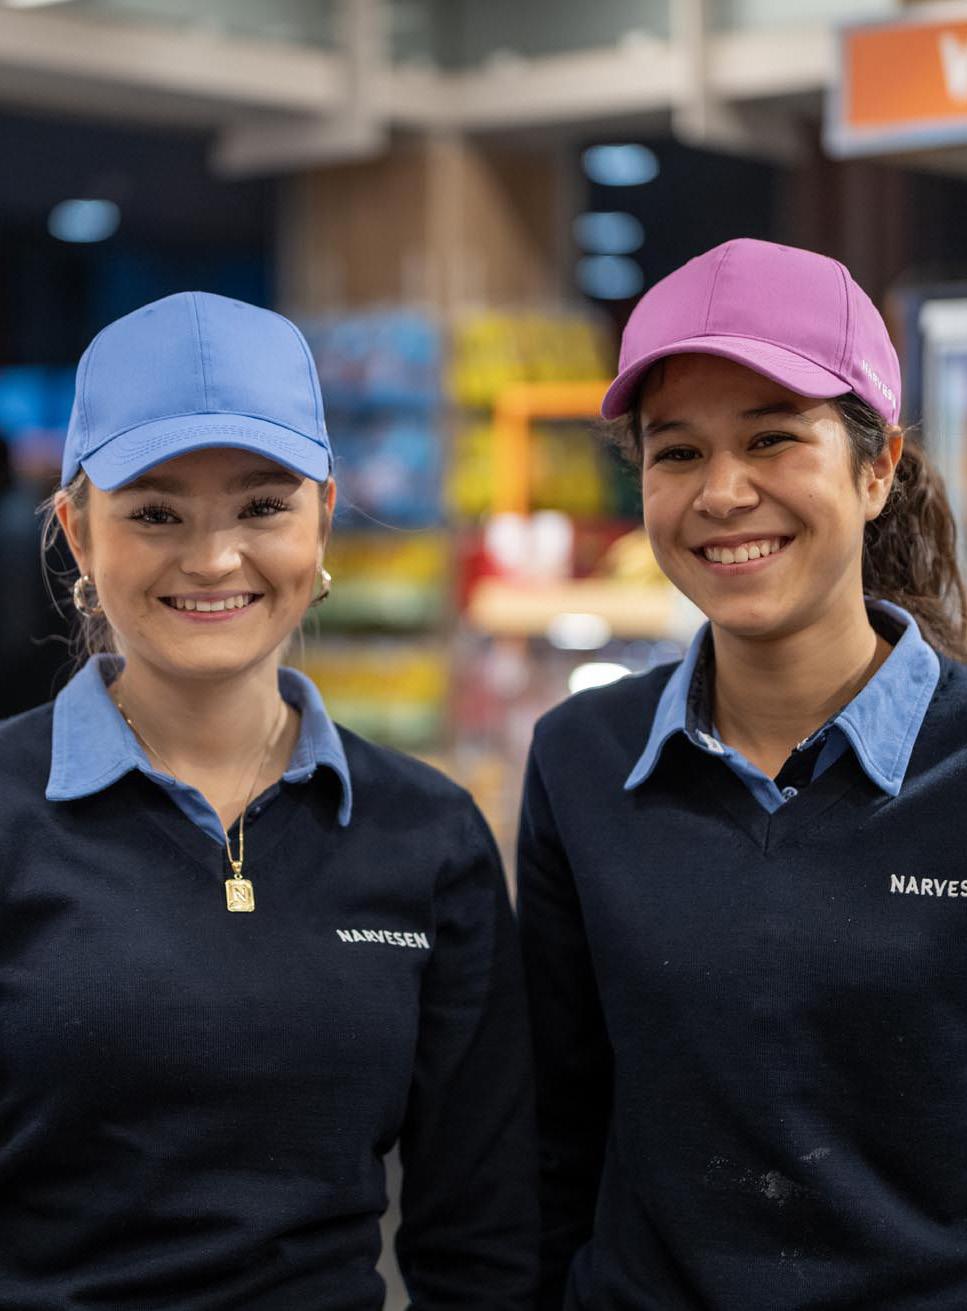
59 58 Our responsibility Our business Corporate governance Financial statements Appendix
2.4 People
Franchisees
TARGET
40 percent representation per gender among new franchisees by 2025.
select sales personnel, as well as encouragement to become franchisees.
Reitan Retail’s 2,000 franchisees are employers that attract talented people from all parts of society, thereby diversifying the workplaces and everyday operations. 36 percent of the franchisees were women, an unchanged proportion compared to 2022. In numbers, there is a decrease in female franchisees in total. In the Baltics, where we have a majority of female franchisees, there has been an increase in male franchisees.
MEET OUR FRANCHISEES
Since the first REMA 1000 store opened in Norway in 1979, our franchise model has been a key success factor. Franchising requires individuals who are driven, passionate about what they do, and have a desire to provide excellent service. We are seeking individuals with that ambition, regardless of background, gender or sexual orientation. Efforts to increase gender equality continue, and we have implemented several initiatives to reach the goal of at least 40 percent of each gender in new franchisees by 2025. In 2023, this included increasing the number of female franchisees and female managers through internal awareness programs, training and annual talent programs for
In 2023, Reitan Retail engaged 275 new franchisees, of which 32 percent were female. Looking at previous years, this is a stable, unbalanced level, suggesting the company has reached a plateau which is difficult to move beyond through business as usual.
By strengthening the company’s culture and providing training programs and value-based leadership, we want to attract highly motivated people who run their own businesses as franchisees. Among other measures to promote diversity and reduce discrimination are minimising physically heavy work and making it possible to manage work and private life in a balanced way.
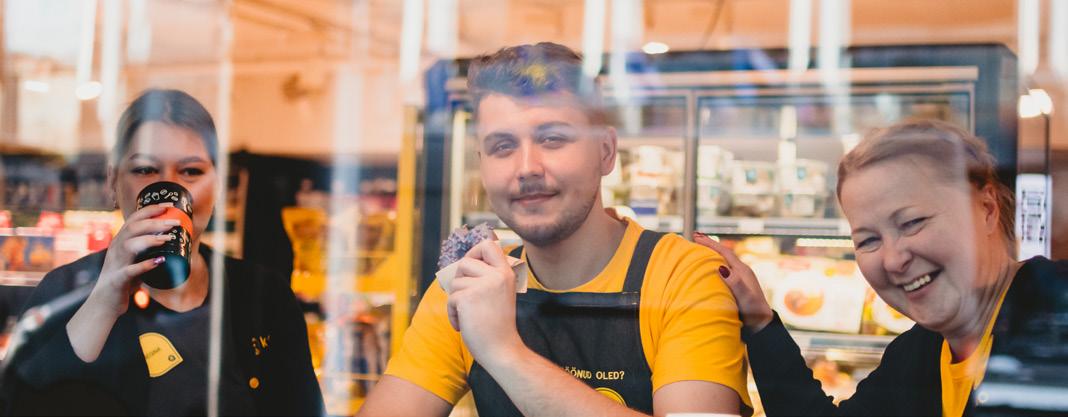
61 60 Our responsibility Our business Corporate governance Financial statements Appendix
GENDER FRANCHISEES, PER COUNTRY 2O23 Norway 25% women and 75% men Sweden 56% women and 44% men Denmark 10% women and 90% men Baltics 82% women and 18% men Finland 68% women and 32% men FRANCHISEES 2023 36% women and 64% men 2023 32% women and 68% men 2022 37% women and 63% men 2022 37% women and 69% men 2021 39% women and 61% men NEW FRANCHISEES AGE FRANCHISEES 2023 13% 63% 24% 19-29 30-49 >50 2.4 People
Managers and management
TARGET
To have at least a 40 percent gender balance for new hires in top and middle management combined by 2025.
We have implemented several initiatives to reach our goal of at least 40 percent representation per gender in new top and middle management hires by 2025. In 2023, this included target gender balance in new hires by ensuring objective and fair recruitment processes and using professional tools such as requirements specifications, thorough assessments, evaluations, interviews, test tools and reference checks. By doing so, we promote equal opportunities for all employees and prevent actions contrary to the Anti-discrimination Act. For the people working with us, we offer flexible working hours, home office solutions and opportunities for parental leave for both genders to promote both women’s and men’s opportunities to balance their careers and family lives.
In Reitan Retail, the total share of females in top and middle management is 40 percent. However, the differences across business areas and countries vary a lot. Looking back, this is a well-known pattern of gender imbalance. In Denmark, we observe the lowest share of female representatives, whereas in the Baltics, the lowest share of male representation is observed. In 2023, Sweden reached a full gender balance in manager and management positions.
In 2023, 46 new top and middle management hires out of 109 were female, equalling 42 percent of all new hires. The number of newly recruited female hires fluctuates significantly between different business areas. In Denmark, the number of managerial positions increased significantly due to organisational changes when the new distribution centre was opened, most of which were filled by male candidates. There is no tendency to show that new hires contribute to a positive gender balance in top and middle management positions in the business areas, and we will work harder in the coming year to ensure systematic and fair recruitment methods.
There are several potential reasons for the current state of affairs, such as access to qualified candidates, operating in traditionally male-dominated industries, and societal norms in the communities in which we operate. Structural issues are a true challenge, but it should not stop the work to make it easier for underrepresented genders to access management positions without compromising on qualifications and abilities. We will investigate these reasons during the coming year to gain deeper insights into inhibiting and promoting factors and use the results in future efforts for equality.
We know that the tone from the top is essential to create a gender-balanced organisation. The Reitan Retail Board of Directors and Corporate Management Board are committed to once and for all balancing the gender gap in our boards in 2024. Today, only 32 percent of the Reitan Retail internal boards have a 40 percent representation of the underrepresented gender. Qualifications and merits will always be the key criteria when evaluating candidates, but out of two equally qualified candidates, the one belonging to the underrepresented gender will be prioritised. The Reitan Retail Corporate Management Board are gender balanced with four women and four men.
In 2023, Reitan Retail initiated extensive work to map the various categories of positions and link them to salary data. This will be used to explore the background of differences in pay between genders and continue striving for equal pay and opportunities for all.
MEET OUR MANAGERS
63 62 Our responsibility Our business Corporate governance Financial statements Appendix
NEW FEMALE MANAGERS AND MANAGEMENT
2023 2023 2023 2023 2023 2023 2023 2023 2022 2022 2022 2022 2022 2022 2022 2022 33% 42% 20% 17% 59% 71% 29% 25% 31% 42% 21% 50% 61% 57% 26% 29% 2.4 People REMA 1000 Norway REMA 1000 Denmark Reitan Convenience Uno-X Mobility REMA 1000 Norway REMA 1000 Denmark Reitan Convenience Uno-X Mobility
FEMALE MANAGERS AND MANAGEMENT
Employee surveys
All companies must have conducted internal employee surveys or use tools that measure how employees experience our diversity work.
Looking ahead, we will continue to conduct internal employee surveys to measure how employees experience our diversity work. The goal is to increase the response rate and ensure that the business areas’ management develops actions for more diversified teams, as well as improve our way of communicating the importance of diversity.
2023 employee survey results
The results from the annual employee survey show that as many as 94 percent of our employees feel they are given significant responsibility. This indicates that value-based management and having confidence in the employees are paying off.

We conduct surveys to measure the perception of our diversity work, and the insights are used to retain and attract great employees. In 2023, we conducted a Great Place to Work survey, and 725 people working in the Norwegian parts of the organisation participated. The participation rate is considered high.
The survey also highlights that employees experience a high degree of fairness regardless of cultural or ethnic affiliation, gender, or sexual orientation.
Another great result is that 85 percent feel their work means something special. A sense of purpose and a feeling of contributing to something bigger
is important to us as people and employees. Furthermore, 90 percent feel they can be themselves at work. This is an important result, as we believe in the individual and want everyone to feel acknowledged and included. The survey results also identified areas for improvement going
forward. We intend to improve cooperation between business areas and bring a sense of “togetherness” throughout our organisation. By looking at the organisational structure, we want to better utilise synergies and work smarter across departments.
91% 97% 94%
«Employees here are treated fairly regardless of cultural or ethnic affiliation»
«Employees here are treated fairly regardless of gender»
90%
«Employees feel they can be themselves at work»
«Employees here are treated fairly regardless of sexual orientation»
65 64 Our responsibility Our business Corporate governance Financial statements Appendix
TARGET
2.4 People
2.5 Value chain

Reitan Retail keeps high moral standards and holds its suppliers accountable to a rigorous ethical Code of Conduct to offer responsibly produced products to its customers.

9,300 suppliers have been risk assessed, accounting for 74 percent of all reported suppliers in our operations.
TARGETS
We want to help prevent deforestation and work to reduce the use of soy in feed and palm oil in the products sold in our companies.
We will integrate the OECD Due Diligence Guidelines for responsible business conduct into our risk management processes. Our ambition is to screen 100 percent of our suppliers based on environmental and social criteria. Reitan Retail has a zero-tolerance approach to any breach of human rights, and we strive to minimise our environmental impact across the value chain.
At Reitan Retail one of eight fundamental business values is “keep high moral standards”.
Global trade and increased production have been essential for helping countries grow and develop, reducing poverty, and making living standards more equal around the world. However, there is an ongoing discussion about companies' responsibility for their production's environmental and social effects.
At Reitan Retail, one of our eight fundamental values is to "keep high moral standards". This entails promoting responsible trade and collaboration across the value chain and contributing to making local communities prosper. We primarily refer to upstream activities in the value chain here, i.e., our suppliers and producers. Read about our work downstream in our value chain together with customers and stakeholders in Chapters 2.1, 2.2, 2.3, and 2.4.
Supply chain transparency allows businesses and consumers to understand how goods are produced and distributed. This includes knowing where and how products are made, the labour practices involved, the journey of products from source to consumer, and any environmental impacts that occur along the way.
Challenges and opportunities
Reitan Retail's global value chain includes over 10,000 producers and suppliers, from large multinational conglomerates to small-scale farmers. Reitan Retail is present in industries with a high risk of violating fundamental human rights, deforestation, overuse of chemicals and water, poor animal welfare and air polluting emissions, including carbon dioxide and leakage of hazardous substances. In addition, agriculture and the food sector are associated with widespread poverty and low wages, leading to a high risk of people being exploited. The complexity of the food industry's value chains and a low degree of regulative requirements for documentation and traceability make it difficult to achieve transparency.
There is a growing global expectation for companies to take full responsibility for impacts on people and the environment in the value chain. In addition to already established global frameworks, national and EU regulations are taking form. We consider this a welcomed and needed push for social and environmental improvement of production and consumption.
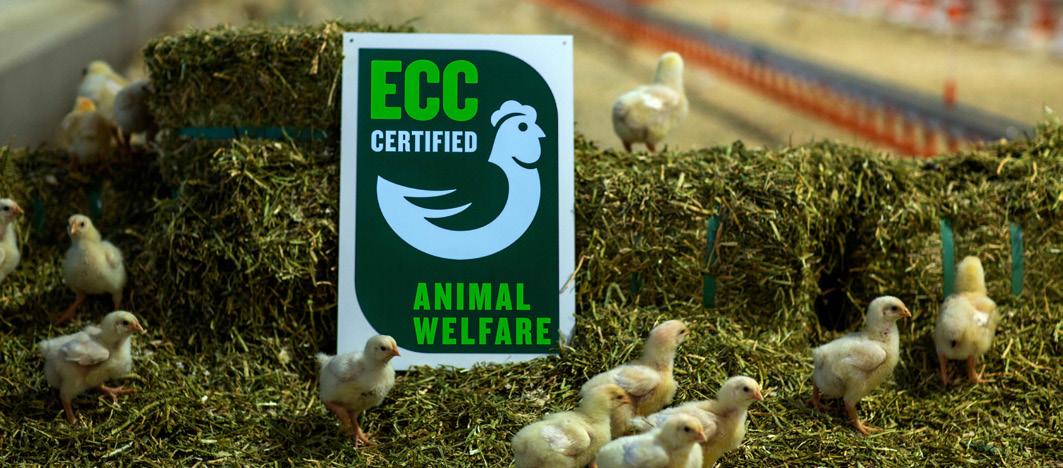
67 Our responsibility Our business Corporate governance Financial statements Appendix
KEY FIGURES About
AMBITION
Responsible sourcing to minimise the negative impact of the value chain
Reitan Retail will integrate the OECD Due Diligence Guidelines for responsible business conduct into the risk management processes and screen 100 percent of our suppliers based on environmental and social criteria. Reitan Retail has a zero-tolerance approach to any breach of human rights and strives to minimise the environmental impact across the value chain.
Sunflower Declaration at the Nobel Peace Conference, a call to action to protect human rights defenders at risk.
Reitan Retail complies with relevant legislation of procurement practices, such as the Norwegian Transparency Act, the EU Deforestation Act, the upcoming EU Due Diligence Directive and the EU Corporate Sustainability Reporting Directive. We work continuously with due diligence in line with the OECD Guidelines for Multinational Enterprises and the UN Guiding Principles on Business and Human Rights that set expectations for preventing and addressing adverse impacts on human rights, the environment and animals. Our Supplier Code of Conduct (SCoC) applies to all our business areas and respective subsidiaries as an overall ethical standard. The business areas develop additional codes, policies and routines for specific purposes.
Reitan Retail and our business areas integrate due diligence in company decision-making, risk management, and responsible procurement. The business areas assess risks related to raw materials, sectors, and production countries. The risk assessment includes parameters such as freedom of association, discrimination, child labour, forced labour, minimum wage, animal welfare, corruption and environmental impact. These assessments provide an overview of the major risks in the supply chain and enable us to prioritise risk-reducing measures.
DUE DILIGENCE PROCESS AND SUPPORTING MEASURES
Communicate how impacts are addressed
As a company that wants to uphold high business ethics, we look beyond our direct impact and seek to take responsibility for the entire supply chain. This entails continuously identifying and assessing negative impacts or harm stemming from operations, supply chain, and business relationships. Our strategic partnership with the Nobel Peace Centre provides us with training and a network in human rights issues. In 2023, we signed the
Risks and identified adverse impacts call for immediate response, and risk performance is monitored at all necessary levels. Monitoring is done through supplier reporting, third-party auditing, site visits, certification schemes and stakeholder engagement. Breaches in the supply chain are handled according to requirements in the specific business areas’ Supplier Code of Conduct, followed up on and reported on.
Identify and assess adverse impacts in operations, supply chains and business relationships
Provide for or cooperate in remediation when appropriate Cease, prevent og mitigate adverse impacts Track implementation and results Embed responsible business conduct into policies and management systems
We are continually increasing our understanding of the supply chain risks and improving risk management in the procurement process. Our Policy on Responsible Procurement will be adopted by the Board of Directors and implemented in 2024. The procurement process is vital to achieving our strategic goals for climate, environment, health and value chain.
Addressing human rights impact
In June, Reitan Retail reported on the Norwegian Transparency Act (the Act) for the first time since it came into force. The Act aims to help companies focus on respecting fundamental human rights and ensuring fair working conditions when making products and offering services. It also aims to make it easier for the public to learn how companies deal with issues that could harm these rights and conditions.
Companies must report any risks in their business and their supply chains. The Act also requires companies to conduct due diligence assessments per the OECD’s Guidelines for Multinational Enterprises. They must openly share what they find from these assessments
and provide information to the public. Among our subsidiaries are companies that individually are covered by the Act and responsible for ensuring compliance in their own operations, but also companies that are included through their affiliation with the Group and whose compliance is ensured by Reitan Retail through due diligence and reporting on a group level.
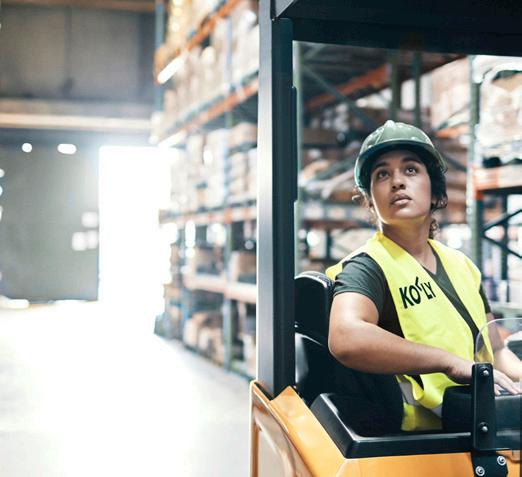
69 68 Our responsibility Our business Corporate governance Financial statements Appendix
2.5 Value chain TARGET
5
3 4 6
1
2
Findings according to the Act:
• About 9,300 suppliers have been risk assessed, accounting for 74 percent of all reported suppliers in our operations.
• There are 1,342 suppliers and production facilities identified as being high or very high risk, primarily within the food/non-food sector, IT hardware and software and manufacturing.
• Reitan Retail companies carried out 29 on-site visits and initiated dialogue to collaborate on ensuring secure and satisfactory working conditions.
• 716 conversations, dialogues, and self-assessments were carried out with suppliers after risk assessments.
• Based on our due diligence efforts, 99 cases required further action. 77 uncovered non-compliance, 19 resulted in improved conditions, and three processes are still ongoing with mitigating actions.
• Two assessments at REMA 1000 Norway led to the termination of supplier contracts.
• 40 information requests regarding the place of origin and due diligence assessments were received via websites and email, and responses were provided within the three-week timeframe to 39 of them.
Read more about the findings in the Appendix, or see more details in our statement according to the Norwegian Transparency Act from 2022 at reitanretail.no. The report for 2023 will be published by June 30, 2024.

Reducing environmental harm
To help prevent deforestation and work to reduce the use of soy in feed and palm oil in the products sold in our companies.
A majority of deforestation is linked to products such as meat, soybeans and palm oil. Today, we have stopped TARGET

Our business areas have worked for supply chain transparency and to prevent deforestation for many years. Enhanced collaboration with suppliers and continued efforts across Reitan Retail are essential to achieve these goals. Innovation is vital to finding science-based solutions to more sustainable food production systems. Reitan Retail has a responsibility to continue making its value chains and sourcing practices more sustainable.
using palm oil in biofuels altogether, and through certifications and collaboration with suppliers, we have worked for more than ten years to reduce the use of palm oil in products sold within our grocery stores and convenience outlets. This year, the Corporate Management Board took a stand against palm oil and the deforestation caused by the production, and we are developing a plan to stop selling all products containing palm oil or palm oil derivatives. Looking ahead, Reitan Retail will continue to collaborate internally and with suppliers on handling risk-prone products such as soy, cocoa and coffee.
Reitan Convenience introduced a new Supplier Code of Conduct with stringent requirements to use certified cocoa, sourcing animal protein locally and being palm oil-free by 2028.
71 70 Our responsibility Our business Corporate governance Financial statements Appendix
2.5 Value chain

Corporate governance
3.1 Letter from the Chair
3.2 Governing bodies
3.3 Risks and risk management
3.4 Governing documents
73 72 Our responsibility Our business Corporate governance Financial statements Appendix
3.1 Letter from the Chair
Reitan Retail made further steps towards more profitable and responsible growth in 2023, strengthening its position as a flagship in Nordic and Baltic retail. Despite economic volatility and a highly competitive landscape, Reitan Retail delivered major strategic transactions, topped by the approval of the landmark acquisition of ALDI’s grocery store network in Denmark.
2023 illustrated the unique REITAN culture, fueled by positive, proactive and resilient franchisees, employees and management committed to putting the customer first while ensuring cost-efficient operations. At Reitan Retail, values and trust-based leadership is the recipe for success, driving 45,000 people towards a joint purpose: to make everyday life a little bit easier and the world a little bit better.
REMA 1000 grew market shares both in Norway and Denmark, while customers returned to Reitan Convenience following the pandemic, and Uno-X Mobility continued its transition from fossil fuel to investments in EV charging. Systemwide sales and revenues rose across all business areas, while cost inflation and one-off effects led to margin pressure.
The Board of Directors has followed up on strategic, financial and sustainability performance while overseeing processes to streamline systems and corporate governance. The Board has been particularly pleased with the focus on return on capital, working capital and adjustments to the real estate organisation with the aim of securing strategic locations as enablers for growth.
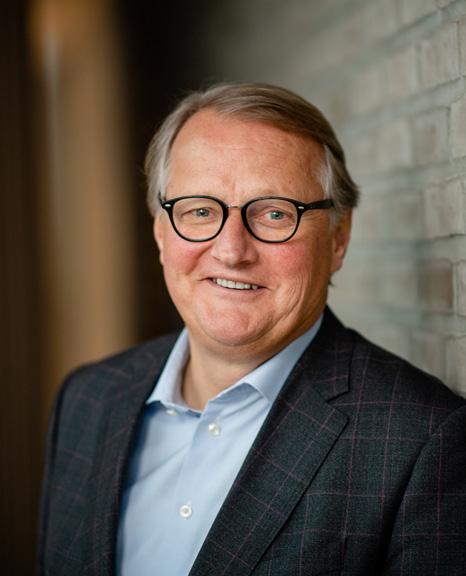
I am also pleased to see progress in the sustainability area, including extensive mapping of climate emissions as a basis for an ambition to halve emissions from all products by 2030 and cut further to net zero by 2050. The company has also set targets to reduce food waste, increase recyclability, ensure transparency and traceability across the value chain, improve gender balance and further strengthen diversity and inclusion.
Based on the philosophy of putting customers first and keeping it simple, Reitan Retail aims to make it easier for customers to make better, healthier and more sustainable choices. This philosophy is the foundation for the roll-out of ultra-fast EV charging, the investments in animal welfare and the offering of healthy and convenient food on the go.
The commercial strength and strategic measures during 2023 lay a solid foundation for further growth. I am optimistic about the future for Reitan Retail and pleased with everyone’s contribution to building a robust, innovative, profitable and responsible retailer for generations to come.
Rune Bjerke Chair of the Board of Directors
3.2 Governing bodies
Reitan Retail AS is a fully owned subsidiary of REITAN AS, which is owned by the Reitan family. Odd Reitan, Ole Robert Reitan, and Magnus Reitan with his family, each own 33.3 percent of the shares in REITAN AS through their individually owned holding companies.
Reitan Convenience and Uno-X Mobility. Each business area is led by an executive vice president and chief executive officer (CEO). In addition, the Group holds a portfolio of retail properties presented as a separate segment, Real Estate, being reported separately to the CFO of Reitan Retail.
Reitan Retail (the Group) is organised with a parent company, Reitan Retail AS, responsible for overall corporate governance. Subsidiaries that are defined as core business areas are referred to as business areas. These are REMA 1000 Norway, REMA 1000 Denmark,
Reitan Retail adheres to REITAN’s philosophy by structuring its operations to minimise the gap between accountability and authority and operational execution. This entails implementing and adhering to routines and internal controls across all organisational areas. These robust routines ensure consistent and ongoing monitoring of the Group’s activities, providing management with the most up-to-date information for decision-making purposes. Learn more about our business in the business overview section, pages 14-19.

75 74 Our responsibility Our business Corporate governance Financial statements Appendix
3.1 Letter from the Chair
Management model
Reitan Retail is led by Chief Executive Officer Ole Robert Reitan (the Group CEO). The Group CEO is responsible for the day-to-day management of Reitan Retail in accordance with applicable legislation and the guidelines, instructions and authorisations given by the Board of Directors of Reitan Retail AS. The Group CEO is also responsible for the Corporate Management Board of Reitan Retail. The Board of Directors oversees the overall management of Reitan Retail AS.
Corporate Management Board
Reitan Retail has a Corporate Management Board, which acts as an advisory management body for the Group CEO and assists and supports the Group CEO in carrying out the day-to-day management and decision-making of Reitan Retail. The Group CEO appoints and determines the composition of the Corporate Management Board. The board of each business area appoints the CEO for the respective business area.
The Corporate Management Board of Reitan Retail consists of the Group CEO Ole Robert Reitan, Executive Vice President (EVP) and Chief Financial Officer (CFO) Kristin S. Genton, EVP and Chief Operating Officer (COO) Monica Ødegaard, EVP and Chief Communications Officer (CCO) Inger Sethov, EVP and CEO of REMA 1000 Norway Christian Hoel (replacing Tom Kristiansen as of January 1, 2024), EVP and CEO of REMA 1000 Denmark Henrik Burkal, EVP and CEO of Reitan Convenience Mariette Kristenson, and EVP and CEO of Uno-X Mobility Vegar Kulset.
The members of the Corporate Management Board have a collective duty to safeguard and promote the
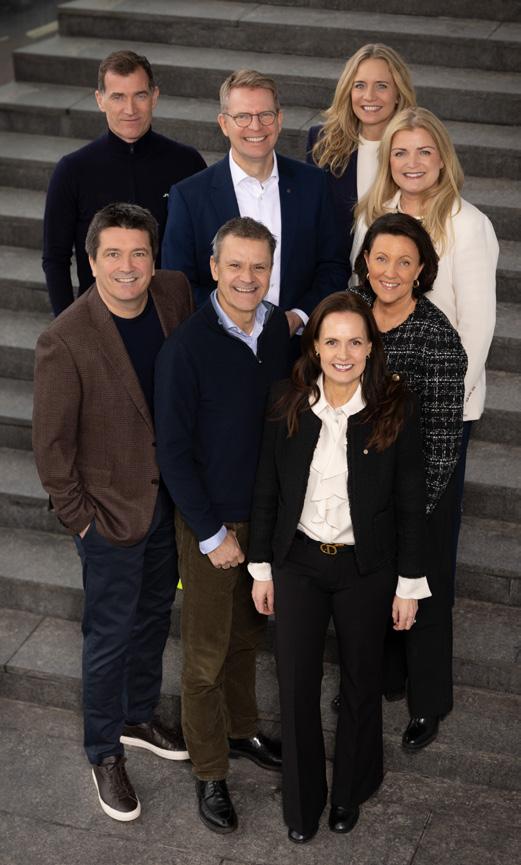
corporate interest of Reitan Retail and to promote Reitan Retail’s strategic, financial and other objectives and targets. In addition, the role of the Corporate Management Board is to:
• Provide support and advice to the Group CEO regarding overall leadership, strategic development and the annual planning and reporting cycle.
• Provide governance and strategic support to the Business Areas in respect of finance, accounting, tax, sustainability, HR, compliance, communication and investor relations.
• Ensure that Reitan Retail is properly organised and that adequate steering, risk management and control systems are in place to provide a sufficient basis for an overview of risk exposures and compliance with applicable laws and regulations.
Board of Directors
In accordance with Norwegian law, the Board of Directors in Reitan Retail (the Group) assumes the overall governance of Reitan Retail, ensures that appropriate management and control systems are in place and supervises the day-to-day management as carried out by the Group CEO.
The Board of Directors in Reitan Retail currently holds three members, with plans to complement the Board in due time. The planned expansion will aim to reflect diversity in competence, age, gender and background.
The tasks and responsibilities of the Board of Directors at Reitan Retail are laid down in the “Board of Directors rules of procedure”. This document governs the work and procedures of the Board of Directors of Reitan Retail AS within the framework of the applicable laws, rules and regulations. It is stated in the “Board of Directors rules of procedure” that the Board shall ensure that the activities of Reitan Retail are properly organised, approve plans, keep itself informed about the Group’s financial position and shall be obliged to ensure that the operations, accounts and asset management are subject to adequate control. The Board may also issue guidelines for the activities of the Group.
The Board shall, on an annual basis, evaluate the content and the need for any amendments to these Rules of Procedure as part of the Board’s review of governance documents.
As a part of its management of Reitan Retail’s activities, the Board shall approve the overall organisation of the Group, including determining, in collaboration with the CEO, the overall strategy for Reitan Retail.
On a general basis, the Board shall ensure that Reitan Retail has sound internal control and systems for risk management that are appropriate for the extent
and nature of the Group’s activities. The Board shall also ensure that the Group uses proper and effective management and control systems, including systems for risk management, that continuously provide a satisfactory overview of the Group’s risk exposure. In addition, The Board shall ensure that the control functions work as intended and that the necessary measures are taken to reduce extraordinary risk exposure. The Board shall also ensure that satisfactory routines are in place to ensure follow-up and compliance with principles and guidelines laid down by the Board in relation to ethical behaviour, compliance, including in respect of anti-corruption, health, safety and working environment, and social responsibility.
With regards to external auditing, the Board shall ensure that Reitan Retail has a proper auditing system that is appropriate to the extent and nature of the Group’s activities. The external auditor shall, at least once a year, present to the Board a review of the Group’s internal control procedures, including identified weaknesses and proposals for improvement.
The Board shall approve and implement measures to ensure that the Group’s financial position is satisfactory, undertake periodical reviews of results compared with financial plans, investment frameworks and adopted target figures and approve periodic accounts.
The Board shall also determine the overriding strategy and the financial targets for the Group, in collaboration with the CEO, and approve the Group’s investment frameworks and financial plans as prepared by the Group CEO.
A proposal for an annual plan for the Board’s work should be prepared by the Group CEO, in consultation with the Chair of the board, at the end of each year. The plan should state how and at what time the Board
77 76 Our responsibility Our business Corporate governance Financial statements Appendix
3.2 Governing bodies
will carry out its functions pursuant to the Rules of Procedure and applicable legislation, with particular emphasis on objectives, strategy and implementation.
The Board shall, as a minimum, meet four times per year and otherwise as often as the Group’s operations require or when any Board member or the Group CEO so demands. The Group CEO shall prepare matters to be considered by the Board, in consultation with the Chair. A matter shall be prepared and presented in such a way that the Board has an adequate decision-making basis, including recommended decisions.
In 2023, a total of six Board meetings were held in accordance with the annual Board meeting plan, and five extraordinary meetings. A total of 53 items were dealt with by the Board.

Eilert Giertsen Hanoa (b. 1970), member of the Board
Education: Economics from BI Business School, Oslo.
Former experience: He started his first IT company as a 15-year-old. He founded and led Mamut until the company became part of Visma in 2011, where he was head of Visma SMB until 2018.
Current assignments: CEO of the global learning platform company Kahoot. Hanoa has a true passion and understanding of entrepreneurship.
Competences: Large scale leadership and Corporate management, Finance, Digitalisation, Sustainability, Business strategy.

Rune Bjerke (b. 1960), Chair of the Board
Education: Social economics from the University of Oslo and a master’s degree (MPA) from Harvard University.
Former experience: Finance counsellor in Oslo and business leader, most recently as CEO of DNB from 2007-2019.
Current assignments: Chair of the board of Wallenius Wilhelmsen and Deputy Chair of the boards of Norsk Hydro and Schibsted.
Competences: Digitalisation, Innovation, IT and cybersecurity, Financial Investor and capital market relationships.

Magnus Reitan (b. 1975), member of the Board
Education: Economics from NHH Norwegian School of Economics, Bergen, and BI Business School, Oslo.
Former experience: CEO, Reitan Convenience, CFO, Reitangruppen.
Current assignments: CEO of Reitan Kapital.
Competences: Financial, Risk management, Merger and acquisitions, Strategy.
3.3 Risks and risk management
Reitan Retail is a leading retail company, operating in the discount grocery, convenience and mobility sector across seven countries, and our operation is exposed to ordinary financial, operational and sustainability risks related to these types of activities.
The risk picture is complex with several risks interlinked by underlying factors. Mitigating the risks requires a comprehensive set of mitigating actions. Several of our risks affect our global value chains. Although we, in later years, have come a long way to improve
transparency, further improving transparency remains a key focus moving forward.
Identifying and managing risks is an integral part of strategic planning as well as of the control and management of the business. Risk management and internal controls are given high priority by the Board of Directors, and they are responsible for ensuring that the necessary and adequate systems are in place. Furthermore, Reitan Retail’s management is responsible for establishing and maintaining sufficient internal controls.
Our most prominent risks and mitigating actions are described below.

79 78 Our responsibility Our business Corporate governance Financial statements Appendix
Reitan Retail operates in a competitive and dynamic market that requires presence in customers’ everyday lives, relevant concepts, as well as flexible and agile people and franchisees to meet customers’ needs.
Cyber security risks
The general trend shows an increasing frequency of large cyber attacks that are more advanced and more difficult to detect and predict. Socially critical sectors such as food and mobility are vulnerable targets.
To mitigate this risk, we have a continuous focus on training employees, ensuring necessary security systems are installed and up to date and continually monitoring systems and services.
Market risks
Although inflation rates came down during 2023, they are still generally above target levels and are putting continued pressure on household economies and businesses alike. Our operation in the discount grocery, convenience and mobility industries experience higher costs for the majority of our input factors. This, in combination with a highly competitive market, makes it challenging to adjust prices accordingly. This risk is mitigated through a strict focus on costs and efficiency. Historically, Reitan Retail has shown resilience throughout inflationary cycles due to strong operational efficiencies and benefits of scale.
Reitan Retail operates in a competitive and dynamic market that requires presence in customers’ everyday lives, relevant concepts, as well as flexible and agile people and franchisees to meet customers’ needs. To stay up to date on trends and developments, the market is constantly monitored, e.g. through consumer surveys, which, together with other analyses, form the basis of our strategy.
Risks related to geopolitical situations and climate changes
To serve our ultimate boss, our customers, we depend upon reliable value chains and a continuous supply of goods and raw materials, such as food and electricity. Geopolitical issues, in combination with climate change, impose a risk of disruption to these value chains, with the war in Ukraine along with extreme weather such as drought and floods being recent examples. This risk is expected to increase moving forward. A related risk is that when resources are scarce, the risks of corruption, food fraud and exploitation of human and environmental resources increase.
To mitigate this risk, we work with our suppliers and partners through collaboration and dialogue and diversify our supplier portfolio for critical risk raw materials. Due diligence assessments in procurement are important tools that enable us to identify regions, industries or suppliers that represent higher risks. The principles for conducting the assessments and the assessment criteria are outlined in our common Responsible Procurement policy. To better understand the impacts of climate change on our operations, we revised our TCFD (Task Force on Climate-related Financial Disclosures) report in 2023. See more in chapters 2 and 3, or read the full TCFD report here. Our Responsible Procurement policy is accessible at www.reitanretail.no
Risk of injury or harm to people or the environment
With 45,000 people working within Reitan Retail, there is a risk of them getting injured or, in extreme cases, facing fatalities. With 3,500 sales outlets across seven countries, there is also a risk of inflicting harm to the surrounding environment.
At Reitan Retail, people are our most precious resource, and we strive to create a safe working environment. Comprehensive health, safety and environment (HSE) systems are implemented in all parts of our operations and are subject to regular maintenance and inspections.
Risk
of not having the right people
Our industries are subject to rapid changes in terms of digitisation and efficiency. These changes pose new
challenges for people and create a need for new and different competencies moving forward. As an example, the franchisees of tomorrow will require a new and different set of competencies to those of today.
In Reitan Retail, the people are our most precious resource, and we strive for a safe
working environment.
At Reitan Retail, we focus on recruiting, developing and retaining the right people with the relevant competencies. In the recruitment process, requirement specifications are prepared for each position, which, together with thorough evaluations, interviews and test tools, ensure we find the best-qualified candidates. We run several skill development courses and programs for our employees and people, and through individual employee interviews, we identify and define career goals and corresponding development plans. The company also promotes internal career development, and vacancies are first advertised internally. Succession planning is a tool used to ensure and preserve competence, diversity, and gender equality within the company.
81 80 Our responsibility Our business Corporate governance Financial statements Appendix 3.3 Risks and risk management

Regulatory risks
Our operations may be affected by forthcoming new and amended laws and regulations, such as packaging, reporting, transparency, marketing, pricing and cybersecurity.
To ensure we always comply with current laws and regulations, we are monitoring the law amendment processes to be prepared and ready when the changes apply. We plan ahead to ensure we have the necessary systems and resources in place to meet forthcoming regulations. We also take an active role as a constructive dialogue partner for authorities and policymakers on local, national and European levels.
Financial risks
Reitan Retail is exposed to financial risks in the form of currency risk, interest rate risk, credit risk, liquidity
risk, risk related to financing and capital structure and inflation risk.
This is mitigated by following established strategies and guidelines for managing financial market risk.
Reitan Retail’s ambition regarding financing and capital structure is referred to in our value principle no. 3: “We aim to be debt-free”. This value principle should be read as a guidance and target to have a robust financial position, with a capital structure allowing us to balance risk and flexibility to act on opportunities. The Group has a solid balance and significant liquidity reserves, including undrawn borrowing facilities, providing the Group with the strength and capacity to handle unforeseen operational challenges and market fluctuations.
Financial risks are covered in more detail in Note 3 in the consolidated financial statements.
3.4 Governing documents
Governing documents
Reitan Retail follows a set of governance documents providing a foundation for sound operations and decentralised decision-making.
Reitan Retail’s global governance documents set out mandatory requirements for Reitan Retail AS and all Reitan Retail companies and employees.
Local governance documents set out mandatory requirements within a specified entity, business area, organisational unit, or geographical area.
The most central governance document for Reitan Retail is the Code of Conduct, which is aligned with our values and mandatory for everyone who works on behalf of Reitan Retail and our subsidiaries.
Compliance with the Code of Conduct is followed up by the Corporate Management Board, and the Board of Directors follows up on deviations from the code. All employees can report any deviations from the Code of Conduct using the whistleblowing function.
Read more about our governance documents on our website
Sustainability governance
The highest-level management position responsible for sustainability-related issues is the Group CEO, and the Corporate Management Board has a collective responsibility to deliver upon the sustainability goals for Reitan Retail.
Responsibility and sustainable business development are part of strategic business planning that is decided and followed up by both the Corporate Management Board and the Board of Directors. Follow-up and analysis of how the business develops take place at different levels and with different frequencies. The Board of Directors reviews the status of the sustainability group targets and follows up on progress and governance on a regular basis.
Regular status meetings and quarterly sustainability forums are held with sustainability managers in the business areas together with the group head of sustainability, group ESG controller and other relevant contributors. These forums represent arenas for sharing knowledge and best practices, as well as collaborating across business areas and geographical borders. In addition, the forums provide guidance on policy orientation and annual strategy activities in the respective business areas to the Corporate Management Board and the Board of Directors.
Responsibility and sustainable business development are part of strategic business planning that is decided and followed up by both the Corporate Management Team and the Board of Directors.
83 82 Our responsibility Our business Corporate governance Financial statements Appendix
Financial statements
4.1 Board of Directors’ report
4.2 Consolidated financial statements
4.3 Parent company financial statements
4.4 Auditor’s report
85 84 Our responsibility Our business Corporate governance Financial statements Appendix
4.1 Board of Directors’ report
About Reitan Retail
Reitan Retail is a leading retail company in the Nordic and Baltic region with operations in discount grocery, convenience and mobility across seven countries. Reitan Retail’s operating model is based on a unique franchise model, the Reitan Format Franchise Model.
The core business is within retail operations, including REMA 1000 Norway, REMA 1000 Denmark, Reitan Convenience and Uno-X Mobility, in addition to a real estate portfolio that supports the core business.
REMA 1000 is a Norwegian pioneer in franchise-based retailing. As the inventor of discount grocery in Norway, REMA 1000 Norway has contributed significantly to the maturity of the discount segment in Norway. Over the past 40 years, REMA 1000 Norway has accomplished steady growth in systemwide sales, number of sales outlets and market share.
Based on the same franchise model, REMA 1000 Denmark is a fast-growing discount grocer, ranked among Denmark’s strongest and most sustainable brands.
Reitan Convenience is a leader in operating franchisebased convenience stores and ranks number one in most markets in the Nordic and Baltic regions, operating a range of well-known kiosks and convenience brands.
Uno-X Mobility has a leading mobility platform in Norway and Denmark, with operations in liquid fuels,
ultrafast EV charging and Nordic Swan ecolabelled car wash. Its mission is to develop and promote solutions for sustainable mobility.
The real estate business operates a portfolio with the aim of meeting Reitan Retail’s long-term need for properties in the right locations and catering for further growth.
At the end of 2023, Reitan Retail spanned 3,639 sales outlets, of which 2,269 were operated by franchisees, 443 by dealers and commission-based retailers and 907 by Reitan Retail. Reitan Retail and our franchisees together employed around 45,000 people in seven countries. Based on strong values, efficient operations and local ownership, we aim to create the best customer experiences in people’s everyday lives and contribute to a more sustainable future. Our unique franchise model is at the heart of our business, and the customer is our ultimate boss. Our ambition is to take a leading sustainability position by making it easier to make good choices – at home and on the go. We share strong values and a common purpose: to make everyday life a little bit easier and the world a little bit better.
Reitan Retail AS is a wholly owned subsidiary of REITAN AS. From 1 January 2021, all retail activity in REITAN was combined in one company, Reitan Retail. A more coordinated retail company will ensure that REMA 1000 can offer even lower prices, that the convenience stores can offer an even better selection of food, drinks and other products to people on the go, and that Uno-X Mobility can strengthen its position as the most efficient and uncomplicated player in liquid fuel, ultrafast EV charging and Nordic Swan ecolabelled car wash.
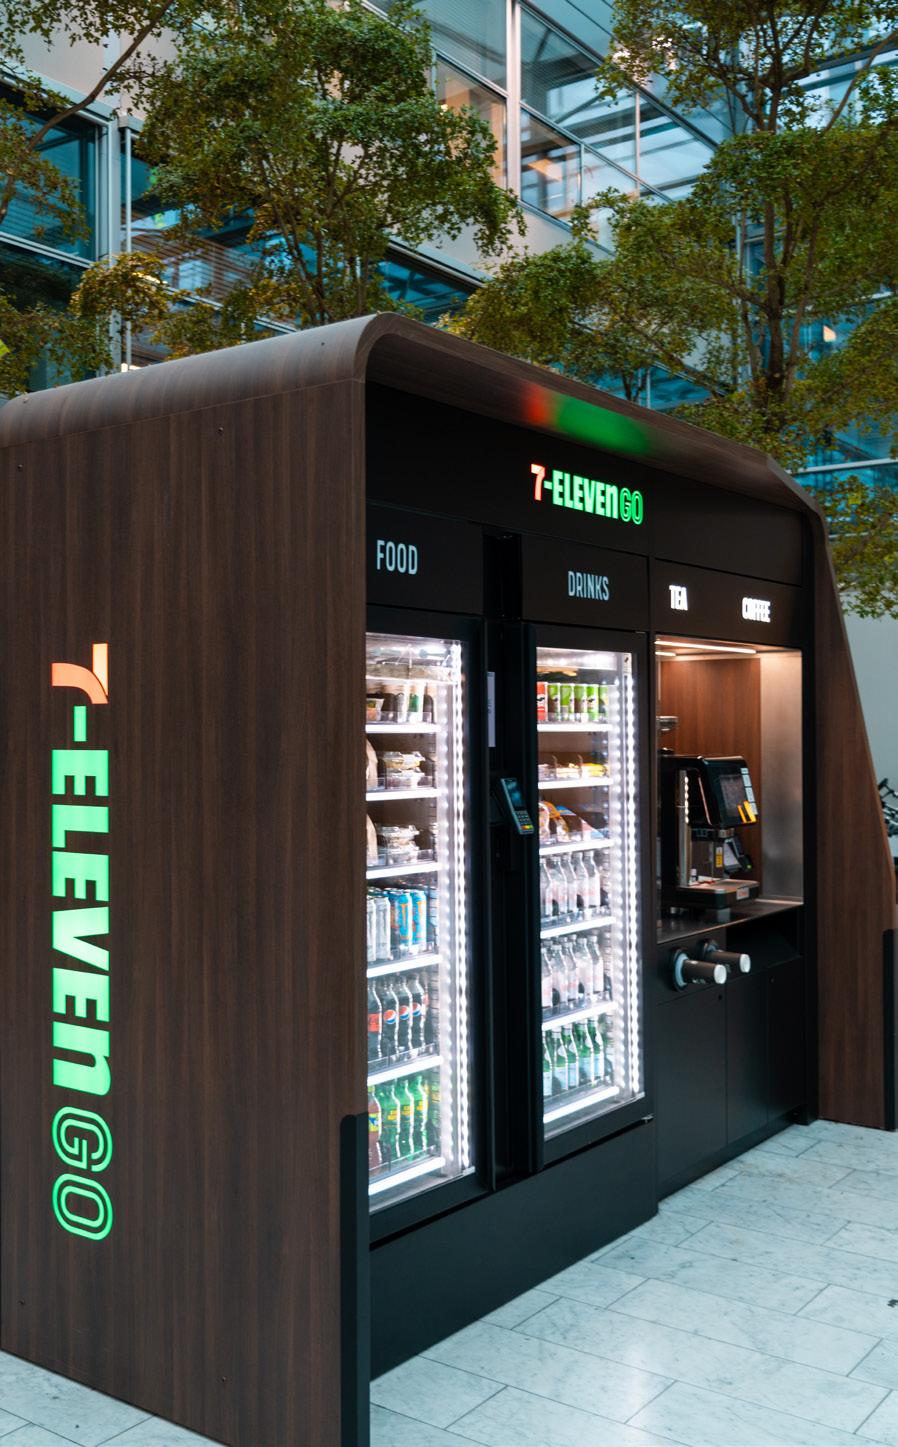
Reitan Retail’s strategy, together with its franchisees, is to create profitable and sustainable growth. To create value in the years to come, we will strengthen our core, expand our business and position for the future through the following six strategic measures:
Strengthen our culture and develop our franchise system
Strengthen competitiveness through lower costs and better terms
Establish new sales outlets and renew existing portfolio to boost average systemwide sales
Strengthen and renew formats to meet growing customer needs
Strengthen and renew the digital customer experience
Take a leading position in sustainability by making good choices easier
87 86 Our responsibility Our business Corporate governance Financial statements Appendix
4.1 Board of Directors’ report
Franchise – our main competitive advantage
The Reitan Format Franchise Model has been the heart and key driver of the successful development since the first REMA 1000 store opened in Norway in 1979. Reitan Retail was the first grocery company in Norway to implement franchising and streamlined this model of operation through REMA 1000. REMA 1000 is the only purely franchise-based grocery player in the Nordics. Franchise is also the main operating model for Reitan Convenience.
The franchise model is a win-win partnership, enabling us to benefit from large-scale economies as well as agile and small-scale economies due to a decentralised decision-making structure with aligned performance incentives for the franchisor and franchisees.
Franchising represents a close collaboration between two independent parties, the franchisor and the franchisee. Franchising is about striking a balance between the freedom to make individual choices and the obligation to follow defined systems operations. The franchisee is self-employed but must adhere to the concept and philosophy established by the franchisor.
For more information about our Reitan Format Franchise Model, see Chapter 1.3
The Reitan values
Reitan Retail is a value-driven company.
Our values are the foundation for making customers, employees and partners feel valuable, creating long-term financial value and conducting our activities with integrity.
We have eight values that define and guide us:
1. We stick to our business model
2. We keep high moral standards
3. We are committed to be debt-free
4. We encourage a winning culture
5. We are positive and proactive
6. We talk with each other, not about each other
7. The customer is our ultimate boss
8. We work for fun and profit
Our values describe what we believe is worth striving for. These values are our internal compass, guiding our mindset and decisions. Clearly defined values are the basis for a strong culture.
For more information about our Values, see Chapter 1.3.
Financial position of the Group
Reitan Retail’s (the Group) financial statements are prepared in accordance with IFRS® Accounting Standards as issued by the International Accounting Standards Board (IASB) and endorsed by the EU, effective from December 31, 2023.
In the view of the Board of Directors, the Group has a solid financial position. In accordance with Section 3-3a of the Norwegian Accounting Act, the Board confirms that the prerequisites for the going-concern assumption exist and that the financial statements have been prepared based on a going-concern basis.
The Group’s result and financial position are affected by uncertainty, especially related to accounting estimates when determining the impairment of nonfinancial assets and incremental borrowing rate to measure lease liabilities and contingent liabilities.
Profit or loss
The Group’s revenue in 2023 was NOK 104,322 million, an increase from NOK 94,367 million in 2022, which corresponds to a growth of 8.1 percent in 2023 and 6.7 percent in 2022. Growth in revenue is calculated using a constant foreign exchange rate; please see the section Performance measures and definitions for further details and reconciliation. Operating profit before amortisation, depreciation and impairment
(EBITDA) was NOK 8,638 million in 2023, compared with NOK 8,262 million in 2022. Operating profit was NOK 3,087 million in 2023, compared with NOK 3,597 million in 2022. Reitan Retail delivered solid growth in revenues in grocery and convenience, while broad-based cost inflation and one-off effects led to margin pressure and a reduction in operating profit compared with last year. Development in key figures for the Group’s segments is discussed in more detail below.
Net financial items in 2023 amounted to NOK -1,233 million, compared with NOK -1,141 million in 2022. Net interest expenses in 2023 amounted to NOK 1,173 million and NOK 960 million in 2022. Net interest expenses include interest expenses on lease liabilities, with NOK 935 million in 2023 and NOK 811 million in 2022. Net losses on financial investments amounted to NOK 94 million in 2023 compared with NOK 246 million in 2022 and include unrealised losses on financial investments of NOK 42 million in 2023 compared with an unrealised loss of NOK 249 million in 2022. Net other financial items amounted to NOK 34 million in 2023 and NOK 65 million in 2022. Net other financial items include mainly unrealised currency gains on financing activities, with NOK 37 million in 2023 and NOK 65 million in 2022.
Profit before taxes amounted to NOK 1,854 million and NOK 2,456 million in 2022. The Group’s profit for the year was NOK 1,409 million in 2023, compared with NOK 1,845 million in 2022.
104,322 million in revenue in 2023
Net other comprehensive income for the year, net of tax, was NOK 383 million compared with NOK 286 million in 2022, of which foreign currency translation effects amounted to a gain of NOK 389 million in 2023 and NOK 304 million in 2022. Total comprehensive income, net of tax, in 2023 amounted to NOK 1,792 million compared with NOK 2,131 million in 2022.
89 88 Our responsibility Our business Corporate governance Financial statements Appendix
Profit for the year attributable to: 2023 2022 Equity holders of the parent 1,395 1,831 Non-controlling interests 14 14 Comprehensive income
Comprehensive income attributable to: 2023 2022 Equity holders of the parent 1,777 2,116 Non-controlling interests 15 15
4.1 Board of Directors’ report
Cash flow and investments
Cash flow from operating activities (before interest and income tax) in 2023 amounted to NOK 8,571 million, compared with NOK 5,846 million in 2022. The difference is largely due to 2022 being negatively impacted by a significant increase in working capital elements (change in inventories, change in trade and other receivables and change in trade and other payables). Cash flow from operating activities differs from Operating profit before amortisation, depreciation and impairments (EBITDA) in the statement of profit or loss as EBITDA includes net gains (losses), share of profit of associates, and working capital elements as mentioned above.
Net cash flow from investing activities in 2023 amounted to NOK -1,274 million, compared with NOK -2,045 million in 2022. The Group invested a total of NOK 3,043 million in intangible assets, investment property and property, plant and equipment in 2023 compared with NOK 3,042 million in 2022. Of total investments in investment property and property, plant and equipment, NOK 653 million relates to real estate investments in 2023 and NOK 915 million in 2022. Proceeds from the sale of intangible assets, investment property and property, plant and equipment amounted to NOK 1,239 million in 2023 and NOK 899 million in 2022, of which NOK 1,120 million relates to real estate in 2023 compared with NOK 793 million in 2022. Net proceeds of associated companies amounted to NOK 121 million in 2023, compared with a net purchase of NOK 51 million in 2022. Dividends received from financial investments and associates in 2023 amounted to NOK 60 million and NOK 72 million in 2022.
Net cash flow from financing activities amounted to NOK -5,669 million in 2023, compared with NOK -2,608 million in 2022. A dividend of NOK 2,740 million was paid in 2023, of which NOK 1,494 million stems from settlement of the Real Estate transaction described below (see section Our Segments Performance). In 2022, the paid dividend amounted to NOK 250 million. The Group’s ability to finance its own investments is considered good.
Balance and liquidity
As of December 31, 2023, total assets amounted to NOK 60,096 million compared with NOK 57,529 million as of December 31, 2022.
Cash and cash equivalents as of December 31, 2023, amounted to NOK 1,556 million compared with NOK 1,220 million as of December 31, 2023. In 2023, NOK 124 million relates to restricted cash, as described in note 21 in the consolidated financial statements. As of December 31, 2023, undrawn borrowing facilities amounted to NOK 5,557 million compared with NOK 6,353 million as of December 31, 2022.
By the end of 2023, total equity amounted to NOK 13,280 million compared with NOK 14,096 million as of 31 December 2022. This is equal to an equity ratio of 22.1 percent as of 31 December 2023 and 24.5 percent as of 31 December 2022.
Geopolitical tensions and macroeconomic uncertainties
The global geopolitical situation remains uncertain. Russia’s invasion of Ukraine and the Israel-Hamas war are having a devastating impact on human life, in addition to causing disruption and uncertainty around global economic prospects and increasing security risks in Europe.
Our people quickly mobilised and adapted to the new situation that arose following Russia’s invasion of Ukraine on February 24, 2022. As always, our top priority is the safety and security of our people, especially employees and franchisees in Finland and the Baltic countries, where uncertainty is particularly high due to the proximity to the war.
Reitan Retail does not have people, assets or operations in Russia or Ukraine and hence is not directly affected by the invasion of Ukraine, and the share of direct purchases from Ukraine is very low in Reitan Retail’s supply chain.
Reitan Retail immediately performed an assessment of the direct and potential impact of the Israel-Hamas war. Reitan Retail do not have people, assets or operations in Israel or Gaza, and the share of direct purchases from Israel is very low in Reitan Retail’s supply chain. We follow the current laws and regulations in Norway and the EU regarding trade in goods and services from all countries. Our policy is to follow the current sanctions lists issued by relevant authorities in the countries where we operate.
Inflation, social unrest and geopolitical uncertainty continue to pressure the grocery retail, convenience and mobility industry and consumers, contributing to higher costs for the majority of our input factors. Inflation rates came down during 2023 but are generally still above various countries’ target levels and are putting continued upward pressures on costs. High levels of inflation and pressure on the household economy are also strengthening the consumer trend towards value for money and discount options.
From March 2022 and onwards, we have seen a normalisation of customer mobility patterns following the Covid-19 pandemic. 2023 was the first full year with no direct impact from Covid-19-induced mobility restrictions and lockdown measures, after significant impact in 2020 and 2021 as well as the first two months of 2022.
Statement of objections from the Norwegian competition authority
On December 15, 2020, The Norwegian Competition Authority sent a statement of objections to REMA 1000 and other grocery chains in Norway related to the chains’ use of “price hunters”. In January 2024, the Norwegian Competition Authority informed that it had dropped the accusations relating to a restriction of competition by object so that the notified fine of NOK 7,371 million no longer applies. The Norwegian Competition Authority further informed that it is still working on the part of the case related to
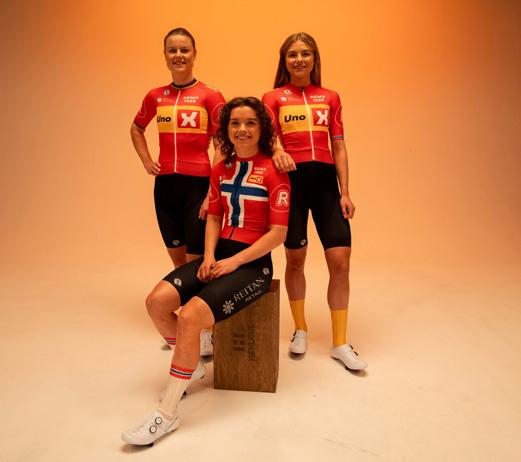
the restriction of competition by effect. On April 10, 2024, the Norwegian Competition Authority issued a supplementary statement of objections in which it notified a fine of NOK 1,333 million to REMA 1000 and REITAN AS in the event that it should find that there is an infringement which has as its effect the restriction of competition. The Group considers it not likely to be any liability. For further information, see Note 35 in the consolidated financial statements.
Our segments’ performance
The key figures for the Group’s business areas consist of both IFRS measures and alternative performance measures (APMs). The following APMs are referred to in the next sections: Systemwide sales, growth in systemwide sales, like-for-like growth in systemwide sales, total systemwide and distribution sales, and growth in revenue. In addition, the Group closely monitors the non-financial performance measure number of sales outlets. See the section Performance measures and definitions for further details on all of the Group’s APMs and non-financial performance measures.
Systemwide sales represents sales in all sales outlets under the Group’s concepts and banners, whether operated by the franchisees, Reitan Retail, dealers or commission-based retailers.
Total systemwide and distribution sales consists of systemwide sales and distribution sales. Distribution sales is the Group’s sale of goods to other external customers not included in systemwide sales.
To exclude the impact of foreign currency translation, growth in systemwide sales, like-for-like growth in systemwide sales and growth in revenue are measured in local and constant currency rates.
Sales from franchise-operated sales outlets are reported by the franchisees and represent their revenues from sales at franchise-operated sales outlets. Sales from franchise-operated sales outlets are not recorded as revenue by Reitan Retail and are
91 90 Our responsibility Our business Corporate governance Financial statements Appendix
4.1 Board of Directors’ report
not included in the Group’s consolidated financial statements. However, the Group’s revenue from the sale of franchise services is computed based on the sales made by the franchisees, and, as a result, sales from franchise-operated sales outlets have a direct effect on the Group’s revenue from the sale of franchise services and profitability. The systemwide sales measure allows management to assess changes in the Group’s overall system performance, the health of our concepts and brands, the financial health of the franchisee base and the strength of our market position relative to our competitors.
Sales outlets include all stores and mobility locations under the Group’s concepts and banners, whether operated by franchisees, Reitan Retail, dealers or commission-based retailers.
REMA 1000 Norway
Systemwide sales in 2023 were NOK 51,280 million and NOK 47,401 million in 2022, corresponding to a growth of 8.2 percent in 2023 and -0.5 percent in 2022. Like-for-like growth in systemwide sales was 7.5 percent in 2023 and -1.7 percent in 2022. Total systemwide and distribution sales in 2023 were NOK 56,395 million compared with NOK 51,990 million in 2022. Both systemwide sales and total systemwide and distribution sales in 2023 were impacted by high levels of inflation. High inflation and pressure on the household economy have led to an increasing trend of customers seeking value for money and discount options, contributing to REMA 1000 Norway increasing its market share in the Norwegian grocery market by 0.3 percent. Up from 23.5 percent in 2022 to 23.8 percent in 2023 (total traditional grocery market from Nielsen IQ, Dagligvarerapporten 2024, and internal data). The number of sales outlets at year-end 2023 was 674, up from 668 at year-end 2022.
REMA 1000 Norway’s revenue in 2023 was NOK 38,276 million, compared with NOK 34,986 million in 2022, corresponding to a growth of 9.4 percent in 2023 and 0.6 percent in 2022. This reflects the similar development as for systemwide sales and distribution sales, leading to higher revenue from the sale of franchise services and revenues from the sale of goods compared with 2022.
In addition, increased volumes and new customers from Kolly in the HoReCa (Hotels, Restaurants, Catering) market contributed positively in 2023. Operating profit before amortisation, depreciation and impairment (EBITDA) was NOK 4,092 million in 2023, compared with NOK 3,840 million in 2022. Operating profit was NOK 1,769 million in 2023, compared with NOK 1,699 million in 2022. The results in 2023 are slightly higher than the previous year, mainly due to improved performance at the Norsk Kylling plant as well as increased franchisee fees due to increased systemwide sales. This was partly offset by general cost inflation and fierce price competition in the Norwegian grocery market.
Continuous development of the REMA 1000 concept through assortment, digitalisation and simplification will contribute to an improved shopping experience for customers and increased efficiency throughout the entire value chain. Establishing new stores in attractive locations is also a strategic priority.
The close collaboration with fully and partially owned and exclusive suppliers will be further developed through REMA Industrier, and we expect further improved operations at Norsk Kylling following significant improvements during 2023. This will help ensure that we deliver high-quality and sustainable poultry at low prices to our customers.
In addition, we will continue developing our HoReCa business through Kolly, with the aim of recruiting more customers and increasing volume.
REMA 1000 Denmark
Systemwide sales in 2023 amounted to NOK 35,207 million and NOK 28,301 million in 2022, corresponding to a growth of 10.2 percent in 2023 and 10.4 percent in 2022. Like-for-like growth in systemwide sales was 8.8 percent in 2023 and 9.5 percent in 2022. Total systemwide and distribution sales in 2023 were NOK 43,097 million and NOK 35,137 million in 2022. The level of systemwide sales and total systemwide and distribution sales in 2023 were impacted by strong momentum for REMA 1000 Denmark, in addition to high levels of food price inflation, also strengthening the trend towards value for money and discount
options. In 2023, REMA 1000 Denmark had an estimated market share of around 18 percent of the traditional Danish grocery market, well above the estimated around 17 percent in 2022. The number of sales outlets at year-end 2023 was 372, up from 363 at year-end 2022.
REMA 1000 Denmark’s revenue in 2023 was NOK 39,713 million, compared with NOK 32,799 million in 2022, corresponding to a growth of 7.2 percent in 2023 and 11.6 percent in 2022. This reflects the similar development as for systemwide sales and distribution sales, leading to higher revenue from the sale of franchise services and revenues from the sale of goods compared with 2022. Operating profit before amortisation, depreciation and impairment (EBITDA) was NOK 2,462 million in 2023 compared with NOK 2,185 million in 2022. Operating profit was NOK 1,347 million in 2023 and NOK 1,248 million in 2022. The improved result in 2023 is mainly explained by increased franchisee fees due to increased systemwide sales and positive currency effects from a weakening NOK vs DKK, partially offset by general inflationary pressure, costs related to the ALDI-acquisition and ramp-up of the new distribution centre.
REMA 1000 Denmark will continue to focus on and strengthen the business idea “Discount med holdning” (“Discount with value”) and “Meget mere discount” (“Much more discount”), which means that goods are sold at a low price and with clear requirements towards the goods’ quality and impact on people and the environment. This includes a continued focus on organic and sustainable groceries and reduced food waste.
In December 2022, an agreement was signed with German discount grocer ALDI to acquire the majority of ALDI’s grocery store network in Denmark. Danish competition authorities approved the acquisition in August 2023, and the transaction was completed in January 2024. The first stores were converted to REMA 1000 in November 2023. During 2024, we will continue to convert and open new REMA 1000 stores, accelerating growth and increasing market share. Successful integration and opening of new stores is a key focus area for 2024.
In 2024, we will also continue to ramp up and improve operations at our new highly automated dry goods distribution centre in Horsens, Denmark, targeting increased efficiency and capacity to handle further growth.
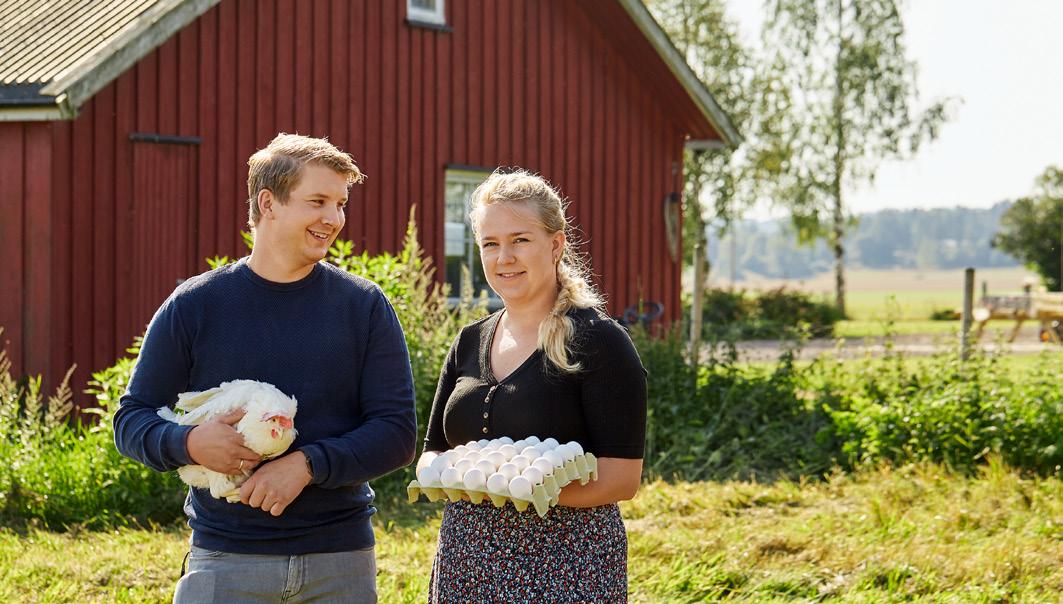
93 92 Our responsibility Our business Corporate governance Financial statements Appendix
4.1 Board of Directors’ report
Reitan Convenience Systemwide sales in 2023 were NOK 16,490 million and NOK 14,688 million in 2022, corresponding to a growth of 3.6 percent in 2023 and 16.1 percent in 2022. Like-for-like growth in systemwide sales was 6.7 percent in 2023 and 15.0 percent in 2022. Total systemwide and distribution sales in 2023 were NOK 16,945 million and NOK 15,082 million in 2022. The level of systemwide sales and total systemwide and distribution sales in 2023 were impacted by high levels of inflation as well as a full year without Covid-19-induced mobility restrictions and lockdown measures, which impacted January and February of 2022. The number of sales outlets at the year-end 2023 was 1,769, down from 1,953 at year-end 2022, reflecting active portfolio management with the opening of new stores in attractive locations while at the same time closing marginal and small stores, mainly in Norway, Finland and the Baltics.
Reitan Convenience’s revenue in 2023 was NOK 5,652 million compared with NOK 4,829 million in 2022, corresponding to a growth of 6.6 percent in 2023 and 22.5 percent in 2022. Higher sales in sales outlets resulted in an increase in both revenues from the sale of franchise services and revenues from the sale of goods compared with 2022. Operating profit before amortisation, depreciation and impairment (EBITDA) was NOK 1,422 million in 2023 and NOK 1,110 million in 2022. Operating profit was NOK 213 million in 2023 compared with NOK -1 million in 2022. The improved result in 2023 is mainly due to increased revenues from franchise services as a result of improved customer offering, optimisation of the store portfolio and more efficient operations. This was partly offset by restructuring costs in Norway and Finland, as well as general inflationary pressure.
Reitan Convenience is a specialist in developing and operating franchise-based convenience concepts. Organic growth in existing stores and new store openings are a core part of Reitan Convenience’s business. Reitan Convenience will continue its focus on food-to-go, hot and cold beverages, and bakery products through continued innovation and digital solutions to improve customer offering and performance and attract existing and new customers.
We have seen positive effects from the successful restructuring of our portfolio in Norway and Finland during 2023, and we will continue our active portfolio management into 2024.
Uno-X Mobility
Systemwide sales in 2023 amounted to NOK 24,656 million compared with NOK 25,340 million in 2022. Total systemwide and distribution sales were NOK 30,046 million in 2023 and NOK 30,887 million in 2022. Total volume sold (measured in 1,000 m³) for the corresponding years was 1,749 and 1,785, but Uno-X Mobility is capturing market share despite a softening market. Both systemwide sales and total systemwide and distribution sales were down slightly in 2023 compared with 2022, reflecting somewhat lower prices for refined oil products in local currency (Average Brent Blend was USD 82 and 99 per barrel in 2023 and 2023, respectively) and 2% lower volumes. As systemwide sales and total systemwide and distribution sales in NOK fluctuate with the oil price, growth in systemwide sales and systemwide and distribution sales are not calculated for this business area. The number of mobility locations at the end of 2023 was 823, compared with 816 at the end of 2022.
Uno-X Mobility’s revenue in 2023 was NOK 20,780 million compared with NOK 21,756 million in 2022, reflecting the same development as for systemwide sales. Operating profit before amortisation, depreciation, and impairment (EBITDA) was NOK 916 million and NOK 1,191 million in 2022. Operating profit was NOK 285 million in 2023 and NOK 723 million in 2022. The results in 2023 are down from 2022, which was at a high level in historical context. The result in 2023 is impacted by solid development for liquid fuel operations, but with a negative inventory effect compared with a significantly positive inventory effect last year due to declining prices for refined oil products during 2023.
Uno-X Mobility is strategically positioned to spearhead the transition towards more sustainable mobility in the years to come. Uno-X Mobility will continue to develop and promote sustainable mobility solutions while maintaining an efficient and profitable liquid fuel network. Moreover, it will expand the rollout of EV charging infrastructure, both to the private and
heavy-duty segments, to enhance the accessibility of renewable energy for road transportation, in alignment with both national and international climate objectives.
Real Estate
The Real Estate’s revenue in 2023 was NOK 21 million, compared with NOK 21 million in 2022. Other income, consisting of rental income, net gains (losses) and revaluation of investment properties, was NOK 6 million in 2023, compared with NOK 183 million in 2022.
Operating profit before amortisation, depreciation, and impairment (EBITDA) was NOK -108 million in 2023 and NOK 149 million in 2022. Operating profit was NOK -115 million in 2023 and NOK 141 million in 2022. Revaluation of investment properties is included in the segment’s profit with NOK -232 million in 2023 compared with NOK -24 million in 2022. Share of profit from associates was NOK -18 million in 2023 and NOK 43 million in 2022. Operating profit for 2023 was impacted by impairment of real estate assets, reflecting higher yields in the real estate market.

The carrying amount of the real estate portfolio at fair value was NOK 3,590 million as of December 31, 2023, and NOK 4,573 million as of December 31, 2023.
During 2023, the Real Estate segment owned real estate in both Norway and Denmark. In December 2023, Reitan Retail sold its real estate development portfolio in Norway to REBUS Handelseiendom, creating a competent and sizeable company with the aim of becoming a key player within sustainable commercial property in Norway. REBUS Utvikling, a subsidiary of REBUS Handelseiendom, will take over the responsibility for developing an attractive real estate portfolio of potential locations for Reitan Retail in Norway. Reitan Retail will participate in REBUS Utvikling through the Board of Directors and Investment Committee and the close cooperation will be governed by a servicelevel agreement. REBUS Handelseiendom is owned by REITAN. Reitan Retail will maintain ownership of a real estate portfolio in Denmark.
The Real Estate segment will continue to secure access to strategically important locations and will be an important enabler for the growth of Reitan Retail and its franchisees.
Risk and risk management
Reitan Retail is a leading retail company operating in the grocery, convenience and mobility sectors across seven countries, and our operation is exposed to ordinary financial, operational and sustainability risks related to these types of activities. The risk picture is complex with several risks interlinked by underlying factors. Mitigating the risks requires a comprehensive set of mitigating actions. Several of our risks affect our global value chains. Although we, in later years, have
95 94 Our responsibility Our business Corporate governance Financial statements Appendix
4.1 Board of Directors’ report

come a long way to improve transparency, improved transparency remains a key focus moving forward.
Identifying and managing risks is an integral part of strategic planning as well as of control and management of the business. Risk management and internal controls are given high priority by the Board of Directors, and they are responsible for ensuring that the necessary and adequate systems are in place. Furthermore, Reitan Retail’s Corporate Management Board is responsible for establishing and maintaining sufficient internal controls.
Our most prominent risks and mitigating actions are described below.
Cyber security risks, mitigated through continuous focus on training employees, ensuring necessary security systems are installed and up to date, as well as continually monitoring systems and services.
Market risks, mitigated through a strict focus on costs and efficiency. Markets are constantly monitored to ensure that we stay up to date on trends and developments, e.g. through consumer surveys, which, together with other analyses, form the basis of our strategy.
Risks related to geopolitical situations and climate changes, mitigated through close collaboration and dialogue with suppliers and partners, and through a supplier Code of Conduct, along with a Responsible Procurement policy, ensuring that both natural and human resources are treated sustainably. We also have strict Anti-corruption and Anti-money laundering policies. To enhance our understanding of the impacts of climate change on our operations we revised our TCFD (Task Force on Climate-related Financial Disclosures) report in 2023. Read the full TCFD report at www.reitanretail.no.
Risk of injury or harm to people or the environment, mitigated through comprehensive Health, Safety and Environment (HSE) systems in all parts of our operations, which are subject to regular maintenance and inspections.
Risk of not having the right people, mitigated through a focus on recruiting, developing and retaining people with relevant competencies, abilities and drive.
Regulatory risks, mitigated through monitoring, planning ahead and taking an active role as a constructive dialogue partner to authorities and policymakers at a local, national and European level.
Financial risks, including currency risk, interest rate risk, credit risk, liquidity risk, risk related to financing and capital structure and inflation risk, mitigated through following established strategies and guidelines for managing financial market risk. Reitan Retail’s ambition regarding financing and capital structure is referenced in our value no. 3: “We aim to be debt-free”. This value shall be understood as providing guidelines and a target for maintaining a robust financial position, with a capital structure allowing us to balance risk and flexibility to act on opportunities. The Group has a solid financial position and significant liquidity reserves, including undrawn borrowing facilities, providing the Group with the strength and capacity to handle unforeseen operational challenges and market fluctuations.
Financial risks are covered in more detail in Note 3 in the consolidated financial statements.
Read more about our risks and risk management in Chapter 3
Financial position of the parent company
The separate financial statements of Reitan Retail AS (the parent company) have been prepared in accordance with the simplified IFRS pursuant to the Norwegian Accounting Act, section 3-9, subsection 5 (“Regulations on simplified use of international accounting standard”) issued by the Norwegian Ministry of Finance on January 21, 2008.
In 2023, other income amounted to NOK 1,675 million, compared with NOK 1,811 million in 2022. Other income consists of dividends and group contributions from subsidiaries. Profit for the year amounted to NOK 1,471 million in 2023 and NOK 1,540 million in 2022.
As of December 31, 2023, total assets amounted to NOK 11,277 million, compared with NOK 11,411 million as of 31 December 2022. At the end of 2023, investments in subsidiaries amounted to NOK 4,679 million and NOK 4,094 million at the end of 2022. Total equity as of
December 31, 2023, was NOK 6,049 million, compared with NOK 7,182 million as of 31 December 2022. This is equal to an equity ratio of 53.6 percent as of December 31, 2023, and 62.9 percent as of December 31, 2023. As of December 31, 2023, total liabilities were NOK 5,228 million, compared with NOK 4,229 million as of December 31, 2023.
In December 2021, Reitan Retail AS established a multi-currency credit facility. The loan is financed by a bank syndicate consisting of six banks. The facility is a revolving credit of NOK 9,000 million, of which NOK 4,500 million originally matured in 2024, and NOK 4,500 million originally matured in 2026. Both tranches included two one-year extension options. In 2022, the first extension option for both tranches was utilised, and in 2023, the last extension option was utilised, extending maturity dates to 2026 and 2028 respectively.
In March 2024, Reitan Retail AS also entered into a DKK 1,300 million term loan with a 2-year maturity, financed by the same bank syndicate of six banks. The loan is entered into to finance the payment of the purchase price and capital expenditures related to the acquisition of ALDI store locations in Denmark.
For further details, please see Note 9 in the consolidated financial statements in the separate financial statements of Reitan Retail AS.
11,277 mill NOK in total assests
97 96 Our responsibility Our business Corporate governance Financial statements Appendix
4.1 Board of Directors’ report
Organisation
Ownership and group organisation
Reitan Retail AS is a wholly owned subsidiary of REITAN AS, owned by the Reitan family. Odd Reitan, Ole Robert Reitan and Magnus Reitan with his family, each own 33.3 percent of the shares in REITAN AS through their individually owned holding companies.
Reitan Retail (the Group) is organised with a parent company, Reitan Retail AS, responsible for overall corporate governance. Subsidiaries that are defined as core business areas are referred to as business areas. These are REMA 1000 Norway, REMA 1000 Denmark, Reitan Convenience and Uno-X Mobility. Each business area is led by an executive vice president and chief executive officer (CEO). In addition, the Group holds a portfolio of retail properties presented as a separate segment, Real Estate, which is reported separately to the CFO of Reitan Retail.
Management model
Reitan Retail is led by the Chief Executive Officer, Ole Robert Reitan (the Group CEO). The Group CEO is responsible for the day-to-day management and the Corporate Management Board of Reitan Retail, in accordance with applicable legislation and as authorised by the Board of Directors of Reitan Retail AS.
The Group CEO reports to the Board of Directors of Reitan Retail AS. The Board of Directors oversees the overall management of Reitan Retail AS.
Corporate Management Board
The Corporate Management Board of Reitan Retail consists of Group CEO Ole Robert Reitan, Executive Vice President (EVP) and Chief Financial Officer (CFO) Kristin S. Genton, EVP and Chief Operating Officer (COO) Monica Ødegaard, EVP and Chief Communications Officer (CCO) Inger Sethov, EVP and CEO of REMA 1000 Norway Christian Hoel (replacing Tom Kristiansen as of January 1, 2024), EVP and CEO of REMA 1000 Denmark Henrik Burkal, EVP and CEO of Reitan Convenience Mariette Kristenson, and EVP and CEO of Uno-X Mobility Vegar Kulset.
The Group CEO appoints and determines the composition of the Corporate Management Board. The board of each business area appoints the CEO for the respective business area.
Board of Directors
In accordance with Norwegian law, the Board of Directors in Reitan Retail is responsible for the overall governance of Reitan Retail, ensures that appropriate management and control systems are in place and supervises the day-today management as carried out by the Group CEO.
The Board of Directors in Reitan Retail currently comprises three members, and there are plans to complement the Board in due course. The planned expansion will aim to reflect diversity in competence, age, gender and background.
The Board meets as often as required and otherwise as often as the Group’s operations require or when any Board member or the Group CEO so demands.
In 2023, a total of six Board meetings were held in accordance with the annual Board meeting plan, aa well as five extraordinary meetings. A total of 53 items were dealt with by the Board.
The board members and the CEO of Reitan Retail AS and its subsidiaries are covered by a directors and officers liability insurance policy for their potential personal liability towards the company and third parties. The insurance also covers any employee acting in a managerial capacity.
Working environment
Reitan Retail shall be a safe and attractive workplace for everyone, with diversity, equality and opportunities in focus. Great emphasis is placed on motivating and developing employees in line with the Group’s values and culture. Reitan Retail wants to give all employees a common platform and cultivate a sense of collective pride across the business areas. Hence, employee development is central to the Group and the business areas, and Reitan Retail have several development programs, including value training, talent- and trainee programs, offers of trade certificates and various individual programs.
In total, Reitan Retail had 7,159 employees at the end of 2023, compared with 6,567 as of 31 December 2022. The number of systemwide employees, including franchisees and their store personnel, was 45,368 at the end of 2023, compared with 43,444 as of 31 December 2022.
Gender equality and diversity
People are Reitan Retail’s most valuable assets, with a strong emphasis on gender equality and diversity among the workforce. We want to be a leading company in creating equal opportunities, and we strongly believe in an inclusive working life that reflects the diversity in society. The diverse skills, competencies, backgrounds and perspectives of Reitan Retail’s employees create new opportunities, lead to better decisions and have a positive impact on our business.
At Reitan Retail, there are equal numbers of women and men. However, a review of the boards in all our businesses shows that we still have a significant task remaining at this level, and corresponding work is needed to improve gender equality at the management level and among franchisees. Our ambition is to ensure gender balance in recruitment processes on the management level and amongst franchisees, and to have a 40-60 percent gender balance in all boards across the company by the end of 2024.
To achieve our goal of gender balance within boards and leadership positions, we have taken steps such as assessing competency requirements and initiating internal training for new board members. We believe that achieving gender balance at the board and management levels will serve as a significant catalyst to bring forward even more female leadership talents and positively impact gender balance across the organisation.
Employees in company
Among the Group’s employees, there were 3,700 women and 3,459 men, compared with 3,424 women and 3,143 men in 2022. Of the employees in 2023, three percent
were below the age of 18, 35 percent aged 19-29, 19 percent aged 30-39, 16 percent aged 40-49, 17 percent aged 50-59 and 10 percent aged 60 and above.
The Group’s Corporate Management Board level consists of eight employees, which is evenly split between four men and four women. Among 557 employees in top and middle management in 2023, 40 percent are women and 60 percent are men. In 2022, the distribution was 41 percent women and 59 percent men among 539 top and middle management. Efforts are being made to ensure gender equality and diversity at all levels of the organisation.
Among the 7,159 employees in Reitan Retail in 2023, 6,510 are permanently employed. 2,488 of our employees work in company-operated sales outlets, 2,448 work in distribution or production facilities and 2,223 work in administrative positions. 2,414 work part-time, of which 63 percent were women in 2023. In 2022, the number of part-time workers was 1,515, of which 56 percent were women.
Out of the total number of employees, 649 are temporarily employed or working as non-guaranteed hours employees, most of whom are in companyoperated sales outlets.
Flexible working hours, home office solutions and opportunities for parental leave for both genders promote opportunities for both women and men to balance their careers and family lives. In 2023, 244 employees were on parental leave, of which 49 percent were women and 51 percent men. The retention rate one calendar year after parental leave is 89 percent for women and 90 percent for men. The total retention rate is 89 percent.
Employee sick leave in 2023 was 5.8 percent compared with 5.9 percent in 2022. A total of 73 injuries resulted in sick leave in 2023.
In 2023, one of the sales outlets in Reitan Convenience Sweden experienced an incident involving severe personal injury. Reitan Convenience Sweden followed its regular emergency preparedness routines, with the company’s emergency team handling the incident
99 98 Our responsibility Our business Corporate governance Financial statements Appendix
4.1 Board of Directors’ report
and following up with the affected employee, family, colleagues and relevant authorities. Suitable measures, such as new risk assessments regarding solo work, have been implemented to mitigate the risk of similar incidents in the future.
As large employers, we play an important role for both the employees and society in facilitating employees on sick leave so they can return to work. Cooperation with local authorities (e.g. the Norwegian Labour and Welfare Administration (NAV) in Norway) is important in this work. The needs of employees with reduced work capacity due to age and/or illness are met, as well as the opportunity to work in reduced positions (partly without sick pay / no reduction in pay). Most sites in the Group are of a modern standard, facilitated for employees with physical disabilities.
Franchisees and store personnel
We hold great pride in our franchisees and the diversity they represent. In 2023, 36 percent of our franchisees were women, and 64 percent were men, similar to the split in 2022.
Of the total 2,182 franchisees, 13 percent were aged 19-29, 32 percent aged 30-39, 31 percent aged 40-49, 20 percent aged 50-59 and 4 percent aged 60 and above. The number of store personnel was 36,027 in 2023, of which 51 percent were women and 49 percent were men.
Our sales outlets can serve as the first entry, as well as a possibility to return to working life, for both young people and people who experience challenges and need work practice or training.
Recruitment
Reitan Retail uses professional tools in its recruitment process. Vacancies are advertised internally to promote internal career opportunities and internal advancement.
In the recruitment processes, requirements specifications are prepared for the positions, which, together with thorough assessments, evaluations, interviews, test tools, and reference checks, will ensure that the Group finds the best-qualified candidate.

Responsibility
The impact of the choices we make every day is enormous. Reitan Retail and our franchisees together employ 45,000 people and encounter two million customers every single day. This means we have a great responsibility, but it also gives us great opportunities to make a difference. For the 75 years we have been in business, the company has been led by values such as making each other better and contributing to the local communities. Doing business responsibly is integral to our culture and core values.
About half of the world’s global climate emissions stem from food systems and transport. With significant operations and impact in both sectors, we recognise our responsibility to take prompt action. In 2023, Reitan Retail committed to a collective path towards net zero emissions and an ambitious near-term climate goal aiming to take on a leadership role in our business.
The most significant damage we inflict on our environment is through our eating habits and the methods we use to produce food. Our global food system is the primary driver of biodiversity loss, with agriculture alone being the identified threat to 86 percent (24,000) species at risk of extinction. The global rate of species extinction today is higher than the average rate over the past 10 million years. In addition, one-third of the food produced globally is wasted or lost, and less than 20 percent of packaging waste is recycled. These challenges are significant for us, as they are for society at large.
Based on our values, the double materiality analysis, and stakeholder dialogues, our sustainability efforts are directed towards the food industry and road transportation sector, as well as the topics most important for the communities where we are present.
The four strategic areas, Environment, Health, People and Value chain, are Reitan Retail’s joint sustainability focus, wherein the business areas contribute by setting objectives, identifying activities, and following up on
effects and results in ways customised to the specific market and stakeholder.
In 2023, we updated our sustainability strategy, originally from 2020, according to materiality and adjusted to the progress of business activities and strategic priorities, stakeholder dialogues, regulations, and sustainability standards. An updated version will be presented in 2024, clearly reflecting our stance on the green transition and the importance of good health, diversity and inclusion, transparent value chains to secure fundamental human rights, decent working conditions, and reduced negative impact on the environment and animals.
Below are some highlights from the responsibility work in 2023. Chapter 2 – Our responsibility provides more information and is given in accordance with GRI Standards. Our business areas also publish sustainability reports for the year 2023 with their contextual journeys toward sustainable development. Please see www.reitanretail.no for the abovementioned reports.
Reitan Retail will contribute to good public health, reduce greenhouse emissions, create greater diversity and equality in working life, and ensure sustainability and transparency throughout the value chain.
101 100 Our responsibility Our business Corporate governance Financial statements Appendix
4.1 Board of Directors’ report
Environment and climate
We aim to lead the green transition in our industries through our sustainability initiatives, helping our customers make more climate-friendly choices and working towards a sustainable value chain that protects soil and biodiversity.


In a time marked by climate change, rapid loss of biodiversity and misuse of natural resources, the need to manage businesses in line with nature’s resilience is extensively growing.
Reitan Retail emitted a total of 8.9 million tonnes CO2 in 2023. Around 99.5 percent of our emissions come from scope 3 and 0.5 percent from scope 1 and 2. The main sources of emissions in Reitan Retail come from the categories of purchased goods and services and the use of sold products. Around 60 percent of our emissions stem from our fossil fuel offerings, while close to 40 percent comes from products sold in sales outlets.
In 2023, our CO2 emissions in scopes 1 and 2 were reduced by 8 percent compared with 2022. In scope
3, Reitan Retail has continued to gather insight to get more granular data when calculating emissions in the value chain, following 2022 being the first year with company-wide scope 3 calculation. In 2023, scope 3 emissions increased by 1.6 percent, attributed to various factors such as enhanced data completeness, more comprehensive factor calculations and increased sale.
Throughout the year, Reitan Retail has developed a climate action plan in close collaboration with external and internal stakeholders. The action plan identifies activities to reduce the company’s carbon emissions and dependency on fossil energy through supplier engagement, promoting
sales of food and drinks under the Nordic dietary guidelines, and collaborating with academia, the market, and authorities to promote innovation. The complete answer is yet to be found, but we will continue to search for solutions to close the so-called “innovation gap”.
We believe electrification and increased utilisation of biofuels and other renewable liquid fuels are important measures for reducing CO2 emissions from road transport, as well as in other parts of the transport sector. We will gradually transfer Uno-X Mobility’s operations towards renewable energy, and efforts are made to build ultrafast electric vehicles (EVs) charging stations in both the private and heavy-duty segments.
Reitan Retail is dedicated to systematically identifying, mitigating, and monitoring risks to nature, such as deforestation and biodiversity loss, through continuous dialogue with suppliers and risk-focused procurement management. Addressing food waste is a significant priority, being the ultimate symbol of inefficiency and waste of natural resources.
Our discount grocery and convenience operations strive to minimise food waste by optimising product offerings and packaging, raising awareness among our people and customers, and leveraging technology and partnerships. Our commitment to reducing food waste saved 3.9 million products in 2023.
Health
We aim to offer healthier products at affordable prices for everyone. We inspire a healthier, active and sustainable lifestyle through our products, services and sponsorships.
We have a responsibility to contribute to better public health, and we want to inspire people to make healthier and more sustainable choices. Food systems and diets are shifting globally due to multiple factors, such as war and conflicts, climate change, and demographic shifts. Growing urbanisation drives the consumption of processed and fast food, leading to increased obesity, malnutrition, and food crises.
We must shift our food system in a more sustainable direction and our diets in a healthier direction, towards a more plant-based nutrition that is less reliant on animal protein. Too many people are eating unhealthily, bringing a cost increase to society and a diminished quality of life for the individual. In times of rising food prices, consumers are buying less fruits and vegetables.
Through our 2,800 sales outlets in discount grocery and convenience, we aim to enhance the accessibility of healthier choices by offering competitive prices, quality products, effective marketing, and appealing packaging. We are consistently engaged in product development in collaboration with our suppliers. Additionally, Reitan Retail endeavours to promote healthy habits and lifestyles by supporting local organisations and community partners.
Improving the range of healthier products involves enhancing existing products and increasing the sales of more nutritious options. Healthier products include those labelled with the keyhole symbol, fresh and frozen fruits, berries and vegetables, whole grains, fish, and seafood. In 2023, 29.0 percent of sales were derived from healthier products, a slight decrease from 29.1 percent in 2022.
Through dialogue with suppliers and product development, we continuously improve recipes for new and existing products, reducing salt, sugar, saturated fat, and food additives while still ensuring they taste great. Certification labels guarantee that the products meet specific salt, sugar, fat, and fibre content requirements within the product group. The aim is to make it easier for consumers to find and choose healthier foods. We will continue to develop and promote healthier products and make those options more accessible in sales outlets.
Throughout the year, we have examined enhancing health initiatives to make healthier options more accessible for a wider range of customers. In 2024, we will introduce our revised sustainability strategy, placing health at its core and with updated targets in line with the Nordic Nutrition Recommendations.
103 102 Our responsibility Our business Corporate governance Financial statements Appendix
People
We aim to lead by example in equal opportunity and firmly believe in an inclusive work environment where people from all backgrounds are given the opportunity to succeed.

Our people are at the heart of everything we do, embodying our values and making it into something unique. Value-based leadership is part of our philosophy to help great people grow and develop. With 45,000 people working across operations in seven countries, Reitan Retail has the opportunity and the responsibility to build inclusive and safe workplaces.
The working environment is built on treating colleagues, customers, business partners, and others with respect, no matter cultural differences and other individual characteristics. People are the most important resource to us, and gender equality and diversity among employees are critical. The various skills, competencies, backgrounds, and perspectives of Reitan Retail’s employees create new opportunities, lead to better decisions, and positively impact our business. We have a gender-balanced workforce overall, with 50 percent women and 50 percent men. However, the share is less balanced among franchisees and managers. We believe equal representation on the top level will have an important trickledown effect and serve as a norm setter that helps highlight and develop more female top leadership candidates, as well as having an important impact on gender balance in all areas within the organisation. During 2024, all 38 boards1 in Reitan Retail across all seven countries
where we operate will secure a minimum of 40 percent representation of the underrepresented gender among board members.
Our value-based culture is the cornerstone of our operations throughout all companies. It is the basis for creating financial value and conducting activities with integrity and responsibility. Odd Reitan describes the Reitan philosophy in “Blåboka” (“the Blue Book”) as eight values and eleven success factors.
We value competence and potential over demographic, cultural, and socioeconomic differences. We have zero tolerance for discrimination and harassment at all workplaces, as established in our Code of Conduct.
In 2023, REMA 1000 Norway was awarded the “Ringer i Vannet” prize (“Ripples in the Water”), recognising its commitment to advancing inclusion to a leadership level and integrating it into the company’s overall strategies and objectives.
In 2023, Reitan Retail also initiated extensive work to map the various categories of positions and link them to salary data. This will be used to explore the background of differences in pay between genders and continue striving for equal pay and opportunities for all.

Value chain
We have a high level of business morale and hold our suppliers accountable to our rigorous ethical code of conduct in order to offer responsibly produced products to our customers.
Global trade and increased production have been essential for helping countries grow and develop, reducing poverty, and making living standards more equal around the world. However, more limited transparency, increased corruption and fraud, an ever-increasing risk of human rights violations pose risk and is basis for discussions about companies’ responsibility for their production’s environmental and social effects.
At Reitan Retail, one of our eight fundamental business values is to “keep high moral standards”. This entails promoting responsible trade and collaboration across the value chain and contributing to making local communities prosper. We have a high level of business ethics founded in our values and are committed to working with suppliers to make our customers sure that our products are produced in a responsible manner.
Supply chain transparency allows businesses and consumers to understand how goods are produced and distributed. This includes knowing where and how products are made, the labour practices involved, the journey of products from source to consumer, and any environmental impacts that occur along the way.
In 2023, the Corporate Management Board of
Reitan Retail took a stand against palm oil and the deforestation caused by the production, and we are developing a plan to stop selling all products containing palm oil or palm oil derivatives.
In June 2023, Reitan Retail reported on the Norwegian Transparency Act (the Act) for the first time since it came into force. The Act aims to help companies focus on respecting fundamental human rights and ensuring fair work conditions when making products and offering services. It also aims to make it easier for the public to learn how companies deal with issues that could harm these rights and conditions. About 9,300 suppliers have been risk assessed in 2023, accounting for 74 percent of all reported suppliers in our operations.
Reitan Retail is continuously increasing its understanding of the supply chain risks and improving risk management and opportunities in the procurement process. The Reitan Retail Policy on Responsible Procurement will be adopted by the Board and implemented in 2024. The procurement process is vital to achieving Reitan Retail’s strategic goals for climate, environment, health, and value chain.
The ongoing effort will ensure that Reitan Retail contributes to creating responsible and sustainable value chains throughout our organisation and pull the world in a better direction.
105 104 Our responsibility Our business Corporate governance Financial statements Appendix 4.1 Board of Directors’ report
Boards with three or more members
Events after the reporting period
Acquisition of a majority of
ALDI’s
Danish grocery store network
On January 16, 2024, the Group acquired 100 percent of the shares of ALDI Danmark ApS, a non-listed company based in Denmark. The transaction gives access to a portfolio of real estate locations, including 113 store locations (84 fully-owned stores and 29 leased stores) and three distribution centres, well-suited for the REMA 1000 format, paving the way for accelerated growth in an attractive market. The transaction was approved by the Danish competition authorities on August 30, 2023. Closing of the transaction was subject to certain conditions, notably including ALDI’s demerger of properties (such as headquarters) and other assets and liabilities not included in the acquisition. As such, the transaction was first completed in January 2024. The financial effects of this transaction have not been recognised as of December 31, 2023. The operating results and assets and liabilities of the acquired company will be consolidated from January 16, 2024. The Group considered this transaction as an asset acquisition.
For further information, see note 36 in the consolidated financial statements.
Amendment of Reitan Retail’s multi-currency credit facility
In March 2024, Reitan Retail AS entered into a DKK 1,300 million term loan with a 2-year maturity, financed by the same bank syndicate as its existing multicurrency credit facility. The loan is entered into to finance the payment of the purchase price and capital expenditures related to the acquisition of a majority of ALDI store locations in Denmark.
Outlook
Reitan Retail aims to be a good owner and contribute to developing all its business areas in a positive direction. Reitan Retail has achieved solid value creation through long-term investments over many years.
Reitan Retail continuously assesses opportunities for its businesses, and at the beginning of 2024, Reitan Retail has a strong financial position for further growth and development.
Oslo, April 26, 2024
 Rune Bjerke Chairman of the Board

107 106 Our responsibility Our business Corporate governance Financial statements Appendix
Magnus
Board Member Ole
CEO Eilert
Board Member 4.1 Board of Directors’ report
Reitan
Robert Reitan
Hanoa


109 4.2 Consolidated financial statements 4.3 Parent company financial statements 108 Our responsibility Our business Corporate governance Financial statements Appendix Reitan Retail Responsible retail 2022 4.2 Consolidated financial statements Profit or loss Comprehensive income Financial position Changes in equity Cash flows Notes to the consolidated financial statements 109 110 111 113 114 115 3 Consolidated statement of profit or loss Million NOK except per share data Note 2023 2022 Revenue 7 104,322 94,367 Other income 8 1,027 1,001 Share of profit of associates 16 99 97 Cost of goods sold 21 -85,031 -77,225 Salaries and personnel costs 9 -4,980 -4,003 Other operating expenses 10 -6,799 -5,975 EBITDA* 8,638 8,262 Amortisation and impairment of intangible assets 13 -270 -281 Depreciation and impairment of property, plant and equipment 14 -1,767 -1,257 Depreciation and impairment of right-of-use assets 15 -3,514 -3,127 Operating profit 3,087 3,597 Interest income 11 91 79 Interest expenses on lease liabilities 11, 15 -935 -811 Other interest expenses 11 -329 -228 Net gains (losses) on financial investments 11 -94 -246 Net other financial items 11 34 65 Net financial items -1,233 -1,141 Profit before taxes 1,854 2,456 Income tax expenses 12 -445 -611 Profit for the year 1,409 1,845 Attributable to: Equity holders of the parent 1,395 1,831 Non- controlling interests 17 14 14 Earnings per share, NOK Basic earnings per share 23 13.29 17.44 Diluted earnings per share 23 13.29 17.44 *EBITDA, or earnings before interest, taxes, depreciation and amortisation, is an alternative performance measure. For more information, see section Performance measures and definitions.
Consolidated statement of comprehensive income
111 4.2 Consolidated financial statements 4.3 Parent company financial statements 110 Our responsibility Our business Corporate governance Financial statements Appendix Consolidated statement of financial position Million NOK Note 31.12.23 31.12.22 ASSETS Deferred tax assets 12 638 591 Intangible assets 13 3,961 3,928 Investment properties 38 48 Property, plant and equipment 14 12,719 12,402 Right-of- use assets 15 23,795 22,297 Investments in associates 16 1,050 1,102 Financial investments 18 129 475 Receivables 19 284 400 Other non -current assets 20 3 6 Total non -current assets 42,617 41,249 Inventories 21 5,130 5,169 Trade and other receivables 19 10,783 9,860 Cash and bank balances 22 1,432 1,106 Restricted cash 22 124 114 Other current assets 30 10 31 Total current assets 17,479 16,280 Total assets 60,096 57,529 Consolidated financial statements | Annual report 2023
Million NOK Note 2023 2022 Profit for the year 1,409 1,845 Other comprehensive income (loss) that will not be reclassified to profit or loss: Remeasurement gain/(loss) on defined benefit plans 9, 12 -7 2 Share of other comprehensive income of associates 1 12, 16 7 9 Net other comprehensive income that will not be reclassified to profit or loss - 11 Other comprehensive income (loss) that may be reclassified to profit or loss: Share of other comprehensive income of associates 12, 16, 24 9 -11 Net gain/(loss) on cash flow hedges 12, 24 -15 -18 Foreign currency translation effects 12, 24 389 304 Net other comprehensive income that may be reclassified to profit or loss 383 275 Net other comprehensive income (loss) for the year, net of tax 383 286 Total comprehensive income for the year, net of tax 1,792 2,131 Attributable to: Equity holders of the parent 1 1,777 2,116 Non- controlling interests 1 17 15 15
Consolidated statement of financial position
Consolidated statement of changes in equity
113 4.2 Consolidated financial statements 4.3 Parent company financial statements 112 Our responsibility Our business Corporate governance Financial statements Appendix Consolidated financial statements | Annual report 2023
Million NOK Note 31.12.23 31.12.22 EQUITY Share capital and premium 2,035 2,035 Other reserves 24 1,846 1,464 Retained earnings 9,255 10,462 Equity attributable to equity holders of the parent 13,136 13,961 Non- controlling interests 17 144 135 Total equity 13,280 14,096 LIABILITIES Deferred tax liabilities 12 465 677 Provisions (LG) 25 686 540 Borrowings (LG) 26 4,642 4,017 Lease liabilities (LG) 15, 26 21,099 20,004 Other non -current liabilities 28 81 86 Total non -current liabilities 26,973 25,324 Provisions 25 106 86 Income tax payable 12 254 124 Borrowings 26 1,214 1,124 Lease liabilities 15, 26 4,267 3,861 Trade and other payables 31 13,986 12,914 Other current liabilities 30 16Total current liabilities 19,843 18,109 Total liabilities 46,816 43,433 Total equity and liabilities
Attributable to equity holders of Reitan Retail AS Million NOK Share capital and premium Other reserves Retained earnings Total Noncontrolling interests Total equity 2022 Equity as at January 1, 2022 2,035 1,190 8,815 12,040 150 12,190 Profit for the year - - 1,831 1,831 14 1,845 Other comprehensive income for the year - 274 11 285 1 286 Total comprehensive income for the year, net of tax - 274 1,842 2,116 15 2,131 Dividends - - -195 -195 -30 -225 Transactions with owners in their capacity as owners - - -195 -195 -30 -225 Equity as at December 31, 2022 2,035 1,464 10,462 13,961 135 14,096 2023 Profit for the year - - 1,395 1,395 14 1,409 Other comprehensive income for the year - 382 - 382 1 383 Total comprehensive income for the year, net of tax - 382 1,395 1,777 15 1,792 Dividends - - -2,600 -2,600 -6 -2,606 Change in non- controlling interests - - -2 -2 - -2 Transactions with owners in their capacity as owners - - -2,602 -2,602 -6 -2,608 Equity as at December 31, 2023 2,035 1,846 9,255 13,136 144 13,280 See note 24 - Other reserves for further details.
Notes to the consolidated financial statements
Note 1 – General information
Note 2 – General accounting policies
Note 3 – Financial risk management
Note 4 – Climate change
Note 5 – Significant accounting judgements, estimates and assumptions
Note 6 – Segment information
Note 7 – Revenue
Note 8 – Other income
Note 9 – Salaries and personnel costs
Note 10 – Other operating expenses
Note 11 – Net financial items
Note 12 – Income taxes
Note 13 – Intangible assets
Note 14 – Property, plant and equipment
Note 15 – Leases
Note 16 – Investments in associates
Note 17 – Investments in subsidiaries
Note 18 – Financial investments
Note 19 – Trade and other receivables
Note 20 – Other non-current assets
Note 21 – Inventories
Note 22 – Cash and cash equivalents
Note 23 – Earnings per share
Note 24 – Other reserves
Note 25 – Provisions
Note 26 – Borrowings
Note 27 – Loan agreements
Note 28 – Other non-current liabilities
Note 29 – Guarantees
Note 30 – Derivative financial instruments
Note 31 – Trade and other payables
Note 32 – Classification of financial instruments
Note 33 – Fair value measurement
Note 34 – Related party transactions
Note 35 – Contingent liabilities
Note 36 – Events after the reporting period
115 4.2 Consolidated financial statements 4.3 Parent company financial statements 114 Our responsibility Our business Corporate governance Financial statements Appendix Consolidated financial statements | Annual report 2023 Consolidated statement of cash flows Million NOK Note 2023 2022 Profit before taxes 1,854 2,456 Net gains (losses) excl. currency gains (losses) on operating activities 8 -108 -75 Share of profit of associates 16 -99 -97 Revaluation of investment properties 1 -51 Depreciation and impairment of property, plant and equipment 14 1,767 1,257 Amortisation and impairment of intangible assets 13 270 281 Depreciation and impairment of right-of-use assets 15 3,514 3,127 Net financial items 11 1,233 1,141 Change in pension obligations 9 -9 -10 Change in inventories 35 -777 Change in trade and other receivables -927 -1,716 Change in trade and other payables 1,040 310 Cash flow from operating activities 8,571 5,846 Interest paid 11,15 -1,248 -1,027 Income taxes paid -309 -537 Net cash flow from operating activities 7,014 4,282 Purchase of intangible assets 13 -184 -333 Proceeds from sale of intangible assets 13 2 4 Purchase of investment properties - -19 Proceeds from sale of investment properties 9 347 Purchase of property, plant and equipment 14 -2,859 -2,690 Proceeds from sale of property, plant and equipment 14 1,228 548 Purchase of associated companies 16 -146 -85 Proceeds from sale of associated companies 16 267 34 Purchase of financial assets 18 - -3 Proceeds from sale of financial assets 18 258 1 Interest received 11 91 79 Dividends received 11,12,16 60 72 Net cash flow from investing activities -1,274 -2,045 Proceeds from borrowings 26, 27 3,848 2,671 Repayments of borrowings 26, 27 -3,323 -1,904 Payment of principal portion of lease liabilities 15, 26 -3,448 -3,095 Dividend paid to parent company -2,740 -250 Dividends paid to non-controlling interests in subsidiaries -6 -30 Net cash flow from financing activities -5,669 -2,608 Change in cash and cash equivalents 71 -371 Cash and cash equivalents as at January 1 22 129 397 Effects of exchange rate changes on cash and cash equivalents 8 175 103 Cash and cash equivalents as at December 31 22 375 129
116 116 117 119 120 121 123 125 126 128 128 129 132 134 136 140 142 143 144 146 146 147 147 148 148 150 152 154 154 154 155 156 159 161 162 162
Note 1 – General information
Reitan Retail AS (the parent company) is registered and domiciled in Norway. The head office is located in Gladengveien 2, Oslo. Reitan Retail is a retail company and the principal activities of the parent company and its subsidiaries (the Group) are described in note 6 – Segment information.
The Group consists of five segments, of which four are retail segments (also referred to as business areas): REMA 1000 Norway, REMA 1000 Denmark, Reitan Convenience and Uno-X Mobility. In addition, the Group holds a portfolio of retail properties presented as a separate segment; Real Estate. The group companies operate from Oslo, Stockholm, Copenhagen, Helsinki, Riga, Tallinn and Vilnius.
Note 2 – General accounting policies
2.1 Basis of preparation
The consolidated financial statements of Reitan Retail AS and its subsidiaries have been prepared in accordance with IFRS Accounting Standards as issued by the International Accounting Standards Board (IASB) and endorsed by the European Union, effective from December 31, 2023.
A list of material subsidiaries is included in note 17
The financial statements have been prepared on a historical cost basis, except for investment properties and certain financial instruments that are measured at fair value
The financial statements are presented in Norwegian kroner (NOK), rounded to the nearest million unless otherwise stated.
The financial statements have been prepared on a going concern basis.
The accounting policies that have been applied as well as significant judgements, estimates and assumptions are disclosed in relevant notes to the consolidated financial statements. The accounting policies outlined in this note are applied throughout the financial statements.
2.2 Basis of consolidation
The consolidated financial statements comprise the financial statements of Reitan Retail AS and its subsidiaries.
Reitan Retail AS is a wholly owned subsidiary of REITAN AS. REITAN AS is 100 percent owned by the Reitan family through three holding companies. REITAN AS’ head office is located at Lade Gaard in Trondheim. Reitan Retail AS is included in the consolidated financial statements of REITAN AS. The ultimate parent of the Group is Odd Reitan Private Holding AS.
The consolidated financial statements of Reitan Retail AS were approved by the company’s Board of Directors on April 26, 2023.

2.3 Summary of other accounting policies
2.3.1 Foreign currencies
The Group’s consolidated financial statements are presented in NOK, which is the parent company’s functional currency.
Foreign exchange differences related to the Group’s working capital are recognised within operating profit for the period. Differences related to financing activities are included in net financial items. Fair value changes in hedging derivatives are recognised within operating profit or net financial items dependent on whether the hedge relates to operating or financing activities.
The Group has foreign entities with functional currency other than NOK. On consolidation, assets and liabilities of foreign operations are translated into NOK at year-end exchange rates. The results of foreign operations are translated into NOK at average rates of exchange each month during the reporting year. The financial statements of foreign operations are translated into NOK on an individual basis, and not using the step-by-step method.
2.3.2 Cash flow statement
The cash flow statement is prepared using the indirect method.
2.4 Changes in accounting policies
2.4.1 New and amended standards and interpretations adopted by the Group
The Group has applied the following standards and amendments for the first time for its annual reporting period commencing January 1, 2023:
• Definition of Accounting Estimates – amendments to IAS 8
• International Tax Reform – Pillar Two Model Rules –amendments to IAS 12 Income taxes
• Deferred Tax related to Assets and Liabilities arising from a Single Transaction – amendments to IAS 12
• Disclosure of Accounting Policies – amendments to IAS 1 and IFRS Practice Statement 2
Note 3 – Financial risk management
The Group’s core operations include discount grocery stores (REMA 1000 Norway and REMA 1000 Denmark), convenience (Reitan Convenience), and mobility (Uno-X Mobility). In addition, the Group holds a portfolio of real estate in Denmark.
The Group's activities involve various financial risks: market risk (including currency risk, interest rate risk and price risk), credit risk and liquidity risk. The Group's overall risk management plan is to minimise potential negative effects on the Group's financial performance. The Group makes use of financial derivatives to hedge against certain risks.
The Group's risk management is performed by a central finance department, in accordance with instructions which have been presented to and approved by the Board of Directors. The Group's finance department identifies, evaluates and manages financial risk in close cooperation with the different operational units. The Board of Directors approves the principles for overall risk management, and provides guidelines for specific areas such as currency risk, credit risk, use of financial derivatives and use of surplus cash.
3.1 Market risk
3.1.a Currency risk
The Group’s operations are located in Scandinavia, Finland and the Baltics, and the Group is exposed to currency risk in several currencies. The risk is particularly related to Swedish kroner, Danish kroner and Euro. Currency risk arises from
These amendments did not have any effect on the measurement or presentation of any items in the consolidated financial statements. Although the amendments to IAS 1 and IFRS Practice Statement 2 did not result in any changes to the accounting policies themselves, they impacted the accounting policy information disclosed in the financial statements.
2.4.2 Standards and revisions effective for future periods
Certain amendments to accounting standards have been published that are not mandatory for reporting periods ending December 31, 2023. These amendments have not been early adopted by the Group and are not expected to have a material impact on the entity in the current or future reporting periods and on foreseeable future transactions.
future retail transactions, assets and liabilities recognised in the balance sheet, and net investments in international operations. This risk is still limited, as our operational units mainly have their revenue and costs and keep their accounts in local currency. The Group has investments in foreign subsidiaries, where net assets are exposed to currency risk in foreign currency translation. The Group tries to limit this exposure by ensuring an overall debt portfolio composition which to the greatest possible extent is adapted to the individual currency's and country's relative importance in the Group's activities.
The effect of a 10 percent weakening of Norwegian kroner is shown in the table below. A 10 percent strengthening will have the opposite effect. The effects are calculated on the basis of the Group's net assets (liabilities) in each currency as at December 31, 2023 and at December 31, 2022.
December 31, 2023
117 4.2 Consolidated financial statements 4.3 Parent company financial statements 116 Our responsibility Our business Corporate governance Financial statements Appendix 11
Million NOK DKK SEK EUR Currency gain (loss) 42 -90 -98 Effect on OCI* 560 74 86 Effect on post-tax profit 592 3 10 December 31, 2022 Million NOK DKK SEK EUR Currency gain (loss) -38 -93 -97 Effect on OCI 547 91 75 Effect on post-tax profit 518 18 -1 *Other comprehensive income (OCI)
Consolidated financial statements | Annual report 2023 10
Note 2 – General accounting policies (continued)

Note 3 – Financial risk management (continued)
3.1.b
Security price risk
The Group’s exposure to changes in prices of securities investments is limited, as financial assets at fair value through profit and loss represent a small proportion of total assets.
3.1.c Interest rate risk
The Group’s interest rate risk is related to borrowings, lending and bank deposits. Borrowings within the Group are entered with floating interest rate and represent an interest rate risk for the Group’s cash flow. To a certain extent, interest rate swaps have been established to minimise the interest rate risk related to borrowings in both NOK and foreign currency. The Group's borrowings are in NOK, DKK, SEK and EUR. The Group’s borrowings amounted to NOK 5,856 million as at December 31, 2023 (NOK 5,141 million as at December 31, 2022) with corresponding interest rate swaps with par value of NOK 112 million as at December 31, 2023 (NOK 151 million as at December 31, 2022). A two percentage point increase in market interest rates will have the following effects related to borrowings:
from derivatives and deposits with financial institutions. Counterparties in derivative contracts and financial deposits are limited to financial institutions with high creditworthiness. Uno-X Mobility is exposed to credit risk through its receivables from end customers. Thorough analysis of the credit quality of new customers and corresponding routines for assessment of existing customer relations have been implemented.
3.3 Liquidity risk
The Group’s interest-bearing receivables and cash and cash equivalents amounted to NOK 1,819 million as at December 31, 2023 (NOK 1,569 million as at December 31, 2022). See section Performance measures and definitions for further details A two percentage point increase in market interest rates will have the following effects related to interestbearing receivables and bank deposits:
The Group operates in markets with high turnover and large volumes. Cash flows are high and relatively stable, but volatile within a week/month. The Group manages its liquidity risk by ensuring a sufficient amount of cash in combination with sufficient availability of undrawn borrowing facilities. Management monitors the Group's liquidity reserves consisting of various borrowing facilities (note 26) and cash equivalents (note 22) through rolling forecasts based on expected cash flow. Management follows the Group’s liquidity reserves separately for each main currency (NOK, DKK, SEK and EUR). The table below specifies the Group’s borrowings and net-settled derivative financial liabilities into relevant maturity groups based on the remaining period to the contractual maturity date at the balance sheet date. The amounts are undiscounted contractual cash flows. Interest payments are estimated based on the terms at the balance sheet date.
December 31, 2023
December
3.2 Credit risk
The most significant part of the Group's operating revenues comes from the sale of goods and services to franchisees. The Group, as franchisor, has a good overview of each franchisee's financial situation. The Group also has established routines for credit assessment and follow-up of business customers other than franchisees such as hotels, restaurants, catering and grocery companies. Historically, the Group’s losses on accounts receivables have been low. A certain credit risk also arises from committed transactions with customers, as well as
Note 3 – Financial risk management (continued)
3.4 Risk related to financing and capital structure
In December 2021 Reitan Retail AS established a revolving multi-currency credit facility of NOK 9,000 million, of which NOK 4,500 million matures in 2026, and NOK 4,500 million matures in 2028. In addition, Uno-X Mobility AS holds a working capital facility agreement including an overdraft facility of NOK 1,400 million Please see note 27 – Loan Agreements for further details.
Reitan Retail’s ambition regarding financing and capital structure is referred to in our value no. 3: “We aim to be debtfree”. This value shall be understood as providing guidance and a target for maintaining a robust financial position, with a capital structure allowing us to balance risk and flexibility to act on opportunities.
Reitan Retail has a solid financial position and significant liquidity reserves, including undrawn borrowing facilities, providing the Group with the strength and capacity to handle unforeseen operational challenges and market fluctuations. To improve capital structure, the Group may adjust its investment level, exploit available credit facilities, sell financial investments or adjust the amount of dividend paid to shareholders.
3.5 Inflation risk
The Group is exposed to the general inflationary pressure which affects the prices on goods we purchase for resale to our customers as well as salaries, supply costs (including
Note 4 – Climate change
In preparing the consolidated financial statements, the Group has considered the impact of climate change, particularly in the context of the Task Force on Climate-related Financial Disclosures (TCFD). See more in chapters 2 and 3 or read the full TCFD report at www.reitanretail.no. As part of the TCFD report the Group has identified 12 climate-related risks. The climate-related risks are categorised into physical impacts such as extreme weather, floods, droughts and sea level rise and transition impacts from potential changes in climate policies and market outlooks.
Climate-related risk has not been identified as having any significant effect on the 2023 consolidated financial statements.
In particular, the Group has considered the impact of climaterelated risks when assessing the following:
Impairments
freight), energy costs and rental costs. 2023 was also a year with high inflation across all countries in which the Group operates, although with easing inflation during the year. See table below for general inflation in the seven countries in which we operate.
The Group seeks to mitigate this risk by strict focus on cost and by being a streamlined and efficient player in the market, as well as working proactively with suppliers, landlords and other partners/stakeholders to mitigate price increases. Historically, the Group has been able to show resilient margins throughout inflationary cycles, due to the strong operational efficiencies and benefit of scale.
The impact of climate-related risks has been considered in relation to indicators of impairment and the forecast of cash flows used in the impairment assessments of non-current assets, including goodwill. At the end of 2023, no material climate-related risk has resulted in write-downs of nonfinancial assets.
The immediately quantifiable impacts of climate change, and costs expected to be incurred in connection with the Group’s net zero commitments, are included in the Group’s financial prognosis approved by management which have been used to support the impairment reviews, with no material impact on cash flows.
The Group has carried out sensitivity analyses on the reasonably possible changes in key assumptions in the impairment tests for each group of cash generating units to which goodwill has been allocated. Due to significant headroom, the Group considers it unlikely that climate-related risks will lead to impairment in the short term. See note 13 and 14 for further information.
119 4.2 Consolidated financial statements 4.3 Parent company financial statements 118 Our responsibility Our business Corporate governance Financial statements Appendix 13
December 31 Harmonised consumer price index 2023 2022 Norway 5.8% 6.2% Denmark 3.4% 8.5% Sweden 5.9% 8.1% Finland 4.3% 7.2% Latvia 9.1% 17.2% Estonia 9.1% 19.4% Lithuania 8.7% 18.9% (Source: Eurostat)
Consolidated financial statements | Annual report 2023 12
December 31 Million NOK 2023 2022 Decrease (increase) in interest expenses -115 -100 Effect on OCI - -
December 31 Million NOK 2023 2022 Decrease (increase) in interest expenses 36 31 Effect on OCI - -
Million NOK <1 yr 1-2 yrs 2-5 yrs >5 yrs Total Borrowings 1,214 9 4,625 8 5,856 Estim. interest paym. 311 247 275 - 833 Lease liabilities 4,277 3,908 9,182 13,645 31,012 Derivatives 16 - - - 16 Trade and other payables 13,986 - - 1 13,987 Total 19,804 4,164 14,082 13,654 51,704
31, 2022 Million NOK <1 yr 1-2 yrs 2-5 yrs >5 yrs Total Borrowings 1,124 9 3,991 17 5,141 Estim. interest paym. 194 151 154 - 499 Lease liabilities 3,874 3,536 8,301 12,817 28,528 Trade and other payables 12,913 - 4 - 12,917 Total 18,105 3,696 12,450 12,834 47,085
Consolidated financial statements | Annual report 2023
Note 4 – Climate change (continued)
Useful lives
The impact of climate-related risks on the useful lives of assets has been considered in determining the carrying value of non-current assets. As at December 31, 2023, the Group has not identified any climate-related risks that would lead to a revision of the useful lives applied. Replacement of, for example, refrigeration systems in sales outlets and transitioning the Group’s vehicle fleet to biogas trucks and electric vehicles take place gradually and to the extent possible as existing assets reach the end of their useful lives.
The Group continues to monitor and assess the regulatory environment and any new standards that may be developed in the future.
See notes 13 and 14 for further information.
Provisions for asset retirement obligations and environmental liabilities
The impact of climate-related risks has been considered in relation to the Group’s provisions for asset retirement obligations and environmental liabilities.
Asset retirement obligations and environmental liabilities are primarily related to the Group’s energy stations through its Uno-X Mobility business. The Group has assessed whether the expected useful lives of these energy stations and the amount of environmental restoration costs require adjustment as a consequence of climate change or related legislation.
Climate change or related legislation could result in earlier closing of energy stations, and hence earlier settlement dates. This would result in an increase in a previously recognised provision, as a result of the impact of discounting. Changes in the estimated cost relating to environmental restoration as a result of climate-related matters may also impact the measurement of the Group’s environmental obligations.
Currently, the expected useful lives of the Group’s energy stations have not been materially reduced as a result of the identified climate-related risks. The Group does not expect any reasonable change in the expected useful lives of the energy stations to have a material effect on the asset retirement obligations. In regards of the environmental liabilities, the Group has not identified any material increase in restoration costs as a consequence of climate-related matters, and as such, the estimated environmental liabilities have not materially increased due to the identified climaterelated risks.
Though climate-related risks are not considered to have any significant effect on the Group’s 2023 consolidated financial statements in relation to provisions for assets retirement obligations or environmental liabilities, the Group continuously considers whether there are any changes in legislation that may result in new obligations or changes to existing obligations.
See note 25 for more information on the Group’s provisions.
Note 5 – Significant accounting judgements, estimates and assumptions
The preparation of financial statements requires management to make use of judgements, estimates and assumptions that affect the reported amounts of assets and liabilities at the date of the financial statements and the reported amounts of revenues and expenses during the reporting period. This note provides an overview of significant judgements, estimates and assumptions. Detailed information about each of these is included in other notes together with information about the basis of calculation for each affected line item in the financial statements.
Significant judgments in applying the Group’s accounting policies
• recognition of revenue from sale of goods to the franchisees, note 7
• recognition of revenue in relation to the franchisees’ access to the Group’s store premises, note 7
• classification of revenue in relation to excess duties, note 7
• judgements in relation to allocation of goodwill to cashgenerating units, note 13
• classification of property as owner-occupied with regards to the franchisees’ access to the Group’s store premises, note 14
• determination of the lease term of contracts with renewal options, note 15
• classification of associated company, note 16
• consolidation considerations in relation to agreements with franchisees, note 17
• judgements in relation to claims and litigation, note 35
Key sources of estimation uncertainty
• estimated impairment of non-financial assets, note 13 and note 14
• estimation of incremental borrowing rates in relation to leases, note 15
Note 6 – Segment information
Accounting policies – Segment information
Segment information for 2023 and 2022 is reported in accordance with the reporting to the CEO (Reitan Retail’s chief operating decision maker) and is consistent with financial information used for assessing performance, profitability and capital allocation.
The Group consists of four reportable retail segments (also referred to as business areas): REMA 1000 Norway, REMA 1000 Denmark, Reitan Convenience and Uno-X Mobility. In addition, the Group holds a portfolio of retail properties in Denmark presented as a separate reportable segment; Real Estate. Other units include the parent companies Reitan Retail AS and REMA 1000 AS. No operating segments have been aggregated to form the above reportable operating segments.
Transfer prices between operating segments are on an arm’s length basis in a manner similar to transactions with third parties.
The segment information is presented in accordance with the Group’s accounting policies, with an exception for measurement of properties owned by the Real Estate segment and used by another segment in the Group. These properties are in the consolidated financial statements measured at cost as they are considered owner-occupied property. For the Real Estate segment, these properties are considered investment properties and carried at fair value. The effect of the measurement differences on the consolidated accounts is illustrated in a separate column in the presentation of financial information per operating segment.
Reitan Retail generates revenues from franchise-based retailing (REMA 1000 Norway and REMA 1000 Denmark), franchise-based convenience services (Reitan Convenience), sale of fuels, lubricants, EV charging and car wash services (Uno-X Mobility) and real estate activities (Real Estate).
Financial information per operating segment 2023
121 4.2 Consolidated financial statements 4.3 Parent company financial statements 120 Our responsibility Our business Corporate governance Financial statements Appendix 15
Million NOK REMA 1000 NO REMA 1000 DK Reitan Conv. Uno-X Mob. Real Estate Other units Meas. diff. Elim. Reitan Retail Revenue from sale of franchise services 3,448 2,462 1,781 - - - - - 7,691 Revenue from sale of goods 34,441 37,246 3,034 20,578 - 51 - -88 95,262 Revenue from sale of other services 387 5 837 202 21 66 - -149 1,369 Revenue 38,276 39,713 5,652 20,780 21 117 - -237 104,322 Other income 320 334 382 27 6 29 362 -433 1,027 Share of profit of associates 90 2 - 25 -18 - - - 99 Cost of goods sold -30,046 -34,808 -2,154 -18,058 - -41 - 76 -85,031 Other operating exp. incl. salaries -4,548 -2,779 -2,458 -1,858 -117 -256 - 237 -11,779 EBITDA1 4,092 2,462 1,422 916 -108 -151 362 -357 8,638 Amort. and imp. of intangible assets -167 -12 -18 -73 - - - - -270 Depr. and imp. of prop., plant and equipment -472 -236 -318 -310 -1 -10 -420 - -1,767 Depr. and imp. of right-of-use assets -1,684 -867 -873 -248 -6 -23 - 187 -3,514 Operating profit (segment profit) 1,769 1,347 213 285 -115 -184 -58 -170 3,087 Total investments2 682 420 404 1,211 653 31 - -358 3,043 Total assets 29,488 17,047 7,748 9,611 4,040 16,390 -272 -23,956 60,096 Revenue - external customers 38,189 39,713 5,652 20,756 - 10 - - 104,320 Revenue - inter -segment 87 - - 24 21 107 - -237 2 Revenue 38,276 39,713 5,652 20,780 21 117 - -237 104,322
or earnings before interest, taxes, depreciation and amortisation, is an alternative performance measure. For more information, see section Performance measures and definitions. 2Total investments are the sum of purchase of intangible assets, investment properties and property, plant and equipment as presented in the consolidated statement of cash flow, see section Performance measures and definitions for further details.
1EBITDA,
2Total
Accounting policies – Revenue
Revenue is income arising from the sale of goods and services in the ordinary course of the Group’s activities.
The Group determines the transaction price to be the amount of consideration it expects in return for transferring the promised goods and services to the customer, net of discounts and sales related taxes. In markets where products are purchased excluding excise duties, revenues from sales to customers are reported net of excise duties. In markets where products are purchased including excise duties, revenues and costs of goods sold are reported including these duties.
The Group has generally concluded that it is the principal in its revenue arrangements, because it typically controls the goods or services before transferring them to the customer. One exception is the sale of transport tickets, lotteries, telephone cards and gift cards through company operated sales outlets where the Group acts as an agent and consequently presents revenue on a net basis.
Sale of franchise services
The Group’s retail concepts are based on franchising within the market of discount grocery stores and convenience. Services promised in a franchise agreement typically include license to one of the Group’s trade names and operating methods, store access, as well as franchising leadership and support. The store access represents a service accounted for in the same way as the other revenue from sale of franchise services, for further information see section below regarding judgements in recognising revenue from sale of franchise services.
The franchise fee is based on a percentage of a store’s sales or contribution margin. The promised franchise services are acc ounted for as a single performance obligation. Agreed franchise fees are recognised over time as the services are rendered in accordance with the franchise agreements.
Significant judgements in recognising revenue from sale of franchise services
- The franchisees’ access to the Group’s store premises
The Group’s franchise agreements may grant a franchisee access to one of the Group’s store premises, provided that the franchisee follows the terms of the agreement and any further or changed instructions on the use of the premises as given by the franchisor. The Group has evaluated and concluded that the franchisee does not have the right to direct the use of the store premises. This mainly relies on the fact that it is the franchisor who controls the decision-making rights that most affect how and for what purpose the premises are used, such as the mix and pricing of goods. Hence, the store access is not considered to represent a lease component. Rather, it represents a service accounted for in the same way as the remaining revenue from sale of franchise services.
Sale of goods to franchisees
The Group sells goods to franchisees in the market of discount grocery stores and convenience stores. Revenue and a trade receivable are recognised on delivery to the franchisee.
Significant judgements in recognising revenue from sale of goods to franchisees
- Agreements with franchisees
Whether the franchisees are agents acting on behalf of the Group as the principal is an important factor to consider when assessing the overall question of how the Group should recognise revenue from the sale of goods, as the assessment determines which party is the Group’s customer and when the Group transfers control of the goods. The Group has determined that the franchisees obtain control of the goods upon delivery to the stores and are thus the Group’s customers. This is based on several factors, including the fact that the franchisees obtain formal ownership of goods upon receipt at the sales outlets, and that they can determine their use (such as determining which end-customer to sell to and pledging the goods while held in inventory). In contrast, the Group cannot require a franchisee to return or send those goods to other franchisees or instruct the franchisee to sell a good to a specific customer and therefore no longer controls the goods upon delivery to the franchisee.
Sale of goods in dealer and commission operated sales outlets
The Group sells goods in dealer and commission operated sales outlets in the market of convenience stores and mobility
Dealer and commission operated sales outlets are based on commission sales where the Group owns the inventory and pays a commission fee to the dealer or commission-based retailer. Revenue is recognised when the end customer obtains control of the goods, which is when the transaction is completed in-store.
17
123 4.2 Consolidated financial statements 4.3 Parent company financial statements 122 Our responsibility Our business Corporate governance Financial statements Appendix
Note
Revenue Consolidated financial statements | Annual report 2023 Note
–
information (continued) Financial information per operating segment 2022 Million NOK REMA 1000 NO REMA 1000 DK Reitan Conv. Uno-X Mob. Real Estate Other units Meas. diff. Elim. Reitan Retail Revenue from sale of franchise services 3,188 1,974 1,682 - - - - - 6,844 Revenue from sale of goods 31,543 30,820 2,412 21,632 - 38 - -61 86,384 Revenue from sale of other services 255 5 735 124 21 89 - -90 1,139 Revenue 34,986 32,799 4,829 21,756 21 127 - -151 94,367 Other income 412 275 256 16 183 29 124 -294 1,001 Share of profit of associates 43 4 - 7 43 - - - 97 Cost of goods sold -27,590 -28,755 -1,755 -19,223 - -32 - 130 -77,225 Other operating exp. incl. salaries -4,011 -2,138 -2,220 -1,365 -98 -284 - 138 -9,978 EBITDA1 3,840 2,185 1,110 1,191 149 -160 124 -177 8,262 Amort. and imp. of intangible assets -161 -14 -11 -96 - 1 - - -281 Depr. and imp. of prop., plant and equipment -454 -194 -297 -213 -1 -9 -89 - -1,257 Depr. and imp. of right-of-use assets -1,526 -729 -803 -159 -7 -23 - 120 -3,127 Operating profit (segment profit) 1,699 1,248 -1 723 141 -191 35 -57 3,597 Total investments2 709 216 398 779 915 25 - - 3,042 Total assets 28,737 14,838 7,426 8,163 5,272 17,329 -112 -24,124 57,529 Revenue - external customers 34,924 32,799 4,829 21,727 - 86 - 2 94,367 Revenue - inter -segment 62 - - 29 21 41 - -153Revenue 34,986 32,799 4,829 21,756 21 127 - -151 94,367 1EBITDA, or earnings before interest, taxes, depreciation and amortisation, is an alternative performance measure. For more information, see section Performance measures and definitions.
locati ons.
7 –
6
Segment
investments are the sum of purchase of intangible assets, investment properties and property, plant and equipment as presented in the consolidated statement of cash flow, see section Performance measures and definitions for further details. Financial information per geographical area Non-current assets as presented in the table below do not include financial instruments, deferred tax assets or pension assets. 2023 Million NOK Norway Denmark Sweden Finland Baltics Elim. Reitan Retail Revenue – external customers 52,390 47,504 892 901 2,618 17 104,322 Non- current assets 24,829 13,465 1,072 1,468 729 - 41,563 2022 Million NOK Norway Denmark Sweden Finland Baltics Elim. Reitan Retail Revenue – external customers 49,683 40,996 786 744 2,154 4 94,367 Non- current assets 25,161 11,542 981 1,411 707 - 39,802
Note 7 – Revenue (continued)
Accounting policies – Revenue (continued)
Sale of goods in company operated sales outlets
The Group sells goods directly to retail customers in company operated sales outlets. Revenue is recognised when the customer obtains control of the goods, which is when the transaction is completed in-store.
Sale of goods to other external customers
In addition to the above, the Group sells goods directly to external business customers such as hotels, restaurants, catering and grocery companies. The Group also sells liquid fuel to external business customers. Revenue and a trade receivable are recognised on delivery of the goods at the customer’s location.
Sale of other services
Revenue from sale of other services includes marketing income, agent income and revenue from sale of car wash services.
Marketing income is recognised as revenue when the Group provides a distinct good or service to a supplier. To the extent that a payment from a supplier is related to a specific ad or campaign that the supplier has agreed to cover its share of, the payment is deducted from the period's marketing costs. Other payments from suppliers that are not made in exchange for a specified good or service are recognised directly as a reduction in cost of goods sold.
The Group recognises agent income related to sale of transport tickets, lotteries, telephone cards and gift cards through company operated sales outlets. In these agreements, the Group acts as an agent and as such, only the commission is reported as revenue. Agent income is recognised as it is earned, i.e. when sold to end customers.
Payment for revenue transactions is typically due within 30 days. See note 19 - Receivables for the opening and closing balances of trade receivables, and note 32 – Classification of financial instruments for accounting policies of financial assets.
Excise duties
The following table summarises the Group’s excise duties which are collected on behalf of third parties and excluded from revenue.
Significant judgements in relation to classification of excise duties
Excise duties are duties which relate to the Group’s sale of refined oil products, sugar sweetened and alcoholic beverages. They are determined and paid directly to the tax authorities and then invoiced to customers by being included in the sales price.
The analysis of the criteria set by IFRS 15 led the Group to determine that it was acting as an agent in these transactions. This conclusion mainly relies on the fact that the Group can reclaim the excise duties in the event the products are not sold, and the fact that the excise duties are not considered levied until the moment of the sales transaction. As such, the excise duties are effectively considered sales-related and recoverable from the tax authorities. In markets where products are purchased excluding these excise duties, revenues are reported net of excise duties. In markets where the products are purchased including excise duties, revenues and cost of goods sold are reported including these excise duties.
Note 8 – Other income
125 4.2 Consolidated financial statements 4.3 Parent company financial statements 124 Our responsibility Our business Corporate governance Financial statements Appendix
Million NOK 2023 2022 Excise duties on refined oil products 9,316 9,253 Excise duties on sugar sweetened and alcoholic beverages 451 433
Million NOK Note 2023 2022 Rental income 15 661 590 Net gains (losses) (i) 81 89 Revaluation of investment property -1 51 Other items 286 271 Total other income 1,027 1,001 (i) Specification of net gains (losses) Million NOK 2023 2022 Gains on sale of property, plant and equipment 125 47 Gains (losses) on termination of lease agreements - 28 Foreign currency exchange gains (losses) from operating activities -27 14 Fair value changes on financial instruments related to operating activities -16Other gains (losses) -1Net gains (losses) 81 89
Consolidated financial statements | Annual report 2023
Note 7 – Revenue (continued)
The Group’s revenue from contracts with customers Million NOK 2023 2022 Revenue from sale of franchise services 7,691 6,844 Revenue from sale of goods 95,262 86,384 Revenue from sale of other services 1,369 1,139 Revenue from contracts with customers 104,322 94,367 Specification of revenue from sale of goods 2023 Million NOK REMA 1000 NO REMA 1000 DK Reitan Conv. Uno-X Mob. Other/ Elim. Reitan Retail Rev. from sale of goods to franchisees*) 28,979 29,312 - - 3,916 62,207 Rev. from sale of goods in dealer and commission op. sales outlets - - 979 6,373 -61 7,291 Rev. from sale of goods in company operated sales outlets 346 44 1,594 9,283 51 11,318 Rev. from sale of goods to other external customers*) 5,116 7,890 461 4,922 -3,943 14,446 Revenue from sale of goods 34,441 37,246 3,034 20,578 -37 95,262 2022 Million NOK REMA 1000 NO REMA 1000 DK Reitan Conv. Uno-X Mob. Other/ Elim. Reitan Retail Rev. from sale of goods to franchisees *) 26,643 23,874 - - 3,475 53,992 Rev. from sale of goods in dealer and commission op. sales outlets - - 810 5,102 -40 5,872 Rev. from sale of goods in company operated sales outlets 312 110 1,208 11,626 38 13,294 Rev. from sale of goods to other external customers*) 4,588 6,836 394 4,904 -3,496 13,226 Revenue from sale of goods 31,543 30,820 2,412 21,632 -23 86,384 *) The segments REMA 1000 Norway and REMA 1000 Denmark sell goods to franchisees within REMA 1000 and Reitan Convenience in Norway and Denmark. In the specification of revenue from sale of goods above, sales to franchisees within the segments are included in the line item Revenue from sale of goods to franchisees, while sales to franchisees outside each segment are included in the line item Revenue from sale of goods to other external customers. For the Group, these revenues represent sales to franchisees, with reclassification reflected in the elimination column.
Note 9 – Salaries and personnel costs
Key management personnel, also referred to as the Corporate Management Board, consists of Group CEO Ole Robert Reitan, Executive Vice President (EVP) and Chief Financial Officer (CFO) Kristin S. Genton, EVP and Chief Operating Officer (COO) Monica Ødegaard, EVP and Chief Communications Officer (CCO) Inger Sethov, EVP and CEO of REMA 1000 Norway Christian Hoel (replacing Tom Kristiansen as of January 1, 2024), EVP and CEO of REMA 1000 Denmark Henrik Burkal, EVP and CEO of Reitan Convenience Mariette Kristenson, and EVP and CEO of Uno-X Mobility Vegar Kulset.
The table below outlines the compensation paid to the Group CEO of Reitan Retail for 2023 and 2022.
Note 9 – Salaries and personnel costs (continued)
Pensions
The Group has several pension schemes for its employees. There are various schemes in the different countries that Reitan Retail operates in, and the schemes also vary between companies within the same country. The majority of the companies within the Group offer their employees defined contribution plans. The Norwegian companies in the Group are subject to, and complies with, the requirements of the Norwegian Mandatory Company Pensions Act. As at December 31, 2023 the Group has defined contribution plans with 5,193 members (4,462 members as at December 31, 2022) and defined benefit plans with 358 members (386 members as at December 31, 2022).
For defined contribution plans, the Group pays contributions to privately administered pension insurance plans on a mandatory, contractual or voluntary basis. The Group has no further payment obligations once the contributions have been paid. The contributions are recognised as employee benefit expense when they are due.
A defined benefit plan typically defines an amount of pension benefit that an employee will receive on retirement, usually dependent on one or more factors such as age, years of service and compensation. In addition to defined benefit plans funded through insurance companies, the Group also has unfunded pension liabilities covered by operations.
The table below outlines key management compensation for 2023 and 2022 for all key management except the Group CEO Cost of hiring the CFO from REITAN AS is not included in the table. See note 34 – Related party transactions in regards of fee paid for key management personnel services to REITAN AS
Loans and security for loans to employees, executives, etc.
The Group had no loans to employees as at December 31, 2023 or as at December 31, 2022. No loans have been granted to, nor security pledged for, the chief executive officer, the chair of the board or other close associates.
Remuneration to the Board of Directors
Information about the individual remuneration to the members of the Board of Directors is provided in the following
Rune Bjerke (Chair of the Board from May 2022)
Magnus Reitan (Board Member from May 2010)
Eilert Giertsen Hanoa (Board Member from May 2022)
Company shares owned by directors, executives and their related parties
Ole Robert Reitan, Group CEO of Reitan Retail, and Magnus Reitan, Board Member of Reitan Retail, own 67 percent of the shares in REITAN AS, which is the parent company of Reitan Retail AS.
127 4.2 Consolidated financial statements 4.3 Parent company financial statements 126 Our responsibility Our business Corporate governance Financial statements Appendix 21
Specification of pension costs Million NOK 2023 2022 Defined benefit plans -1 -2 Defined contribution plans -282 -211 Pension costs (incl. in salaries and personnel costs) -283 -213 Net interest expenses - defined benefit plans (incl. in other interest expenses) -2 -1 Remeasurement of defined benefit plans (incl. in other comprehensive income) -9 1 Total pension costs -294 -213 Fees to auditors Million NOK 2023 2022 Statutory audit services -17 -15 Assurance services -1 -1 Other non -audit services -2 -9 Tax advisory services -1 -1 Total fees to auditors -21 -26 Audit fees covered on behalf of franchisees -11 -11 All amounts relating to audit fees specified above are exclusive of VAT. Audit fees covered on behalf of franchisees are not included in total fees to auditors.
Consolidated
financial statements | Annual report 2023
Salaries Million NOK 2023 2022 Salaries and holiday pay1 -4,205 -3,373 Social security tax -393 -330 Pension costs1 -283 -213 Other personnel costs1 -99 -87 Total salaries and personnel costs -4,980 -4,003 Average number of employees 6,863 6,141 Number of full-time equivalents during the year 5,888 5,229 Key management compensation
Million NOK 2023 2022 Salary and other short-term employee benefits -9.0 -8.2 Pension costs2 -1.1 -1.0 Total compensation paid to the Group CEO -10.1 -9.2
Million NOK 2023 2022 Salary and other short-term employee benefits -66 -65 Other long -term benefits -3 -7 Pension costs2 -8 -8 Total compensation paid to key management personnel, excl. Group CEO and CFO -77 -80
table: Million NOK 2023 2022
-0.9 -0.5
-
-0.4 -0.3
Note 11 – Net financial
policies – Income taxes
The tax effect on items recognised in comprehensive income are included in the comprehensive income statement. The same applies to any tax effects of equity transactions that are entered directly to equity.
Deferred tax assets and liabilities are offset to the extent that the deferred taxes relate to the same fiscal authority, and there is a legally enforceable right to offset current tax assets against current tax liabilities.
Deferred tax assets related to tax losses carried forward are recognised if there is convincing evidence that sufficient
income will be available through future taxable income.
129 4.2 Consolidated financial statements 4.3 Parent company financial statements 128 Our responsibility Our business Corporate governance Financial statements Appendix 23 Accounting
Income tax expenses
income tax payable Million NOK 2023 2022 Current tax on profit for the year -513 -605 Adjustments in current tax previous years 5 -8 Changes in deferred tax 63 2 Income tax expenses -445 -611 Current tax on profit for the year 1 513 605 Prepaid taxes -330 -416 Effect of group contribution -47 -139 Acquisition and disposal of subsidiaries and other effects -2 -11 Net income tax payable as at December 31 134 39 Income tax payable (liability) 254 124 Prepaid taxes (receivable) -120 -85 Net income tax payable as at December 31 134 39 Reconciliation of Norwegian corporate income tax rate to effective tax rate Million NOK 2023 2022 Profit before taxes 1,854 2,456 Expected corporate income tax rate in Norway 22% -408 -540 Effect of different tax rates outside Norway 2 -22 Effect of changes in tax rates - -1 Effect of non-deductible expenses -52 -65 Effect of share of profit of associates reported net of tax 16 19 Effect of non-taxable income 9 6 Effect of adjustments in taxes previous years 5 -8 Other -17Income tax expenses -445 -611 Effective tax rate in % 24% 25% The nominal tax rates in the countries where the Group operates were as follows in 2023 and 2022; 22.0 percent in Norway, 20.6 percent in Sweden, 22.0 percent in Denmark, 20.0 percent in Finland, 15.0 percent in Lithuania, 0.0 percent in Latvia, and 0.0 percent in Estonia. In Latvia and Estonia, a tax rate of 20.0 percent is payable on dividend payments. Note
taxes Consolidated financial statements | Annual report 2023 22 Note
– Other operating expenses Accounting policies - Other operating expenses Cost of distributing goods from the Group's distribution centres or fuel storage sites to sales outlets or mobility locations are included in other operating expenses. Million NOK Note 2023 2022 Lease expenses not capitalised 15 -558 -412 Maintenance -1,193 -1,042 Distribution -1,696 -1,502 IT -821 -685 Loss on receivables -31 -64 Other items -2,500 -2,270 Total other operating expenses -6,799 -5,975 Expenses reported in "Other items" include costs related to marketing, external personnel, fees (legal, audit and other consultancy fees), travel, office equipment and insurances.
items Million NOK 2023 2022 Interest income - cash and cash equivalents 61 61 Interest income - customers 20 10 Interest income - other 10 8 Total interest income 91 79 Interest expense - lease liabilities -935 -811 Interest expense - borrowings from banks -285 -187 Net interest expense - interest rate swaps 2Interest expense - provisions for liabilities -16 -12 Interest expense - other -30 -29 Total other interest expenses -329 -228 Dividend income, received from financial investments 2 2 Realised gains (losses) on financial investments -54 1 Unrealised gains (losses) on financial investments -42 -249 Net gains (losses) on financial investments -94 -246 Net foreign currency exchange gains (losses) on financing activities 37 65 Fair value gains (losses) on derivative financial instruments -2 3 Net other financial income (expenses) -1 -3 Net other financial items 34 65 Net financial items -1,233 -1,141 Reconciliation of interest paid as presented in the consolidated statement of cash flow: Million NOK 2023 2022 Interest expense - lease liabilities -935 -811 Total other interest expenses -329 -228 Total interest expenses -1,264 -1,039 Less: Interest expense - provisions for liabilities 16 12 Interest paid -1,248 -1,027
taxable
and
12 – I ncome
10
As at December 31, 2023, the Group has NOK
at December 31, 2022). The amounts not recognised are mainly related to Norway and Denmark and may be
forward indefinitely.
OECD’s BEPS Pillar 2
The Group is within the scope of the OECD Pillar Two rules effective from January 1, 2024. As at December 31, 2023, the Group had no related current tax exposure as this legislation was not effective at this date. The Group applies the exception to recognising and disclosing information about deferred tax assets and liabilities related to Pillar Two income taxes.
Under the legislation, the Group is subject to top-up tax for the difference between their Global Anti-Base Erosion
(“GloBE tax rate”) per jurisdiction and the 15 percent minimum rate. The Group expects that the Pillar Two rules will not have material impact on the effective tax rate of the Group.
131 4.2 Consolidated financial statements 4.3 Parent company financial statements 130 Our responsibility Our business Corporate governance Financial statements Appendix 25 Net deferred tax assets (liabilities) Million NOK Intangible assets Investment prop. Property, plant and equipm. Right -of-use assets / lease liab. Provisions Tax losses carried forward Other Total Net DTA (DTL) as at Jan. 1, 2022 -213 2 -324 436 134 -48 35 22 Recognised in profit or loss 1 1 -19 -2 2 49 -30 2 Recognised in OCI - - - - - - 5 5 Acquisition / disposal of subs. 7 - -16 - - 1 - -8 Effect of group contribution - - - - - - -85 -85 Translation differences -21 1 -12 4 3 4 -1 -22 Net DTA (DTL) as at Dec. 31, 2022 -226 4 -371 438 139 6 -76 -86 Recognised in profit or loss -3 7 -4 6 19 54 -16 63 Recognised in OCI - - - - - - 6 6 Acquisition / disposal of subs. - - 114 7 - -12 - 109 Effect of group contribution - - - - - - 92 92 Translation differences -9 - -9 7 5 -5 - -11 Net DTA (DTL) as at Dec. 31, 2023 -238 11 -270 458 163 43 6 173
deferred
have not been recognised (NOK 36 million as
Deferred tax assets and deferred tax liabilities recognised in the consolidated statement of financial position Million NOK 2023 2022 Deferred tax assets, not offset within the same taxation auth. 907 850 Effect of deferred tax assets offset against deferred tax -269 -259 Deferred tax assets in the balance as at December 31 638 591 Deferred tax liabilities, not offset within the same tax auth. 734 936 Effect of deferred tax liabilities offset against deferred tax assets -269 -259 Deferred tax liabilities in the balance as at December 31 465 677 Net deferred tax assets (liab.) as at December 31 173 -86 Income tax expenses recognised in other comprehensive income Million NOK 2023 Before tax 2023 Tax 2023 After tax 2022 Before tax 2022 Tax 2022 After tax Share of OCI of associates 16 - 16 -2 - -2 Foreign currency translation effect 389 - 389 304 - 304 Net gain/(loss) on cash flow hedges -19 4 -15 -23 5 -18 Remeasurement gain (loss) on defined benefit plans -9 2 -7 2 - 2 Other comprehensive income 377 6 383 281 5 286
117 million in
tax assets that
carried
effective tax rate
Note
Consolidated financial statements | Annual report 2023 24 Tax effect of temporary differences Deferred tax assets (DTA) Million NOK Intangible assets Investment prop. Property, plant and equipm. Right -of-use assets / lease liab. Provisions Tax losses carried forward Other Total DTA as at January 1, 2022 - 10 67 441 138 24 104 784 Recognised in profit or loss - 1 34 -2 3 49 -31 54 Recognised in OCI - - - - - - -Acquisition / disposal of subs. - - - - - 1 - 1 Translation differences - 1 1 4 3 2 - 11 DTA as at December 31, 2022 - 12 102 443 144 76 73 850 Recognised in profit or loss - 2 3 6 17 51 -14 65 Recognised in OCI - - - - - - -Acquisition / disposal of subs. - - -17 7 - -12 - -22 Translation differences - - 2 7 5 - - 14 DTA as at December 31, 2023 - 14 90 463 166 115 59 907 Deferred tax liabilities (DTL) Million NOK Intangible assets Investment prop. Property, plant and equipm. Right -of-use assets / lease liab. Provisions Tax losses carried forward Other Total DTL as at January 1, 2022 -213 -8 -391 -5 -4 -72 -69 -762 Recognised in profit or loss 1 - -53 - -1 - 1 -52 Recognised in OCI - - - - - - 5 5 Acquisition / disposal of subs. 7 - -16 - - - - -9 Effect of group contribution - - - - - - -85 -85 Translation differences -21 - -13 - - 2 -1 -33 DTL as at December 31, 2022 -226 -8 -473 -5 -5 -70 -149 -936 Recognised in profit or loss -3 5 -7 - 2 3 -2 -2 Recognised in OCI - - - - - - 6 6 Acquisition / disposal of subs. - - 131 - - - - 131 Effect of group contribution - - - - - - 92 92 Translation differences -9 - -11 - - -5 - -25 DTL as at December 31, 2023 -238 -3 -360 -5 -3 -72 -53 -734 Note
ncome
12 – I ncome taxes (continued)
12 – I
taxes (continued)
Consolidated financial statements | Annual report 2023
Note 13 – Intangible assets
Accounting policies – Intangible assets
The Group amortises licences, IT and trademarks with a limited useful life, using the straight-line method over their useful economic lives of five to ten years.
The Group’s trademarks include R-kioski (Finland), R-kiosk (Estonia) and Lietuvos Spauda (Lithuania). The R-kioski, R-kiosk and Lietuvos Spauda trademarks are considered to have indefinite useful lives. Trademarks that have indefinite useful lives, since they are expected to provide economic benefits to the Group indefinitely, are not amortised, but tested for impairment annually or more frequently should events or changes in circumstances indicate that they might be impaired.
Intangible assets
The Group has not recognised any significant impairments in 2023 or 2022. The impairment of goodwill in 2022 relates to an acquisition in the Uno-X Mobility segment (acquisition of Ipart Group in November 2022), which is considered immaterial to the Group.
Note 13 – I ntangible
assets (continued)
Estimate for measuring recoverable amount
Impairment is determined by assessing the recoverable amount of each cash generating unit (CGU) to which the goodwill or trademarks relates. If the recoverable amount of a CGU is less than its carrying amount, an impairment loss is recognised.
The recoverable amount is determined based on value in use calculations using cash flow projections from financial prognosis approved by management, covering a three to five year period. A terminal value is calculated for the period beyond the initial prognosis period, using a constant nominal growth rate, corresponding to country specific expected long-term inflation.
The cash flow projections are based on past performance, expected market development and strategic plans, with the three most important parameters being expected growth in sale of goods and services to franchisees (driven by overall expected growth in systemwide sales*), EBITDA* (operating profit before amortisation, depreciation and impairment) and number of sales outlets. The existence of any immediate or short-term physical risks due to climate change were also considered in assessing for any indication of impairment.
The Group constantly monitors the latest government legislation in relation to climate-related matters. At the current time, no legislation has been passed that will impact the Group. The Group will adjust the key assumptions used in value in use calculations and sensitivity to changes in assumptions should a change be required. For further information on climate-related risk and its impact on impairment of non-financial assets, see note 4.
The Group uses observable market data, such as risk-free rates and market risk premiums obtained from recognised financial data services, for the calculation of discount rates. In the recoverable amount assessment, the Group has applied estimated cash flows after tax and corresponding discount rates after tax. The recoverable amounts would not have changed significantly if pre-tax cash flows and pre-tax discount rates had been applied instead.
Goodwill and trademarks are allocated to CGUs or groups of CGUs as shown in the following table:
Sensitivity
Goodwill and trademarks with indefinite useful lives are related to financially strong business areas. The Group has carried out sensitivity analyses on the reasonably possible changes in key assumptions in the impairment tests for each group of CGUs to which goodwill or trademarks have been allocated. Neither a reasonably possible increase of 2.0 percentage point in discount rates, nor a decrease of 2.0 percentage point in long-term growth rates would indicate impairment in any group of cashgenerating units to which goodwill has been allocated.
Significant accounting judgements in relation to allocation of goodwill to cash -generating units
Judgements are required when allocating goodwill to cash-generating units. The significant part of the Group’s goodwill is allocated to the Group’s retail segments REMA 1000 Norway, REMA 1000 Denmark and Reitan Convenience, and followed up and tested collectively for the group of cash-generating units that constitute these retail segments. Goodwill has been allocated to these segments as this is the level where synergies are expected and goodwill is monitored for internal management purposes.
*Systemwide sales and EBITDA are APMs. For more information, see section Performance measures and definitions.
133 4.2 Consolidated financial statements 4.3 Parent company financial statements 132 Our responsibility Our business Corporate governance Financial statements Appendix 27
Million NOK WACC Goodwill Trademarks Total REMA 1000 Norway 7.8% 1,039 - 1,039 REMA 1000 Denmark 6.8% 168 - 168 Reitan Convenience 9.0% 1,489 320 1,809 Uno-X Mobility - 4 - 4 Carrying amount as at December 31, 2023 2,700 320 3,020 Million NOK WACC Goodwill Trademarks Total REMA 1000 Norway 6.5% 1,039 - 1,039 REMA 1000 Denmark 6.1% 158 - 158 Reitan Convenience 8.5% 1,406 309 1,715 Uno-X Mobility - 4 - 4 Carrying amount as at December 31, 2022 2,607 309 2,916
Million NOK Goodwill Trademarks, licences and IT Development Total Cost price 2,738 2,621 86 5,445 Accumulated amortisation and impairment charges -188 -1,468 - -1,656 Carrying amount as at January 1, 2022 2,550 1,153 86 3,789 Additions - 139 91 230 Additions from acquisition of subsidiaries 60 36 7 103 Reclassifications - 71 -55 16 Disposal - -4 - -4 Amortisation - -221 - -221 Impairment loss -60 - - -60 Foreign currency translation effects 57 18 - 75 Carrying amount as at December 31, 2022 2,607 1,192 129 3,928 Cost price 2,851 2,865 129 5,845 Accumulated amortisation and impairment charges -244 -1,673 - -1,917 Carrying amount as at December 31, 2022 2,607 1,192 129 3,928 Additions - 72 112 184 Additions from acquisition of subsidiaries - - -Reclassifications - 133 -136 -3 Disposal - -2 - -2 Amortisation - -238 - -238 Impairment loss - -23 -9 -32 Foreign currency translation effects 93 31 - 124 Carrying amount as at December 31, 2023 2,700 1,165 96 3,961 Cost price 2,960 3,133 106 6,199 Accumulated amortisation and impairment charges -260 -1,968 -10 -2,238 Carrying amount as at December 31, 2023 2,700 1,165 96 3,961
Accounting policies – Property, plant and equipment
Property, plant and equipment are held at historical cost less accumulated depreciation and any recognised provision for impairment. Where applicable, estimated asset retirement costs and costs relating to environmental restoration are added to the cost of the relevant asset. See note 25 – Provisions for further information on asset retirement obligations and environmental obligations.
Depreciation is calculated using the straight-line method to allocate the cost of the assets, net of their residual values, over their estimated useful lives as follows:
• Buildings and plants: 10-25 years
• Fixtures: 5-10 years
• Vehicles: 5-25 years
• Office equipment: 3-5 years
Gains and losses on disposal are recognised in the consolidated statement of profit or loss under Net gains (losses) and constitute the difference between net proceeds and carrying amount.
At each reporting date, the Group reviews the carrying amounts of its property, plant and equipment to determine whether there is any indication of impairment. If any such indication exists, the recoverable amount is estimated.
Impairment exists when the carrying value of an asset or cash-generating unit (CGU) exceeds its recoverable amount, which is the higher of its fair value less costs of disposal and its value in use. The fair value less costs of disposal calculation is based on available data from binding sales transactions, conducted at arm’s length, for similar assets or observable market prices less incremental costs of disposing of the asset. The value in use calculation is based on a discounted cash flow model (DCF). The cash flows are derived from budgets for the next three to five years.
Significant accounting judgements - Classification of property as owner-occupied with regards to the franchisees’ access to the Group’s store premises
The Group’s franchise agreements may grant a franchisee access to one of the Group’s store premises, provided that the franchisee applies the terms of the agreement and follows any further or changed instructions on the use of the premises as given by the franchisor. The Group has evaluated and concluded that the franchisee does not have the right to direct the use of the store premises. This mainly relies on the fact that it is the franchisor who controls the decision-making rights that most affect how and for what purpose the premises are used, such as the mix and pricing of goods. Hence, the store access is not considered to represent a lease component and the properties are measured at cost as they are considered owner-occupied.
For information on climate-related risk and its impact on impairment assessments and the useful lives of asset, see note 4 –Climate risk.
Note 14 – Property, plant and equipment (continued)
Impairment losses recognised in the year
The impairment loss on land, buildings and plants is mainly related to a NOK 210 million impairment of the real estate portfolio in REMA Etablering AS which was disposed in 2023. The recoverable value of the portfolio, measured based on the agreed selling price, was determined to be lower than its carrying amount. The sale of the company was completed in December 2023. The remaining impairment losses for the Group largely reflect higher yields in the real estate market, increased building costs, as well as lower observable market prices. The impairment losses have been included in the consolidated statement of profit or loss in the line item Depreciation and impairment of property, plant and equipment.
135 4.2 Consolidated financial statements 4.3 Parent company financial statements 134 Our responsibility Our business Corporate governance Financial statements Appendix 29 Property, plant
equipment Million NOK Land, buildings and plants Fixtures Vehicles Office eq. Constr. in progr. Total Cost 5,430 12,015 91 3,050 416 21,002 Accumulated depreciation and impairment -1,021 -6,771 -34 -1,902 -19 -9,747 Carrying amount as at January 1, 2022 4,409 5,244 57 1,148 397 11,255 Additions 1,153 988 7 232 174 2,554 Additions from acquisition of subsidiaries 127 5 - 4 - 136 Reclassifications 85 69 2 20 -187 -11 Disposal -403 -80 -2 -2 -14 -501 Depreciation -194 -861 -8 -189 - -1,252 Impairment -2 -7 - -2 -6 -17 Reversals of impairment - 12 - - - 12 Foreign currency translation effects 125 77 - 17 7 226 Carrying amount as at December 31, 2022 5,300 5,447 56 1,228 371 12,402 Cost 6,506 12,539 95 3,334 394 22,868 Accumulated depreciation and impairment -1,206 -7,092 -39 -2,106 -23 -10,466 Carrying amount as at December 31, 2022 5,300 5,447 56 1,228 371 12,402 Additions 985 1,282 22 238 332 2,859 Additions from acquisition of subsidiaries - - - - -Reclassifications 91 96 - 35 -220 2 Disposal -924 -89 -3 -29 -59 -1,104 Depreciation -212 -919 -9 -225 - -1,365 Impairment -341 -34 - -2 -25 -402 Reversals of impairment - - - - -Foreign currency translation effects 177 119 - 26 5 327 Carrying amount as at December 31, 2023 5,076 5,902 66 1,271 404 12,719 Cost 6,563 13,647 110 3,559 418 24,297 Accumulated depreciation and impairment -1,487 -7,745 -44 -2,288 -14 -11,578 Carrying amount as at December 31, 2023 5,076 5,902 66 1,271 404 12,719 Purchase of property, plant and equipment as presented in the cash flow statement Land, buildings and plants Fixtures Vehicles Office eq. Constr. in progr. Total Million NOK 2023 985 1,282 22 238 332 2,859 2022 1,280 993 7 236 174 2,690 Proceeds from sale of property, plant and equipment as presented in the cash flow statement Land, buildings and plants Fixtures Vehicles Office eq. Constr. in progr. Total Million NOK 2023 1,048 89 3 29 59 1,228 2022 442 87 3 2 14 548
and
Consolidated financial statements | Annual report 2023 28
– Property, plant
equipment
Note 14
and
financial statements | Annual report 2023
Note 14 – Property, plant and equipment (continued)
Note 15 – Leases (continued) Consolidated
Assets pledged as security
As at December 31, 2023, properties with a carrying amount of NOK 217 million (NOK 224 million as at December 31, 2022) were subject to borrowings secured by collateral. See note 26 – Borrowings for further details
Assets held for sale and restricted assets
The Group had no assets classified as held for sale or as restricted as at December 31, 2023, or as at December 31, 2022.
Note 15 – Leases
Accounting policies – Leases; the Group as a lessee
At the lease commencement date, the Group recognises a lease liability and corresponding right-of-use asset for all lease agreements in which it is the lessee, except for the following exemptions applied:
• Short-term leases (defined as 12 months or less)
• Low-value assets (defined as assets with a new value of NOK 100 000 or less)
For these exempted leases, the Group recognises the lease payments as other operating expenses in the consolidated statement of profit or loss when they are incurred.
The lease liability is initially measured at the present value of the remaining lease payments during the assessed lease term. The discount rate used to calculate the present value of future lease payments is the interest rate implicit in the lease, if available.
Significant accounting estimates and judgements
Determining the lease term of contracts with renewal options
The lease term represents the non-cancellable period of the lease, together with periods covered by an option to extend the lease if it is reasonably certain to exercise the option, or any periods covered by an option to terminate the lease, if it is reasonably certain not to exercise the option.
The Group has several lease contracts that include extension options. The Group applies judgement in evaluating the certainty as to whether or not the option to renew the lease will be exercised. That is, it considers all relevant factors that create an economic incentive for it to exercise the renewal options, such as major premises renovations or specific requirements in a franchise agreement. After the commencement date, the Group reassesses the lease term to see if there is a significant event or change in circumstances that is within its control and affects its ability to exercise the option to renew.
Estimating the incremental borrowing rate
The Group cannot readily determine the interest rate implicit in its leases, therefore, it uses its incremental borrowing rate (IBR) to measure lease liabilities. The IBR is the rate of interest that the Group would have to pay to borrow, over a similar term, and with a similar security, the funds necessary to obtain an asset of a similar value to the right-of-use asset in a similar economic environment. The IBR therefore reflects what the Group ‘would have to pay’, which requires estimation when no observable rates are available (such as for subsidiaries that do not enter into financing transactions) or when they need to be adjusted to reflect the terms and conditions of the lease. To arrive at the incremental borrowing rate, the Group applies the respective country’s (economic environment) risk-free rate for the term corresponding to the lease term, and a credit premium. The credit premium corresponds to the market credit premium for companies with similar credit ratings as the tenant.
Accounting policies – Leases; The Group as a lessor
The Group has classified its lease agreements in which it is a lessor as operating leases since substantially all the risks and rewards of ownership are retained by the Group.
Lease payments for operating leases are treated as income and distributed over the life of the lease on a straight-line basis.
The Group as a lessee
The Group operates franchise-based businesses in the markets of discount grocery stores and convenience. As such, it has a longterm need for appropriate properties in the right locations – for sales outlets as well as warehouses and logistics operations. The large number of leases with options to extend the lease ensures flexibility and future performance.
Right-of-use assets
Remeasurements
The remeasurements of right-of-use assets relating to sales outlets mainly result from changes in lease terms as well as changes in indexes used to determine the lease payments The increase in remeasurements compared to last year mainly relates to the current macroeconomic environment and inflationary pressure, refer to note 3
137 4.2 Consolidated financial statements 4.3 Parent company financial statements 136 Our responsibility Our business Corporate governance Financial statements Appendix 31
Million NOK Land Sales outlets Warehouse and prod.fac. Offices Vehicles and offices eq. Total Carrying amount as at January 1, 2022 473 17,068 2,776 262 387 20,966 Reclassifications - - - - -Additions 132 796 846 1 116 1,891 Disposals - -13 - - -2 -15 Remeasurements 41 1,972 109 108 4 2,234 Impairment - -4 - - - -4 Reversal of impairment - 19 - - - 19 Depreciation -80 -2,611 -271 -54 -126 -3,142 Foreign currency translation effects 4 277 63 -1 5 348 Carrying amount as at December 31, 2022 570 17,504 3,523 316 384 22,297 Reclassifications 15 -23 8 - -Additions 116 808 272 16 313 1,525 Disposals - -1 - -1 -12 -14 Remeasurements 74 2,645 227 37 6 2,989 Impairment - - - - -Reversal of impairment - - - - -Depreciation -113 -2,885 -295 -57 -164 -3,514 Foreign currency translation effects 6 422 75 3 6 512 Carrying amount as at December 31, 2023 668 18,470 3,810 314 533 23,795 Remaining lease term 1-30 1-45 years 1-25 years 1-10 years 1-7 years Depreciation method Straight Straight Straight Straight Straight
risk management,
Number
leases Land Sales outlets Warehouse and prod.fac. Offices Number of lease contracts as at December 31, 2022 218 3,081 87 37 Number of lease contracts as at December 31, 2023 439 2,797 80 32 Number of lease contracts containing options to extend the lease as at December 31, 2023 267 1,490 14 10
– Financial
section 3.5.
of
Remeasurements
The remeasurements of lease liabilities relating to sales outlets mainly result from changes in lease terms as well as changes in indexes used to determine the lease payments. The increase in remeasurements compared to last year mainly relates to the current macroeconomic environment and inflationary pressure, refer to note 3 – Financial risk management, section 3.5.
Variable lease payments
Some property leases contain variable payments that are linked to sales generated from a sales outlet. Variable payment terms are used for a variety of reasons, including linking rental payments to store cash flows and reducing fixed cost.
The following table provides information on the Group’s variable lease payments, including the magnitude in relation to fixed payments:
that are not capitalised
139 4.2 Consolidated financial statements 4.3 Parent company financial statements 138 Our responsibility Our business Corporate governance Financial statements Appendix 33 Total cash flow related to leases Million NOK Land Sales outlets Warehouse and prod.fac. Offices Vehicles and office eq. Total Total cash flow related to leases 2023 -156 -4,030 -464 -72 -220 -4,942 Total cash flow related to leases 2022 -115 -3,552 -412 -64 -175 -4,318 Reconciliation of lease payments presented in consolidated statement of cash flow Million NOK 2023 2022 Total lease expenses, included in profit before taxes -558 -412 Paid and expensed interest on lease liabilities -936 -811 Payment of principal portion of lease liabilities, presented on a separate line -3,448 -3,095 Total cash flow related to leases -4,942 -4,318 Maturity analysis of undiscounted lease liabilities Million NOK 31.12.23 31.12.22 Within 1 year 4,277 3,874 Within 1- 2 years 3,908 3,536 Within 2- 3 years 3,462 3,138 Within 3- 4 years 3,052 2,736 Within 4- 5 years 2,668 2,427 Within 5- 10 years 9,313 8,623 Within 10 -15 years 3,351 3,169 Within 15 -20 years 861 861 More than 20 years 120 164 Total undiscounted lease liabilities 31,012 28,528 Effect of discounting -5,646 -4,663 Present value of lease liabilities 25,366 23,865 Future lease payments for non-cancellable lease contracts that have not yet commenced Future lease payments for non-cancellable lease contracts that have not yet commenced as at December 31, 2023 are NOK 55 million within one year, NOK 626 million within five years and NOK 1,706 million thereafter. The Group as a lessor The Group has operating lease arrangements in which it is a lessor, mainly related to lease of fixture to stores and lease of fuel infrastructure. Lease income Million NOK 2023 2022 Total rental income 661 590 Of which variable rental income 145 111 Maturity analysis of undiscounted fixed lease payments to be received Million NOK 2023 2022 Within 1 year 230 330 Within 1 - 2 years 174 251 Within 2 - 3 years 132 214 Within 3 - 4 years 98 173 Within 4 - 5 years 78 131 More than 5 years 291 266 Total undiscounted lease payments 1,003 1,365
Consolidated financial statements | Annual report 2023 32 Lease liabilities Million NOK Land Sales outlets Warehouse and prod.fac. Offices Vehicles and office eq. Total Carrying amount as at January 1, 2022 489 18,379 3,075 280 324 22,547 Reclassifications - - - - -Additions 131 788 846 1 98 1,864 Disposals - -19 - - - -19 Remeasurements 40 1,959 95 108 9 2,211 Payments -96 -3,228 -399 -62 -121 -3,906 Interest expense 19 663 116 7 6 811 Foreign currency translation effects 3 286 64 -1 5 357 Carrying amount as at December 31, 2022 586 18,828 3,797 333 321 23,865 Current liabilities 106 3,185 393 61 116 3,861 Non- current liabilities 480 15,643 3,404 272 205 20,004 Carrying amount as at December 31, 2022 586 18,828 3,797 333 321 23,865 Reclassifications 11 -19 9 - - 1 Additions 92 782 272 16 293 1,455 Disposals - - - -1 -1 -2 Remeasurements 75 2,639 227 37 6 2,984 Payments -132 -3,573 -446 -71 -162 -4,384 Interest expense 28 737 144 13 14 936 Foreign currency translation effects 6 420 76 4 5 511 Carrying amount as at December 31, 2023 666 19,814 4,079 331 476 25,366 Current liabilities 127 3,494 421 68 157 4,267 Non- current liabilities 539 16,320 3,658 263 319 21,099 Carrying amount as at December 31, 2023 666 19,814 4,079 331 476 25,366
Note 15 – Leases (continued)
Million NOK 2023 2022 Variable lease payments -374 -331 Fixed lease payments -4,568 -3,987 Total lease payments -4,942 -4,318 Lease expenses
Million NOK 2023 2022 Variable lease payments -374 -331 Expenses related to short-term leases -128 -33 Expenses related to leases of low-value assets -56 -48 Total lease expenses -558 -412
Note 15 – Leases (continued)
None of the Group's associates are publicly listed. The associates had no contingent liabilities as at December 31, 2023 or as at December 31, 2022.
The Group had no material investments in joint ventures as at December 31, 2023 or as at December 31, 2022.
Material associates
Company name Office address Ownership Business
BAMA Gruppen AS Oslo, Norway 20.0% (19 8% in 2022) Wholesale of fruit and vegetables
The list shows direct ownership.
BAMA Gruppen AS prepares its financial statements in accordance with the Norwegian Accounting Act and generally accepted accounting principles in Norway. In the consolidated financial statements of Reitan Retail, the figures of BAMA Gruppen AS are restated to comply with IFRS. Adjustments primarily relate to amortisation of goodwill and actuarial gains/(losses) not recognised in profit or loss.
Significant accounting judgement in 2022 – Classification of investment in BAMA Gruppen AS As at December 31, 2022 the Group had a 19.8 percent interest in BAMA Gruppen AS. Through the shareholder agreement, the Group is entitled to one seat on the board of BAMA Gruppen AS and participates in significant financial and operating decisions. The Group therefore determined that it had significant influence over this entity, even though it held less than 20 percent of the voting rights. As such, BAMA Gruppen AS was classified as an associated company in the Group’s consolidated financial statements in 2022. Note
The following tables set forth summarised financial information of BAMA Gruppen AS, and reconciliation with the
amount of the investment for the Group:
Statement of financial position
141 4.2 Consolidated financial statements 4.3 Parent company financial statements 140 Our responsibility Our business Corporate governance Financial statements Appendix 35
carrying
BAMA Gruppen AS Million NOK 2023 2022 Current assets 3,444 3,344 Non- current assets 5,712 5,290 Total assets 9,156 8,634 Current liabilities 3,225 3,491 Non- current liabilities 2,503 2,102 Total liabilities 5,728 5,593 Total equity 3,428 3,041 Total equity and liabilities 9,156 8,634
BAMA Gruppen AS Million NOK 2023 2022 Revenues 23,055 21,460 Profit for the year 421 215 Other comprehensive income/(loss) for the year, net of tax 80 -9 Total comprehensive income for the year, net of tax 501 206
of changes in equity BAMA Gruppen AS Million NOK 2023 2022 Net assets as at January 1 3,041 3,081 Profit for the year 421 215 Other comprehensive income/(loss) for the year, net of tax 80 -9 Dividend -114 -246 Net assets as at December 31 3,428 3,041 Reconciliation of carried amounts BAMA Gruppen AS Million NOK 2023 2022 Percentage ownership interest 20.0% 19.8% Share of profit for the year* 90 43 Share of other comprehensive income/(loss) for the year, net of tax 16 -2 Share of total comprehensive income for the year, net of tax 106 41 *Including effect of NOK 6 million from increase in ownership interest from 19.8 percent to 20 Ownership interest as at December 31 686 602 Goodwill 15 15 Carrying amount as at December 31 701 617 Note
– Investments in associated companies (continued) Consolidated financial statements | Annual report 2023 34
policies
Investments in associated companies
Statement of comprehensive income
Statement
16
Accounting
–
accounted for
applying the equity method,
share of profit of associates is presented as part of operating profit as investments in companies engaged in retail, fuel
real estate-related business activities are considered to be part of
Retail’s core operating activities. Associated companies Million NOK 2023 2022 Carrying amount as at January 1 1,102 1,018 Additions 146 85 Disposals -267 -34 Profit for the year 99 97 Other comprehensive income/(loss) for the year, net of tax 16 -2 Dividend received -58 -70 Foreign currency translation effects 12 8 Carrying amount as at December 31 1,050 1,102
Associates are
by
and the
or
Reitan
Investments
associated companies
16 –
in
Note 16 – Investments in associated companies (continued)
Note 17 – Investments in subsidiaries
Accounting policies – Investments in subsidiaries
Subsidiaries are entities controlled by the Group. The Group ‘controls’ an entity when it is exposed to, or has rights to, variable returns from its involvement with the entity and has the ability to affect those returns through its power over the entity. The financial statements of subsidiaries are included in the consolidated financial statements from the date on which control commences until the date on which control ceases.
Significant accounting judgements - Agreements with franchisees
The Group operates franchise-based businesses in the markets of discount grocery stores and convenience under the Reitan Format Franchise model. Within the franchise agreement, the franchisee controls the majority, or in some cases all, of the activities related to efficient store operations, hiring and training of employees, financing and investment activities. The Group has power to direct other activities, however, the rights to direct those activities are to a large extent protective rather than substantive. Therefore, the franchisees have power over the entity. Both parties have the ability to direct different relevant activities, however, it is the Group’s opinion that the franchisee is subject to greater exposure with regard to variable return and to a greater extent has the ability to use its power to influence the variable return. Based on a judgement of the criteria in IFRS 10, the Group has determined that it does not control its franchisees and the franchisees are therefore not consolidated.
Material subsidiaries
REMA 1000 AS Oslo, Norway
Norge AS Oslo, Norway
1000 Danmark A/S Horsens, Denmark
Reitan Convenience AS Oslo, Norway
Uno-X Mobility AS Oslo, Norway
The list shows direct ownership and voting rights in 2023 and 2022
Total non-controlling interests as at December 31, 2023 was NOK 144 million (NOK 135 million as at December 31, 2022) and originate from immaterial subsidiaries
143 4.2 Consolidated financial statements 4.3 Parent company financial statements 142 Our responsibility Our business Corporate governance Financial statements Appendix 37 Accounting policies – Financial investments
investments are measured at fair value with changes in fair value recognised in the consolidated statement of profit or loss as net gains (losses) on financial investments, see note 32 - Classification of financial instruments. When no quoted market price is available, fair value is estimated using different valuation techniques such as discounted cash flow models or valuations based on prices derived from transactions with external parties. The fair value measurement hierarchy of all the Group’s financial assets and liabilities is provided in note 33 - Fair value measurement. Million NOK 2023 2022 Carrying amount as at January 1 475 715 Additions - 3 Disposals -312 -1 Net gains (losses) through other comprehensive income -Net unrealised gains (losses) through profit or loss -42 -248 Foreign currency translation effects 8 6 Carrying amount as at December 31 129 475 Of which classified as non-current assets 129 475 Of which classified as current assets -Carrying amount as at December 31 129 475 Financial investments consist of: Million NOK Ownership 31.12.23 Ownership 31.12.22 2023 2022 Oda Group Holding AS 0.2% 1.0% 4 35 Urban Property Holding AS 0.0% 10.0% - 217 Nebo Topco AS 0.0% 5.0% - 65 Other real estate investments - - 92 123 Other financial assets - - 33 35 Total financial investments as at December 31 129 475 In 2023, the Group recognised a loss on the financial investment in Oda Group Holding AS of NOK 31 million. Urban Property Holding AS and Nebo Topco AS were disposed of as part of the Group’s sale of REMA Etablering Norge AS in December 2023.
Consolidated financial statements | Annual report 2023
Immaterial associates Million NOK 2023 2022 Profit for the year 9 54 Other comprehensive income/(loss) for the year, net of tax -Total comprehensive income for the year, net of tax 9 54 Million NOK Ownership 31.12.23 2023 2022 Gram og Nybøl Godser A/S 49.4% 81 73 Scanlube AB 50.0% 42 25 Skanol A/S 50.0% 83 68 Samtank A/S 50.0% 128 99 Other real estate investments - 11 216 Other - 4 4 Carrying amount as at December 31 349 485
Financial
Note 18 – Financial investments
Entity
Share of ownership Share of voting rights
100% 100% REMA
100% 100% REMA
100% 100%
Office location
1000
100% 100%
100% 100%
Note 19 – Trade and other receivables
Accounting policies – Trade and other receivables
Trade and other receivables are adjusted for provision for impairment in accordance with the expected credit loss model. The Group applies the simplified approach, measuring the loss allowance at an amount equal to lifetime expected credit losses.
19 – Trade and other receivables (continued)
The Group’s provision for losses on trade receivables include provision for overdue receivables of
31, 2023 (NOK 117 million as at December 31, 2022).
arise from contracts with customers.
The Group's provision for losses on trade receivables was NOK 61 million as at December 31, 2023 (NOK 133 million as at December 31, 2022)
The effective interest rate on interest-bearing receivables was 2.9 percent as at December 31, 2023. Non-current interest-bearing receivables due in more than five years, mainly consist of start-up loans related
of inventories for new franchisees and loans to associated companies.
145 4.2 Consolidated financial statements 4.3 Parent company financial statements 144 Our responsibility Our business Corporate governance Financial statements Appendix 39 Age distribution of overdue trade receivables Million NOK 2023 2022 Less than 3 months 671 542 More than 3 months 93 26 Overdue receivables as at December 31 764 568
NOK 52 million as at December
Maturity distribution of non-current receivables Million NOK 2023 2022 1-2 years 36 93 2-5 years 117 188 More than 5 years 131 119 Non -current receivables as at December 31 284 400
Trade and other receivables are denominated in the following currencies Million NOK 2023 2022 NOK 5,943 5,528 DKK 4,324 3,851 SEK 186 183 EUR 591 463 Other currencies 23 235 Total current and non -current receivables as at December 31 11,067 10,260
Consolidated financial statements | Annual report 2023 38
to funding
Note
Current receivables Million NOK 2023 2022 Trade receivables 9,071 8,066 Accrued income 460 210 Current receivables, franchisees 179 221 Current interest-bearing receivables 99 58 Other non -interest-bearing current receivables 974 1,305 Current receivables as at December 31 10,783 9,860 Trade receivables
Non-current receivables Million NOK 2023 2022 Other non -current interest-bearing receivables 164 291 Other non -current receivables 120 109 Non -current receivables as at December 31 284 400 Total receivables as at December 31 11,067 10,260
value, provision
carrying amount Million NOK 2023 2022 Nominal value of receivables 11,148 10,419 Provision for expected credit losses -81 -159 Carrying amount as at December 31 11,067 10,260 Provision for expected credit losses on trade and other receivables Million NOK 2023 2022 Provision as at January 1 -159 -116 Movements in provision 78 -43 Provision as at December 31 -81 -159
mainly
Nominal
and
Note 20 – Other non-current assets
Note 22 – Cash and cash equivalents
Accounting policies – Cash and cash equivalents
Cash and cash equivalents in the consolidated statement of financial position comprise cash at banks and on hand and other short-term highly liquid investments with original maturity of three months or less.
Note 21 – Inventories
Accounting policies - Inventories
Inventories are valued at the lower of cost and net realisable value. Cost is determined using the first-in, first-out method. For goods for resale and work in progress, cost consists of costs for product design, cost of materials, freight, other direct costs and indirect production costs (based on normal capacity). Payments from suppliers, other than those related to a specific ad or campaign that the Group has expensed and for which the supplier has agreed to cover its share of, are recognised directly as a reduction in cost of goods sold. Net realisable value is the estimated selling price in the ordinary course of business, less applicable variable sales expenses.
The amount of cash placed in escrow accounts as at December 31, 2023 and as at December 31, 2022 is related to sale of real estate portfolios at the end of the year. Escrow accounts are classified as cash equivalents as the amounts are subject to an insignificant risk of changes in fair value and have a maturity of less than three months from the acquisition date.
Cash and cash equivalents as presented in the consolidated statement of cash flows
For the purpose of the consolidated statement of cash flows, cash and cash equivalents consist of cash and cash equivalents, as defined above, net of outstanding bank overdrafts as they are considered an integral part of the Group’s cash management.
Bank overdrafts are presented within borrowings in current liabilities in the consolidated statement of financial position.
Note 23 – Earnings per share
Accounting policies – Earnings per share
Earnings per share is calculated by dividing the
number of outstanding shares during the year.
There are no instruments that could result in dilution.
147 4.2 Consolidated financial statements 4.3 Parent company financial statements 146 Our responsibility Our business Corporate governance Financial statements Appendix
Million NOK 2023 2022 Cash at bank and on hand 1,432 1,106 Tax withholdings 13 8 In escrow accounts 55 51 Other restricted funds 56 55 Restricted cash 124 114 Cash and cash equivalents as at December 31 1,556 1,220
Million NOK 2023 2022 Cash and cash equivalents 1,556 1,220 Bank overdrafts -1,181 -1,091 Total cash and cash equivalents in the statement of cash flows as at December 31 375 129
profit
parent
weighted average
The table below shows the number of shares used when calculating earnings per share: Million NOK 2023 2022 Profit for the year attributable to owners of the parent 1,395 1,831 Weighted average number of ordinary shares outstanding (number) 105,000,000 105,000,000 Weighted average number of ordinary shares outstanding, diluted (number) 105,000,000 105,000,000
for the year attributable to owners of the
by the
Consolidated financial statements | Annual report 2023 40
Million NOK Note 2023 2022 Pension assets 2 4 Derivative financial instruments 30 1 2 Other non -current assets as at December 31 3 6
Million NOK 2023 2022 Raw materials 187 183 Work in progress 20 26 Goods for resale 4,957 4,988 Total inventories as at December 31 5,164 5,197 Provision for obsolescence -34 -28 Carrying amount of inventories as at December 31 5,130 5,169 Carrying amount of inventories pledged as security for liabilities 493 463 Provision for obsolescence Million NOK 2023 2022 Provision for obsolescence as at January 1 -28 -27 Change in provisions -6 -1 Provision for obsolescence as at December 31 -34 -28
Inventories
Note 24 – Other reserves
Note 25 – Provisions
Accounting policies – Provisions
Provisions are measured at the present value of the expenditures expected to be required to settle the obligation using a pre-tax rate that reflects current market assessments of the time value of money and the risks specific to the obligation. The increase in the provision due to passage of time is recognised as a financial expense.
The discount rate used in the calculation of the asset retirement obligations and the environmental obligations is a pre-tax riskfree rate based on the applicable currency and time horizon of the underlying cash flows, and equalled 3.5 percent as at December 31, 2023 (1.5 percent as at December 31, 2022).
Asset retirement obligations
Asset retirement obligations exist where the Group has a legal obligation to remove an asset and restore the site. The Group has asset retirement obligations relating primarily to energy stations. Where the Group is required to settle an asset retirement obligation, the Group has estimated and capitalised the net present value of the obligations and increased the carrying value of the related asset. Provisions for asset retirement obligations are based on management’s estimates of the reasonably possible outcomes in terms of both the range of settlement dates and amount of expenses, as well as probabilities to be assigned to each of the reasonably possible outcomes.
Environmental liabilities
The Group purchases, stores and sells petroleum products through its business in Uno-X Mobility. This represents a potential exposure towards environmental consequences. The Group performs regular environmental inspections in order to assess the need for provisions relating to environmental restoration.
The Group performs a comprehensive environmental review of the operations in both Norway and Denmark annually. This forms the basis for estimating existing environmental liabilities. The outcome of the review, combined with knowledge of how environmental liabilities arise, give the Group a basis for estimating further development of environmental liabilities. Total estimated environmental liabilities are based on estimated environmental liabilities per location. The calculations make use of specific information for each service station, such as age, number of tanks, as well as a specific assessment of the stations’ environmental conditions and factors, such as the distance to drinking water sources. The estimates are uncertain as they are based on average costs and timing. The estimations have been performed with assistance from third-party experts. There is no assurance that future changes in environmental regulation, if any, will not adversely affect the Group’s accounting for environmental liabilities.
For information on climate-related risk and its impact on asset retirement obligations and environmental liabilities, see note 4 –Climate change.
Note 25 – Provisions (continued)
149 4.2 Consolidated financial statements 4.3 Parent company financial statements 148 Our responsibility Our business Corporate governance Financial statements Appendix 43 Classification of total provisions Million NOK 2023 2022 Current 106 86 Non- current 686 540 Total provisions for other liabilities as at December 31 792 626 Million NOK Asset retirement obligations Environ. obligations Employee benefits Deferred payments Other Total Carrying amount as at January 1, 2022 422 174 4 6 17 623 Used during the year -41 4 - - -22 -59 Unused amounts reversed -4 -16 - 2 - -18 Provisions made in the year 32 16 1 - 7 56 Interest costs 7 5 - - - 12 Foreign currency translation effects 7 5 - - - 12 Carrying amount as at December 31, 2022 423 188 5 8 2 626 Used during the year -19 -14 - - - -33 Unused amounts reversed - -10 - -1 - -11 Provisions made in the year 73 90 26 - 1 190 Interest costs 9 5 1 1 - 16 Foreign currency translation effects 7 2 -5 - - 4 Carrying amount as at December 31, 2023 493 261 27 8 3 792 Expected maturity structure Million NOK Asset retirement obligations Environ. obligations Employee benefits Deferred payments Other Total Due in less than 1 year 28 75 - - 2 105 Due in 1 -2 years 57 14 26 - - 97 Due in 2 -5 years 129 49 1 8 - 187 Due in more than 5 years 279 123 - - 1 403 Carrying amount as at December 31, 2023 493 261 27 8 3 792 Discount rate 3.2% 3.1% 3.0% 6.6% - -
Consolidated financial statements | Annual report 2023
Million NOK Associates Financial assets Foreign currency translation effects Total Other reserves as at January 1, 2022 5 46 1,139 1,190 Share of other comprehensive income of associates -11 - - -11 Net gain/(loss) on cash flow hedges - -18 - -18 Foreign currency translation effects - - 303 303 Other reserves as at December 31, 2022 -6 28 1,442 1,464 Share of other comprehensive income of associates 9 - - 9 Net gain/(loss) on cash flow hedges - -15 - -15 Foreign currency translation effects - - 388 388 Other reserves as at December 31, 2023 3 13 1,830 1,846
Accounting policies – Borrowings
Fees paid on the establishment of loan facilities are recognised as transaction costs of the loan to the extent that it is probable that some or all of the facility will be drawn down. In this case, the fee is deferred until the draw-down occurs. To the extent there is no evidence that it is probable that some or all of the facility will be drawn down, the fee is capitalised as a pre-payment for liquidity services and amortised over the period of the facility to which it relates.
Bank overdraft, borrowings from parent company and other borrowings are in the consolidated statement of financial position presented as current and non-current borrowings.
The exposure of the Group's borrowings to interest rate changes and contractual re-pricing dates at the end of the
period is as follows:
The re-pricing structure includes interest rate swaps.
Carrying amount of the Group's borrowings is denominated in the following currencies:
Carrying
Assets pledged as security are related to collateral borrowings and the working capital facility agreement of NOK 1,400 million in Uno-X Mobility.
structure
The interest rates do not include interest rate swaps, commitment fees and arrangement fees. See note 30 – Derivative financial instruments for more information about interest rate swaps.
Fair value of borrowings
The Group’s borrowings are mainly at floating interest rates. The carrying amount is a reasonable approximation of the fair value for all borrowings. Interest rate swaps are booked at fair value and are not considered in the assessment of fair value of borrowings.
151 4.2 Consolidated financial statements 4.3 Parent company financial statements 150 Our responsibility Our business Corporate governance Financial statements Appendix
45
reporting
Million NOK 2023 2022 Within 1 year 5,847 5,129 1-2 years 2 2 2-3 years 2 2 3-4 years 2 2 4-5 years 2 2 After 5 years 1 4 Total borrowings as at December 31 5,856 5,141
Million NOK Amounts in currency 2023 2022 NOK 4,548 4,548 3,552 DKK 324 489 805 SEK 944 956 929 EUR 11 118 54 USD -25 -255 -199 Total borrowings as at December 31 5,856 5,141
borrowing facilities Million NOK 2023 2022 Expires within 1 year (floating interest rates) 1,152 1,300 Expires after more than one year (floating interest rates) 4,405 5,053 Total undrawn borrowing facilities as at December 31 5,557 6,353 Interest
Million NOK NOK DKK SEK EUR USD Bank overdraft 5.9% 5.8% 5.1% 5.2% 6.8% Collateral borrowings 5.9% 7.0% - -Syndicated bank loans 5.4% 4.6% 4.7% 4.6%Other borrowings - - - -Average interest rates 5.6% 4.8% 4.7% 4.6% 6.8% Interest rates as at December 31, 2022 Million NOK NOK DKK SEK EUR USD Bank overdraft 4.4% 3.4% 3.5% 3.5%Collateral borrowings 5.0% - - -Syndicated bank loans 3.9% 2.8% 2.9% 2.9%Other borrowings 4.3% - - -Average interest rates 4.1% 3.0% 3.0% 3.0% -
Undrawn
rates as at December 31, 2023
Note
Borrowings
Consolidated financial statements | Annual report 2023 44
26 –
(continued)
Borrowings Million NOK 2023 2022 Collateral borrowings 43 53 Syndicated bank loans 4,598 3,949 Other bank loans -Other borrowings 1 15 Total non -current borrowings as at December 31 4,642 4,017 Bank overdraft 1,181 1,091 Collateral borrowings 33 33 Total current borrowings as at December 31 1,214 1,124 Total borrowings as at December 31 5,856 5,141
amount of assets pledged as security Million NOK 2023 2022 Property, plant and equipment 217 224 Inventories 493 463 Current trade and other receivables 1,205 1,066 Other net assets in pledged subsidiaries 123 224 Total carrying amount of assets pledged as security as at December 31 2,038 1,977
Million NOK 2023 2022 Within 1 year 1,214 1,124 1-2 years 9 9 2-3 years 4,357 3,958 3-4 years 9 24 4-5 years 259 9 After 5 years 8 17 Total borrowings as at December 31 5,856 5,141
Borrowings
Maturity
Note 26 –
Note 27 – Loan agreements (continued)
The following financial covenants apply to the revolving credit facility in Reitan Retail AS: Time of measurement
and later
Net interest-bearing debt and equity share are measured excluding IFRS 16 leases. EBITDA is adjusted for IFRS 16 lease payments. During 2023 and 2022, Reitan Retail AS was in compliance with these covenants, and there is significant headroom also going forward
Working capital facility agreement - Uno -X Mobility
In 2010, Uno-X Mobility AS and DNB entered into a credit and corporate account agreement with collateral in subsidiaries, receivables and inventories, the latter limited to Norwegian subsidiaries only. The agreement includes an overdraft facility of NOK 1,400 million, limited to a percentage of the Group’s outstanding receivables and the Norwegian companies’ inventories. Uno-X Mobility AS is the owner of the facility. Drawn amounts as at December 31, 2023 were NOK 1,021
December 31, 2022) and are included in "Bank overdraft" in note 26 - Borrowings
All subsidiaries are members of the credit and corporate account agreement and have provided an on-demand guarantee as collateral for Uno-X Mobility AS and its obligations according to the working capital facility agreement.
The following financial covenants apply to the working capital facility agreement in Uno-X Mobility AS:
Note 27 – Loan agreements
The Group has the following material loan agreements:
Multi-currency credit facility - Reitan Retail AS
In December 2021 Reitan Retail AS established a multi -currency credit facility. The loan is financed by a bank syndicate consisting of six banks. The facility is a revolving credit of NOK 9,000 million, of which NOK
million originally matured in 2024, and NOK 4,500 million originally matured in 2026. Both tranches included two one-year extension options. In 2022 the first extension option for both tranches was utilised, and in 2023 the last extension option was utilised, extending maturity dates to 2026 and 2028 respectively. The drawn amounts as at December 31, 2023 are included in "Other bank loans" in note 26 - Borrowings The facility was amended in March 2024, see note 36 – Events after the reporting period for more information.
Covenants (Q4 2010 and later)
Reporting frequency
During 2023 and 2022, Uno-X Mobility AS was in compliance with these covenants, and there is significant headroom also going forward
Other material loan agreements
The Group has cash pooling arrangements with legally enforceable rights to offset cash and overdraft balances. Where there is an intention to settle on a net basis, cash and overdraft balances relating to the cash pooling arrangements are reported on a net basis in the consolidated statement of financial position.
Most subsidiaries in REMA 1000 Norway and REMA 1000 Denmark are members of a cash pool agreement entered into between REMA 1000 AS and Danske Bank. The agreement includes an overdraft facility of NOK 500 million. Drawn amounts as at December 31, 2023 were NOK 0 million (NOK 0 million as at December 31, 2022) and are included in "Bank overdraft" in note 26Borrowings. No financial covenants apply to this agreement.
Within the Reitan Convenience segment, there are several cash pool agreements in the various countries where it is represented. They include overdraft facilities of NOK 200 million in Norway, SEK 150 million in Sweden, DKK 30 million in Denmark and EUR 7 million in Finland. Drawn amounts of all these overdraft facilities as at December 31, 2023 were NOK 159 million (NOK 106 million as at December 31, 2022) and are included in "Bank overdraft" in note 26 - Borrowings. No financial covenants apply to any of these.
153 4.2 Consolidated financial statements 4.3 Parent company financial statements 152 Our responsibility Our business Corporate governance Financial statements Appendix
Net interest -bearing debt/ EBITDA (maximum) Equity share (minimum) Q4 2021
3.50 25.0%
million
as at
(NOK 966 million
Receivables/ debt (minimum) EBITDA 12 months rolling basis (minimum) Equity to be (minimum) Equity share (minimum)
1.00 NOK 220 million NOK 900 million 20.0%
Monthly Quarterly Quarterly Quarterly
Consolidated financial statements | Annual report 2023 46 Changes in the carrying amount of borrowings are distributed as follows: Million NOK Lease liabilities Bank overdraft Borrowings from parent company Other borrowings Total borrowings Carrying amount as at January 1, 2022 22,547 700 - 3,284 26,531 Proceeds, included in cash flow from financing activities - - - 2,671 2,671 Repayments, included in cash flow from financing activities -3,095 - - -1,904 -4,999 Net cash effect, included in cash and cash equivalents - 391 - - 391 New leases 1,864 - - - 1,864 Dividends/group contributions declared - - - -Foreign currency translation effects 357 - - -1 356 Other changes 2,192 - - - 2,192 Carrying amount as at December 31, 2022 23,865 1,091 - 4,050 29,006 Proceeds, included in cash flow from financing activities - - - 3,848 3,848 Repayments, included in cash flow from financing activities -3,448 - - -3,323 -6,771 Net cash effect, included in cash and cash equivalents - 90 - - 90 New leases 1,455 - - - 1,455 Dividends/group contributions declared - - - -Foreign currency translation effects 511 - - 101 612 Other changes 2,983 - - -1 2,982 Carrying amount as at December 31, 2023 25,366 1,181 - 4,675 31,222
4,500
Million NOK 2023 2022 Revolving credit 9,000 9,000 Total available credit as at December 31 9,000 9,000 Drawn amount in NOK 3,000 2,550 Drawn amount in DKK (in NOK) 422 396 Drawn amount in SEK (in NOK) 1,064 898 Drawn amount in EUR (in NOK) 112 105 Total drawn amount as at December 31 4,598 3,949 Undrawn credit amount as at December 31 4,402 5,051
Note 26 – Borrowings (continued)
Note 28 – Other non-current liabilities
Note 29 – Guarantees
The Group provided guarantees for off-balance sheet liabilities limited to NOK 82 million as at December 31, 2023 (NOK 313 million as at December 31, 2022). The guarantees are mainly provided on behalf of associated real estate companies.
Note 30 – Derivative financial instruments
Derivative financial instruments are included in the line items "Other current assets", "Other non-current assets" and "Other current liabilities" in the consolidated statement of financial position. Changes in fair value are recognised in the consolidated statement of profit or loss as other income or net other financial items dependent on whether the hedge relates to operating or financing activities, unless they are designated and effective hedging instruments. The effective portion of gains or losses related to derivatives designated as hedging instruments is recognised in the consolidated statement of comprehensive income in the cash flow hedge reserve, while any ineffective position is recognised immediately in the consolidated statement of profit or loss.
Note 31 – Trade and other payables
and
155 4.2 Consolidated financial statements 4.3 Parent company financial statements 154 Our responsibility Our business Corporate governance Financial statements Appendix
Current trade and other payables Million NOK 2023 2022 Trade payables 10,023 9,258 Social security and other taxes 2,470 2,008 Liabilities to franchisees 62 55 Other current non -interest-bearing liabilities 1,431 1,593 Current trade and other payables as at December 31 13,986 12,914 Other current non-interest-bearing liabilities
accrued expenses related to goods and services delivered and not invoiced to the Group. Non-current trade
payables Million NOK 2023 2022 Due in 1 -2 years -Due in 2 -5 years - 4 Due in more than 5 years 1Non -current trade and other payables as at December 31 1 4 Both current
non-current trade
other payables are non-interest-bearing. Consolidated financial statements | Annual report 2023
mainly include
and other
and
Million NOK Note 2023 2022 Pension obligations 80 82 Non- current trade and other payables 31 1 4 Other non -current liabilities as at December 31 81 86
Accounting policies - Derivative financial instruments
Million NOK 2023 2022 Interest rate swaps - expire within 1 year (eiendeler) 1Foreign exchange forward contracts - expire within 1 year (eiendeler) - 2 Other derivative financial instruments - expire within 1 year (eiendeler) 9 29 Interest rate swaps - expire in 1-5 years (eiendeler) - 2 Other derivative financial instruments - expire in 1- 5 years (eiendeler) 1Total derivative financial instruments as at December 31 - assets 11 33 Foreign exchange forward contracts - expire within 1 year 15Other derivative financial instruments - expire within 1 year 1Total derivative financial instruments as at December 31 - liabilities 16Total net financial derivative instruments as at December 31 - assets (liabilities) -5 33 2023 2022 Lowest fixed rate in interest rate swaps at December 31 1.713% 1.578% Highest fixed rate in interest rate swaps at December 31 3.130% 1.775% Million NOK Amount in currency 2023 Notional principal amount of interest rate swaps in NOK 112 112 Total notional principal amount of interest rate swaps as at December 31 112 112 Million NOK Amount in currency 2023 Notional principal amount of foreign exchange forward contracts in EUR 8 88 Notional principal amount of foreign exchange forward contracts in USD 34 343 Total notional principal amount of foreign exchange forward contracts as at December 31 431 All interest rate swaps are floating-to-fixed and related to the Group's borrowings.
Note 32 – Classification of financial instruments
Accounting policies – Classification of financial instruments
Financial assets
Financial assets at fair value through profit or loss
Financial assets at fair value through profit or loss include equity instruments and derivatives with a positive value.
Financial assets at amortised cost
The Group’s financial assets at amortised cost include trade receivables, other receivables and cash and cash equivalents. With the exception of trade receivables that do not contain a significant financing component, the Group initially measures these financial assets at fair value plus transaction costs. Subsequently, these assets are measured at amortised cost less impairment using the effective interest (EIR) method. Gains and losses are recognised in the consolidated statement of profit or loss when the asset is derecognised, modified or impaired. The Group applies the simplified approach for trade receivables, measuring loss allowance at an amount equal to lifetime expected credit losses. To calculate the expected credit losses the Group uses its historical experience, individual assessments and forward-looking information. Impairment for expected credit losses is recognised in the consolidated statement of profit or loss and updated at each reporting date.
Derivatives designated as hedging instruments at fair value through other comprehensive income
A few hedging instruments are recognised at fair value through other comprehensive income.
Financial liabilities
Financial liabilities at fair value through profit and loss
Financial liabilities at fair value through profit or loss mainly include derivatives. Derivatives are carried as assets when the fair value is positive and as liabilities when the fair value is negative. Such derivative financial instruments are initially recognised at fair value on the date on which a derivative contract is entered into and are subsequently re-measured at fair value through profit and loss. Gains or losses are recognised in the consolidated statement of profit or loss for the reporting period in which they arise.
Financial liabilities at amortised cost
Interest-bearing loans and borrowings are initially recognised at fair value net of directly attributable transaction costs. Subsequently, these liabilities are measured at amortised cost using the EIR method. Gains and losses are recognised in the consolidated statement of profit or loss when the liabilities are derecognised. The EIR amortisation is included as finance costs in the consolidated statement of profit or loss. Liabilities are measured at their nominal amount if the effect of discounting is immaterial.
Derivatives designated as hedging instruments at fair value through other comprehensive income
The effective portion of the gain or loss on the hedging instrument is recognised in other comprehensive income (OCI) in the cash flow hedge reserve, while any ineffective position is recognised immediately in the consolidated statement of profit or loss.
157 4.2 Consolidated financial statements 4.3 Parent company financial statements 156 Our responsibility Our business Corporate governance Financial statements Appendix 51 Carrying amount of financial assets and liabilities divided into categories: December 31, 2023 Financial assets at fair value through profit or loss Financial assets at amortised cost Financial liabilities at fair value through profit or loss Financial liabilities at amortised cost Derivatives designated as hedging instruments through OCI Total Million NOK Note Financial investments 18 129 - - - - 129 Derivative financial instruments 30 - - - - 1 1 Non- current receivables 19 - 284 - - - 284 Total non -current financial assets 129 284 - - 1 414 Trade and other receivables 19 - 10,783 - - - 10,783 Derivative financial instruments 30 1 - - - 9 10 Cash and bank balances 22 - 1,432 - - - 1,432 Restricted cash 22 - 124 - - - 124 Total current financial assets 1 12,339 - - 9 12,349 Total financial assets 130 12,623 - - 10 12,763 Borrowings 26 - - - 4,642 - 4,642 Derivative financial instruments 30 - - - -Other liabilities 31 - - - 1 - 1 Total non -current financial liabilities - - - 4,643 - 4,643 Borrowings 26 - - - 1,214 - 1,214 Derivative financial instruments 30 - - 16 - - 16 Trade and other payables 31 - - - 13,986 - 13,986 Total current financial liabilities - - 16 15,200 - 15,216 Total financial liabilities - - 16 19,843 - 19,859 Total net financial assets (liabilities) 130 12,623 -16 -19,843 10 -7,096 Note
financial instruments (continued) Consolidated financial statements | Annual report 2023 50
32 – Classification of
Accounting policies – Fair value measurement
All assets and liabilities for which fair value is measured or disclosed in the financial statements are categorised within the fair value hierarchy, described as follows, based on the lowest level of input that is significant to the fair value measurement as a whole:
Level 1 – Quoted (unadjusted) market prices in active markets for identical assets or liabilities.
Level 2 – Valuation techniques for which the lowest level input that is significant to the fair
measurement is
or indirectly observable.
Level 3 – Valuation techniques for which the lowest level input that is significant to the fair value
31, 2023
The Group has assessed that the fair values of cash and cash equivalents, trade and other receivables, and
159 4.2 Consolidated financial statements 4.3 Parent company financial statements 158 Our responsibility Our business Corporate governance Financial statements Appendix 53 Note
33 – Fair value measurement
value
directly
December
Level 1 Level 2 Level 3 Total Million NOK Note Investment properties - - 38 38 Financial investments 18 - 4 125 129 Derivative financial instruments 30 - 11 - 11 Total assets measured at fair value - 15 163 178 Derivative financial instruments 30 - 16 - 16 Total liabilities measured at fair value - 16 - 16 Net assets (liabilities) measured at fair value - -1 163 162 December 31, 2022 Level 1 Level 2 Level 3 Total Million NOK Note Investment properties - - 48 48 Financial investments 18 - 35 440 475 Derivative financial instruments 30 - 33 - 33 Total assets measured at fair value - 68 488 556 Derivative financial instruments 30 - - -Total liabilities measured at fair value - - -Net assets (liabilities) measured at fair value - 68 488 556
measurement is unobservable.
trade and other payables approximate their carrying amounts largely due to the short-term maturities of these instruments. Consolidated financial statements | Annual report 2023 52 December 31, 2022 Financial assets at fair value through profit or loss Financial assets at amortised cost Financial liabilities at fair value through profit or loss Financial liabilities at amortised cost Derivatives designated as hedging instruments through OCI Total Million NOK Note Financial investments 18 475 - - - - 475 Derivative financial instruments 30 - - - - 2 2 Non- current receivables 19 - 400 - - - 400 Total non -current financial assets 475 400 - - 2 877 Trade and other receivables 19 - 9,860 - - - 9,860 Derivative financial instruments 30 - - - - 31 31 Cash and bank balances 22 - 1,106 - - - 1,106 Restricted cash 22 - 114 - - - 114 Total current financial assets - 11,080 - - 31 11,111 Total financial assets 475 11,480 - - 33 11,988 Borrowings 26 - - - 4,017 - 4,017 Other liabilities 31 - - - 4 - 4 Total non -current financial liabilities - - - 4,021 - 4,021 Borrowings 26 - - - 1,124 - 1,124 Trade and other payables 31 - - - 12,913 - 12,913 Total current financial liabilities - - - 14,037 - 14,037 Total financial liabilities - - - 18,058 - 18,058 Total net financial assets (liabilities) 475 11,480 - -18,058 33 -6,070 Note
financial instruments
32 – Classification of
(continued)
Note 33 – Fair value measurement
Reitan Retail is a wholly owned subsidiary of REITAN AS and included in the consolidated financial statements of REITAN AS (REITAN). REITAN AS is owned by the Reitan family through three holding companies.
Reitan Retail’s related parties include its management personnel, subsidiaries, associates, group companies in REITAN and parent company. The Group has ownership interests in 16 associated companies, see note 16 – Investment in associated companies. For benefits to key management, see note 9 – Salaries and personnel costs For guarantees to related parties, see note 29 –Guarantees
The related party transactions disclosed consist of transactions carried out with related parties that are not eliminated in the consolidated financial statements.
The following transactions were carried out with related parties:
with parent company REITAN AS
161 4.2 Consolidated financial statements 4.3 Parent company financial statements 160 Our responsibility Our business Corporate governance Financial statements Appendix 55
Transactions
Million NOK 2023 2022 Sale of goods and services - 2 Purchase of goods and services1 -12 -13 1Of which fee paid for key management personnel services amounts to NOK 4.9 million in 2023 (NOK 4.5 million in 202 2). Transactions between the Group and other companies in REITAN Million NOK 2023 2022 Sale of goods and services 2 2 Purchase of goods and services -19 -13 Sale of property and other assets 1,355Lease payments -575 -498 Current receivables as at December 31 1 11 Current liabilities as at December 31 5 6 Non- current lease liabilities as at December 31 4,894 4,502 Current lease liabilities as at December 31 554 513 Transactions with associated companies Million NOK 2023 2022 Sale of goods and services 14 18 Purchase of goods and services -891 -623 Interest income 7 6 Non- current receivables as at December 31 50 147 Current receivables as at December 31 3 3 Non- current liabilities as at December 31 - 15 Current liabilities as at December 31 34 29 Non-current receivables from related parties are unsecured and interest-bearing. The interest rate is determined based on market rates including a premium Current receivables from related parties are unsecured and non-interest-bearing. These are receivables arising from purchases and sales of goods and services, as well as accrued interest on loans. Lease liabilities are related to leases of outlets and warehouses from other group companies in REITAN. Note
transactions Consolidated financial statements | Annual report 2023
34 – Related party
Reconciliation of fair value measurement of non-listed financial investments classified as financial assets at fair value through profit or loss (level 3): Million NOK 2023 2022 Carrying amount as at January 1 440 715 Additions - 3 Reclassifications - -295 Disposals -253 -1 Net unrealised gains (losses) through profit or loss -69 12 Foreign currency translation effects 7 6 Carrying amount as at December 31 125 440 See note 18 – Financial investments for further information on non-listed financial investments. Reconciliation of fair value measurement of investment properties (level 3): Million NOK 2023 2022 Carrying amount as at January 1 48 326 Additions - 19 Reclassifications -1 -7 Disposals -9 -347 Net unrealised gains (losses) through profit or loss -1 52 Foreign currency translation effects 1 5 Carrying amount as at December 31 38 48
(continued)
Note 35 – Contingent liabilities
Accounting policies – Contingent liabilities
A contingent liability is a liability of uncertain timing and amount. Contingencies are not recognised in the consolidated statement of financial position because the existence can only be confirmed by the occurrence or non-occurrence of one or more uncertain future events not wholly within the control of Reitan Retail or because the risk of loss is estimated to be possible but not probable or because the amount cannot be measured reliably.
Significant accounting judgements in relation to claims and litigation
In the ordinary course of business, Reitan Retail is party to certain claims and litigations etc. of varying content and scope, one of which is referred to below. There is significant uncertainty related to predicting the outcome of claims and litigations as they depend on relevant applicable proceedings, such as negotiations between the parties affected, government actions and court rulings. Reitan Retail is required to exercise judgement to determine whether the risk of loss is possible but not probable.
Statement of objections from The Norwegian Competition Authority
On December 15, 2020, The Norwegian Competition Authority sent a statement of objections to REMA 1000, NorgesGruppen and Coop, indicating that it intends to impose administrative fines. The preliminary assessment of the Competition Authority is that the joint understanding between the companies regarding the implementation of the “Industry Norm for Comparative Advertising in the Grocery Sector”, where the companies agreed not to hinder access to each other’s stores for observation of shelf prices, was in breach of the Competition Act Section 10 and the EEA Agreement Article 53. In January 2024, the Norwegian Competition Authori ty informed that it has dropped the accusations relating to a restriction of competition by object under the Competition Act Section 10 and the EEA Agreement Article 53. The notified fine to REMA 1000 Norge AS and REITAN AS of NOK 7,371 million related to an object restriction therefore no longer apply. The Norwegian Competition Authority further informed that it is still working on the part of the case related to restriction of competition by effect. On April 10, 2024, the Norwegian Competition Authority issued a supplementary statement of objections in which it notifies a fine of NOK 1,333 million to REMA 1000 and REITAN AS in the event that it should find that there is an infringement which has as its effect the restriction of competition.
The Group considers it not likely to be a liability as per December 31, 2023 or at the time of signing of these consolidated financial statements. It is the position of the Group that the agreement not to hinder access to each others stores for the observation of shelf prices does not have as its effect the restriction of competition contrary to the Competition Act or the EEA Agreement.
Note 36 – Events after the reporting period (continued)
Following the Danish competition authorities approval in August 2023, ALDI Danmark ApS granted REMA 1000 Danmark A/S the right to use the stores and distribution centres. This right was granted in stages from September to December 2023 and made it possible for the Group to start to refurbish, rebrand and open sales outlets as REMA 1000 during the final months of 2023. Based on a thorough assessment the Group considers this right to use the stores and distribution centres to represent short-term lease agreements.
Following the Danish competition authorities’ approval, ALDI Danmark ApS also granted REMA 1000 Danmark A/S the right to enter into its existing external lease agreements as the lessee. The majority of these agreements have been considered short-term leases. In addition, the Group has recognised NOK 57 million in right-of-use assets and NOK 57 million in lease liabilities as at December 31, 2023.
The effect of the ALDI-acquisition on operating profit in the 2023 consolidated financial statements is presented in the
below:
The following table represents the Group’s preliminary allocation of the acquisition cost to individually identifiable assets and liabilities based on their relative fair values. Assets held for sale are measured at the lower of the carrying amount had it not been classified as held for sale and fair value less costs to sell.
Note 36 – Events after the reporting period
Acquisition of a majority of ALDI’s Danish grocery store network
On January 16, 2024, the Group acquired 100 percent of the shares of ALDI Danmark ApS, a non-listed company based in Denmark. The transaction gives access to a portfolio of real estate locations, including 113 store locations (84 fully-owned stores and 29 leased stores) and three distribution centers, well-suited for the REMA 1000 format, paving the way for accelerated growth in an attractive market.
The transaction was approved by the Danish competition authorities on August 30, 2023. Closing of the transaction was subject to certain conditions, notably including ALDIs demerger of properties (such as headquarters) and carve-out of other assets and liabilities not included in the acquisition. As such, the transaction was not completed until January 2024. The financial effects of this transaction have not been recognized as at December 31, 2023. The operating results and assets and liabilities of the acquired company will be consolidated from January 16, 2024.
Real estate locations and distribution centres amount to more than 95 percent of the acquisition price. In addition, the acquisition includes trucks and fixtures. As part of the transaction, REMA 1000 Denmark assumed certain ALDI employees who worked in ALDI stores or distribution centres at the time of transfer of the respective properties. The existing strategic management function and associated processes were not acquired and, as such, the Group considered this transaction to be an asset acquisition, rather than an acquisition of a business.
*During
Amendment of Reitan Retail’s multi-currency credit facility
In March 2024, Reitan Retail AS entered into a DKK 1,300 million term loan with 2-year maturity, financed by the same bank syndicate as its existing multi-currency credit facility. The loan is entered into to finance the payment of the purchase price and capital expenditures related to the acquisition of a majority of ALDI’s Danish grocery store network.
163 4.2 Consolidated financial statements 4.3 Parent company financial statements 162 Our responsibility Our business Corporate governance Financial statements Appendix
table
Million NOK 2023 Salary 39 Short-term lease expenses 39 Other operating expenses 45 Total effect on operating profit in the 2023 consolidated financial statements 122
Million NOK January 16, 2024 Property, plant and equipment 789 Right -of -use assets 58 Properties held for sale* 2.328 Other assets** 81 Non-current lease liabilities -46 Current lease liabilities -12 Bank overdraft -799 Other liabilities -17 Net assets and liabilities acquired 2,381 Total purchase consideration 2,381
Group signed several sales agreements with external buyers regarding ALDI properties it does not intend to own. The properties are presented as held
sale
table above **Other assets consist
equivalents
autumn of 2023, the
for
in the
of cash and cash
and receivables.
Consolidated financial statements | Annual report 2023 56

165 4.2 Consolidated financial statements 4.3 Parent company financial statements 164 Our responsibility Our business Corporate governance Appendix Financial statements Our responsibility Our business Corporate Governance Financial statments Appendix 164 Reitan Retail Responsible retail 2022 164 4.3 Parent company financial statements Comprehensive income Financial position Changes in equity Cash flows Notes to the financial statements 165 166 167 168 169 Statement of comprehensive income Million NOK Note 2023 2022 Revenue 15 49 Other income 2 1,675 1,811 Operating expenses 3,4 -201 -213 Depreciation of property, plant and equipment -1 -1 Operating profit 1,488 1,646 Interest income from group companies 11 339 131 Other interest income 6 3 Other interest expenses -195 -99 Net financial items 150 35 Profit before taxes 1,638 1,681 Income tax expenses 5 -167 -141 Profit for the year 1,471 1,540 Remeasurement gain/(loss) on defined benefit plans 4 -4 -2 Other comprehensive income/(loss) for the year, net of tax -4 -2 Total comprehensive income for the year, net of tax 1,467 1,538
167 4.2 Consolidated financial statements 4.3 Parent company financial statements 166 Our responsibility Our business Corporate governance Appendix Financial statements Financial Statements | Annual R eport 2023 Statement
Million NOK Note 31.12.23 31.12.22 ASSETS Property, plant and equipment 10 5 Investments in subsidiaries 6 4,679 4,094 Pension assets 0 1 Receivables 7,10,11 4,692 4,894 Total non -current assets 9,381 8,994 Receivables kortsiktig 7,10,11 1,694 1,930 Cash and cash equivalents 202 487 Total current assets 1,896 2,417 Total assets 11,277 11,411 EQUITY AND LIABILITIES Share capital 8 106 106 Share premium 8 1,929 1,929 Retained earnings 4,014 5,147 Total equity 6,049 7,182 Pension obligations 4 1 1 Borrowings 9,10,11 4,598 3,949 Total non -current liabilities 4,599 3,950 Income tax payable 5 10Other payables 9,10,11 619 279 Total current liabilities 629 279 Total liabilities 5,228 4,229 Total equity and liabilities Statement of changes in equity Million NOK Share capital Share premium Retained earnings Total equity Equity as at January 1, 2022 106 1,929 3,609 5,644 Profit for the year - - 1,540 1,540 Remeasurement gain/(loss) on defined benefit plans - - -2 -2 Total comprehensive income for the year, net of tax - - 1,538 1,538 Dividend and group contribution as of year end - - -Equity as at December 31, 2022 106 1,929 5,147 7,182 Profit for the year this year - - 1,471 1,471 Remeasurement gain/(loss) on defined benefit plans this year - - -4 -4 Total comprehensive income for the year, net of tax this year - - 1,467 1,467 Dividend throughout the year this year - - -2,600 -2,600 Equity as at December 31, 2023 106 1,929 4,014 6,049
of financial position
169 4.2 Consolidated financial statements 4.3 Parent company financial statements 168 Our responsibility Our business Corporate governance Appendix Financial statements Financial Statements | Annual R eport 2023 Statement of cash flows Million NOK Note 2023 2022 Profit before taxes 1,638 1,681 Income taxes paid 5 - -50 Depreciation of property, plant and equipment 1 1 Change in net post-employment benefits 1 0 Losses (gains) on sale of property, plant and equipment - -1 Dividend and group contribution recognised in profit or loss, not paid 2 -1,675 -1,810 Change in current trade and other receivables 1,354 -55 Change in current trade and other payables -7 67 Net cash flow from operating activities 1,312 -167 Purchase of property, plant and equipment -7 -5 Proceeds from sale of property, plant and equipment - 1 Investments in subsidiaries 6 -200 -400 Proceeds from subsidiaries 7,11 801 538 Net cash flow from investing activities 594 134 Proceeds from borrowings 9 3,848 2,642 Repayment of borrowings -3,299 -1,902 Dividend paid to parent company -2,740 -250 Net cash flow from financing activities -2,191 490 Net change in cash and cash equivalents -285 457 Cash and cash equivalents as at January 1 487 30 Cash and cash equivalents as at December 31 202 487 Reitan Retail Responsible retail 2022 169 Notes
Note 1 – General information and summary of significant accounting policies Note 2 – Other income Note 3 – Salaries and personnel costs Note 4 – Pension obligations Note 5 – Income taxes Note 6 – Investments in subsidiaries Note 7 – Receivables Note 8 – Share capital and shareholder information Note 9 – Liabilities Note 10 – Financial instruments Note 11 – Related party transactions Note 12 – Events after the reporting period 170 170 170 171 173 173 174 174 175 176 177 177
to the financial statements of the parent company
Note 1 – General information and summary of significant accounting policies
Reitan Retail AS (the parent company) is the parent company in the Reitan Retail group.
The separate financial statements of Reitan Retail AS have been prepared in accordance with the simplified IFRS pursuant to the Norwegian Accounting Act, section 3-9, subsection 5 (“Regulations on simplified use of international accounting standard”) issued by the Norwegian Ministry of Finance on January 21, 2008
Reitan Retail AS’ accounting policies are consistent with the accounting principles for the Group, as described in note 2 of the consolidated financial statements. Where the policies for the parent company are substantially different from the policies for the Group, these are described below. Otherwise, refer to the notes to the consolidated financial statements.
Shares in subsidiaries
Shares in subsidiaries are recognised at cost in Reitan Retail AS’ financial statements.
Dividend and group contribution
Entities that are required to keep accounts and prepare company accounts in accordance with the regulations pursuant to Section 3.9 of the Norwegian Accounting Act, regardless of other provisions in these regulations, can choose to recognise dividends and group contributions in accordance with the provisions of the Norwegian Accounting Act. Reitan Retail AS has chosen to make use of this exception. This means that dividends and group contributions received and paid by the parent company will be recognised the year prior to when the receipt or payment is adopted. The same applies to any tax effect of such transactions.
Note 2 - Other income
Note 3 – Salaries and personnel costs
Note 3 – Salaries and personnel costs (continued)
Remuneration of the CEO and Board of Directors
In 2023, the CEO received a total compensation of NOK 10.1 million (NOK 9.2 million in 2022), of which NOK 9.0 million is salary and other short-term benefits and NOK 1.1 million is pension costs.
The CEO is entitled to severance pay equal to twelve months of the annual base salary from the expiry of the notice period. Any severance pay entitlement is conditional upon the CEO waiving the employee protection rights under local law and is applied in situations where resignation is requested by Reitan Retail AS. The CEO’s own resignation will not trigger severance payment, and the severance payment is also forfeited in cases of summary dismissal from the company.
Information about the individual remuneration to the members of the Board of Directors is
in the
from May 2022)
The Chair has no agreements regarding bonus or severance pay upon termination of office.
Fees to auditors (exclusive of VAT)
Note 4 – Pension obligations
As at December 31, 2023, Reitan Retail AS had 36 employees (24 employees as at December 31, 2022). The company is obligated to provide an occupational pension scheme in accordance with the Norwegian Mandatory Occupational Pension Act. Reitan Retail AS’s pension scheme satisfies the requirements of the Act.
Reitan Retail AS has a defined contribution plan for its employees with a contribution rate of 6 percent for
and 9 percent for salaries from 7.1G to 12G. A separate pension scheme has been established for employees with salaries above 12G. Total pension costs for 2023 are NOK 6.1 million (NOK 2.7 million in 2022). G is the basic amount of the Norwegian National Insurance Scheme. As at December 31, 2023, 1 G amounts to NOK 118,620.
In addition, Reitan Retail AS has several defined benefit plans arising from operations in previous years. The defined benefit plans primarily consist of secured pension plans financed through insurance companies.
Number of retirees covered by the
There were no active members in the defined
plans as at December 31, 2023.
171 4.2 Consolidated financial statements 4.3 Parent company financial statements 170 Our responsibility Our business Corporate governance Appendix Financial statements
provided
table
Million NOK 2023 2022 Rune Bjerke (Chair of the Board
-0.9 -0.5 Magnus Reitan (Board Member from
2010)Eilert Giertsen Hanoa (Board Member from May 2022) -0.4 -0.3
below.
May
Thousands NOK 2023 2022 Statutory audit services -1,800 -1,500 Total fees to auditors -1,800 -1,500
salaries
1G to 7.1G
from
Financial assumptions 2023 2022 Discount rate 3.70% 3.20% Expected rate of pension increase 2.25% 2.00% Expected increase of social security base amount 3.50% 0.00%
defined benefit plans 2023 2022 Secured pension plan 189 209 Unsecured pension plan 5 6
Financial Statements | Annual R eport 2023
benefit
Million NOK 2023 2022 Dividend and group contribution 1,675 1,810 Gain on sale of property, plant and equipment - 1 Other income 1,675 1,811
Salaries Million NOK 2023 2022 Salaries and holiday pay -73 -57 Social security tax -12 -7 Pension costs -6 -3 Other personnel costs -1 -6 Total salaries and personnel costs -92 -73 Number of employees, end of year 36 24 Average number of employees during the year 30 20
Note 5 – Income taxes
Note 6 – Investments
173 4.2 Consolidated financial statements 4.3 Parent company financial statements 172 Our responsibility Our business Corporate governance Appendix Financial statements
Income tax expenses and income tax payable Million NOK 2023 2022 Current tax on profit for the year -166 -140 Change in deferred tax -1 -1 Income tax expenses -167 -141 Current tax on profit for the year -166 -140 Effect of group contribution 156 140 Net income tax payable as at December 31 -10Reconciliation of Norwegian corporate income tax rate to effective tax rate Million NOK 2023 2022 Profit before taxes 1,638 1,681 Corporate income tax rate (22%) -360 -370 Effect of non-taxable income1 193 229 Income tax expenses -167 -141 Effective tax rate in % 10% 8% 1Effect of group contribution Changes in deferred tax liabilities (deferred tax assets) Million NOK 2023 2022 Net deferred tax (deferred tax assets) as at January 1 -Recognised in the period -Net deferred tax (deferred tax assets) as at December 31 -Income tax expense recognised in other comprehensive income Million NOK 2023 2022 Before tax Tax After tax Before tax Tax After tax Remeasurement gain/(loss) on defined benefit plans -5 1 -4 -3 1 -2 Other comprehensive income/(loss) -5 1 -4 -3 1 -2
in subsidiaries Million NOK Year of acquisition Office Share of ownership Share of voting rights 2023 2022 REMA 1000 AS 2001 Oslo, Norway 100% 100% -REMA 1000 Norge AS 1997 Oslo, Norway 100% 100% -REMA 1000 Danmark A/S 1994 Horsens, 100% 100% -Reitan Convenience AS 2001 Oslo, Norway 100% 100% 2,130 1,747 Uno-X Mobility AS 2020 Oslo, Norway 100% 100% 2,530 2,330 Gladengen Drift AS 2002 Oslo, Norway 100% 100% 19 17 Reitan Handel AS 2020 Oslo, Norway 100% 100% -Verde AS 2021 Oslo, Norway 100% 100% -Total investments in subsidiaries as at December 31 4,679 4,094 Financial Statements | Annual R eport 2023 Note
Pension obligations recognised in the balance sheet Million NOK 2023 2022 Defined benefit obligation (secured pension plan) -54 -57 Fair value plan assets 56 60 Net pension obligations (secured pension plan) 2 3 Defined benefit obligation (unsecured pension plan) -3 -3 Net pension obligations -1Pension obligations -1 -1 Pension assets 0 1 Net pension obligations recognised as at December 31 -1Reconciliation of the pension obligations Million NOK Defined benefit obligation Fair value plan assets Net pension obligation As at January 1, 2022 -66 67Net interest -1 1Actuarial changes arising from changes in financial assumptions 3 - 3 Benefits paid 7 -7As at December 31, 2022 -57 61 3 Net interest -2 2Actuarial changes arising from changes in financial assumptions -2 - -2 Benefits paid 7 -7As at December 31, 2023 -54 56 1 Asset categories December 31, 2023 December 31, 2022 Equity securities 4% 4% Loan 13% 15% Short-dated bonds 7% 6% Long-dated bonds 45% 41% Money market 15% 16% Real estate 14% 14% Other 2% 4% Total 100% 100% Return
2024
NOK
million
4 – Pension obligations (continued)
on pension funds Actual return on plan assets was 1.8 percent in 2023 (-3.7 percent in 2022). Expected premium payment Expected premium payments for
is
0.1
Note 7 – Receivables
Reitan Retail AS has provided loans to subsidiaries maturing on December 31, 2027 The effective interest rate is 5.9 percent as at December 31, 2023 (4.0 percent as per December 31, 2022). The company has not made any provisions for losses on receivables as at December 31, 2023 or as at December 31, 2022, nor have any such losses been realised in 2023 or 2022.
Note 9 – Liabilities
Reitan Retail AS has the following loan agreement as at December 31, 2023: Multi-currency credit facility - Reitan Retail AS In December 2021 Reitan Retail AS established a multi-currency credit facility. The loan is
consisting of six banks. The facility is a revolving credit of NOK 9,000
4,500 million matured in 2026. Both tranches included two one-year extension options. In 2022 the first extension option for both tranches was utilised, and in 2023 the last extension option was utili sed, extending maturity date to 2026 and 2028 respectively.
Note 8 – Share capital and shareholder information
The share capital consists of 105,000,000 shares with a nominal value of NOK 1.01 each. All shares carry equal rights in the company and are owned by REITAN AS.
The following financial covenants apply to the multi-currency revolving credit facility in Reitan Retail AS:
During 2023 and 2022, Reitan Retail AS was in compliance with these covenants, and there is
175 4.2 Consolidated financial statements 4.3 Parent company financial statements 174 Our responsibility Our business Corporate governance Appendix Financial statements
Borrowings Million NOK 31.12.23 31.12.22 Syndicated bank loans 4,598 3,949 Total borrowings as at December 31 4,598 3,949
financed
bank syndicate
million,
NOK 4,500 million originally matured in 2024, and NOK
Million NOK 2023 2022 Revolving credit 9,000 9,000 Total available credit as at December 31 9,000 9,000 Drawn amount in NOK 3,000 2,550 Drawn amount in DKK (in NOK) 422 396 Drawn amount in SEK (in NOK) 1,064 898 Drawn amount in EUR (in NOK) 112 105 Total drawn amount as at December 31 4,598 3,949 Undrawn credit amount as at December 31 4,402 5,051
by a
of which
Time of measurement Net interest -bearing debt/ EBITDA (maximum) Equity share (minimum) Q4 2021 and later 3.50 25.0% Net interest-bearing debt
equity share
measured
16 leases. EBITDA is adjusted for IFRS 16 lease payments.
going
Other payables Million NOK 31.12.23 31.12.22 Current liabilities to parent company 541 140 Current liabilities to subsidiaries 2 56 Trade payables 4 20 Social securities and other taxes 7 3 Accrued expenses 65 60 Total other payables as at December 31 619 279 Financial Statements | Annual R eport 2023
and
are
excluding IFRS
significant headroom also
forward.
Non-current receivables Million NOK 31.12.23 31.12.22 Receivables from subsidiaries langsiktig 4,673 4,870 Other non -current receivables 19 24 Total non -current receivables 4,692 4,894
Million NOK 31.12.23 31.12.22 Receivables from subsidiaries 1,676 1,875 Other current receivables 18 55 Total current receivables 1,694 1,930
Current receivables
Share capital
premium 31.12.23 31.12.22 Share capital 106,050,000 106,050,000 Share premium 1,929,021,000 1,929,021,000 Share capital
premium
December 31 2,035,071,000 2,035,071,000
and
and
as at
Note 11 – Related party transactions
Note 12 – Events after
177 4.2 Consolidated financial statements 4.3 Parent company financial statements 176 Our responsibility Our business Corporate governance Appendix Financial statements
Receivables Million NOK 31.12.23 31.12.22 REMA 1000 AS 2,776 3,121 Reitan Convenience AS 1,897 1,749 Total non -current receivables 4,673 4,870 REMA 1000 AS 1,675 1,810 Reitan Convenience AS - 7 Uno-X Mobility AS - 52 Other group companies 1 6 Total current receivables 1,676 1,875 Liabilities Million NOK 31.12.23 31.12.22 REITAN AS -Total non -current borrowings -REITAN AS 48 140 Reitan Convenience AS 492 51 Other group companies 3 4 Total other payables 543 195 Total liabilities 543 195 Interest income Million NOK 2023 2022 REMA 1000 AS 239 92 Reitan Convenience AS 99 38 Uno-X Mobility AS 1 1 Total interest income 339 132 Interest expenses Million NOK 2023 2022 REITAN AS -Total interest expenses -Guarantees Reitan Retail AS has issued guarantees on behalf of subsidiaries of NOK 27 million as at December 31, 2023 (NOK 29 million on behalf of subsidiaries as at December 31, 2022).
reporting period Amendment of the multi-currency credit facility In March 2024, Reitan Retail AS entered into a DKK 1,300 million term loan with 2-year maturity, financed by the same bank syndicate as its existing multi-currency credit facility. The loan is entered into to finance the payment of the purchase price and capital expenditures related to Reitan Retail’s acquisition of a majority of ALDI’s Danish grocery store network. Financial Statements | Annual R eport 2023 Note
– Financial Instruments Million NOK 2023 2022 Assets Non- current receivables 4,692 4,894 Current receivables 1,694 1,930 Total financial assets at amortised cost 6,386 6,824 Liabilities Non- current borrowings 4,598 3,949 Other payables 619 279 Total financial liabilities at amortised cost 5,217 4,228 Net financial instruments as at December 31 1,169 2,596
the
10
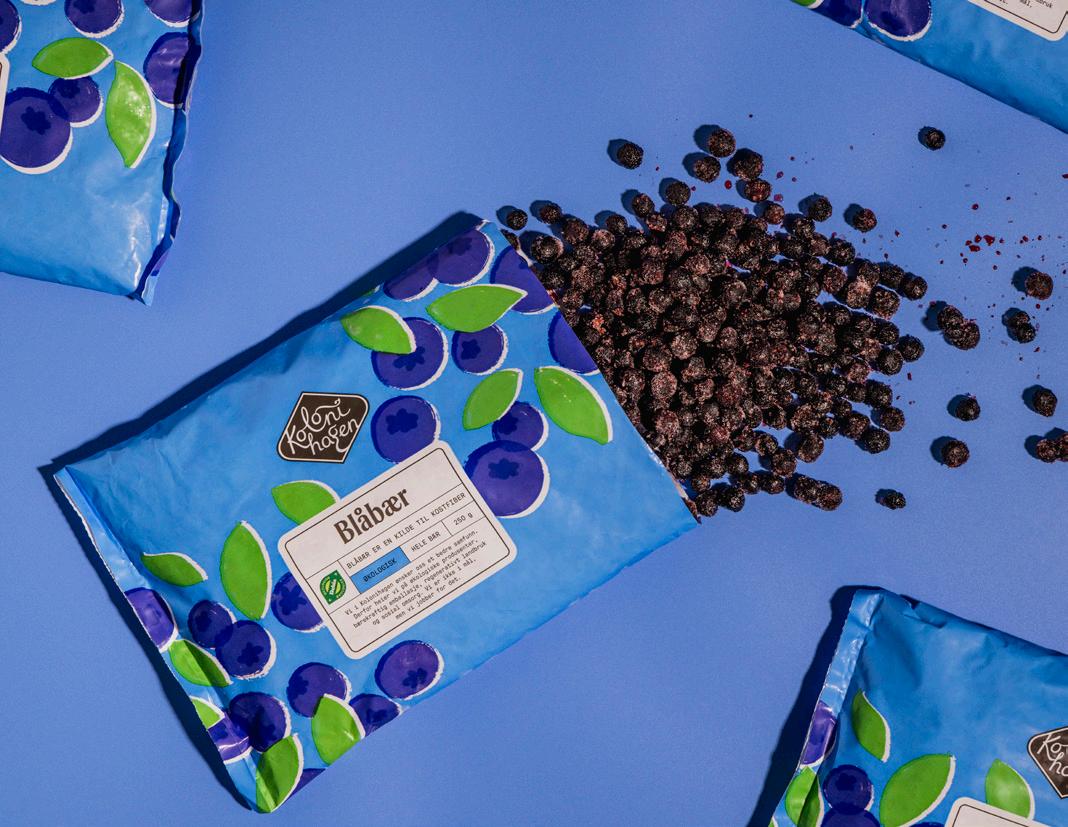
4.4 Auditor’s report
INDEPENDENT AUDITOR'S REPORT
To the Annual Shareholders' Meeting of Reitan Retail AS
Opinion
We have audited the financial statements of Reitan Retail AS (the Company), which comprise the financial statements of the Company and the consolidated financial statements of the Company and its subsidiaries (the Group). The financial statements of the Company comprise the statement of financial position as at 31 December 2023, the statement of comprehensive income, the statement of cash flows and the statement of changes in equity for the year then ended, and the notes to the financial statements, including a summary of significant accounting policies. The consolidated financial statements of the Group comprise the consolidated statement of financial position as at 31 December 2023, the consolidated statement of profit or loss, the consolidated statement of comprehensive income, the consolidated statement of cash flow, the consolidated statement of changes in equity for the year ended and the notes to the financial statements, including general accounting policies.
In our opinion
the financial statements comply with applicable legal requirements, the financial statements give a true and fair view of the financial position of the Company as at 31 December 2023 and its financial performance and cash flows for the year then ended in accordance with simplified application of international accounting standards according to section 3-9 of the Norwegian Accounting Act, the consolidated financial statements give a true and fair view og the financial position of the Group as at 31 December 2023 and its financial performance and cash flows for the year then ended in accordance with IFRS Accounting Standards as adopted by the EU.
Basis for opinion
We conducted our audit in accordance with International Standards on Auditing (ISAs). Our responsibilities under those standards are further described in the Auditor’s responsibilities for the audit of the financial statements section of our report. We are independent of the Company and the Group in accordance with the requirements of the relevant laws and regulations in Norway and the International Ethics Standards Board for Accountants’ International Code of Ethics for Professional Accountants (including International Independence Standards) (IESBA Code), and we have fulfilled our other ethical responsibilities in accordance with these requirements. We believe that the audit evidence we have obtained is sufficient and appropriate to provide a basis for our opinion.
Other information
Other information consists of the information included in the annual report other than the financial statements and our auditor’s report thereon. Management (the board of directors and CEO) is responsible for the other information. Our opinion on the financial statements does not cover the other information, and we do not express any form of assurance conclusion thereon.
In connection with our audit of the financial statements, our responsibility is to read the other information, and, in doing so, consider whether the board of directors’ report contains the information required by legal requirements and whether the other information is materially inconsistent with the financial statements or our knowledge obtained in the audit, or otherwise appears to be materially misstated. If, based on the work we have performed, we conclude that there is a material misstatement of this other information or that the information required by legal requirements is not included, we are required to report that fact.
179 178 Our responsibility Our business Corporate governance Financial statements Appendix Our responsibility Our business Corporate Governance Financial statments Appendix 178 Reitan Retail Responsible retail 2022 178
Statsautoriserte revisorer Ernst & Young AS Stortorvet 7, 0155 Oslo Postboks 1156 Sentrum, 0107 Oslo Foretaksregisteret: NO 976 389 387 MVA Tlf: +47 24 00 24 00 www.ey.no Medlemmer av Den norske Revisorforening A member firm of Ernst & Young Global Limited
We have nothing to report in this regard, and in our opinion, the board of directors’ report is consistent with the financial statements and contains the information required by applicable legal requirements.
Responsibilities of management for the financial statements
Management is responsible for the preparation of the financial statements that give a true and fair view in accordance with IFRS Accounting Standards as adopted by the EU, and for such internal control as management determines is necessary to enable the preparation of financial statements that are free from material misstatement, whether due to fraud or error.
In preparing the financial statements, management is responsible for assessing the Company’s and the Group’s ability to continue as a going concern, disclosing, as applicable, matters related to going concern and using the going concern basis of accounting unless management either intends to liquidate the Company or the Group, or to cease operations, or has no realistic alternative but to do so.
Auditor’s responsibilities for the audit of the financial statements
Our objectives are to obtain reasonable assurance about whether the financial statements as a whole are free from material misstatement, whether due to fraud or error, and to issue an auditor’s report that includes our opinion. Reasonable assurance is a high level of assurance, but is not a guarantee that an audit conducted in accordance with ISAs will always detect a material misstatement when it exists.
Misstatements can arise from fraud or error and are considered material if, individually or in the aggregate, they could reasonably be expected to influence the economic decisions of users taken on the basis of these financial statements.
As part of an audit in accordance with ISAs, we exercise professional judgment and maintain professional scepticism throughout the audit. We also:
Identify and assess the risks of material misstatement of the financial statements, whether due to fraud or error, design and perform audit procedures responsive to those risks, and obtain audit evidence that is sufficient and appropriate to provide a basis for our opinion. The risk of not detecting a material misstatement resulting from fraud is higher than for one resulting from error, as fraud may involve collusion, forgery, intentional omissions, misrepresentations, or the override of internal control.
Obtain an understanding of internal control relevant to the audit in order to design audit procedures that are appropriate in the circumstances, but not for the purpose of expressing an opinion on the effectiveness of the Company’s and the Group’s internal control.
Evaluate the appropriateness of accounting policies used and the reasonableness of accounting estimates and related disclosures made by management.
Conclude on the appropriateness of management’s use of the going concern basis of accounting and, based on the audit evidence obtained, whether a material uncertainty exists related to events or conditions that may cast significant doubt on the Company’s and the Group’s ability to continue as a going concern. If we conclude that a material uncertainty exists, we are required to draw attention in our auditor’s report to the related disclosures in the financial statements or, if such disclosures are inadequate, to modify our opinion. Our conclusions are based on the audit evidence obtained up to the date of our auditor’s report. However, future events or conditions may cause the Company and the Group to cease to continue as a going concern.
Evaluate the overall presentation, structure and content of the financial statements, including the disclosures, and whether the financial statements represent the underlying transactions and events in a manner that achieves fair presentation.
Obtain sufficient appropriate audit evidence regarding the financial information of the entities or business activities within the Group to express an opinion on the consolidated financial statements. We are responsible for the direction, supervision and performance of the group audit. We remain solely responsible for our audit opinion.
We communicate with the board of directors regarding, among other matters, the planned scope and timing of the audit and significant audit findings, including any significant deficiencies in internal control that we identify during our audit.
Oslo, 26 April 2024 ERNST &YOUNG AS
Asbjørn Ler
State Authorised Public Accountant (Norway)
181 180 Our responsibility Our business Corporate governance Financial statements Appendix 2 Independent auditor's report - Reitan Retail AS 2023 A member firm of Ernst & Young Global Limited
3 Independent auditor's report - Reitan Retail AS 2023 A member firm of Ernst & Young Global Limited
Appendix
5.1 Performance measures and definitions
5.2 Transparency Act
5.3 EU Taxonomy
5.4 Greenhouse gas accounting
Greenhouse gas accounting methodology
Greenhouse gas accounting verification statement
5.5 GRI standards
Introduction
General disclosures
Environmental disclosures
Health disclosures
People disclosures
GRI Index
183 182 Our responsibility Our business Corporate governance Financial statements Appendix
5.1 Performance measures and definitions
1. Alternative performance measures
In the reporting of financial information, Reitan Retail (“the Group”) has
performance measures (APMs). These measures are not defined by International Financial Reporting Standards (IFRS) and may not be directly comparable to other companies’ APMs, including those in the Group’s industry. APMs should be considered as supplementary measures and are not intended to be a substitute for, or superior to, IFRS measurements. The Group believes that these APMs assist
performance and position of the Group. Consequently, APMs are used by the
for performance
on the
and
The following sections contain definitions and reconciliations of the Group’s APMs to the closest IFRS measures. Due to rounding, numbers presented may not add up precisely to the totals provided in the consolidated financial statements.
Performance measures per retail segment1
1.6 EBITDA, or earnings before interest, taxes, depreciation and amortisation 1.7
185 184 Our responsibility Our business Corporate governance Financial statements Appendix Reitan Retail Responsible retail 2022
1. Alternative performance measures 1.1 Systemwide sales 1.2 Growth in systemwide sales 1.3 Like-for-like growth in systemwide sales 1.4 Total systemwide and distribution sales
Growth in revenue
1.5
Equity ratio
Interest-bearing receivables and bank deposits 1.9 Operating profit 1.10 Operating profit as a percentage of revenue 1.11 Operating profit as a percentage of systemwide sales 1.12 Total investments 2. Definitions and non-financial performance measures 2.1 Sales outlets 2.2 Systemwide employees 185 187 189 190 192 193 194 194 195 196 196 196 197 198 198 198 Performance measures and definitions | Annual report 2023 76
1.8
various so-called
providing additional useful information
underlying trends,
analysis,
adopted
alternative
in
management
planning
reporting.
Million NOK REMA 1000 NO REMA 1000 DK Reitan Conv. Uno-X Mob. Other/elim . Reitan Retail Total systemwide and distribution sales 56,395 43,097 16,945 30,046 -3,893 142,591 Systemwide sales 51,280 35,207 16,490 24,656 51 127,684 Growth in systemwide sales 8.2% 10.2% 3.6% - - 8.1% Like-for-like growth in systemwide sales 7.5% 8.8% 6.7% - - 7.8% Number of sales outlets 674 372 1,769 823 1 3,639 Number of employees 2,255 2,023 2,491 311 79 7,159 Number of systemwide employees 15,673 17,351 11,954 311 79 45,368 2022 Million NOK REMA 1000 NO REMA 1000 DK Reitan Conv. Uno-X Mob. Other/elim . Reitan Retail Total systemwide and distribution sales 51,990 35,137 15,082 30,887 -3,463 129,633 Systemwide sales 47,401 28,301 14,688 25,340 38 115,767 Growth in systemwide sales -0.5% 10.4% 16.1% - - 5.2% Like-for-like growth in systemwide sales -1.7% 9.5% 15.0% - - 4.1% Number of sales outlets 668 363 1,953 816 1 3,801 Number of employees 2,284 1,403 2,517 299 64 6,567 Number of systemwide employees 15,320 15,176 12,585 299 64 43,444 1These performance measures relate to the Group’s retail segments. As such, measures for the Real Estate segment are not presented. Performance measures
area 2023 Million NOK Norway Denmark Sweden Finland Baltics Other/elim Reitan Retail Total systemwide and distribution sales 77,275 55,460 4,068 3,206 2,581 - 142,591 Systemwide sales 70,483 47,802 4,068 3,206 2,126 - 127,684 Sales outlets 1,550 844 388 379 478 - 3,639 Number of employees 2,737 2,245 117 577 1,483 - 7,159 Number of systemwide employees 18,609 19,428 2,763 2,415 2,153 - 45,368 2022 Million NOK Norway Denmark Sweden Finland Baltics Other/elim . Reitan Retail Total systemwide and distribution sales 73,435 47,683 3,563 2,821 2,132 - 129,633 Systemwide sales 67,028 40,618 3,563 2,821 1,738 - 115,767 Sales outlets 1,579 838 397 451 536 - 3,801 Number of employees 2,675 1,626 106 580 1,580 - 6,567 Number of systemwide employees 18,611 17,211 2,971 2,360 2,291 - 43,444
2023
per geographical
1.1 Systemwide sales
Definition: ‘Systemwide sales’ represents sales in all sales outlets under the Group’s concepts and banners, whether operated by the franchisees, Reitan Retail, dealers or commission-based retailers
Sales from franchise-operated sales outlets are reported by the franchisees and represent their revenues from sales at franchise-operated sales outlets. Sales from franchise-operated sales outlets are not recorded as revenue by Reitan Retail and are not included in the Group’s consolidated financial statements. However, the Group’s revenues from sale of franchise services are computed based on the sales made by the franchisees and, as a result, sales from franchise-operated sales outlets have a direct effect on the Group’s revenue from sale of franchise services and its profitability.
The systemwide sales measure allows management to assess changes in our overall system performance, the health of our brand, the financial health of the franchisee base and the strength of our market position relative to our competitors.
The Group believes this APM is an important supplemental measure of operating performance because it highlights trends in the Group’s business that may not otherwise be apparent when relying solely on GAAP financial measures.
‘Systemwide sales’ includes excise duties and excludes VAT.
The closest IFRS measure to ‘Systemwide sales’ is the line item ‘Revenue’ as recorded in the consolidated statement of profit or loss.
1.1.1 Components of ‘systemwide sales’ 2023
1 Not recorded as revenue by the Group.
2 Incl. excise duties reported net by the Group, see note 7 - Revenue in Reitan Retail's consolidated financial statements.
1.1 Systemwide sales (continued)
187 186 Our responsibility Our business Corporate governance Financial statements Appendix Performance measures and definitions | Annual report 2023 1.1.2
Million NOK Ref. REMA 1000 NO REMA 1000 DK Reitan Conv. Uno-X Mob. Other /elim. Reitan Retail Rev. from sale of goods in company operated sales outlets Note 7 346 44 1,594 9,283 51 11,318 Rev. from sale of goods in dealer and commission op. sales outlets Note 7 - - 979 6,373 -61 7,292 Rev. from sale of services in comp., dealer and comm. op. s. outlets1 Note 6 - - 74 152 - 226 Revenue recorded by the Group, incl. in systemwide sales (A) 346 44 2,647 15,809 -10 18,836 Rev. from sale of goods to franchisees Note 7 28,979 29,312 - - 3,916 62,207 Rev. from sale of goods to other external customers Note 7 5,116 7,890 461 4,922 -3,943 14,446 Rev. from sale of franchise services Note 6 3,448 2,462 1,781 - - 7,691 Rev. from sale of services to other external customers1 Note 6 387 5 763 50 -61 1,144 Revenue recorded by the Group, not incl. in systemwide sales (B) 37,930 39,669 3,005 4,972 -88 85,488 Revenue recorded by the Group (= A + B) Note 6 38,276 39,713 5,652 20,780 -98 104,322 2022 Million NOK Ref. REMA 1000 NO REMA 1000 DK Reitan Conv. Uno-X Mob. Other /elim. Reitan Retail Rev. from sale of goods in company operated sales outlets Note 7 312 110 1,208 11,626 38 13,293 Rev. from sale of goods in dealer and commission op. sales outlets Note 7 - - 810 5,102 -40 5,873 Rev. from sale of services in comp., dealer and comm. op. s. outlets1 Note 6 - - 85 3 - 88 Revenue recorded by the Group, incl. in systemwide sales (A) 312 110 2,104 16,731 -2 19,254 Rev. from sale of goods to franchisees Note 7 26,643 23,874 - - 3,475 53,992 Rev. from sale of goods to other external customers Note 7 4,589 6,836 394 4,904 -3,497 13,226 Rev. from sale of franchise services Note 6 3,188 1,975 1,682 - - 6,844 Rev. from sale of services to other external customers1 Note 6 255 4 649 121 21 1,051 Revenue recorded by the Group, not incl. in systemwide sales (B) 34,674 32,689 2,725 5,025 -1 75,112 Revenue recorded by the Group (= A + B) Note 6 34,986 32,799 4,829 21,756 -2 94,367 1 'Revenue from sale of other services' (ref. note 6 - Segment information in Reitan Retail's consolidated financial statements) is for the purpose of this reconciliation split between 'Revenue from sale of services in company, dealer and commission operated sales outlets' and 'Revenue from sale of services to other external customers'.
Revenue included in ‘Systemwide sales’ 2023
77
Million NOK REMA 1000 NO REMA 1000 DK Reitan Conv. Uno-X Mob. Other Reitan Retail Sale of goods and services in franchise-operated sales outlets1 50,934 35,163 13,843 - 61 100,001 Sale of goods and serv. in company, dealer and comm. op. s. outlets2 346 44 2,647 24,656 -10 27,683 Systemwide sales 51,280 35,207 16,490 24,656 51 127,684 2022 Million NOK REMA 1000 NO REMA 1000 DK Reitan Conv. Uno-X Mob. Other Reitan Retail Sale of goods and services in franchise-operated sales outlets1 47,089 28,192 12,584 - 40 87,904 Sale of goods and serv. in company, dealer and comm. op. s. outlets2 312 110 2,104 25,340 -2 27,863 Systemwide sales 47,401 28,301 14,688 25,340 38 115,767
5.1 Performance measures and definitions
1.1 Systemwide sales (continued)
1 Revenue is reported net of these excise duties by the Group, see note 7 - Revenue. Excise duties on sugar sweetened beverages and alcohol reported net by the Group are included in line 'Sale of goods and services - franchise-operated sales outlets'.
2 Not recorded as revenue by the Group.
3 'Revenue for Reitan Retail excl. Uno-X Mobility' and 'Systemwide sales for Reitan Retail excl. Uno-X Mobility' are used when calculating growth in revenue and systemwide sales, see section 1.5 and 1.2 respectively.
Definition: ‘Growth in systemwide sales’ refers to the percentage change in systemwide sales in one period from the same period in the prior year measured at constant currency.
To exclude the impact of foreign currency translation ‘Growth in systemwide sales’ is measured in local currency at constant foreign exchange rates, using the currency rate from prior comparable period The Group believes excluding the impact of foreign currency translation provides a better year over year comparability.
To eliminate fuel price volatility in the comparison, ‘Growth in systemwide sales’ is not calculated for Uno-X Mobility and hence not included in the growth figure of Reitan Retail excl. Uno-X Mobility
‘Growth in systemwide sales’ is a ratio that measures year-on-year movement in systemwide sales. It is considered a good indicator of how rapidly the business is growing.
1.2.1 Calculation of ‘Growth in systemwide sales’ 2023
1 'Systemwide sales' is recalculated based on previous period's currency rates, refer to table below.
189 188 Our responsibility Our business Corporate governance Financial statements Appendix Performance measures and definitions | Annual report 2023
Million NOK REMA 1000 NO REMA 1000 DK Reitan Conv. Elim. Reitan Retail excl. Uno-X Mob. Systemwide sales 2023, based on constant currency rates1 (A) 51,280 31,181 15,210 51 97,722 Systemwide sales 2022 (B) 47,401 28,301 14,688 38 90,427 Growth in systemwide sales (= A/B-1) 8.2% 10.2% 3.6% - 8.1%
Recalculation of systemwide sales based on constant currency rates Million NOK REMA 1000 NO REMA 1000 DK Reitan Conv. Elim. Reitan Retail excl. Uno-X Mob. Systemwide sales 2023 51,280 35,207 16,490 51 103,028 Effect using exchange rates for 2022 - -4,026 -1,280 - -5,306 Systemwide sales 2023, based on constant currency rates 51,280 31,181 15,210 51 97,722 2022 Million NOK REMA 1000 NO REMA 1000 DK Reitan Conv. Elim. Reitan Retail excl. Uno-X Mob. Systemwide sales 2022, based on constant currency rates1 (A) 47,401 28,441 14,918 38 90,798 Systemwide sales 2021 (B) 47,642 25,752 12,853 -11 86,237 Growth in systemwide sales (= A/B-1) -0.5% 10.4% 16.1% - 5.2% 1 'Systemwide sales' is recalculated based on previous period's currency rates, refer to table below. Recalculation of systemwide sales based on constant currency rates Million NOK REMA 1000 NO REMA 1000 DK Reitan Conv. Elim. Reitan Retail excl. Uno-X Mob. Systemwide sales 2022 47,401 28,301 14,688 38 90,427 Effect using exchange rates for 2021 - 140 230 - 370 Systemwide sales 2022, based on constant currency rates 47,401 28,441 14,918 38 90,798 1.2
Reconciliation of ‘Systemwide sales’ to revenue 2023 Million NOK Ref. REMA 1000 NO REMA 1000 DK Reitan Conv. Uno-X Mob. Other / elim. Reitan Retail Less: Uno-X Mob. Reitan Retail excl. Uno-X Mob.3 Revenue Note 6 38,276 39,713 5,652 20,780 -98 104,322 -20,780 83,542 Less: Revenue not included in systemwide sales Section 1.1.2 -37,930 -39,669 -3,005 -4,972 88 -85,488 4,972 -80,516 Add: Excise duties on refined oil products 1 Note 7 - - - 8,848 - 8,848 -8,848Sale of goods and serv. in franchise-op. sales 50,934 35,163 13,843 - 61 100,001 - 100,001 Systemwide sales 51,280 35,207 16,490 24,656 51 127,684 -24,656 103,027 2022 Million NOK Ref. REMA 1000 NO REMA 1000 DK Reitan Conv. Uno-X Mob. Other / elim. Reitan Retail Less: Uno-X Mob. Reitan Retail excl. Uno-X Mob.3 Revenue Note 6 34,986 32,799 4,829 21,756 -3 94,367 -21,756 72,611 Less: Revenue not included in systemwide sales Section 1.1.2 -34,674 -32,689 -2,725 -5,025 1 -75,113 5,025 -70,088 Add: Excise duties on refined oil products 1 Note 7 - - - 8,609 - 8,609 -8,609Sale of goods and serv. in franchise-op. sales 47,089 28,192 12,584 - 40 87,904 - 87,904 Systemwide sales 47,401 28,301 14,688 25,340 38 115,767 -25,340 90,427
Growth in systemwide sales 1.1.3
5.1 Performance measures and definitions
Definition: ‘Like-for- like growth in systemwide sales’ is calculated as the percentage growth of comparable systemwide sales from last year.
Only sales outlets that operate under the same conditions in two comparing periods are considered to be comparable and hence included in the like-for -like growth figure. Exemption is made for sales outlets which are temporarily closed for less than 30 days.
To exclude the impact of foreign currency translation, like-for -like growth in systemwide sales is measured in local currency at constant foreign exchange rates. The Group believes excluding the impact of foreign currency translation provides a better year over year comparability.
As the consolidated growth figure consists of companies with different local currencies, growth is weighted based on the companies' relative share of systemwide sales last year (in NOK).
To eliminate fuel price volatility in the comparison, like-for-like growth in systemwide sales is not calculated for Uno-X Mobility and hence not included in calculation of like -for-like growth in systemwide sales for the Group.
The Group believes that disclosing ‘Like-for -like growth in systemwide sales’ provides additional useful analytical information to investors regarding the operating performance of Reitan Retail as it neutralises the impact of, for example, newly acquired or closed sales outlets, in the calculation of systemwide sales growth.
1.3.1 Calculation of ‘Like-for-like growth in systemwide sales’ 2023
Business areas excl. Uno-X Mobility
growth in systemwide sales 2023 (C = A/B-1)
1 'Systemwide sales' is recalculated based on previous period's exchange rates, refer to section
2 Only sales outlets that operate under the same conditions in two comparing periods are considered to be comparable and hence included in likefor-like growth in systemwide sales. Reitan Retail excl. Uno-X Mobility
1 As the consolidated growth figure consists of companies with different local currencies, it is weighted based on the companie s' relative share of systemwide sales last year (in NOK). 1.3
1 As the consolidated growth figure consists of companies with different local currencies, it is weighted
systemwide sales
(in
191 190 Our responsibility Our business Corporate governance Financial statements Appendix Performance measures and definitions | Annual report 2023 2022 Business areas excl. Uno-X Mobility Million NOK REMA 1000 NO REMA 1000 DK Reitan Conv. Systemwide sales 2022, based on constant currency rates1 47,401 28,441 14,918 Like-for-like adjustment2 -970 -232 -783 Like-for-like adj. systemwide sales 2022 (A) 46,430 28,209 14,135 Systemwide sales 2021 47,642 25,752 12,853 Like-for-like adjustment2 -398 - -566 Like-for-like adj. systemwide sales 2021 (B) 47,245 25,752 12,286 Like-for-like growth in systemwide sales 2022 (C = A/B-1) -1.7% 9.5% 15.0%
previous period's
rates, refer to section 1.2.
1 'Systemwide sales' is recalculated based on
exchange
that operate under the same conditions in two comparing periods are considered to be comparable and hence included in like -
Reitan Retail excl. Uno-X Mobility Million NOK REMA 1000 NO REMA 1000 DK Reitan Conv. Percentage share of systemwide sales 2021, excl. Uno -X Mobility (D) 55.2% 29.9% 14.9% Like-for-like growth in systemwide sales 2022 (C) -1.7% 9.5% 15.0% Weighted like-for-like growth in systemwide sales 2022 (E = C*D) -1.0% 2.8% 2.2% Like-for-like growth in systemwide sales 2022 for Reitan Retail excl. Uno-X Mobility1 (= sum of E) 4.1%
2 Only sales outlets
for-like growth in systemwide sales.
based on the companie s' relative share of
81
last year
NOK). 1.3 Like-for-like growth in systemwide sales (continued)
Million NOK REMA 1000 NO REMA 1000 DK Reitan Conv. Systemwide sales 2023, based on constant currency rates1 51,280 31,181 15,210 Like-for-like adjustment2 -726 -401 -1013 Like-for-like adj. systemwide sales 2023 (A) 50,554 30,780 14,197 Systemwide sales 2022 47,401 28,301 14,688 Like-for-like adjustment2 -361 0 -1385 Like-for-like adj. systemwide sales 2022 (B) 47,039 28,301 13,303 Like-for-like
7.5% 8.8% 6.7%
Million
REMA 1000 NO REMA 1000 DK Reitan Conv.
2022, excl.
-X Mobility (D) 52.4% 31.3% 16.2% Like-for-like growth in systemwide sales
7.5% 8.8% 6.7% Weighted
systemwide sales
3.9% 2.7% 1.1% Like-for-like
7.8%
1.2.
NOK
Percentage share of systemwide sales
Uno
2023 (C)
like-for-like growth in
2023 (E = C*D)
growth in systemwide sales 2023 for Reitan Retail excl. Uno-X Mobility1 (= sum of E)
5.1 Performance measures and definitions
Like-for-like growth in systemwide sales
Definition : ‘Total systemwide
The Group uses ‘Total systemwide and distribution sales’ as an internal measure of business operating performance and as a performance measure for benchmarking against the Group’s peers and competitors.
‘Total systemwide and distribution sales’ includes excise duties and excludes VAT.
The closest IFRS measure to ‘Total systemwide and distribution sales’ is the line item ‘Revenue’ as recorded in the consolida
or loss.
1.4.1 Reconciliation of ‘Total
Definition: ‘Growth in revenue’ refers to the percentage change in revenue in
in the
measured at constant currency.
To exclude the impact of foreign currency translation ‘Growth in revenue’ is
the currency rate from prior comparable period. The Group believes excluding the impact
year comparability. To eliminate fuel price volatility in the comparison, ‘Growth in revenue’
figure of Reitan Retail excl. Uno-X Mobility
1.5.1 Calculation of ‘Growth in revenue’ 2023
NOK
1 Revenue is recalculated based on
193 192 Our responsibility Our business Corporate governance Financial statements Appendix Performance measures and definitions | Annual report 2023 84
one period from the same period
prior year
measured in local currency at constant foreign exchange rates, using
of
currency translation provides better a year over
not calculated for
Mobility and hence not included in the growth
foreign
is
Uno-X
Million
REMA 1000 NO REMA 1000 DK Reitan Conv. Real estate Other/ elim. Reitan Retail excl. Uno-X Mob. Revenue 2023, based on constant currency rates (A)1 38,276 35,146 5,149 21 -119 78,474 Revenue 2022 (B) 34,986 32,799 4,829 21 -24 72,611 Growth in revenue (= A/B-1) 9.4% 7.2% 6.6% -1.8% - 8.1%
Revenue is recalculated based on previous period's currency rates, refer to table below. Recalculation
revenues based on constant currency rates Million NOK REMA 1000 NO REMA 1000 DK Reitan Conv. Real estate Other/ elim. Reitan Retail excl. Uno-X Mob. Revenue 2023 38,276 39,713 5,652 21 -119 83,544 Effect using exchange rates for 2022 - -4,567 -503 - - -5,070 Revenue 2022, based on constant currency rates 38,276 35,146 5,149 21 -119 78,474 2022 Million NOK REMA 1000 NO REMA 1000 DK Reitan Conv. Real estate Other/ elim. Reitan Retail excl. Uno-X Mob. Revenue 2022, based on constant currency rates (A)1 34,986 32,959 4,884 21 -24 72,827 Revenue 2021 (B) 34,764 29,541 3,988 35 -78 68,250 Growth in revenue (= A/B-1) 0.6% 11.6% 22.5% -39.4% - 6.7%
1
of
previous period's currency rates, refer to table below. Recalculation of revenues based on constant currency rates Million NOK REMA 1000 NO REMA 1000 DK Reitan Conv. Real estate Other/ elim. Reitan Retail excl. Uno-X Mob. Revenue 2022 34,986 32,799 4,829 21 -24 72,611 Effect using exchange rates for 2021 - 161 56 - - 216 Revenue 2021, based on constant currency rates 34,986 32,959 4,884 21 -24 72,827 1.5 Growth in revenue 83
distribution sales’ consists of systemwide sales and distribution sales. Distribution sales is the Group’s sale of goods to other external customers not included in systemwide sales.
and
ted statement of profit
systemwide
Million NOK Ref. REMA 1000 NO REMA 1000 DK Reitan Conv. Uno-X Mob. Other / elim. Reitan Retail Revenue Note 6 38,276 39,713 5,652 20,780 -98 104,322 Revenue not included in systemwide sales Section 1.1.2 -37,930 -39,669 -3,005 -4,972 88 -85,488 Excise duties on refined oil products 1 Note 7 - - - 8,848 - 8,848 Sale of goods and services in franchise-operated sales outlets2 50,934 35,163 13,843 - 61 100,001 Systemwide sales (A) 51,280 35,207 16,490 24,656 51 127,684 Rev. from sale of goods to other external customers Note 6 5,116 7,890 455 4,922 -3,944 14,439 Excise duties on refined oil products 1 Note 7 - - - 468 - 468 Distribution sales (B) 5,116 7,890 455 5,390 -3,944 14,906 Total systemwide and distribution sales (= A + B) 56,395 43,097 16,945 30,046 -3,893 142,590 2022 Million NOK Ref. REMA 1000 NO REMA 1000 DK Reitan Conv. Uno-X Mob. Other / elim. Reitan Retail Revenue Note 6 34,986 32,799 4,829 21,756 -2 94,367 Revenue not included in systemwide sales Section 1.1.2 -34,674 -32,689 -2,725 -5,025 1 -75,112 Excise duties on refined oil products 1 Note 7 - - - 8,609 - 8,609 Sale of goods and services in franchise-operated sales outlets2 47,089 28,192 12,584 - 40 87,904 Systemwide sales (A) 47,401 28,301 14,688 25,340 38 115,767 Rev. from sale of goods to other external customers Note 6 4,589 6,836 394 4,904 -3,501 13,222 Excise duties on refined oil products 1 Note 7 - - - 644 - 644 Distribution sales (B) 4,589 6,836 394 5,547 -3,501 13,865 Total systemwide and distribution sales (= A + B) 51,990 35,137 15,082 30,887 -3,463 129,633
7
Revenue.
duties on sugar
beverages
net
Group
included in line
of goods and services - franchise-operated sales outlets'. 2
recorded
revenue
the Group.
Total
distribution
5.1 Performance measures and definitions
and distribution sales’ to revenue 2023
1 Revenue is reported net of these excise duties by the Group, see note
-
Excise
sweetened
and alcohol reported
by the
are
'Sale
Not
as
by
1.4
systemwide and
sales
1.6 EBITDA, or earnings before interest, taxes, depreciation and amortisation
Definition: Operating profit before amortisation, depreciation and impairment.
EBITDA is considered to be a useful measure to understand the overall picture of profit generated in the Group and its segments’ operating activities.
1.7
Equity ratio
Definition: Shareholders’ equity as a percentage of total assets at the end of the period.
Measures the amount of leverage used by the Group.
Calculation of equity ratio
(B)
1.8 Interest-bearing receivables and bank deposits
Definition: Current interest-bearing receivables, other non- current receivables and cash and cash equivalents.
This figure is useful when evaluating the Group’s interest rate risk and liquidity needs.
The closest IFRS measure to ‘Interest-bearing receivables and bank deposits’ is the line items ‘Trade and other receivables’, ‘Receivables’ and ‘Cash and cash equivalents’.
1.8.1 Components of ‘Interest-bearing receivables and bank deposits’
1.8.2 Reconciliation of ‘Interest-bearing
and bank deposits’
195 194 Our responsibility Our business Corporate governance Financial statements Appendix Performance measures and definitions | Annual report 2023
Million NOK Ref. 2023 2022 Cash and cash equivalents Statement of financial position 1,556 1,220 Current interest-bearing receivables Note 19 99 58 Other non -current interest-bearing receivables Note 19 164 291 Interest -bearing receivables and bank deposits as at December 31 1,819 1,569
Million NOK Ref. 2023 2022 Trade and other receivables Statement of financial position 10,783 9,860 Receivables Statement of financial position 284 400 Cash and cash equivalents Statement of financial position 1,556 1,220 12,623 11,480 Less: Trade receivables Note 19 -9,071 -8,066 Accrued income Note 19 -460 -209 Current receivables, franchisees Note 19 -179 -221 Current non -interest-bearing receivables Note 19 -974 -1,306 Other non -current receivables Note 19 -120 -109 Interest -bearing receivables and bank deposits as at December 31 1,819 1,569
receivables
Million NOK Ref. 2023 2022 Equity 31.12 (A) Statement of financial position 13,280 14,096 Total assets 31.12
Statement of financial position 60,096 57,529 Equity ratio as at December 31 (= A/B) 22.1% 24.5% 5.1 Performance measures and definitions
1.12 Total investments
Definition : Investments in intangible assets, investment properties and property, plant and equipment paid during the period according to the consolidated statement of cash flow.
‘Total investments’ is a measure of investments made in the operations in the relevant period and is considered useful in evaluating the capital intensity of the operations.
‘Total investments’ is the sum of the line items ‘Purchase of intangible assets’, ‘Purchase of investment properties’ and ‘Purchase of
and equipment’ (PPE) as recorded in the consolidated statement of cash flow.
Reconciliation of ‘Total investments’
197 196 Our responsibility Our business Corporate governance Financial statements Appendix Performance measures and definitions | Annual report 2023
property, plant
Total investments per segment Million NOK Ref. 2023 2022 REMA 1000 NO Note 6 682 709 REMA 1000 DK Note 6 420 216 Reitan Conv. Note 6 404 398 Uno-X Mobility Note 6 1,211 779 Real Estate Note 6 653 915 Other units/elim. Note 6 -327 25 Total investments Statement of cash flows 3,043 3,042 Total investments as recorded in the statement of cash flows Million NOK Ref. 2023 2022 Purchase of intangible assets Statement of cash flows 184 333 Purchase of investment properties Statement of cash flows 0 19 Purchase of PPE Statement of cash flows 2,859 2,690 Total investments Statement of cash flows 3,043 3,042 1.9 Operating profit Definition: Profit before net financial items and tax. Indicates profitability of operating activities. 1.10 Operating profit as a percentage of revenue Definition: Operating profit as a percentage of revenue for the period. This ratio is an important indicator of the Group’s operating efficiency. 1.10.1 Calculation of ‘operating profit as a percentage of revenue’ Million NOK Ref. 2023 2022 Operating profit (A) Profit or loss 3,087 3,597 Revenue (B) Profit or loss 104,322 94,367 Operating profit as a percentage of revenue (= A/B) 3.0% 3.8% 1.11 Operating profit as a percentage of systemwide sales Definition: Operating profit as a percentage of systemwide sales for the period. This ratio is an important indicator of the Group’s operating efficiency. 1.11.1 Calculation of ‘operating profit as a percentage of systemwide sales’ Million NOK Ref. 2023 2022 Operating profit (A) Profit or loss 3,087 3,597 Systemwide sales (B) Section 1.1 127,684 115,767 Operating profit as a percentage of systemwide sales (= A/B) 2.4% 3.1% 5.1 Performance measures and definitions
1.12.1
2. Definitions and non-financial performance measures
The specific definitions outlined below add context to our non-financial performance measures and other metrics used in this report.
2.1 Sales outlets
Definition: ‘Sales outlets’ includes all stores and mobility locations under the Group’s concepts and banners, whether operated by franchisees, Reitan Retail, dealers or commission-based retailers.
Commission operated sales outlets are also referred to as sales outlets under a franchise-light model. Sales outlets in Uno-X Mobility are also referred to as mobility locations.
2.2 Systemwide employees
Definition: ‘Systemwide employees’ includes all employees of Reitan Retail AS and its subsidiaries, as well as all people being employed or selfemployed in the sales outlets operated by independent third parties (e.g. franchisees) under the Group’s concepts and brands (e.g. pursuant to a franchise agreement).
Systemwide employees are also referred to as ‘people’.
199 198 Our responsibility Our business Corporate governance Financial statements Appendix
2023 REMA 1000 NO REMA 1000 DK Reitan Conv. Uno-X Mob. Other Reitan Retail Franchise-operated sales outlets 663 371 1,235 - - 2,269 Company operated sales outlets 11 1 327 587 1 927 Dealer and commission operated sales outlets - - 207 236 - 443 Sales outlets as at December 31 674 372 1,769 823 1 3,639 2022 REMA 1000 NO REMA 1000 DK Reitan Conv. Uno-X Mob. Other Reitan Retail Franchise-operated sales outlets 658 361 1,356 - - 2,375 Company operated sales outlets 10 2 386 546 1 945 Dealer and commission operated sales outlets - - 211 270 - 481 Sales outlets as at December 31 668 363 1,953 816 1 3,801
5.1 Performance measures and definitions
5.2 Transparency Act
In June, Reitan Retail reported on the Norwegian Transparency Act (the Act) for the first time since it came into force. The Act aims to help companies focus on respecting fundamental human rights and ensuring decent working conditions when making products and offering services. It also aims to make it easier for the public to learn how companies deal with issues that could harm these rights and conditions.
The Act imposes a duty to carry out due diligence assessments in line with the OECD’s Guidelines for Multinational Enterprises, a duty to publicly account for their due diligence, and a duty of information towards the public.
How Reitan Retail worked according to the Transparency Act in 2023
The Act applies to all companies in the Group, whether they are direct or indirect subsidiaries. We believe that conducting risk assessments and due diligence at the operational level provides the greatest benefits. In 2023 we expanded the application of the Act to our subsidiaries outside of Norway. This effort was supported by the process of providing a joint policy for responsible procurement. The policy focused on enhancing the understanding of supply chain risks and improving risk management. The Reitan Retail Policy on Responsible Procurement will be adopted by the Board of Directors and put into effect in 2024.
Qualitative and quantitative results from the due diligence under the Act, have in 2023 been reported to Reitan Retail together with mitigating actions. Overall risks assessments and the evolution of identified risks are fixed discussion points at board meetings in Reitan Retail AS, our four business areas REMA 1000 Norway, REMA 1000 Denmark, Reitan Convenience, Uno-X Mobility and their respective subsidiaries.
REMA 1000 Denmark identified three cases in which production sites did not meet their supplier requirements. Two were at existing production sites, and one was at a new production site. One non-compliance involved a producer in Bulgaria who submitted a certificate with numerous errors and deficiencies. A new audit date was promptly scheduled. The other two instances were in Thailand, where one production site transitioned from an Amfori BSCI score of B to D. A D-score is unacceptable, and a new audit was immediately ordered. Another producer in Thailand encountered issues with the employment of migrant workers, and upon awareness, prompt action was taken to rectify the problems, with a reaudit ordered.
Read more about our challenges and opportunities in the value chain in 2.5 Value chain or more details in Reitan Retail’s statement according to the Norwegian Transparency Act from 2022 at reitanretail.no. The full statement for 2023 will be published by June 30, 2024.
Supply chain risk assessment –fundamental human rights and decent work conditions
With operations in the sectors food, agriculture, fuel and mobility, our supply chains are global, complex, and exposed to climate change. Challenges linked to forced labour, child labour, corruption, freedom of association, discrimination, living wage and environmental destruction are significant in these sectors and with the expected consequences of climate change they are set to worsen in the years to come. In addition to the risk assessments performed on suppliers providing the goods we sell in our stores and for the fuel and energy suppliers in Uno-X Mobility, risk assessments for the products and services that are vital for our daily operations
In 2023, REMA 1000 Denmark has concentrated its attention on suppliers and production sites engaged in producing their privat e-labelled products. All business areas and their subsidiaries will continue to enhance their due diligence assessment processes and inc lude more suppliers and production facilities in the current year and beyond.
have been conducted, where certain categories have been identified with high and very high risk.
Food and non-food - The substantive part of our suppliers are connected to the goods we sell in our 2,800 discount grocery stores and convenience outlets. There is a high risk for violations of human rights in the raw material market. Especially in the supply chains of products such as tea, coffee, cocoa, cane sugar and tropical fruit, where child labour and forced labour is widespread and well-documented. There are also documented
cases of migrants working under slave-like working conditions for products produced in Europe. The agricultural sector, especially in developing countries, is characterised by informal labour. There are also health risks linked to the use of pesticides. Given this risk assessment, both raw materials and geographical production location are prioritised risk areas.
Fuel and biofuel - Human rights issues are central within the oil and gas industry. As a result, we trade goods mainly from large oil and gas suppliers located in Scandinavia having strict human
201 200 Our responsibility Our business Corporate governance Financial statements Appendix
5.2 Transparency Act
Case study
Annual Report 2023 Due diligence assessments of suppliers with emphasis on fundamental human rights and decent working conditions 2023 2022 REMA 1000 Norway REMA 1000 Denmark Reitan Conv. Uno-X Mob. Other Reitan Retail Reitan Retail % change Total number of suppliers during the year 4,382 1,801 3,242 2,874 332 12,631 7,052 79% Number of suppliers risk evaluated during the year 2,693 201 3,242 2,874 332 9,342 4,752 97% Number of suppliers with very high risk 168 - 217 - - 385 145 166% Number of suppliers with high risk 605 46 262 10 34 957 397 141% Number of suppliers with medium risk 536 - 503 60 59 1,158 674 72% Number of suppliers with low risk 1,384 155 2,260 2,804 239 6,842 3,536 93% Share of suppliers assessed during the year 61% 11% 100% 100% 100% 74% 67% 10% Share of assessed suppliers with very high risk 6% 0% 7% 0% 0% 4% 3% 35% Share of assessed suppliers with high risk 22% 23% 8% 0% 10% 10% 8% 23% Share of assessed suppliers with medium risk 20% 0% 16% 2% 18% 12% 14% -13% Share of assessed suppliers with low risk 51% 77% 70% 98% 72% 73% 74% -2% 2023 2022 Supplier categories for high or very high categories REMA 1000 Norway REMA 1000 Denmark Reitan Conv. Uno-X Mob. Other Reitan Retail Reitan Retail % change Food and non-food 205 46 257 - 1 509 205 148% Fixed assets 353 - 8 2 12 375 220 70% IT-hardware, software and services 105 - 204 - 5 314 53 492% Transportation 97 - - 1 1 99 33 200% Textiles 11 - 8 1 - 20 13 54% Packaging - - 2 - 5 7 7 0% Other 2 - - 6 10 18 11 64% Total suppliers with high or very high risk 773 46 479 10 34 1,342 542 148% Results from assessments of high or very high risk suppliers Suppliers with signed code of conduct (SCoC) 526 46 218 5 32 827 266 211% Supplier dialogue, self -assessment, etc. 638 46 - 2 30 716 634 13% Supplier dialogue through on -site visits 29 - - - - 29 65 -55% Uncovered non-compliance through assessments 2 75 - - - 77 2 3750% Assessments resulting in improved conditions 2 17 - - - 19 4 375% Ongoing process after assessments 1 2 - - - 3 2 50% Assessments resulting in contract termination 2 - - - - 2 - 100%
Duty to provide information 2023 2022 REMA 1000 Norway REMA 1000 Denmark Reitan Conv. Uno-X Mob. Other Reitan Retail Reitan Retail % change Number of requests 23 10 1 6 - 40 17 135% Number of replies within three weeks 22 10 1 6 - 39 17Number of replies within two months 1 - - - - 1 -Response rate 100% 100% 100% 100% - 100% 100%
Case study
Reitan Convenience’s continuous risk assessments, focusing on human rights and decent working conditions, as well as deforestation and CO2 emissions emphasise a significant risk associated with the tobacco supply chain. The majority of tobacco is cultivated in lowand middle-income countries where the demand for food production outweighs that for tobacco. Tobacco production takes place in countries such as China, Brazil, India, Indonesia, Malawi, Pakistan, Mozambique, and others, where substandard working conditions are common, leading to concerns about human rights violations. The tobacco industry plays a significant role in deforestation, carbon dioxide emissions, and excessive water usage, particularly in regions already experiencing water scarcity raising concerns about the well-being of the impacted communities.
rights policies and close monitoring of their supply chains. Biofuel on the other hand is prone to risk related to land use change.
Uno-X Mobility take a strong stance towards no soy and palm oil in their purchased products and acquire sustainability certificates from certified institutes on all purchases of biofuels, further verified by a third party in accordance with official requirements in Norway and Denmark in order to mitigate this potential risk.
Fixed assets – Building materials, inventory, office supplies etc. originate from all over the world. Due diligence assessments are carried out in the operational level of the organisation, where detailed knowledge and experience of the supply chain allow for qualified assessments. Within this category, solar panels are identified with very high risk. Solar panels are installed on several of our distribution and industry sites to reduce the carbon footprint of our operations, and additional locations have been screened for further rollout. Risks of forced labour and possible slavery of indigenous people in Xinjiang province in China has halted the rollout and intensified the due diligence assessment of the suppliers.
IT – hardware, software and services - All our points of sales, administration offices, distribution companies and industry companies are highly dependent on IT, technical solutions and electronics. The electronics market is experiencing high pressure, widespread use of subcontractors and environmental problems associated with the products. The mineral industry is part of the supply chain for IT products, where the main risks include unsafe working environment, use of forced and child labour, impact on local communities when developing new mining areas and financing of military/paramilitary groups.
Transportation – Growth in international trade has led to pressure in the transport and logistics sector. Global competition has led to lower wages and a high degree of informal work, especially in road transport. Workers in the sector are also exposed to a high HSE risk, related to long shifts, manual work and traffic accidents.
Textiles – The textile industry is highly concentrated in Asia. Uniforms are part of our day-to-day operations with main origin in Bangladesh, a country subject to poor working conditions, especially excessive use of overtime, unsatisfying safety and use of child labour.
Packaging – Most end-products require packaging. The production of plastic products involves the use of hazardous chemicals and risks related to the working environment. HSE risk is therefore high in the sector, especially in countries where the labour market is not regulated or regulated to a lesser extent. The cardboard and paper industry also involves the use of chemicals that can be harmful to workers in the production process.
Case study
REMA 1000 collaborates with approximately 350 suppliers, both domestically in Norway and Denmark, as well as internationally for our private label products. We have a particular duty to secure and oversee human rights and decent working conditions in the production of these products, which are connected to production facilities around the world, and in Norway and Denmark. Guidelines for due diligence assessments and responsible purchasing are implemented to secure responsible procurement.
Geographical locations identified with high risk:
• Bangladesh
• Brazil
• China
• Hungary
• India
• Indonesia
• Malaysia
• Maldives
• Morocco
• Pakistan
• Paraguay
• Philippines
• Sri Lanka
• Thailand
• Turkey
• Vietnam
Results
Duty to provide information
In 2023, REMA 1000 Denmark has concentrated its attention
products. All business areas and their subsidiaries will continue to enhance
and production facilities in the current year and beyond.
In 2023, we received 40 requests, all except one of which were promptly and clearly addressed within the three-week timeframe. The remaining request was resolved in February 2024. The requests have pertained to the country of origin of specific products, our stance on products from Israel, and how we carry out due diligence assessments in compliance with the Act.
In 2023, we received 40 requests, all except one of which were promptly and clearly addressed.
of requests
of replies within three weeks
Work going forward
Risk mapping and prioritisation are continuously performed in the due diligence process to cease, prevent and mitigate adverse impact on fundamental human rights and decent working conditions. In 2024, the work to fully integrate REMA 1000 Denmark and Ipart Aps in our Transparency Act reporting continues together with more granular reporting from the
international subsidiaries of Reitan Convenience. This will encompass suppliers essential for our daily operations, as well as providers of fixed assets. Additionally, environmental and climate risks, stakeholder engagement, health and animal welfare are equally important and included in our responsible procurement policy which will be adopted by the Board of Directors and put into effect in 2024. Strategic KPIs will be developed to measure performance on procurement according to the Reitan Retail sustainability strategy. When adopted, we will also implement the EU Due Diligence Directive.

203 202 Our responsibility Our business Corporate governance Financial statements Appendix
5.2 Transparency Act
Critical raw materials: • Palm oil • Soy • Scampi • Tuna fish • Cocoa • Coffee • Tea • Hazelnuts • Cashew nuts • Paper • Wood 22 Food and non-food 205 46 257 - 1 509 205 148% Fixed assets 353 - 8 2 12 375 220 70% IT-hardware, software and services 105 - 204 - 5 314 53 492% Transportation 97 - - 1 1 99 33 200% Textiles 11 - 8 1 - 20 13 54% Packaging - - 2 - 5 7 7 0% Other 2 - - 6 10 18 11 64% Total suppliers with high or very high risk 773 46 479 10 34 1,342 542 148%
from assessments of high or very high risk suppliers Suppliers with signed code of conduct (SCoC) 526 46 218 5 32 827 266 211% Supplier dialogue, self -assessment, etc. 638 46 - 2 30 716 634 13% Supplier dialogue through on -site visits 29 - - - - 29 65 -55% Uncovered
assessments 2 75 - - - 77 2 3750% Assessments resulting
improved conditions 2 17 - - - 19 4 375% Ongoing
1 2 - - - 3 2 50%
resulting in contract termination 2 - - - - 2 - 100%
non-compliance through
in
process after assessments
Assessments
on suppliers and production sites engaged in producing their privat e-labelled
assessment processes and inc lude more suppliers
2023 2022 REMA 1000 Norway REMA 1000 Denmark Reitan Conv. Uno-X Mob. Other Reitan Retail Reitan Retail % change Number
23 10 1 6 - 40 17 135% Number
22 10 1 6 - 39 17Number of replies within two months 1 - - - - 1 -Response rate 100% 100% 100% 100% - 100% 100%
their due diligence
Duty to provide information
5.3 EU Taxonomy
In 2020, EU presented the European green deal, an action plan to achieve carbon neutrality by 2050. The EU taxonomy, which is an important part of this action plan, is a classification system that sets out a list of environmentally sustainable economic activities, referred to as eligible activities.
The taxonomy aims to provide companies, investors, and policymakers with appropriate definitions for which economic activities can be considered environmentally sustainable. In this way, it should further create security for investors, protect private investors from greenwashing, help companies to become more climate-friendly, mitigate market fragmentation and help shift investments where they are most needed.
In Norway, the Sustainable Finance Act came into effect on January 1, 2023, with reporting due in 2024 for entities of public interest. Reitan Retail, being a Norwegian non-public interest entity, is not subject to the EU taxonomy and voluntarily reported on eligible activities last year. In June 2023, the EU published the Sustainable Finance package, detailing activities and associated screening criteria for the last four environmental objectives (WTR, CE, PPC, and BIO) and additional activities and associated screening criteria for the first two (CCM and CCA). Towards the end of 2023, the Norwegian Ministry of Finance announced that Norwegian companies are not obliged to include information about the new taxonomy activities in their reporting for the financial year 2023.
Reitan Retail is a retail company operating in the Nordic and Baltic regions, involved in discount grocery, convenience, and mobility sectors. Our activities related to the sale of fossil fuel products are inherently excluded from the Taxonomy, which aligns with the EU’s environmental and climate goals. Similarly, operations in the food and agriculture sector are not currently covered by the taxonomy as of December 2023, indicating that Reitan Retail’s primary activities fall outside the scope of the Taxonomy. Nonetheless, the assessment of eligible activities across all six environmental objectives highlights value chain activities within our operations.
EU taxonomy’s environmental objectives
• Climate change mitigation (CCM)
• Climate change adaptation (CCA)
• The sustainable use and protection of water and marine resources (WTR)
• The transition to a circular economy (CE)
• Pollution prevention and control (PPC)
• The protection and restoration of biodiversity and ecosystems (BIO)
In 2024, companies subject to the Corporate Sustainability Reporting Directive (CSRD) are required to report annually on the extent to which their economic activities are eligible under the Taxonomy and adhere to the criteria outlined in the Taxonomy delegated acts that define Taxonomy-aligned activities. Other companies not covered by the CSRD, such as Reitan Retail, have the option to voluntarily disclose this information.
Initial screening of eligible activities that will be further investigated in 2024
Reitan Retail will voluntarily commence the transition towards reporting under the CSRD and the European Sustainability Reporting Standards (ESRS) in 2024, incorporating Taxonomyeligible and aligned activities. This reporting will involve assessments to determine if the activities significantly contribute to an environmental objective without causing significant harm to other environmental targets. Moreover, the activities must adhere to minimum requirements for social and governance conditions, as outlined in the OECD’s guidelines for multinational companies, the UN’s guiding principles for business and human rights, and ILO conventions. CCM and CCA
4.1 Electricity generation using solar photovoltaic technology 4.2 Electricity generation using concentrated solar power (CSP) technology 4.9 Transmission and distribution of electricity 4.10 Storage of electricity 4.15 District heating/cooling distribution
Water supply, sewerage, waste management and remediation
5.2 Renewal of wastewater collection, treatment and supply systems
5.3 Construction, extension and operation of wastewater collection, treatment and supply systems
5.7 Anaerobic digestion of bio-waste Composting of bio-waste
6.6 Freight transport services by road
6.8 Inland freight water transport
Construction and real estate
7.1 Construction of new buildings
7.2 Renovation of existing buildings
7.7 Acquisition and ownership of buildings
Professional, scientific and technical activities 9.1 Close to market research, development and innovation
2.2 Urban wastewater treatment
Recovery of bio-waste by anaerobic digestion or composting
2.2 Treatment of wastewater
1.1 Conversation, including restoration, of habitats, ecosystems and species
205 204 Our responsibility Our business Corporate governance Financial statements Appendix
Energy
Transport
WTR
CE 2.4
2.5
PPC
BIO
Treatment of wastewater
5.3 EU Taxonomy
5.4 Greenhouse gas accounting
accounting scope 1 and 2 (GRI 305 -1 and 305-2)
base
is 21 percent. These figures account for restatements provided on page 209.
accounting scope 3 (GRI 305-3)
In 2023, emissions increased by 1.6 percent, driven by factors such as enhanced data completeness, more comprehensive factor calculations including FLAG emissions (Forest, Land and Agriculture) for high -risk commodities, and an uptick in total unit sales. For a more comprehensive understanding of the organisational boundaries, reporting principles, and methodologies, refer to pages 208 -220. Emissions related to Indirect Land Use Change (ILUC) are accounted for in Uno -X Mobility under Category 1 purchased goods and services. By definition, the GHG -protocol does not define this activity as relevant to report on in the carbon accounting. However , Norwegian and Danish legislation mandates the calculation of these emissions using standardised emission factors from the EU Directive.
In the category Business Travel, 308 tCO 2e of emissions are associated with the use of private airplanes. This accounts for 9 percent of the total emissions from business travel and 0.003 percent of the total scope 3 emissions in Reitan Retail.
GHG emissions data is verified by DNV Business Assurance Norway AS. Verification statement on page 222.
REMA 1000 Denmark owns 49 percent of the shares in Gram Slot, Denmark's largest organic farm. Our share of Gram Slot's emissi ons is presented under REMA 1000 Denmark. REMA 1000 Norway has 20 percent ownership in Bama Gruppen. Emissions related to Bama Gruppen are not disclosed due to confidentiality constraints.
Scope 3 break down of category 1 - Purchased goods and services
A detailed analysis and comprehension
reduce emissions. The table presents categories ranked from
comprehensive list of categories offers valuable insights and will be actively utilised
and
2 Norsk Kylling and Stanges Gårdsprodukter, subsidiaries of REMA 1000 Norway, are the main providers of white meat in REMA 1000 's systemwide stores in Norway. According to GHG Protocol, tCO 2e from these subsidiaries are accounted for in scope 1 and 2 in their respective carbon accountings. As subsidiaries, their emissions, across all scopes are accounted for in accordance with the operational control methodology defined by the protocol. Production of their products are excluded from the calculation of REMA 10 00 Norway’s product assortment to avoid double counting, which provides reasoning for the significantly lower emissions presented for REMA 1000 Norway compared to REMA 1000 Denmark in the food category white meat above. The 6,848 tCO 2e mentioned for REMA 1000 Norway refers to third -party white meat products. Therefore, the emissions from Norsk Kylling and Stanges Gårdsprodukter need to be included with the emissions from the third -party products to accurately reflect the total emissions from the sale of whi te meat products.
207 206 Our responsibility Our business Corporate governance Financial statements Appendix
2023 2022 REMA 1000 Norway REMA 1000 Denmark Reitan Conv. Uno-X Mob. Other Reitan Retail Reitan Retail % change Refrigerants tCO2e 815 357 3,272 - - 4,444 7,078 -37% Transportation tCO2e 4,711 1,657 678 554 1 7,601 7,712 -1% Stationary combustion tCO2e 1,807 745 3,918 - - 6,470 3,694 75% Total scope 1 tCO2e 7,333 2,759 7,868 554 1 18,515 18,484 0% Electricity (location based) tCO2e 1,793 11,923 8,974 629 2 23,321 26,602 -12% District heating/cooling tCO2e 172 810 718 1 - 1,701 2,177 -22% Total scope 2 tCO2e 1,965 12,733 9,692 630 2 25,022 28,779 -13% Total scope 1 and 2 tCO2e 9,298 15,492 17,560 1,184 3 43,537 47,263 -8% Electricity (market based) tCO2e 145,255 41,531 53,348 2,120 147 242,401 203,231 19%
total emissions of 55,148
2e. In 2020, scope 1 emissions were 19,993 tCO 2e,
in emissions
2023
2022
8 percent
the reduction compared to the
2023 2022 REMA 1000 Norway REMA 1000 Denmark Reitan Conv. Uno-X Mob. Other Reitan Retail Reitan Retail % change Purchased Goods and Services tCO2e 1,838,669 1,399,426 157,786 1,290,052 2,331 4,688,264 4,482,447 5% Capital Goods tCO2e 19,075 7,769 6,797 4,867 946 39,454 31,382 26% Fuel-and-energy related activities tCO2e 3,089 5,933 4,503 275 2 13,802 8,259 67% Upstream transportation and distribution tCO2e 55,197 72,894 50,385 6,367 12 184,855 126,118 47% Waste tCO2e 4,253 4,143 6,557 586 45 15,584 15,325 2% Business Travel tCO2e 1,057 173 458 1,233 389 3,310 3,838 -14% Employee Commuting tCO2e 4,102 8,760 10,102 128 13 23,105 11,426 102% Upstream Leased Assets tCO2e 10,012 - - - - 10,012 12,344 -19% Downstream transportation and distribution tCO2e 417 - 114 - - 531 9,487 -94% Use of sold products tCO2e 1,495 2,755 1,039 3,865,324 - 3,870,613 4,002,536 -3% End-of-life treatment of sold products tCO2e 2,831 967 1,023 19 - 4,840 11,460 -58% Downstream leased assets tCO2e - 529 - - - 529 826 -36% Investments 1 tCO2e - 5,288 - - - 5,288 4,813 10% Total scope 3 tCO2e 1,940,197 1,508,637 238,764 5,168,851 3,738 8,860,187 8,720,261 2% Total scope 1, 2 and 3 tCO2e 1,949,495 1,524,129 256,324 5,170,035 3,741 8,903,724 8,767,524 1.6 %
GHG
The base year for calculating scope 1 and 2 emissions is 2020, with
tCO
and scope 2 emissions were 35,155 tCO2e. The reduction
in
compared to
is
while
year
GHG
1
of scope
within the purchased goods and services category are crucial for o ur ongoing efforts to
highest to
based on emissions
grouped as edible and no n-food. This
in our companies as we progress towar ds achieving net-zero emissions throughout
entire value chain. 2023 2022 Food and non-food categories ranged by size of emissions REMA 1000 Norway REMA 1000 Denmark Reitan Conv. Uno-X Mob. Other Reitan Retail Reitan Retail % change Processed meat 1 tCO2e 460,071 128,058 28,108 - 428 616,665 649,717 -5% Red meat tCO2e 226,428 356,767 57 - 214 583,466 503,805 16% Dairy products tCO2e 292,979 241,848 5,690 - 291 540,808 611,988 -12% Confectionary and snacks tCO2e 122,065 50,552 9,571 - 119 182,307 120,882 51% Fruit, vegetables & berries tCO2e 80,571 70,536 2,208 - 80 153,395 181,985 -16% Alcohol tCO2e 44,658 69,680 8,049 - 42 122,429 110,352 11% Fish & seafood tCO2e 81,369 35,758 104 - 81 117,312 153,979 -24% White meat 2 tCO2e 6,848 44,390 47 - 5 51,290 43,040 19% Soda & energy drinks tCO2e 21,031 16,303 12,800 - 19 50,153 41,378 21% Processed vegetarian tCO2e 11,664 6,994 2,954 - 11 21,623 23,253 -7% Vegetarian tCO2e 1,516 4,221 - - 1 5,738 6,471 -11% Other food categories tCO2e 355,997 236,593 34,837 - 435 627,862 538,443 17% Total food categories tCO2e 1,705,197 1,261,700 104,425 - 1,726 3,073,048 2,985,293 3% Fossil fuel tCO2e 819 165 132 1,153,746 - 1,154,862 1,169,503 -1% Biofuel tCO2e - - - 90,522 - 90,522 78,044 16% Packaging tCO2e 36,900 3,338 1,759 2,234 - 44,231 50,326 -12% Tobacco products tCO2e 7,294 5,533 24,153 - 5 36,985 44,783 -17% Press tCO2e - 394 5,770 - - 6,164 4,482 38% EV charging tCO2e - - - 73 - 73 4 1725% Other non-food categories tCO2e 88,459 128,298 21,547 43,478 603 282,385 150,012 88% Total non-food categories tCO2e 133,472 137,728 53,361 1,290,053 608 1,615,222 1,497,154 8% Total purchased good and services tCO2e 1,838,669 1,399,428 157,786 1,290,053 2,334 4,688,270 4,482,447 5% 2023 2022 1 Breakdown of processed meat REMA 1000 Norway REMA 1000 Denmark Reitan Conv. Uno-X Mob. Other Reitan Retail Reitan Retail % change Processed red meat tCO2e 403,568 72,774 3,331 - 372 480,045 522,293 -8% Processed white meat tCO2e 7,070 16,472 9,079 - 7 32,628 22,711 44% Processed fish and seafood tCO2e 49,433 38,813 997 - 49 89,292 96,045 -7% Type of protein unavailable tCO2e - - 14,701 - - 14,701 8,668 70% Processed meat tCO2e 460,071 128,059 28,108 - 428 616,666 649,717 -5%
3 emissions
lowest
the
Emissions from sale of white meat 1 REMA 1000 Norway Share Norsk Kylling tCO2e 70,715 83% Stange
tCO2e 11,192 13% Emissions
tCO2e -3,092 -4% Third
tCO2e 6,848
White meat
1000 Norway tCO2e 85,663 100%
Gårdsprodukter
- not white meat production
party white meat suppliers
8%
in REMA
5.4 Carbon accounting
Greenhouse gas (GHG) accounting methodology
Reitan Retail applies greenhouse gas (GHG) inventory accounting principles throughout its reporting methodology consistent with the GHG Protocol Corporate Accounting and Reporting Standard (GHG Protocol). The GHG Protocol was developed by the World Resources Institute (WRI) and World Business Council for Sustainable Development (WBCSD). In alignment with the GHG Protocol, Reitan Retail takes into consideration the gases CO2, CH4, N2O HFCs, PFCs, SF6 and NF3 when converting reported data to tonnes CO2-equivalents (tCO2e). The Global Warming Potential (GWP) factors used in the conversion of non-CO2 greenhouse gases into CO2e are based on the fourth, fifth and sixth assessment report (Assessment Report; AR4, AR5 and AR6) over a 100-year period from the Intergovernmental Panel on Climate Change (IPCC). The GWP source for each emission factor has been determined based on the recommendation of the original source of the factor, if available, and accessibility of updated and comparable data. Reitan Retail uses CEMAsys.com to map and calculate all emissions for all business areas, using the same methodology approach.
Organisational and operational boundary
In Reitan Retail, we have operational control over four the business areas: REMA 1000 Norway, REMA 1000 Denmark, Reitan Convenience and Uno-X Mobility, with locations in seven countries across the Nordics and Baltics. Within each of our four business areas, Reitan Retail reports on all subsidiaries. The inclusion of the ALDI acquisition in the GHG accounting will commence in 2024, with the estimation of historical data back to the base year of 2022.
Scope 1
Includes all direct emission sources from owned and leased assets, as well as our from franchise operated stores. This includes emissions from transportation and stationary combustion, such as leased company cars and owned trucks, as well as refrigerants in our stores, distribution centres and trucks.
Scope 2
Accounts for GHG emissions from the generation of purchased electricity consumed by all facilities in Reitan Retail. Consistent with the scope 2 guidance from the GHG Protocol, both location-based method and market-based method are reported in our GHG accounting. Primarily, Reitan Retail uses the location-based method when calculating the emissions from scope 2 with country-specific emissions factors from International Energy Agency (IEA). The only exception to this is electricity purchased in Denmark, where the Department of Energy have published their own recommendation for calculating emissions per kwh that we follow to ensure alignment with local authorities’ recommendations.
Still, Guarantees of Origin (GoOs) or Renewable Energy Certificates (RECs) have been purchased in the reporting year for parts of our operations, and are included in the market-based calculation. One of these entities is Gladengen Drift AS (main office), where the consumption of electricity is divided to the different business units in accordance with the number of employees. The market-based emissions are calculated based on the country specific factors from Association of Issuing Bodies (AIB).
The calculation of scope 1 and 2 are assessed as complete and is not expected to change significantly in the forthcoming years. Emissions from Scope 1 and 2 are calculated based on the described methodology for all business areas.
Scope 3
Entails emissions from Reitan Retails value chain. Each business area has conducted a scope 3 screening to define which relevant categories to report on. Just like last year’s reporting, we have calculated all relevant emissions for the current reporting year. Nonetheless, there are still some discrepancies to resolve, and improvements needed in data quality and detail as we move forward. .See table below for an overview of scope 3 calculations and further description of each business area. We expect minor changes in scope 3 calculations in the forthcoming years. The relevance of each category is revised in our annual reporting. Upon changes in our operations, relevant categories and related emissions will be reassessed and accounted for accordingly.
Purchased Goods and Services Relevant, assessed as complete Relevant, assessed as complete Relevant, assessed as complete Relevant, assessed as complete Relevant, assessed as complete
Capital Goods Relevant, assessed as partially complete Relevant, assessed as complete Relevant, assessed as complete Relevant, assessed as partially complete Relevant, assessed as complete
Fuel-and-energy related activities Relevant, assessed as complete Relevant, assessed as complete Relevant, assessed as complete Relevant, assessed as complete Relevant, assessed as complete
Upstream transportation and distribution Relevant, assessed as complete Relevant, assessed as complete Relevant, assessed as complete Relevant, assessed as partially completed Relevant, assessed as complete
Waste Relevant, assessed as complete Relevant, assessed as complete Relevant, assessed as complete Relevant, assessed as partially completed Relevant, assessed as complete
Business Travel Relevant, assessed as complete Relevant, assessed as complete Relevant, assessed as complete Relevant, assessed as completed Relevant, assessed as complete
Employee Commuting Relevant, assessed as complete Relevant, assessed as complete Relevant, assessed as complete Relevant, assessed as complete Relevant, assessed as complete
Upstream Leased Assets Relevant, assessed as complete* Not applicable Not applicable Not applicable Not applicable
Downstream transportation and distribution Relevant, assessed as complete Not applicable Relevant, assessed as partially complete Not applicable Not applicable
Processing of sold products Not applicable Not applicable Not applicable Not applicable Not applicable
Use of sold products Relevant, assessed as complete Relevant, assessed as partially complete Relevant, assessed as partially complete Relevant, assessed as complete Relevant, assessed as complete
End-of-life treatment of sold products Relevant, assessed as complete Relevant, assessed as partially complete Relevant, assessed as complete Relevant, not calculat-ed Relevant, accounted for elsewhere
Downstream leased assets Not applicable Relevant, assessed as complete Not applicable Not applicable Not applicable
Franchises Included in scope 1 and 2 Included in scope 1 and 2 Included in scope 1 and 2 Not applicable Included in scope 1 and 2
Investments Relevant, assessed as complete** Relevant, assessed as complete Not applicable Not applicable Not applicable
* Norsk Kylling accounts for emissions from the breeding of their chickens. Upstream leased assets in REMA 1000 Norway’s records cover scope 1 and 2 emissions from these farms, even though the farms are not owned by the company.
** REMA 1000 Norway holds a 20 percent ownership stake in Bama Gruppen AS. These emissions are not publicly disclosed due to confidentiality constraints but are included in our internal greenhouse gas accounting overview.
Restatements of information
As our sustainability reporting matures, our greenhouse gas (GHG) accounting also develops. With increased understanding and data quality the carbon accounting has experienced smaller changes compared to the GHG accounting disclosed in our 2022 Annual and sustainability report. In the following, we will summarize any key changes made to the organisation and key changes in the GHG accounting.
REMA 1000 Norway - No reinstatements of information have been made for REMA 1000 Norway.
REMA 1000 Denmark - No reinstatements of information have been made for REMA 1000 Denmark.
Reitan Convenience - No reinstatements of information have been made for Reitan Convenience.
Uno-X Mobility - Uno-X Mobility has undertaken structural changes since the last reporting period where the YX brand has been incorporated under the Uno-X brand. The company’s GHG accounting has therefore been restructured. Further restatements include changes in emission factors for petrol and diesel from using DEFRA emissions factors to factors from EU Directive Renewable Energy Directive (RED). This change resulted in a 2.5 percent increase in the total Scope 1, 2, and 3 2022 emissions, while leading to a 1.5 percent increase for Reitan Retail.
A small correction of category 6, business travel, was conducted for the 2022 GHG accounting during the reporting for 2023. This correction was not significant to Uno-X Mobility’s 2022 emissions. Lastly, a small correction in category 3, fuels-and-energy related activities, was conducted for the 2022 reporting. This correction did not lead to significant changes in the company’s emissions.
Other - No reinstatements of information have been made for Reitan Retail AS, Gladengen Drift AS or Innom, grouped as Other.
209 208 Our responsibility Our business Corporate governance Financial statements Appendix
Scope 3 Category REMA 1000 NO REMA 1000 DK Reitan Convenience Uno-X Mobility Reitan Retail Other
5.4 Greenhouse gas accounting
Detailed methodology for our business areas
REMA 1000 Norway
The GHG accounting for REMA 1000 Norway covers their 674 stores, administrative offices, REMA Distribusjon with seven distribution centers across Norway, Kolly, and six industry subsidiaries: Norsk Kylling, Stanges Gårdsprodukter, Grans Bryggeri, Kjeldsberg Kaffebrenneri, Kolonihagen, and Spekeloftet. During our base year of 2022, we assessed our scope 3 emissions and identified that 12 out of the 15 categories were material for reporting. These 12 categories remain relevant and are reported on accordingly.
The GHG accounting for REMA 1000 Norway is not expected to change significantly in the upcoming years, as most of the scope 3 emissions have already been evaluated. However, the inclusion of FLAG-related emissions, which consist of newly discovered data not previously accounted for, may impact the reporting and emission data. This was evident in the reporting year for our chocolate and coffee commodities, where there was a notable increase in emissions compared to previous years. Moving forward, REMA 1000 Norway will maintain its focus on enhancing data quality and specificity across scope 3 categories, particularly in areas such as product range, packaging, raw materials, and transportation. A key priority is obtaining Life Cycle Assessments (LCAs) from suppliers for their products to enhance specificity.
Scope 1
REMA 1000 Norway includes all emissions from their operations, including fossil fuels from company cars and trucks, stationary combustion, and consumption of refrigerants. Refrigerants are reported based on refill of the refrigerant at systemwide stores, distribution centres and operations within the industry subsidiaries. REMA 1000 Norway utilise diesel generators to run the cooling systems in company-owned trucks. In the reporting year, the supplier has provided data for the total amount of refrigerant in the company-owned trucks. This indicates that REMA 1000 Norway has addressed the reporting discrepancy from previous reports.
Scope 2
This scope covers the electricity usage of the 674 stores. During the reporting period, Kolonihagen has purchased GoOs for 2 percent of its electricity consumption. Additionally, REMA 1000 Norway is responsible for 58 percent of the electricity consumption at the headquarters, where GOOs were also purchased during the reporting year.
Scope 3
Category 1 – Purchased goods and services
In the reporting year, REMA 1000 Norway has calculated the emissions from their sold products. The scope includes 95 percent of their product range, whereas 5 percent of the sold products is accounted for in the GHG accounting for in their industry subsidiaries. The inclusion rata is a slight decrease of 1 %-point compared to 2022. The remaining 5 percent had to be excluded due to 1) the product fell outside our defined core products: food, drinks and groceries, or 2) data on the product was lacking, either on the product side (weight/ composition) or due to lacking emissions data on the type of product (emission factor, LCA, or similar).
The emissions calculations are derived from activity data through the item list, providing an overview of the sales of each unique product. For the greater share of the products an emission factor that suits the type of product has been applied. Where this was not possible, an emission factor representing the main ingredient based on the ingredient list was applied to the product. Where relevant, average emission factors were used. The GHG accounting also encompasses products acquired by REMA 1000 Norway for consumer use in stores, including items like plastic bags for fruits and vegetables and bags for baked goods.
As for Kolly, 98 percent of their products based on revenue is included. To avoid double counting, products sold and distributed to Reitan Convenience Norway are excluded from Kolly’s reporting in line with current practices in Reitan Convenience’s GHG accounting.
In order to complete the GHG accounting, REMA Industri, REMA 1000’s six industry subsidiaries: Norsk Kylling, Stanges Gårdsprodukter, Grans Bryggeri, Kjeldsberg Kaffebrenneri, Kolonihagen, and Spekeloftet account for the production of goods separately from the stores and distribution. This means that raw materials for production, such as the feed utilised in the production of white meat, malt to produce beer and coffee beans for the burning of coffee, are accounted for in this category. The same goes for the packaging materials utilised for the produced assortment. As a result, a detailed cradle-to-gate reporting is conducted for the assortment produced by our subsidiaries.
Finally, other purchased goods and services for the administration and franchisees have been included using a spend-based calculation approach. This covers purchases related to office operations such as office suppliers, marketing materials and other professional services. Legal and consulting services have been excluded from our carbon accounting on the grounds that such services are primarily conducted at a desk and thus result in very low emissions, while the costs associated with such services generally are quite
high. As we currently do not have the possibility of including these services using activity data, the calculations would be subject to significant discrepancies, as the costs for such services would not reflect the actual emissions of the same services. Although legal and consulting services can be material from a financial point of view, we have deemed these services immaterial to our GHG reporting.
Category 2 – Capital goods
As a policy, capital goods are calculated based on the spend-based approach until suppliers can accommodate emissions for the purchased goods. Capital goods comprise office furniture, main office maintenance and refurbishments, as well as store renovations and capital goods acquisitions. A part of Norsk Kylling has relocated to a new hatchery. The construction of the building was carried out by RELOG, a subsidiary of Reitan Eiendom, and is leased to Norsk Kylling, along with Kolly’s new refrigerated storage facility. Consequently, it is determined that the emissions from these capital assets will not be accounted for in REMA 1000 Norway’s reporting, as per the consolidation method relying on operational control, but rather in the sister company of Reitan Retail, Reitan Eiendom. The category is assessed as partially completed as newly purchased trucks in REMA Distribusjon were not included in the reporting year due to insufficient data.
Category 3 – Fuel-and-energy related activities
This category is calculated on activity data from our Scope 1 and 2 consumption and includes all upstream emissions of the emission sources in these two scopes.
Category 4 – Upstream transportation and distribution REMA 1000 Norway’s upstream transportation is divided into four categories. First is the transportation between our distribution centres and systemwide stores and/or business-clients, which is based on information from our truckers. The truckers’ trucks run on either diesel, biogas, or electricity. Second, the transportation between the supplier’s storage (tier 1) and the distribution centres conducted by third-party trucks, rail freight and sea cargo. This is reported and calculated using activity data reported by REMA Distribusjon. To ensure a complete GHG accounting, an additional 10 percent of the assortment is accounted for based on an average Nordic-distance and the total weight of the product (tonnes-kilometre). The percentage used to calculate these emissions is provided by REMA Distribusjon, to avoid double counting of the transportation between tier 1 and distribution centres. Third, is the transportation of our goods by suppliers directly to our systemwide stores, which for the reporting year was five suppliers. These data are provided by the suppliers, who report fuel consumed, or tonness-kilometres driven to deliver REMA 1000 Norway’s goods to the stores. Lastly, upstream transportation is reported separately for each subsidiary according to their purchased goods.
REMA 1000 Norway does not report on refrigerants refilled on third-party trucks. When retrieving emission calculation from suppliers, we assume that the supplier has accounted for and reported relevant refills, in line with best practices. The company will in the forthcoming years analyse the scope of these emissions and report accordingly if new information is retrieved. The incorporation of these emissions is not anticipated to have a substantial impact on the overall transportation emissions of REMA 1000 Norway. Following best practices, upstream or WTT emissions for transportation are considered in the assessment of this category. Consequently, the emissions represent the complete value chain emissions, encompassing well-to-wheel (WTW) emissions.
Category 5 – Waste
Based on reports from suppliers, waste has been calculated using activity data, where emissions have been calculated according to its treatment method where information on the treatment method has been available. In the reporting year, data on wastewater has at large not been reported. Wastewater was for the first time included in the 2022 reporting which means that routines on data collection still has room for improvement. Due to the nature of REMA 1000 Norway’s operations, it is not expected that wastewater will change the calculated emissions significantly.
Category 6 – Business travels
Emissions from business travels are based on reports from third party travel agents or directly reported emissions from private plane providers. Trips booked outside of these agents and providers are accounted for through a spend-based approach. For emissions related to travels by our franchises, a spend-based method is employed due to the limited granularity in their activity data. Otherwise, all calculations are made on activity-based data. Consistent with the transportation calculation methodology, the emissions represent the complete value chain emissions, covering WTW emissions.
Category 7 – Employee commuting
Employee commuting is estimated using Statens Vegvesens Reisevaneundersøkelse 2022 as the basis for calculation. The calculation considers the number of employees, personnel in systemwide stores, working days, and the fraction of positions to determine their commuting emissions. To estimate emissions for administrative employees and Kolly, statistics for Oslo and Akershus are used as a foundation for the calculation. Among REMA 1000 Norway units, only the administration considers home office days. Consistent with transportation calculation methodology, the emissions represent the complete value chain emissions, encompassing WTW emissions.
211 210 Our responsibility Our business Corporate governance Financial statements Appendix
5.4 Greenhouse gas accounting
Category 8 – Upstream leased assets
In line with previous years, Norsk Kylling collected and reported information related to scope 1 and 2 emissions from the farming of chicken, as well as emissions linked to manure production. As the farms are not owned nor under the operational control of Norsk Kylling, these emissions are accounted for under scope 3, category 8, upstream leased assets. The calculation of emissions from manure contributes to the future ambition to set a FLAG-target in line with the latest guideline for land, forest, and agriculture.
Category 9 - Downstream transportation and distribution
In line with the GHG Protocol, category 9, downstream transportation and distribution, is accounted for based on transportation from downstream activities, if the undertaking does not pay for the transportation. In the reporting year, four of REMA 1000’s subsidiaries reported activities from downstream transportation and distribution services. These services are connected to home deliveries or transportation of biproducts purchased by third parties.
While customer travel to and from our stores can be considered relevant, REMA 1000 Norway currently does not calculate these emissions due to data limitations and the complexity of measuring them. However, we’re committed to promoting sustainable customer journeys. We’ve partnered with Uno-X Mobility to install ultrafast EV chargers at our stores, facilitating the transition to electric vehicles. Furthermore, our focus on convenient store locations can indirectly encourage walking, cycling, or public transport use. We’ll continue exploring solutions to nudge customers towards sustainable travel options.
Category 11 – Use-of-sold products
This category is based on activity data from our items list and covers sold products that include butane (e.g. lighters). Additionally, Norsk Kylling accounts for the utilisation of CO2, as the liquid gas serves as a food safety measure to prevent food depravity. This means that the gas has no direct emission during production, but during the use-phase.
Category 12 – End-of-life treatment of sold products
Emissions related to the end-of-life treatment of sold products are estimated based on REMA 1000 Norway’s 2022 market share and national statistics on household waste (2020), due to lack of updated information. In addition, the end-of-life treatment of packaging materials purchased by the company and products that are purchased for the consumers’ use in stores, for instance plastic bags for self-mix candy, fruit and vegetables, and bread, has also been included using activity data.
REMA 1000 Denmark
The GHG accounting for REMA 1000 Denmark covers their 372 stores, distribution centres, the administration, the subsidiary REMA 1000 med Vigo, the webstore REMA.dk, and the ownership share of 49 percent of Gram Slot. The inclusion of the ALDI acquisition in the GHG accounting will commence in 2024, with the estimation of historical data back to the base year of 2022.
In 2022, scope 3 emissions assessment concluded that 12 of 15 scope 3 categories were relevant to REMA 1000 Danmark. 11 of these categories were included in the 2022 reporting. In 2023, the remaining category, category 2 capital goods, has been included to complete scope 3 inventory. One of the categories included in 2022 emissions, category 9 downstream transportation and distribution, has since been revised, concluding that the emission source in this category should instead be reported under category 4, upstream transportation and distribution. This means that in the 2023 reassessment of relevant Scope 3 categories, 11 of 15 categories were determined as relevant and all these categories were included in the report.
In 2023, there was a strong focus on enhancing the quality of emissions data. The improvement efforts involved evaluating the calculation method for employee commuting and striving to enhance the quality of transportation data provided by suppliers who deliver goods directly from own distribution centres to the systemwide stores. Furthermore, a comprehensive item list mapping has been conducted, incorporating a wider range of available emission factors, and implementing rigorous quality control measures for the mapped goods. With these enhancements and adjustments, the GHG accounting report is deemed complete.
Scope 1
REMA 1000 Denmark includes all direct emissions from their operations, including consumption of fossil fuels in the car fleet and other vehicles owned by REMA 1000 Danmark, stationary heating, and the emission of refrigerants. The emissions in scope 1 cover the administration, distribution centres, systemwide stores, and subsidiaries. Scope 1 is largely calculated using activity data, with only a few exceptions, where the use of estimations was necessary to calculate our consumption.
The emission of refrigerants is based on invoices from stores and the distribution centres that had their refrigerant units refilled with gas in the reporting year. Until 2022, emissions from REMA 1000 Danmark’s refrigerated trailers was included in our scope 1 emissions. The refrigerated trailers utilise CO2 for cooling, or Cryo Technology. However, the CO2 from the trailers is a by-product from ammonia
production at a third-party company. The third-party accounts for the emitted CO2 and are charged a fee for this emission, meaning that the CO2 is already accounted for in their Scope 1 emissions. As double reporting in Scope 1 is discouraged by the GHG Protocol, this emissions source has since been excluded from our GHG accounting. The upstream emissions from the transportation of the CO2 are included in our scope 3 inventory, as a part of category 1, purchased goods and services.
Cars and other fossil fuel driven vehicles’ fuel consumption is collected through reports from our fuel suppliers. Natural gas and burning oil consumption has decreased, as alternatives such as district heating and waste heating are increasingly being taken into use. Both of which is calculated using activity data.
Scope 2
Scope 2 includes emissions in relation to the consumption of electricity and district heating in 372 stores, the administration, the distribution centres, and subsidiaries. Calculations rely on activity data from meters or information supplied by utility companies.
Scope 3
In 2023, there was a specific focus on incorporating Capital goods into our carbon accounting. Although the category was deemed relevant in our carbon inventory in 2022, it could not be included in the 2022 carbon accounting report. Additionally, this year, emissions from the transportation of goods via REMA 1000 med Vigo are classified under Upstream transportation and distribution instead of Downstream transportation and distribution as in 2022. The 11 Scope 3 categories included in the 2023 GHG accounting represent our total value chain emissions. Below is a comprehensive overview of all relevant Scope 3 categories along with the calculation method.
Category 1 - Purchased goods and services
In 2023, around 96 percent of the items list has been mapped. The remaining 4 percent had to be excluded due to 1) the product fell outside our defined core products: food, drinks and groceries or 2) data on the product was lacking, either on the product side (weight/ composition) or due to lacking emissions data on the type of product (emission factor, life cycle assessment, or similar). The emissions calculations are derived from activity data through the item list, providing an overview of the sales of each unique product. For the greater share of the products an emission factor that suits the type of product has been applied. Where this was not possible, an emission factor representing the main ingredient based on the ingredient list was applied to the product. Where relevant, average emission factors were used. The GHG accounting also encompasses products acquired by REMA 1000 Denmark for consumer use in stores, including items like plastic bags for fruits and vegetables and bags for baked goods.
Finally, other purchased goods and services for the administration and franchisees have been included using a spend-based calculation approach. This covers purchases related to office operations such as office suppliers, marketing materials and other professional services. Legal and consulting services have been excluded from our carbon accounting on the grounds that such services are primarily conducted at a desk and thus result in very low emissions, while the costs associated with such services generally are quite high. As we currently do not have the possibility of including these services using activity data, the calculations would be subject to significant discrepancies, as the costs for such services would not reflect the actual emissions of the same services. Although legal and consulting services can be material from a financial point of view, we have deemed these services immaterial to our GHG reporting.
Category 2 - Capital goods
This category is included in our carbon accounting for the first time and includes emissions from construction projects at our administrative buildings and distribution centres as well as smaller renovation projects in the stores that are financed by REMA 100 Denmark. In addition, purchases of larger electrical equipment in the stores, mainly refrigerating units, has been included in the category.
This category is calculated on spend-based data. In the coming years, we plan to develop the precision in this category, as we assess spend-based emission factors to be deficient. Spend-based emission factors are not necessarily able to consider macroeconomic factors such as inflation as well as variation in prices between products that are similar from an emission perspective.
Category 3 – Fuel-and-energy related activities
This category is calculated on activity data from our Scope 1 and 2 consumption and includes all upstream emissions of the emission sources in these two scopes.
Category 4 - Upstream transportation and distribution
Our upstream transportation is divided into four categories. First is the transportation between our distribution centres and stores, which is based on information from our truckers. The truckers’ trucks run on either diesel, biogas, or electricity. Second is the transportation of our goods by suppliers directly between their distribution centres and our stores, which includes goods that are not first transported to REMA 1000 Danmark’s own distribution centres. These data are provided by the suppliers, who have been asked to provide data in the form of an emissions report, fuel consumed, or tonnes-kilometres driven to deliver REMA 1000 Danmark goods to
213 212 Our responsibility Our business Corporate governance Financial statements Appendix
5.4 Greenhouse gas accounting
the stores by the suppliers. Third, the transportation between suppliers and our distribution centres calculated for each unique product is based on the distance between the individual supplier and the relevant REMA 1000 distribution centre and the total weight of the product. Lastly, the transportation of purchased goods through REMA med Vigo’s services is categorized as upstream transportation this year, unlike in 2022 when it was classified as downstream transportation. This change follows a reassessment of the two categories, revealing that REMA reimburses transportation carried out by REMA 1000 Danmark’s customers on behalf of other clients through the REMA med Vigo app. As a result, the emissions from the transportation of these goods should be considered an upstream transportation in accordance with the GHG Protocol’s guidance.
Our upstream transportation and distribution emissions are calculated using the hybrid method, where both activity-based data and estimates are used in calculation emissions. According to best practices, upstream or WTT emissions for transportation is included in the calculation of this category. As a result, the emissions reflect entire value chain emissions, WTW.
Category 5 - Waste
Emissions from waste are also calculated using the hybrid method. Our waste data is derived from activity data provided by our waste management suppliers in the distribution centers and systemwide stores. Around 43 percent of the stores needed to estimate their waste data based on their 2022 data, as they were unable to collect data for 2023 in time for the reporting. For two smaller office locations in Greve and in Copenhagen, we have estimated the waste totals based on average waste data for office employees.
In addition, waste from packaging from the distribution centres has been included with the assumption that there is a 1:1 relationship between the amount of packaging purchased over the year and the amount of packaging waste produced in the same year.
Category 6 - Business travels
Emissions from business travels are based on company-specific data, extracted from our accounting systems, and includes the administration, franchisees, and distribution centres’ business travels in 2023. All calculations are made on activity-based data. In line with the methodology on transportation calculations, the emissions reflect the entire value chain emissions, WTW.
Category 7 - Employee commuting
The employee’ commuting habits are estimated based on our FTE count and national statistics on commuting habits from Danish Statistics and DTU. Since last reporting year, the calculation method has changed with the assumption that our youth employees (under 18 years of age) neither own nor drive a car to work, and thus should not be included in the number of employees that drive to work. In line with the methodology on transportation calculations, the emissions reflect the entire value chain emissions, WTW.
Category 9 - Downstream transportation and distribution
As the emission source in this category has been revised, this category is no longer applicable to our Scope 3 emission. Please see Category 4 - Upstream transportation and distribution for further information.
Category 11 – Use-of-sold products
This category is based on activity data from the items list and covers sold products that include propane and butane (e.g. lighters). New to the category this year is the inclusion of the use (burning) of candle wax.
Category 12 – End-of-life treatment of sold products
Emissions related to the end-of-life treatment of sold products are estimated based on REMA 1000 Danmark’s market share and national statistics on household waste. In addition, the end-of-life treatment of products that are purchased for the consumers’ use in stores, for instance plastic bags for self-mix candy, fruit and vegetables, and bread, has also been included using activity data.
Category 13 - Downstream leased assets
In the distribution centre in Horsens a third part company rents part of the building. Scope 1 and 2 emissions from the company’s activities in the building are calculated and included in this category based on activity data.
Category 15 - Investments
REMA 1000 Denmark incorporates emissions associated with its ownership share in Gram Slot into this category. As REMA 1000 Denmark does not have operational control over the farm’s activities and does not hold an ownership share exceeding 50 percent, these emissions are not included in scope 1 and 2 emissions. Emissions in this category are calculated using activity data provided by Gram Slot, encompassing emissions from farming activities, dairy cattle, heating, fuel consumption by machinery and vehicles, gas usage in the farm restaurant, and electricity consumption on the farm’s premises.
Reitan Convenience
The GHG accounting for Reitan Convenience includes seven subsidiaries representing each country Reitan Convenience has operations in: Reitan Convenience Norway, Reitan Convenience Sweden, Reitan Convenience Denmark, Reitan Convenience Finland, Reitan Convenience Latvia, Reitan Convenience Estonia, and Reitan Convenience Lithuania. It also encompasses a total of eight concepts distributed among 1,769 outlets in 2023, along with their respective administrations. These concepts are Narvesen, 7-Eleven, Northland, Pressbyrån, PBX, R-kioski, Caffeine, Lietuvos Spauda. RC Lithuania includes Coffee Point in their GHG accounting, a roastery distributing coffee beans to the Baltic region. Furthermore, Baltic-based companies Press Express in Lithuania, Preses Serviss in Latvia, and Lehepunkt in Estonia have ownership and operations in press distribution.
The GHG accounting includes emissions from the 7-Eleven franchises located at YX 7-Eleven stations, while the fossil fuels sold at these stations are accounted for in Uno-X Mobility’s GHG accounting.
Scope 1
Reitan Convenience includes all emissions from their operations, including fossil fuels from company cars, stationary combustion, and consumption of refrigerants. Refrigerants are reported based on refill of the refrigerant at systemwide outlets. Even though non-Kyoto refrigerant gases typically are not included in scope 1 under the GHG Protocols recommendations, Reitan Retail and Reitan Convenience want to include this in their scope 1. As a result, refrigerant gasses R-290 and R-600A are included in 2023 and will continue to be included in scope 1 in the following years.
Scope 2
This scope includes energy purchased by Reitan Convenience in the form of electricity, district heating and cooling, and heat from purchased natural gas (as the heat generated from natural gas occurs outside of RC Estonia’s controlled or owned facilities and is not a direct emission, it is classified as a scope 2 emission rather than a scope 1 emission where natural gas heating is typically reported). Data quality and gathering is a challenge for several of the business units, as their outlets are often located in malls, airports, and similar shared locations. Estimations on consumption of electricity and district heating have been conducted to aggregate the data for most of the companies. The offices of Reitan Convenience AS, Reitan Convenience Norway, Reitan Convenience Lithuania, and Reitan Convenience Estonia have in the reporting year purchased RECs for parts of their electricity consumption, which is included in the market-based calculations.
Scope 3
Reitan Convenience have in a scope 3 assessment found 10 of 15 categories relevant for their operations and report on all 10 identified categories. However, the relevance of category 9, downstream transportation and distribution, slightly differs between the companies. Moving forward, some differences in the GHG accounting between the companies should be addressed, and we are planning to work on improving data quality and granularity. Please see the overview below for the calculations currently included in the reporting year. Reitan Convenience expect some changes in scope 3 calculations in the forthcoming years. The relevance of each category is assessed and revised in our annual reporting. Upon changes in our operations, relevant categories and related emissions will be reassessed and accounted for accordingly.
Purchased Goods and Services Relevant, assessed as complete Relevant, assessed as complete Relevant, assessed as complete Relevant, assessed as complete Relevant, assessed as complete Relevant, assessed as complete Relevant, assessed as complete
Capital Goods Relevant, assessed as complete Relevant, assessed as complete Relevant, assessed as complete Relevant, assessed as complete Relevant, assessed as complete Relevant, assessed as complete Relevant, assessed as complete
Fuel-and-energy related activities Relevant, assessed as complete Relevant, assessed as complete Relevant, assessed as complete Relevant, assessed as complete Relevant, assessed as complete Relevant, assessed as complete Relevant, assessed as complete
Upstream transportation and distribution Relevant, assessed as complete Relevant, assessed as complete Relevant, assessed as complete Relevant, assessed as complete Relevant, assessed as complete Relevant, assessed as complete Relevant, assessed as complete
Waste Relevant, assessed as complete Relevant, assessed as complete Relevant, assessed as complete Relevant, assessed as complete Relevant, assessed as complete Relevant, assessed as complete Relevant, assessed as complete
215 214 Our responsibility Our business Corporate governance Financial statements Appendix
Scope 3 Category RC Norway RC Sweden RC Denmark RC Finland RC Latvia RC Estonia RC Lithuania
5.4 Greenhouse gas accounting
Scope 3 Category RC Norway
Business Travel Relevant, assessed as complete Relevant, assessed as complete Relevant, assessed as complete Relevant, assessed as complete Relevant, assessed as complete Relevant, assessed as complete Relevant, assessed as complete
Employee Commuting Relevant, assessed as complete Relevant, assessed as complete Relevant, assessed as complete Relevant, assessed as complete Relevant, assessed as complete Relevant, assessed as complete Relevant, assessed as complete
Upstream Leased Assets Not applicable Not applicable Not applicable Not applicable Not applicable Not applicable Not applicable
Downstream transportation and distribution Relevant, not yet calculated Not applicable Relevant, assessed as complete Not applicable Not applicable Relevant, assessed as complete Not applicable
Processing of sold products Not applicable Not applicable Not applicable Not applicable Not applicable Not applicable Not applicable
Use of sold products Relevant, assessed as complete Relevant, assessed as complete Relevant, assessed as complete Relevant, assessed as complete Relevant, assessed as complete Relevant, assessed as complete Relevant, assessed as complete
End-of-life treatment of sold products Relevant, assessed as partially complete Relevant, assessed as partially complete Relevant, assessed as partially complete Relevant, assessed as partially complete Relevant, assessed as partially complete Relevant, assessed as partially complete Relevant, assessed as partially complete
Downstream leased assets Not applicable Not applicable Not applicable Not applicable Not applicable Not applicable Not applicable
Franchises Included in scope 1 and 2 Included in scope 1 and 2 Included in scope and 2 Included in scope 1 and 2 Included in scope 1 and 2 Included in scope 1 and 2 Included in scope 1 and 2
Investments Not applicable Not applicable Not applicable Not applicable Not applicable Not applicable Not applicable
In 2023, enhancements in data quality and granularity have raised the level of details in the business area’s scope 3 reporting compared to 2022.
Category 1 - Purchased goods and services
Purchased goods and services includes cradle-to-gate emissions for all relevant sold products at Reitan Convenience’ systemwide outlets. Therefore, it is deemed as the category with the most significant emissions. To increase granularity, the products are calculated based on items lists, and divided into multiple sub-categories to increase the possibility of comparison between the organisational units. The current GHG accounting includes key categories such as food, beverages, convenience goods, and other goods sold in the outlets. Emissions are calculated using activity data.
A change in methodology from the previous reporting year is the exclusion of products classified by Reitan Convenience as agent income, such as lottery and transportation tickets, from the GHG accounting. This exclusion is justified by the fact that the revenue from these products is categorised in the financial accounts as a “Sale of services”. This indicates a distinction in physical nature and degree of control compared to other products included in the company inventory.
When it comes to the products provided by the press distribution companies, Reitan Convenience includes all products in the GHG accounting. These products, as per financial reports, are consistently recorded under “Sale of Goods” and are thus considered part of the company inventory during the relevant period.
Category 2 – Capital goods
Capital goods are primarily assessed using a combination of activity and spend-based data for items purchased throughout the year where data is accessible, such as dishwashers, freezers, and counter machines. This category also encompasses estimates from renovation projects, which are categorized into four types, each classified as a capital good: “smaller renovations”, “renovations”, “new establishment” and “closing of establishments”.
Category 3 – Fuel-and-energy related activities
Fuel-and-energy related activities are calculated based on inputs on consumption in scope 1 and 2, applied with upstream or well-totank (WTT) factors.
Category 4 – Upstream transportation and distribution
Data concerning upstream transportation and distribution is mostly obtained from suppliers. There are notable variations in the data that different companies can gather from their individual suppliers. Continuous communication with suppliers regarding data quality is
an area for enhancement. Following best practices, upstream or WTT emissions for transportation are considered in the calculation of this category. Consequently, the emissions mirror the complete value chain emissions, encompassing WTW emissions.
Category 5 – Waste
When calculating emissions from waste generated in operations, variations in data quality and granularity arise from the availability of supplier-specific data. Not all systemwide outlets have equal opportunities to gather data with the same level of detail from their suppliers, primarily due to collective waste management at shared outlet locations. Consequently, some business units have had to measure waste from one or a portion of the stores to approximate the total waste from all stores. For instance, RC Norway has estimated waste from approximately 80% of their stores.
Category 6 – Business travel
Business travel, on the other hand, is a category that is relatively straightforward to gather data for and is thus computed using activity data. Thanks to effective collaboration with travel agencies and the availability of data within the countries’ financial departments, this area boasts good data availability and quality. Consistent with the transportation calculation methodology, the emissions mirror the complete value chain emissions, encompassing WTW emissions.
Category 7 – Employee commuting
Employee commuting is a category where data quality varies. Through a hybrid calculation approach, some of the business units have conducted surveys among their employees to collect activity data and extrapolated the survey findings to all employees. In contrast, other business units have opted to use national statistics and apply them to the number of employees in the unit to estimate emissions. Consistent with the transportation calculation methodology, the emissions represent the complete value chain emissions, encompassing WTW emissions.
Category 9 – Downstream transportation and distribution
Downstream transportation and distribution are assessed as relevant for three of seven subsidiaries in Reitan Convenience. The category is assessed to be relevant when third-party companies like Wolt or Foodora pick up goods at the systemwide outlets to transport the goods to customers. Reitan Convenience does not pay for the transportation service, and do not have operational control of the service or its administration. Only business units where this information has been provided throughout the reporting period has been accounted for. When and if the service is provided or established in additional Reitan Convenience subsidiaries, the related emissions will be accounted for accordingly.
Category 11 – Use-of-sold products
Use of sold products has for the reporting year been estimated, as there only are a few products in Reitan Convenience’s assortment that have possible use-phase emissions. In this year’s reporting, we have included emissions from the use of lighters (butane), propane, kerosene, and petrol. The emissions from this category can be further expanded in following years, depending on data granularity and emissions from other fossil-based products and services. An area for improvement is to estimate emissions from products determined by the GHG Protocol to have a direct use-phase. For Reitan Convenience this applies to electronic products sold in our concept stores.
As these are additional products outside of Reitan Convenience core assortment, the emissions from these are likely to be small. As a result, the category is assessed as partially completed for the reporting year.
Category 12 – End-of-life
treatment
For emissions from end-of-life treatment of sold products, we have reported on end-of-life treatment for food waste as well as packaging and press (e.g. newspapers and magazines). As for food waste, an estimate based on national waste statistics has been utilised together with the market share of each subsidiary in their respective countries. For packaging and press we have based the calculation on the assumption that there is a 1:1 relationship between purchased packaging and press (which is collected and reported in category 1) and packaging waste, which is then reported as waste in category 12. This is a general assumption for all subsidiaries unless other details regarding the topic have been provided. The calculations can be enhanced in future years by applying similar estimates for other sold products, such as flowers. Nonetheless, the category is assessed as complete for the reporting year, as the end-of-life treatment of Reitan Convenience core assortment is accounted for.
Uno-X Mobility
Uno-X Mobility are committed to being transparent with the GHG emissions accounting and report emissions from own operations and value chain based on the GHG Protocol. Data for the GHG accounting are collected from 803 liquid fuel stations, 77 Nordic Swan eco-labelled carwash, 30 conventional carwash locations, three ultra-fast EV charging locations for Heavy-duty vehicles, and 38 ultra-fast EV charging locations, six tank facilities for fuel storage, Uno-X Mobility Cycling, bike production, lubricants operations, as well as office operations.
217 216 Our responsibility Our business Corporate governance Financial statements Appendix
RC
RC
RC
RC
RC Estonia RC
Sweden
Denmark
Finland
Latvia
Lithuania
5.4 Greenhouse gas accounting
Uno-X Mobility will during 2024 work towards enhancing Scope 3 data quality further. This amongst other things will include collecting activity data for the transportation of lubricants, and attaining more data from Ipart A/S.
Scope 1
Uno-X Mobility includes all emissions from their operations. This comprises data related to owned company cars and leased vehicles.
Scope 2
This mainly includes electricity consumption from Uno-X Mobility’s offices in Norway and Denmark, given that the majority of operations are centred around unmanned fuel and energy stations. Scope 2 also includes the transmission and distribution losses of electricity from EV charging stations.
Scope 3
In 2022, Uno-X Mobility conducted a scope 3 assessment, concluding that 8 of 15 scope 3 categories are relevant to report on. In the revised assessment for the current reporting, category 12, End-of-life treatment of sold products, was assessed as relevant as well, thus increasing the scope of reporting to 9 of 15 categories.
Category 1 - Purchased goods and services
Uno-X Mobility accounts for upstream or well-to-tank (WTT) emissions of liquid fuels, fossil and biofuels, sold electricity at the EV-charging stations, and water consumption at car wash locations in purchased goods and services. In the reporting year, the company has increased the reporting scope to include raw materials used for production of bikes, as well as lubricants.
Furthermore, Uno-X Mobility calculates emissions related to indirect land-use change (ILUC). The calculation is based on standardised emission factors outlined in the EU Directive. As there is an increasing demand for biofuels, efforts need to be made to account for their climate impact. The GHG Protocol does not define this as a relevant activity to report on in the carbon accounting, however, due to legislations in Norway and Denmark, these emissions must be calculated with standardised emission factors from the EU Directive.
Category 2 – Capital goods
In the 2022 scope 3 assessment, capital goods were assessed as relevant. Due to a lack of data in time for the reporting, the category has been partially reported for the first time in 2023. The category includes emissions from the construction of new EV-charging stations, construction of new Nordic Swan ecolabelled carwashes, purchase of a tank at one of the tank storage facilities, and purchase of a bus for the cycling team. The calculations are based on a hybrid approach utilising activity data where available and a spend-based approach to narrow the reporting gap. The category is assessed as partially completed due to insufficient information from subsidiary Ipart A/S. Uno-X Mobility will define reporting boundaries for this category to ensure complete reporting in 2024.
Category 3 – Fuel-and-energy related activities
Fuel-and-energy related activities is calculated based on input in scope 2, applied with upstream or WTT factors. This category should, according to the GHG Protocol also apply to input in scope 1. However, fossil fuels reported within Uno-X Mobility’s scope 1 emissions stem exclusively from purchases made at the company’s own energy stations. Uno-X Mobility allocates all fossil fuel purchased in 2023 to category 1, purchased goods and services, with associated well-to-tank emission factors. Including scope 1 fossil fuel consumption in fuel-and-energy related activities would result in double counting in the upstream categories, prompting the exclusion of scope 1 activities from this category to ensure accurate emissions reporting.
Category 4 – Upstream transportation and distribution
Based on activity data, upstream transportation and distribution emissions include transportation of fuel to Uno-X Mobility in Norway and Denmark carried out by Skanol. The category is assessed to be partially completed as upstream transportation and distribution for Smøreolje Norway, Smøreolie Denmark, and Uno-X Bikes is not yet included in the calculated emissions in this category. According to best practices and Reitan Retails methodology, upstream or WTT emissions for transportation shall be accounted for in this category. However, Skanol procures all fuel used in its transportation for Uno-X Mobility at our energy stations. As a result, the WTT emissions are incorporated within category 1, purchased goods and services, and excluded from this category to avoid double counting.
Category 5 – Waste
In our operations, Uno-X Mobility incorporates all wastewater from carwash services and waste from the excavation of organic soil at new locations, such as EV-charging stations. Uno-X Mobility considers garbage bins at the stations as immaterial, and hence do not include it in the GHG accounting. The category is assessed as partially completed due to the lack of reporting from the subsidiary Ipart A/S.
Category 6 – Business travel
Emissions from business travels are based on company-specific data, extracted from our accounting systems. All calculations are
made on activity-based data. Due to lack of capacity, Ipart A/S has not reported business travels for the reporting year. Nonetheless, these emissions are assessed as quite small due to the size of the subsidiary. Therefore, the category is still assessed as complete. In line with the methodology on transportation calculations, the emissions reflect the entire value chain emissions, WTW.
Category 7 – Employee commuting
Based on national and regional statistics, emissions from employee commuting for all Uno-X Mobility companies except the E-Mobility companies have been estimated. Uno-X E-Mobility in Norway and Denmark have used activity data as they conducted an internal employee commuting survey in 2023. In line with the methodology on transportation calculations, the emissions reflect the entire value chain emissions, WTW.
Category 11 – Use-of-sold products
Based on sold fuels and electricity at our stations, the use-phase emissions related to these products are accounted for based on a 1:1 approach between category 1 and category 11. Data reported in this category deducts consumption reported in scope 1 and scope 3 category 4, upstream transportation and distribution, as it would result in double counting of these use-phase emissions. As a result, Uno-X Mobility has accounted for well-to-wheel (lifecycle) of our liquid fuels and sold electricity.
Category 12 – End-of-life treatment
End-of-life treatment of sold products is assessed as relevant for Uno-X Mobility’s GHG accounting through its lubricant products. This has not been included in the reporting for the 2023 year due to a lack of data availability.
Other
Other is the remaining part of Reitan Retail outside of the four business areas.
• Gladengen Drift represent Reitan Retail’s head quarter and facility services connected to Gladengveien 2 in Oslo, not reported elsewhere.
• Innom is a concept store at Grünerløkka, Oslo, converted from a REMA 1000 store in 2022. In line with the financial reporting, the unit is reported separate from REMA 1000 Norway’s GHG accounting. As of 2024, Reitan Convenience Norway has the operational control of Innom.
• Reitan Retail AS represent the parent company of Reitan Retail, not reported elsewhere.
Scope 1
Other includes all direct emissions from their operations, including consumption of fossil fuels from one company car and the emission from refrigerants. Refill of refrigerants were not conducted in the reporting year, and as such are not reported in the GHG accounting this year. For 2023, scope 1 emissions only stem from the company car’s fossil fuel consumption calculated based on an estimation.
Scope 2
Electricity and district heating consumption at Gladengen 2 is allocated to the various business areas based on the number of employees located on the premises. Therefore, Gladengen Drift itself has no electricity consumption to report, avoiding double counting. Reitan Retail AS is accountable for 4.6 percent of the electricity consumption at Gladengen 2, whereas the remaining consumption is reported by REMA 1000 Norway, Reitan Convenience and Uno-X Mobility. Innom’s electricity consumption is extracted from supplier data and reported accordingly.
Both scope 1 and 2 emissions are for the reporting year assessed as complete.
Scope 3
In 2022, Other conducted a scope 3 assessment, concluding that nine of 15 scope 3 categories are relevant to report on. Compared to previous reporting year, categories 3, 4 and 7 are reported for the first time. Emissions from category 4, upstream transportation and distribution has previously been included elsewhere, whilst emissions from category 3, fuel-and-energy related activities, and 7, employee commuting, are reported for the first time.
Category 1 – Purchased goods and services
Most of the ingredients and products used in the cantina in Reitan Retail’s main office are purchased from REMA 1000 Norway and accounted for in their GHG accounting. Emissions calculations for goods from external suppliers are based on activity data via order schemes and invoices. For the greater share of the products, an emission factor that suits the type of product has been applied. Where this was not possible, an emission factor representing the main ingredient based on the ingredient list was applied to the product. Where relevant, average emission factors were used.
219 218 Our responsibility Our business Corporate governance Financial statements Appendix
5.4 Greenhouse gas accounting
Other purchased goods and services for Gladengen Drift and Reitan Retail AS are included using a spend-based calculation approach. This covers purchases related to office operations such as office suppliers and other professional services. Legal and consulting services have been excluded from our carbon accounting on the grounds that such services are primarily conducted at a desk and thus result in very low emissions, while the costs associated with such services generally are quite high. As we currently do not have the possibility of including these services using activity data, the calculations would be subject to significant discrepancies, as the costs for such services would not reflect the actual emissions of the same services. Although legal and consulting services can be material from a financial point of view, we have deemed these services immaterial to our GHG reporting.
Category 2 – Capital goods
As a policy, capital goods are calculated based on the spend-based approach until suppliers may accommodate emissions report for the purchased goods defined as capital in Reitan Retails accounting. Capital goods for Reitan Retail Other includes office furniture, maintenance of the main office and renovation, as well as renovations and purchases of capital goods at Innom.
Category 3 – Fuel-and-energy related activities
This category is calculated on activity data from our Scope 1 and 2 consumption and includes all upstream emissions of the emission sources in these two scopes.
Category 4 – Upstream transportation and distribution
Using a spend-based approach, Gladengen Drift and Reitan Retail AS have accounted for emissions from upstream transportation and distribution activities. Furthermore, parts of Innom’s upstream transportation and distribution emissions are accounted for in the current GHG accounting, whilst remaining emissions are accounted for under REMA 1000 Norway. This is due to collective transportation services managed by REMA Distribusjon Norway. According to best practices, upstream or WTT emissions for transportation is included in the calculation of this category. As a result, the emissions reflect entire value chain emissions, WTW.
Category 5 – Waste
Utilizing activity data from our supplier, emissions from waste generated at the main offices are accounted for under Gladengen Drift. As for Immon, as a previous REMA 1000 store, we are not able to split all data in an appropriate manner for the separate reporting. As a result, less material categories are still accounted for in REMA 1000 Norway’s GHG accounting until data granularity is sufficient for Innoms’ reporting.
Category 6 – Business travel
Business travel is calculated using different methods depending on the unit. Gladengen Drift and Reitan Retail AS both collect supplier specific data from travel agencies, supplemented with spend-based calculations to complete the reporting. As for Innom, business travels are accounted for using spend-based approach due to less granularity in the franchise’s activity data. In line with the methodology on transportation calculations, the emissions reflect the entire value chain emissions, WTW.
Category 7 – Employee commuting
Employee commuting is calculated as an estimate. The estimate is based on national statistics from Statens Vegvesens Reisevaneundersøkelse 2022, applied to the number of the employees for the reporting unit and number of working days in the reporting year. As Oslo-based locations, Gladengen Drift and Reitan Retail AS have used the specific travel results for Oslo and Akershus in the estimation. Furthermore, these two units have taken home office days into account. In line with the methodology on transportation calculations, the emissions reflect the entire value chain emissions, WTW.
Category 11 – Use-of-sold products
This category is based on activity data from our items list and covers sold products that include butane (e.g. lighters). The category is not applicable for the reporting entities Gladengen Drift and Reitan Retail AS.
Category 12 – End-of-life treatment of sold products
With regards to Innom, as a previous REMA 1000 store, we are not able to split all data in an appropriate manner for the separate reporting. As a result, less material categories are still accounted for in REMA 1000 Norway’s GHG accounting until data granularity is sufficient for Innom’s reporting. Additionally, due to the size of Innom, the emissions from Innom’s end-of-life treatment are deemed negligible individually.
The category is not applicable for the reporting entities Gladengen Drift and Reitan Retail AS.
221 220 Our responsibility Our business Corporate governance Financial statements Appendix
5.4 Greenhouse gas accounting

Statement no: Valid from: C678703-1 12 March 2024
Reitan Retail AS
Verification of Scope 1, Scope 2, and selected Scope 3 categories GHG emissions for year 2023 for Reitan Retail AS.
DNV Business Assurance Norway AS (DNV) was commissioned by Reitan Retail AS (Reitan) to provide limited assurance on the information described below for the year ending 31 December 2023
The purpose of this document is to clarify matters set out in the process of verifying CO2-eq emissions for Reitan’s operations. We do not accept or assume any responsibility or liability on our part to any party who may have access to this letter or related documents.
1. Boundaries of the reporting company covered by the assurance report and any known exclusions :
The scope of our work was limited to assurance over the 2023 GHG emission figures including:
• Scope 1 CO2-eq emissions
• Scope 2 CO2-eq emissions
- Marked-based emissions
- Location-based emissions
• Selected Scope 3 CO2-eq emissions:
- Category 1: Purchased goods and services
- Category 2: Capital goods
- Category 3: Fuel and energy related activities
- Category 4: Upstream transportation and distribution
- Category 5: Waste generated in operations
- Category 6: Business travel
- Category 7: Employee commuting
- Category 8: Upstream leased assets
- Category 9: Downstream transportation and distribution
- Category 11: Use of sold products
- Category 12: End-of-life treatment of sold products
- Category 13: Downstream leased assets
- Category 15: Investments
2. Emissions data verified:
The GHG aggregated emissions data for Reitan (Selected Information) presented in the table below, represent the cumulative emissions for each Scope from the following entities:
• Reitan Retail AS • REMA 1000 Norway • REMA 1000 Denmark
Uno-X
DNV Business Assurance Norway AS, Veritasveien 1, 1363 Høvik, Norway

3. Period included in the verification: 01 January 2023 to 31 December 2023
4. Reporting criteria: ISO 14064-1:2019, GHG Protocol Corporate Accounting and Reporting Standard , and Corporate Value Chain (Scope 3) Standard.
5. Level of assurance: Limited Assurance
The verification was conducted between 31 January 2024 and 5 March 2024, during which Reitan provided its GHG calculations
DNV has performed the verification with the following approach:
- A review of the consolidation process
- Review of procedures for collection of activity data and emissions factors and calculations including routines for data quality management
- Review of calculation methods and emission source references
- Interviews with key personnel through calls (MS Teams) for Reitan Retail AS, REMA 1000 Norway, REMA 1000 Denmark, Uno-X Mobility and Reitan Convenience
- Closing out reported non-compliances, observations, and clarifications
Based on the procedures DNV has performed and the evidence we have obtained, nothing has come to our attention that causes us to believe that the Selected Information for the year ending 31 December 2023 has not been prepared, in all material respects, in accordance with the Reporting Criteria.
6. Verification provider:
DNV Business Assurance Norway AS Place and date: Høvik, 12 March 2024
223 222 Our responsibility Our business Corporate governance Financial statements Appendix
•
Mobility • Reitan
Other emissions have not been part of the verification scope and hence have not been verified by DNV. Scopes [tCO2-eq] 2023 Scope 1, Total CO2-eq Scope 1 emissions: 18 514 Scope 2, Total CO2-eq Scope 2 emissions (location based): 25 021 Scope 2, Total CO2-eq Scope 2 emissions (market based): 244 101 Scope 3, Total CO2-eq Scope 3 emissions: 8 860 187
Convenience
Norway
DNV Business Assurance Norway AS, Veritasveien 1, 1363 Høvik,
Lead verifier Technical Reviewer Torp, Catharina Digitally signed by Torp, Catharina Date: 2024.03.12 09:39:39 +01'00' Rice, Tone Digitally signed by Rice, Tone Date: 2024.03.12 09:49:06 +01'00' 5.4 Verification statement
5.5 Global reporting initiative (GRI) standards
This report encompasses Reitan Retail’s financial, environmental, social, and governance (ESG) performance. The information provided pertains to the fiscal year 2023 and is disclosed in compliance with the GRI Standards.
GRI indicators are presented for both 2023 and 2022. ESG risks were monitored throughout 2023, with climate-related risks and opportunities detailed in this report and a separate Task Force on Climate-related Financial Disclosures (TCFD) report. We actively engage in global efforts to achieve the 2030 Sustainable Development Goals (SDGs), and our greenhouse gas emissions reporting aligns with the GHG Protocol to address our climate impact across our operations and value chain.
GRI data for the General, Environment, Health, and People sections on the following pages are provided for Reitan Retail (the Group) and the business areas REMA 1000 Norway, REMA 1000 Denmark, Reitan Convenience, Uno-X Mobility, and Other. The Other category encompasses Reitan Retail AS, Gladengen Drift AS, and Innom. Within the financial statements, Reitan Retail’s portfolio of retail properties in Norway and Denmark is included and presented separately in the segment note as Real Estate. In December 2023, Reitan Retail divested the Norwegian portfolio to REBUS Handelseiendom. The GRI data presents the retail property portfolio in Denmark alongside REMA 1000 Denmark, while the Norwegian portfolio is not included.
The 2023 report is compiled in accordance with GRI Standards 2021 and adheres to the applicable reporting principles:
• Accuracy
• Balance
• Clarity • Comparability
• Completeness
• Sustainability context • Timeliness
• Verifiability
RETAIL
The Board of Directors has reviewed the combined financial and sustainability report including the company’s material topics. This report, Responsible Retail 2023 was approved by the Board of Directors on April 29, 2024.
For the 2024 sustainability reporting, Reitan Retail will transition from using GRI to the EU Corporate Sustainability Reporting Directive (CSRD) and the underlying European Sustainability Reporting Standards (ESRS).
RETAIL
225 224 Our responsibility Our business Corporate governance Financial statements Appendix
5.5 GRI
General Disclosures Environmental disclosures Health disclosures People disclosures full-time workers among our people 25% Female managers and in mgmt. per country 0 1 2 3 4 5 6 6.0% 5.9% 5.1% 2021 2022 2023 0 10 20 30 40 50 60 70 80 40% 60% 2021 2022 2023 Women Men 0 10 20 30 40 50 60 70 80 Female managers and in mgmt. per country 35% 50% 27% 62% 64% REITAN
Our people per country REITAN
Sickness absence percentage - employees 0 10 20 30 40 50 60 70 80 70% 72% 74% 2021 2022 2023 REITAN RETAIL Waste recycled share REITAN RETAIL Our employees per country REITAN RETAIL Diversity of managers – employees 0 20 40 60 80 100 84% 81% 80% 2021 2022 2023 REITAN RETAIL Renewable energy share (location based) Norway Sweden Denmark Finland Baltics REITAN RETAIL diversity of managers per country – employees 0 100 200 300 400 500 465 265 2021 2022 2023 Private label Brand label REMA 1000 Keyhole-labelled products sold (thousand) 0 30 60 90 120 150 113 83 2021 2022 2023 Private label Brand label REMA 1000 Organic products sold (thousand) 45,369 total 7,159 total 226 230 234 237
Employees in the company, not including franchisees and their store personnel. The data is compiled by the use of head count at the end of the reporting period. 2023
1 The prerequisites that enable Non-guaranteed hours contracts are not present in REMA 1000 Denmark, and for that reason REMA 1000 Denmark does not use this form of employment.
GRI - Employees and workers who are not employed
GRI 2-8 Workers who are not employees
Workers in Reitan Retail, defined as not employees are our franchisees and their store personnel. Workers and managers in com pany operated outlets are
and reported in GRI 2 -7 Employees. The data is compiled by the use of head count at the end of the reporting period.
Employees in the company, franchisees and their store personnel.
1 The prerequisites that enable Non-guaranteed hours contracts are not present in REMA 1000 Denmark, and
not use this form of employment.
227 226 Our responsibility Our business Corporate governance Financial statements Appendix
GRI 2-7 Employees
2022 Employment type REMA 1000 REMA 1000 Reitan Uno-X Other Reitan Reitan NO DK Conv. Mobility Retail Retail Women Men Women Men Women Men Women Men Women Men Women Men Women Men Permanent 89% 88% 98% 97% 88% 85% 96% 98% 95% 92% 91% 91% 90% 89% Temporary 6% 8% 2% 3% 1% 1% 0% 0% 3% 8% 2% 5% 3% 6% Non-guaranteed hours 1 5% 4% 0% 0% 11% 14% 4% 2% 2% 0% 7% 4% 7% 5% Employment by gender 725 1,530 847 1176 1,988 503 99 212 41 38 3,700 3,459 3,424 3,143 Gender in share of total 32% 68% 42% 58% 80% 20% 32% 68% 52% 48% 52% 48% 52% 48% Total employment 2,255 2,023 2,491 311 79 7,159 6,567
2023 2022 Employment capacity REMA 1000 REMA 1000 Reitan Uno-X Other Reitan Reitan NO DK Conv. Mobility Retail Retail Women Men Women Men Women Men Women Men Women Men Women Men Women Men Part-time 22% 18% 43% 31% 49% 44% 11% 4% 34% 45% 41% 26% 25% 21% Full-time 78% 82% 57% 69% 51% 56% 89% 96% 66% 55% 59% 74% 75% 79% Employment by gender 725 1,530 847 1176 1,988 503 99 212 41 38 3,700 3,459 3,424 3,143 Gender in share of total 32% 68% 42% 58% 80% 20% 32% 68% 52% 48% 52% 48% 52% 48% Total employment 2,255 2,023 2,491 311 79 7,159 6,567
2023 2022 Workers who are not employees - employment type REMA 1000 REMA 1000 Reitan Uno-X Other Reitan Reitan NO DK Conv. Mobility Retail Retail Women Men Women Men Women Men Women Men Women Men Women Men Women Men Permanent 74% 69% 40% 29% 62% 56% - - - - 58% 49% 58% 66% Temporary 5% 7% 60% 71% 16% 24% - - - - 29% 38% 28% 21% Non-guaranteed hours 1 21% 24% 0% 0% 22% 20% - - - - 13% 13% 14% 13% Workers by gender 6,437 6,981 7,007 8,321 5,577 3,886 - - - - 19,021 19,188 18,796 18,081 Gender in share of total 48% 52% 46% 54% 59% 41% - - - - 50% 50% 51% 49% Total workers not employed 13,418 15,328 9,463 - - 38,209 36,877 1 The prerequisites that enable Non-guaranteed hours contracts are not present in REMA 1000 Denmark, and for that reason REMA 1000 Denmark does not use this form of employment.
1 2023 2022 Workers who are not employees - employment capacity REMA 1000 REMA 1000 Reitan Uno-X Other Reitan Reitan NO DK Conv. Mobility Retail Retail Women Men Women Men Women Men Women Men Women Men Women Men Women Men Part-time 79% 75% 92% 87% 80% 82% - - - - 84% 81% 80% 79% Full-time 21% 25% 8% 13% 20% 18% - - - - 16% 19% 20% 21% Employment by gender 6,437 6,981 7,007 8,321 5,577 3,886 - - - - 19,021 19,188 18,796 18,081 Gender in share of total 48% 52% 46% 54% 59% 41% - - - - 50% 50% 51% 49% Total workers not employed 13,418 15,328 9,463 - - 38,209 36,877 Own
Employees and workers in Reitan Retail, defined as not employees are our franchisees and their store personnel. The data is c ompiled by the use of head count at the end of the reporting period. 2023 2022 Employees and workersemployment type REMA 1000 REMA 1000 Reitan Uno-X Other Reitan Reitan NO DK Conv. Mobility Retail Retail Women Men Women Men Women Men Women Men Women Men Women Men Women Men Permanent 76% 73% 47% 37% 69% 60% 96% 98% 95% 92% 64% 56% 63% 69% Temporary 5% 7% 53% 63% 12% 21% 0% 0% 3% 8% 24% 33% 24% 19% Non-guaranteed hours1 19% 20% 0% 0% 19% 19% 4% 2% 2% 0% 12% 11% 13% 12% Workers by gender 7,162 8,511 7,854 9,497 7,565 4,389 99 212 41 38 22,721 22,647 22,220 21,224 Gender in share of total 46% 54% 45% 55% 63% 37% 32% 68% 52% 48% 50% 50% 51% 49% Total workers not employed 15,673 17,351 11,954 311 79 45,368 43,444
counted
General disclosures
for that reason REMA 1000 Denmark does
2023 2022 Employees and workersemployment capacity REMA 1000 REMA 1000 Reitan Uno-X Other Reitan Reitan NO DK Conv. Mobility Retail Retail Women Men Women Men Women Men Women Men Women Men Women Men Women Men Part-time 73% 64% 87% 80% 72% 77% 11% 4% 34% 45% 77% 73% 72% 70% Full-time 27% 36% 13% 20% 28% 23% 89% 96% 66% 55% 23% 27% 28% 30% Employment by gender 7,162 8,511 7,854 9,497 7,565 4,389 99 212 41 38 22,721 22,647 22,220 21,224 Gender in share of total 46% 54% 45% 55% 63% 37% 32% 68% 52% 48% 50% 50% 51% 49% Total workers not employed 15,673 17,351 11,954 311 79 45,368 43,444 GRI 2-21 Annual total compensation ratio Reitan Retail comprise of subsidiaries in seven countries with several salary - and payroll systems being used within the Group. For reporting on GRI 221 we present data on the Group's compensation ratio in intervals, average and median, compiled from input from the business areas' subsidiaries. Annual total compensation ratio 2023 2022 Number of reporting companies 33 37 Compensation ratio - interval 1.5 - 34.3 1.4 - 26.7 Compensation ratio - average 6.9 5.8 Compensation ratio - median 4.5 4.3 Growth CEO pay - average 8.3% 5.2% Growth CEO pay - median 7.4% 0.8% Growth median pay - average 2.1% 4.6% Growth median pay - median 4.9% 3.7%
2023,
within Reitan Retail
shared managing director,
why they are not reporting on annual compensation ratio.
In
seven companies
have a
which is
GRI 2-26 Mechanisms for seeking advice and raising concerns
Reitan Retail (the Group) has a common whistleblowing channel available to all stakeholders of Reitan Retail with subsidiarie s at reitanretail.no. This is managed by an independent third party. As our operations are located in seven countries, our busines s areas and their subsidiaries also have unique whistleblowing channels available on the their respective websites in local languages. 2023
GRI 2-30 Collective bargaining agreements
Reitan Retail recognises the importance and impact of organised labour, and the freedom of individuals to organise in the workplace and to enter into collective bargaining agreements.
Our company and business areas are situated in a part of the world with a strong history and culture related to organised lab our. In the Scandinavian countries, the tripartite concertation between state, labour unions and employers make up the basic framework fo r our work life.
However, in the retail industry in our operating areas, the utilising of collective bargaining agreements as a tool is less c ommon. This may relate to the relative high percentage of young and/or part -time employees working within the sector.
Reitan Retail’s sales outlets are mostly organised as franchises. Therefore, wage bargaining for most of our 38,000 people ar e conducted locally, between the franchisee and their employees. 7,000 employees in administration, distribution centres and industrial companies carry out wage negotiations with their respective companies locally. Reitan Retail have started mapping the extent of employees covered by c ollective agreements. At the same time, we also work on increasing the level of awareness in our business areas, and the importance of organised labour, not only amongst employees in outlets, but also among the franchisees and administrative emplo yees.
Own GRI - Political influence and lobbying activities
Political influence and lobbying activities at Reitan Retail are guided by our Public Affairs strategy. We uphold a policy of openness and transparency, therefore, most of our activities are published in our own media channels as well as through traditional media.
In an era where businesses are increasingly intertwined with regulatory frameworks and societal expectations, Reitan Retail recognizes the indispensable role of proactive engagement with government bodies and authorities. Throughout 2023, our Public Affairs office remained committed to fostering and nurturing relationships with key stakeholders, including government officials, politicians, and NG Os. Participation in hearings, conferences, and bilateral meetings was pivotal in facilitating dialogue and collaboration on pertinent issues. Not ably, our presence at prestigious events such as COP28 in Dubai and Arendalsuka, alongside partnerships with esteemed organizations like the Nobel Peace Center, underscored our dedication to constructive engagement and impactful discourse. At the heart of our Public Relations strategy lies a multifaceted approach aimed at fortifying our operations and positioning Reitan Retail for sustainable growth:
Regulatory Compliance: Regular interactions with regulatory authorities ensure our alignment with evolving legislative mandates, safeguarding against legal risks and fostering a culture of compliance.
Reitan Retail AS Reitan Convenience
NHO Service og Handel Board of Directors De Samvirkende Købmænd Board of Directors Nobel Peace Centre Collaboration Finnish Commerce Federation Board of Directors The Finnish Grocery Trade Association Board of Directors REMA 1000 Norway Retailers’ Environment Fund Membership
The Norwegian Food Center Board of Directors Keep Norway clean Membership Norwegian Food Foundation Board of Directors The Swedish Trade Federation Membership Trade Environmental Fund Board of Directors Convenience Stores Sweden Membership The grocery store's environmental forum Board of Directors Danish Chamber of Commerce Membership Infinitum Board of Directors Helsinki Chamber of Commerce Membership Norsk Returkartong AS Board of Directors The Estonian Employers' Confederation Membership Plastretur AS Board of Directors Estonian Traders Association Membership Food Preparedness Membership Green Tiger Membership Ethical Trade Norway Membership Norwegian Chamber of Commerce in Latvia Membership Rainforest Foundation Norway Collaboration The Foreign Investors’ Council in Latvia Membership
The Norwegian Animal Protection Alliance Collaboration Lithuanian diversity charter Membership Lithuanian Responsible Business Assoc. Membership
REMA 1000 Denmark Handelns Säkerhetsgrupp Collaboration
The Danish Chamber of Commerce Board of Directors Thinktank Frej Collaboration
DagSam Board of Directors SOPA Collaboration
Whole Grain Partnership Board of Directors The Latvian Food retailers association Collaboration
The Food Partnership - Health and Climate Board of Directors
Stop Wasting Food Denmark Board of Directors
De Samvirkende Købmænd Board of Directors Uno-X Mobility Ethical Trade Denmark Board of Directors Drivkraft Norge Board of Directors
Danish Alliance for Responsible Palm Oil Membership Drivkraft Danmark Board of Directors
Danish Alliance for Responsible Soy Membership Danish preparedness forum Board of Directors
Thinktank Frej Collaboration Norwegian preparedness forum Membership
Access to Information : Engaging with government agencies provides invaluable insights and data, empowering informed decision -making and strategic planning within our organization.
Advocacy and Influence: By cultivating relationships with policymakers, we advocate for policies conducive to innovation, competition, and economic prosperity, thereby shaping regulatory environments that support our business objectives.
Risk Mitigation : Proactive engagement with government entities enables us to identify and address potential risks, ranging from compliance issues to geopolitical challenges, thereby enhancing resilience and safeguarding our interests.
Access to Funding and Resources: Strategic alliances with government agencies open doors to funding opportunities and incentives, particularly in high-growth sectors such as EV charging infrastructure, bolstering our capacity for innovation and expansion.
Public Image and Reputation : Collaborative initiatives with government bodies bolster our reputation as a responsible corporate citizen, fostering trust and loyalty among stakeholders and enhancing brand equity.
Crisis Management: During times of crisis, our established report with authorities ensures swift and effective coordination of response efforts, ensuring business continuity and minimizing disruptions.
In conclusion, while nurturing relationships with government entities demands concerted effort and resources, the dividends i n terms of enhanced visibility, risk mitigation, and access to resources are undeniable. By embracing the complexities of government rel ations, Reitan Retail reaffirms its commitment to sustainable growth, stakeholder engagement, and responsible corporate citizenship, positio ning itself for long-term success and prosperity.
229 228 Our responsibility Our business Corporate governance Financial statements Appendix 3
REMA 1000 Norway REMA 1000 Denmark Reitan Conv. Uno-X Mob. Other Reitan Retail Number of reporting units in the business area 13 4 12 11 3 43 Companies with whistleblowing system 100% 100% 75% 100% 100% 93% Whistleblowing systems for both internal and external stakeholders 92% 100% 89% 55% 100% 83% Whistleblowing systems administrated by a third -party 69% 100% 78% 100% 100% 85% 2023 Reported incidents REMA 1000 Norway REMA 1000 Denmark Reitan Conv. Uno-X Mob. Other Reitan Retail Violations of laws and regulations 25 7 9 - - 41 Discrimination and harassment 17 5 5 - - 27 Data privacy breaches and data security incidents - 5 0 - - 5 Corporate governance issues - - 1 - - 1 Accounting and financial irregularities - 1 - - - 1 Other unethical or illegal behaviour 18 - 3 - - 21 Number of reported incidents 60 18 18 - - 96 Reported incidents by internal stakeholders 70% 89% 94% - - 78% GRI
Membership associations
2-28
Annual Report 2023 4
Environmental disclosures
Our business areas are constantly working to enhance the efficiency of material utilisation, aiming for a greater use of both recycled and recyclable materials. Data collection practices on these matters vary among subsidiaries, with REMA 1000 Denmark serving as a n example of inadequate data quality. As a result, all materials are reported as non -recycled. In 2023, our business areas report increased consumption of non-renewable materials, whilst decreasing the utilisation of renewable materials. In the forthcoming years, we are committed to phasing out the use of non-renewable materials entirely.
GRI 303 - Water effluents
Reitan Retail's business areas interacts with water mainly through municipality services across all business areas and countr ies. As such, water is drawn mainly from groundwater interconnected with the municipality water supply. The majority of our water withdrawal is c onnected to our outlets, car washes and industries. The reporting of water usage and management in our business areas has room for improvemen t and provides significant opportunities for enhancement. The decrease in reported water discharge is detailed in the reporting met hodology concerning REMA 1000 Norway. In 2024, we will investigate the internal reporting capabilities and establis hing procedures for reporting on water withdrawl, consumption, and discharge.
There has not been reported significant impacts of the business' water withdrawal in 2023. However, parts of our business are as have a significant utilisation of water, where related impacts needs to be mapped out. In general, Norway and Denmark, the countries in which we have significant water consumption are seen as low risk on extensive water consumption and baseline water stress by the WWF W ater Risk Index, whereas countries further south -east of the Nordic countries in Europe, in which we have operations, face a low -moderate risk. Waterrelated impacts are managed in our subsidiaries management approach, e.g., Uno -X Mobility have invested in a growing amount of Nordic Swan ecolabelled car wash facilities. As per the requirements of Nordic Swan, contaminated water from washing is 90 percent m ore thoroughly rinsed and requires about 80 percent less water consumption compared to conventional car wash.
As the majority of our systemwide outlets, car washes and industries are connected to the municipality or local water supplie r, official reports showcase that wastewater is managed before retreating back to the source, which is assumed to be the same as the source of th e withdrawal. Reitan Retail has currently no internal water quality standards or guidelines in reference to discharge but complies with nat ional requirements at all facilities.
231 230 Our responsibility Our business Corporate governance Financial statements Appendix Annual Report 2023 GRI 301-1 Material used by weight or volume 2023 2022 REMA 1000 Norway REMA 1000 Denmark Reitan Conv. Uno-X Mob. Other Reitan Retail Reitan Retail % change Bagasse, renewable tonnes - - 77 - - 77 234 -67% Cardboard tonnes 1,531 148 81 - - 1,760 1,718 2% Cardboard, renewable tonnes 354 - - - - 354 3Glass, virgin tonnes 1,529 - - - - 1,529 1,799 -15% Glass, recycled tonnes 917 - - - - 917 675 36% Metals, virgin tonnes 1,280 15 3 507 - 1,805 2,190 -18% Metals, recycled tonnes 1,399 - - - - 1,399 1,079 30% Paper tonnes 112 153 365 - - 630 3,119 -80% Paper, renewable tonnes - - 129 - - 129 44 193% Plastic tonnes 4,128 603 113 380 - 5,224 3,910 34% Plastic, renewable tonnes 2,887 - 5 - - 2,892 3,373 -14% Other virgin material tonnes 9 5,924 21 - - 5,954 51Packaging material, non-renewable tonnes 411 - 685 - - 1,096 2,764 -60% Total weight material used tonnes 14,557 6,843 1,479 887 - 23,766 20,958 13% Improved data quality has been a priority in 2023, in addition to the inclusion of more scope 3 data from our business area. In Uno-X Mobility, several of their units have enhanced their reporting and included packaging as part of their carbon accounting. GRI 301-2 Recycled input materials used 2023 2022 REMA 1000 Norway REMA 1000 Denmark Reitan Conv. Uno-X Mob. Other Reitan Retail Reitan Retail % change Total weight, materials used tonnes 14,557 6,843 1,479 887 - 23,766 20,958 13% Total weight, renewable materials tonnes 5,557 - 211 - - 5,768 5,408 7% share renewable materials % 38% 0% 14% 0% - 24% 26%Total weight, non-renewable materials tonnes 9,000 6,843 1,268 887 - 17,998 15,550 16% share non-renewable materials % 62% 100% 86% 100% - 76% 74% -
15 GRI 302-1 Energy consumption 2023 2022 Energy consumption REMA 1000 Norway REMA 1000 Denmark Reitan Conv. Uno-X Mob. Other Reitan Retail Reitan Retail % change Transportation MWh 21,032 6,671 2,778 2,169 5 32,655 34,501 -5.3 % Stationary combustion MWh 7,585 6,059 19,127 - - 32,771 19,124 71.4 % Total Scope 1 MWh 28,617 12,730 21,905 2,169 5 65,426 53,624 22.0 % Electricity MWh 289,191 96,130 139,177 14,095 292 538,885 554,158 -2.8 % District heating/cooling MWh 19,253 18,236 9,687 114 30 47,320 50,646 -6.6 % Green electricity production MWh 4,104 3,688 - - - 7,792 4,646 0.0 % Total Scope 2 MWh 312,548 118,054 148,864 14,209 322 593,997 609,449 -2.5 % Total scope 1 and 2 MWh 341,165 130,784 170,769 16,378 327 659,423 663,073 -0.6 % 2023 2022 Renewable energy share REMA 1000 Norway REMA 1000 Denmark Reitan Conv. Uno-X Mob. Other Reitan Retail Reitan Retail % point change Scope 1 renewable energy share 1 % 13.6% 19.5% 0.9% 3.9% 5.0% 10.2% 11.4 % -1.2% Scope 2 renewable energy share 1 % 90.4% 79.4% 73.0% 90.6% 91.6% 83.9% 81.1 % 2.8% Scope 1 and 2 renewable energy shares1 % 84.0% 73.6% 63.8% 79.1% 90.3% 76.6% 75.5 % 1.1% 1
o
Renewable energy share is based on the specific countries' share of electricity production from renewable sources according t
IEA.
2023 2022 Groundwater REMA 1000 Norway REMA 1000 Denmark Reitan Conv. Uno-X Mob. Other Reitan Retail Reitan Retail % change 303-3 a. Water withdrawal megaliter 350 55 348 70 - 822 962 -14.5 % 303-4 a. Water discharge megaliter 12 55 305 70 - 442 853 -48.2 % 303-5 Water consumption megaliter 337 - 43 - - 380 109 248.5 %
5.5 GRI
The table above showcase waste generated in our operations and upstream activities, producing and distributing food, beverage and fuel products (input). Waste generated in our operations have seen an increase from last year because of improved data gathering m ethods and an increase in number of units reporting waste. At Uno -X Mobility the high rate of establishment of ultrafast EV chargers and Nordic Swan ecolabelled car washes cause an increase in the removal of non -contaminated soil to landfills. In general, Reitan Convenience as a business area is largely dependent on estimations, which need to be further addressed in the upcoming years for satisfactory result. The variable presentation of total wastewater is explained in the reporting methodology per business area.
We will further enhance our waste reporting procedures and focus on units with inadequate waste reporting practices to standa rdise the quality of reporting across all our subsidiaries.
1 Organic waste generated offsite (output) is estimated based on the national statistics for food waste, multiplied by the mark et share for REMA 1000 in Norway and Denmark respectively. For Reitan Convenience, it is presumed that food waste at the consumer level is lowe r compared to REMA 1000, given the nature of their operations. To reflect the convenience sector, national statistics stating the amount of total waste from the Service and Convenience Goods industry in Norway was retrieved and applied as a mu ltiplicator. The equation provides an estimate of the food waste generated at the consumer end (e.g., thrown away or not fully consumed) from Reitan Convenience's sold food products. T his indicator was not available for all geographical locations across Reitan Convenience. As such, most of the estimates are based on the N orwegian statistic multiplied with the countries market share.
Reitan Retail is continuously improving our efforts with regards to data collection, meaning that the actual change from year to year cannot always be inferred directly from the numbers. An increase or decrease can be a result of improvements in data collection. The table above is an example of this, where the data collection has improved in 2023.
233 232 Our responsibility Our business Corporate governance Financial statements Appendix Annual Report 2023 16 GRI 306-3, -4, -5 Waste generated in our operations diverted and directed to disposal 2023 2022 Waste generated in our operations REMA 1000 Norway REMA 1000 Denmark Reitan Conv. Uno-X Mob. Other Reitan Retail Reitan Retail % change Residual waste, incinerated tonnes 5,422 6,375 7,748 5 78 19,628 21,910 -10% Hazardous waste, incinerated tonnes 53 - 358 50 - 461 10 4510% Other waste, incinerated tonnes 148 29 100 15 - 292 1,373 -79% Organic waste, recycled tonnes 5,586 3,784 2,106 - 28 11,504 8,758 31% Paper and cardboard, recycled tonnes 23,231 23,055 3,779 1 76 50,142 49,884 1% Hazardous waste, recycled tonnes 57 - - - - 57 96 -41% Plastic waste, recycled tonnes 1,906 2,742 764 - 3 5,415 3,602 50% Other waste, recycled tonnes 7,508 1,288 1,500 4 19 10,319 9,673 7% Other waste, landfill tonnes 11 - 2,015 10,252 - 12,278 2,589 374% Total waste generated in operations tonnes 43,922 37,273 18,370 10,327 204 110,096 97,895 12% Total waste, recycled tonnes 38,288 30,869 8,149 5 126 77,437 72,013 8% Share recycled of total waste generated % 87% 83% 44% 0% 62% 70% 74%Total wastewater megaliter 12 55 305 70 - 442 853 -48%
2023 2022 Offsite REMA 1000 Norway REMA 1000 Denmark Reitan Conv. Uno-X Mob. Other Reitan Retail Reitan Retail % change Organic waste, treated 1 tonnes 51,251 40,040 40,467 - - 131,758 98,783 33% Plastic waste, recycled tonnes 4,068 191 149 380 - 4,788 4,456 7% Other waste, recycled tonnes 5,432 - 7,395 507 - 13,334 5,874 127% Residual waste, incinerated tonnes - 199 - - - 199 4 4875% Other waste, incinerated tonnes 648 - 6 - - 654 2,239 -71% Total waste directed to disposal tonnes 61,399 40,430 48,017 887 - 150,733 111,356 35% Total waste, recycled tonnes 9,500 191 7,544 887 - 18,122 10,330 75%
5.5 GRI 17 GRI 305-7 Nitrogen oxides (NOx), sulfur oxides (SOx), and other significant air emissions, Scope 1 2023 2022 REMA 1000 Norway REMA 1000 Denmark Reitan Conv. Uno-X Mob. Other Reitan Retail Reitan Retail % change NOx kg 12,846 6,294 3,254 1,872 1 24,267 30,893 -21% SOx kg 202 13 3 3 - 221 50 342% VOC kg 554 1,155 1,415 - 2 3,126 2,784 12% TSP/PM kg 276 132 72 - - 480 485 -1% For
significant air e missions resulting
sale of fossil fuels in scope 3 category (Use of sold products), please refer to Uno-X Mobility's Annual and Sustainability Report 2023.
Number of sales outlets 31.12 Number supported by a commercial or public recycling system Number with in-store sorting facilities REMA 1000 NORWAY 674 674 668 Share of total sales outlets 100% 99% REMA 1000 DENMARK 372 372 372 Share of total sales outlets 100% 100% REITAN CONVENIENCE 1,769 1,227 1,096 Share of total sales outlets 69% 62% Reitan Convenience Norway 349 349 349 Reitan Convenience Sweden 388 249 152 Reitan Convenience Denmark 175 175 163 R-kioski Oy 379 276 276 Reitan Convenience Estonia 82 42 35 Reitan Convenience Latvia 221 93 93 Reitan Convenience Lithuania 175 43 28 UNO-X MOBILITY N/A N/A N/A REITAN RETAIL 2,815 2,273 2,136 Share of total sales outlets 81% 76%
2023 2022 Country Number of saved products Number of saved products Norway 1,792,425 29,880 Sweden 318,176 213,649 Denmark 782,354 254,308 Finland 508,043 316,013 Latvia 114,231 54,961 Estonia 162,136 87,160 Lithuania 245,420Total 3,922,785 955,971
information on significant air emissions, such as Nitrogen oxides (NOx), sulfur oxides (SOx), and other
from the
Own GRI – Waste sorting in sales outlets
Own GRI - Food waste reduction actions
Health disclosures
1 REMA 1000 Norway: Includes fresh and frozen fruit, vegetables, and berries. Additionally 100 percent juice and smoothies are included. REMA 1000 Denmark: Fresh fruit, vegetables and berries.
2 REMA 1000 Norway: Products labelled with Grovhetsskalaen and other whole grain products with keyhole label. REMA 1000 Denmark: Products labelled with Fuldkornsmærket.
3 REMA 1000 Norway: 100 percent fish and seafood products, fresh and frozen fish, as well as keyhole labelled fish and seafood products. REMA 1000 Denmark: Keyhole labelled fish and seafood products.
4 All keyhole labeled products not included in the rows above.
5 Other edible products includes both edible and drinkable products
2,261
Håndballandslagene i Norge
Oslo Maraton
Drammen halvmaraton
Aktiv mot kreft Physical health DUO day Mental health
Norges Musikkorpsforbund Physical health MOT Norge Mental health
REMA 1000 Trondheim Håndballcup Physical health Prästbyrån Mental health
REMA 1000 Håndballskoler Physical health The Danish Cancer Society Disease prevention
Stine Sofie Stiftelsen Mental health SUL Disease prevention
REMA 1000 DK
Danish Football Unions' Football Schools Physical health Uno-X Mobiliy
Fødevarepartnerskabet - for sundhed og klima Physical health Norwegian Cycling Union Physical health
REMA 1000 Sport Camp Physical health Cycling Clubs Physical health
REMA 1000 Aqua Camp Physical health Johannes Høsflot Klæbo Physical health
SSA Sports- og Sundhedsakadamiet Physical health Johannes Thingnæs Bø and NSSF Physical health
Cooking schools Physical health Norwegian gymnasts national team Physical health
Madkulturen Physical health Team Rytger Physical health
Fuldkornspartnerskabet Physical health Danish Cycling Union Physical health
Alt for Damernes Kvindeløb Physical health MOT Mental health
MOT Mental health
The national society LEV Mental health
Smoke Free Future Disease prevention
Danish Cancer Society Disease prevention
Dementia Friend Disease prevention
The Danish Multiple Sclerosis Society Disease prevention
The Danish Diabetes Association Disease prevention
235 234 Our responsibility Our business Corporate governance Financial statements Appendix
GRI - Sale of healthier food and drink options in REMA 1000 Norway and REMA 1000 Denmark Healthier options 2023 2022 Figures in mill. Systemwide sales Share Units Share Systemwide sales Share Units Share Fruit, vegetables and berries 1 10,260 14.0% 593 18.7% 9,027 14.1% 605 19.3% Whole grain products 2 2,062 2.8% 94 3.0% 1,677 2.6% 88 2.9% Fish and seafood 3 2,210 3.0% 55 1.7% 1,991 3.1% 55 1.7% Other keyhole labelled products 4 6,805 9.2% 268 8.4% 5,931 9.3% 265 8.4% Healthier options in REMA 1000 21,337 29.0% 1,010 31.8% 18,626 29.1% 1,013 32.3% Other edible products 5 52,236 71.0% 2,162 68.2% 45,364 70.9% 2,125 67.7% Total edible products 73,573 100.0% 3,172 100.0% 63,991 100.0% 3,138 100.0%
Own
Keyhole labelled products 2023 2022 Figures in mill. Systemwide sales Share Units Share Systemwide sales Share Units Share Keyhole - private label 7,033 9.6% 265 8.3% 5,900 9.2% 249 7.9% Keyhole - brand label 6,849 9.3% 465 14.7% 5,948 9.3% 470 15.0% Keyhole labelled products 13,882 18.9% 730 23.0% 11,848 18.5% 719 22.9% Other edible products 59,691 81.1% 2,443 77.0% 52,142 81.5% 2,419 77.1% Total edible products 73,573 100.0% 3,172 100.0% 63,991 100.0% 3,138 100.0%
keyhole labelled products were available in REMA 1000 Norway and Denmark during 2023. As at 31 December 2023, 1,172 keyhole labelled products were available. Organic products 2023 2022 Figures in mill. Systemwide sales Share Units Share Systemwide sales Share Units Share Organic - private label 1,428 1.9% 83 2.6% 1,022 1.6% 74 2.3% Organic - brand label 2,087 2.8% 113 3.5% 2,074 3.2% 117 3.7% Total organic products 3,516 4.7% 195 6.1% 3,096 4.8% 190 6.0% Other edible products 70,057 95.3% 2,977 93.9% 60,895 95.2% 2,948 94.0% Total edible products 73,573 100.0% 3,172 100.0% 63,991 100.0% 3,138 100.0% 1,721 organic products were available in REMA 1000 Norway and Denmark during 2023. As at 31 December 2023, 698 organic products were available.
5.5 GRI Annual Report 2023 6 Own GRI - Participants on camps and schools held, promoting well -being Main collaborations and activities from each business area 2023 2022 REMA 1000 NO Handball schools during school vacations 5,239 7,925 National tournament for adapted handball and football 1,625Camp Sagosen 200REMA 1000 DK Cooking schools 1,746 1,422 DBU Football schools 26,899 24,700 REMA 1000 Sports Camp 1,737 371 REMA 1000 Aqua Camp 6,390 6,163 REMA 1000 Tennis Camp 253 265 SSA Sports- og Sundhedsakadamiet 375 361 Other - 596 Reitan Convenience Sport camps and Sustainability lectures 455 225 Uno-X Mobility Biathlethe with MOT 300 300 Reitan Retail - Participants on camps and schools held, promoting well-being 45,219 42,328 Own GRI - Health promoting collaborations and activities Main collaborations and activities in the business areas REMA 1000 NO REMA 1000
Physical health Reitan Convenience Idrett
Physical health Stebby Physical health Pur
Physical
Physical health
Hjerteligaen
for alle-brødet
Vinterglede
health Walk15
Physical health
Physical health Maternity Hospital Fund
Physical health
Physical health TV Aksjonen NRK
Mental health
Physical health MOT Latvija
People disclosures
237 236 Our responsibility Our business Corporate governance Financial statements Appendix 9
- Campaigns promoting healthier options in Reitan Convenience The respective Reitan Convenience subsidiaries have individually defined healthier options with associated promotions and cam paigns. All convenience countries are prioritising food and are gradually improving the assortment going from red meat to white meat and plant based. 2023 2022 Total campaigns Campaigns healthier options Share healthier campaigns Total campaigns Campaigns healthier options Share healthier campaigns Reitan Convenience Norway 54 16 30% 156 22 14% Reitan Convenience Sweden 26 8 31% 34 9 26% Reitan Convenience Denmark 48 11 23% 49 34 69% R-kioski Oy 88 24 27% 100 30 30% Reitan Convenience Estonia 76 14 18% 20 6 30% Reitan Convenience Latvia 20 8 40% 14 5 36% Reitan Convenience Lithuania 9 4 44% 19 4 21% Reitan Convenience - total 321 85 26% 392 110 28% 5.5 GRI Annual Report 2023 GRI 401 Employment Employees in the company, not including franchisees and their store personnel. The data is compiled by the use of head count at the end of the reporting period. 401-1 a. New employee hires 2023 2022 Age and gender REMA 1000 REMA 1000 Reitan Uno-X Other Reitan Reitan NO DK Conv. Mobility Retail Retail Women Men Women Men Women Men Women Men Women Men Women Men Women Men <18 10% 11% 9% 10% 3% 5% 0% 2% 0% 22% 5% 9% 7% 6% 19-29 50% 44% 51% 53% 70% 76% 17% 44% 33% 28% 62% 56% 59% 58% 30-39 24% 20% 14% 16% 8% 11% 21% 14% 42% 22% 11% 16% 13% 20% 40-49 10% 13% 13% 11% 8% 6% 25% 19% 17% 17% 10% 10% 8% 10% 50-59 5% 12% 8% 6% 7% 1% 33% 13% 8% 11% 8% 6% 9% 4% >60 1% 0% 5% 4% 4% 1% 4% 8% 0% 0% 4% 3% 4% 2% New employee hires by gender 143 280 578 834 1,389 322 24 52 12 18 2,146 1,506 1,810 1,295 Gender in share of total 34% 66% 41% 59% 81% 19% 32% 68% 40% 60% 59% 41% 58% 42% Total employee hires 423 1,412 1,711 76 30 3,652 3,105 401-1 b. Employee turnover 2023 2022 Age and gender REMA 1000 REMA 1000 Reitan Uno-X Other Reitan Reitan NO DK Conv. Mobility Retail Retail Women Men Women Men Women Men Women Men Women Men Women Men Women Men <18 11% 7% 9% 8% 3% 5% 0% 0% 14% 11% 5% 7% 5% 4% 19-29 59% 47% 62% 58% 60% 77% 29% 24% 29% 33% 60% 57% 57% 58% 30-39 18% 19% 13% 19% 8% 7% 22% 24% 43% 56% 9% 17% 13% 21% 40-49 4% 13% 11% 8% 9% 5% 21% 24% 14% 0% 9% 9% 10% 9% 50-59 6% 9% 4% 4% 9% 3% 21% 17% 0% 0% 8% 6% 9% 5% >60 2% 5% 1% 3% 11% 3% 7% 11% 0% 0% 9% 4% 6% 3% Employee turnover by gender -115 -329 -267 -525 -1,456 -281 -14 -51 -7 -9 -1,859 -1,195 -1,346 -906 Gender in share of total 26% 74% 34% 66% 84% 16% 22% 78% 44% 56% 61% 39% 60% 40% Total employee turnover -444 -792 -1,737 -65 -16 -3,054 -2,252 401-3 Parental leave 2023 2022 REMA 1000 REMA 1000 Reitan Uno-X Other Reitan Reitan NO DK Conv. Mobility Retail Retail Women Men Women Men Women Men Women Men Women Men Women Men Women Men Employees entitled to parental leave1 N/A N/A N/A N/A N/A N/A N/A N/A N/A N/A N/A N/A N/A N/A Employees on parental leave 32 60 40 50 40 6 6 6 2 2 120 124 102 77 Employees returned in the reporting period after parental leave ended 18 52 37 17 18 5 4 6 2 1 79 81 54 67 Return to work rate 95% 91% 93% 34% 90% 100% 100% 100% 100% 100% 93% 68% 81% 96% Return to work rate - total 92% 60% 92% 100% 100% 78% 88% Employees employed 12 months after their parental leave ended 17 31 17 23 15 4 3 9 2 0 54 67 81 86 Retention rate 82% 90% 94% 83% 87% 100% 100% 100% 100% 0% 89% 90% 77% 74% Retention rate - total 88% 88% 89% 100% 100% 89% 75% 1 Due to country specific parental leave regulations and GDPR, it is not possible to collect the exact number of employees that were entitled to parental leave
Own GRI
403-10 Work-related
403-6 Promotion of worker health
In addition to regulatory occupational injury insurance, companies may provide access to extended medical and healthcare serv ices, through partnerships and insurances.
2023
Share of employees 1 with extended medical and healthcare services through company insurances
Share of workers who are not employees2 with extended medical and healthcare services through company insurances
1 Employees in the company, not including franchisees and their store personnel. 2 Franchisees and their store personnel. Reitan Retail does generally not hold information on additional insurance positions provided by the franchisees to their store personnel. 3 5,469 store personnel in REMA 1000 Denmark over the age of 20 have an extra health insurance through PFA (pension fund - Gjensidige insurance). 4 Uno-X Mobility Cycling have special insurance arrangements for all cyclists.
Employees in the company, not including franchisees and their store personnel.
1 Injuries from accidents in cycling are quite common, so the typical
Mobility business area.
GRI 405 Diversity and Equal Opportunity
403-8 Workers covered by an occupational health and safety management system All Reitan Retail's subsidiaries have company -specific standards for Health, Environment and Safety together with personnel handbooks outlining the employees' and workers' rights and obligations.
2023
Share of employees 1 included in a Group company's occupational health and safety management system
Share of workers who are not employees2 included in a Group company's occupational health and safety management system
1 Employees in the company, not including franchisees and their store personnel. 2 Franchisees and their store personnel. Reitan Retail includes standards for Health, Environment and Safety, including safety management systems in the franchise contracts.
403-9 Work-related injuries
Out of the 73 work -related injuries in 2023 the majority occurred as crush - or cut injuries, twisted limbs, falling i stairs and minor burns from boiling water. Number of injuries are reported in table with GRI 403 -10.
In 2023, one of our sales outlets in Sweden experienced an unfortunate incident involving personal injury. A member of the st ore staff was attacked and required emergency care for very serious injuries. The individual survived the attack. Reitan Convenience Sweden followed its regular emergency preparedness routines, with the company's emergency team handling the incident, following up the affected employee, family, c olleagues, and relevant authorities. The labour authorities did not find any wrongdoing on our part. Suitable measures, such as new risk assessment r egarding solo work have been implemented to mitigate the risk of similar incidents in the futu re.
Employees
239 238 Our responsibility Our business Corporate governance Financial statements Appendix 9 GRI 403 Occupational Health and Safety
REMA 1000 REMA 1000 Reitan Uno-X Other Reitan NO DK 3 Conv. Mobility 4 Retail
70% 61% 46% 98% 61% 60%
5% 36% 20% N/A N/A 21%
REMA 1000 REMA 1000 Reitan Uno-X Other Reitan NO DK Conv. Mobility Retail
100% 100% 100% 100% 100% 100%
100% 100% 100% 100% 100% 100%
5.5 GRI 1
ill
2023 2022 REMA 1000 REMA 1000 Reitan Uno-X Other Reitan Reitan NO DK Conv. Mobility 1 Retail Retail Work-related injuries 25 23 18 7 0 73 51 Number of sickness days 41,053 11,629 18,778 1,481 1,035 73,976 73,243 Sickness in percent of man-labour 8.6% 4.0% 17.0% 3.3% 6.6% 5.8% 5.9% Full-time equivalents in the year 2,006 1,257 1,915 299 63 5,540 5,230 Sickness in percent of man-labour last year 8.0% 5.5% 4.6% 1.6% 3.4% 5.9% 5.1%
health
injuries are not reported within Uno -X Mobility Cycling, part of the Uno -X
expected
405-1
governance
2023 2022 Age and gender REMA 1000 REMA 1000 Reitan Uno-X Other Reitan Reitan NO DK Conv. Mobility Retail Retail Women Men Women Men Women Men Women Men Women Men Women Men Women Men 19-29 3% 1% 0% 2% 5% 3% 0% 7% 0% 0% 3% 2% 5% 1% 30-39 20% 24% 7% 16% 21% 22% 38% 5% 0% 17% 20% 20% 21% 19% 40-49 28% 35% 53% 33% 44% 46% 31% 43% 71% 33% 39% 38% 39% 41% 50-59 41% 34% 40% 42% 25% 21% 25% 33% 29% 50% 32% 33% 30% 31% >60 8% 6% 0% 7% 5% 8% 6% 12% 0% 0% 6% 7% 5% 8% Governance bodies by gender 78 158 15 60 105 72 16 40 7 6 221 336 220 319 Gender in share of total 33% 67% 20% 80% 59% 41% 29% 71% 54% 46% 40% 60% 41% 59% Total governance bodies 236 75 177 56 13 557 539 Governance bodies are presented as the companies' management teams and managers with personnel responsibility. 405-1 b. Diversity of employees by gender and age 2023 2022 Age and gender REMA 1000 REMA 1000 Reitan Uno-X Other Reitan Reitan NO DK Conv. Mobility Retail Retail Women Men Women Men Women Men Women Men Women Men Women Men Women Men <18 3% 2% 6% 5% 2% 2% 0% 1% 5% 11% 3% 3% 3% 2% 19-29 21% 18% 39% 44% 42% 42% 13% 24% 19% 24% 36% 31% 34% 30% 30-39 28% 25% 19% 21% 14% 22% 26% 18% 37% 26% 18% 23% 18% 24% 40-49 22% 27% 17% 15% 13% 20% 17% 20% 20% 26% 16% 21% 16% 22% 50-59 21% 21% 13% 10% 16% 11% 33% 25% 17% 13% 17% 16% 18% 16% >60 5% 7% 6% 5% 13% 3% 11% 12% 2% 0% 10% 6% 11% 6% Employment by gender 725 1,530 847 1,176 1,988 503 99 212 41 38 3,700 3,459 3,424 3,143 Gender in share of total 32% 68% 42% 58% 80% 20% 32% 68% 52% 48% 52% 48% 52% 48% Total employees 2,255 2,023 2,491 311 79 7,159 6,567
a. Diversity of
bodies
franchisees
store
in the company, not including
and their
personnel.
405-2 Ratio of basic salary and remuneration of women to men
By law, all employers in Norway, regardless of size, have a duty to work actively, purposefully and plan to promote equality and prevent discrimination in the workplace. Equal pay reporting is part of the obligations related to Workplace Equality & Diversity Reporting (Aktivitets - og redegjørelsesplikten, ARP). Our Norwegian companies, of which are legally bound by the law, report individual ARPs.
Reitan Retail as a group aim to work systematically to correct pay differences between genders in all employment categories, with particular focus on management level. The companies in our organisation have various areas of improvement, and each shall continue to work with c oncrete and specific measures that address the challenges we face. This work will continue in 2024 and be presented in 2025.
As in 2022, Reitan Retail also collected data on equal pay per employment category in 2023. All companies within the Group
nducted separate assessments on equal pay based on remuneration data and gender composition, and reported on relevant employment categories. I n total, 39 companies reported 107 data points throughout the Group, providing us with a valuable foundation to guide our efforts towards equal pay and opportunities for all, utilising the data collected in both years.
Below, in the table, we have defined equal pay as within a 5 percentile range, above and below
The
points where women have higher salary and compensation than men, while the
more than women. Data points reported on equal pay in Reitan Retail 2023
241 240 Our responsibility Our business Corporate governance Financial statements Appendix Annual Report 2023 2 405-1 b. Diversity of employees by gender and employment category 2023 2022 Employment category REMA 1000 REMA 1000 Reitan Uno-X Other Reitan Reitan NO DK Conv. Mobility Retail Retail Women Men Women Men Women Men Women Men Women Men Women Men Women Men Managers - Own operated outlets 1% 0% 0% 0% 6% 3% 0% 0% 2% 3% 4% 1% 5% 1% Co-workers - Other 1% 0% 0% 0% 0% 0% 10% 19% 0% 0% 0% 1% 0% 1% Co-workers - Distribution 18% 50% 31% 57% 4% 6% 0% 1% 0% 0% 13% 43% 14% 47% Co-workers - Production facilities 23% 15% 0% 0% 4% 1% 0% 12% 0% 0% 6% 8% 7% 9% Co-workers - Office 25% 10% 26% 10% 11% 13% 64% 33% 41% 39% 19% 12% 20% 13% Co-workers - With resp area 11% 9% 2% 2% 5% 15% 10% 16% 20% 13% 6% 8% 5% 9% Managers 8% 8% 2% 5% 3% 6% 9% 8% 7% 13% 4% 6% 4% 6% Management 2% 3% 0% 1% 2% 8% 7% 11% 10% 3% 2% 3% 3% 4% Employment by gender 725 1,530 847 1,176 1,988 503 99 212 41 38 3,700 3,459 3,424 3,143 Gender in share of total 32% 68% 42% 58% 80% 20% 32% 68% 52% 48% 52% 48% 52% 48% Total employees 2,255 2,023 2,491 311 79 7,159 6,567 Employees in the company, not including franchisees and their store personnel. 405-1 b. Diversity of employees by gender and employment type 2023 2022 Employment type REMA 1000 REMA 1000 Reitan Uno-X Other Reitan Reitan NO DK Conv. Mobility Retail Retail Women Men Women Men Women Men Women Men Women Men Women Men Women Men Permanent employment 89% 88% 98% 97% 88% 85% 96% 98% 95% 92% 91% 91% 90% 89% Temporary employment 6% 8% 2% 3% 1% 1% 0% 0% 3% 8% 2% 5% 3% 6% Non-guaranteed hours employees1 5% 4% 0% 0% 11% 14% 4% 2% 2% 0% 7% 4% 7% 5% Employment by gender 725 1,530 847 1176 1,988 503 99 212 41 38 3,700 3,459 3,424 3,143 Gender in share of total 32% 68% 42% 58% 80% 20% 32% 68% 52% 48% 52% 48% 52% 48% Total employees 2,255 2,023 2,491 311 79 7,159 6,567 Employees in the company, not including franchisees and their store personnel. 405-1 b. Diversity of employees by gender and employment capacity 2023 2022 Employment capacity REMA 1000 REMA 1000 Reitan Uno-X Other Reitan Reitan NO DK Conv. Mobility Retail Retail Women Men Women Men Women Men Women Men Women Men Women Men Women Men Part-time 22% 18% 43% 31% 49% 44% 11% 4% 34% 45% 41% 26% 25% 21% Full-time 78% 82% 57% 69% 51% 56% 89% 96% 66% 55% 59% 74% 75% 79% Employment by gender 725 1,530 847 1176 1,988 503 99 212 41 38 3,700 3,459 3,424 3,143 Gender in share of total 32% 68% 42% 58% 80% 20% 32% 68% 52% 48% 52% 48% 52% 48% Total employees 2,255 2,023 2,491 311 79 7,159 6,567 Employees in the company, not including franchisees and their store personnel. 5.5 GRI 3
co
1.
column labeled <1.05 in dicates the count of data
column labeled >0.95 indicates the count of data p oints where men earn
Equal pay 0.95-1.05 Women higher pay <1.05 Men higher pay >0.95 Total Co-workers - Company operated outlets 3 2 1 6 Managers - Company operated outlets 2 0 2 4 Co-workers - Other 0 1 0 1 Co-workers - Warehouse/Distribution 2 1 5 8 Co-workers - Production facilities 2 2 4 8 Co-workers - Office 3 2 19 24 Co-workers - With responsibility area 4 3 11 18 Managers 3 5 10 18 Management 2 5 13 20 Total data points 21 21 65 107 Share of data points per pay category 20% 20% 61% 100% Shares of data points reported on equal pay in Reitan Retail Equal pay 0.95-1.05 Women higher pay <1.05 Men higher pay >0.95 Total Co-workers - Company operated outlets 50% 33% 17% 100% Managers - Company operated outlets 50% 0% 50% 100% Co-workers - Other 0% 100% 0% 100% Co-workers - Warehouse/Distribution 25% 13% 62% 100% Co-workers - Production facilities 25% 25% 50% 100% Co-workers - Office 13% 8% 79% 100% Co-workers - With responsibility area 22% 17% 61% 100% Managers 17% 28% 55% 100% Management 10% 25% 65% 100% Own GRI - Diversity of managers and management 2023 2022 Managers and management REMA 1000 REMA 1000 Reitan Uno-X Other Reitan Reitan NO DK Conv. Mobility Retail Retail Women Men Women Men Women Men Women Men Women Men Women Men Women Men New hires by gender 42% 58% 17% 83% 71% 29% 28% 72% 67% 33% 42% 58% 42% 58% Number of new hires 36 24 28 18 3 109 88 Turnover by gender 15% 85% 20% 80% 74% 26% 11% 89% 100% 0% 50% 50% 50% 50% Total turnover -20 -5 -47 -9 -1 -82 -46 Total by gender 33% 67% 20% 80% 59% 41% 29% 71% 54% 46% 40% 60% 41% 59% Total managers and management 236 75 177 56 13 557 539
243 242 Our responsibility Our business Corporate governance Financial statements Appendix 5.5 GRI Annual Report 2023 4 Own GRI - Diversity in Board of Directors 2023 2022 Age and gender REMA 1000 REMA 1000 Reitan Uno-X Other Reitan Reitan NO DK Conv. Mobility Retail Retail Women Men Women Men Women Men Women Men Women Men Women Men Women Men 19-29 5% 0% 0% 0% 0% 0% 0% 0% 0% 0% 1% 0% 0% 0% 30-39 5% 13% 0% 0% 2% 0% 0% 3% 14% 0% 3% 6% 0% 12% 40-49 32% 39% 25% 10% 59% 37% 9% 63% 14% 25% 41% 43% 52% 31% 50-59 47% 37% 75% 70% 39% 21% 91% 34% 57% 50% 51% 37% 40% 45% >60 11% 11% 0% 20% 0% 42% 0% 0% 15% 25% 4% 14% 8% 12% Board of Directors by gender 19 46 4 10 41 19 11 41 7 8 82 124 64 131 Gender in share of total 29% 71% 29% 71% 68% 32% 21% 79% 47% 53% 40% 60% 33% 67% Total Board of Directors 65 14 60 52 15 206 195 Number of internal boards 1) 11 3 11 10 3 38Share with 40/60 balance 55% 33% 36% 10% 0% 32%1) Boards with three or more members. Reitan Retail aims for the boards in the business area s with their respective subsidiaries to have a gender balance of 40 -60 percent by the end of 2024. Reitan Retail AS' Board of Directors consists of three men in the age intervals 40 -49, 50-59 and >60. See pages 77-78 for more information.
GRI index
Statement of use Reitan Retail AS has reported in accordance with the GRI Standards for the period January 1, 2023 to December 31, 2023
GRI 1 used GRI 1: Foundation 2021
Applicable GRI Sector Standard(s) No applicable GRI Sector Standards in this report. Uno-X Mobility report on GRI 11 Oil and gas. REMA 1000 Norway report on GRI 13 Agriculture, aquaculture, and fishing.
GRI standard/ other source Disclosure Location Omission
Requirement(s)
2-1 Organizational details a. Reitan Retail AS (family owned) b. Business overview pages 14-15 c. Contact page 250 d. Business overview pages 14-15
A gray cell indicates that reasons for omission are not permitted for the disclosure or that a GRI Sector Standard reference number is not available.
2-2 Entities included in the organisation’s sustainability reporting
a.-c. Greenhouse gas accounting methodology pages 208-220 and Global reporting initiative standards page 224 c. iii. Due to company structure, there are relevant sector standard disclosures. GRI 11 sector standard is reported for by Uno-X Mobility and GRI 13 for REMA 1000 Norway
2-3 Reporting period, frequency and contact point January 1, 2023 - December 31, 2023
Annual reporting Published April 30, 2024 inger.sethov@reitanretail.no
2-4 Restatements of information Carbon accounting principles and reporting methodology page 209
2-5 External assurance Financial assurance statement by EY pages 179-181 Greenhouse gas accounting verification statement by DNV pages 222-223
GRI 2: General Disclosures
2-6 Activities, value chain and other business relationships
b. iii Reitan Retail’s greenhouse gas emissions data (Scope 1, 2 and 3) is verified by DNV with limited assurance. The data has been verified according to requirements set out by the Greenhouse Gas Protocol and defined in ISO 14064-3:2019.
GRI indicators, other than greenhouse gas emissions, are not assured by third party.
a. Our business areas pages 20-29
Our role and responsibility page 32
2-6 c. Information unavailable/ incomplete Data missing or unavailalbe
b. Societal impact and value across the value chain pages 34-35
d. The inclusion of the ALDI acquisition in the carbon accounting will commence in 2024, with estimation of historical data back to the base year of 2022.
d. Our business areas pages 20-29
2-7 Employees a. - d. General disclosures page 226
e. No significant fluctuation in number of employees
2-8 Workers who are not employees a. - b. General disclosures pages 226-227
c. No significant fluctuation in number of workers who are not employees
2-7 a.-b. Information unavailable/ incomplete Partial omission. Data reported per business area not by region
GRI 2: General Disclosures 2021
2-9 Governance structure and composition a. Governing bodies pages 75-78 b. No committees in Reitan Retail in 2023 c. Governing bodies page 78
2-10 Nomination and selection of the highest governance body a. The board members of Reitan Retail AS are nominated and elected by the company’s owners, based on the expertise they consider relevant for Reitan Retail.
2-11 Chair of the highest governance body Chair of the Board is Rune Bjerke. He is not a senior executive in Reitan Retail.
2-12 Role of the highest governance body in overseeing the management of impacts Governing bodies pages 75-76 Double materiality analysis page 36
Stakeholder dialogue page 37
2-13 Delegation of responsibility for managing impacts Governing bodies pages 75-76 TCFD report
2-14 Role of the highest governance body in sustainability reporting Governing bodies pages 75-76 Governing bodies page 83 Greenhouse gas accounting methodology page 208 and Global reporting initiative standards page 224
2-15 Conflicts of interest Code of Conduct
Section 2 - Upholding this Code of Conduct, section 7 - Legal Compliance and Business Ethics and section 9 - Privacy, competition and confidentiality 2-15
2-16 Communication of critical concerns All critical concerns are reported to the Board of Directors Whistleblowing channel General disclosures page 228
2-16 b.
2-17 Collective knowledge of the highest governance body Board of Directors page 78 In 2024, changes will be made to the Board composition to enhance the collective knowledge on sustainable development.
2-18 Evaluation of the performance of the highest governance body
The evaluation of the Corporate Management Board (CMB) is overseen by the KPI scorecard of economic, environmental and social performance. The method for assessing performance is an outcome of collaboration between the Board of Directors and the CMB.
2-19 Remuneration policies Reitan Retail Note 9 - Salaries and personnel costs pages 126-127
GRI 2: General Disclosures 2021
2-20 Process to determine remuneration Remuneration of the CEO and Corporate Management Board should be competitive in the market and is linked both to company and individual performance.
2-21 Annual total compensation ratio General disclosures page 227
2-22 Statement on sustainable development strategy Letter from the CEO pages 8-13 Letter from the Chair page 74 2-23 Policy commitments Governing documents page 83 Governing documents approved by the Board of Directors: - Code of Conduct - Supplier Code of Conduct - Whistleblowing process - Anti fraud and anti corruption e. - f. The business areas’ CEO is responsibile for embedding policy documents in their respective organisations
unavailable/ incomplete
unavailable or incomplete.
245 244 Our responsibility Our business Corporate governance Financial statements Appendix GRI standard/ other source Disclosure Location Omission Requirement(s) omitted Reason Explanation
2-10 b. Information unavailable/ incomplete Partial omission
2-11 b. Not applicable Chair of the board is not a senior executive
2-14 b. Not applicable Highest governing body
responsible
is
Information
Information unavailable
unavailable/ incomplete
or incomplete
Information
Information
Information unavailable/ incomplete Partial omission
2-18 a.-c.
2-19
Information unavailable/ incomplete Partial omission
a.-b.
Not applicable Partial omission. Not a fixed policy standard in 2023
2-20 a.-b.
omitted Reason Explanation General disclosures
2021
5.5 GRI
2-24 Embedding policy commitments Governing documents page 83 The business areas’ CEO are responsibile for embedding policy documents in their respective organisations
2-25 Processes to remediate negative impacts Corporate governance pages 75-83 Value chain pages 66-71 Whistleblowing process Transparency Act
2-26 Mechanisms for seeking advice and raising concerns Whistleblowing channel Whistleblowing process General disclosures page 228
Conduct
3-1 Process to determine material topics Our role and responsibility pages 32-39 A gray cell indicates that reasons for omission are not permitted for the disclosure or that a GRI Sector Standard reference number is not available.
3-2 List of material topics Double materiality analysis page 36 a. Table page 36 b. Text describing process of updating our sustainability strategy on page 36
3-3 Management of material topics Environment pages 40-43
302-1 Energy consumption within the organization Climate pages 42-44 Environmental disclosures page 231 f. - g. Carbon accounting priciples and reporting methodology page 208
302-2 Energy consumption outside of the organization Reitan Retail currently only take responsibility for energy consumption in companies where we have operational control.
302-3 Energy intensity
302-4 Reduction of energy consumption Climate page 42 Environmental disclosures page 231 The overall energy consumption has decreased slightly, but is in line with last year. Generally, the energy reduction from initiatives is less than the need of energy spanning from operational growth.
302-2 Information unavailable/ incomplete Reporting on energy consumption outside the operations will be looked into going forward
302-3 Information unavailable/ incomplete Energy intensity measurements will be established going forward
302-4 Information unavailable/ incomplete Detailed reduction in energy consumption will be looked into going forward
GRI 305: Emissions 2016
305-1 Direct (Scope 1) GHG emissions a. Greenhouse gas accounting page 206
b. Greenhouse gas accounting methodology page 208
d. Greenhouse gas accounting page 206
e. - g. Greenhouse gas accounting methodology pages 208-220
305-2 Energy indirect (Scope 2) GHG emissions a. Greenhouse gas accounting page 206
b. Greenhouse gas accounting methodology page 208
d. Greenhouse gas accounting page 206 e. - g. Greenhouse gas accounting methodology pages 208-220
305-3 Other indirect (Scope 3) GHG emissions a. Greenhouse gas accounting page 206
b. Greenhouse gas accounting methodology page 208
c. Uno-X Mobility Annual and Sustainability Report
e. Greenhouse gas accounting page 206
g. - f. Greenhouse gas accounting methodology pages 208-220
305-4 GHG emissions intensity
GRI 305: Emissions 2016
305-5 Reduction of GHG emissions Climate pages 42-44 a. Greenhouse gas accounting page 206
b. Greenhouse gas accounting methodology page 208
c. - d. Greenhouse gas accounting page 206
e. Greenhouse gas accounting methodology pages 208-220
305-7 Nitrogen oxides (NOx), sulfur oxides (SOx), and other significant air emissions Environmental disclosures page 233 Uno-X Mobility Annual and Sustainability Report
Foodwaste/Circularity and Waste Management
247 246 Our responsibility Our business Corporate governance Financial statements Appendix GRI standard/ other source Disclosure Location Omission Requirement(s) omitted Reason Explanation
305-1
Not applicable
biogenic emissions
c.
No
in scope 1
305-3 d. Not applicable Biogenic CO2 emissions is material in Uno-X Mobility
305-4 Information unavailable/ incomplete Emissions intensity measurements will be established going forward
GRI 301: Materials 2016 301-1 Materials used by weight
volume Environmental
page 230 301-2 Recycled input materials used Environmental
230 GRI 306: Waste 2020 306-1 Waste generation
significant waste-related impacts Environment pages 34-35 Environment pages 47-49 306-1 Information unavailable/ incomplete Information unavailable or incomplete 306-2 Management of significant waste-related impacts Environment pages 47-49 306-2 Information unavailable/ incomplete Information unavailable or incomplete 306-3 Waste generated Environmental disclosures page 232 306-4 Waste diverted from disposal Environmental disclosures page 232 306-4 d.-e. Information unavailable/ incomplete Information unavailable or incomplete 306-5 Waste directed to disposal Environmental disclosures page 232 Own GRI Waste sorting in sales outlets Environmental disclosures page 233 Own GRI Food waste reduction actions Environmental disclosures page 233 GRI standard/ other source Disclosure Location Omission Requirement(s) omitted Reason Explanation GRI 2: General Disclosures 2021
or
disclosures
disclosures page
and
2-25 c. d. e. Information unavailable/ incomplete Partial omission
statement
GRI 2: General Disclosures 2021
228
General
page 229 2-30 Information unavailable/ incomplete Partial omission. See location Own GRI Political influence
lobbying activities General disclosures page 229 This disclosure should
read
we
Material
2-27 Compliance with laws and regulations Statement of objections from the Norwegian competition authority page 91
2-28 Membership associations General disclosures page
2-29 Approach to stakeholder engagement Stakeholder dialogue page 37 2-30 Collective bargaining agreements
disclosures
and
be
as an effort to explain how
manage our public policy. Relating this disclosure to GRI 415, we as a company are politically independent. Code of
topics
GRI 3: Material Topics 2021
Environment
GRI 3: Material Topics 2021
GRI 302: Energy 2016
Climate Emissions
5.5 GRI
3: Material Topics 2021
3-3 Management of material topics Health pages 50-51
Healthier products
GRI 416: Customer Health and Safety 2016
416-1 Assessment of the health and safety impacts of product and service categories Health pages 50-53 Optimisation of recipes to contain fewer calories, less sugar, salt and saturated fat have top priority for private label products in Reitan Retail. Responsible procurement policy, including assessment of health will be implemented in 2024. Overall quantitative assessment is not executed.
Own GRI Sale of healthier food and drink options in REMA 1000 Norway and REMA 1000 Denmark Health disclosures page 234
Own GRI Participants on camps and schools held, promoting well-being Health disclosures page 235
Own GRI Health promoting collaborations and activities Health disclosures page 235
Own GRI Campaigns promoting healthier options in Reitan Convenience Health disclosures page 236 People
GRI 3: Material
to full-time employees that are not provided to temporary or part-time employees
We adhere to national and local legislations. We do not possess a full overview as detailed in the GRI Standard of this matter in our companies.
401-3 Parental leave People disclosures page 237
unavailable/ incomplete Information unavailable or incomplete
a. Legal prohibitions Data not collected due to GDPR GRI 403: Occupational Health and Safety 2018 403-6 Promotion of worker health
403-8 Workers covered by an occupational health and safety management system
People disclosures page 238
People disclosures page 238
Data on workrelated injuries to franchisees and their store personnel are unavailable.
Data unavailable 403-10
ill health People disclosures page 239
on workrelated ill health to franchisees and their store personnel are unavailable
Consolidated statement of profits or loss page 109 ii. Consolidated statement of financial position pages 111-112 iii. Consolidated statement of changes in equity page 113
201-2 Financial implications and other risks and opportunities due to climate change Risk and risk management pages 79-81 TCFD report
new policy on responsible procurement will be approved by the Board of Directors and adopted and implemented by the Corporate Management Board Board in 2024. The procurement policy will be implemented to keep our value chains reliable and support a continuous supply of goods and raw materials, while also ensuring that both natural and human resources are treated
249 248 Our responsibility Our business Corporate governance Financial statements Appendix GRI standard/ other source Disclosure Location Omission Requirement(s) omitted Reason Explanation
404:
2016 404-1 Average
per year per
Most of Reitan Retail's
training
undertake.
404-1 Information unavailable/ incomplete Information unavailable or incomplete 404-2 Programs
upgrading employee skills
programs Most of Reitan
data
training
employees
data will be
going forward. 404-2 Information unavailable/ incomplete Information unavailable or incomplete Equality,
GRI 405: Diversity and Equal Opportunity 2016 405-1 Diversity of governance bodies and employees People disclosures pages 239240 405-1 a.iii b.iii Legal prohibitions Data not collected due to GDPR 405-2 Ratio of basic salary and remuneration of women to men People disclosures page 241 405-2 Information unavailable/ incomplete Partial omission - Does not include data on significant location of operation Own GRI Diversity of managers People disclosures page 241 Own GRI Diversity in Board of Directors People disclosures page 242 Value Chain GRI 3: Material Topics 2021 3-3 Management of material topics Value Chain pages 66-67
GRI
Performance 2016 201-1
a. i.
GRI
Training and Education
hours of training
employee
companies gather data on hours of
their employees
Consolidated data will be considered going forward.
for
and transition assistance
Retail's companies gather
on hours of
their
undertake. Consolidated
considered
diversity, and inclusion
Responsible Business
201: Economic
Direct economic value generated and distributed
201-2
iii. v. Information unavailable/ incomplete Information unavailable or incomplete
Environmental Assessment 2016 308-1
A
308-1 Information unavailable/ incomplete We aim to
indicator
308-2 Negative environmental impacts in the supply chain
actions taken See 308-1 308-2 Information unavailable/ incomplete We aim
GRI 414: Supplier Social Assessment 2016 414-1 New suppliers that were screened using social criteria Transparency act page 201 See also 308-1 414-1 Information unavailable/ incomplete Partial omission. New suppliers included in total assessments reported 414-2 Negative social impacts in the supply chain and actions taken Transparency act pages 200203 GRI standard/ other source Disclosure Location Omission Requirement(s) omitted Reason Explanation GRI 303: Water effluents 303-1 Interactions with water as a shared resource Environmental disclosures page 231 303-2 Management
water dischargerelated impacts Environmental disclosures page 231 303-3 Water withdrawl Environmental disclosures page 231 303-4 Water discharge Environmental disclosures page 231 303-5 Water consumption Environmental disclosures
231 Health GRI
a.
Tracability, transparency and sustainable food production GRI 308: Supplier
New suppliers that were screened using environmental criteria
sustainably.
report on this
going forward.
and
to report on this indicator going forward.
of
page
416-1 Information unavailable/ incomplete Partial omission
Topics 2021 3-3 Management
material
People
54-55 Safe employer GRI 401: Employment 2016 401-1 New employee hires and employee turnover People disclosures page 237 401-1 Information unavailable/ incomplete Partial omissionData reported
business
not region
of
topics
pages
on
areas,
401-2 Benefits provided
401-2 Information
403-6 b. Information
401-3
Responsible employer page 56 People disclosures page 238
unavailable/ incomplete Partial omission - Complete list of health promoting services not proided
a.
c.
403-9
403-9 b.-e. Information
b.
403-10 b.-d. Information
b.
c.-d.
5.5 GRI
b. No workers are excluded
Work-related injuries People disclosures page 238
unavailable/ incomplete
c.-e.
Work-related
unavailable/ incomplete
Data
Data unavailable
Contact
Reitan Retail
Gladengveien 2, 0661 Oslo, Norway +47 24 09 85 55 post@reitanretail.no www.reitanretail.no
REMA 1000 Norway
Gladengveien 2, 0661 Oslo, Norway +47 24 09 85 55 kontakt@rema.no
REMA 1000 Denmark
Marsallé 32, 8700 Horsens, Denmark +47 24 09 85 55 kontakt@rema1000.dk
Reitan Convenience
Gladengveien 2, 0661 Oslo, Norway +47 24 09 85 55 post@reitanconvenience.no
Uno-X Mobility
Gladengveien 2, 0661 Oslo, Norway +47 24 09 85 55 post@unox.no
250
