INTELLIGENCE
THERMAL IMAGING
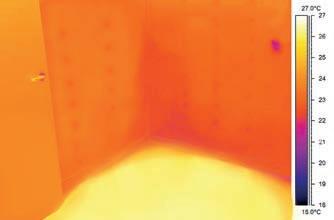
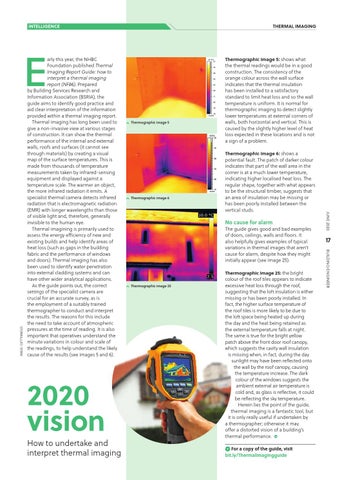
Thermographic image 5
Thermographic image 6
Thermographic image 5: shows what the thermal readings would be in a good construction. The consistency of the orange colour across the wall surface indicates that the thermal insulation has been installed to a satisfactory standard to limit heat loss and so the wall temperature is uniform. It is normal for thermographic imaging to detect slightly lower temperatures at external corners of walls, both horizontal and vertical. This is caused by the slightly higher level of heat loss expected in these locations and is not a sign of a problem. Thermographic image 6: shows a potential fault. The patch of darker colour indicates that part of the wall area in the corner is at a much lower temperature, indicating higher localised heat loss. The regular shape, together with what appears to be the structural timber, suggests that an area of insulation may be missing or has been poorly installed between the vertical studs.
No cause for alarm
2020 vision
Thermographic image 25: the bright colour of the roof tiles appears to indicate excessive heat loss through the roof, suggesting that the loft insulation is either missing or has been poorly installed. In fact, the higher surface temperature of the roof tiles is more likely to be due to the loft space being heated up during the day and the heat being retained as the external temperature falls at night. The same is true for the bright yellow patch above the front door roof canopy, which suggests the cavity wall insulation is missing when, in fact, during the day sunlight may have been reflected onto the wall by the roof canopy, causing the temperature increase. The dark colour of the windows suggests the ambient external air temperature is cold and, as glass is reflective, it could be reflecting the sky temperature. Herein lies the point of the guide, thermal imaging is a fantastic tool, but it is only really useful if undertaken by a thermographer; otherwise it may offer a distorted vision of a building’s thermal performance.
How to undertake and interpret thermal imaging
For a copy of the guide, visit bit.ly/Thermalimagingguide
17 ThermalImage.indd 17
Thermographic image 25
17 BUILDING ENGINEER
The guide gives good and bad examples of doors, ceilings, walls and floors. It also helpfully gives examples of typical variations in thermal images that aren’t cause for alarm, despite how they might initially appear (see image 25).
JUNE 2020
IMAGE: GETTYIMAGES
E
arly this year, the NHBC Foundation published Thermal Imaging Report Guide: how to interpret a thermal imaging report (NF86). Prepared by Building Services Research and Information Association (BSRIA), the guide aims to identify good practice and aid clear interpretation of the information provided within a thermal imaging report. Thermal imaging has long been used to give a non-invasive view at various stages of construction. It can show the thermal performance of the internal and external walls, roofs and surfaces (it cannot see through materials) by creating a visual map of the surface temperatures. This is made from thousands of temperature measurements taken by infrared-sensing equipment and displayed against a temperature scale. The warmer an object, the more infrared radiation it emits. A specialist thermal camera detects infrared radiation that is electromagnetic radiation (EMR) with longer wavelengths than those of visible light and, therefore, generally invisible to the human eye. Thermal imagining is primarily used to assess the energy efficiency of new and existing builds and help identify areas of heat loss (such as gaps in the building fabric and the performance of windows and doors). Thermal imaging has also been used to identify water penetration into external cladding systems and can have other wider analytical applications. As the guide points out, the correct settings of the specialist camera are crucial for an accurate survey, as is the employment of a suitably trained thermographer to conduct and interpret the results. The reasons for this include the need to take account of atmospheric pressures at the time of reading. It is also important that operatives understand the minute variations in colour and scale of the readings, to help understand the likely cause of the results (see images 5 and 6).
18/05/2020 11:03