
Waterfront Report THE MOST COVETED PROPERTY LIFESTYLE 2023 rsirwaterfront.com Nothing Compares
TABLE OF CONTENTS
What's Ahead
County Overviews
Seattle | Ballard & Magnolia
Seattle | Northwest Lake Washington
Seattle | Southwest Lake Washington
Seattle | West Seattle
Bainbridge Island
Bellevue
Camano Island
Four Points
Gig Harbor & Fox Island
Kirkland
Kitsap County
Mercer Island
Port Angeles
Redmond
Renton
Sammamish & Issaquah
San Juan Islands
Sequim
What's Ahead
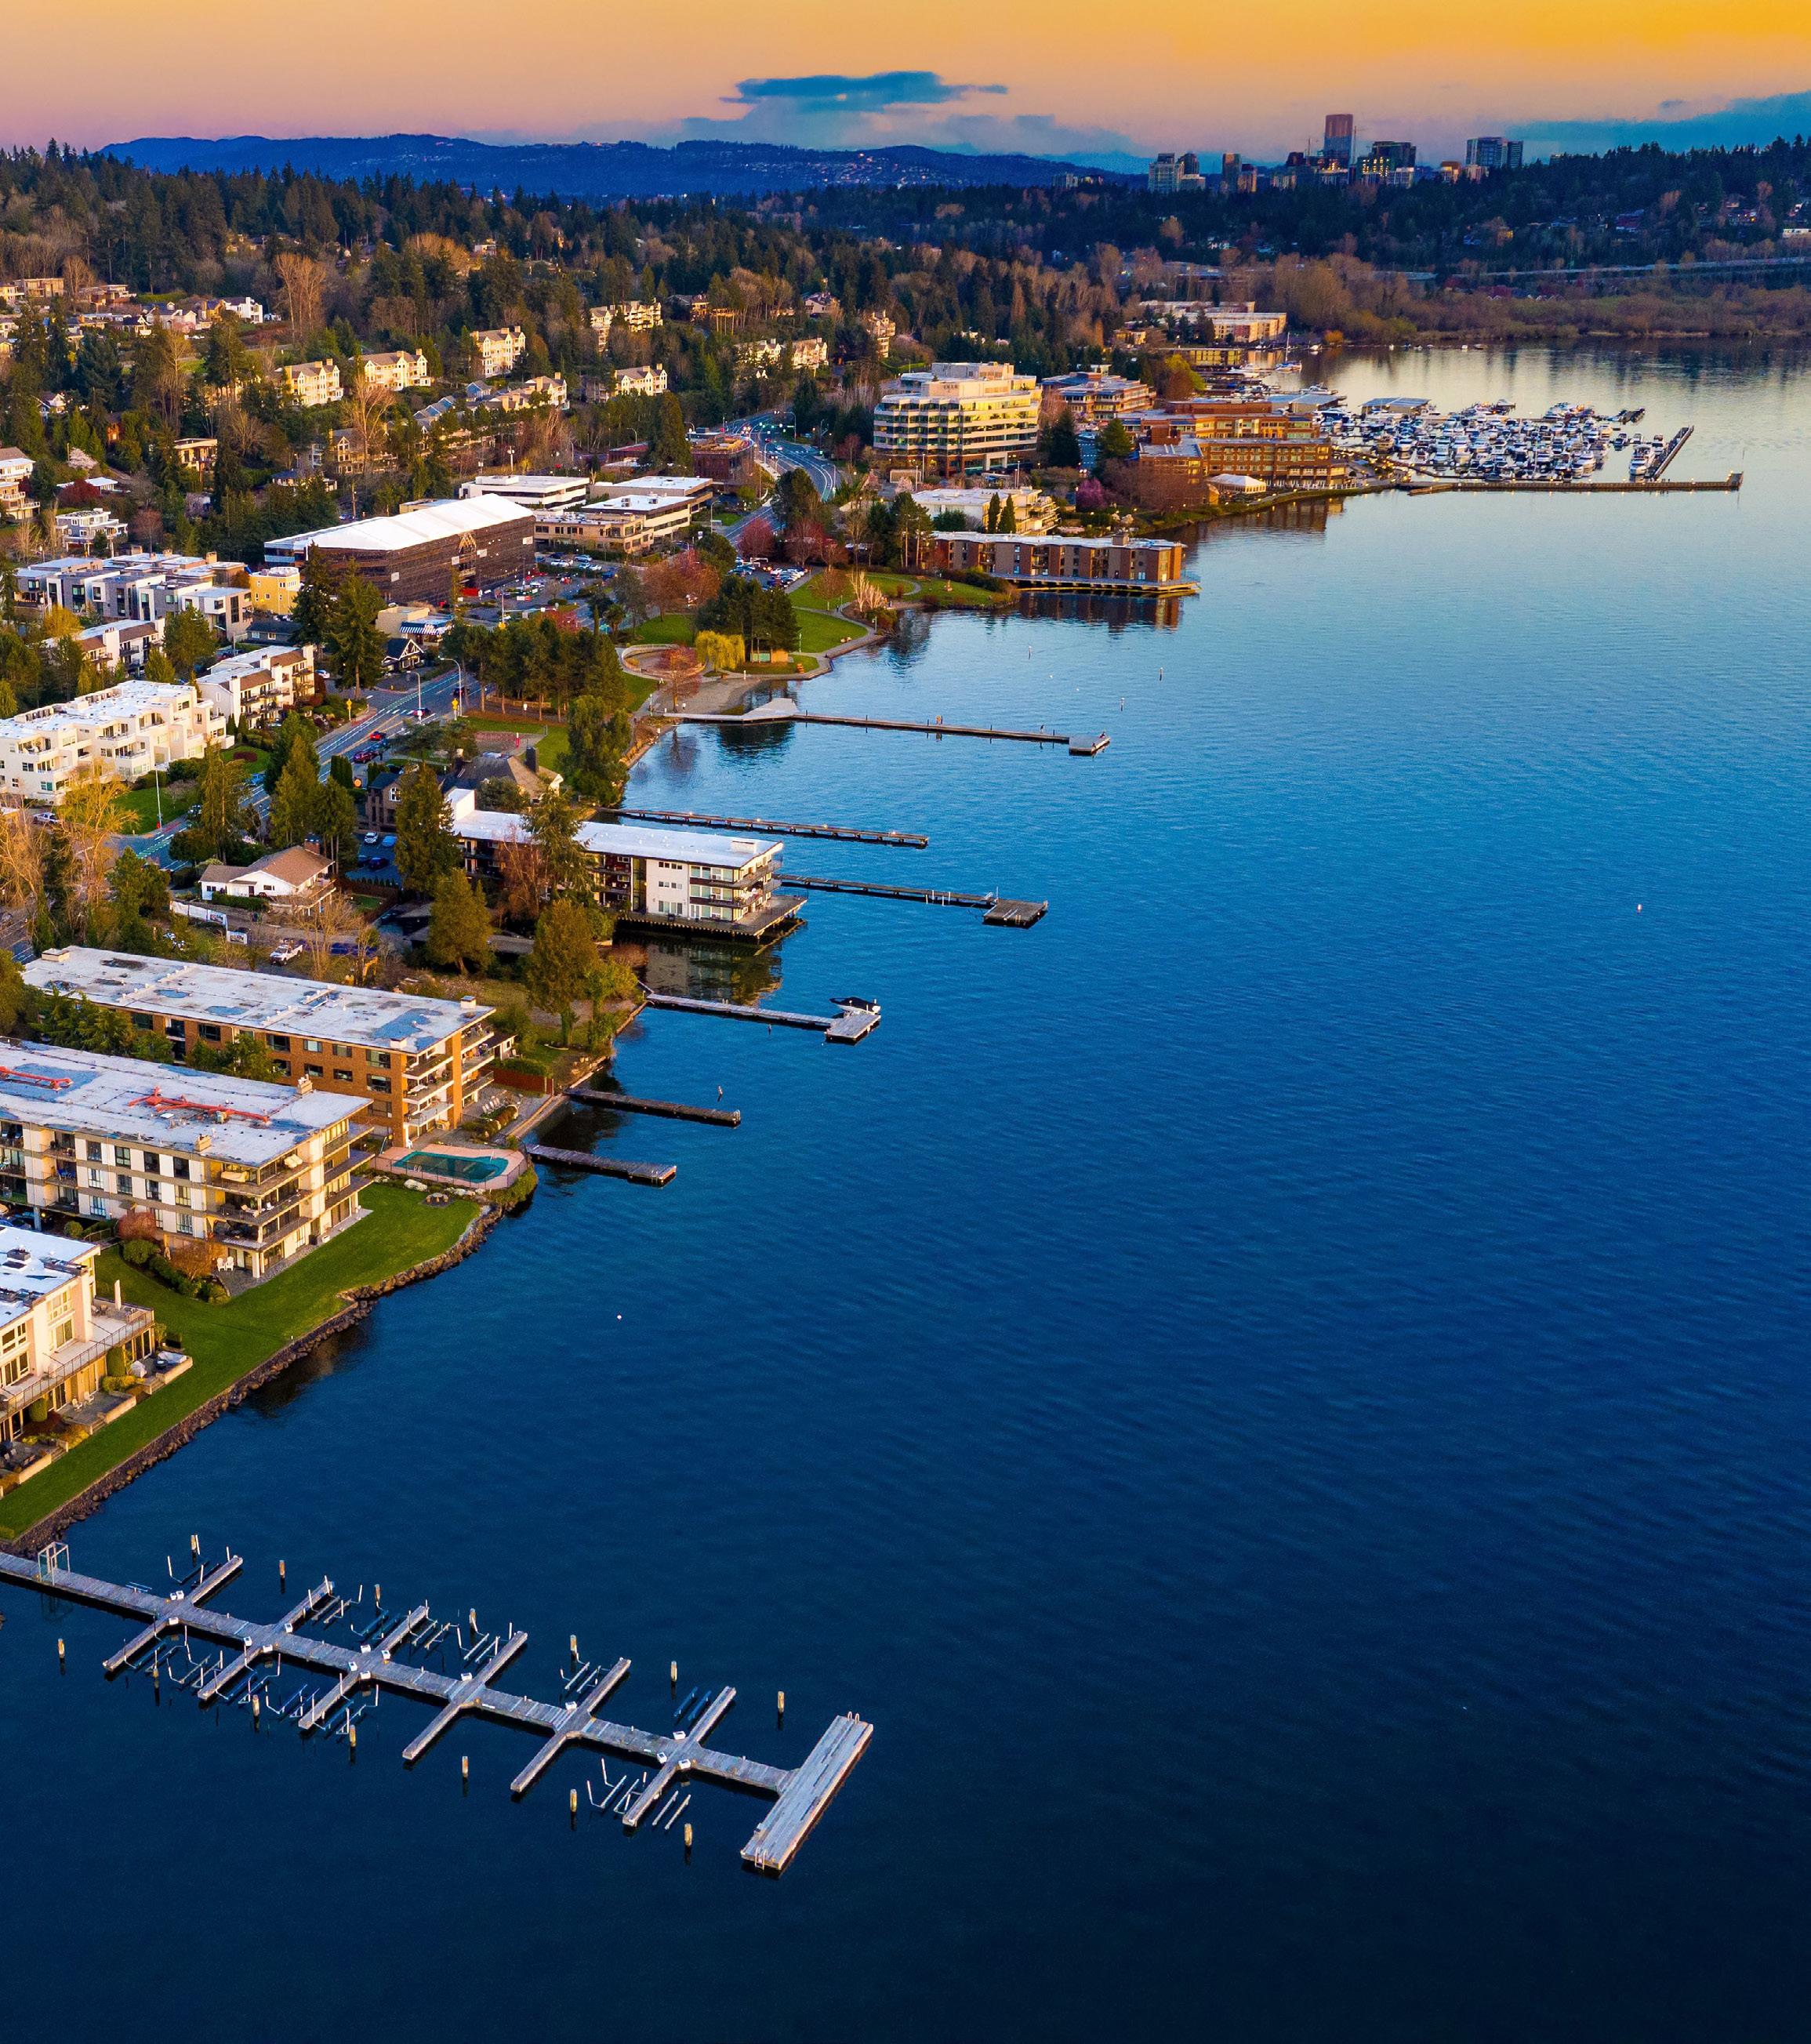
From elegant lakefront estates to peaceful abodes on idyllic peninsulas, the Puget Sound region offers some of the most remarkable, diverse options for waterfront living in the country. These desirable properties appeal to homeowners locally and globally, and their unique characteristics, demand, and opportunities put them in a different league than the rest of the region’s listings.
We understand how important it is to take a closer look at this special subset of the market, so we’ve compiled data, analysis, and perspective on market trends over the past years, focusing on 2022’s unique circumstances— the crests and troughs—and how our waterfront markets weathered the real estate downturn after the significant shift from the previous boom, causing sellers and buyers to reevaluate their real estate goals.
Luckily, iconic PNW vistas, endless opportunities for waterfront recreation, and a lifestyle inspired by location ensure that shoreline properties will always remain in demand. RSIR global real estate advisors are experts on our waterfront markets, sailing you through your buying or selling passage with ease.
 Chief Marketing Officer
 Realogics Sotheby’s International Realty

Whether your next move is around the corner or around the world, we’re here to help.

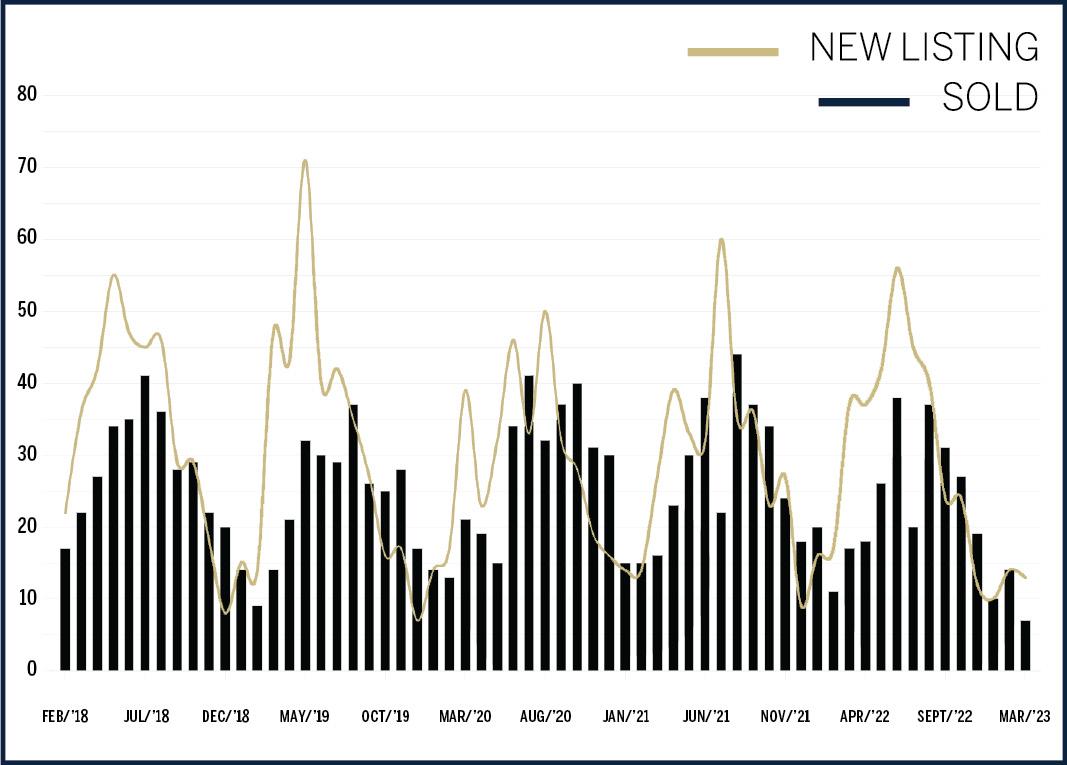
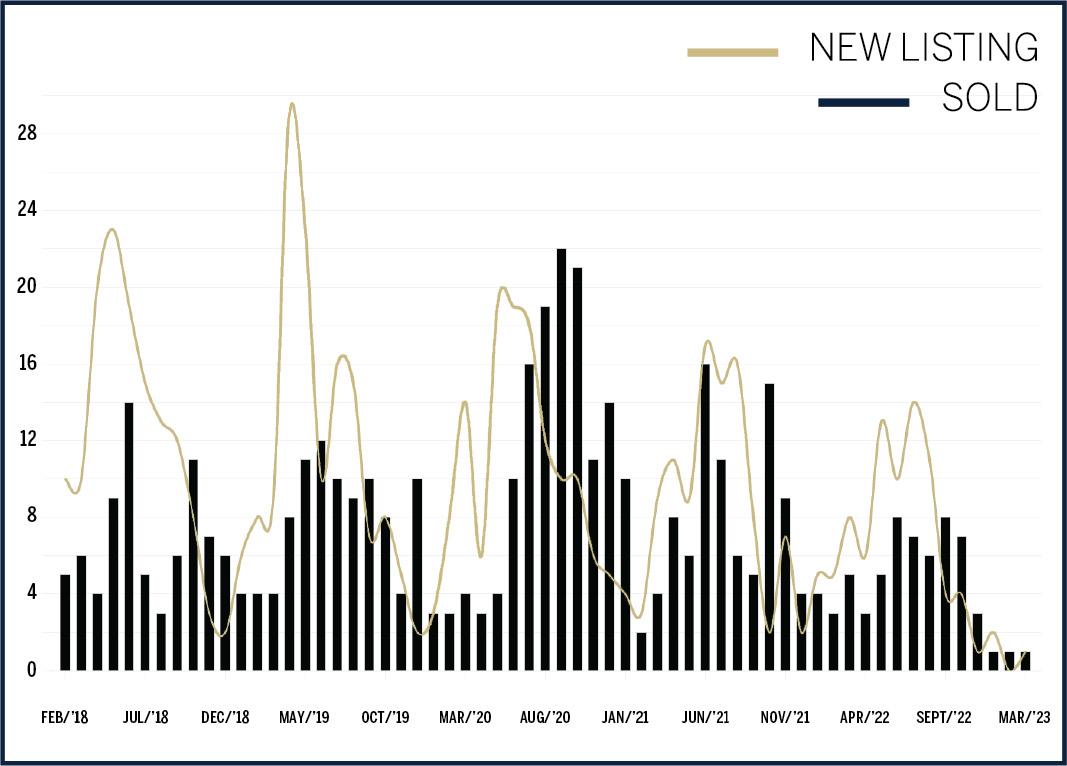
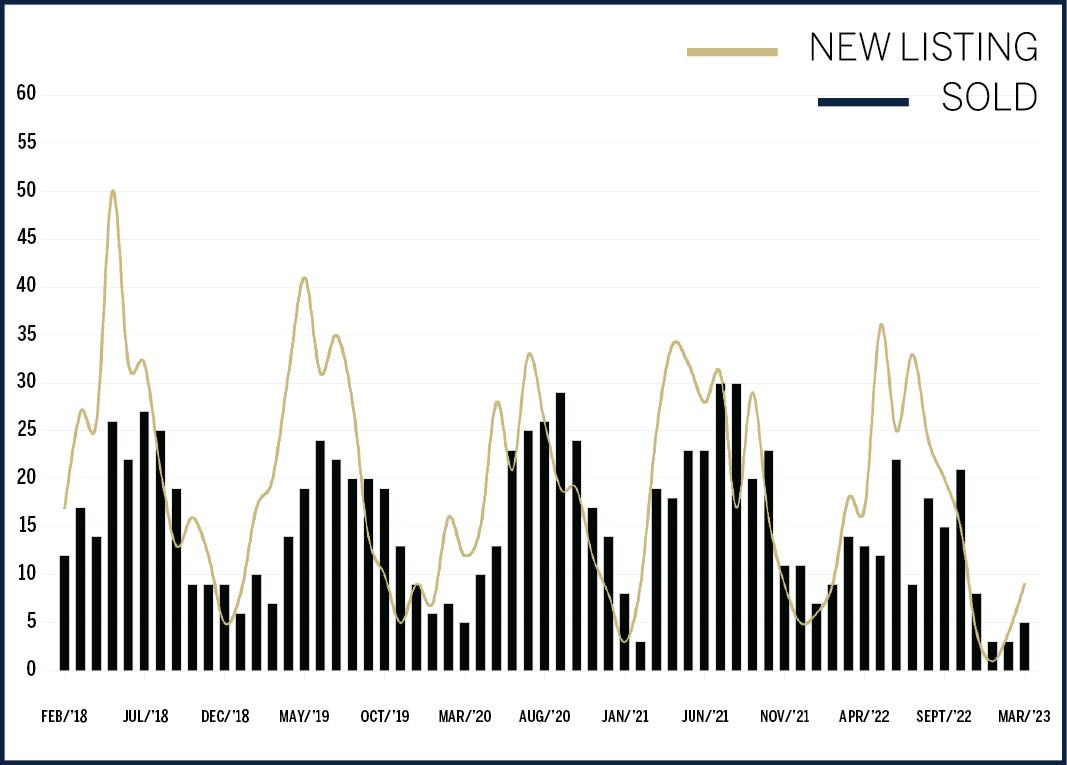
A 5-YEAR SEASONAL VIEW ON THE LISTING AND SELLING TRENDS ACROSS WASHINGTON New listings and closed sales 2016-2022, data courtesy Trendgraphix.
County Overview
KING COUNTY
If you're keeping an eye on the King County housing market, you may have noticed a trend over the past 5 years. New listings tend to appear between April and May, while closed sales typically peak in June and July. However, in 2022 we saw a noticeable slowdown in closed sales.
PIERCE COUNTY
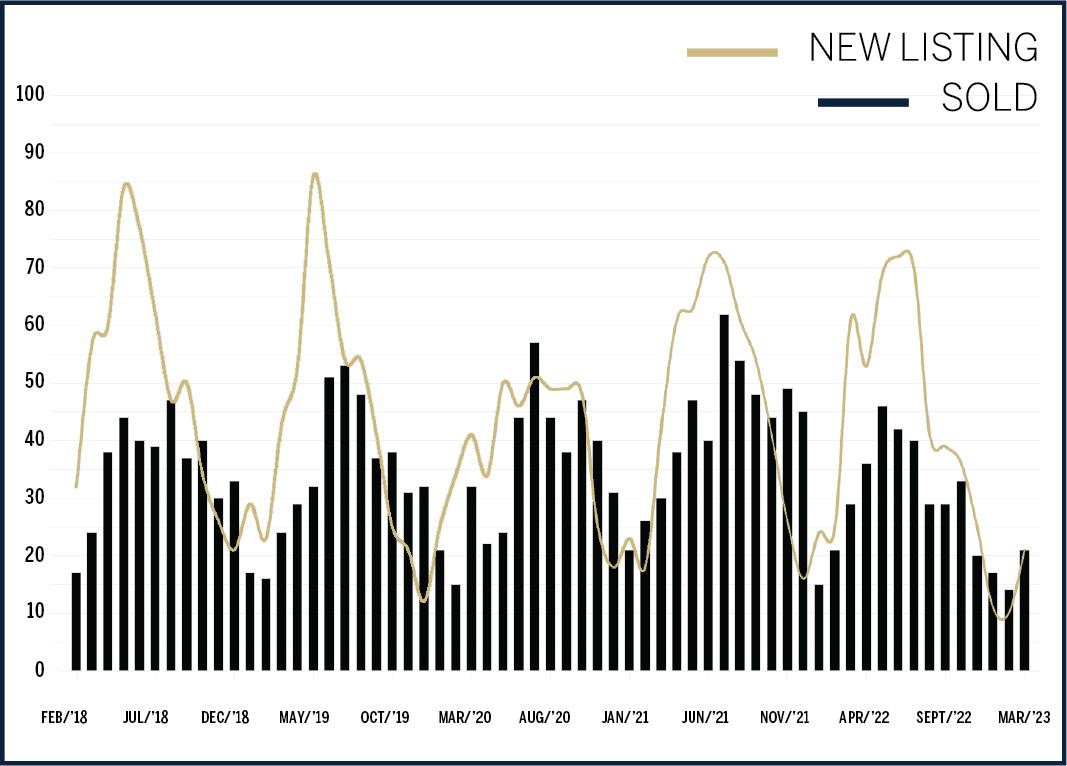
New listings typically outpace closed waterfront sales in Pierce County, but the seasonality is predictable year over year. Listings hit the market in May and June, and the peak closing time is June and July, sometimes lingering into August.
SNOHOMISH COUNTY
Snohomish County waterfront listings and sales follow predictable market patterns. New listings typically hit the market during the spring sales surge. Buyers, however, may not be ready to pull the trigger on these homes until the summer months of June through August, when closed sales typically peak.
KITSAP COUNTY
The waterfront seasons in Kitsap County fall later in the year compared to the urban markets of Western Washington. New listings tend to have mini peaks throughout the year, with most closed sales picking up between August and early fall.
CLALLAM COUNTY
After peaking in June of 2021, closed sales started to tick down, and 2022 never quite reached the months of high closed sales experienced in previous years. Still, preparing to list a home ahead of the summer-fall busy season is ideal for sellers.
GRAYS HARBOR COUNTY
New listings for waterfront homes tend to hit the market at the start of the traditional spring selling season. However, the peak of closed waterfront sales tends to pick up mid-to-late summer. Year over year, closed sales have decreased since their peak in 2020.
JEFFERSON COUNTY
Waterfront sales in Jefferson County are less predictable and not as tied to the seasons as other counties' waterfront real estate sales may be. There is a trend of new listings hitting the market during the spring sales surge, though when they’ll sell— early summer or late—depends on the year.
PACIFIC COUNTY
The rolling trends of new listings and closed sales in Pacific County don’t follow the strict seasonality of other counties. However, when reviewing the trends over the past five years, it’s easy to see when the market was hottest (2020) and how it started to cool in 2021 and 2022.
ISLAND COUNTY
In 2022, closed sales didn’t follow the regular pattern established during the previous four years. Likely, shifting market conditions had something to do with a spike, then a dip in closed sales. Still, summer is the prime time to close a waterfront sale, so listing just ahead of the rush is key.
SAN JUAN COUNTY
Over the past three years, new listings have remained fairly steady. However, closed sales, after peaking in 2020, trended down year over year, with peaks occurring in the summer and fall, though not with the same regularity as in other counties.
WHATCOM COUNTY
In 2020 and 2021, new listings appeared to keep pace with closed sales. Before the pandemic era, and in 2022, new listings far outpaced the closed sales. The shifting market also had an impact on when closed sales peaked in 2022.
SKAGIT COUNTY
From 2018 through 2021, closed sales and listings followed a familiar pattern, with closings peaking around July and sometimes carrying on at high volume through the fall. But in 2022, amid the shifting market, late summer and fall saw the majority of closed sales.
Bainbridge Island
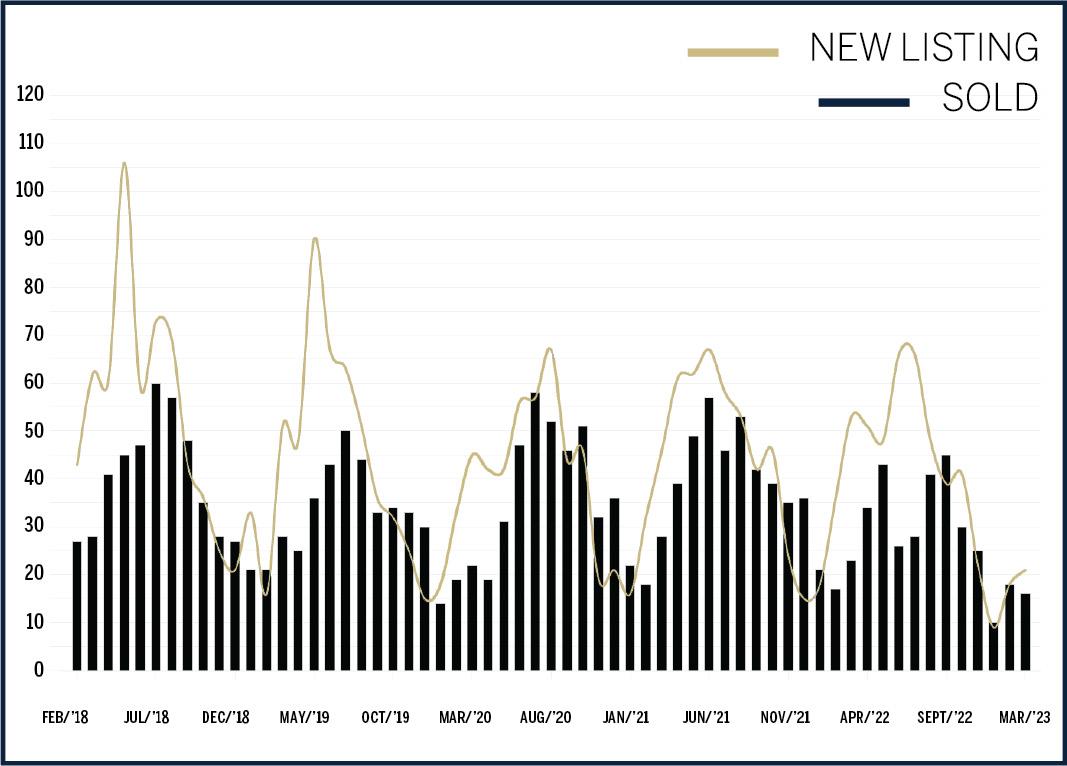
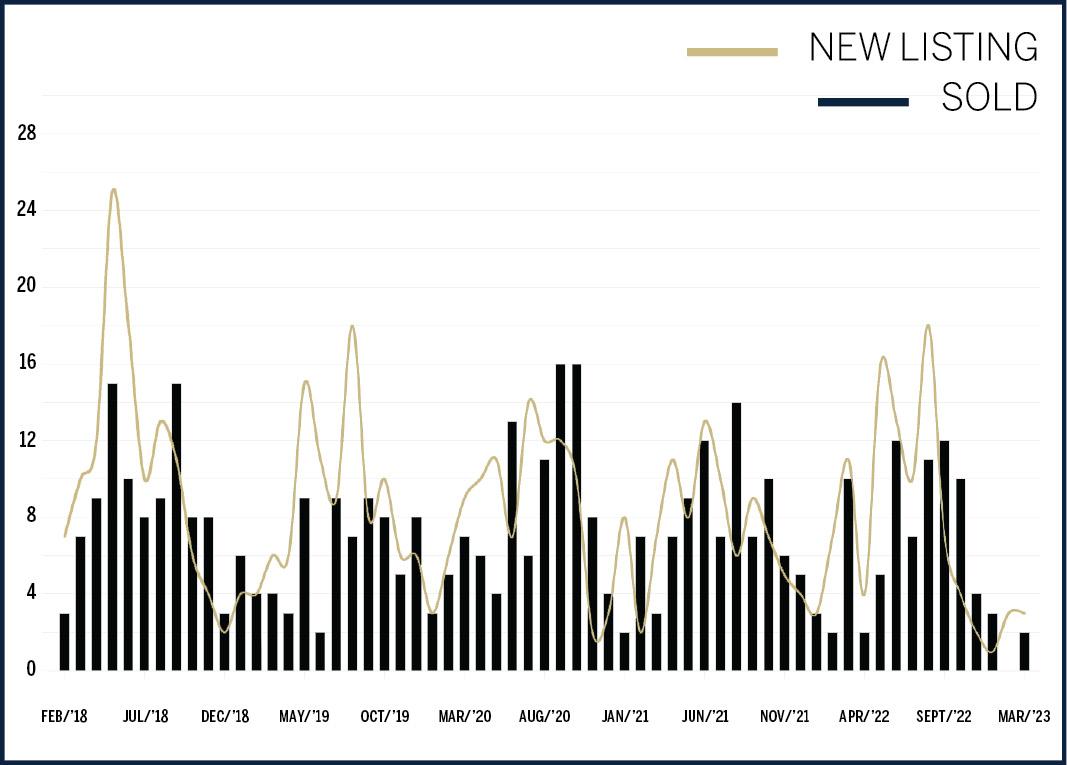
The diamond of Kitsap County, Bainbridge Island is easily accessible by ferry, continuing to o er wonderful waterfront opportunities in 2022. But the closed sales couldn’t keep pace with the new listings. The number of closed sales was down 35% year over year, while the number of new listings exceeded 2021’s number by two. The shifting market experienced across the real estate industry impacted waterfront living on Bainbridge Island—but it’s not all bad news. While the median sales price ticked down, it was minimal, less than 3%, and the average price per square foot increased by 7%. While fewer waterfront home sales closed last year compared to the year before, the amount of time spent on the market was down year over year, from 24 days in 2021 to 17 days in 2022.
Waterfront Market Report
Each o ce is Independently owned and operated. All reports presented are based on data supplied by the Northwest MLS. Neither the Associations nor their MLSs guarantee or are in anyway responsible for its accuracy. Data maintained by the Associations or their MLSs may not re ect all real estate activities in the market. Information deemed reliable but not guaranteed. Bainbridge Island data includes MLS Area 170. *Represents Realogics Sotheby’s International Realty sales.
‘23
Top Three Waterfront Sales In 2 0 2 2 6516 Wing Point Rd NE, Bainbridge Island* MLS# 1922782 | $5,800,000 9135 Fox Cove Lane NE, Bainbridge Island MLS# 1903456 | $5,300,000 6020 Eagle Harbor Dr NE, Bainbridge Island*
1720332 | $4,600,000 STATE OF THE MARKET 1.8 months of inventory - Seller’s Market (Based on closed sales, March 2023 inventory. Seller’s Market = 0 to 3 months inventory, Neutral Market = 3 to 6 months inventory, Buyer’s Market = 6+ months inventory) SELLER ’SMARKET NEUTRAL BUYER’S MARKET SELLER’S MARKET 1.8 MONTHS OF SUPPLY New Listings Closed Sales BAINBRIDGE ISLAND NEW LISTINGS VS. CLOSED SALES 2018-2022 2021 $7 91 SQ. FT. AVERAGE PRICE PER SQUARE FOOT Single-Family Homes ↑(7.33%) 2022 $849 SQ. FT. 2020 127 FT. 2022 106 FT. 2021 108 FT. MEDIAN SALES PRICE Single-Family Homes ↓(−2.83%) 20 21 20 22 $2.167M AVERAGE DAYS ON MARKET 2022 17 2021 24 2020 81 AVERAGE LINEAR WATERFRONT FOOTAGE rsirwaterfront.com 2022 2021 2020 2019 2018 10 20 30 40 50 60 70 80 90 100 110 120 $2.23M 1 2 3
MLS#
Ballard & Magnolia
In-city waterfront living is in demand, especially along the shores of Magnolia and Ballard. In a year when most single-family homes began to see a decline in the median sales price, waterfront home prices ticked up in this area by over 31% year over year. The average price per square foot was also up year over year at 10%. Still, the slowdown in the market was apparent when examining the number of closed sales—just seven waterfront home sales closed compared to 14 in 2021. It’s a pace that aligns much more closely with the number of home sale closings over the past ve years, which included fewer than 10 homes. It’s a testament to the rarity of this home type in this in-demand community. Whether the views in sight are over the Puget Sound or gaze out over Shilshole Bay, these homes will demand to be seen.
Waterfront Market
Report ‘23
Top Three Waterfront Sales In 2 0 2 2 5634 39th Ave W, Seattle MLS# 1899847 | $3,600,000 3251 Perkins Ln W, Seattle MLS# 1887625 | $3,500,000 3239 Perkins Ln W, Seattle MLS# 1885491 | $3,500,000 STATE OF THE MARKET 1.0 months of inventory - Seller’s Market (Based on closed sales, March 2023 inventory. Seller’s Market = 0 to 3 months inventory, Neutral Market = 3 to 6 months inventory, Buyer’s Market = 6+ months inventory) Each o ce is Independently owned and operated. All reports presented are based on data supplied by the Northwest MLS. Neither the Associations nor their MLSs guarantee or are in anyway responsible for its accuracy. Data maintained by the Associations or their MLSs may not re ect all real estate activities in the market. Information deemed reliable but not guaranteed. Ballard & Magnolia data includes Ballard, Magnolia, and North Beach (area 705). 5 0 10 15 20 25 SELLER ’SMARKET NEUTRAL BUYER’S MARKET SELLER’S MARKET 1.0 MONTH OF SUPPLY New Listings Closed Sales 2022 2021 2020 2019 2018 BALLARD & MAGNOLIA NEW LISTINGS VS. CLOSED SALES 2018-2022 MEDIAN SALES PRICE Single-Family Homes ↑(31.43%) SEATTLE rsirwaterfront.com 2021 $809 SQ. FT. 2022 $920 SQ. FT. 2020 69 FT. 2022 64 FT. 2021 73 FT. 20 21 20 22 $3.50M AVERAGE DAYS ON MARKET 2022 50 2021 44 2020 64 AVERAGE LINEAR WATERFRONT FOOTAGE $2.66M AVERAGE PRICE PER SQUARE FOOT Single-Family Homes ↑(13.82%) 1 2 3
Pricing right is critical in a waterfront market like Bellevue. As the market cooled in 2022, the average waterfront home went for over the asking price in 2021 (103% of what the home was listed for) to under the asking price in 2022 (98% of what the home was listed for). Comparing 2022 to 2020, the number of listings to hit the market each year was nearly identical. The same can’t be said for closed sales, which slowed in 2022, with 28% fewer closed sales year over year. Still, the average price per square foot of these desired homes stayed relatively at between 2022 and 2021, and the average time the homes spent on market was up by only four days in 2022. Likewise, the median sales price also stayed relatively at year to year, ticking down just 2%.
Waterfront Market Report
Each o ce is Independently
and operated. All reports presented are
on data supplied by the Northwest MLS. Neither the Associations nor their MLSs guarantee or are in anyway responsible for its accuracy. Data maintained by the Associations or their MLSs may not re ect all real estate activities in the market. Information deemed reliable but not guaranteed. Bellevue data includes the city of Bellevue.
‘23
owned
based
Bellevue Top Three Waterfront Sales In 2 0 2 2 18110 SE 41st Ln, Bellevue MLS# 1825218 | $12,750,000 9425 Lake Washington Blvd NE, Bellevue MLS# 1911469 | $12,125,000 15 Crescent Key, Bellevue MLS# 1886523 | $9,000,000 STATE OF THE MARKET 5.0 months of inventory - Neutral Market (Based on closed sales, March 2023 inventory. Seller’s Market = 0 to 3 months inventory, Neutral Market = 3 to 6 months inventory, Buyer’s Market = 6+ months inventory) SELLER ’SMARKET NEUTRAL BUYER’S MARKET NEUTRAL MARKET 5.0 MONTH OF SUPPLY New Listings Closed Sales 10 20 30 40 50 60 70 80 90 2022 2021 2020 2019 2018 2018-2022 BELLEVUE NEW LISTINGS VS. CLOSED SALES AVERAGE PRICE PER SQUARE FOOT Single-Family Homes ↓(-1.49%) MEDIAN SALES PRICE Single-Family Homes ↓(-2.92) rsirwaterfront.com 2021 $1,271 SQ. FT. 2022 $1,252 SQ. FT. 2020 98 FT. 2022 74 FT. 2021 90 FT. 20 21 20 22 $4.15M AVERAGE DAYS ON MARKET 2022 28 2021 24 2020 44 AVERAGE LINEAR WATERFRONT FOOTAGE $4.275M 1 2 3
Camano Island
In 2021, waterfront sellers could expect multiple o ers leading to 105%, on average, of the listing price. Home sellers experienced this across market areas and property types due to record-low interest rates. While those escalating o ers may not have continued with the same fervor the following year, the average asking price was at the list price—not under. New listings were down by 13% year over year—while the number of closed sales was down 33%. While the shifting market has led to fewer transactions, the median sales price saw an increase of nearly 19% year over year, and the average price per square foot was up nearly 34%. In 2023, having a Realogics Sotheby’s International Realty local waterfront expert who understands will be key to meeting your real estate goals.
Each
its
all real
Information
reliable
not
Camano Island data includes MLS Areas 780. *Represents Realogics Sotheby’s International Realty
Waterfront Market Report ‘23
o ce is Independently owned and operated. All reports presented are based on data supplied by the Northwest MLS. Neither the Associations nor their MLSs guarantee or are in anyway responsible for
accuracy. Data maintained by the Associations or their MLSs may not re ect
estate activities in the market.
deemed
but
guaranteed.
sales.
Top Three Waterfront Sales In 2 0 2 2 1311 U.P. Trail Ln, Camano Island MLS# 1921892 | $5,200,000 2106 Breezy Point Rd, Camano Island* MLS# 1942364 | $3,248,000 1149 Cavalero Rd, Camano Island MLS# 1928172 | $2,625,000 STATE OF THE MARKET 3.0 months of inventory - Neutral Market (Based on closed sales, March 2023 inventory. Seller’s Market = 0 to 3 months inventory, Neutral Market = 3 to 6 months inventory, Buyer’s Market = 6+ months inventory) 10 20 30 40 50 60 70 80 90 100 110 120 SELLER ’SMARKET NEUTRAL BUYER’S MARKET NEUTRAL MARKET 3.0 MONTHS OF SUPPLY New Listings Closed Sales 2022 2020 2021 2019 2018 CAMANO ISLAND NEW LISTINGS VS. CLOSED SALES 2018-2022 AVERAGE PRICE PER SQUARE FOOT Single-Family Homes ↑(33.94%) MEDIAN SALES PRICE Single-Family Homes ↑(18.92%) rsirwaterfront.com 2021 $442 SQ. FT. 2022 $592 SQ. FT. 2020 107 FT. 2022 98 FT. 2021 87 FT. 20 21 20 22 $1.1M AVERAGE DAYS ON MARKET 2022 22 2021 20 2020 33 AVERAGE LINEAR WATERFRONT FOOTAGE $925K
1 2 3
Four Points
Exclusive and luxurious, the communities that make up the Four Points are the most in-demand and sought-after waterfront properties in Washington state. Their price points say it all—the record sales here are often unlisted, though the top listed sales of 2022 range from $17 million to $23 million. And the median sales price of a waterfront home on Yarrow Point, Hunts Point, or Medina reached $10.95 million, a nearly 4.5% decrease from the year before. This speci c market bene ts from local waterfront experts from Realogics Sotheby’s International Realty familiar with the area, as often the new listings greatly exceed the closed sales and the average percentage of the accepted asking price is below the list price—in 2021 it was 91%, and in 2022 it was 89%. Sellers, have patience as your home is marketed to this audience of buyers. The average time spent on market was 93 days, 126 days, and 70 days in 2020, 2021, and 2022, respectively.
Waterfront
Each
its
all real estate
the
reliable
not
Four Points data
Market Report ‘23
o ce is Independently owned and operated. All reports presented are based on data supplied by the Northwest MLS. Neither the Associations nor their MLSs guarantee or are in anyway responsible for
accuracy. Data maintained by the Associations or their MLSs may not re ect
activities in
market. Information deemed
but
guaranteed.
includes Medina, Clyde Hill, Yarrow Point, and Hunts Point.
Top Three Waterfront Sales In 2 0 2 2 611 Evergreen Pt Rd, Medina MLS# 1921343 | $23,000,000 9011 NE 38th Pl, Yarrow Point MLS# 1930038 | $18,000,000 2247 Evergreen Pt Rd, Medina MLS# 1951563 | $17,770,000 STATE OF THE MARKET 6.0 months of inventory - Buyer’s Market (Based on closed sales, March 2023 inventory. Seller’s Market = 0 to 3 months inventory, Neutral Market = 3 to 6 months inventory, Buyer’s Market = 6+ months inventory) 5 10 15 20 25 30 35 40 45 SELLER ’SMARKET NEUTRAL BUYER’S MARKET BUYER’S MARKET 6.0 MONTHS OF SUPPLY New Listings Closed Sales FOUR POINTS NEW LISTINGS VS. CLOSED SALES 2018-2022 AVERAGE PRICE PER SQUARE FOOT Single-Family Homes ↓(-15.31%) MEDIAN SALES PRICE Single-Family Homes ↓(-4.48%) 2021 2022 2020 2019 2018 rsirwaterfront.com 2021 $2,195 SQ. FT. 2022 $1,859 SQ. FT. 2020 98 FT. 2022 93 FT. 2021 98 FT. 20 21 20 22 $10.95M AVERAGE DAYS ON MARKET 2022 70 2021 126 2020 93 AVERAGE LINEAR WATERFRONT FOOTAGE $11.46M 1 2 3
Gig Harbor & Fox Island
Appreciation. Whether it’s appreciation of the stunning nature that surrounds these waterfront homes, the architecture that sets these homes apart from other shoreline locales, or the year-over-year appreciation gains, there’s so much to enjoy about these communities. As these stats will show, even amid a shifting market, waterfront homes in Gig Harbor and the surrounding area saw gains. The median sales price was up 9% year over year while the average price per square foot was up 15%. True, the shifting market may have impacted the number of sellers ready to place their homes on the market, the area saw the fewest new listings (82) over the past ve years. Likewise, closed sales were down 34% year over year. But if a home was priced for the market correctly, with a Realogics Sotheby’s International Realty waterfront expert as its advisor, it was likely to see less time on the market than the year before—a 25% decrease year over year.
Waterfront
Each o ce is Independently owned and operated. All reports presented are based on data supplied by the Northwest MLS. Neither the Associations nor their MLSs guarantee or are in anyway responsible for its accuracy. Data maintained by the Associations or their MLSs may not re ect all real estate activities in the market. Information deemed reliable but not guaranteed. Gig Harbor and Fox Island data includes MLS Areas 1, 3, 5, 6, and 7. *Represents Realogics Sotheby’s International Realty sales.
Market Report ‘23
Top Three Waterfront Sales In 2 0 2 2 8406 Goodman Dr NW, Gig Harbor MLS# 1840468 | $5,300,000 10310 Kopachuck Dr NW, Gig Harbor* MLS# 1994117 | $4,350,000 8714 90th Ave NW, Gig Harbor MLS# 1966376 | $4,100,000 STATE OF THE MARKET 2.8 months of inventory - Seller’s Market (Based on closed sales, March 2023 inventory. Seller’s Market = 0 to 3 months inventory, Neutral Market = 3 to 6 months inventory, Buyer’s Market = 6+ months inventory) SELLER ’SMARKET NEUTRAL BUYER’S MARKET SELLER’S MARKET 2.8 MONTHS OF SUPPLY New Listings Closed Sales 10 20 30 40 50 60 70 80 90 100 110 120 130 140 2021 2022 2020 2019 2018 GIG HARBOR & FOX ISLAND NEW LISTINGS VS. CLOSED SALES 2018-2022 AVERAGE PRICE PER SQUARE FOOT Single-Family Homes ↑(15.11%) MEDIAN SALES PRICE Single-Family Homes ↑(9.06%) rsirwaterfront.com 2021 $523 SQ. FT. 2022 $602 SQ. FT. 2020 113 FT. 2022 121 FT. 2021 100 FT. 20 21 20 22 $1.565M AVERAGE DAYS ON MARKET 2022 20 2021 27 2020 83 AVERAGE LINEAR WATERFRONT FOOTAGE $1.43 5M 1 2 3
Waterfront can vary tremendously across a single market. This may explain the huge drop in the median sales price year over year—in 2021 it was $5.6 million and in 2022 $1.55 million. Those contemplating listing their Kirkland waterfront home shouldn’t be discouraged by this, as the average price per square foot was relatively at year over year, seeing a 1.8% gain. Here, like many markets (particularly surrounding Lake Washington), a local waterfront expert, like those at Realogics Sotheby’s International Realty, is key in helping you list or search for your ideal waterfront home, since price points and property types vary greatly along the shoreline. In 2022, the number of new listings was up year over year, from 22 to 29, but it was likely impacted by our shifting market mid-year, as the number of closed sales saw a signi cant drop of 35%—though, this may have just been a correction, as the closed sales fell more closely in line with 2020.
Each o ce is Independently owned and operated. All reports presented are based on data supplied by the Northwest MLS. Neither the Associations nor their MLSs guarantee or are in anyway responsible for its accuracy. Data maintained by the Associations or their MLSs may not re ect all real estate activities in the market. Information deemed reliable but not guaranteed. Kirkland data includes the city of Kirkland.
Top Three Waterfront Sales In 2 0 2 2 405 Lake St S, Kirkland MLS# 1992138 | $15,400,000 Undisclosed, Kirkland MLS# 1937592 | $9,875,000 11069 Champagne Point Rd NE, Kirkland MLS# 1882920 | $6,800,000 STATE OF THE MARKET 2.3 months of inventory - Seller’s Market (Based on closed sales, March 2023 inventory. Seller’s Market = 0 to 3 months inventory, Neutral Market = 3 to 6 months inventory, Buyer’s Market = 6+ months inventory) SELLER ’SMARKET NEUTRAL BUYER’S MARKET SELLER’S MARKET 2.3 MONTHS OF SUPPLY New Listings Closed Sales AVERAGE PRICE PER SQUARE FOOT Single-Family Homes ↑(1.79%) MEDIAN SALES PRICE Single-Family Homes ↓(-72.32%) 5 10 15 20 25 30 35 40 45 2021 2022 2020 2019 2018 KIRKLAND NEW LISTINGS VS. CLOSED SALES 2018-2022 2021 $1,342 SQ. FT. 2022 $1,366 SQ. FT. 2020 87 FT. 2022 67 FT. 2021 91 FT. 20 21 20 22 $1.55M AVERAGE DAYS ON MARKET 2022 20 2021 53 2020 24 AVERAGE LINEAR WATERFRONT FOOTAGE $5.6M 1 2 3 Waterfront Market Report ‘23 rsirwaterfront.com
Kirkland
Kitsap County
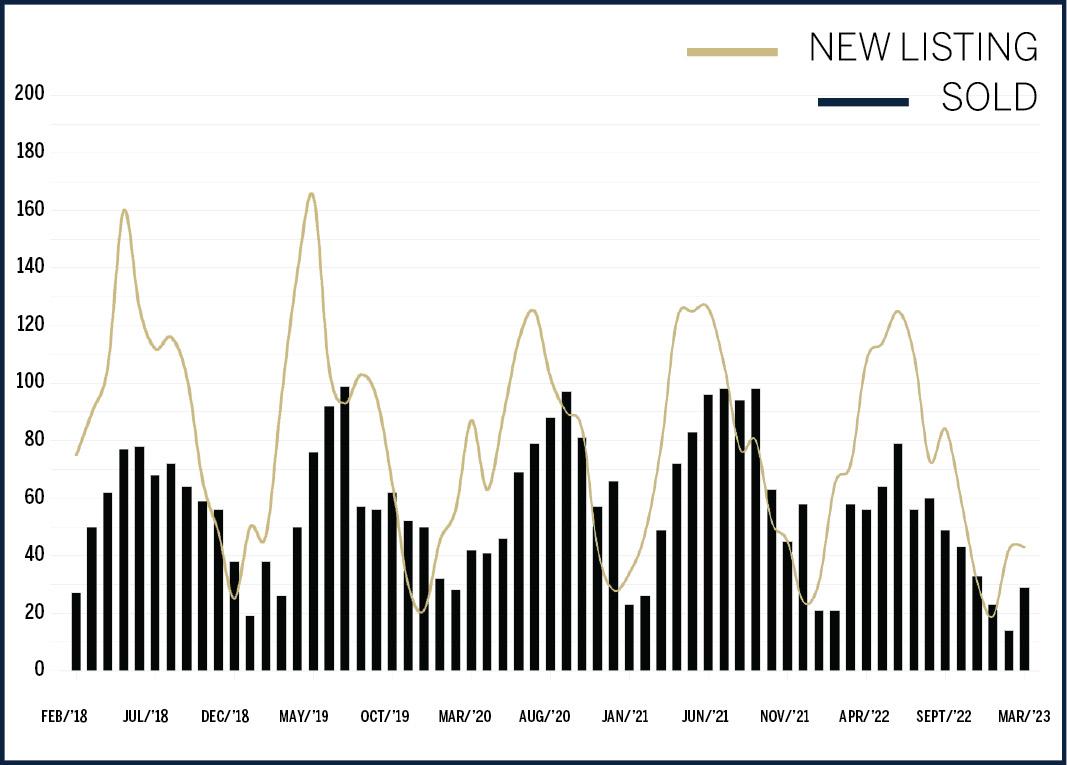
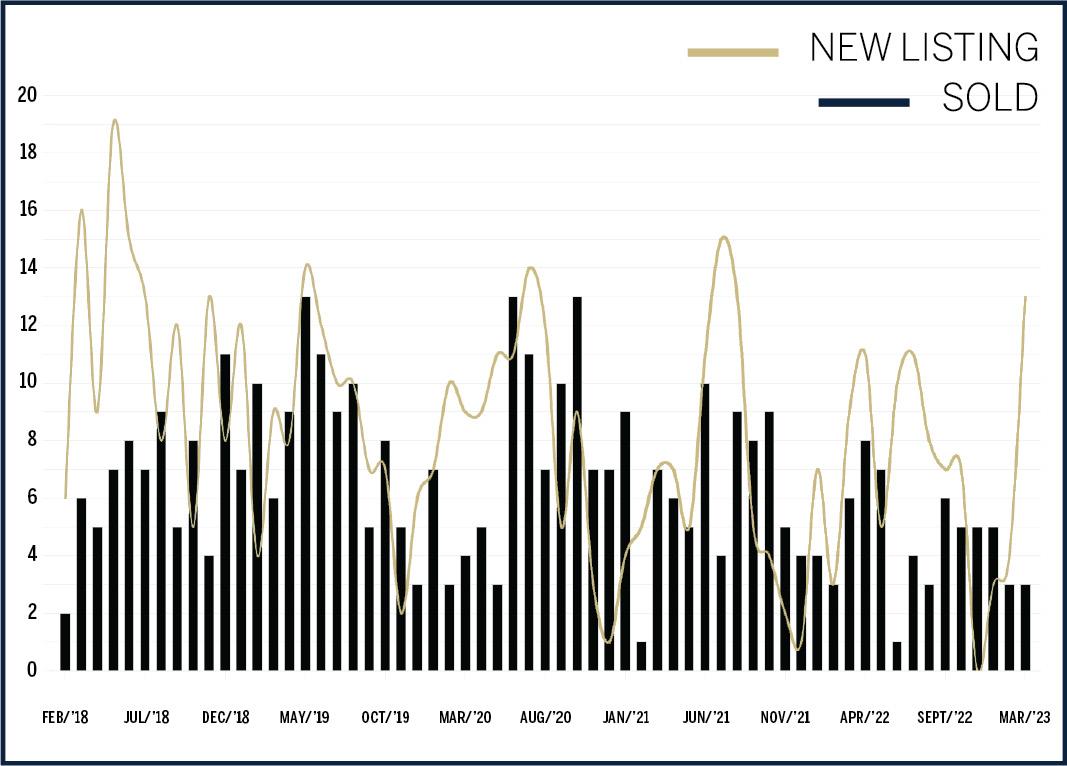
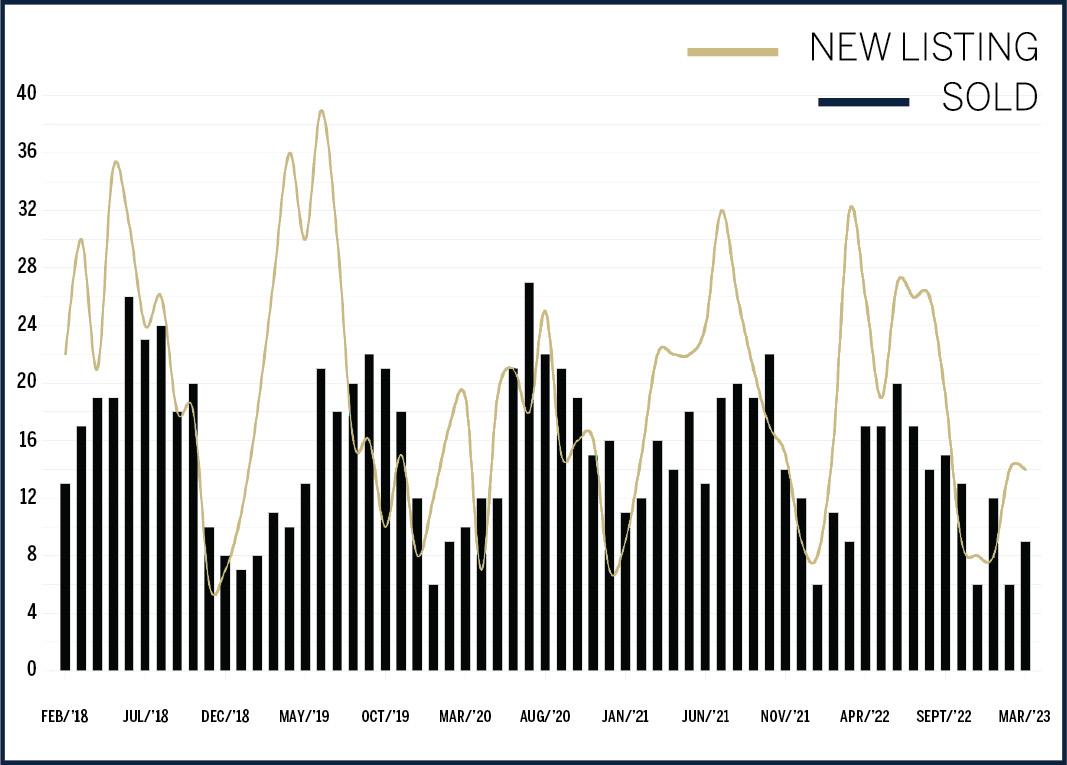
The waterfront opportunities across Kitsap County are abundant. After featuring Poulsbo as a part of Realogics Sotheby’s International Realty’s 2023 Forecast Report, it’s not a surprise to us that the top three waterfront sales came from that community. But it’s hardly the only option across this incredible county. And amidst a shifting market in 2022, homes here continued to see appreciation year over year, with the median sales price up 10.5% from $800K to $884K, although the average price per square foot decreased slightly by just 1.71%. From 2021 to 2022, the number of new listings increased by just under 4%, though the closed sales fell 7.26% year over year. This has been a common pattern for closed sales over the past ve years—fewer homes are available on the market, and the number of closed sales also ticks down, albeit slightly—with one exception. A boom in 2020 saw the number of closed waterfront home sales in the area increase, potentially as a result of the pandemic realigning homebuyers' priorities.
Waterfront
Market Report ‘23 Each o ce is Independently owned and operated. All reports presented are based on data supplied by the Northwest MLS. Neither the Associations nor their MLSs guarantee or are in anyway responsible for its accuracy. Data maintained by the Associations or their MLSs may not re ect all real estate activities in the market. Information deemed reliable but not guaranteed. Kitsap County data excludes Bainbridge Island Area 170.
Top Three Waterfront Sales In 2 0 2 2 16591 Lemolo Shore Dr NE, Poulsbo MLS# 1994836 | $3,500,000 25875 Canyon Rd NW, Poulsbo MLS# 1879214 | $3,300,000 17304 Lemolo Shore Dr NE, Poulsbo MLS# 1960933 | $2,800,000 EXCLUDING BAINBRIDGE ISLAND STATE OF THE MARKET 1.9 months of inventory - Seller’s Market (Based on closed sales, March 2023 inventory. Seller’s Market = 0 to 3 months inventory, Neutral Market = 3 to 6 months inventory, Buyer’s Market = 6+ months inventory) SELLER ’SMARKET NEUTRAL BUYER’S MARKET SELLER’S MARKET 1.9 MONTHS OF SUPPLY New Listings Closed Sales 25 50 75 100 125 150 175 200 225 250 275 300 325 2021 2022 2020 2019 2018 AVERAGE PRICE PER SQUARE FOOT Single-Family Homes ↓(-1.71%) MEDIAN SALES PRICE Single-Family Homes ↑(10.5%) rsirwaterfront.com KITSAP COUNTY (EXCLUDING BAINBRIDGE ISLAND) NEW LISTINGS VS. CLOSED SALES 2018-2022 2021 $409 SQ. FT. 2022 $402 SQ. FT. 2020 112 FT. 2022 120 FT. 2021 111 FT. 20 21 20 22 $884K AVERAGE DAYS ON MARKET 2022 33 2021 16 2020 53 AVERAGE LINEAR WATERFRONT FOOTAGE $800K 1 2 3
Mercer Island
Across Mercer Island over the past few years, waterfront homes and those locked on land saw drastic increases in median home sales prices and the price per square foot. So, as 2022’s market shift ensued, Mercer Island experienced a readjustment of sorts. Waterfront homes on the island, while still one of the most sought-after freshwater opportunities in the Seattle Metro, saw what some would call a market correction. The average price per square foot fell 18% year over year. The median sales price went down over 15% year over year. In 2021, sellers experienced and accepted over-asking o ers on their listing on average, but in 2022 it was more likely that a home went for the asking price, not above. That means a waterfront expert from Realogics Sotheby’s International Realty will be key in helping sellers both market and price their homes for the current uctuating shifts in waterfront real estate.
Waterfront
Each o ce is Independently owned and operated. All reports presented are based on data supplied by the Northwest MLS. Neither the Associations nor their MLSs guarantee or are in anyway responsible for its accuracy. Data maintained by the Associations or their MLSs may not re ect all real estate activities in the market. Information deemed reliable but not guaranteed. Mercer Island data includes MLS Area 510. *Represents Realogics Sotheby’s International Realty sales.
Market Report ‘23
Top Three Waterfront Sales In 2 0 2 2 6315 77th Ave SE, Mercer Island MLS# 1962727 | $12,000,000 5425 W Mercer Wy, Mercer Island
1999037 | $9,080,000
N Mercer Wy, Mercer Island*
1924598 | $9,000,000 STATE OF THE MARKET 6.0 months of inventory - Buyer’s Market (Based on closed sales, March 2023 inventory. Seller’s Market = 0 to 3 months inventory, Neutral Market = 3 to 6 months inventory, Buyer’s Market = 6+ months inventory) New Listings Closed Sales 2021 2022 2020 2019 2018 10 20 30 40 50 60 70 AVERAGE PRICE PER SQUARE FOOT Single-Family Homes ↓(-18.63%) MEDIAN SALES PRICE Single-Family Homes ↓(-15.35%) rsirwaterfront.com MERCER ISLAND NEW LISTINGS VS. CLOSED SALES 2018-2022 SELLER ’SMARKET NEUTRAL BUYER’S MARKET BUYER’S MARKET 6.0 MONTHS OF SUPPLY 2021 $1,487 SQ. FT. 2022 $1,210 SQ. FT. 2020 74 FT. 2022 70 FT. 2021 93 FT. 20 21 20 22 $5.375M AVERAGE DAYS ON MARKET 2022 25 2021 23 2020 72 AVERAGE LINEAR WATERFRONT FOOTAGE $6.3 5M 1
MLS#
8900
MLS#
2 3
The number of new listings along with the number of closed waterfront sales were both down year over year, falling in line with reports about a slowing market in 2022 across all price points, property types, and locations across the region. Still, the median sold price for a Lake Washington home was up 6%, and the price per square foot was also up 1.5%. The top waterfront sales in the area are an example of the luxury o erings in this corner of Seattle, with the top sale exceeding $12 million. Year over year, these in-demand homes also move quickly, with the average days on market relatively the same, at 23 days in 2022 and 22 days in 2021. Understanding this market and its demand is key, as homes typically go for the list price. This means working with a waterfront expert at Realogics Sotheby’s International Realty is a must.
Waterfront
Each o ce is Independently
and operated. All
are
on data
by the Northwest MLS. Neither the Associations nor their MLSs guarantee or are in anyway responsible for its accuracy. Data maintained by the Associations or their MLSs may not re ect all real estate activities in the market. Information deemed reliable but not guaranteed. Northwest Lake Washington data includes MLS Areas 710 & 390.
Market Report ‘23
owned
reports presented
based
supplied
Top Three Waterfront Sales In 2 0 2 2 4502 55th Ave NE, Seattle MLS# 1953993 | $12,500,000 6405 NE Windermere Rd, Seattle MLS# 1926361 | $8,320,000 4102 55th Ave NE, Seattle MLS# 1852770 | $8,100,000 SEATTLE
STATE OF THE MARKET 4.0 months of inventory - Neutral Market (Based on closed sales, March 2023 inventory. Seller’s Market = 0 to 3 months inventory, Neutral Market = 3 to 6 months inventory, Buyer’s Market = 6+ months inventory) SELLER ’SMARKET NEUTRAL BUYER’S MARKET NEUTRAL MARKET 4.0 MONTHS OF SUPPLY New Listings Closed Sales 10 20 30 40 50 60 70 80 90 2021 2022 2020 2019 2018 AVERAGE PRICE PER SQUARE FOOT Single-Family Homes ↑(1.55%) MEDIAN SALES PRICE Single-Family Homes ↑(6.08%) rsirwaterfront.com NORTHWEST LAKE WASHINGTON NEW LISTINGS VS. CLOSED SALES 2018-2022 2021 $1,094 SQ. FT. 2022 $1,111 SQ. FT. 2020 69 FT. 2022 72 FT. 2021 56 FT. 20 21 20 22 $1.5 7M AVERAGE DAYS ON MARKET 2022 23 2021 22 2020 55 AVERAGE LINEAR WATERFRONT FOOTAGE $1.48M 1 2 3
Northwest Lake Washington
Port Angeles
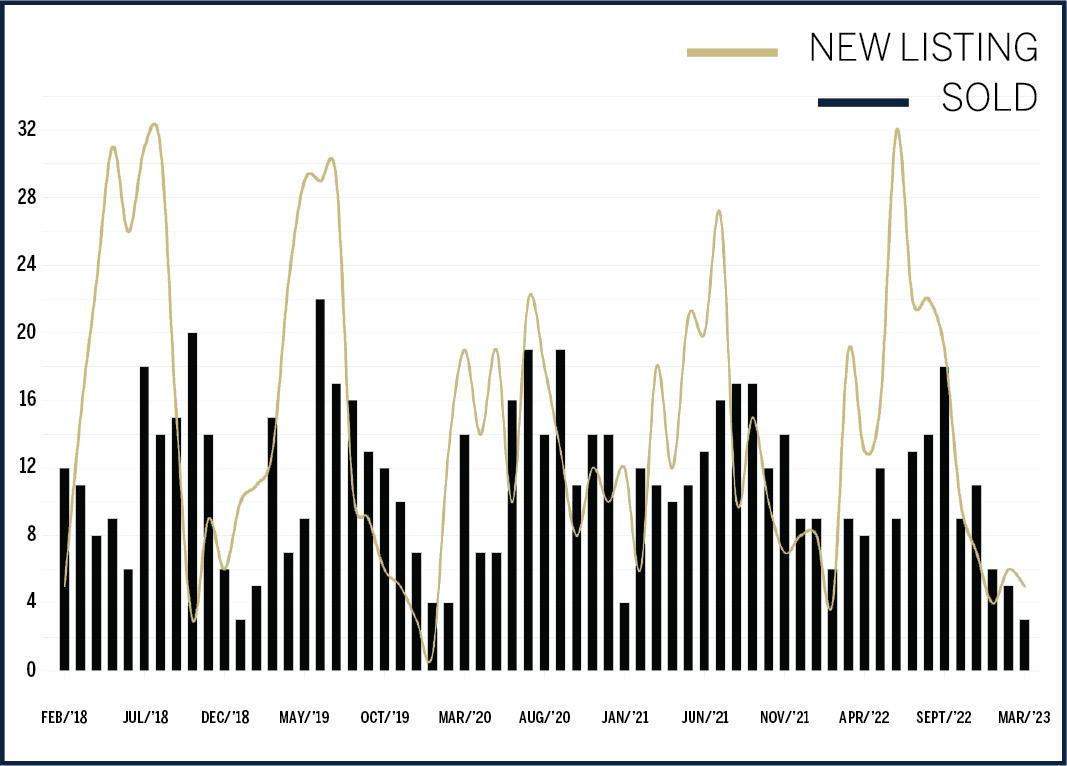
The real estate shifts of 2022 had an impact on waterfront sellers in Port Angeles. Though it caused only a minor year-over-year decline in new listings (down from 48 to 43), the number of closed sales fell signi cantly by 42%. With experts believing that the bottom of the market has passed, now may be a great opportunity for sellers and buyers alike in this beautiful port community. After all, the median sales price stayed relatively at from 2021 to 2022, ticking up by 2.22%, while the average price per square foot saw gains nearing 19% year over year. While many factors could contribute to the length of time a waterfront home spends on the market, that number stayed relatively at from 2021 to 2022 as well, from 29 days to 25 days. So, for those looking for a piece of saltwater shoreline to call their own, or those who are ready to list their waterfront abode, opportunities abound in Port Angeles.
Waterfront Market Report
Each o ce is Independently owned and operated. All reports presented are based on data supplied by the Northwest MLS. Neither the Associations nor their MLSs guarantee or are in anyway responsible for its accuracy. Data maintained by the Associations or their MLSs may not re ect all real estate activities in the market. Information deemed reliable but not guaranteed. Port Angeles data includes the city of Port Angeles.
‘23
Top Three Waterfront Sales In 2 0 2 2 164 Seagull Dr, Port Angeles MLS# 1893198 | $2,980,000 2298 Freshwater Bay Rd, Port Angeles MLS# 1922060 | $1,700,000 346 Ocean Cove Ln, Port Angeles MLS# 1969330 | $1,354,033 STATE OF THE MARKET 3.0 months of inventory - Neutral Market (Based on closed sales, March 2023 inventory. Seller’s Market = 0 to 3 months inventory, Neutral Market = 3 to 6 months inventory, Buyer’s Market = 6+ months inventory) New Listings Closed Sales AVERAGE PRICE PER SQUARE FOOT Single-Family Homes ↑(18.75%) MEDIAN SALES PRICE Single-Family Homes ↑(2.22%) 5 10 15 20 25 30 35 40 45 50 55 60 2020 2021 2022 2019 2018 rsirwaterfront.com PORT ANGELES NEW LISTINGS VS. CLOSED SALES 2018-2022 SELLER ’SMARKET NEUTRAL BUYER’S MARKET NEUTRAL MARKET 3.0 MONTHS OF SUPPLY 2021 $304 SQ. FT. 2022 $361 SQ. FT. 2020 318 FT. 2022 456 FT. 2021 15 8 FT. 20 21 20 22 $599K AVERAGE DAYS ON MARKET 2022 25 2021 29 2020 121 AVERAGE LINEAR WATERFRONT FOOTAGE $586K
1 2 3
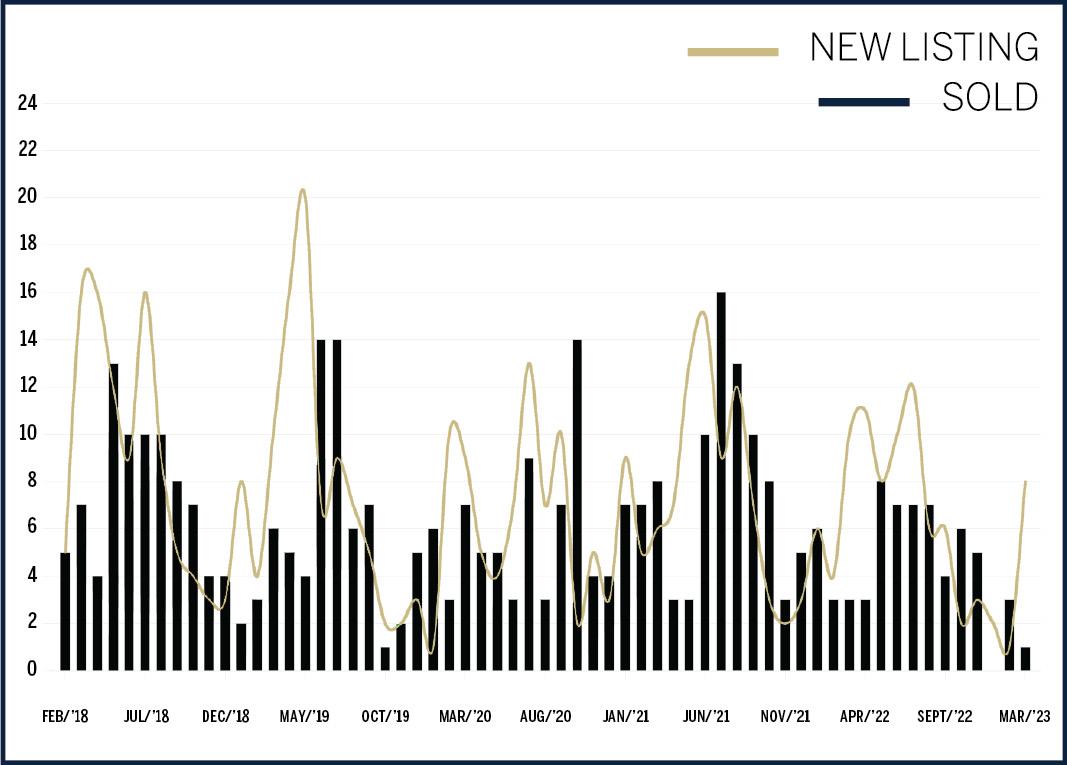
Maybe it’s the Microsoft e ect, maybe it’s the top-rated schools, but waterfront living in Redmond saw appreciation in 2022 when other areas saw at growth or shallow declines. The median sales price for a Redmond waterfront home was up 25% year over and the average price per square foot was up nearly 15%. The market wasn’t perfect, but there were more new listings in 2022 than there had been over the past ve years—39 homes went on the market. But closed waterfront sales were down to 19. Redmond hasn’t seen so few closed waterfront sales in a single year since 2016. That meant that last year, and this year, the guidance of a Realogics Sotheby’s International Realty waterfront expert is key to pricing and marketing waterfront properties amid our shifting market.
Waterfront Market Report
Each o ce is Independently owned and operated. All reports presented are based on data supplied by the Northwest MLS. Neither the Associations nor their MLSs guarantee or are in anyway responsible for its accuracy. Data maintained by the Associations or their MLSs may not re ect all real estate activities in the market. Information deemed reliable but not guaranteed. Redmond data includes the city of Redmond.
‘23
Redmond Top Three Waterfront Sales In 2 0 2 1 2020 W Lake Sammamish Pkwy, Redmond MLS# 1908123 | $3,100,000 4020 W Ames Lake Dr, Redmond MLS# 1954842 | $2,800,000 12653 Avondale Rd NE, Redmond MLS# 1943534
$2,200,000 STATE OF THE MARKET 2.0 months of inventory - Seller’s Market (Based on closed sales, March 2023 inventory. Seller’s Market = 0 to 3 months inventory, Neutral Market = 3 to 6 months inventory, Buyer’s Market = 6+ months inventory) New Listings Closed Sales AVERAGE PRICE PER SQUARE FOOT Single-Family Homes ↑(14.98%) MEDIAN SALES PRICE Single-Family Homes ↑(25.61%) 5 10 15 20 25 30 35 40 45 2021 2022 2020 2019 2018 rsirwaterfront.com REDMOND NEW LISTINGS VS. CLOSED SALES 2018-2022 SELLER ’SMARKET NEUTRAL BUYER’S MARKET SELLER’S MARKET 2.0 MONTHS OF SUPPLY 2021 $601 SQ. FT. 2022 $691 SQ. FT. 2020 100 FT. 2022 63 FT. 2021 72 FT. 20 21 20 22 $1.8M AVERAGE DAYS ON MARKET 2022 27 2021 25 2020 89 AVERAGE LINEAR WATERFRONT FOOTAGE $1.433M 1 2 3
|
Renton
The southern shoreline of Lake Washington sometimes feels like Renton’s best-kept secret. From Lakeridge to Kennydale, to a few other low-key locales on quiet in-city lakes, there’s so much to explore. Yet, 2022 saw declines across the board. Year over year, the median sales price was down 26% and the average price per square foot was down nearly 19%. From 2021 to 2022, there was a 34% decline in the number of new listings to hit the market, and the closed sales dropped 46%. Buyers who are looking for a Renton shoreline property to call their own may be at an advantage here, although inventory remains tight. Sellers who are ready to enter the market will have still seen appreciation gains over the past ve years, but they can enjoy the positive news that experts believe the market has already bottomed and is on its way back up—just like buyer demand.
Waterfront
Each o ce is Independently owned and operated. All reports
are
on data supplied by the Northwest MLS. Neither the Associations nor their MLSs guarantee or are in anyway responsible for its accuracy. Data maintained by the Associations or their MLSs may not re ect all real estate activities in the market. Information deemed reliable but not guaranteed. Renton data includes the city of Renton.
Market Report ‘23
presented
based
Top Three Waterfront Sales In 2 0 2 2 17425 E Lake Desire Dr SE, Renton MLS# 1898349 | $2,110,000 6631 Ripley Ln SE, Renton MLS# 1910666 | $2,030,000 13717 E Lake Kathleen Dr SE, Renton MLS# 1921515 | $1,930,000 STATE OF THE MARKET 1.5 months of inventory - Seller’s Market (Based on closed sales, March 2023 inventory. Seller’s Market = 0 to 3 months inventory, Neutral Market = 3 to 6 months inventory, Buyer’s Market = 6+ months inventory) New Listings Closed Sales AVERAGE PRICE PER SQUARE FOOT Single-Family Homes ↓(-18.92%) MEDIAN SALES PRICE Single-Family Homes ↓(-26.37%) 5 10 15 20 25 30 35 40 45 50 55 60 2021 2022 2020 2019 2018 SELLER ’SMARKET NEUTRAL BUYER’S MARKET SELLER’S MARKET 1.5 MONTHS OF SUPPLY rsirwaterfront.com RENTON NEW LISTINGS VS. CLOSED SALES 2018-2022 2021 $650 SQ. FT. 2022 $527 SQ. FT. 2020 75 FT. 2022 72 FT. 2021 7 9 FT. 20 21 20 22 $913K AVERAGE DAYS ON MARKET 2022 25 2021 11 2020 66 AVERAGE LINEAR WATERFRONT FOOTAGE $1.24M
1 2 3
Sammamish & Issaquah
This area and this waterfront remain some of the Eastside’s most in-demand shoreline. Still, it was hit hard by the market shifts in 2022. While new listings were down from 72 in 2021 to 28 in 2022, the number of closed sales sank year over year by nearly 44%. Of those that did sell, the average o er was above the list price. In a community with top-ranked schools, close to the Eastside tech sector, and growth potential as the Sammamish Town Center project gets underway, being a buyer here certainly has its opportunities as the market adjusts. Still, sellers armed with the backing of a Realogics Sotheby’s International Realty waterfront expert will be at an advantage, knowing how to price and market their home to attract attention and help them achieve top-dollar and reach their real estate goals.
Waterfront
Market Report ‘23 Each o ce is Independently owned and operated. All reports presented are based on data supplied by the Northwest MLS. Neither the Associations nor their MLSs guarantee or are in anyway responsible for its accuracy. Data maintained by the Associations or their MLSs may not re ect all real estate activities in the market. Information deemed reliable but not guaranteed. Sammamish and Issaquah data includes the cities of Sammamish and Issaquah.
Top Three Waterfront Sales In 2 0 2 2 18884 SE 42nd St, Issaquah MLS# 1909621 | $11,600,000 1817 E Lake Sammamish Pl SE, Sammamish MLS# 1954077 | $6,200,000 247 E Lake Sammamish Pkwy SE, Sammamish MLS# 1939729 | $5,395,000 STATE OF THE MARKET 3.3 months of inventory - Neutral Market (Based on closed sales, March 2023 inventory. Seller’s Market = 0 to 3 months inventory, Neutral Market = 3 to 6 months inventory, Buyer’s Market = 6+ months inventory) New Listings Closed Sales AVERAGE PRICE PER SQUARE FOOT Single-Family Homes ↑(2.25%) MEDIAN SALES PRICE Single-Family Homes ↓(15.30%) 10 20 30 40 50 60 70 80 90 2022 2020 2021 2019 2018 SELLER ’SMARKET NEUTRAL BUYER’S MARKET NEUTRAL MARKET 3.3 MONTHS OF SUPPLY rsirwaterfront.com SAMMAMISH & ISSAQUAH NEW LISTINGS VS. CLOSED SALES 2018-2022 2021 $775 SQ. FT. 2022 $772 SQ. FT. 2020 111 FT. 2022 101 FT. 2021 109 FT. 20 21 20 22 $1.55M AVERAGE DAYS ON MARKET 2022 16 2021 12 2020 55 AVERAGE LINEAR WATERFRONT FOOTAGE $1.83M 1 2 3
San Juan Islands
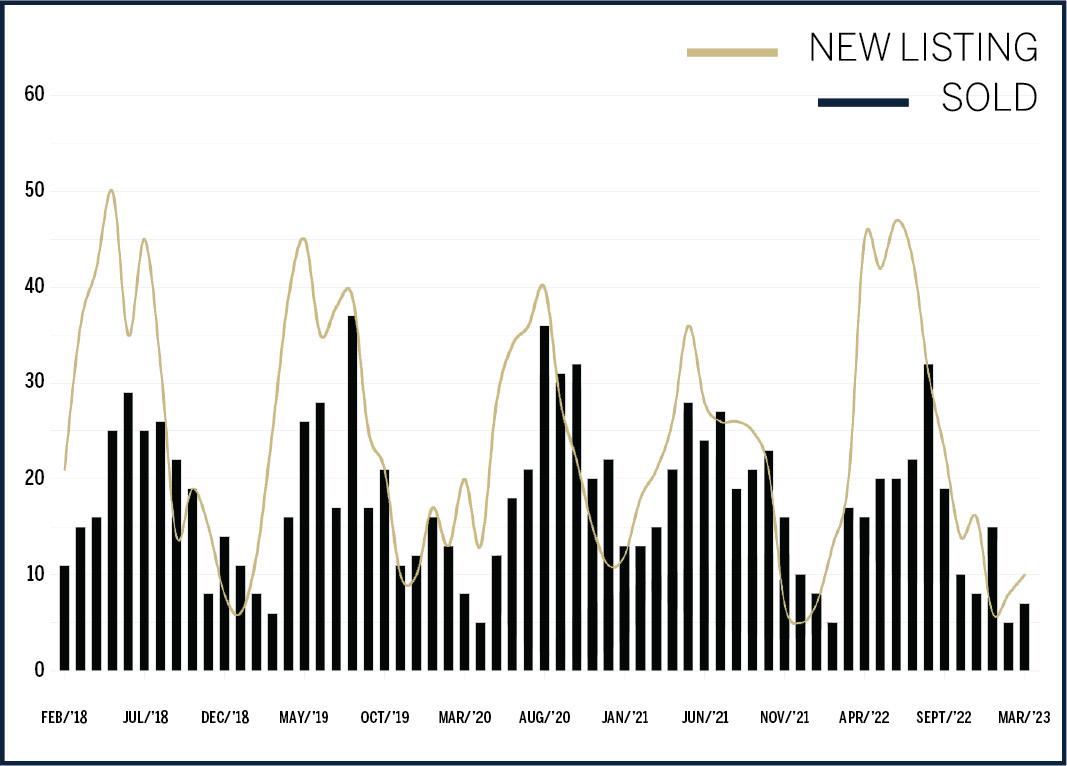
Life in the San Juans is an experience all its own. Whether you long for views from a high-bank property in Greenbank or are looking for a piece of shoreline that may or may not be a private island (or at least close to it), the San Juans are one of Washington’s most desired escapes. Because of the park-like settings of many of the waterfront o erings, the average linear footage often climbs into the thousands. And because many of these homes are considered remote retreats instead of in-city enclaves, the time they spend on the market can vary dramatically from year to year. The area wasn’t una ected by in ation, climbing interest rates, and other economic concerns in 2022. The number of closed sales dropped by 37.5% year over year, and the median sales price ticked down very slightly by 2.35%, though the average price per square foot was up year over year by more than 7%.
Waterfront Market Report
Each o ce is Independently owned and operated. All reports presented are based on data supplied by the Northwest MLS. Neither the Associations nor their MLSs guarantee or are in anyway responsible for its accuracy. Data maintained by the Associations or their MLSs may not re ect all real estate activities in the market. Information deemed reliable but not guaranteed. San Juan Islands data includes San Juan County. *Represents Realogics Sotheby’s International Realty sales.
‘23
Top Three Waterfront Sales In 2 0 2 2 172 & 165 San Juan Dr, Friday Harbor MLS# 1985260 | $8,950,000 93 Hunziker Rd, Orcas Island MLS# 1824691 | $7,995,000 84 Parks Bay Dr, Shaw Island* MLS# 1935338 | $6,875,000 STATE OF THE MARKET 10 months of inventory - Buyer’s Market (Based on closed sales, March 2023 inventory. Seller’s Market = 0 to 3 months inventory, Neutral Market = 3 to 6 months inventory, Buyer’s Market = 6+ months inventory) 10 20 30 40 50 60 70 80 90 100 110 120 130 140 150 SELLER ’SMARKET NEUTRAL BUYER’S MARKET BUYER’S MARKET 10.0 MONTHS OF SUPPLY 2021 2022 2020 2019 2018 New Listings Closed Sales AVERAGE PRICE PER SQUARE FOOT Single-Family Homes ↑(7.71%) MEDIAN SALES PRICE Single-Family Homes ↓(-2.35%) rsirwaterfront.com SAN JUAN ISLANDS NEW LISTINGS VS. CLOSED SALES 2018-2022 2021 $882 SQ. FT. 2022 $950 SQ. FT. 2020 275 FT. 2022 330 FT. 2021 464 FT. 20 21 20 22 $1.538M AVERAGE DAYS ON MARKET 2022 58 2021 114 2020 215 AVERAGE LINEAR WATERFRONT FOOTAGE $1.5 75M 1 2 3
Sequim
The waterfront market in Sequim saw some impressive growth over the past year. In fact, the median sales price shot up by 33% from $660,000 in 2021 to $880,000 in 2022. The average price per square foot stayed about the same with less than a one percent year-over-year di erence. Compared to other markets in the region that experienced a slowdown in sales with listings sitting on the market longer, in 2022, Sequim’s waterfront listings’ average days on market dropped from 2021’s average of 53 days to 40 days. Although an average of 40 days does not signal a fast-moving market with homes selling as soon as they hit the market, it does indicate that Sequim’s market has had more stability than other similar locales. Sellers can still see impressive appreciation and buyers will bene t from plenty of inventory from which to choose.
Waterfront Market Report ‘23 Each o ce is Independently owned and operated. All reports presented are based on data supplied by the Northwest MLS. Neither the Associations nor their MLSs guarantee or are in anyway responsible for its accuracy. Data maintained by the Associations or their MLSs may not re ect all real estate activities in the market. Information deemed reliable but not guaranteed. Sequim data includes the City of Sequim.
Top Three Waterfront Sales In 2 0 2 2 188 W Anderson Rd, Sequim MLS# 1837976 | $2,687,500 63 E Seashore Ln, Sequim MLS# 1902729 | $1,850,000
Discovery Wy, Sequim MLS# 1956563 | $1,475,000 STATE OF THE MARKET 5.0 months of inventory - Neutral Market (Based on closed sales, March 2023 inventory. Seller’s Market = 0 to 3 months inventory, Neutral Market = 3 to 6 months inventory, Buyer’s Market = 6+ months inventory) New Listings Closed Sales AVERAGE PRICE PER SQUARE FOOT Single-Family Homes ↑(0.24%) MEDIAN SALES PRICE Single-Family Homes ↑(33.33%) rsirwaterfront.com 5 10 15 20 25 30 40 45 35 2021 2022 2020 2019 2018 SEQUIM NEW LISTINGS VS. CLOSED SALES 2018-2022 SELLER ’SMARKET NEUTRAL BUYER’S MARKET NEUTRAL MARKET 5.0 MONTH OF SUPPLY 2021 $424 SQ. FT. 2022 $425 SQ. FT. 2020 13 5 FT. 2022 152 FT. 2021 169 FT. 20 21 20 22 $880K AVERAGE DAYS ON MARKET 2022 40 2021 53 2020 55 AVERAGE LINEAR WATERFRONT FOOTAGE $660K 1 2 3
441
Southwest Lake Washington
These Lake Washington homes were hard to come by in 2022. The number of new listings was down from 14 in 2021 to just 5 in 2022. Likewise, the number of closed sales was down 50% year over year. In fact, before this year, this area hadn’t seen the number of closed sales dip into the single digits since 2018, when there were only three closed sales. The lack of inventory didn’t hurt the median sales price though, which was up 22% year over year, and the average price per square foot also saw a jump of 34%. Despite market conditions across the region, the average time one of these waterfront homes spent on the market was down to nine days, whereas in 2021, the average days spent on market was 43. Local experts from Realogics Sotheby’s International Realty know the value of these incredible homes and can price them to sell. For buyers, keep a keen eye out for your ideal home, it could go pending in the blink of an eye.
Waterfront
Each
their
guarantee or are in
their
re ect all real estate activities in the market. Information deemed reliable but not
Southwest
Market Report ‘23
o ce is Independently owned and operated. All reports presented are based on data supplied by the Northwest MLS. Neither the Associations nor
MLSs
anyway responsible for its accuracy. Data maintained by the Associations or
MLSs may not
guaranteed.
Lake Washington data includes MLS Area 380.
Top Three Waterfront Sales In 2 0 2 2 6408 60th Place S, Seattle MLS# 1983589 | $3,105,000 10402 Rainier Ave S, Seattle MLS# 1926177 | $2,780,000 9852 Rainier Ave S, Seattle MLS# 1918421 | $2,440,000 SEATTLE STATE OF THE MARKET 1.0 months of inventory - Seller’s Market (Based on closed sales, March 2023 inventory. Seller’s Market = 0 to 3 months inventory, Neutral Market = 3 to 6 months inventory, Buyer’s Market = 6+ months inventory) New Listings Closed Sales 5 10 15 20 25 30 2021 2022 2020 2019 2018 AVERAGE PRICE PER SQUARE FOOT Single-Family Homes ↑(34.17%) MEDIAN SALES PRICE Single-Family Homes ↑(33.30%) rsirwaterfront.com SOUTHWEST SEATTLE NEW LISTINGS VS. CLOSED SALES 2018-2022 SELLER ’SMARKET NEUTRAL BUYER’S MARKET SELLER’S MARKET 1.0 MONTH OF SUPPLY 2021 $600 SQ. FT. 2022 $805 SQ. FT. 2020 62 FT. 2022 69 FT. 2021 53 FT. 20 21 20 22 $2.61M AVERAGE DAYS ON MARKET 2022 9 2021 43 2020 117 AVERAGE LINEAR WATERFRONT FOOTAGE $1.958M 1 2 3
West Seattle
The bridge may have reopened West Seattle to the world in 2022, but the waterfront homes saw a decline in their median sales price despite the easier access, down 13% year over year. Before that sounds like doom and gloom, take a look at the average square foot price, up 25% year over year. Also up between 2021 and 2022? The average linear footage of a sold West Seattle shoreline. The number of closed sales was down year over year, but only from 17 in 2021 to 15 in 2022. And that’s still more closed sales compared to 2020 and 2019. And despite the shifting market that clouded the region in 2022, the average number of days a waterfront home spent on market trended down, from 41 days in 2021 to 38 days in 2022.
Waterfront Market Report
Each
‘23
o ce is Independently owned and operated. All reports presented are based on data supplied by the Northwest MLS. Neither the Associations nor their MLSs guarantee or are in anyway responsible for its accuracy. Data maintained by the Associations or their MLSs may not re ect all real estate activities in the market. Information deemed reliable but not guaranteed. West Seattle data includes MLS Area 140.
Top Three Waterfront Sales In 2 0 2 2 9325 Fauntleroy Wy SW MLS# 1779507 | $6,747,000 9829 51st Ave SW* MLS# 1966688 | $3,995,000 6041 Beach Dr SW MLS# 1924351 | $3,931,000 SEATTLE STATE OF THE MARKET 1.5 months of inventory - Seller’s Market (Based on closed sales, March 2023 inventory. Seller’s Market = 0 to 3 months inventory, Neutral Market = 3 to 6 months inventory, Buyer’s Market = 6+ months inventory) New Listings Closed Sales 5 10 15 20 25 30 35 2021 2022 2020 2019 2018 AVERAGE PRICE PER SQUARE FOOT Single-Family Homes ↑(25.97%) MEDIAN SALES PRICE Single-Family Homes ↓(-13.04%) rsirwaterfront.com WEST SEATTLE NEW LISTINGS VS. CLOSED SALES 2018-2022 SELLER ’SMARKET NEUTRAL BUYER’S MARKET SELLER’S MARKET 1.5 MONTHS OF SUPPLY 2021 $774 SQ. FT. 2022 $975 SQ. FT. 2020 48 FT. 2022 58 FT. 2021 46 FT. 20 21 20 22 $2M AVERAGE DAYS ON MARKET 2022 38 2021 41 2020 62 AVERAGE LINEAR WATERFRONT FOOTAGE $2.3M 1 2 3
Glossary
Bay
A broad inlet of the sea where the land curves inward.
Boathouse
A structure at the edge of the water used to house boats.
Bulkhead
A wall that separates a property from the water; in some cases, property owners are responsible for maintaining the bulkheads.
Buoy
An anchored float serving as a navigation mark to show reefs or other hazards, or for mooring.
Coastal
Of or located near a coast.
Cove
A small, sheltered bay.
Deadhead
Logs lost from towed rafts or other wood debris which becomes lodged in the seafloor.
Dock

A usually wooden pier used as a landing place or moorage for boats.
Floating home
A floating residence constructed according to city code and connected to city sewer, water, and electricity; usually located in a co-op-owned or condo slip.
Foreshore
The part of a shore between high and low water marks or between the water and cultivated or developed land.
Frontage
A strip or extent of land abutting water; the boundary between the water and land fronting on and providing access to a watercourse, bay or lake.
Harbor
A place on the coast where vessels may find shelter, especially one protected from rough water by piers, jetties, and other artificial structures.
High bank
No access to the water and located on a cliff or steep slope, deep water below with dramatic views.
Houseboat
A barge designed and equipped for use as a dwelling.
Jetty
A landing stage or small pier at which boats can dock or be moored.
Lakefront
The land along the edge of a lake.
Littoral
Zone or nearshore, the part of a sea, lake, or river that is close to the shore, extending from the high water mark, which is rarely inundated, to shoreline areas that are permanently submerged; often refers to the rights and privileges that are incidental to owning property on the shore of sea or a lake.
Low bank
Easy access by a small flight of stairs or an easy climb, many low banks have pocket beaches with docks.
Medium bank
Access to the water with option of watching from above, sometimes access is tide dependent.
Mooring
Any permanent structure to which a vessel may be secured; a place where a boat or ship is moored.
No bank
Smooth transition to the beach and directly into the water; often referred to as beach front.
Non-tidal
Not affected by tides.
Oceanfront
The land that borders the ocean.
Pier
A platform supported on pillars or girders leading out from the shore into a body of water, used as a landing stage for boats.
Piling
Heavy stakes or posts installed to support a structure, often found in waterfront properties.
Private beach
A beach that is owned by a person, a group of people, or a company; the beach is not accessible to the general public.
Private mooring
Private dock or slip to moor a boat.
Protected
Shoreline protection is intended to decrease or eliminate coastal erosion; protection involves the construction of engineered structures or techniques that slow erosion.
Riparian
Relating or situated on the banks of a river; often refers to rights and privileges that are incidental to the ownership fronting on a body of water.
Saltwater
Seawater and things found in saltwater, living in the sea.
Shared beach
Shared beach access from multiple properties.
Shared mooring
Shared dock where more than one property can moor their boats.
Shoreline
The line alongside a large body of water where it meets the land.
Slip
A designated docking boat space that is protected on three sides.
Sound
An inlet linked to the ocean by a strait; the Puget Sound is linked to the ocean by the Strait of Juan De Fuca, Seattle is situated on its eastern shore.
Strait
A narrow passage of water connecting two seas or two other large areas of water.
Tidal
Relating or affected by tides.
Tideland
Land submerged during high tide.
Tide flat
Land above water at a normal low tide.
Tide pool
An isolated pocket of seawater found where the ocean meets the land and is usually packed with sea life.
Upland
Waterfront lands located above the high-water mark.
Vista
A pleasing view, especially one seen through a long, narrow opening.
Water access
Accessible from property by small beach or stairs.
Water view
Water is viewable from the property.
Wharf
A level quayside area to which a ship may be moored to load and unload.
rsirwaterfront.com For the best in the Northwest, just add water.
