

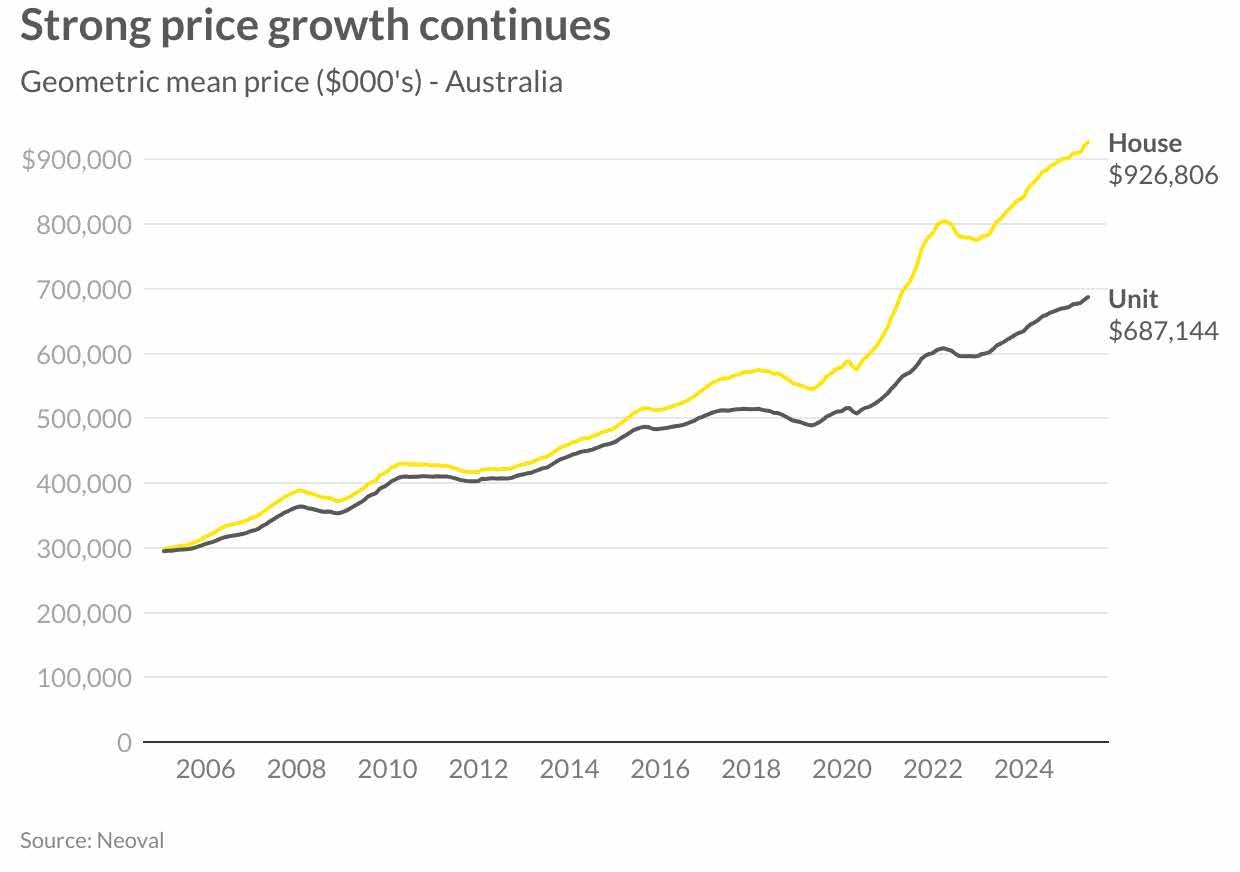
Australian property prices continued their remarkable acceleration in May 2025, with house prices rising 0.7 per cent to reach $926,806, delivering annual growth of 5.2 per cent. Unit values advanced 0.6 per cent to $687,144, achieving 4.5 per cent year-on-year appreciation.
The momentum that began with January’s recovery has intensified significantly following the Reserve Bank’s interest rate cuts, creating conditions reminiscent of 2021 and far exceeding early-year predictions. Perth continues its extraordinary trajectory toward the million-dollar threshold, while Sydney’s acceleration positions it for a potential two-million-dollar median by late 2026. Adding complexity to market dynamics, the Labor government’s proposed superannuation tax on unrealised gains over $3 million may prompt some SMSF property holders to reassess their portfolios, though immediate market impacts remain limited.
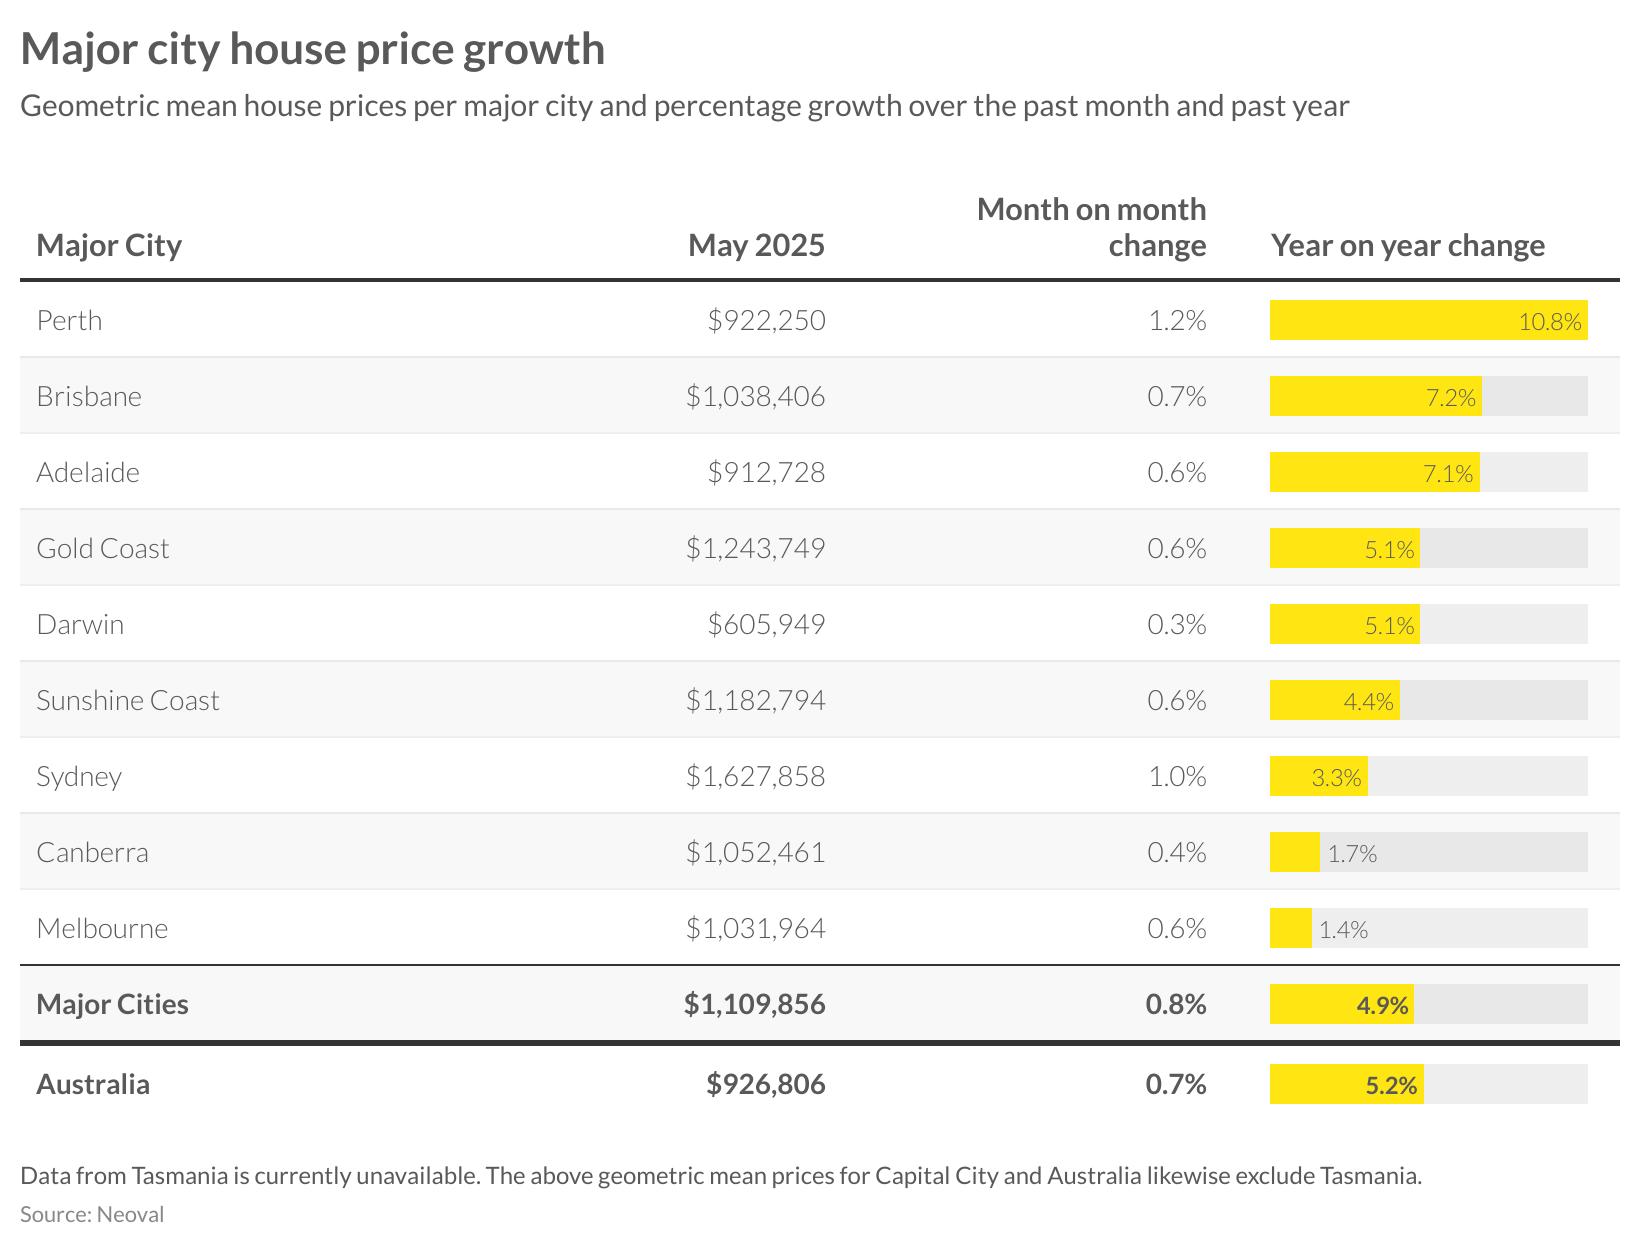
The capital city housing market continues displaying varied performance, with Perth maintaining its position as the standout performer. Perth recorded a robust 1.2 per cent monthly gain, reaching $922,250 and delivering exceptional 10.8 per cent annual growth.
Brisbane established itself firmly above the million-dollar mark at $1,038,406, posting 0.7 per cent monthly growth and solid 7.2 per cent annual appreciation. Adelaide sustained strong momentum with 0.6 per cent monthly growth, reaching $912,728 and achieving 7.1 per cent annual growth. Sydney demonstrated renewed strength with a substantial 1.0 per cent monthly increase to $1,627,858, though annual growth remained modest at 3.3 per cent.
Melbourne recorded 0.6 per cent monthly growth to $1,031,964, but annual growth lagged at just 1.4 per cent. The addition of Sunshine Coast to our reporting shows solid performance at $1,182,794 with 0.6 per cent monthly growth and 4.4 per cent annual appreciation.

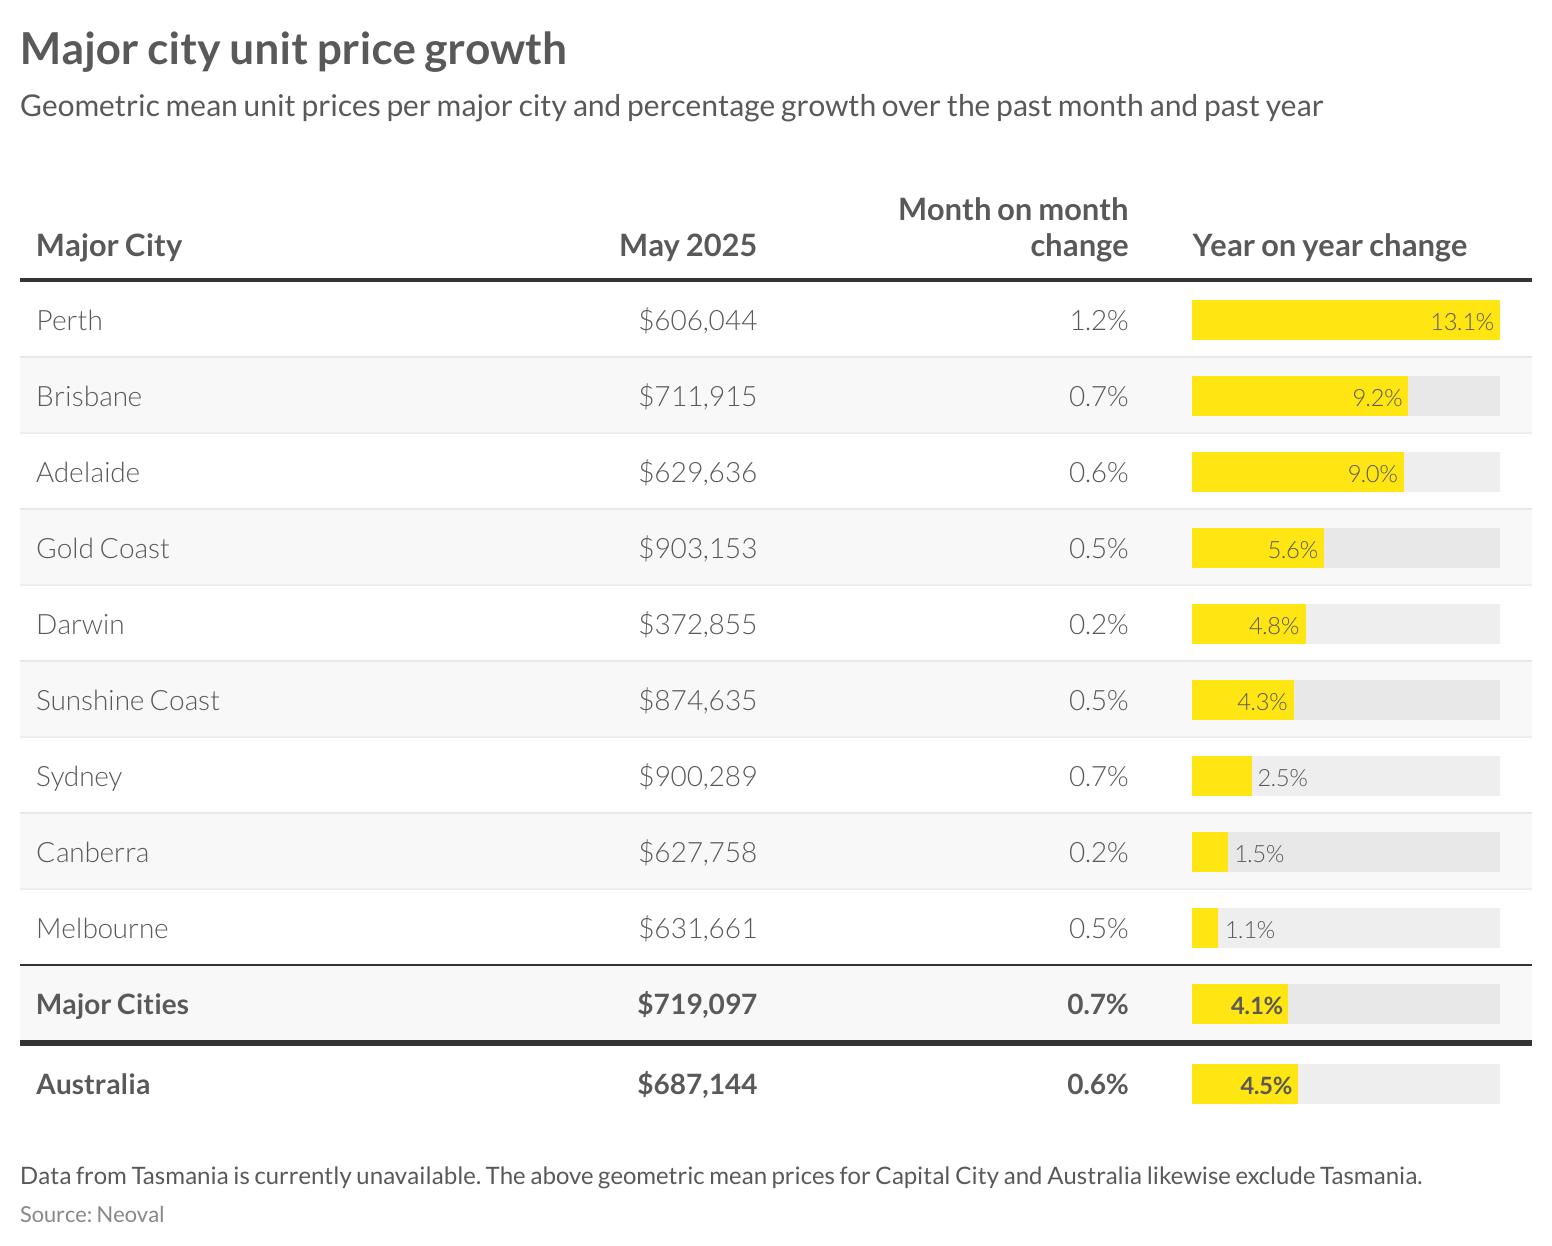
The unit market across major cities demonstrated consistent momentum, with Perth continuing to lead year-on-year growth at 13.1 per cent despite its $606,044 median remaining the most affordable among major markets. Brisbane units recorded strong performance with 0.7 per cent monthly growth, reaching $711,915 and achieving 9.2 per cent annual appreciation. Adelaide units posted 0.6 per cent monthly growth to $629,636, delivering solid 9.0 per cent annual growth. Sydney units advanced 0.7 per cent monthly to $900,289, moving closer to the million-dollar threshold with 2.5 per cent annual growth. The Gold Coast maintained its premium position at $903,153 with 0.5 per cent monthly growth and 5.6 per cent annual appreciation. Melbourne continued showing the most subdued performance with 0.5 per cent monthly growth to $631,661 but just 1.1 per cent annual appreciation, highlighting the divergent recovery patterns across Australia’s unit markets.
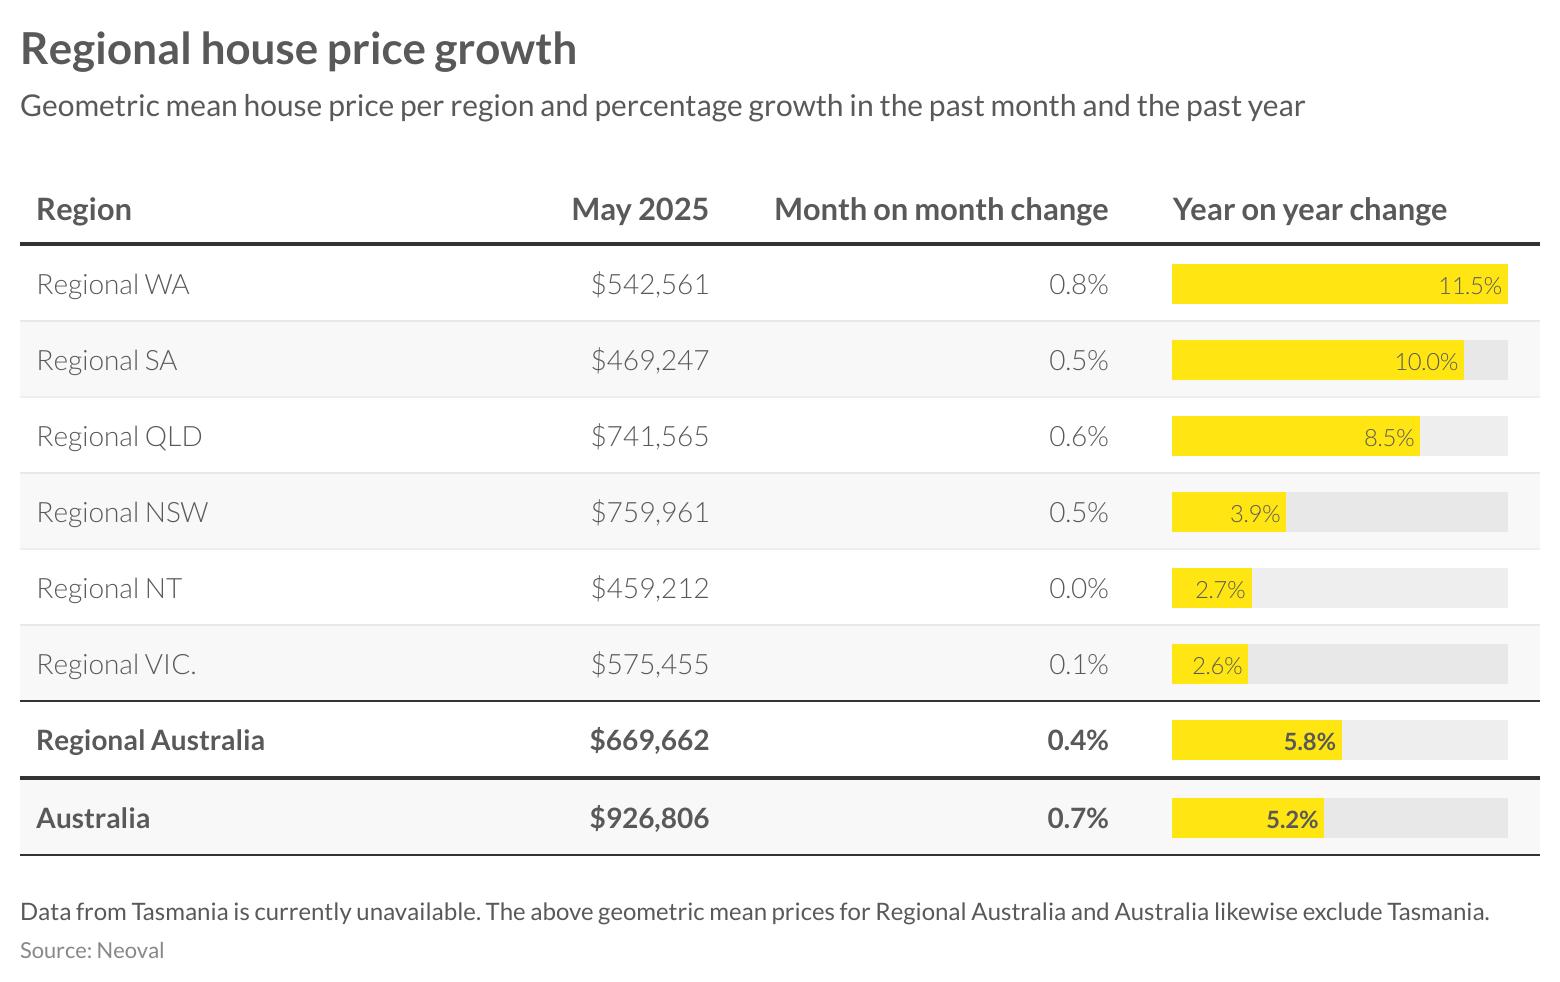
Regional markets continue demonstrating significant variation, with resource-rich states maintaining leadership positions. Regional Western Australia leads with exceptional 11.5 per cent annual growth, reaching $542,561 with a solid 0.8 per cent monthly increase. Regional South Australia follows closely with 10.0 per cent annual growth and a 0.5 per cent monthly gain, bringing the median to $469,247. Regional Queensland maintains strong conditions with 8.5 per cent annual growth and 0.6 per cent monthly appreciation, reaching $741,565. Regional New South Wales, holding the highest median at $759,961, recorded modest 0.5 per cent monthly growth and 3.9 per cent annual appreciation. Regional Victoria and Northern Territory showed more conservative performance with 0.1 per cent and zero monthly movement respectively, delivering 2.6 per cent and 2.7 per cent annual growth. The resource sector’s continued strength, particularly in Western Australia’s lithium and iron ore industries, and South Australia’s copper production, underpins the superior performance in these markets.

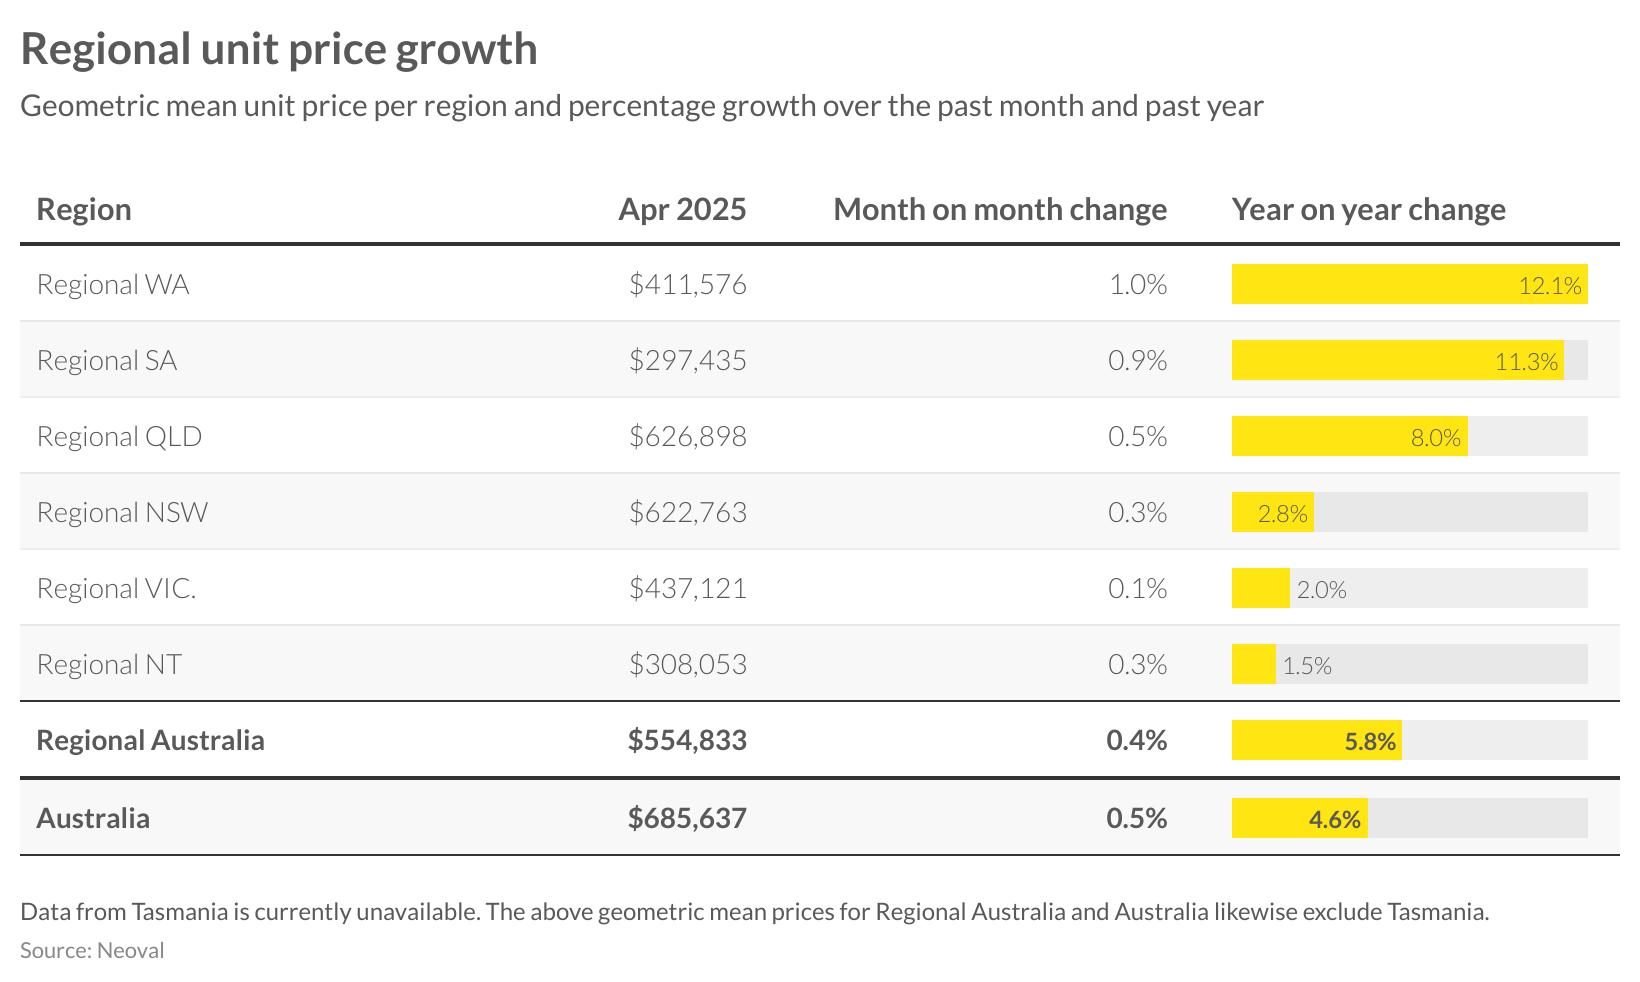
The regional unit market mirrors housing sector trends, with Western Australia and South Australia leading annual growth at 11.8 per cent and 11.2 per cent respectively. Regional Western Australia posted a strong 0.8 per cent monthly increase, reaching $412,078, while regional South Australia gained 0.6 per cent to $300,071. Regional Queensland maintains robust conditions with 8.0 per cent annual growth and 0.6 per cent monthly appreciation, bringing the median to $633,137. Regional New South Wales, with the highest median at $625,710, recorded 0.4 per cent monthly growth and modest 3.2 per cent annual appreciation. Regional Victoria showed limited momentum with 0.2 per cent monthly growth and 2.7 per cent annual appreciation to $438,912. The Northern Territory recorded the only monthly decline at -0.2 per cent, though maintaining 1.4 per cent annual growth. Overall, regional Australia’s unit market continues outperforming the national average with 6.0 per cent annual growth, highlighting the ongoing strength in regional markets driven by lifestyle preferences and relative affordability.
MAJOR CITY HOUSE PRICES (%CHANGE) | SINCE LAST MONTH
MAJOR CITIES - AUSTRALIA
1.2%
$ GEOMETRIC MEAN PRICE % CHANGE IN PRICE
0.3%
0.6%
1.0%
0.6%
REGIONAL HOUSE PRICES (%CHANGE) | SINCE LAST MONTH
REGIONAL AUSTRALIA
$669,662 0.4%
$ GEOMETRIC MEAN PRICE % CHANGE IN PRICE
LISTINGS ACTIVITY
May listing data shows a continued limited market supply, with new listings reaching 38,884 properties nationally. This represents a 9.4 per cent monthly increase from April’s 35,501 listings, yet marks a significant 11.8 per cent annual decline compared to May 2024’s 44,062 properties. The trajectory shows 2025 consistently tracking well below both 2023 and 2024 levels throughout the year, creating the tightest supply conditions seen in recent years.
Despite the typical seasonal moderation as the market enters the historically quieter winter months, the magnitude of the annual decline highlights severe supply constraints. This persistent shortage of properties coming to market represents a critical factor underpinning the current price acceleration, as buyer demand significantly outstrips available stock across most Australian markets.


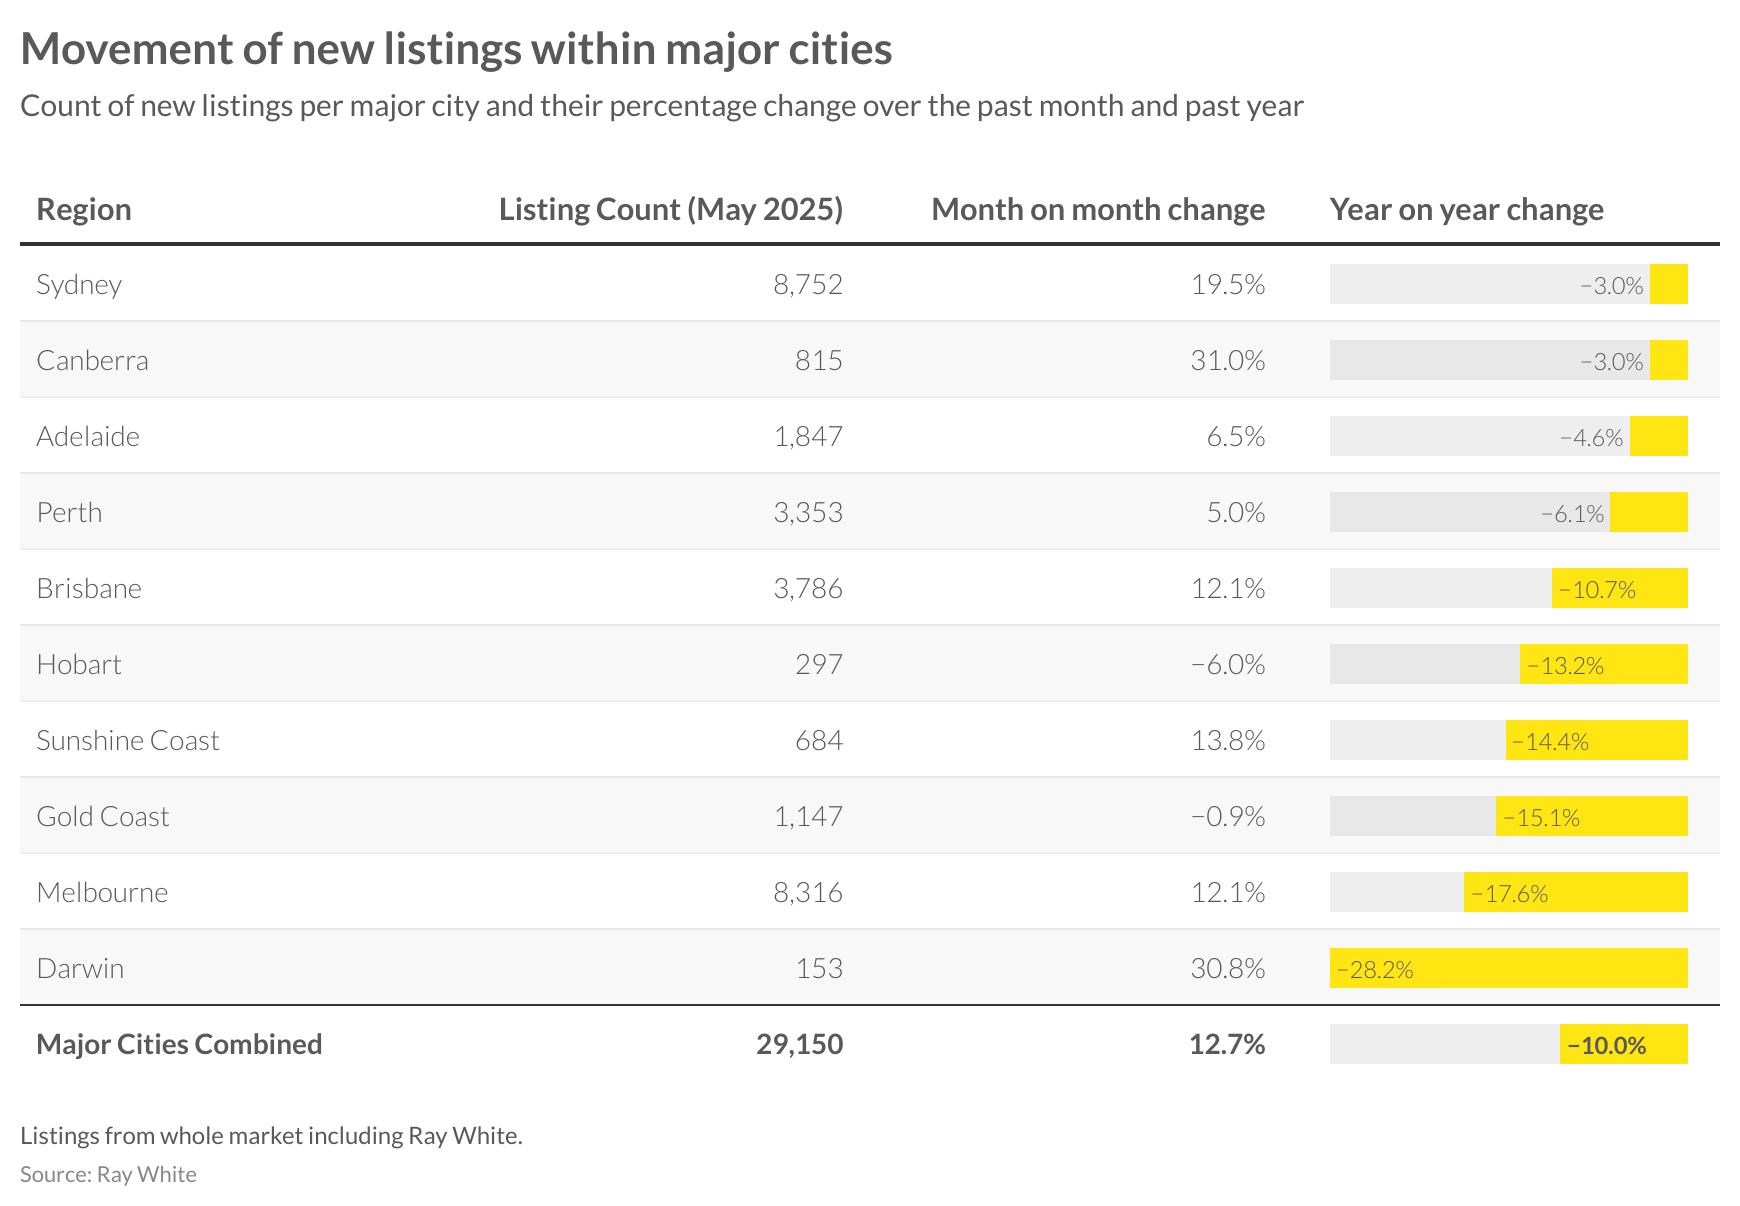
Major cities recorded 29,150 new properties in May, representing a 12.7 per cent monthly increase but a 10.0 per cent annual decline. Sydney dominated with 8,752 listings, though this marked a significant 19.5 per cent monthly surge against a modest 3.0 per cent annual decline. Melbourne contributed 8,316 properties with a strong 12.1 per cent monthly gain, yet recorded a substantial 17.6 per cent annual decrease. Brisbane’s 3,786 listings reflected a 12.1 per cent monthly increase despite a 10.7 per cent annual reduction. Perth’s 3,353 listings showed a 5.0 per cent monthly gain but a 6.1 per cent annual decline. Canberra experienced the most dramatic monthly surge of 31.0 per cent, though annual figures remained 3.0 per cent below 2024 levels. Notably, several smaller markets including Darwin, Gold Coast, and Sunshine Coast recorded significant annual declines, indicating tight supply conditions in these growth markets.

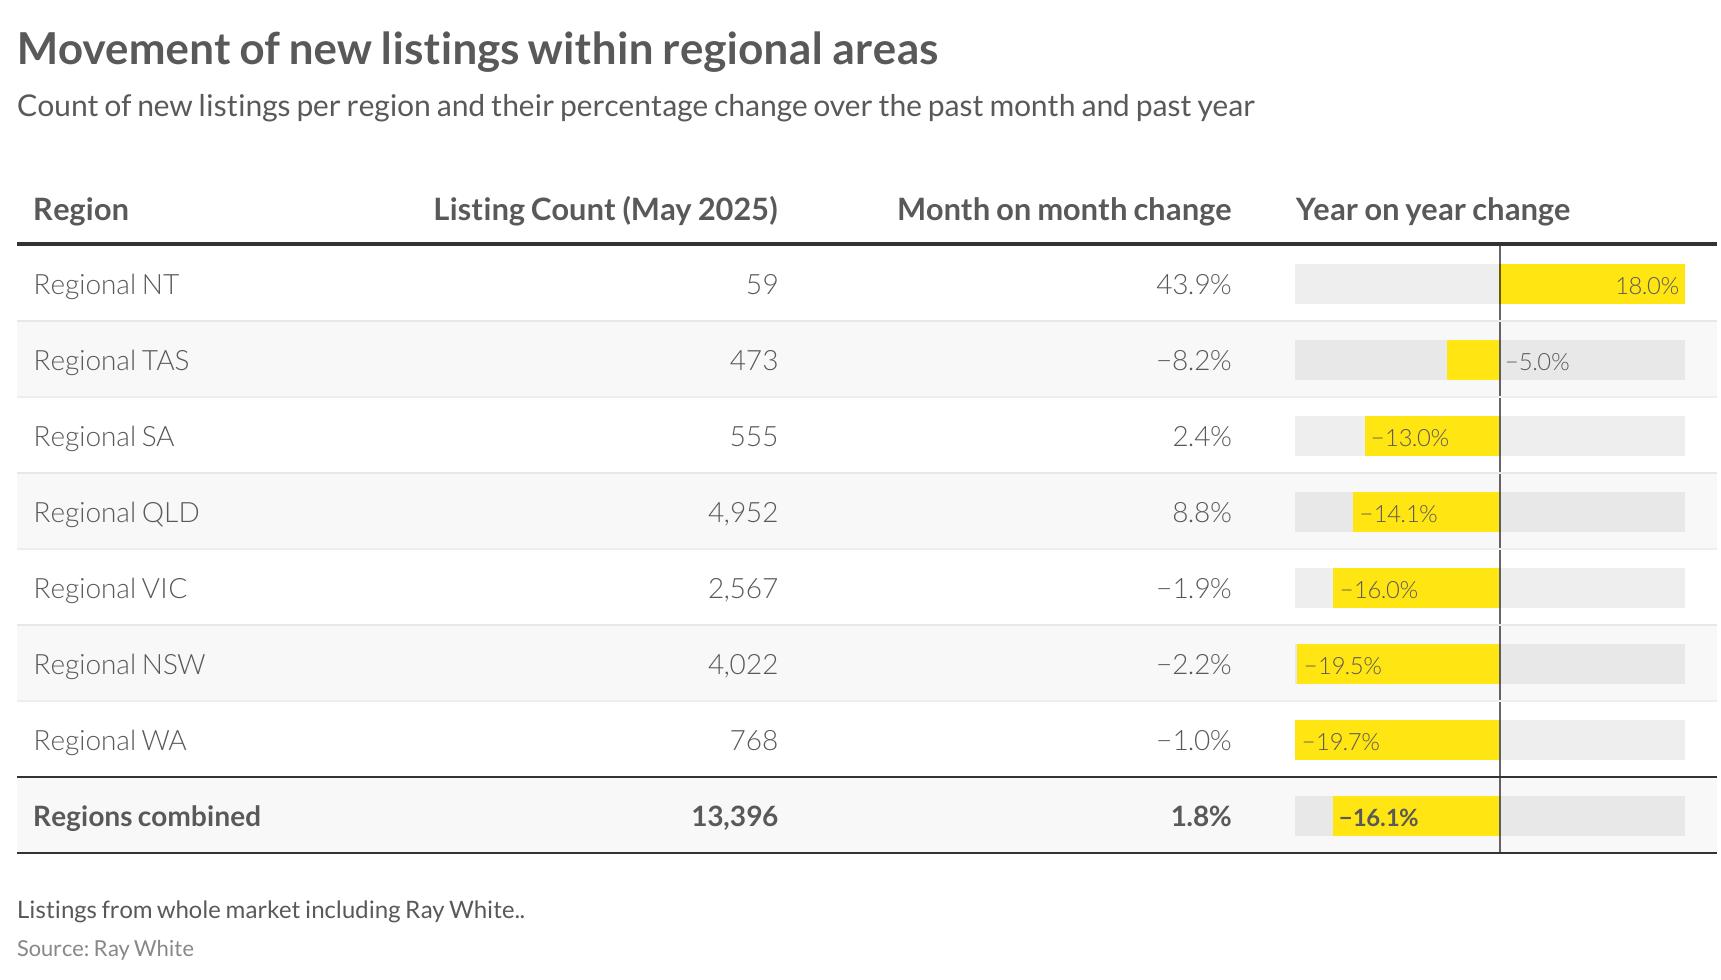
Regional markets posted 13,396 new listings in May, showing a modest 1.8 per cent monthly increase but a significant 16.1 per cent annual decline. Regional Queensland led absolute volumes with 4,952 listings, achieving an 8.8 per cent monthly gain despite a 14.1 per cent annual reduction. Regional New South Wales followed with 4,022 listings, though recording a 2.2 per cent monthly decline and substantial 19.5 per cent annual decrease. Regional Victoria contributed 2,567 listings with a 1.9 per cent monthly decline and 16.0 per cent annual drop. Regional Western Australia posted 768 listings, down 1.0 per cent monthly and 19.7 per cent annually. The Northern Territory emerged as the standout performer with a 43.9 per cent monthly surge, achieving 18.0 per cent annual growth from a modest base of 59 listings, highlighting varying supply dynamics across regional Australia.

AUCTION INSIGHTS
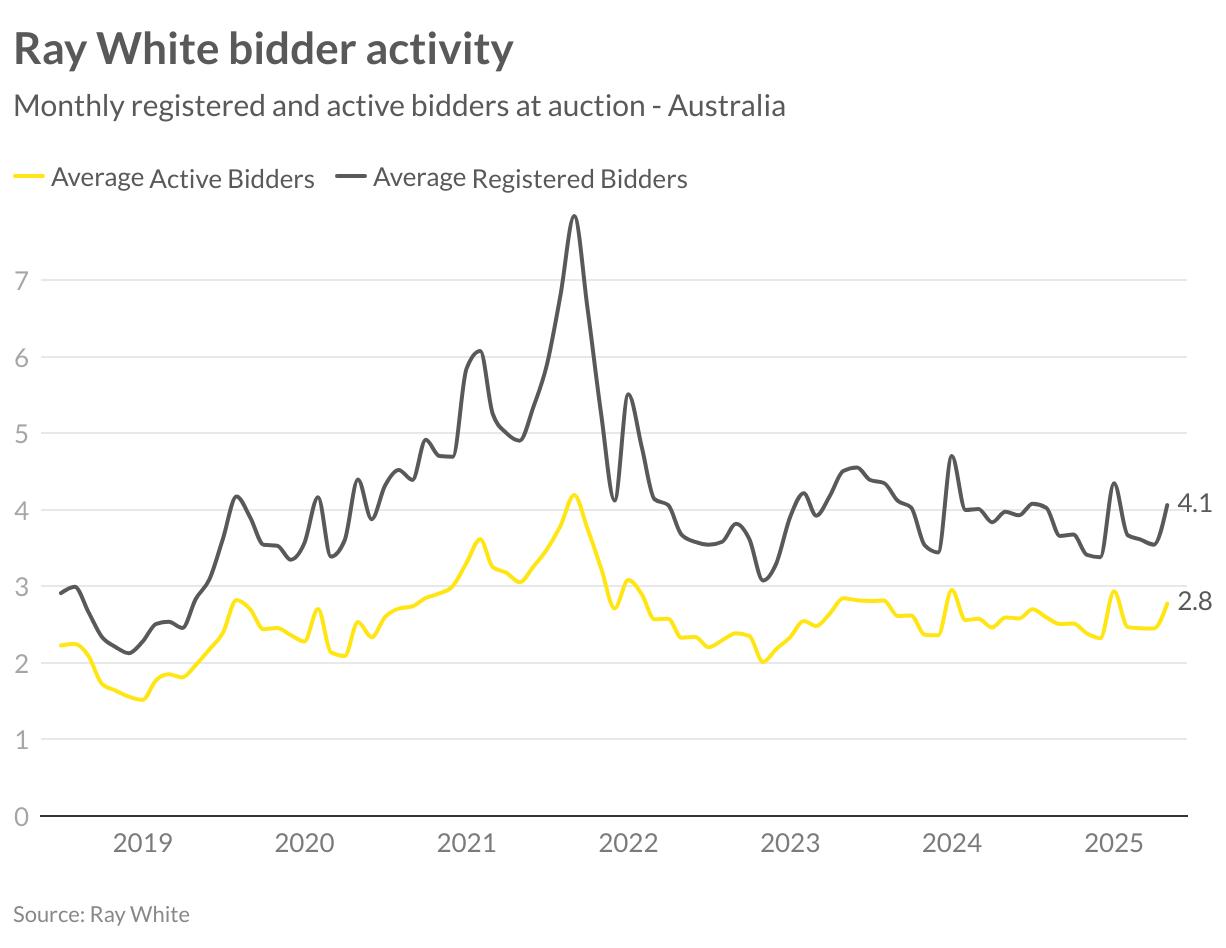
Bidder participation at Ray White auctions maintained steady levels in May, with registered bidders averaging 4.1 per property and active bidders at 2.8 per auction. These figures represent consistent engagement patterns established through early 2025, following the more volatile activity seen during 2022 and 2023. The ratio of active to registered bidders continues indicating serious buyer intent, with approximately 68 per cent of registered participants actively competing. While slightly below the pandemic-era peaks, current participation levels reflect a market where genuine buyers are competing for available stock, supporting ongoing price growth. The stability in bidder numbers, despite increasing auction volumes, suggests buyers are adapting to current market pricing while maintaining competitive pressure at individual sales.

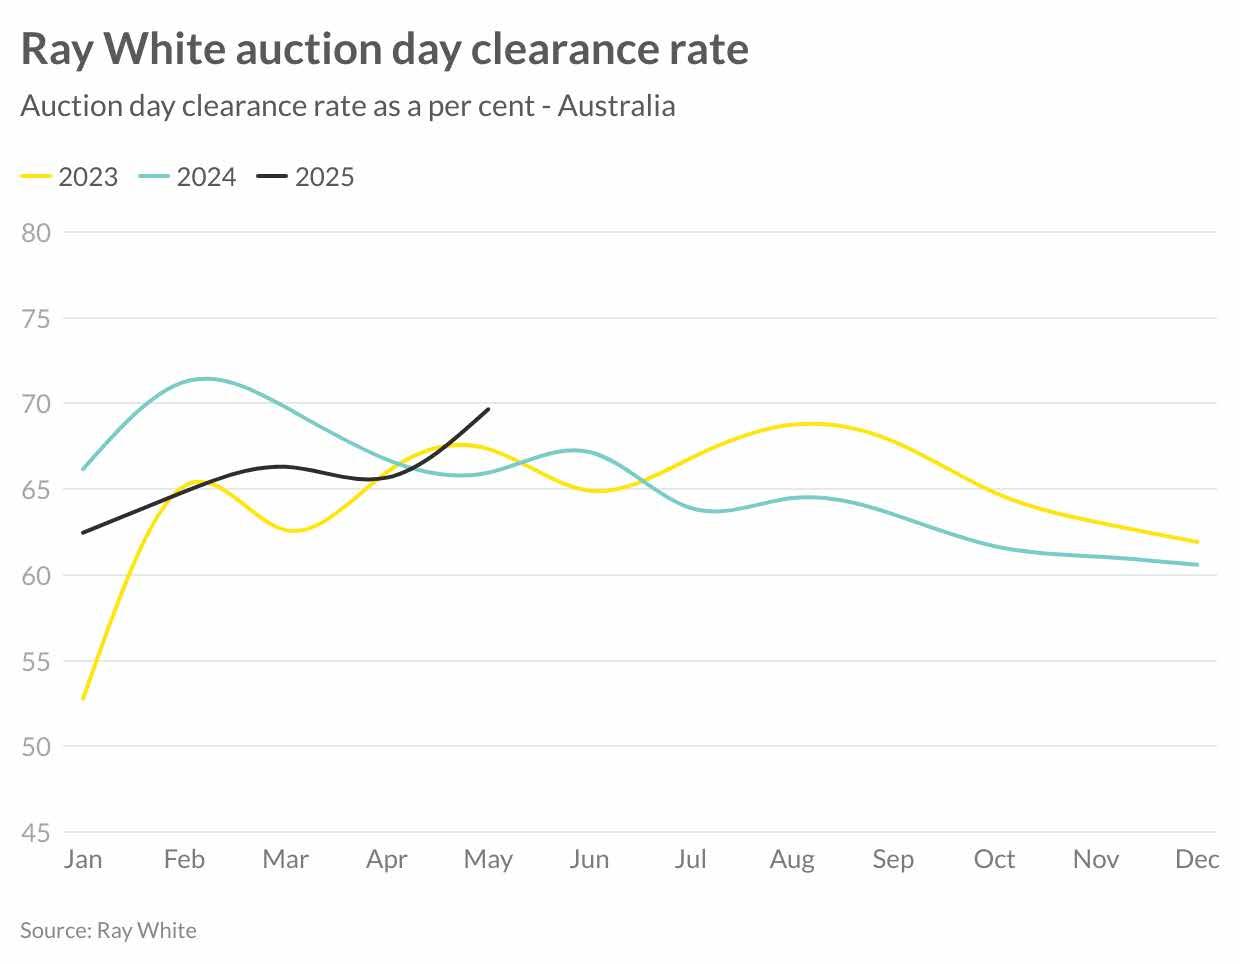
Ray White auction clearance rates strengthened in May, achieving 69.7 per cent compared to April’s 65.7 per cent, marking a solid 4.0 percentage point monthly improvement. This performance represents a significant 5.7 percentage point increase compared to May 2024’s 66.0 per cent, indicating strengthening market conditions year-on-year. The May result positions 2025 performance above both 2023 and 2024 levels for the corresponding period, reflecting sustained buyer demand despite increased property volumes. The improvement in clearance rates coincides with the recent interest rate cuts, which appear to be supporting purchaser confidence and competitive tension at auctions. This strengthening trend suggests the auction market is responding positively to improved financing conditions, with buyers demonstrating increased commitment to securing properties amid ongoing supply constraints.

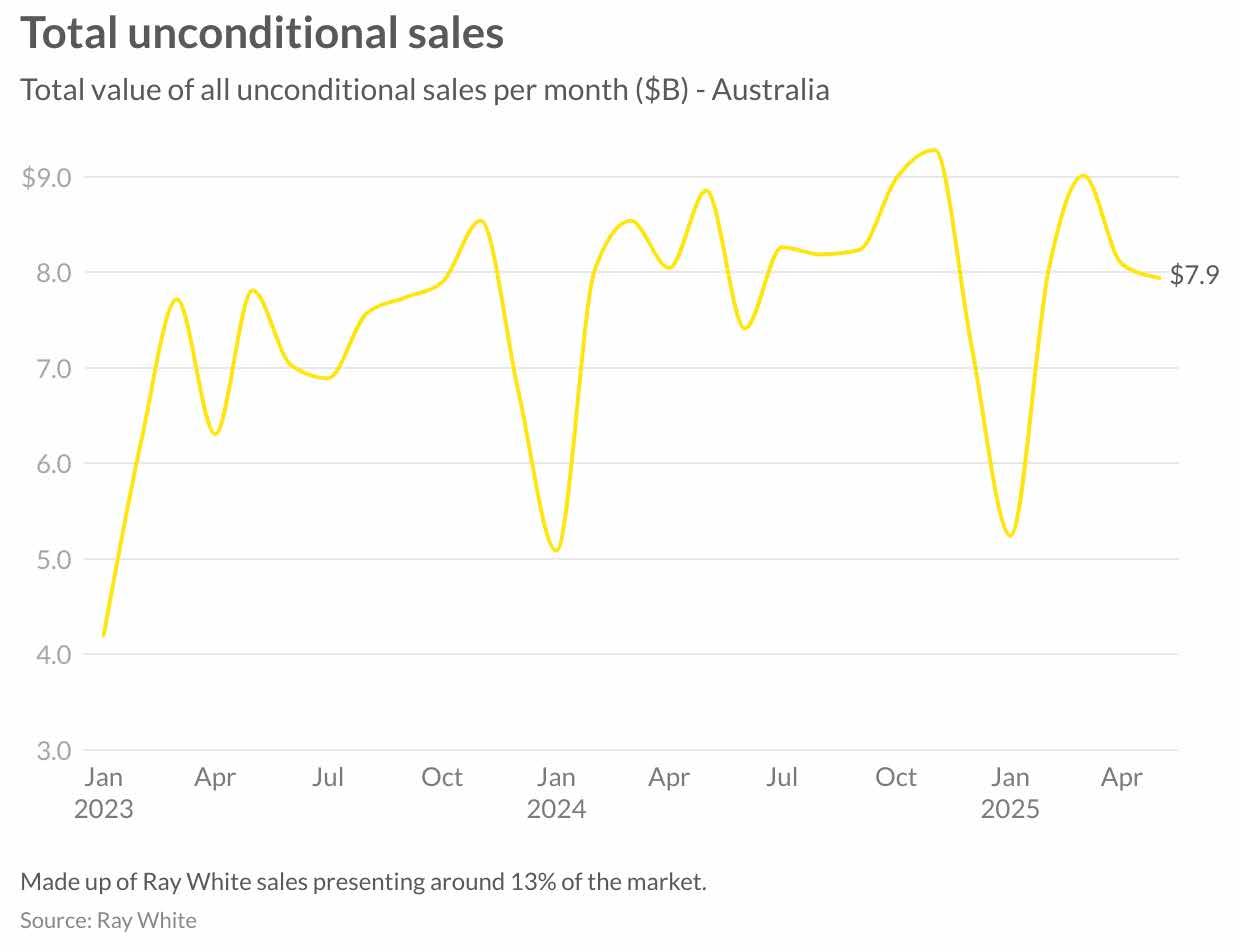
Ray White Group’s sales performance in May reached $7.9 billion, demonstrating the sustained strength of market conditions despite seasonal moderation from peak autumn levels. This result reflects both continued price appreciation and steady transaction volumes across most markets, particularly in the high-growth cities of Perth, Adelaide, and Brisbane. The May figure aligns with typical seasonal patterns while maintaining the elevated baseline established through 2025’s strong opening months. With interest rates now in their cutting cycle and further reductions anticipated, this momentum appears well-positioned to continue through the traditionally quieter winter period ahead.

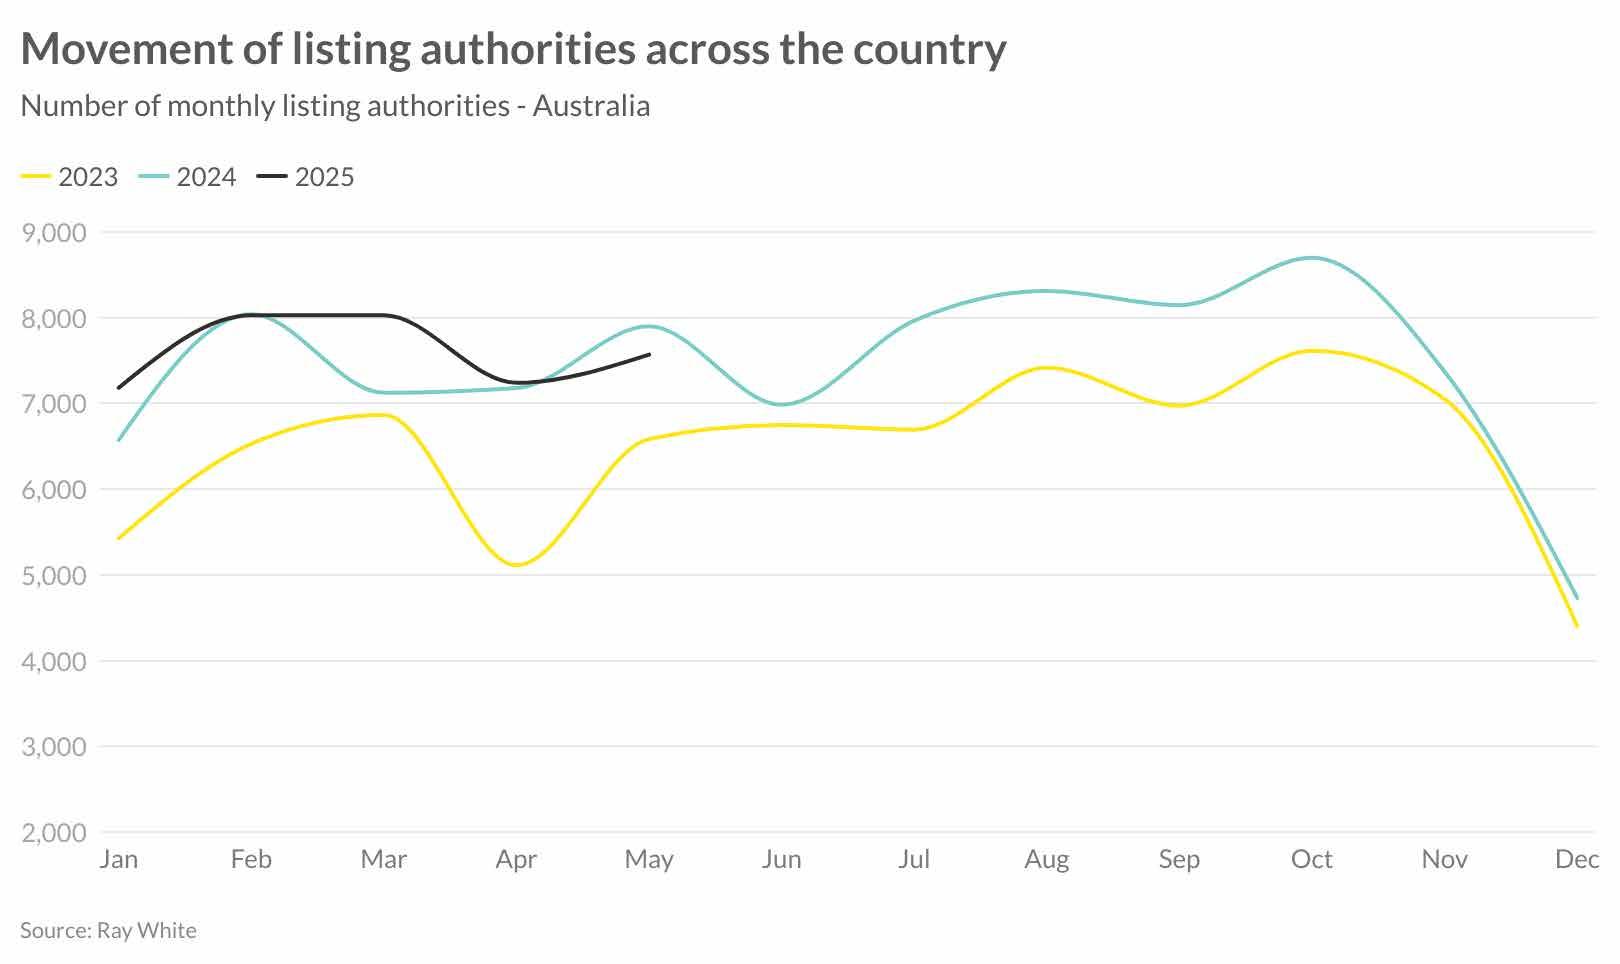
Ray White listing authorities provide valuable forward-looking insight into market supply, representing properties signed for sale but not yet marketed. May data shows 7,570 authorities, reflecting a 4.4 per cent monthly decrease from April’s 7,240 level, which aligns with typical seasonal patterns as the market enters the historically quieter winter months. However, the annual comparison reveals a concerning 4.2 per cent decline compared to May 2024’s 7,899 authorities, with 2025 tracking well below both 2023 and 2024 levels throughout the year. This sustained reduction in listing authorities suggests continued tight supply conditions ahead, particularly as vendors may be holding back in anticipation of further interest rate cuts potentially driving even stronger market conditions. The shortage of upcoming stock provides fundamental support for the current price acceleration trajectory.