


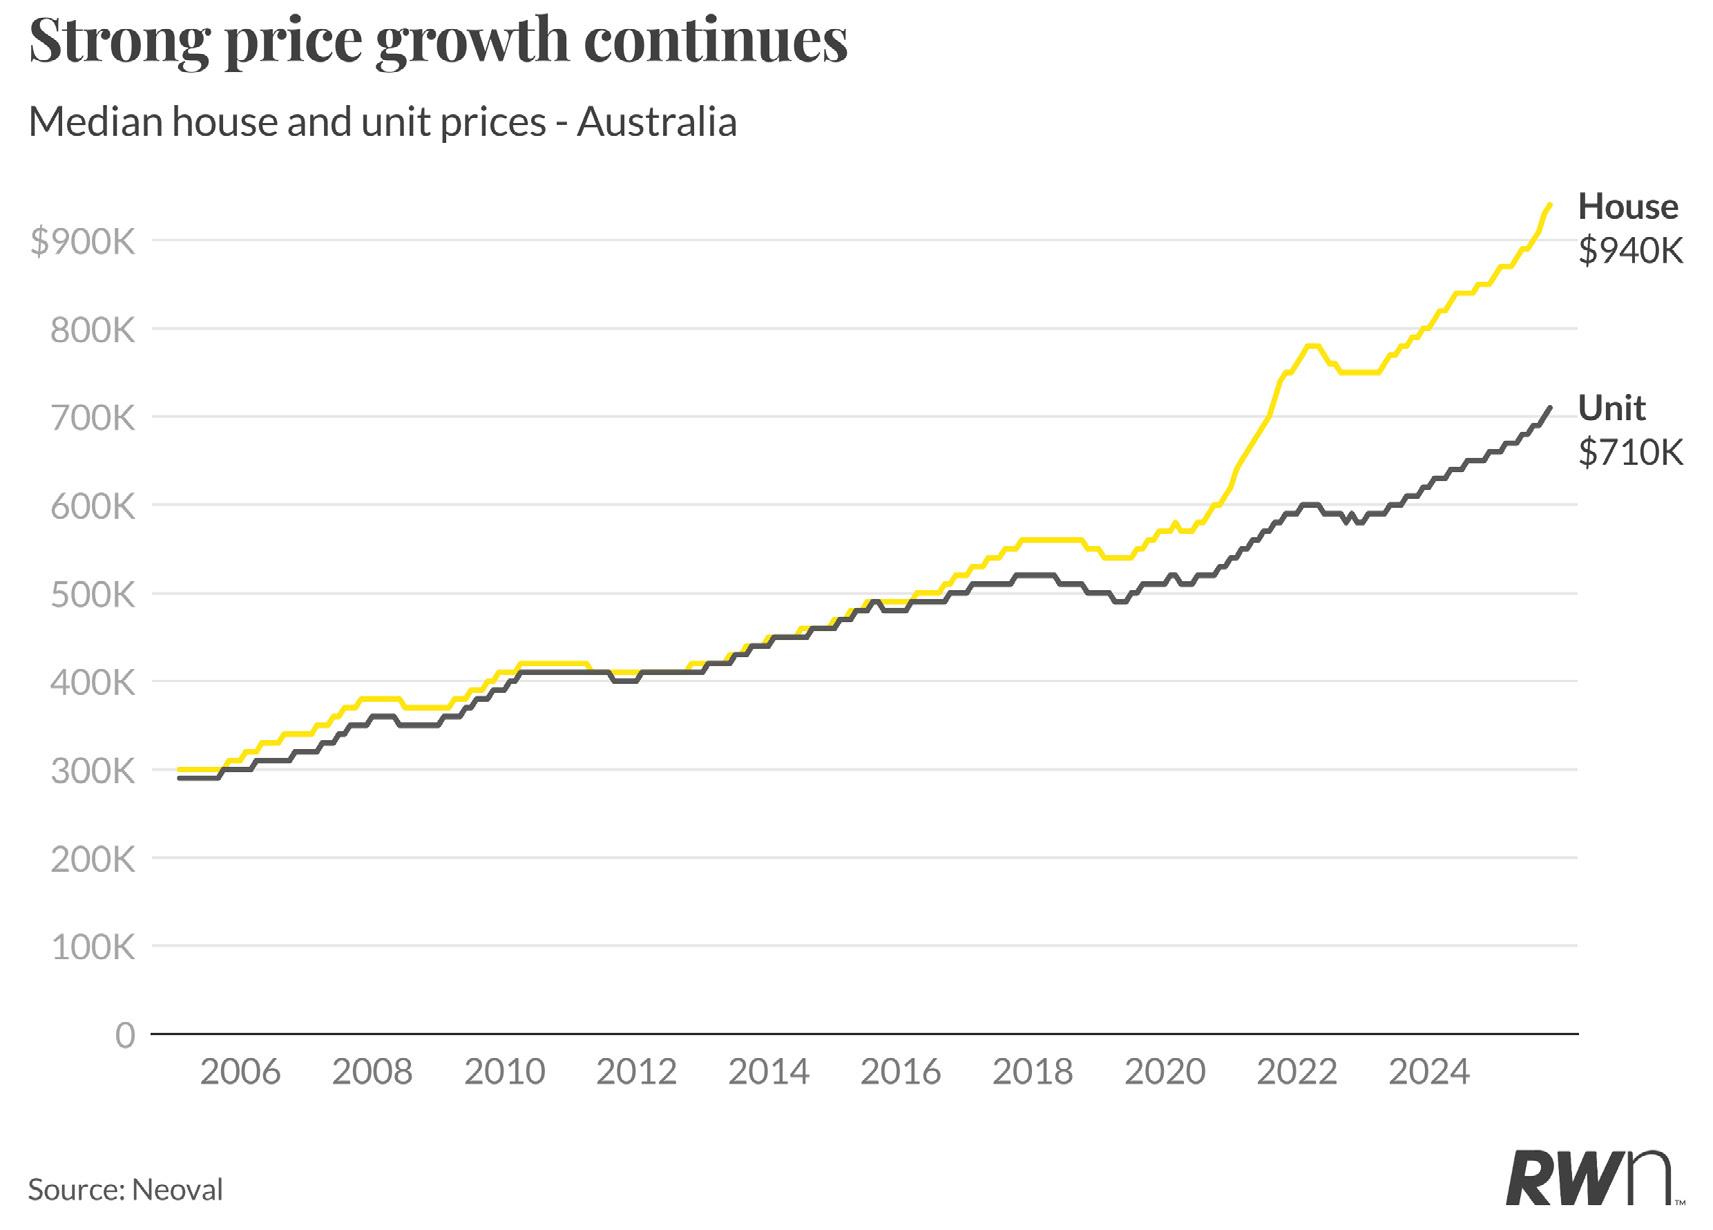
Australian property prices maintained solid momentum in October, with the national median house price increasing 1.1 per cent to $940,000. This marks the ninth consecutive month of price gains and pushes annual growth to 10.6 per cent, the first double-digit result since the pandemic boom. Unit prices posted an even stronger monthly rise of 1.4 per cent, reaching $710,000, with annual growth now at 9.2 per cent.
This acceleration represents a notable shift in market trajectory. The consistent monthly gains since February for houses and March for units reflect sustained buyer demand meeting constrained supply across most markets. With the Reserve Bank holding the cash rate at 3.60 per cent this month following elevated inflation readings in the September quarter of 3.2 per cent, the price momentum suggests underlying demand pressures remain resilient rather than following monetary policy.

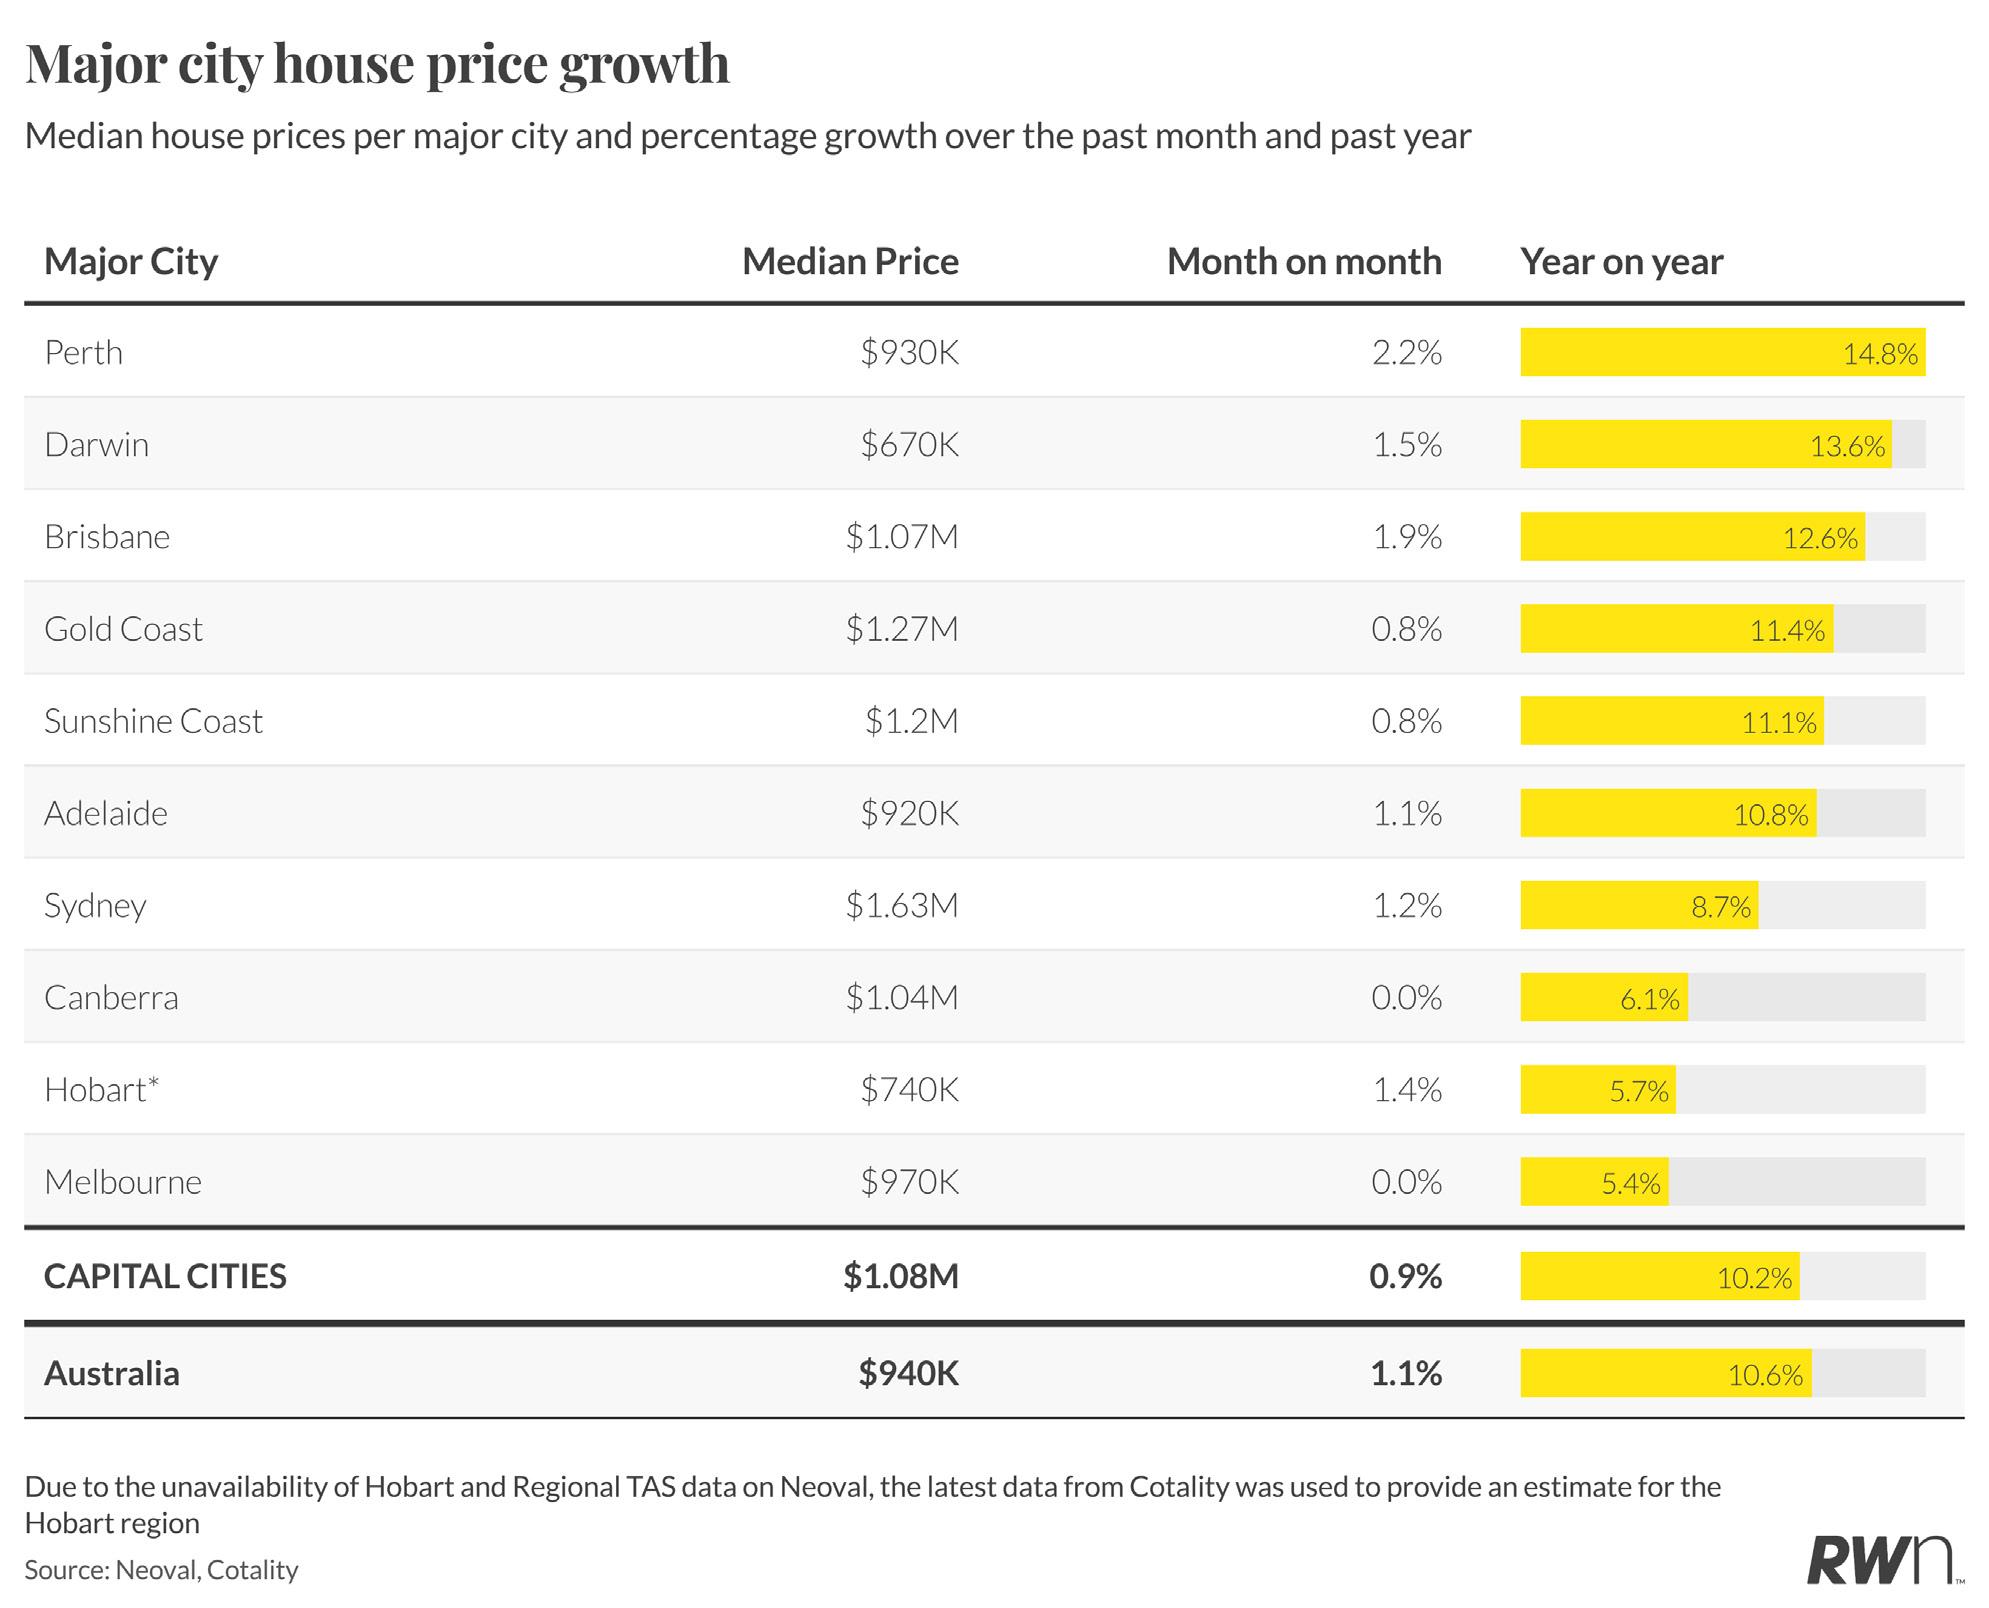
Perth continues to lead the capital city housing markets with exceptional year-on-year growth of 14.8 per cent, bringing the mean to $930,000. The monthly gain of 2.2 per cent demonstrates sustained upward pressure from tight supply and strong demand dynamics. Darwin followed with 1.5 per cent monthly growth and 13.6 per cent annually, reaching $670,000, whilst Brisbane’s 1.9 per cent monthly increase drove annual growth to 12.6 per cent with a mean of $1.07 million.
The Gold Coast and Sunshine Coast lifestyle markets recorded more modest monthly advances of 0.8 per cent each, though both maintain double-digit annual growth at 11.4 per cent and 11.1 per cent respectively. Adelaide posted 1.1 per cent monthly growth with a 10.8 per cent annual rise to $920,000. Sydney’s 1.2 per cent monthly increase resulted in 8.7 per cent annual growth and a mean of $1.63 million, whilst Canberra held flat over the month despite 6.1 per cent annual appreciation. Melbourne and Hobart showed the most restrained conditions, each recording zero monthly growth but maintaining modest annual gains of 5.4 per cent and 5.7 per cent respectively.

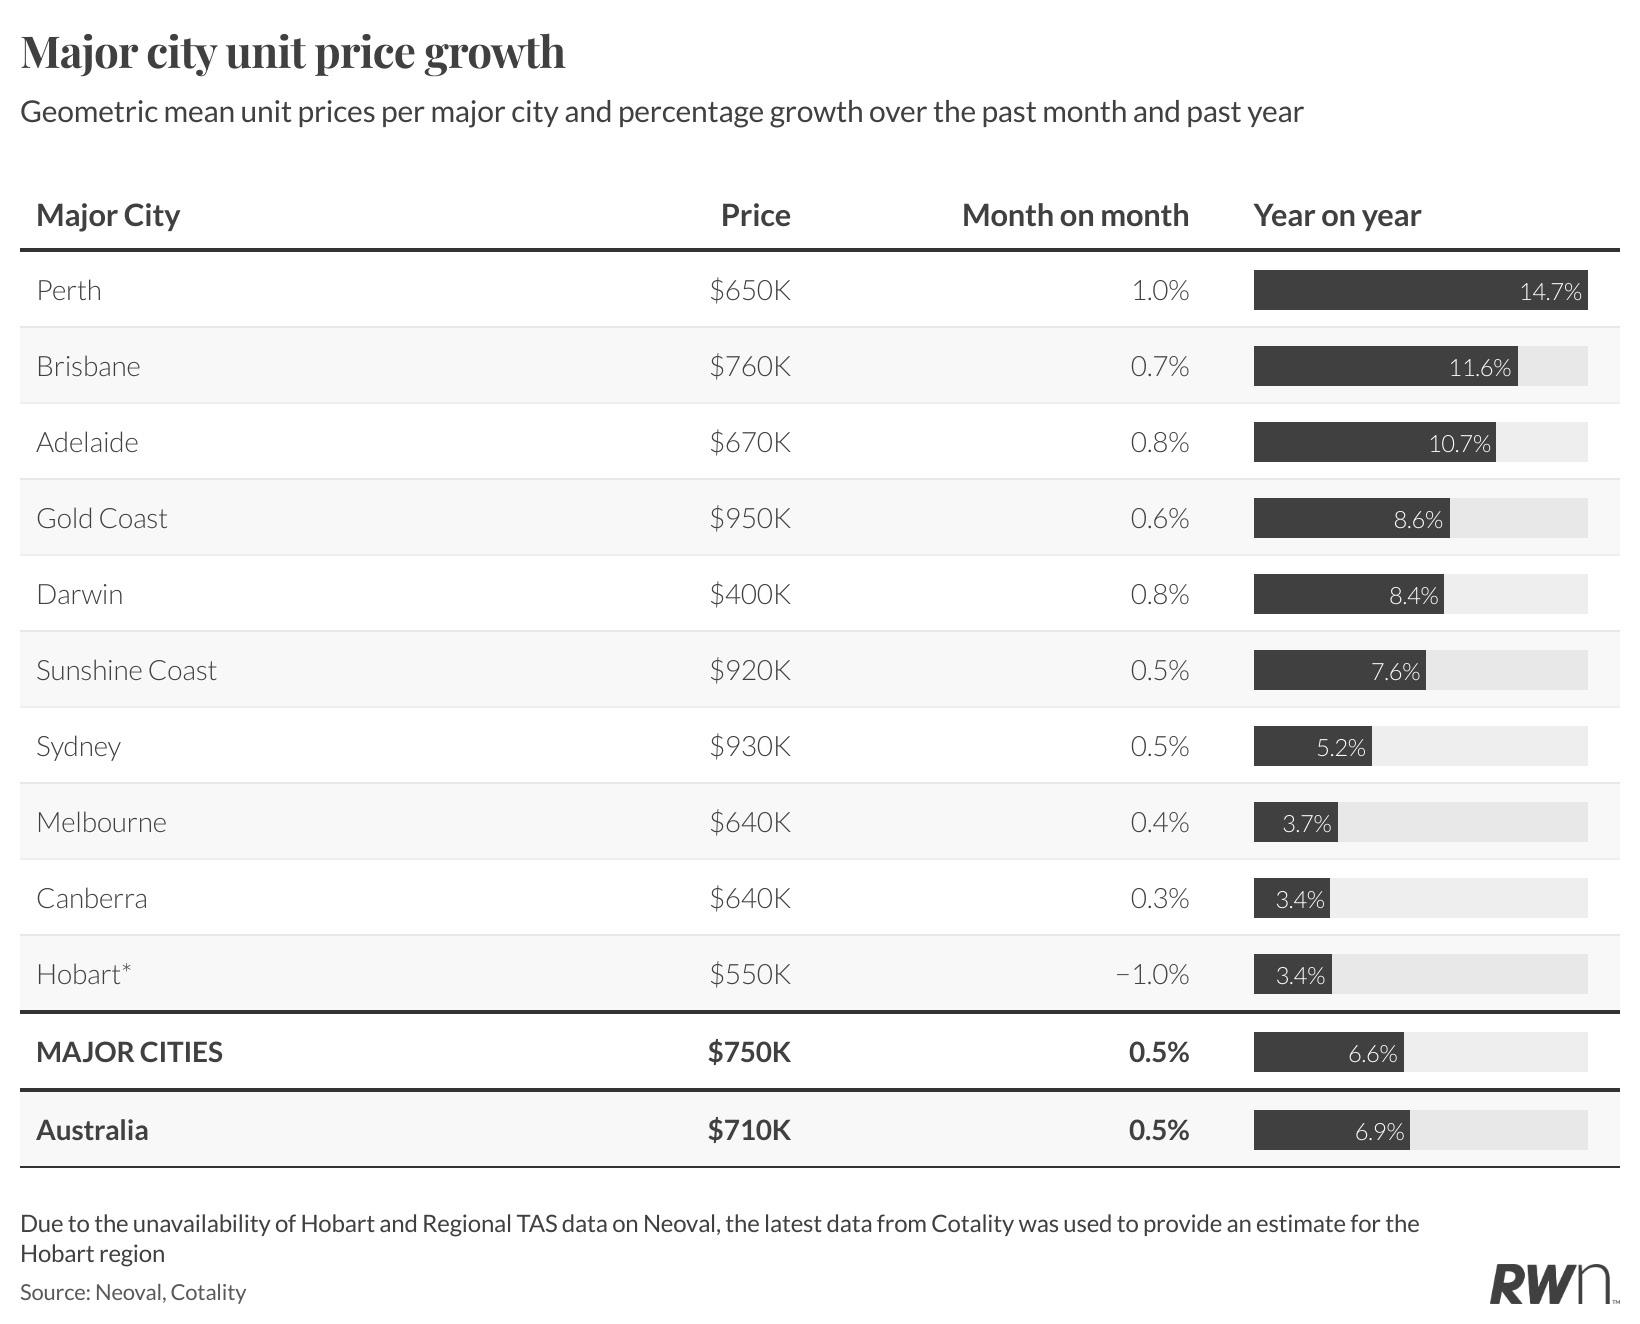
The metropolitan unit market outperformed houses this month, with capital cities recording flat monthly growth but sustained annual appreciation of 7.5 per cent to a mean of $720,000. Perth led with a substantial 1.6 per cent monthly gain and 18.2 per cent annual growth, bringing the mean to $650,000. Adelaide and Brisbane both posted strong monthly increases of 1.5 per cent and 1.3 per cent respectively, translating to annual growth rates of 11.7 per cent and 13.4 per cent.
Darwin’s 2.5 per cent monthly rise pushed annual growth to 10.8 per cent at $410,000, whilst the Gold Coast and Sunshine Coast recorded 1.1 per cent and 1.2 per cent monthly gains with annual growth of 9.8 per cent and 8.7 per cent respectively. Hobart remained flat monthly but maintained 5.7 per cent annual growth at $560,000. Sydney and Melbourne, along with Canberra, all recorded zero monthly growth, though Sydney maintains 4.8 per cent annual appreciation at $870,000, Melbourne 3.3 per cent at $630,000, and Canberra 3.2 per cent at $640,000. The unit market continues to benefit from affordability constraints driving buyers toward lower price points.
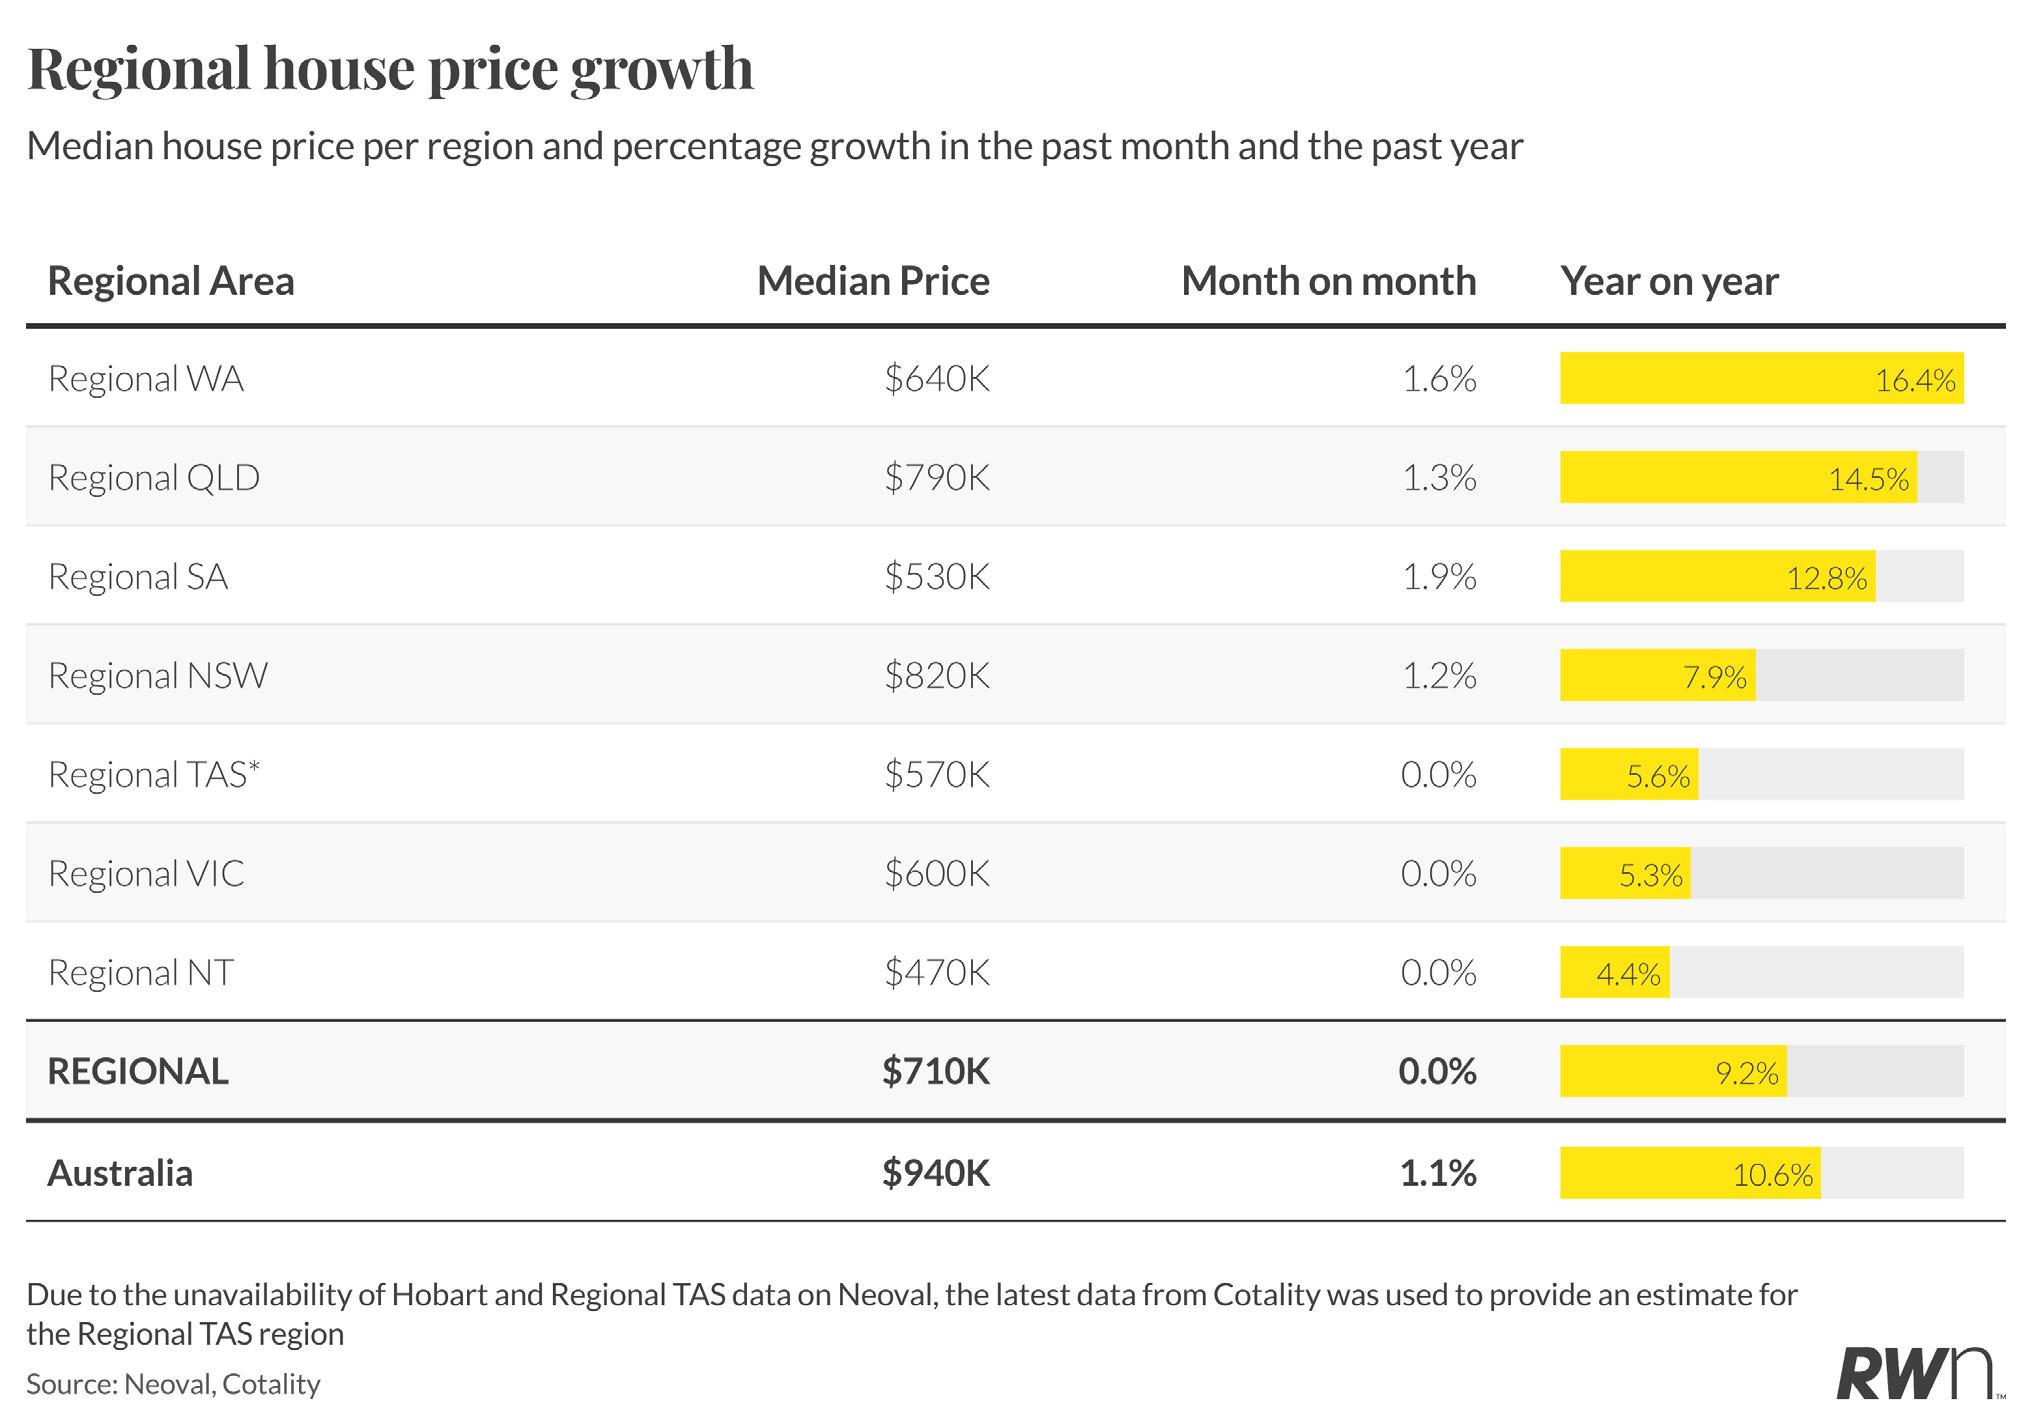
Regional markets posted flat monthly growth nationally but maintained robust annual appreciation of 9.2 per cent, with the mean reaching $710,000. Regional Western Australia led monthly gains with 1.6 per cent growth, supporting exceptional annual growth of 16.4 per cent to a mean of $640,000. Regional South Australia followed with 1.9 per cent monthly and 12.8 per cent annual increases to $530,000, whilst regional Queensland’s 1.3 per cent monthly rise brought annual growth to 14.5 per cent at $790,000.
Regional New South Wales recorded 1.2 per cent monthly growth with a more moderate annual appreciation of 7.9 per cent, reaching a mean of $820,000. Regional Victoria, regional Tasmania and regional Northern Territory all held flat over the month, though Regional Victoria maintained 5.3 per cent annual growth at $600,000, regional Tasmania 5.6 per cent at $570,000, and regional Northern Territory 4.4 per cent at $470,000. The divergence between resource-exposed states and other regions continues to shape the regional market landscape.
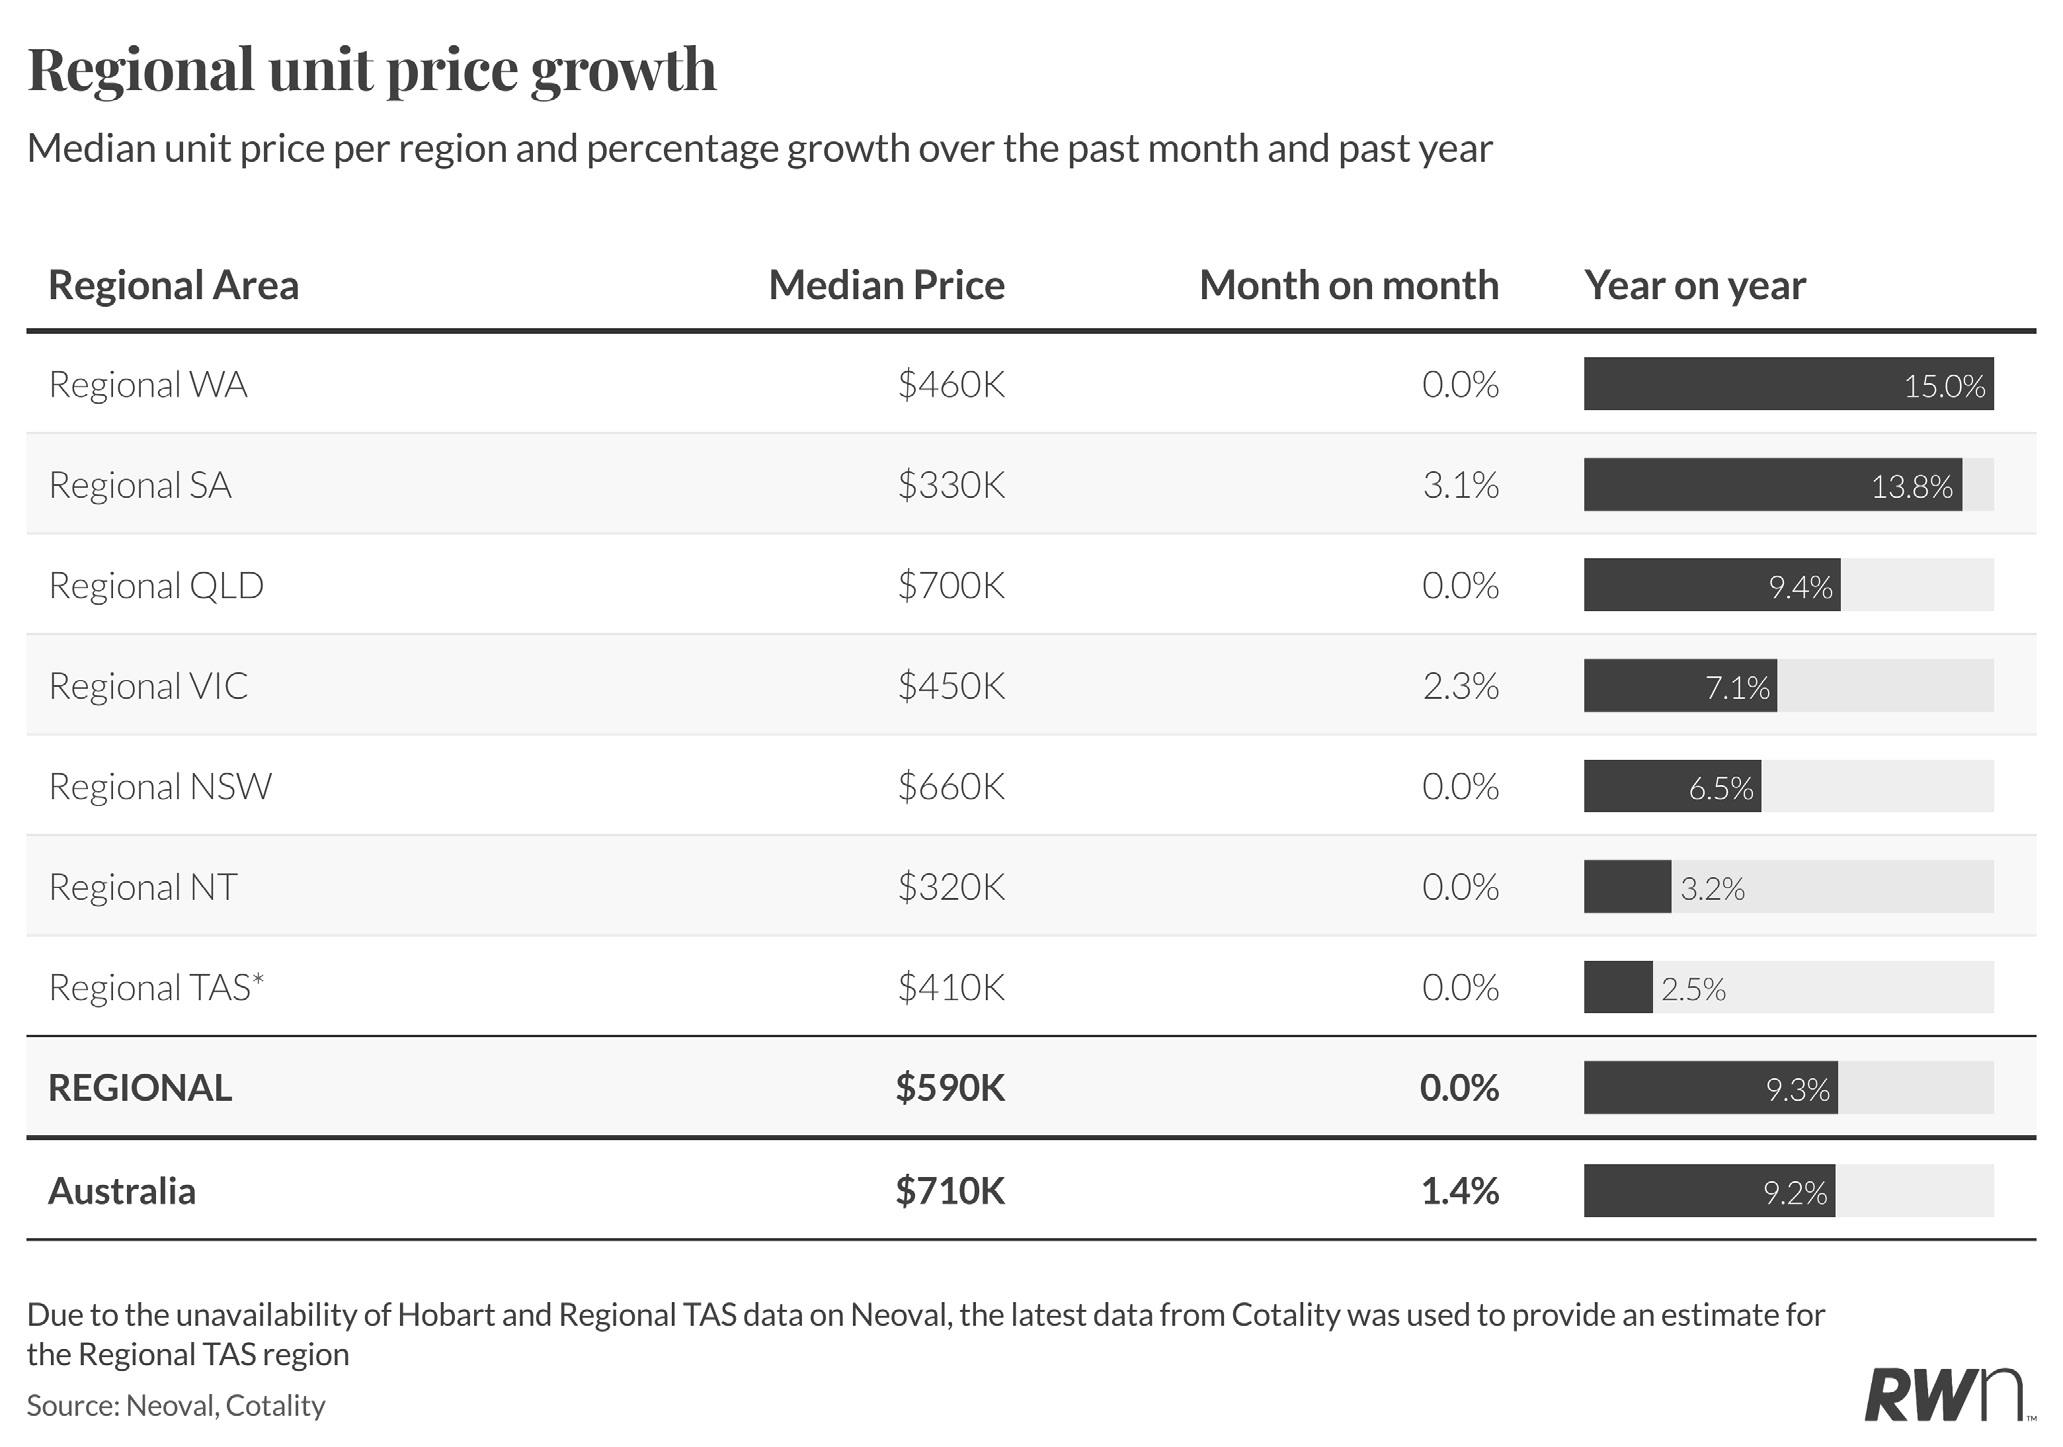
Regional unit markets held flat nationally over the month but sustained solid annual growth of 9.3 per cent, with the mean at $590,000. Regional South Australia led monthly gains with a notable 3.1 per cent increase, supporting exceptional annual growth of 13.8 per cent to $330,000. Regional Victoria followed with 2.3 per cent monthly growth and 7.1 per cent annually at $450,000. Regional Western Australia held flat over the month despite maintaining the strongest annual performance at 15.0 per cent, with a mean of $460,000.
Regional Queensland and regional New South Wales both recorded zero monthly growth, though regional Queensland maintains 9.4 per cent annual appreciation at $700,000 and regional New South Wales 6.5 per cent at $660,000.
Regional Northern Territory held steady with modest 3.2 per cent annual growth at $320,000, whilst regional Tasmania posted 2.5 per cent annual growth at $410,000. The regional unit market continues to offer relative affordability compared to capital cities whilst delivering solid returns for investors.
MAJOR CITY HOUSE PRICES (%CHANGE) | SINCE LAST
Source: Neoval Updated as of November
Source: Neoval
REGIONAL HOUSE PRICES (%CHANGE) | SINCE LAST MONTH
LISTINGS ACTIVITY
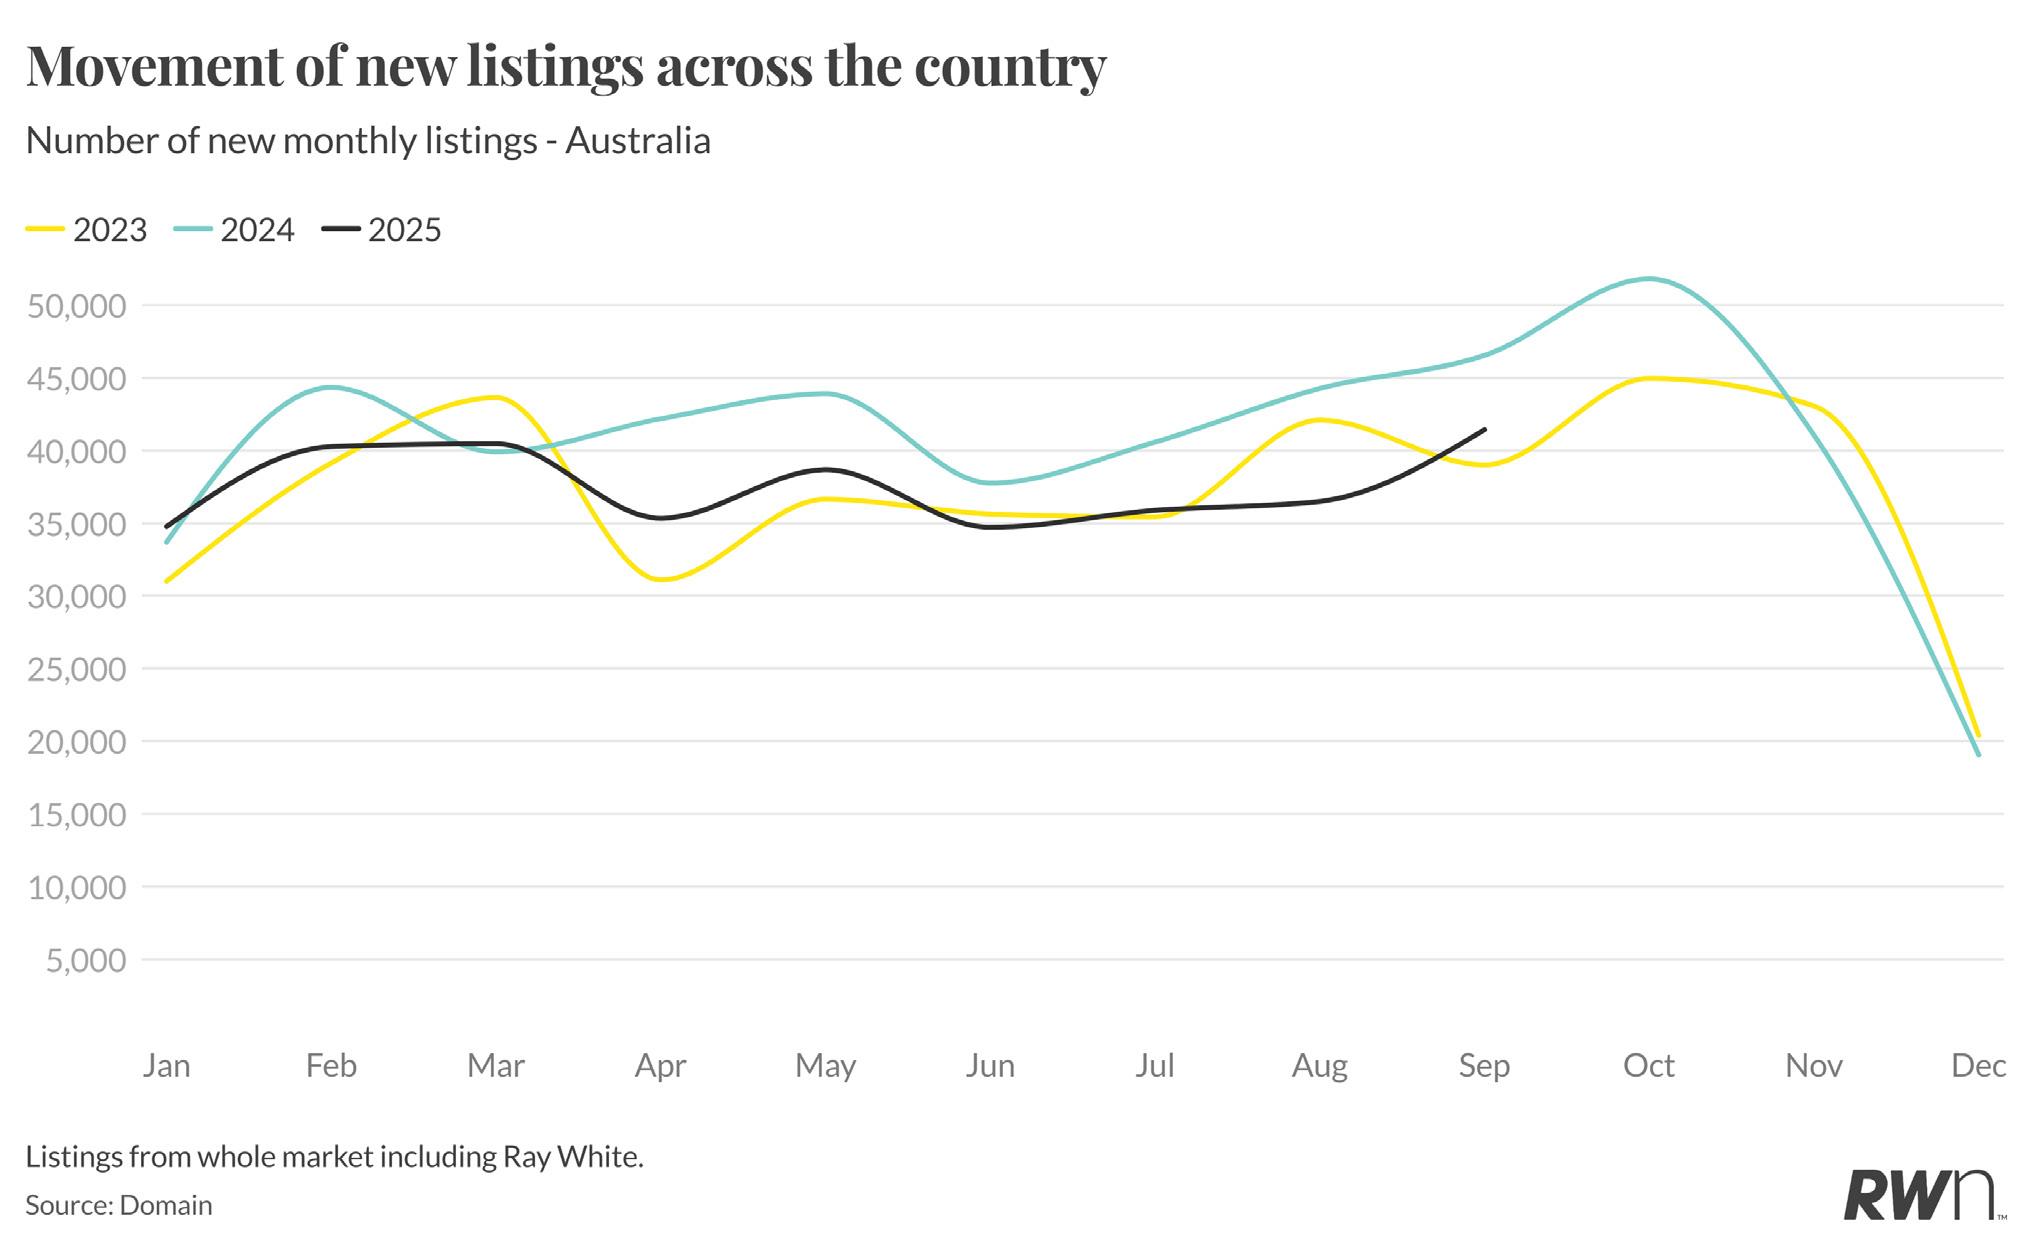
October witnessed new listings reach 50,059 properties nationally, representing a substantial 11.3 per cent increase from September’s 44,961 listings. This marks the seasonal peak for 2025, slightly below October 2024’s 51,820 but significantly ahead of October 2023’s 44,961. The strong October result reflects the traditional spring listing surge, with vendors capitalising on the final weeks of peak selling season before the summer slowdown.
Year-to-date performance shows 2025 tracking consistently above 2023 levels, though generally below the elevated volumes observed through much of 2024. The October peak follows a steady build through the winter and spring months, with listings climbing from January’s 34,767 to the current level. With November and December traditionally marking sharp declines as the market enters its holiday period, the strong October foundation suggests solid supply entered the market during the critical spring window, though ongoing annual comparisons indicate supply remains below last year’s levels across most of the year.
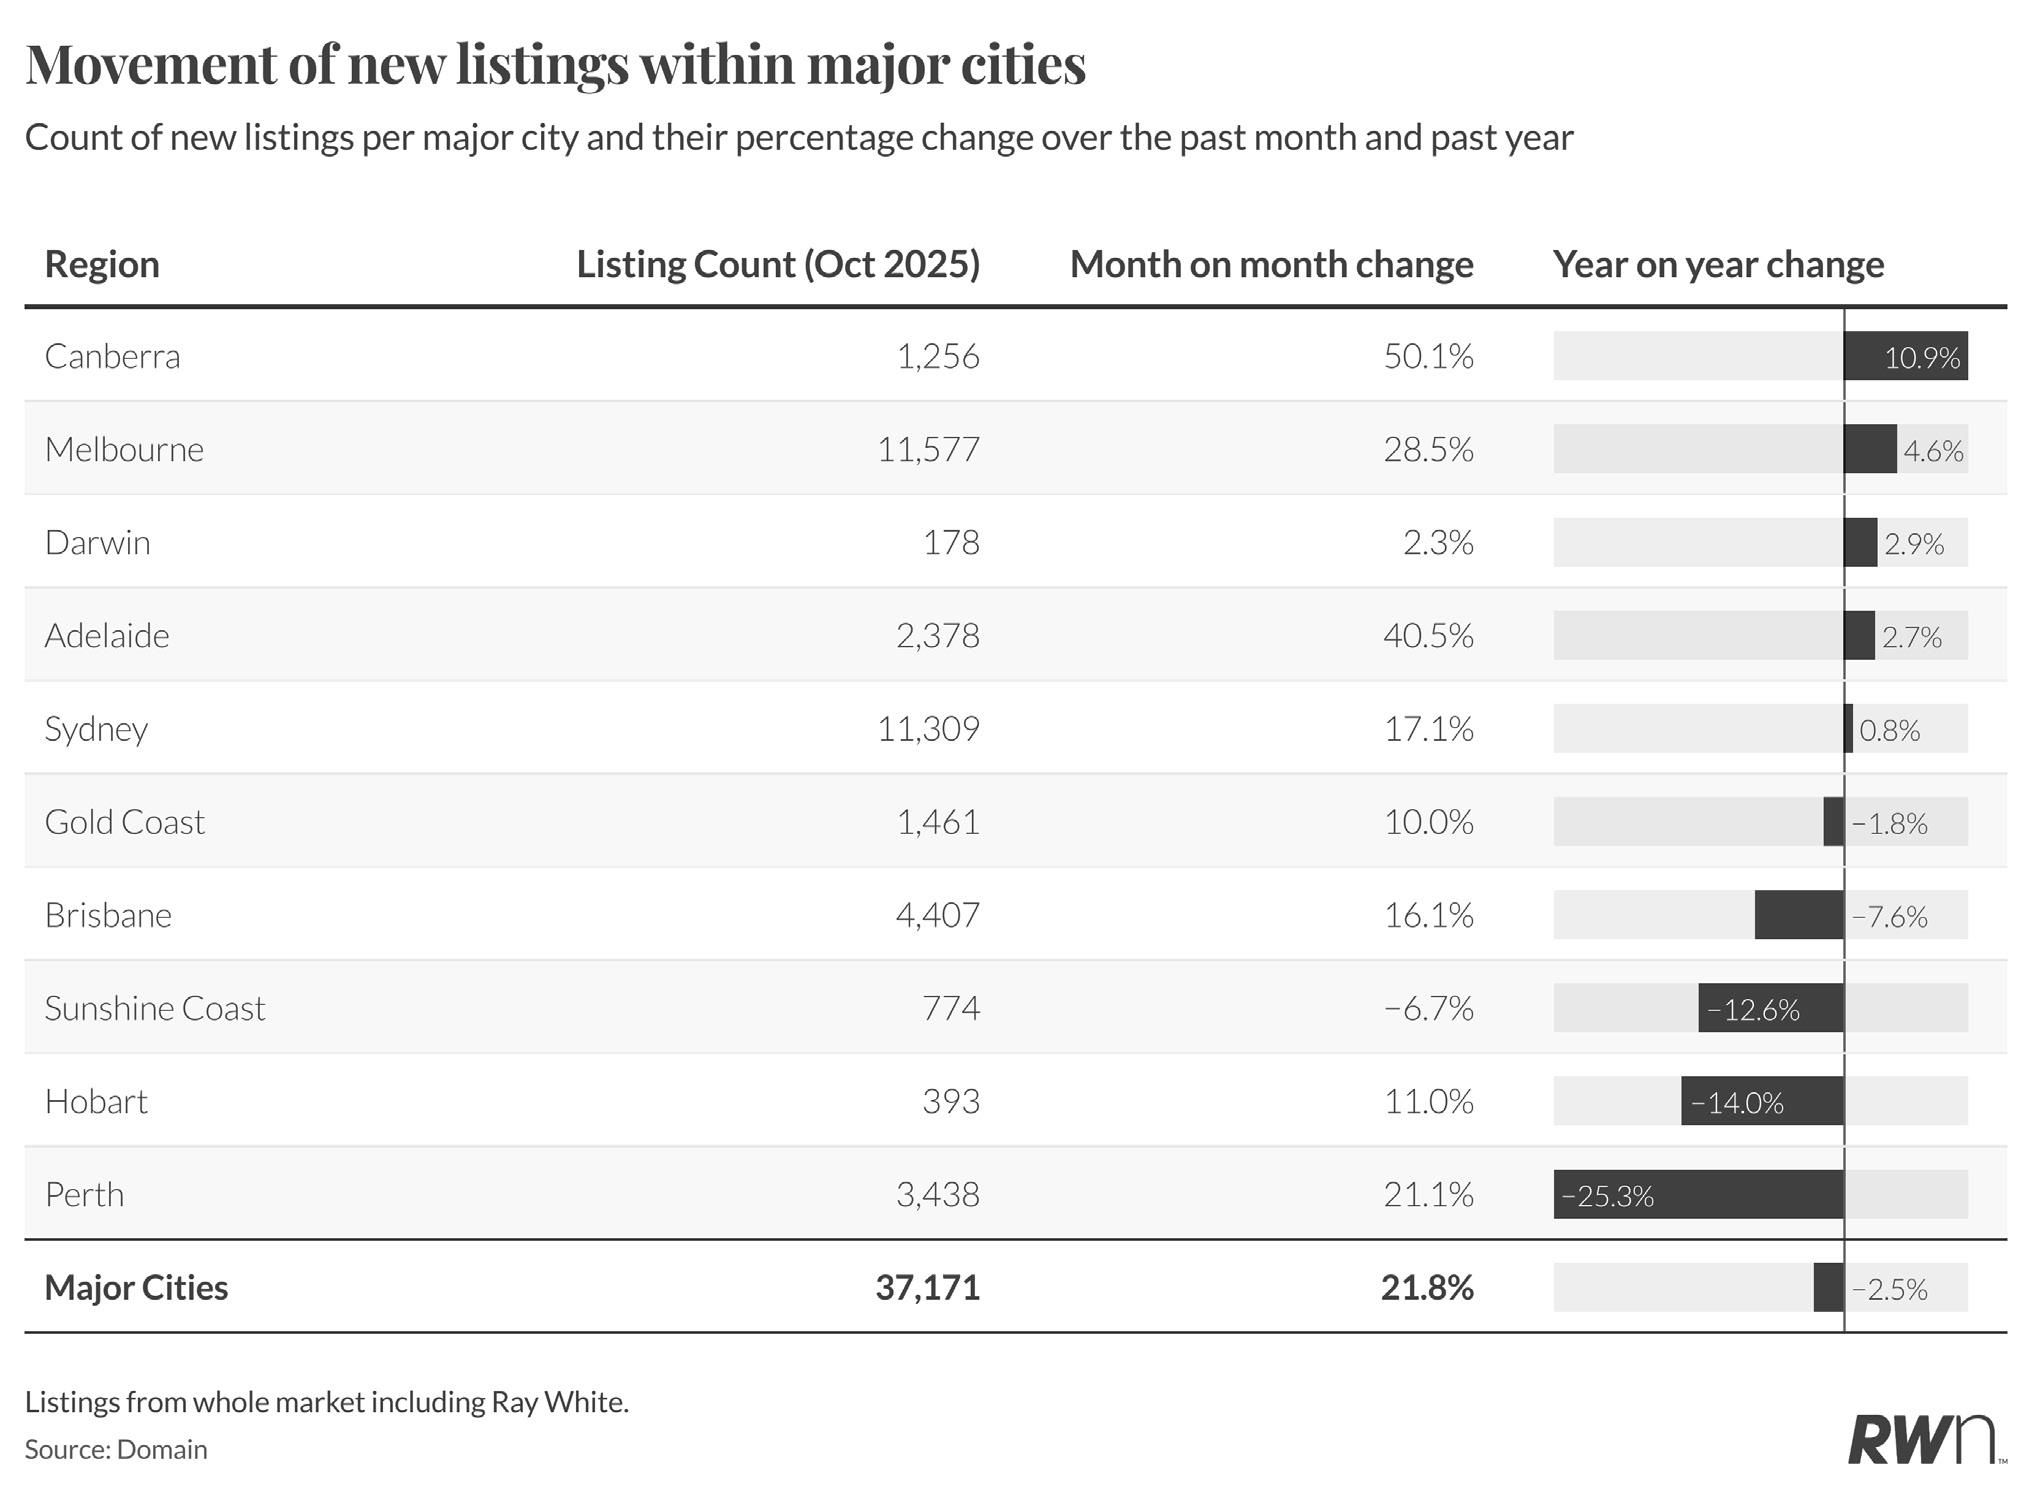
Major city listings recorded substantial monthly growth of 21.8 per cent in October, with 37,171 new properties coming to market. This represents a modest 2.5 per cent annual decline compared to October 2024, indicating supply constraints persist despite the seasonal lift. Canberra led monthly gains with a striking 50.1 per cent increase though remains down 10.9 per cent year-on-year, whilst Melbourne’s 28.5 per cent monthly rise still reflects a 4.6 per cent annual decline.
Adelaide posted 40.5 per cent monthly growth with 2.7 per cent annual gains, whilst Sydney’s 17.1 per cent monthly increase translates to just 0.8 per cent annual growth. Brisbane recorded 16.1 per cent monthly growth but remains down 7.6 per cent annually, reflecting the ongoing supply shortage in Queensland’s capital. Perth’s 21.1 per cent monthly rise accompanies a concerning 25.3 per cent annual decline, highlighting the severe inventory constraints driving that city’s exceptional price growth. The Gold Coast, Sunshine Coast and Hobart all posted modest monthly gains against significant annual declines of 1.8 per cent, 12.6 per cent and 14.0 per cent respectively.
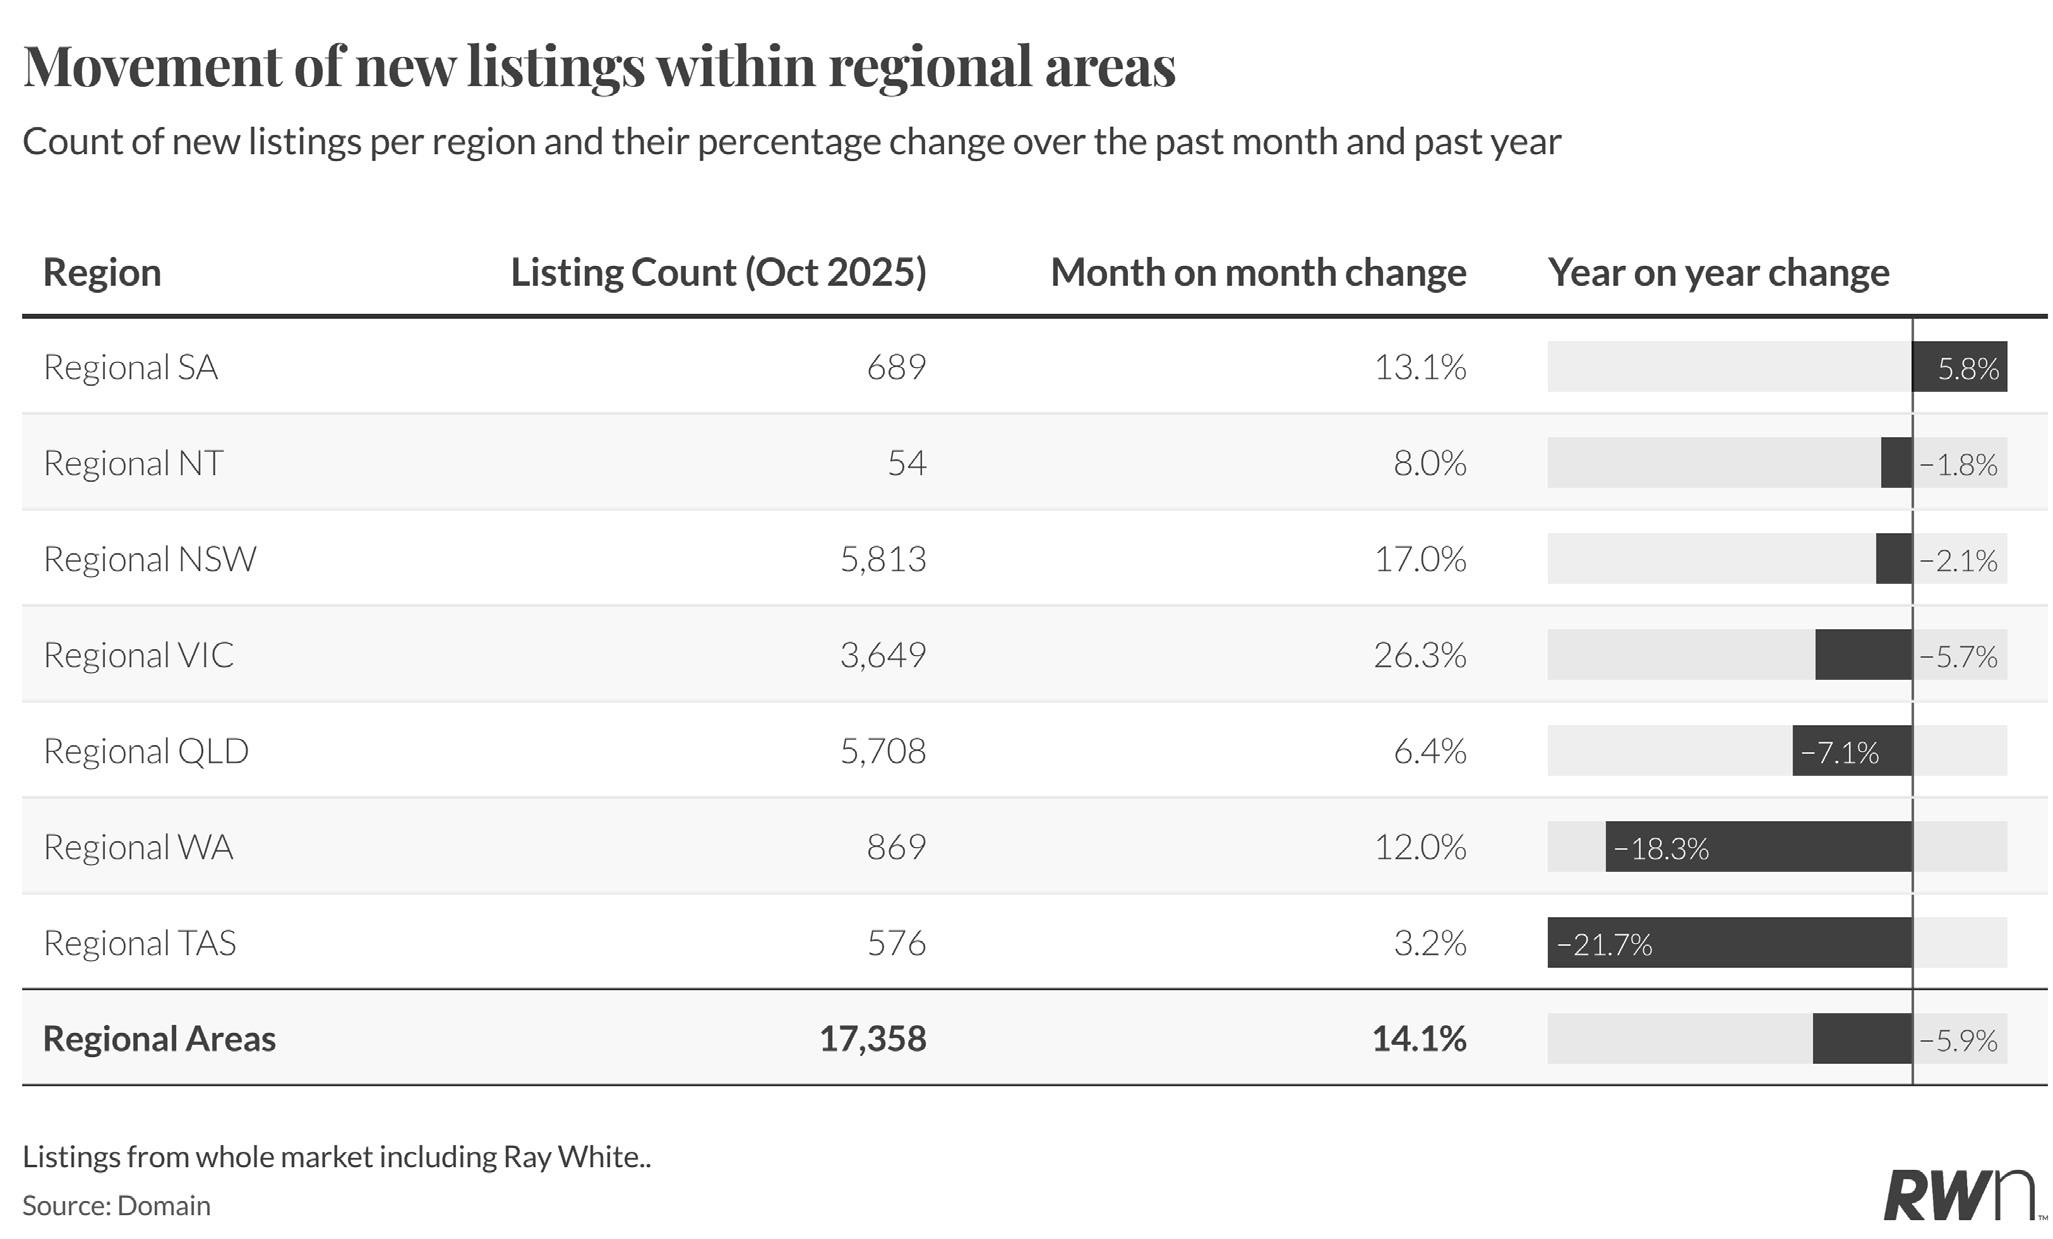
Regional listings increased 14.1 per cent month-on-month in October with 17,358 new properties, though remain down 5.9 per cent year-on-year, underscoring persistent supply constraints outside capital cities. Regional Victoria led monthly growth with 26.3 per cent, followed by regional South Australia’s 13.1 per cent and regional New South Wales’ 17.0 per cent. Regional Queensland recorded a modest 6.4 per cent monthly increase, whilst regional Western Australia and regional Northern Territory posted 12.0 per cent and 8.0 per cent gains respectively.
Year-on-year comparisons reveal the supply challenges facing regional markets. Regional Tasmania suffered a 21.7 per cent annual decline despite 3.2 per cent monthly growth, whilst regional Western Australia dropped 18.3 per cent annually and regional Queensland fell 7.1 per cent. Regional Victoria declined 5.7 per cent year-on-year, regional New South Wales 2.1 per cent, and regional Northern Territory 1.8 per cent. Only regional South Australia posted positive annual growth at 5.8 per cent, indicating that market’s stronger supply position.

AUCTION INSIGHTS
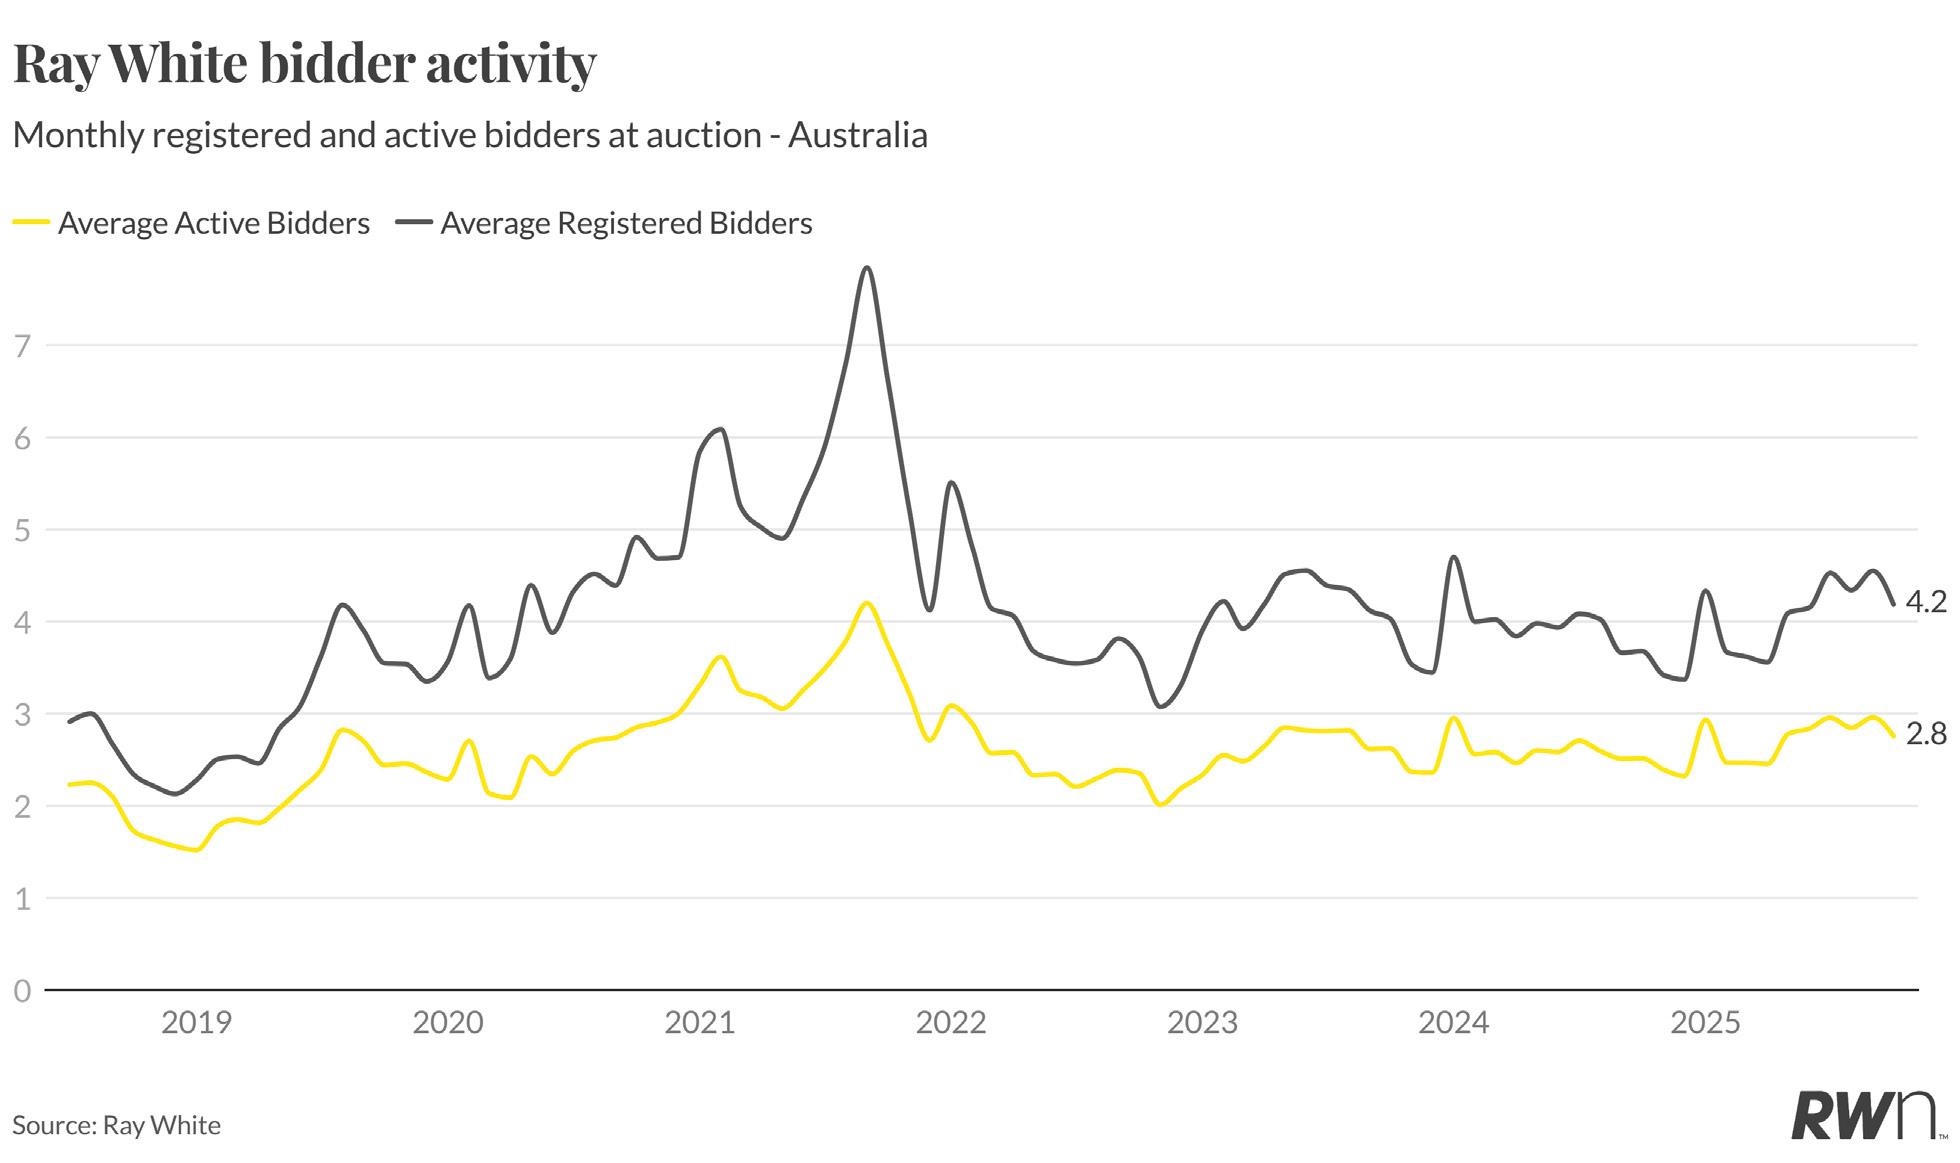
Ray White auction bidder activity remained steady in October, with average registered bidders holding at 4.2 and active bidders at 2.8. These figures represent a continuation of the stabilisation observed through the second half of 2025, following the elevated peaks of 2021-22. The current participation rates suggest balanced market conditions, where competitive tension exists without the intensity seen during the pandemic-driven boom.
The consistency in bidder numbers through October, despite the reducing interest rate environment this year, sustained demand pressures is reflected by supply constraints rather than speculative buying behaviour. With the Reserve Bank holding rates steady this month following elevated inflation data, these participation metrics indicate buyers remain committed to securing properties despite rates not dropping.

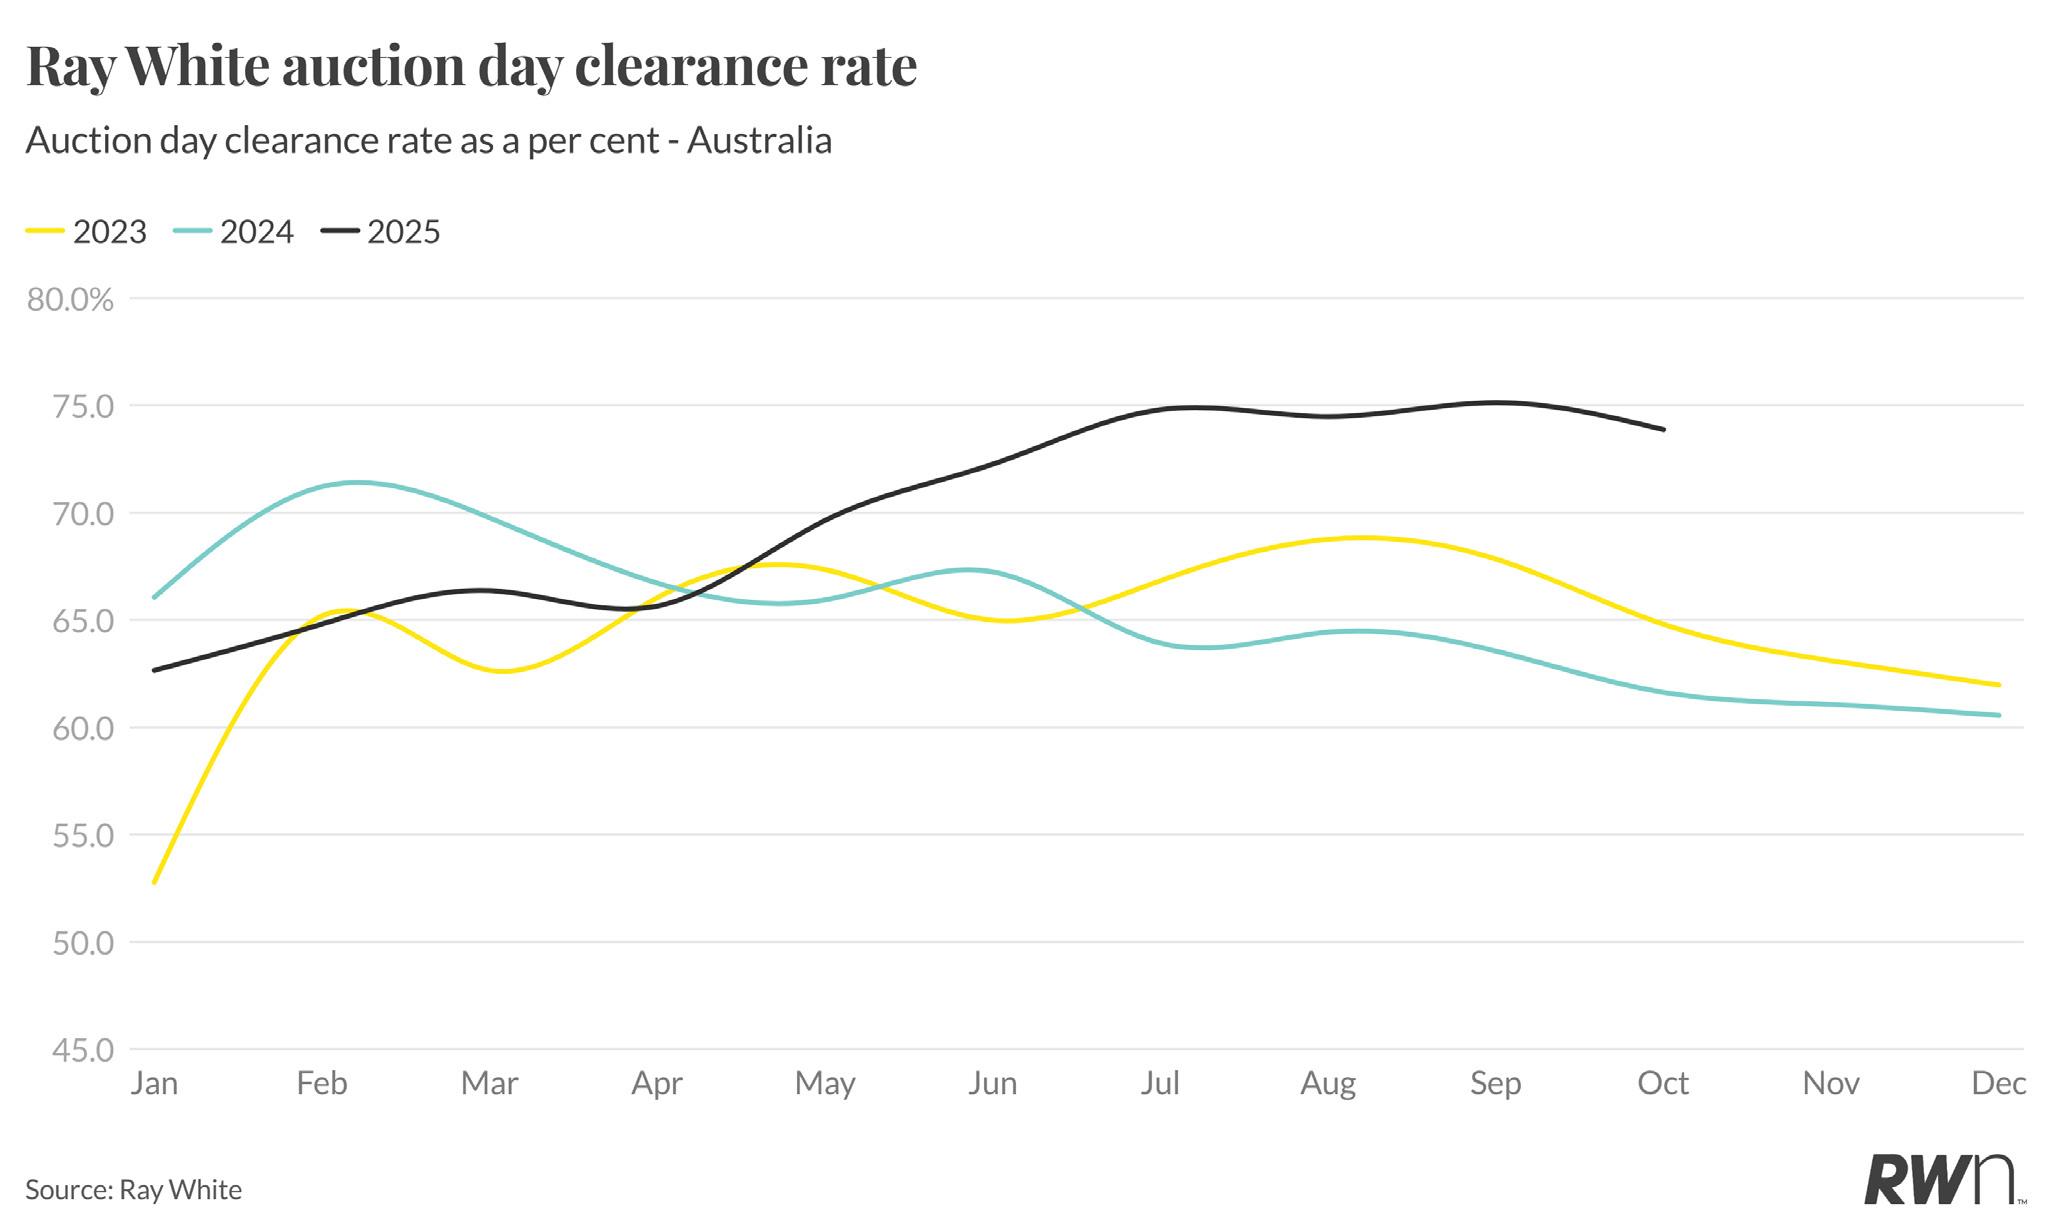
Ray White’s national auction clearance rate reached 73.87 per cent in October, maintaining the exceptional trajectory established throughout 2025. This performance significantly outpaces both 2023 (64.8 per cent) and 2024 (61.63 per cent) for the corresponding period, demonstrating the competitive dynamics created by limited property availability. The October result represents a modest decline from September’s 75.13 per cent but continues the pattern of sustained strength through the second half of the year.
The 2025 clearance rate trend has consistently tracked above both prior years, with the gap widening particularly from mid-year onwards. July’s 74.8 per cent and August’s 74.48 per cent marked the recent peaks, whilst the current October reading of 73.87 per cent remains substantially elevated compared to historical norms. These sustained success rates through the spring selling season, despite unchanged interest rates following elevated inflation data, indicate underlying demand pressures continue to drive competitive bidding. The upcoming summer slowdown will likely see participation moderate through November and December, though the strong year-to-date performance positions auction as a viable selling method heading into 2026.

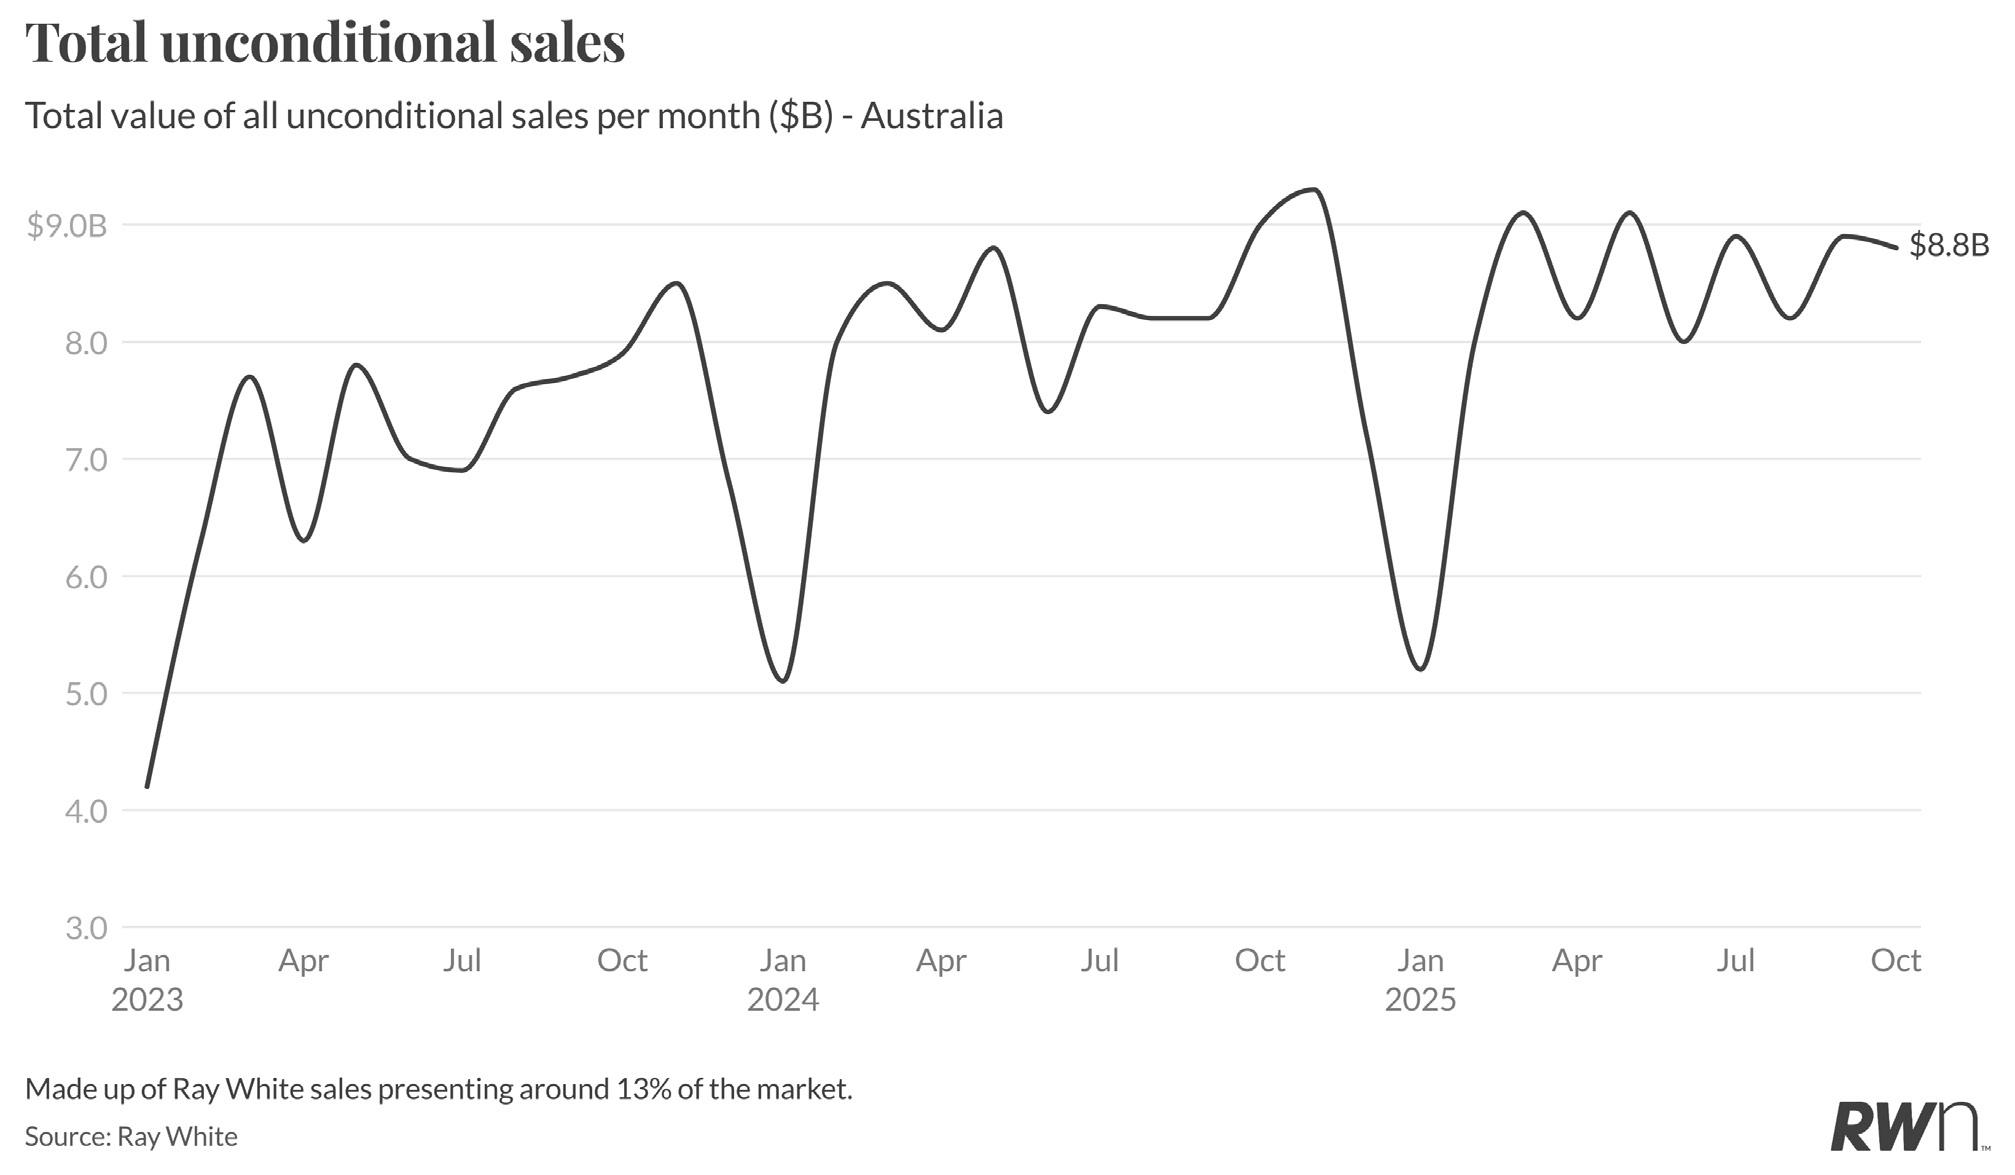
Ray White Group’s unconditional sales reached $8.88 billion in October, reflecting the culmination of the spring selling season’s peak activity. This result represents a strong outcome compared to recent months and demonstrates sustained transaction values despite the seasonal transition toward the quieter summer period. The October figure aligns with the elevated baseline established through 2025, supported by continued price appreciation across most markets.
The maintenance of robust sales values heading into the traditional year-end slowdown suggests underlying transaction quality remains solid. With the Reserve Bank holding rates this month following elevated inflation readings, the current momentum appears supported by genuine buyer demand meeting limited supply rather than speculative activity. As the market approaches the December holiday period, sales volumes will naturally moderate, though the strong October result positions the market well for the anticipated rebound in late January and February.
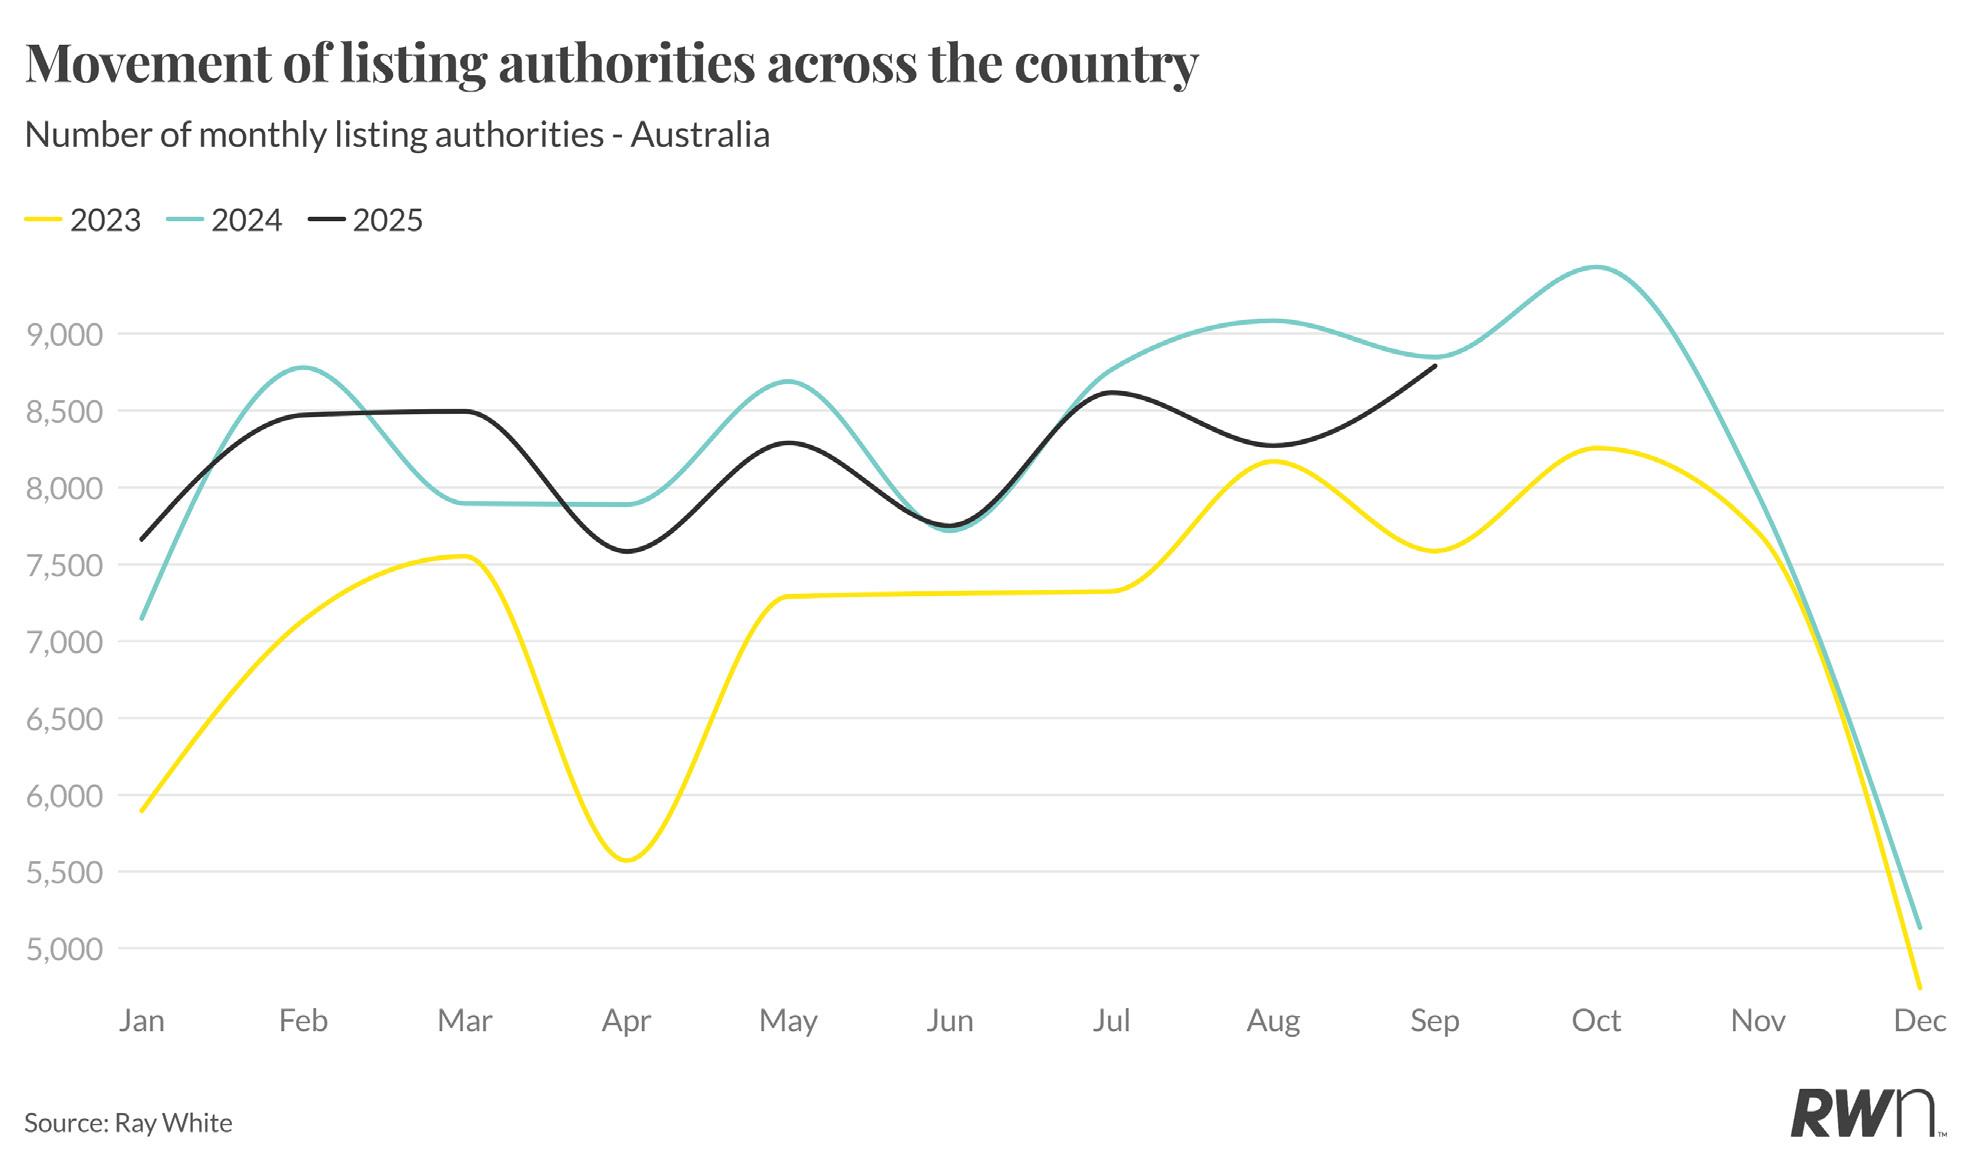
Ray White’s listing authorities present an encouraging supply story, with September 2025 recording 8,791 new authorities, up from August’s 8,272 and tracking ahead of September 2023’s 7,586. This monthly increase is particularly significant as it comes during a period when vendor engagement typically declines as the market transitions from spring into the final quarter.
The 28-day rolling sum shows 2025 consistently outpacing 2023 levels, with sustained vendor participation evident through winter and spring. February posted 8,471 authorities, March reached 8,496, and May recorded 8,290, demonstrating consistent engagement despite affordability challenges. This leading indicator, drawn from Ray White’s commanding 15 per cent market share, suggests vendors are recognising the opportunity created by strong buyer demand and elevated clearance rates. The recent uptick signals potential for an extended selling season, offering buyers improved choice heading into the final quarter.