
REGIONAL OUTLOOK
Defining “Regional” in Australia
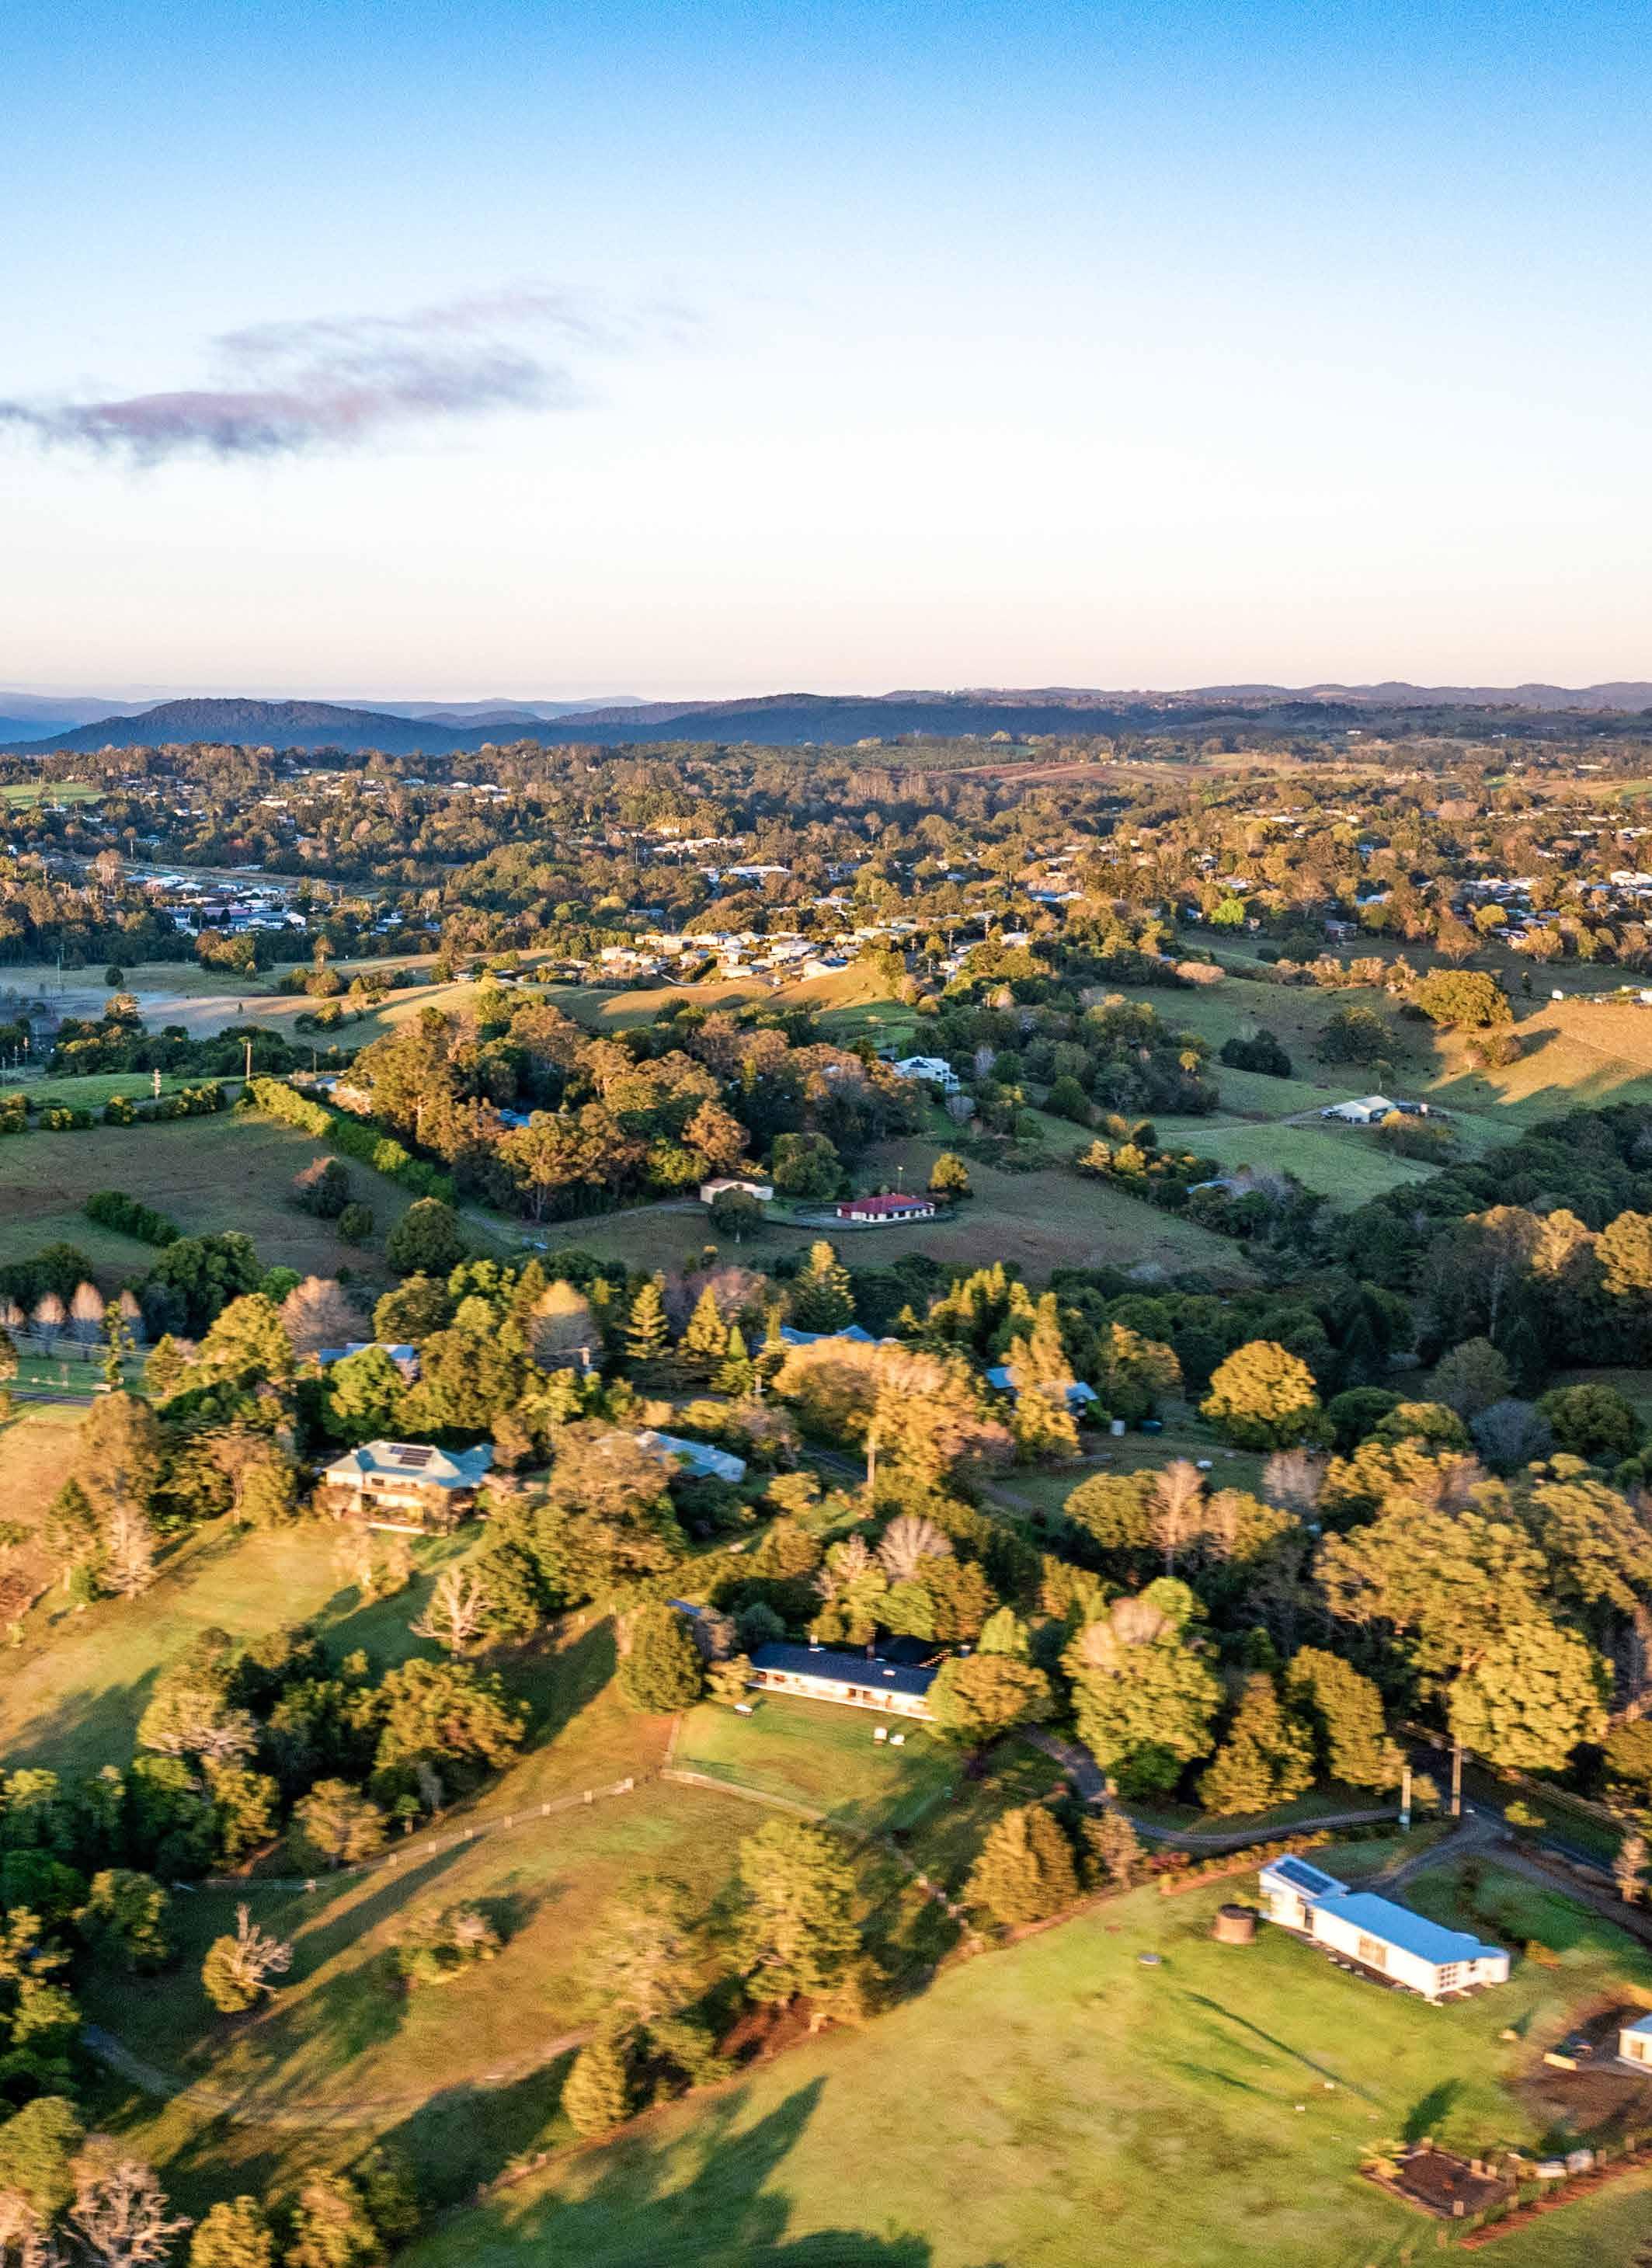
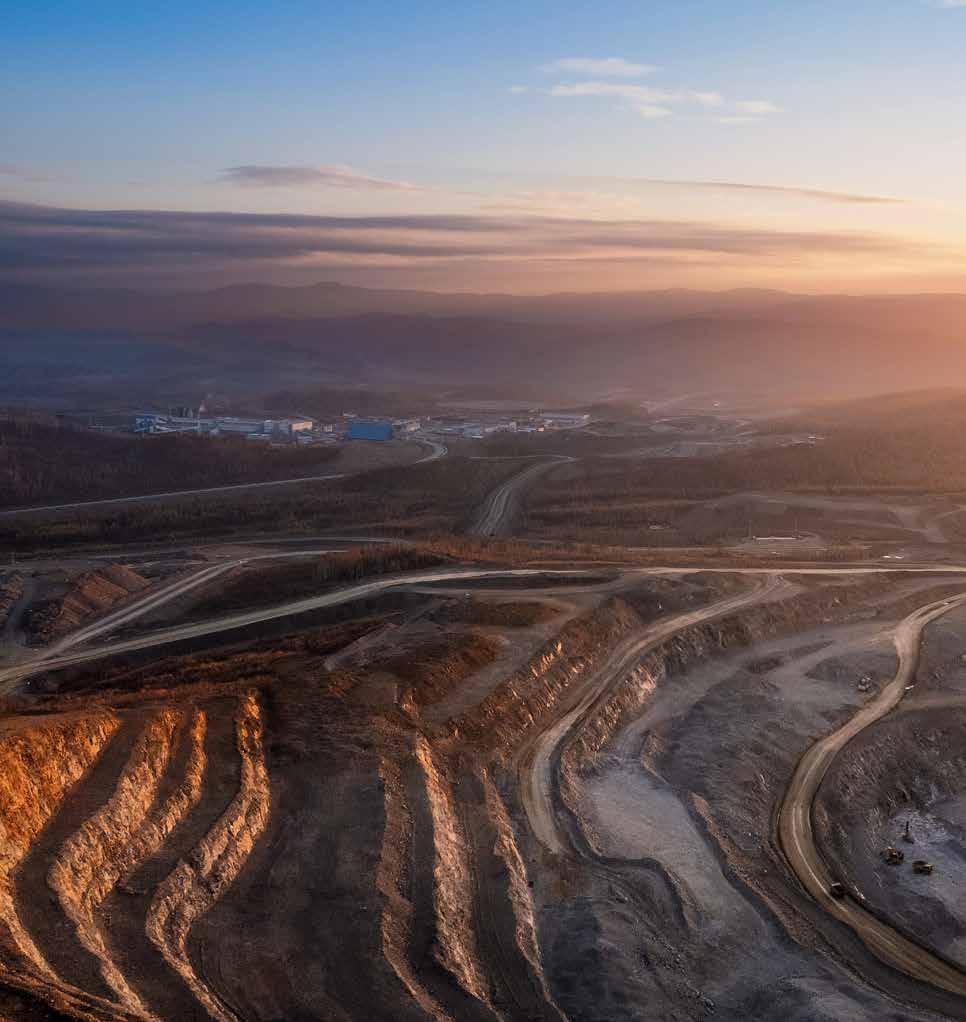
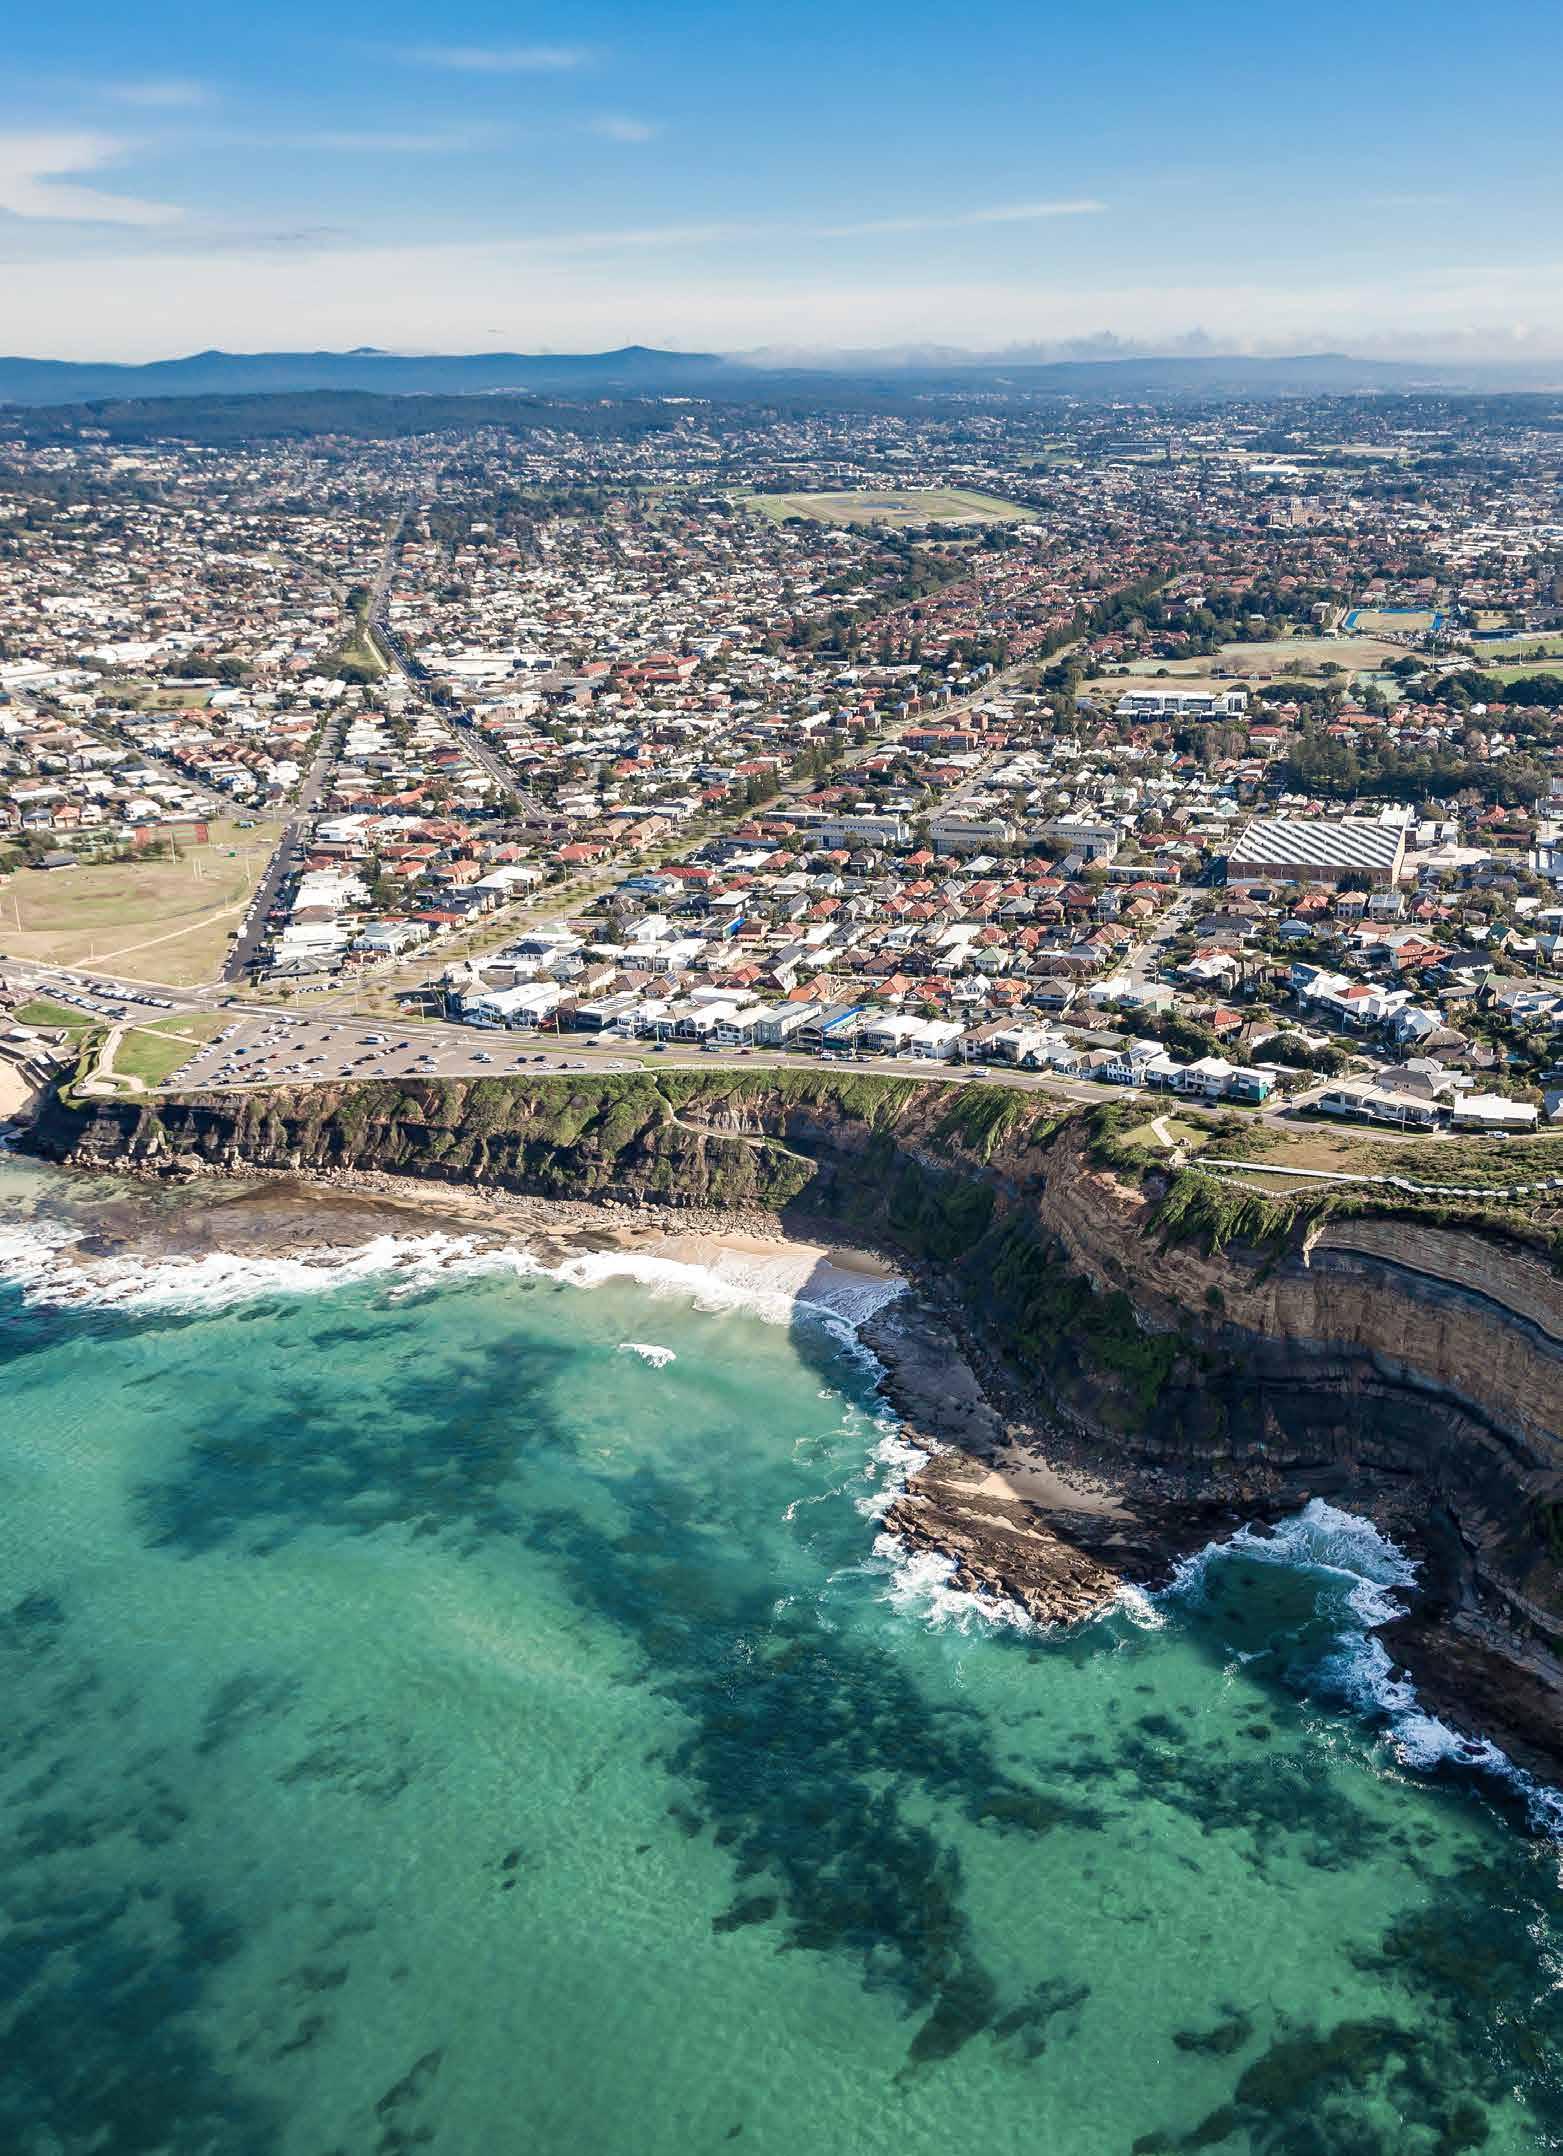
Regional Australia is more than farmland. Spanning everything beyond our eight capital cities, it encompasses thriving coastal centres, established inland hubs, wine regions, mining towns, and agricultural communities. Each region represents a distinct facet of regional life shaped by local industry, geography, and community character
Unlike capital city markets, regional property responds to hyper-local factors like mining cycles, agricultural prosperity, infrastructure investment, and lifestyle-driven migration. Representing one-third of Australia’s population, it’s a significant and increasingly dynamic segment of the national property market.


Welcome
Regional Australia’s property landscape in 2025 presents a compelling story of economic transformation, demographic shifts, and commodity-driven prosperity. From the wheat fields of Western Australia to the wine regions of South Australia, from Tasmania’s lifestyle markets to Queensland’s mining heartlands, regional property markets have evolved far beyond simple metropolitan spillover effects to become sophisticated economic ecosystems in their own right.
In this second edition of our Regional Outlook Report, Ray White brings together comprehensive analysis from our Economics team to examine not just regional performance as a whole, but the eight distinct market segments that drive regional Australia’s success. Rather than treating regional markets as a single entity, we’ve analysed the specific economic forces, demographic trends, and commodity cycles that shape lifestyle destinations, wine country, holiday home markets, cattle regions, mining towns, and agricultural areas.
Our group Chief Economist, Nerida Conisbee, provides detailed economic analysis of the fascinating connections between commodity cycles and property performance, examining how wheat prices, cattle markets, and mining volatility translate into housing demand across agricultural and resource regions. Our Head of Research, Vanessa Rader, explores the complex relationships between wine production fundamentals and property values, the surprising

DAN WHITE MANAGING DIRECTOR, RAY WHITE GROUP
dynamics of holiday home markets with extreme vacancy rates, and the cultural impact of Australia’s Big Things on regional property performance. Our Senior Data Analyst, Atom Go Tian, offers valuable insights into overall regional performance and lifestyle market dynamics, examining how affordability-driven migration has evolved from New South Wales and Victoria to South Australia as earlier markets reached maturity.
This report also examines the parallel commodity markets that drive regional prosperity, particularly agricultural and mining sectors, which offer valuable insights into the economic foundations that underpin regional property performance. These economic indicators often anticipate or mirror trends we later see in regional real estate markets.
As Australia’s largest real estate group, with an unrivalled presence in regional markets across every state and territory, Ray White is uniquely positioned to provide this comprehensive analysis of regional property performance. Our network spans from Sydney’s harbour to remote mining towns, from coastal lifestyle destinations to agricultural centres, offering unparalleled insights into the complex dynamics that drive regional Australia’s success.
We trust this report will serve as a valuable resource for property owners, investors, developers, and industry professionals seeking to understand the evolving dynamics of regional Australia’s property markets in 2025.
Executive summary
Regional Australia has outpaced national property markets by 14 percentage points over the past decade, delivering 98.8 per cent house price growth compared to 84.7 per cent nationally. This isn’t just metropolitan spillover anymore - it represents a fundamental transformation where regional markets have developed their own economic foundations, driven by two powerful and distinct engines.
The first engine - lifestyle migrationbegan early when Sydney and Melbourne’s housing crisis pushed buyers toward New South Wales and Victoria’s coastal and country markets. Tasmania joined this wave, leveraging its island appeal and dramatic affordability advantage. As these pioneer markets matured and prices rose, demand shifted toward South Australia, which now serves as Australia’s affordability escape valve. Regional house prices have climbed to 72 per cent of national levels, up from 65 per cent historically, and the narrowest this gap has ever been.
Within lifestyle markets, a secondary evolution is occurring. Premium coastal destinations like Byron Bay and Lorne are cooling as prices push buyers away, while more accessible alternatives including mountain retreats and wine regions maintain stronger momentum. The data reveals that wine country success depends on production fundamentals rather than prestige. High-volume regions like Barossa Valley outperform boutique markets that have reached appreciation limits.
The second engine - commodity cycles - has created extraordinary opportunities, particularly benefitting Queensland and

NERIDA CONISBEE
Western Australia. Agricultural regions have delivered remarkable returns, with wheat belt areas showing 85 per cent house price growth over the decade as perfect correlation emerged during the 2019-2022 La Niña period. Cattle regions achieved 65 per cent average appreciation, led by the Darling Downs at 95 per cent growth as Australia’s feedlot capital.
Mining regions demonstrate the most dramatic patterns. Some areas crashed over 65 per cent from boom peaks before staging remarkable recoveries. Western Australia’s 45.2 per cent post-pandemic surge reflects iron ore recovery and the emerging lithium boom, while Queensland’s mining regions have rebounded strongly after earlier declines.
Even holiday home markets reveal surprising dynamics. Australia’s highest vacancy locations like Moreton Islandwith 66 per cent unoccupied dwellings - command premium prices and delivered 140.9 per cent decade growth, proving scarcity can drive values independent of traditional investment fundamentals.
This dual-engine growth has positioned regional Australia as a mature alternative to metropolitan living with sustainable foundations beyond simple city spillover effects. Regional markets now represent genuine economic opportunities alongside lifestyle benefits, supported by infrastructure investment, commodity prosperity, and permanent demographic shifts that signal a lasting transformation in Australia’s settlement patterns.
RAY WHITE GROUP CHIEF ECONOMIST


Regional Australia outpaces national

Regional Australia’s property boom is driven by two powerful forces: people escaping expensive city prices for lifestyle benefits, and the boom-bust cycles of commodity markets.
The affordability story started before the pandemic, as Sydney and Melbourne buyers sought coastal and country alternatives. The pandemic accelerated this trend when remote work made regional living more viable for city workers.
The commodity story is different as it is tied to global demand for

Australia’s resources like iron ore, coal, and lithium. When prices are up, mining towns boom. When they fall, these communities struggle.
For the first half of the last decade, price growth between regional and national Australia was relatively similar, with regional Australia performing only 2.4 per cent better than national. However, the pandemic was a key turning point. From 2020 onwards, house price growth in regional Australia began to diverge from national house price growth
due to a combination of affordabilitydriven lifestyle migration and commodity cycle booms. Between 2015 and 2025, regional house prices grew 98.8 per cent to $688,000, while national house prices grew only 84.7 per cent to $950,000. As it stands, regional house prices represent just 72 per cent of national house prices, up from around 65 per cent historically and the closest this price gap has ever been.
Between 2015 and 2025, regional house prices grew 98.8 per cent to $688,000, while national house prices grew only 84.7 per cent to $950,000.
ATOM GO TIAN RAY WHITE SENIOR DATA ANALYST

REGIONAL AUSTRALIA 10 YEAR PRICE GROWTH
New South Wales
Regional New South Wales was an early standout performer, growing 18.3 per cent between 2015 and 2019. Sydney’s high prices drove buyers to seek coastal and country alternatives in areas like the Southern Highlands, Byron Bay, and Newcastle.
Strategic infrastructure investments helped accelerate this trend. The Rebuilding New South Wales program, Pacific Highway improvements, and regional rail upgrades made these areas more accessible and attractive to city buyers.
This early momentum paid off during the pandemic, with regional New South Wales achieving strong 51.7 per cent growth as the lifestyle shift accelerated.
Post-pandemic, growth has slowed but remains solid at 13.0 per cent between 2023 and 2025.
SOURCE: NEOVAL
Regional Victoria saw the strongest pre-pandemic growth of any regional market with a 24.2 per cent increase in house prices from 2015 to 2019. Like New South Wales, Melbourne’s affordability pressures drove buyers to areas like Geelong, Bendigo, Hume, and Ballarat. Early infrastructure investments also worked to position Victoria perfectly for the pandemic lifestyle boom, matching New South Wales, with virtually identical 51.5 per cent growth.
However, Victoria now shows clear signs of market exhaustion. Post-pandemic growth has been the weakest nationally at just 3.1 per cent between 2023 and 2025. This sharp decline reflects Melbourne’s broader market cooling that has reduced the metropolitan spillover effect that drove much of the regional demand. Victoria faces more severe capacity constraints than New South Wales’ more geographically diverse regional markets. REGIONAL
SOURCE: NEOVAL
REGIONAL
Queensland
Regional Queensland’s house market tells two distinct stories: the boom-and-bust cycles of mining towns and the steady rise of premium coastal areas.
Before the pandemic (2015-2019), the region barely grew at just 1.5 per cent. The Gold Coast and Sunshine Coast performed well with 12 per cent and 14 per cent growth respectively. But mining areas like Central Queensland, Townsville, and Mackay declined by around 10 per cent. During the pandemic, coastal markets exploded. The Gold Coast and Sunshine Coast saw massive growth of 56 per cent and 58 per cent. Mining regions also bounced back strongly with 31 per cent growth as the economy shifted.
After the pandemic, coastal growth continued but slowed to a more sustainable 26 per cent for the Gold Coast and 22 per cent for the Sunshine Coast. Meanwhile, mining regions hit their stride. As commodity prices recovered, these areas saw their best performance in a decade with 50 per cent growth between 2023 and 2025. This combination of coastal stability and mining recovery drove overall regional Queensland post-pandemic growth of 37.4 per cent, positioning it to become Australia’s most valuable regional property market.
REGIONAL
Tasmania
Regional Tasmania saw the second strongest pre-pandemic growth nationally at 30.2 per cent between 2015 and 2019. This growth began as part of Australia’s broader trend of affordability-driven lifestyle migration. Mainland buyers, particularly from Sydney and Melbourne, found they could access significantly lower house prices in regional cities like Launceston, Burnie-Ulverstone, and Devonport with strong lifestyle appeal. This early momentum accelerated dramatically during the pandemic, with regional Tasmania recording the highest pandemic growth of 74.4 per cent. Remote work made the island’s geographic isolation irrelevant for many professionals, while its clean environment and outdoor lifestyle became highly desirable during lockdowns. However, like Victoria, Tasmania now shows signs of market exhaustion.
Post-pandemic growth has slowed to just 2.4 per cent between 2023 and 2025, the second weakest performance nationally after Victoria.
This decline reflects Tasmania’s unique constraints. Unlike mainland states, the island has limited land suitable for development, restricted transport links, and a small local economy. At current prices of $553,000, still below national house prices but up dramatically from pre-pandemic levels, regional Tasmania has priced out many local buyers while reaching affordability limits for mainland migrants. The market appears to have absorbed the initial wave of lifestyleseeking buyers, with few new arrivals to sustain growth momentum.
SOURCE: NEOVAL
$600K $485K
REGIONAL
Western Australia
While Queensland’s growth reflects commodity recovery similar to Western Australia, regional Western Australia demonstrates even more dramatic commodity cycle volatility. The state shows the strongest post-pandemic growth at 45.2 per cent following a severe pre-pandemic decline of -11.8 per cent. When iron ore prices collapsed from 20142019, it devastated regional economies. Towns that relied on mining services and agricultural exports to China saw their populations shrink.
The current surge reflects iron ore recovery and Western Australia’s emergence as a critical lithium supplier for global battery production, alongside traditional agricultural export strength. Regional Western Australia communities that experienced population exodus now face acute housing demand from returning mining workers, creating genuine supplydemand imbalances driving price growth.
REGIONAL
South Australia
South Australia represents a third distinct pattern within Australia’s regional narrative. Regional South Australia’s minimal pre-pandemic growth (0.06 per cent) reflects economic challenges including disproportionate impact from automotive industry closures, sustained population outflow to eastern states, and limited economic diversification. Before the pandemic, regional South Australia remained largely stagnant as young people migrated to higher-opportunity markets.
SOURCE: NEOVAL
However, current acceleration (43.0 per cent post-pandemic) positions South Australia as the affordability escape valve for buyers priced out of New South Wales and Victoria’s regional markets. As those markets matured and became expensive, buyers discovered South Australia offered comparable lifestyle benefits at substantial discounts while maintaining economic stability. The evolution of wine regions like Barossa Valley toward premium products, combined with defence industry expansion in centres such as Adelaide Hills, has created diverse economic foundations supporting sustained demand.
Northern Territory
Regional Northern Territory represents Australia’s most challenged regional market, with consistently weak performance including pre-pandemic decline (-3.3 per cent), the lowest pandemic growth nationally (14.5 per cent), and near-stagnant post-pandemic performance (0.9 per cent). Unlike South Australia’s successful positioning as
an affordability alternative, Northern Territory’s low house prices at $467,000 haven’t translated into buyer interest, suggesting that affordability alone cannot drive regional market performance without accompanying lifestyle amenities, economic opportunities, or geographic accessibility that characterise successful regional markets elsewhere.
SOURCE: NEOVAL

Looking forward
The transformation of regional Australia from 2015-2025 reveals two distinct growth engines rather than a single regional market.
1. Affordability-driven migration powered New South Wales and Victoria’s early success, then spread to South Australia as those markets became expensive. Buyers seeking lifestyle benefits at lower prices have driven sustained demand in coastal and country areas.
2. Commodity cycles created the dramatic swings in Queensland and Western Australia’s mining regions. These areas declined when prices fell, then surged when global demand for Australia’s resources recovered.
As regional prices rise closer to city levels, successful regional markets are becoming less about being “cheap alternatives” and more about offering genuine economic opportunities alongside lifestyle benefits.
The Australian lifestyle boom

Lifestyle markets are regional areas where buyers prioritise scenery, recreation, and quality of life over purely economic factors. These destinations attract people seeking coastal towns, wine regions, mountain retreats, or cultural hubs that offer benefits often unavailable in major cities.
New South Wales and Victoria are home to the most popular lifestyle markets due to their proximity to Sydney and Melbourne,
combined with natural diversity and longer settlement history. As they become more expensive, buyers are discovering unique advantages in other states: Queensland’s tropical coasts, Western Australia’s wine regions and Mediterranean climate, South Australia’s wine heritage, Northern Territory’s desert landscapes, and Tasmania’s island living.
The pandemic boosted all lifestyle markets, with growth ranging from 30 per cent to 65 per cent from
2020-2022. However, pre-pandemic patterns show significant differences between states that continue to shape performance today.
The pandemic boosted all lifestyle markets, with growth ranging from 30 per cent to 65 per cent from 2020-2022.
ATOM GO TIAN RAY WHITE SENIOR DATA ANALYST
New South Wales
New South Wales lifestyle markets were early winners from Sydney’s affordability crisis. Between 2015 and 2019, regional New South Wales lifestyle destinations grew between 14.5 per cent and 28.2 per cent, with premium areas like Bangalow near Byron Bay leading.
The pandemic accelerated this trend, but now growth has shifted within the state. The most expensive lifestyle destinations are slowing down. Bangalow, which had the strongest pre-pandemic growth, now shows the

weakest post-pandemic performance at just 4.6 per cent. Byron Bay and the Southern Highlands follow similar patterns as prices push buyers away.
Meanwhile, more affordable lifestyle areas are picking up momentum. The Central Coast and Blue Mountains, which saw modest early growth, now show stronger performance. Port Macquarie, Coffs Harbour, and Hunter Valley offer cheaper entry points to New South Wales lifestyle living.
BYRON BAY
MORNINGTON PENINSULA
Victoria
Victoria’s lifestyle markets showed even stronger early performance than New South Wales, with growth ranging from 15.5 per cent to 40.7 per cent between 2015 and 2019 as Melbourne buyers sought alternatives.
Now Victoria’s lifestyle markets show clear signs of buyers moving to more affordable options within the state. The Grampians, Victoria’s most affordable lifestyle market, now leads growth after minimal pre-pandemic performance.
Meanwhile, premium coastal markets like Lorne and Mornington Peninsula have declined slightly (around -0.5%), while Otway has slowed to 2.6 per cent growth as prices push buyers away.
Bright-Mount Beauty stands as the exception, maintaining strong growth across all periods. But most other Victoria lifestyle markets have largely flattened from 2023 to 2025 following their huge pandemic boom, as buyers exhaust the affordable options within the state.
MACEDON RANGES
YARRA VALLEY
DAYLESFORD
Queensland
Queensland’s lifestyle markets follow a clear pattern: established premium destinations are slowing down while emerging areas accelerate.
The Gold Coast ($1.29M) and Sunshine Coast ($1.22M) lead in value and showed solid pre-pandemic growth of 12.2 per cent and 14.8 per cent respectively. Both exploded during the pandemic with growth around

56-58 per cent, but have now moderated to more sustainable 22-26 per cent post-pandemic growth as prices reach premium levels.
Port Douglas ($1.1M) follows a similar trajectory, with strong pandemic performance of 50.3 per cent now settling to 24.1 per cent growth.
Meanwhile, emerging destinations are hitting their stride.
Airlie-Whitsundays and Mission Beach show exceptional post-pandemic growth of 37-39 per cent at more accessible price points of $857,000 and $523,000 respectively. These areas saw minimal pre-pandemic activity but are now benefitting as buyers seek Queensland’s tropical lifestyle at lower entry costs.
AUGUSTA - MARGARET
RIVER - BUSSELTON
Western Australia
Western Australia’s lifestyle markets tell a unique story of commodity-driven volatility. Unlike New South Wales and Victoria’s steady early growth, Western Australia lifestyle destinations actually declined between 2015-2019, with Augusta-Margaret River-Busselton down 4.3 per cent, Denmark down 1.9 per cent, and Albany down 7.0 per cent.
This decline reflected Western Australia’s broader economic struggles during the mining downturn. Even lifestyle buyers were affected by reduced purchasing power across the state’s resource-dependent economy.
The pandemic changed everything. All three markets surged with growth between 30-39 per cent, then accelerated even further post-pandemic. Albany now shows the strongest recent performance
at 47.9 per cent growth between 2023 and 2025, followed by Augusta-Margaret River-Busselton at 42.5 per cent and Denmark at 40.8 per cent.
Augusta-Margaret River-Busselton leads in value at $987,000, offering coastal towns like Dunsborough, rural areas like Cowaramup, surf destinations like Yallingup, and the famous Margaret River wine region. Denmark ($795,000) and Albany ($704,000) provide more affordable entry points.
Western Australia’s lifestyle markets demonstrate how resource sector recovery has restored purchasing power, driving exceptional recent acceleration. This shows these markets are fundamentally tied to commodity cycles rather than pure affordability migration like the eastern states.
South Australia
South Australia’s lifestyle markets showed modest pre-pandemic growth of around 5-7 per cent, with the exception of Clare Valley declining slightly at -1 per cent. The pandemic brought strong acceleration across all South Australia lifestyle destinations, ranging from 30.6 per cent to 50 per cent growth. This momentum has continued as South Australia benefits from overflow demand from expensive eastern markets.
Victor Harbor on the Fleurieu Peninsula leads both price ($759,000)
and recent performance with 31 per cent post-pandemic growth, making it South Australia’s most popular lifestyle destination.
The wine regions are seeing particularly strong demand. Barossa Valley ($668,000) and Clare Valley ($531,000) both show exceptional recent growth of around 45.7 per cent as buyers discover these areas offer comparable lifestyle benefits to New South Wales and Victoria wine regions at substantial discounts.
Kangaroo Island remains the

most accessible option at $488,000, recording solid 27.9 per cent recent growth despite its more isolated location.
South Australia’s lifestyle markets demonstrate how affordability drives sustained demand when combined with genuine lifestyle appeal, positioning South Australia as the value alternative to expensive eastern markets.
VICTOR HARBOR
BAROSSA VALLEY
CLARE VALLEY
Northern Territory
The Northern Territory offers unique desert landscapes and First Nations cultural heritage for authentic wilderness experiences. However, both Alice Springs ($503,000) and Katherine ($357,000) declined before the pandemic, with Katherine falling 13.8 per cent and Alice Springs down one per cent. The pandemic brought modest recovery of around 14-15 per cent

growth, but this was the weakest nationally. Post-pandemic, Alice Springs has stalled at -0.1 per cent while Katherine shows minimal four per cent growth. Alice Springs commands a premium as gateway to Uluru, but remote location, extreme climate, and increasing crime rate create barriers for mainstream lifestyle migration.
Tasmania’s lifestyle markets show strong five-year performance but mixed recent trends. Break O’Day leads fiveyear growth at 60.2 per cent to reach $513,000, while Glamorgan-Spring Bay recorded exceptional 64.6 per cent fiveyear gains to $650,000. However, recent performance varies significantly across the state. Break O’Day maintains positive momentum with 2.5 per cent recent growth, while Launceston ($556,000) shows the strongest current performance at 3.9 per cent growth alongside solid 58.9 per cent five-year gains.
$810K $650K $620K $556K $513K
In contrast, other areas show clear cooling. Glamorgan-Spring Bay has declined 6.5 per cent over the past year, while Huon Valley ($620,000) fell 6.9 per cent recently despite strong 40.9 per cent five-year performance. Kingborough, the most expensive at $810,000, shows modest recent decline after 38.5 per cent five-year growth.
Tasmania’s lifestyle markets are splitting between accessible areas maintaining momentum and premium destinations facing buyer resistance as prices reach affordability limits.

Where wine country meets real estate


VANESSA RADER RAY WHITE HEAD OF RESEARCH
Australia’s wine regions present a property paradox: the most prestigious wine areas don’t necessarily command the highest prices or strongest growth. The relationship between wine industry fundamentals and residential property performance reveals that production volume, export economics, and infrastructure investment often matter more than reputation alone.
Australia’s wine industry operates on a massive scale; the 2025 grape crush of 1.57 million tonnes produces enough wine annually to fill over 400 Olympic swimming pools. If you lined up every bottle from this production end-to-end, they would circle the Earth 13 times. This production flows through regional communities, creating economic activity that impacts property values, though not always as expected.
WINE REGION PROPERTY PERFORMANCE
Granite Belt
SOURCE: NEOVAL, COTALITY, WINE AUSTRALIA
The outstanding performers
PENOLA, SA: Penola serves as the commercial hub for the famous Coonawarra wine region, renowned for premium Cabernet Sauvignon. The town benefits from the economic activity generated by one of Australia’s most respected wine areas without commanding vineyard-adjacent pricing. Coonawarra’s focus on premium reds has benefitted significantly from the resumption of China trade, where exports grew from virtually zero to 59 million litres in six months following duty removal.
GRANITE BELT, QLD: Queensland’s high-altitude wine region demonstrates how emerging areas with solid fundamentals can outperform established markets. The region benefits from accessibility to Brisbane while maintaining authentic wine country character at reasonable price points.
BAROSSA VALLEY, SA: The Barossa’s substantial production footprint of 53,100 tonnes represents 3.7 per cent of Australia’s national crush, supporting diverse economic activity beyond tourism. This volume creates employment across logistics, processing, and support industries, underpinning consistent property demand. The region’s combination of volume production and premium export positioning has benefitted strongly from renewed Asian market access.
HUNTER VALLEY, NSW: BranxtonGreta-Pokolbin represents the heart of the Hunter Valley wine region, combining premium wine production with strong tourism infrastructure and proximity to Sydney. The 5,635 tonnes crushed in the broader Hunter Valley creates solid economic fundamentals, while the region’s established cellar door culture and events calendar support consistent property demand from both lifestyle buyers and tourism-related investment.

Launceston TAS
MARGARET RIVER, WA: Despite producing wines that contribute significantly to Australia’s $3.72 per litre export average, Margaret River’s premium positioning may have reached natural growth constraints. The region’s 25,661 tonnes represents just 1.6 per cent of national production, creating a boutique economic base that supports high absolute prices but limits broader economic impact.
MORNINGTON PENINSULA, VIC:
Australia’s most expensive wine region property market shows how lifestyle premiums can reach saturation points. While the Peninsula commands top prices due to proximity to Melbourne and prestigious Pinot Noir production, moderate growth rates suggest these premiums may have natural ceilings.

The established premium markets The balanced performers Infrastructure and economic fundamentals
MUDGEE, NSW: Mudgee exemplifies successful regional wine area economics, balancing accessibility with wine industry fundamentals. The region benefits from reasonable distance to Sydney while maintaining authentic agricultural character and growing wine tourism infrastructure.
HEATHCOTE, VIC: Heathcote outperforms the more prestigious Yarra Valley despite lower wine tourism profile, suggesting production fundamentals and infrastructure investment drive better long-term returns than reputation alone.
YARRA VALLEY, VIC: Despite strong wine tourism credentials and proximity to Melbourne, Yarra Valley’s 8,982 tonnes represents just 0.6 per cent of national production. This limited agricultural scale may constrain broader economic impact compared to regions with more substantial output.
The Tasmanian turnaround
LAUNCESTON, TAS: Tasmania’s property market has clearly responded to the state’s wine industry expansion. With the state recording its second consecutive record crush in 2025 at 18,764 tonnes (up 61 per cent over two years), Launceston’s strong 106.1 per cent decade growth reflects the broader economic benefits flowing from Tasmania’s emerging wine reputation and increasing production scale.
The wine-property connection
The data reveals that successful wine region property markets share common characteristics:
1. Substantial production volumes creating economic stability
2. Strong export exposure benefitting from global wine trade
3. Infrastructure investment providing employment beyond agricultural cycles
Wine regions require substantial fixed infrastructure that provides economic stability beyond vintage fluctuations. Australia’s wine inventory of 1.96 billion litres represents approximately $5 billion in stored value, demanding warehouses, cellars, and processing facilities that create ongoing employment.
The domestic market absorption of 457 million litres annually, roughly 24 bottles per Australian, provides crucial economic stability for regions with strong cellar door profiles. Vineyard establishment costs between $25,000$40,000 per hectare, while modern winery construction represents millions in regional investment.
Regions with pure premium positioning without volume may struggle to generate the broad economic activity that drives sustained property growth. Conversely, high-volume commercial regions without lifestyle appeal face challenges commanding significant property premiums.
The strongest wine region property performers balance solid industry fundamentals with accessibility to major population centres and reasonable pricing that allows continued growth rather than hitting lifestyle premium ceilings. Export exposure, particularly to recovering markets like China, provides additional economic momentum that regional property markets clearly respond to.
High vacancy, higher returns: the holiday home paradox

VANESSA RADER RAY WHITE HEAD OF RESEARCH
Australia’s housing landscape harbours a hidden story within its vacancy statistics. While the national unoccupied dwelling rate sits at 10.1 per cent, some regional holiday destinations record vacancy rates exceeding 60 per cent - yet these same markets deliver above-average 10-year growth. These astronomical figures
reveal the concentrated geography of Australia’s holiday home phenomenon and challenge fundamental assumptions about property investment returns.
Using unoccupied housing data as a proxy for holiday home concentration reveals regional markets operating under entirely different economic principles than
metropolitan residential investment. The ten locations with Australia’s highest dwelling vacancy rates span six states, creating property markets that defy conventional performance expectations.
While the national unoccupied dwelling rate sits at 10.1 per cent, some regional holiday destinations record vacancy rates exceeding 60 per cent - yet these same markets deliver above-average 10-year growth.
THE HOLIDAY HOME PARADOX
Distribution of SA2s by 10 year house price growth vs unoccupied dwelling rate
Unoccupied dwelling rate

Moreton Island QLD
Lorne-Anglesea VIC
Yorke Peninsula South SA
Gingin
Dandaragan WA
Central Highlands TAS
Callala BayCurrarong
NSW
Moreton Island claims Australia’s highest unoccupied dwelling rate at 66 per cent, yet defies assumptions that extreme vacancy indicates market weakness.
The island premium paradox State-by-state dynamics
Moreton Island claims Australia’s highest unoccupied dwelling rate at 66 per cent, yet defies assumptions that extreme vacancy indicates market weakness. Properties command a median price of $1.25 million, with annual growth of 11.5 per cent and remarkable 10-year appreciation of 140.9 per cent.
The island’s success illustrates how scarcity can drive values independent of traditional investment fundamentals. Vehicle access requires four-wheel drive capability and ferry transport, yet this isolation creates premium positioning that conventional metrics struggle to capture. However, building materials and tradespeople require ferry transport, increasing maintenance costs significantly while insurance premiums often run 3040 per cent above mainland alternatives.

Victoria dominates premium holiday home markets, claiming four of the ten highest unoccupied locations. LorneAnglesea commands the highest median price at $1.57 million, yet records modest 3.8 per cent annual growth. Point Nepean follows similarly at $1.31 million with identical 3.8 per cent growth. Both suggest premium markets are reaching natural appreciation limits as affordability constraints restrict buyer expansion.
Tasmania contributes two intriguing markets demonstrating the island state’s tourism transformation. Central Highlands records 58 per cent unoccupancy with exceptional 157 per cent 10-year growth at $321,000 median, while GlamorganSpring Bay shows 132.4 per cent decade appreciation despite a recent 6.5 per cent annual decline.
New South Wales’ Callala BayCurrarong represents South Coast dynamics with 48 per cent vacancy, delivering solid 6.5 per cent annual growth and 126.8 per cent 10-year appreciation at $1.15 million median. The location benefits from Sydney and Canberra proximity while maintaining coastal lifestyle appeal.
South Australia’s Yorke Peninsula - South demonstrates regional affordability potential, combining 52 per cent unoccupied dwelling rate with 12.7 per cent annual growth at $490,000 median. Western Australia’s GinginDandaragan shows strong 11.4 per cent recent growth at $660,000, benefitting from Perth proximity.
The environmental cost reality Infrastructure and regulatory challenges
Highly unoccupied locations face environmental risks beyond what traditional residential investments confront. Coastal exposure accelerates maintenance cycles through salt air corrosion, with insurance premiums often 20-30 per cent above regional averages. Bushfire risk affects multiple locations, requiring elevated insurance and potential evacuation during peak tourism periods.
Climate change projections indicate these pressures will intensify, with sea level rise, increased storm frequency, and extended bushfire seasons threatening long-term viability in exposed locations. Successful markets increasingly factor environmental resilience alongside scenic appeal.
Highly unoccupied regions operate infrastructure designed for seasonal rather than permanent populations. Holiday home owners encounter service connection delays, limited provider options, and higher charges reflecting peak-period capacity constraints.
Recent regulatory changes have altered investment calculations. Victoria’s 7.5 per cent levy on short-stay platform revenue affects four locations in the analysis, while various councils implement rates surcharges for Airbnb properties. These measures respond to housing affordability pressures but reduce rental income potential for holiday home investors.
Tax implications add complexity, with Australian Taxation Office guidelines creating compliance requirements for dualpurpose properties and expense deduction limitations for properties not genuinely available for rent year-round.


The performance paradox explained Investment implications
The relationship between high unoccupied dwelling rate and performance reveals fundamental differences between tourism appeal and residential investment dynamics. Moreton Island’s exceptional growth alongside extreme vacancy demonstrates how exclusivity can drive returns independent of rental income potential.
Conversely, established premium markets like Lorne-Anglesea show how tourism success doesn’t automatically translate to sustained appreciation. These locations may have reached value ceilings where growth depends on broader economic factors rather than tourism demand.
Tasmania’s strong long-term performance across both locations suggests emerging holiday home markets can deliver substantial returns during development phases, but face volatility as seasonal patterns establish and infrastructure constraints emerge.
The data reveals three distinct performance categories: premium established destinations with moderate growth, emerging markets with strong appreciation potential, and regional affordable locations offering balanced returns with lower entry barriers.
Australia’s highest unoccupied regions demonstrate that holiday home investment operates under principles distinct from conventional residential analysis. Tourism appeal, environmental resilience, infrastructure capacity, and regulatory stability matter more than traditional metrics like rental yields or employment proximity.
Environmental risk management becomes crucial, with properties in exposed locations facing insurance cost escalation and potential value impairment. Regulatory risk represents an emerging factor, with policy measures likely to continue affecting short-term rental income potential.
The geographic diversity across all mainland states plus Tasmania demonstrates that holiday home opportunities exist across multiple market segments. Success requires understanding unique cost structures, risks, and market dynamics that distinguish these locations from conventional residential investment. The data suggests informed analysis can identify opportunities for both lifestyle and financial returns, but traditional investment wisdom may not apply in markets where scarcity, exclusivity, and seasonal demand patterns drive performance more than fundamental economic indicators.
When wheat prices soar, so do house prices in the grain belt
5

House prices in Australia’s wheat belt have surged 85 per cent over the past decade while wheat prices rose just 36 per cent. The connection between these markets runs deeper than the headline numbers suggest, with extraordinary periods where they move in perfect synchronisation - driven by weather booms that lift all regions simultaneously - followed by dramatic decoupling phases
NERIDA CONISBEE RAY WHITE GROUP CHIEF ECONOMIST
when broader economic forces like interest rates override agricultural fundamentals.
This analysis examines 11 major wheat growing regions across Australia from 2015 to 2025, including New South Wales’ Central West, Riverina, and New England areas, Queensland’s Darling Downs and Central Queensland, Victoria’s North West and Warrnambool
districts, South Australia’s BarossaYorke-Mid North and Outback regions, and Western Australia’s Wheat Belt and Outback South areas. Using annual wheat price data alongside regional median house prices, correlation coefficients were calculated to measure the statistical relationship between commodity movements and local property values across different time periods.
House prices in Australia’s wheat belt have surged 85 per cent over the past decade while wheat prices rose just 26 per cent.
PERFECT CORRELATION TO DRAMATIC DECOUPLING
Wheat prices vs average house price in wheat growing regions (2015-2025)

$420/t
$210/t
0
$630/t WHEAT PRICE HOUSE PRICE
$525K
$425K
$325K
$225K
SOURCE: NEOVAL, DAFF
Perfect correlation period
Decoupling period
The grain belt connection
Over the past decade, wheat prices and house prices in growing regions have moved with a correlation coefficient of 0.71 - a statistically strong positive relationship. When wheat prices climbed 36 per cent from $271 per tonne in 2015 to $369 per tonne in 2025, average house prices across wheat regions surged 85 per cent. This connection makes economic sense: higher wheat prices mean better farm incomes, stronger rural economies, and increased demand for local housing.
The relationship peaked during 2019-2022, when every single wheat growing region showed perfect correlation with commodity prices. During this period, wheat prices jumped from $290 to $619 per tonne - a 114 per cent increase - while house prices across wheat regions rose from $275,000 to $399,000.
Weather drives the cycles
The correlation patterns align closely with Australia’s weather cycles, particularly La Niña and El Niño events. The 2019-2022 La Niña period brought exceptional rainfall across most wheat regions, creating bumper harvests and synchronised prosperity. During these years, all 11 wheat growing regions moved in perfect lockstep with wheat prices.
Since 2022, as weather patterns returned to normal variability, the correlations have shifted. Some regions now show negative correlations as wheat prices declined 33 per cent from their 2022 peak while house prices continued rising on interest rate cuts and broader housing shortage pressures.
Regional winners and losers The current disconnect
Not all wheat regions respond equally to commodity price movements. Victorian regions like Warrnambool and South West show the strongest long-term correlations, while Queensland’s Central Queensland region demonstrates more resilience during downturns.
New South Wales regions - including the Central West, Riverina, and New England areas - exhibit high sensitivity to wheat price swings but also show the most volatility. South Australian wheat regions display extreme sensitivity, swinging from very strong positive correlations during boom periods to equally strong negative correlations during adjustments.
Western Australian wheat regions fall in the middle, showing moderate but consistent sensitivity to commodity cycles.
Since 2022, a disconnect has emerged. Wheat prices have fallen from their $619 per tonne peak to $369 today, yet house prices in wheat regions continue climbing. This reflects the broader housing market dynamics - interest rate cuts, supply shortages, and lifestyle migration - now outweighing agricultural factors.
However, history suggests this disconnect may not last. Previous cycles show that during stable wheat price periods, the correlation typically reasserts itself as other market forces moderate.
WHEAT REGION HOUSE PRICE GROWTH
From stable pre-boom conditions (2015–2018) through the La Niña rainfall boom (2019–2022) to recent post-boom adjustment with interest rate cuts (2022–2025)
Stable period (2015-2018) Boom period (2019-2022) Recent period (2023-2025)
SOURCE: NEOVAL,
and South West, VIC
New England and North West, NSW
Riverina, NSW Central West, NSW
Warrnambool
Local weather trumps national wheat prices
While national wheat prices provide the headline figure, local weather conditions determine whether individual regions actually benefit from commodity booms. Not all wheat regions move in sync with national prices because they may not be experiencing the same favourable growing conditions.
During uniform weather events, like widespread La Niña rainfall, all regions move together. But in typical years, regional differences in rainfall patterns, irrigation infrastructure, and seasonal cycles create divergent outcomes.
Victorian regions, which include the reliable Wimmera and Mallee districts, tend to show more consistent correlations partly due to their relatively stable rainfall patterns and established irrigation infrastructure. In contrast, the more weather-dependent rain-fed regions of New South Wales and South Australia exhibit stronger correlations during boom periods but also greater volatility when conditions turn.
Queensland’s wheat regions operate on different seasonal cycles and face different weather systems altogether, which helps explain their more moderate correlation patterns. Western Australian regions fall somewhere in between, with their Mediterranean climate providing reasonable reliability but still subject to significant year-to-year variation.
The wheat belt property story ultimately reflects local agricultural reality rather than just national commodity headlines. Regional growing conditions, seasonal timing, and weather resilience all influence whether rising wheat prices translate into local economic prosperity and housing demand.
Barossa - YorkeMid North, SA
SA Outback, SA
Wheat Belt, WA
WA Outback (South), WA
Darling DownsMaranoa, QLD Central Queensland, QLD
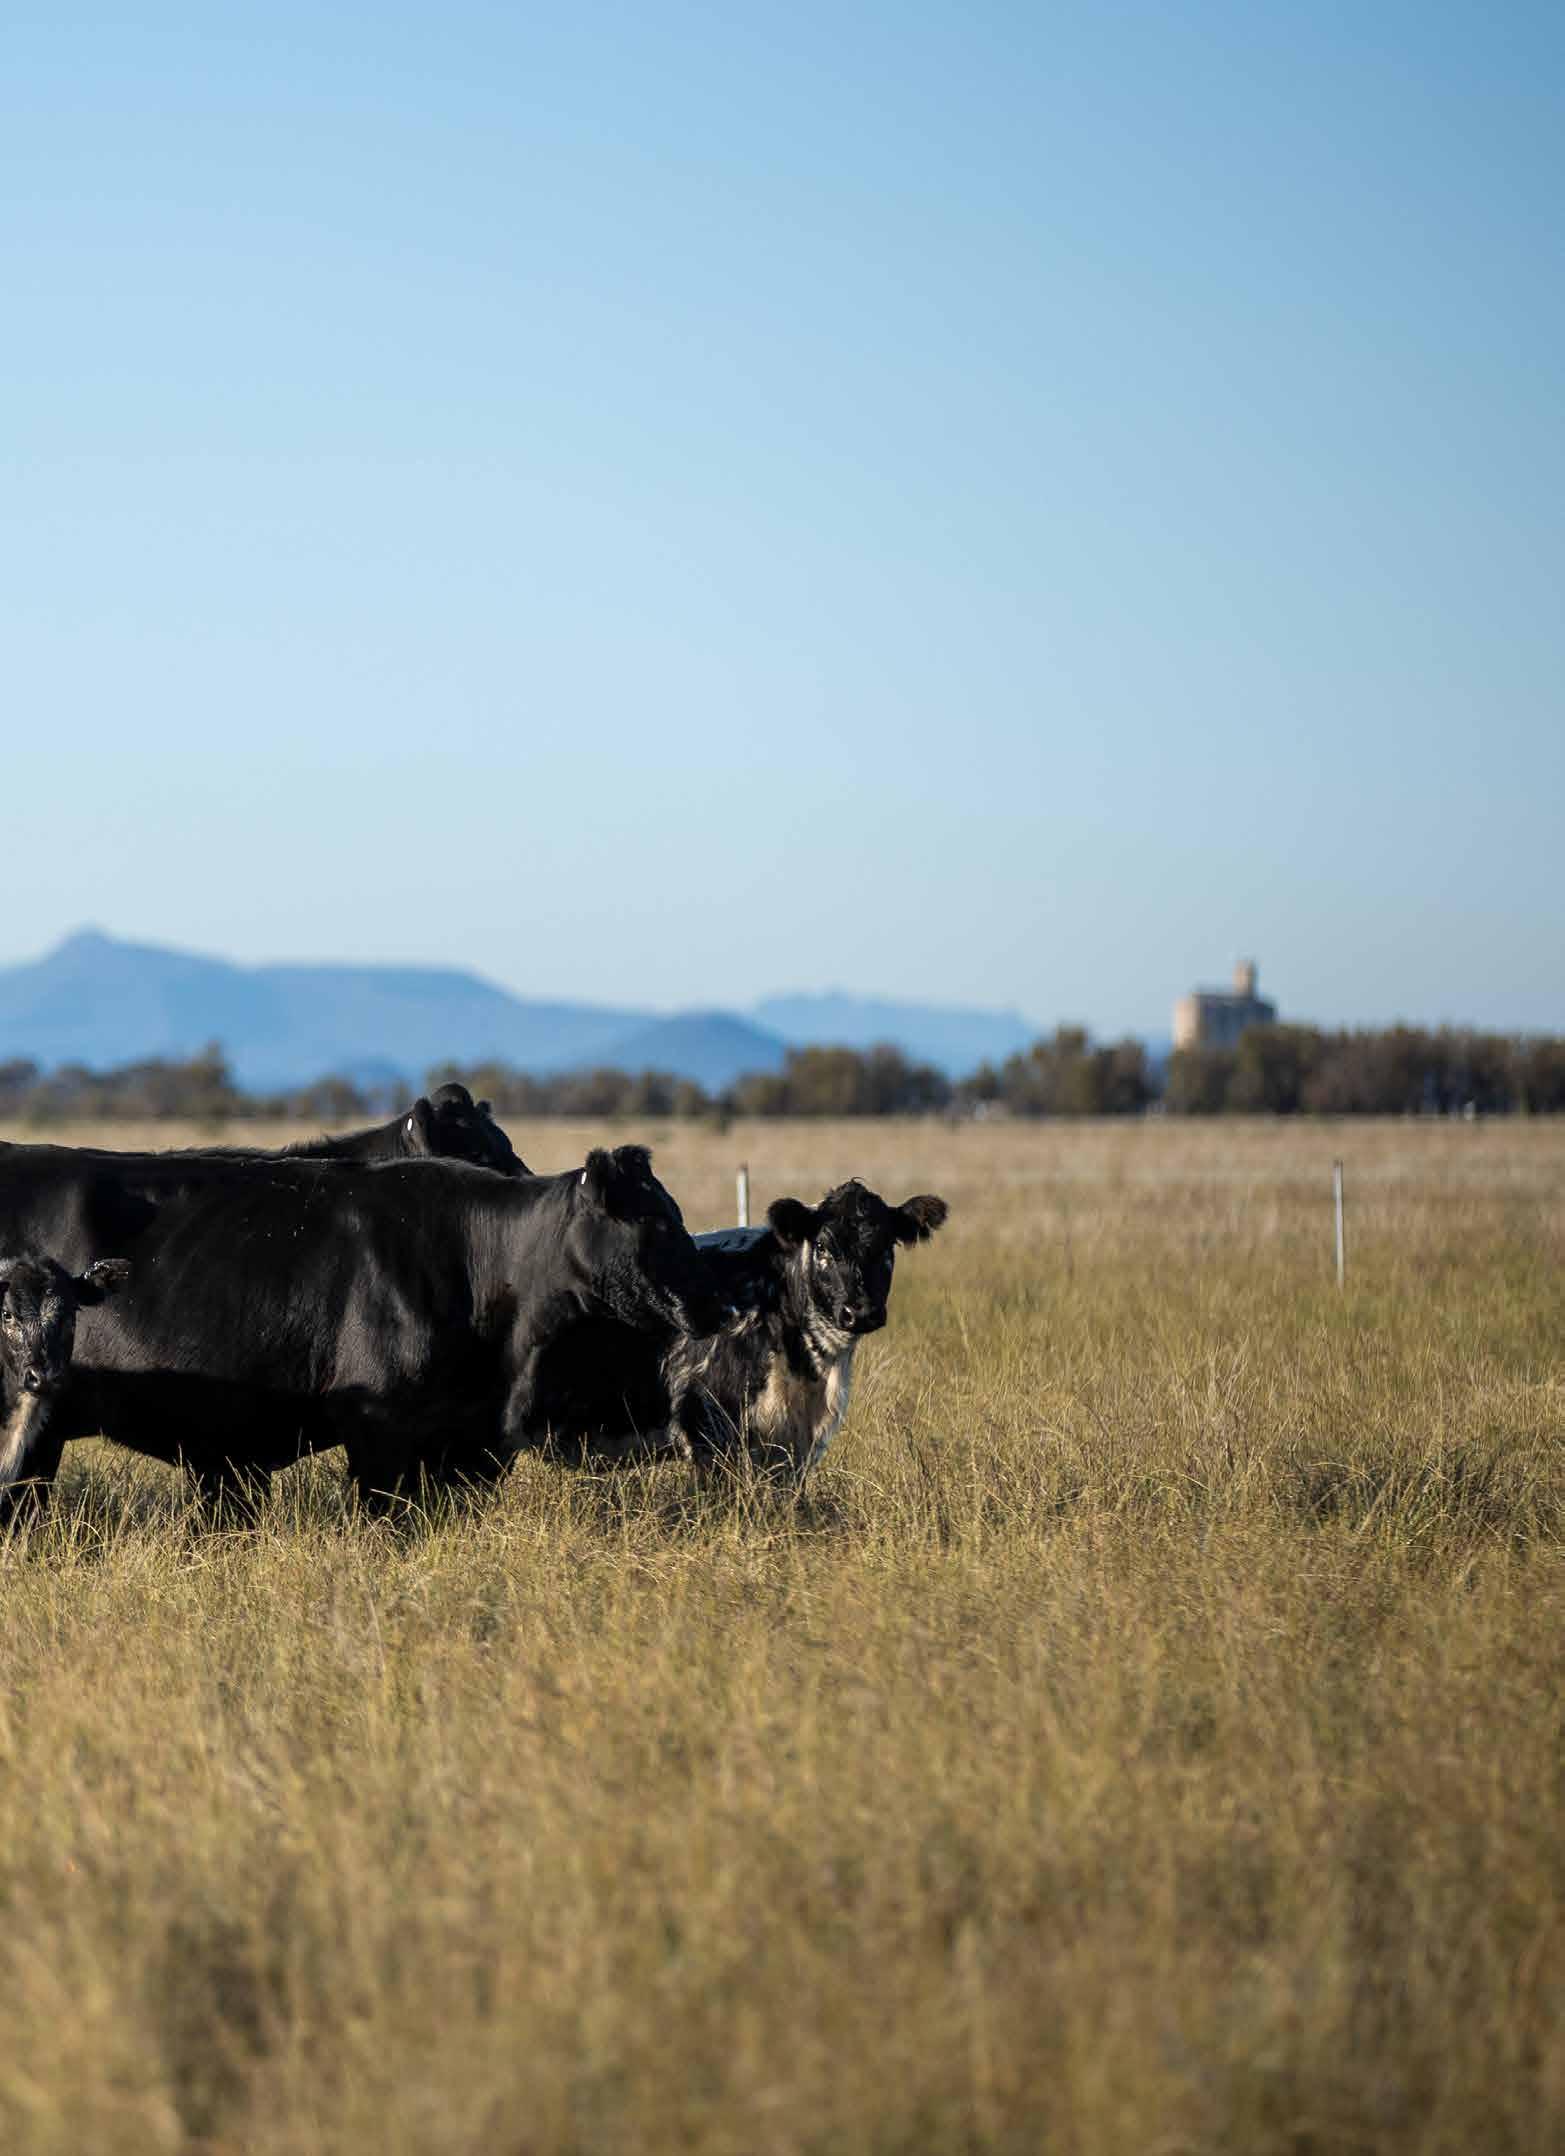
Cattle country’s property surge rides the beef boom
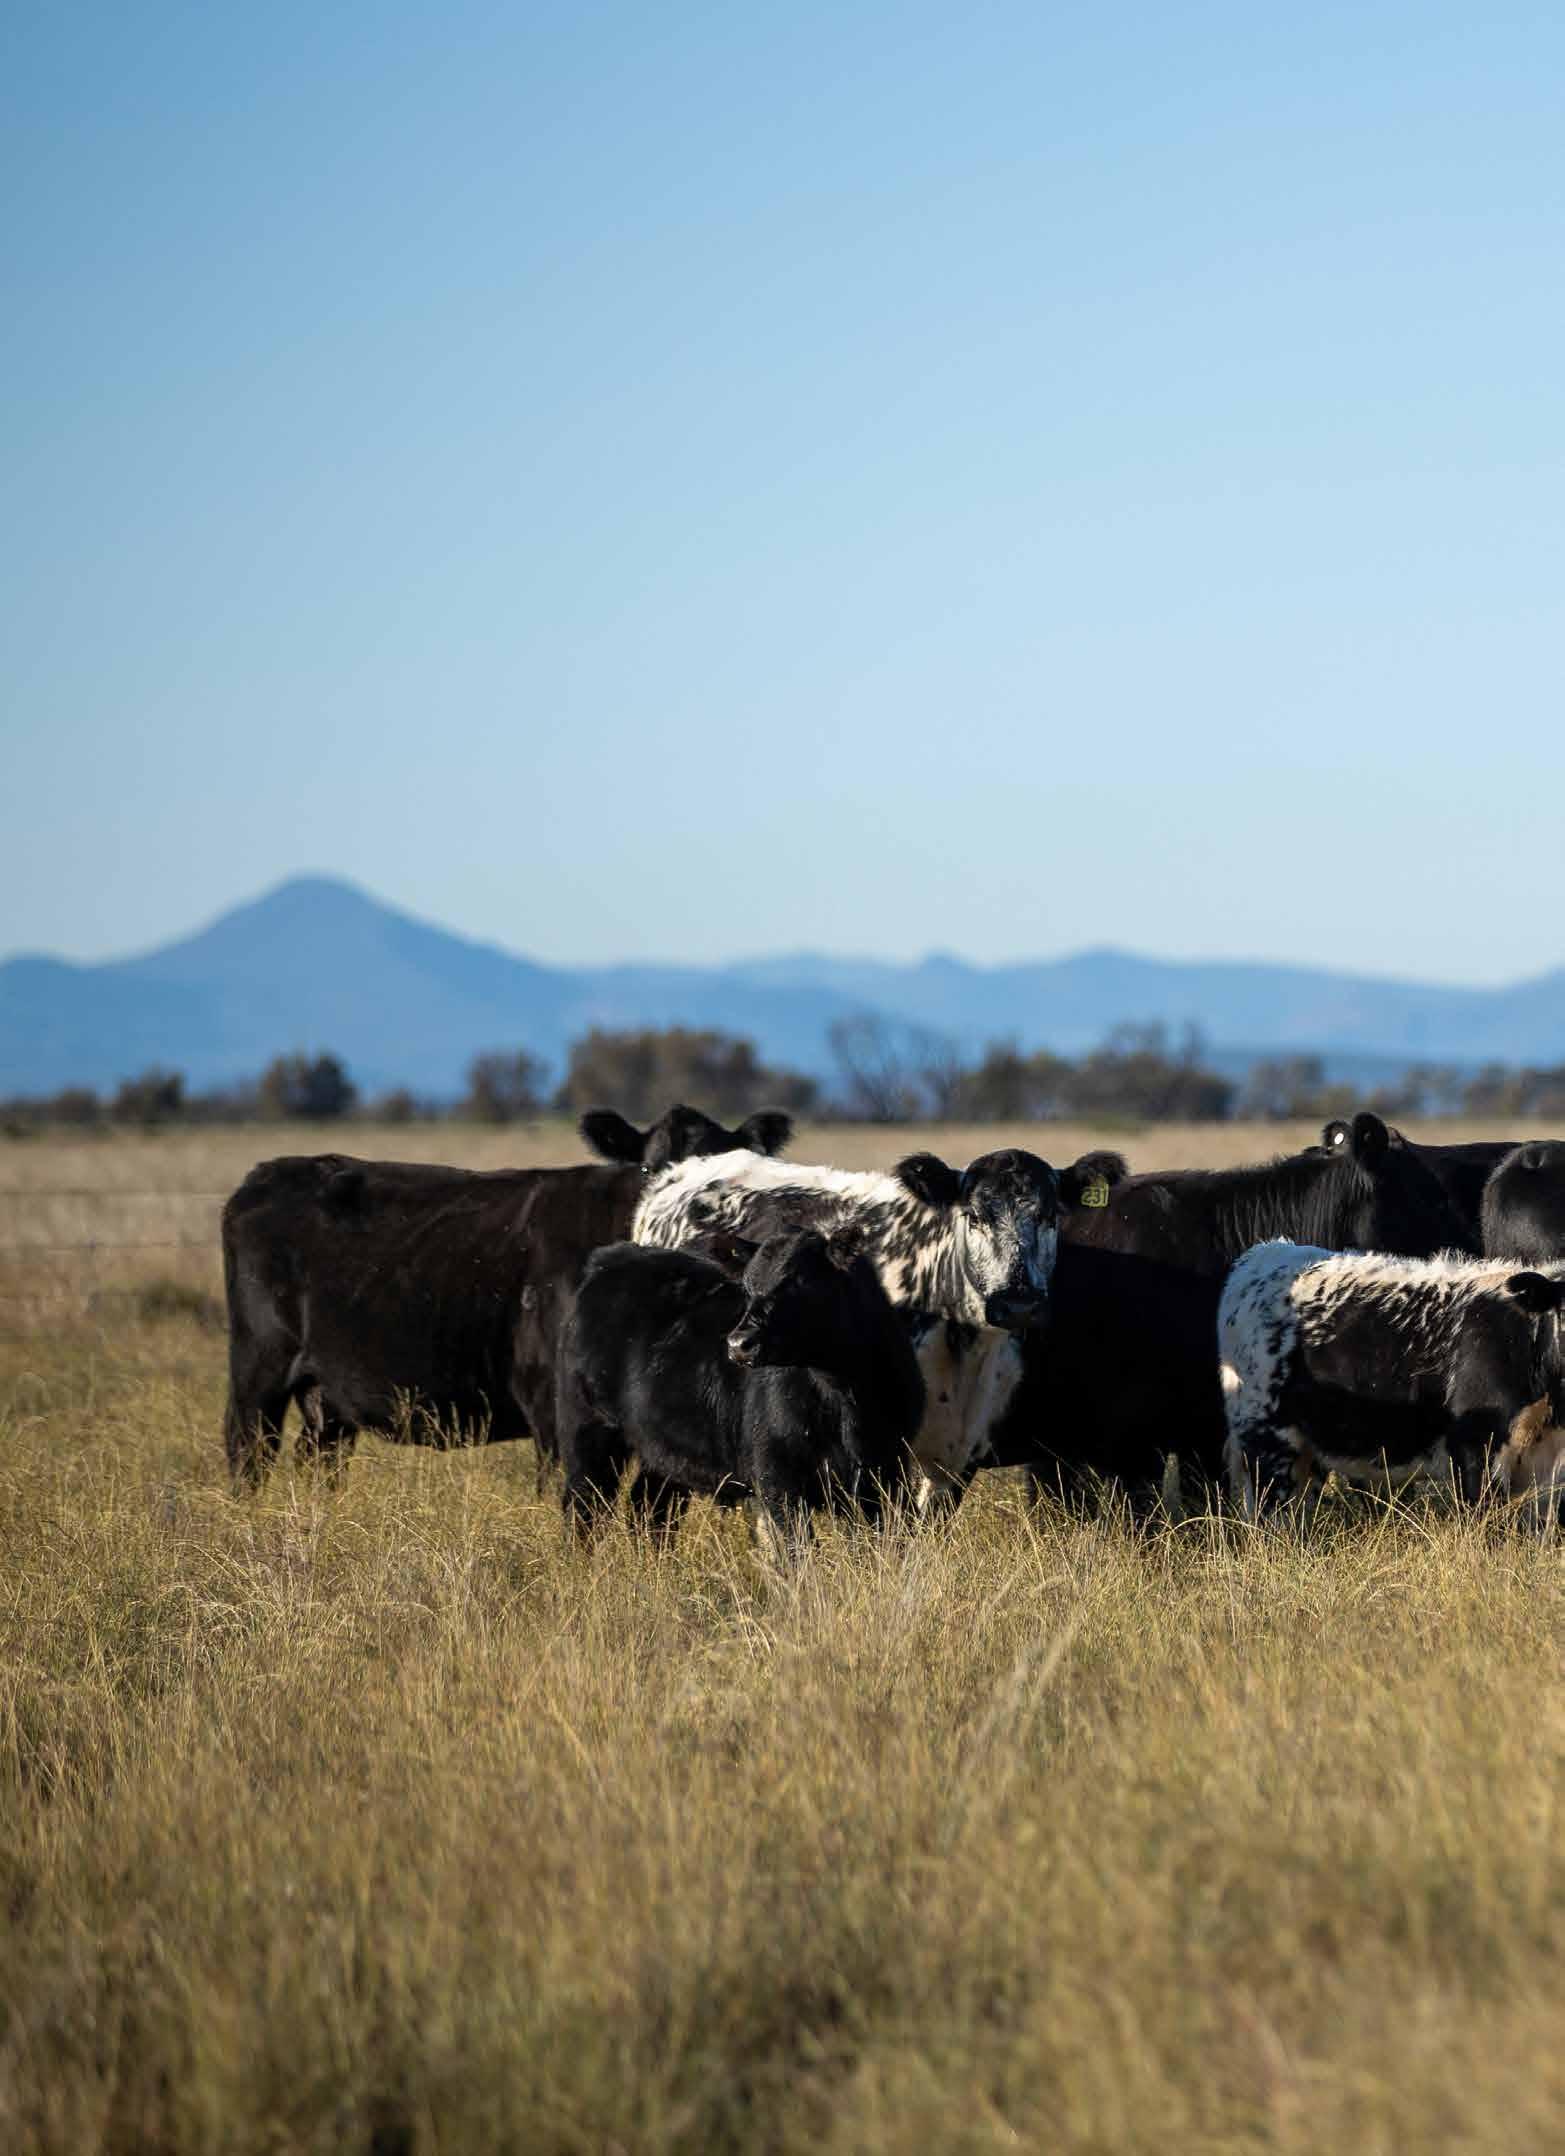
Australia’s cattle regions span dramatically different landscapes and climates, from New England’s temperate tablelands two hours from Sydney to the vast tropical stations of the Kimberley where properties can exceed a million hectares. The Victoria River District encompasses some of the Northern Territory’s largest cattle operations,
while Queensland’s Central Queensland region bridges coastal access with inland grazing country. The Darling Downs represents Australia’s most intensive cattle finishing area, leveraging rich soils and reliable rainfall to support both cattle and the grain that feeds them. These diverse cattle regions are delivering strong property returns,
with house prices surging 65 per cent over the past decade as beef prosperity combines with broader rural lifestyle trends. The Darling Downs leads with a remarkable 95.2 per cent increase, transforming from $229,000 median prices in 2015 to $448,000 today.
These diverse cattle regions are delivering strong property returns, with house prices surging 65 per cent over the past decade as beef prosperity combines with broader rural lifestyle trends.
BEEF REGION 1Y AND 10Y HOUSE PRICE GROWTH
Geometric mean house price as of 2025 vs 2024 and 2015
DARLING DOWNS, QLD
NEW ENGLAND, NSW
CENTRAL QUEENSLAND, QLD
KIMBERLEY, WA
VICTORIAN RIVER DISTRICT, NT
SOURCE: NEOVAL
New England follows closely with 90.4 per cent growth, while Central Queensland posted 78.3 per cent gains. Even remote regions are participating - the Kimberley has seen 50.3 per cent appreciation despite its isolation. Only the sparsely populated Victoria River District showed modest 12.7 per cent growth, though this still represents solid returns in one of Australia’s most remote areas.
This analysis examines median house price data from 2015 to 2025 across these five key cattle regions,
cross-referenced with Eastern States Young Cattle Indicator prices from Meat & Livestock Australia. Regional house price trends were analysed alongside quarterly cattle price movements to identify correlations and divergences, with particular attention to periods of significant commodity price volatility and broader economic shifts affecting rural property markets. Driving this boom is a powerful combination of strengthening cattle prices and changing rural preferences. Cattle values have climbed
39.5 per cent over the past decade, rising from 510c/kg in 2015 to 712c/ kg in 2025 according to the Eastern States Young Cattle Indicator. While substantial, this increase is dwarfed by the 65 per cent average house price growth across cattle regions, suggesting agricultural prosperity is being amplified by broader demographic and economic forces.
CATTLE BOOM AMPLIFIES REGIONAL HOUSE PRICE GROWTH
Eastern States Young Cattle Indicator vs regional house price performance, indexed to 2015
SOURCE: NEOVAL, MEAT & LIVESTOCK AUSTRALIA
From breeding to feedlots
Each region plays a distinct role in Australia’s beef supply chain, influencing how quickly cattle price improvements flow through to local economies.
New England’s temperate climate and proximity to major cities makes it ideal for premium breeding operations serving Sydney and Brisbane markets. The region captures quick benefits from price rises while also attracting lifestyle buyers seeking rural amenity close to urban centres.
The tropical Kimberley and Victoria River District focus on large-scale breeding
across vast pastoral leases, typically shipping cattle south for finishing. These regions benefit from low operating costs and economies of scale, though their remote locations can delay the flowthrough effects of commodity price improvements.
Central Queensland combines breeding with intensive finishing operations near major export ports at Gladstone and Rockhampton. This dual exposure to both domestic and international markets provides multiple revenue streams that support sustained
New England, NSW
Darling Downs, QLD
Victoria River District, NT Central Queensland
Kimberley, WA
economic growth beyond pure cattle price cycles.
The Darling Downs operates as Australia’s feedlot capital, fattening cattle with locally grown grain for both domestic consumption and export markets. This region shows the strongest response to cattle price movements as it captures value at the final, highest-margin stage of beef production.
Cattle
The boom behind the growth
Cattle prices have strengthened on multiple fronts since the drought recovery began. Producers are rebuilding herds rather than selling breeding stock, restricting supply. Feed costs have stabilised after earlier volatility, improving margins and encouraging producers to carry cattle to heavier weights. Favourable seasonal conditions across many regions have supported pasture growth, reducing expensive supplementary feeding costs.
Current price levels represent a significant recovery from dramatic recent volatility. Cattle prices soared to record highs of 1,050c/kg in 2022 before crashing 45 per cent to 579c/kg in 2023. Today’s levels around 712c/kg suggest the market has found more sustainable footing, though still well above historical averages.
Looking at the broader picture, current cattle prices sit 167 per cent above their 2000 lows of 266c/kg, reflecting a long-term structural shift toward higher protein demand, particularly from Asia. Cattle prices traditionally follow long cycles, with the rebuilding phase following
major drought events typically supporting elevated prices for several years.
The outlook has been transformed by shifting global trade dynamics. US tariffs on various goods have strained relationships with China, leading Chinese buyers to diversify their protein imports away from American suppliers. Australia is perfectly positioned to fill this gap, with China’s growing middle class continuing to demand premium protein.
This trade shift particularly benefits grain-fed operations around the Darling Downs, where feedlots can meet Chinese specifications for marbled, consistentquality beef. Export contracts locked at elevated prices provide strong foundations for continued producer confidence and regional economic activity.
Meanwhile, recent approval for US beef imports into Australia has had minimal impact due to quarantine restrictions, shipping costs, and strong consumer preference for local products. Import volumes remain tiny relative to domestic production.
Current price levels represent a significant recovery from dramatic recent volatility. Cattle prices soared to record highs of 1,050C/kg in 2022 before crashing 45 per cent to 579c/kg in 2023.
STAGES
REGIONS:
New England - breeding and backgrounding, temperate climate and improved pastures
Kimberley - pure production/breeding
Victoria River District - breeding, vast cattle stations
Central Queensland - operates across multiple stages (breeding and finishing), access to both extensive grazing and grain production, benefits from location near major export ports
Darling Downs - feedlot capital, fattening cattle, grain production, most sensitive to cattle price because of late stage in supply chain
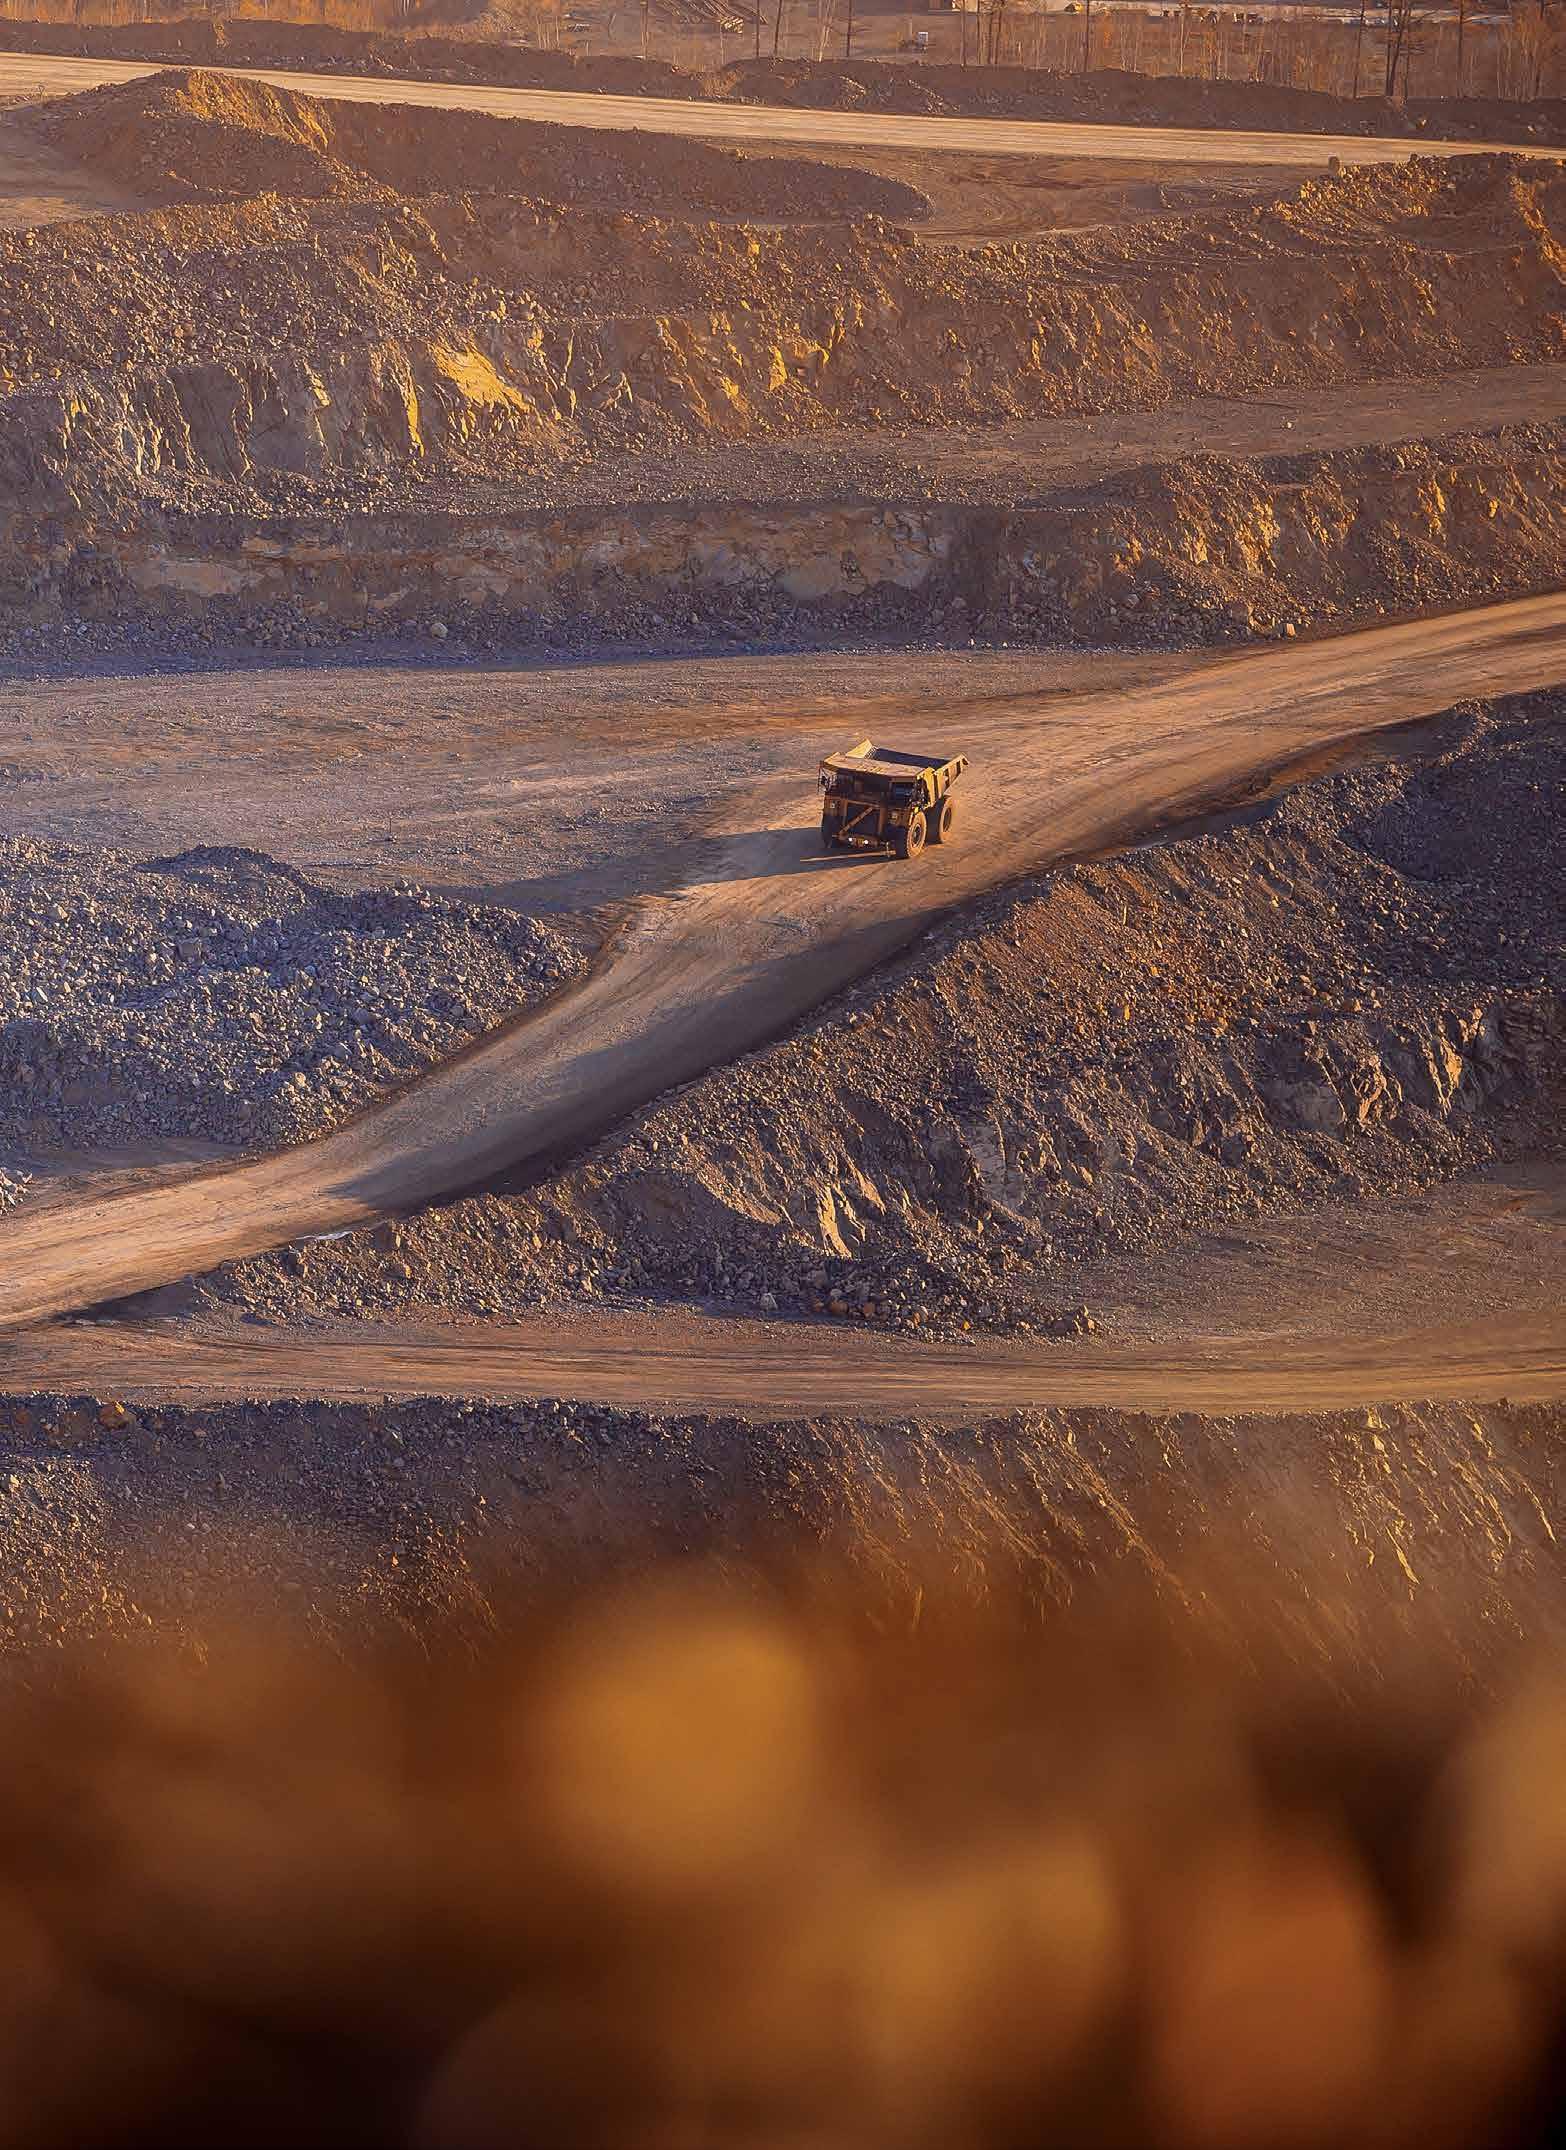
The volatile world of mining region house prices
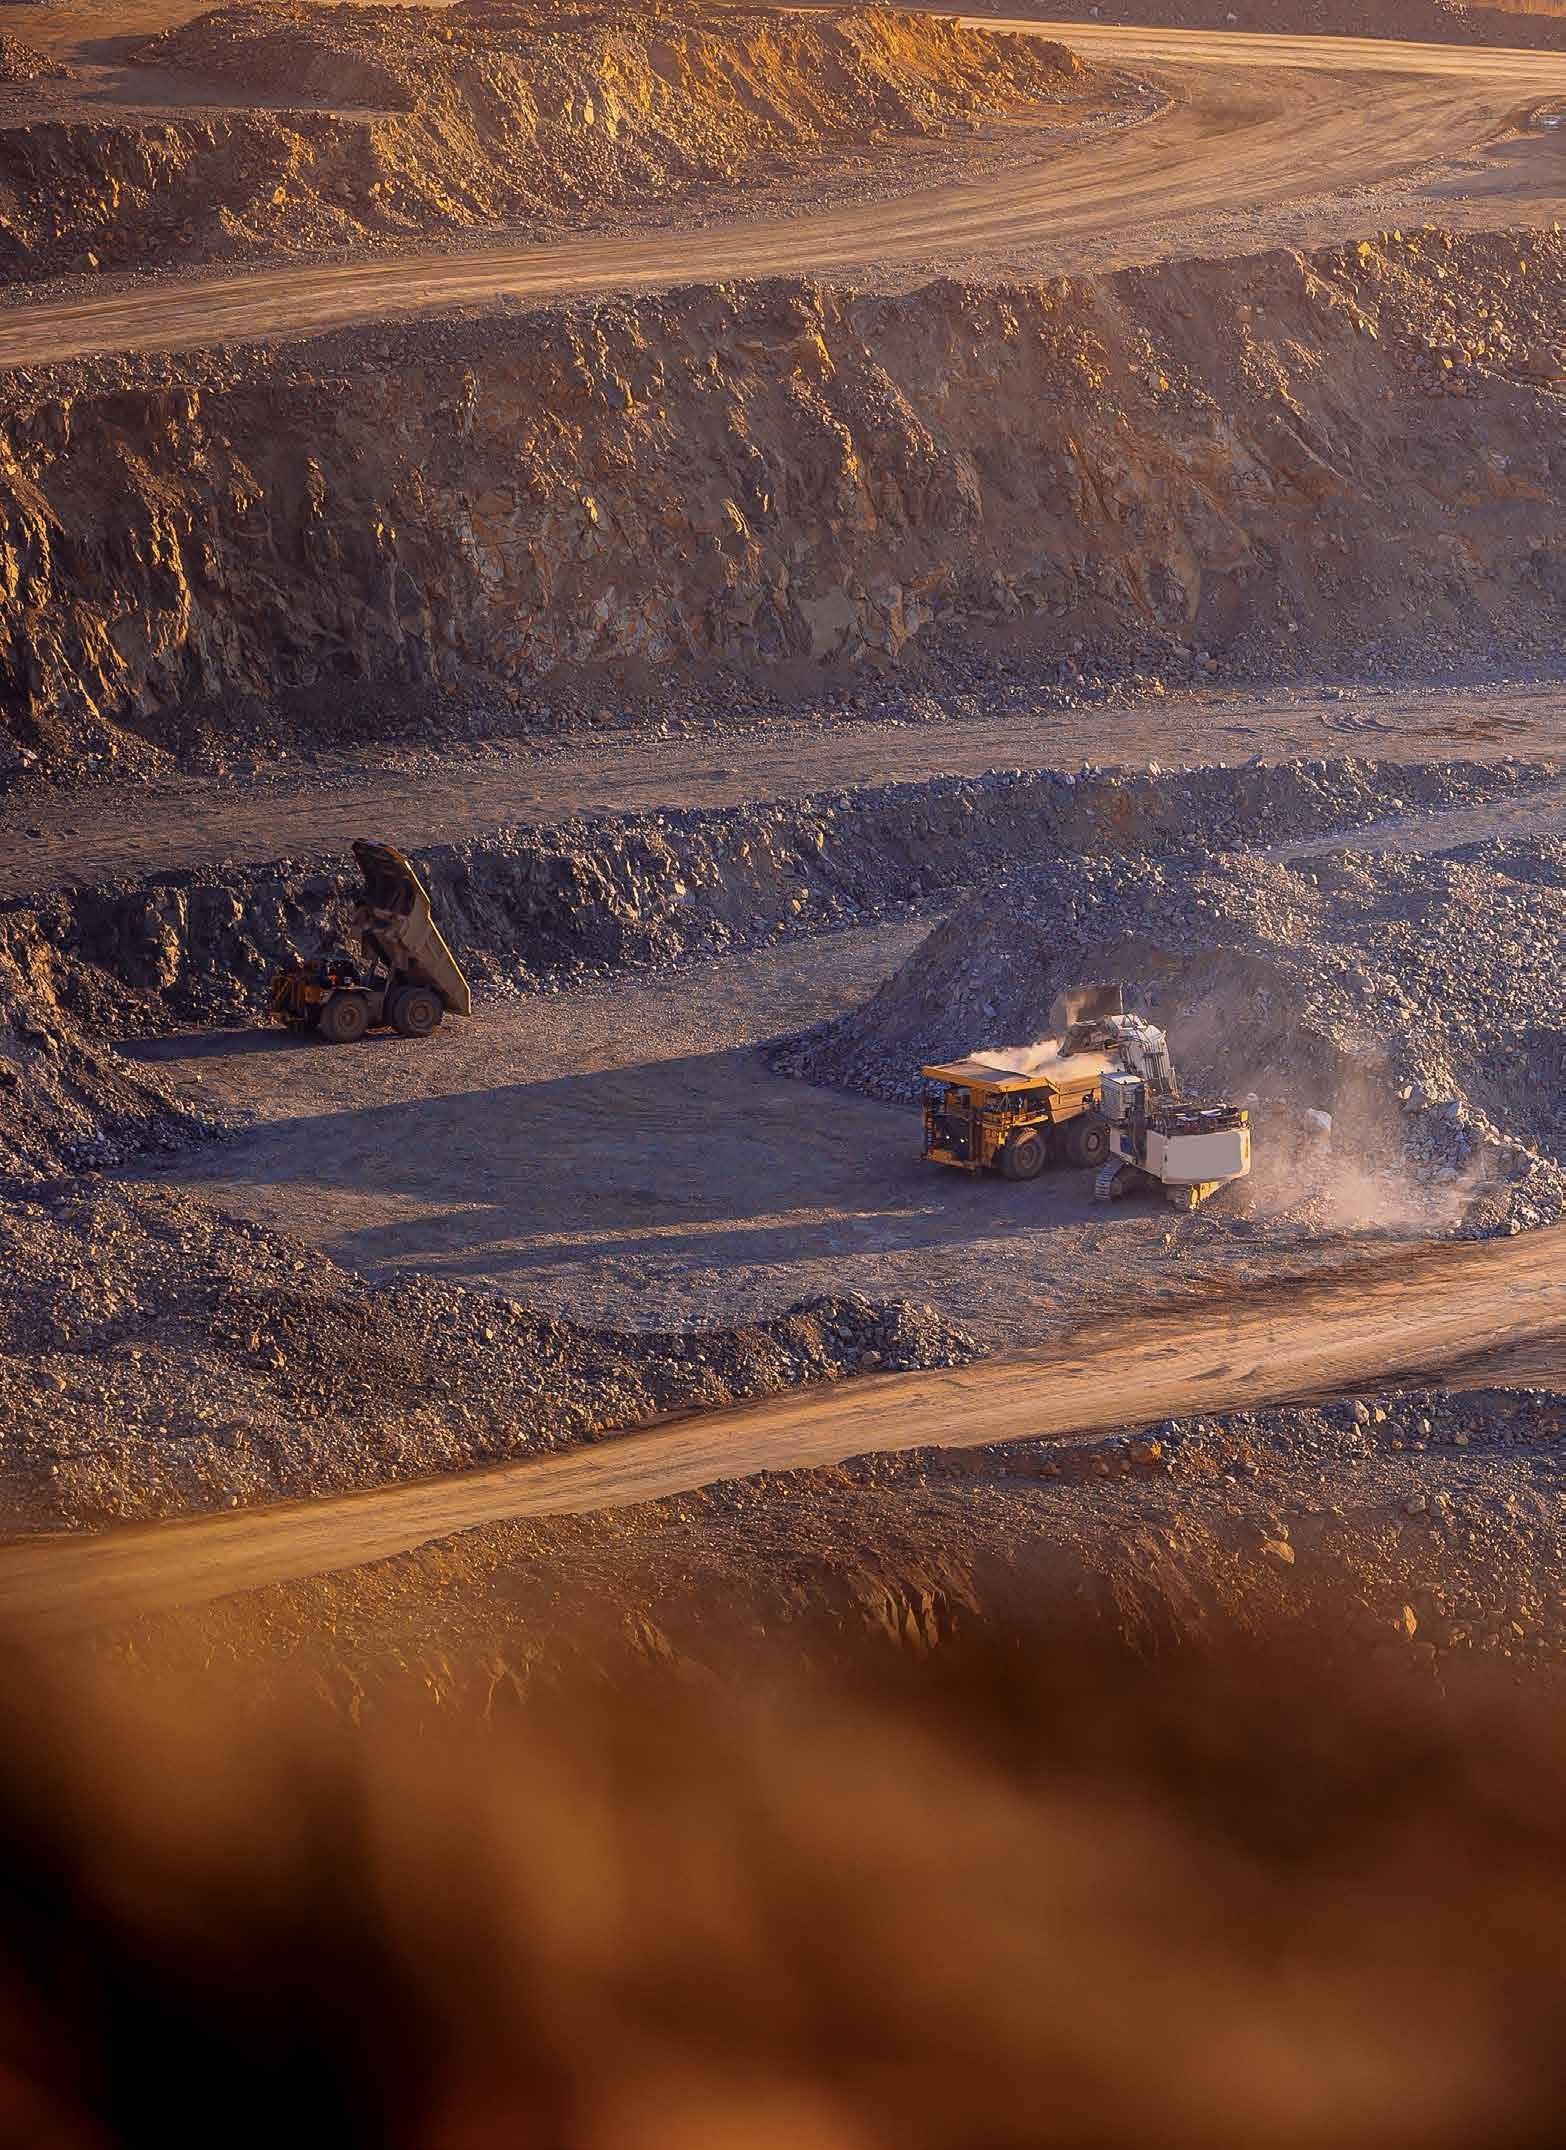
Mining region house prices have experienced extraordinary volatility over the past two decades, with some areas crashing more than 65 per cent from their peaks during the mining boom before staging remarkable recoveries.
The East Pilbara was the worst impacted with a 66.8 per cent fall from its 2012 peak of $718,000 to a 2017 trough of
just $238,000 – before climbing back to today’s $520,000.
This analysis examines nine major mining regions across Australia from 2005 to 2025, spanning the Pilbara iron ore heartland, coal mining centres in Queensland and New South Wales, gold producing areas in Western Australia, and emerging lithium regions.
NERIDA CONISBEE RAY WHITE GROUP CHIEF ECONOMIST
COMMODITY PRICE CYCLES
SOURCE: TRADING ECONOMICS
Mining region house prices have experienced extraordinary volatility over the past two decades, with some areas crashing more than 65 per cent from their peaks during the mining boom.
GOLD
COAL
LITHIUM IRON ORE
SOURCE: NEOVAL
The brutal correction
The period from 2012 to 2017 delivered brutal house price corrections across Australia’s mining regions, with an average crash of 31.5 per cent from boom peaks. Three regions suffered crashes exceeding 40 per cent, demonstrating the extreme vulnerability of resource-dependent housing markets.
The West Pilbara saw house prices plummet 55.1 per cent from their 2010 peak of $704,000 to a 2017 low of
$315,000. East Pilbara experienced the most severe correction, with prices collapsing from $718,000 in 2012 to $238,000 in 2017 – wiping out $480,000 in median house value.
The Queensland coal regions showed more resilience but still suffered significant corrections. Bowen Basin house prices fell 45.9 per cent from their 2012 peak, while Mount Isa dropped 35.6 per cent.
Hunter Valley exc Newcastle BridgetownBoyup Brook
Esperance
Goldfields
Mount Isa Surrounds
Bowen Basin - North Mount Isa
West Pilbara
East Pilbara
GOLD COAL LITHIUM IRON ORE
Divergent recovery paths
Since 2017, mining region recovery has diverged sharply. Hunter Valley house prices now sit at record levels of $770,000, with the region’s proximity to Sydney, wine tourism industry, and appeal as a lifestyle destination for tree-changers likely driving prices more than coal demand. Bowen Basin, Goldfields, Esperance, and Mount Isa Surrounds have all achieved new price records, with regions like Esperance also benefitting from coastal lifestyle migration and tourism growth alongside their traditional mining base.
However, iron ore regions remain scarred. West Pilbara has recovered to 92.4 per cent of its previous peak but remains $54,000 below its 2010 high. East Pilbara sits 28 per cent below its 2012 peak despite strong recovery momentum.
Bridgetown-Boyup Brook, representing Australia’s emerging lithium regions, experienced only a modest 5.2 per cent correction during the broader mining downturn. The region now shows record prices of $592,000 as electric vehicle demand drives the lithium boom.
This represents a 270.3 per cent increase from 2005 levels, showcasing the wealth generation potential of new commodity cycles. However, current lithium price volatility suggests these regions may face their own boom-bust reckoning.
Why mining towns swing so hard
Mining regions demonstrate exceptional price volatility, with an average total range of 182.3 per cent since 2005. Some regions like East Pilbara and Bridgetown experienced volatility exceeding 270 per cent, while areas with more diversified economies like Hunter Valley showed greater price stability.
This extreme volatility reflects the concentrated economic base of mining communities, where single commodity cycles determine regional prosperity. During boom periods, construction costs soar and supply shortages amplify price gains. During busts, population outflows and oversupply create lasting downward pressure that can persist for years. Regions with broader economic foundations - including tourism, agriculture, and proximity to major cities - tend to experience more moderate price swings as alternative income sources provide stability during mining downturns.
What comes next?
Today’s mining regions sit at an interesting juncture. Traditional commodity areas have largely recovered but remain sensitive to Chinese economic conditions. Meanwhile, new cycles in lithium and green metals create fresh boom conditions in previously overlooked regions.
The historical pattern suggests regions currently at record prices should prepare for eventual corrections, while those still recovering may prove more resilient having already worked through previous boombust cycles. Understanding these cycles remains crucial for navigating the extreme volatility that defines resource-dependent housing markets.
“Big Things”: Are these quirky icons driving regional property markets?
Donnybrook, regional WA
BIG BOXING CROCODILE
Humpty Doo, Darwin, NT
BIG
Glenrowan, regional VIC
BIG CASSOWARY
Mission Beach, regional QLD
BIG MANGO Bowen, regional QLD
BIG PINEAPPLE
Woombye, regional QLD
BIG PRAWN
West Ballina, regional NSW
BIG BANANA
Coffs Harbour, regional NSW $589K
BIG MERINO
Goulburn, regional NSW
Where Big Things
work - and where they don’t
From the iconic Big Banana in Coffs Harbour to the towering Big Lobster in Kingston, Australia’s landscape is dotted with more than 150 oversized attractions that have captured the nation’s imagination for over six decades. These whimsical roadside giants, born from grassroots community initiatives in the 1960s, have evolved from simple tourist magnets into significant economic drivers for regional Australia.
But beyond their obvious role as Instagram-worthy pit stops and tourism drawcards, could Australia’s Big Things be influencing something far more substantial: the property markets of the towns they call home?
The phenomenon began in 1964 with Coffs Harbour’s Big Banana, erected to celebrate the region’s banana-growing industry. What started as a clever marketing ploy quickly sparked a national trend, with communities across the country erecting their own oversized tributes to local industries, produce, and wildlife. Today, these structures serve multiple economic functions that extend far beyond their initial tourism appeal, acting as powerful branding tools that help regional towns establish distinct identities in an increasingly competitive landscape.
However, new analysis of property performance in Big Thing towns reveals a more complex relationship between quirky attractions and real estate values than their tourism success might suggest. The data shows a clear coastal advantage among Big Thing locations. Woombye,
home to the Big Pineapple on Queensland’s Sunshine Coast, commands a median house price of $988,000, a remarkable 31.5 per cent above the broader regional Queensland market. Similarly, West Ballina’s Big Prawn sits in a market valued at $882,000, nearly 10 per cent above regional New South Wales averages. Even the established Big Banana market in Coffs Harbour holds steady at regional parity with an $800,000 median.
This coastal clustering reveals a fundamental truth: natural amenities and accessibility appear to matter more than novelty attractions when it comes to sustained property value growth. These seaside Big Thing towns benefit from lifestyle appeal, proximity to growth centres, and established tourism infrastructure that extends far beyond their oversized monuments.
The contrast with inland locations is stark. Bowen’s Big Mango, despite the town’s status as a significant agricultural centre, sits in a property market valued at just $480,000, 36 per cent below the regional Queensland average. Mission Beach’s Big Cassowary faces similar challenges at $550,000 despite its coastal location, trailing regional markets by 27 per cent. These gaps suggest that geographic isolation and limited economic diversity can’t be overcome by tourism attractions alone.
Intriguingly, some heritage-focused Big Things in wine and tourism regions buck the trend. Rutherglen’s Big Wine Bottle shows exceptional 15.7 per cent
This coastal clustering reveals a fundamental truth: natural amenities and accessibility appear to matter more than novelty attractions when it comes to sustained property value growth.
annual growth and 166 per cent growth over the decade, likely driven by the Murray Valley’s evolution into a premium wine tourism destination. This success illustrates how Big Things can amplify existing economic strengths rather than create them from scratch.
Tasmania presents an interesting case study where both Big Thing locations, Penguin and Latrobe, outperform their regional market. The Big Penguin town commands $615,000 (12 per cent above regional Tasmania), while Latrobe’s Big Platypus sits marginally above regional averages. This suggests the island state’s broader property performance has lifted all markets, regardless of roadside attractions.
The data also highlights the limitations of Big Things in economically stagnant areas. Goulburn’s Big Merino, celebrating the traditional wool industry, sits 21.8 per cent below regional New South Wales averages at $629,000. Similarly, Humpty Doo’s Big Boxing Crocodile, despite proximity to Darwin, shows minimal 10- year growth of just 8.3 per cent, well below the territory’s broader performance.
Western Australia’s Big Apple in Donnybrook provides another cautionary tale, sitting 13.7 per cent below regional Western Australia averages despite the state’s resource-driven property boom. This underperformance suggests that even in strong regional markets, isolated locations struggle to capitalise on broader economic momentum.
Big Things work best as tourism amplifiers in areas with strong fundamental advantages, coastal lifestyle appeal, wine tourism potential, or proximity to growth corridors.

Substance trumps size
The evidence suggests Big Things work best as tourism amplifiers in areas with strong fundamental advantages, coastal lifestyle appeal, wine tourism potential, or proximity to growth corridors. They appear incapable of single-handedly transforming property markets in isolated or economically-declining areas.
As Australia’s regional property markets continue their current growth
trajectory, these findings indicate that while Big Things remain important cultural icons and tourism drivers, their influence on real estate values depends heavily on location, accessibility, and broader economic fundamentals. In the complex world of property markets, it seems that substance ultimately trumps size, even when that size reaches truly monumental proportions.

Methodology
The Ray White Regional Report 2025 represents a comprehensive analysis of Australia’s regional property markets, drawing on multiple data sources and analytical approaches to provide authoritative insights into eight distinct market segments.
PRIMARY PROPERTY DATA
For regional property performance analysis across seven of our eight market segments, we sourced data from Neoval, using geometric mean house price as our primary statistical measure. The geometric mean was selected because it provides a more accurate representation of typical values in markets with significant price outliers. Unlike the arithmetic mean, which can be disproportionately influenced by extremely high-value transactions, the geometric mean calculates the central tendency by finding the nth root of the product of n values. This approach effectively mitigates the distorting effect of ultra-premium outlier sales while still capturing the underlying market dynamics.
For all analysis citing Tasmanian property data, we used median house price data from Cotality due to data availability issues from Neoval in Tasmania.
COMMODITY AND AGRICULTURAL DATA
Our wine region analysis drew on production data from Wine Australia’s National Vintage Report 2025, examining crush volumes, regional production statistics, and export performance data to establish the relationship between wine industry fundamentals and residential property performance.
Wheat belt property analysis incorporated wheat price data from the Department of Agriculture, Fisheries and Forestry, tracking national commodity pricing movements against regional house price trends from 2015 to 2025.
For cattle region analysis, we used the Eastern Young States Cattle Indicator from Meat & Livestock Australia as our primary commodity benchmark. This indicator was selected over alternatives because it
specifically tracks young cattle prices in the eastern states where the majority of Australia’s cattle operations are located.
Broader commodity price trends for mining region analysis were sourced from Trading Economics, covering iron ore, coal, gold, and lithium price movements over the analysis period.
HOLIDAY HOME MARKET IDENTIFICATION
Our holiday home market analysis used unoccupied dwelling rate data from the Australian Bureau of Statistics as a proxy for holiday home concentration. Areas with the highest unoccupied dwelling rates were identified as locations with significant holiday home activity, allowing us to examine the performance characteristics of these tourismdependent property markets.
GEOGRAPHIC SCOPE
Geographic analysis was conducted using Australian Bureau of Statistics regional classifications to ensure consistency with official boundaries while providing appropriate granularity for different market segments. SA2 (Statistical Area Level 2) regions represent communities that interact socially and economically, typically containing populations between 3,000 to 25,000. SA3 (Statistical Area Level 3) regions capture regional labour markets and service areas, generally containing populations between 30,000 to 130,000 people. SA4 (Statistical Area Level 4) regions represent the largest sub-state regional boundaries designed for labour market analysis and typically contain populations above 100,000 people. This hierarchical approach allowed us to identify local market variations while maintaining consistency with official regional planning and economic analysis frameworks.
1.
Top 50 regional sales over the last 12 months
NSW Byron Bay 8 Border St, Byron Bay
NSW Bangalow 165 Lismore Rd, Bangalow
VIC Flowerdale 0 Whittlesea Yea Rd, Flowerdale
QLD Noosa Heads 10 Noosa Pde, Noosa Heads
NSW Oakhampton 42 Kezia Rd, Oakhampton
QLD Noosa Heads 31 Witta Cir, Noosa Heads
QLD Noosa Heads 3 Allambi Rise, Noosa Heads
QLD Noosaville 92 Hilton Tce, Noosaville
NSW Byron Bay 14 Brownell Dr, Byron Bay
NSW Bangalow 84 Fowlers Lane, Bangalow
QLD Noosa Heads 17 Mossman Ct, Noosa Heads
NSW Bar Beach 14 Bar Bch, Bar Beach
QLD Sunshine Beach 38 Seaview Tce, Sunshine Beach
NSW Newrybar 225 Broken Head Rd, Newrybar
NSW Byron Bay 146 Lighthouse Rd, Byron Bay
NSW Bowral 2 Manor Rise, Bowral
VIC Torquay 21 Central Ave, Torquay
QLD Doonan 81 Panorama Dr, Doonan
QLD Noosa Heads 20 Key Ct, Noosa Heads
QLD Cooroy Mountain 430 Cooroy Mountain Rd, Cooroy Mountain
QLD Chevallum 25 Glenn Vista, Chevallum
QLD Noosa Heads 11 Allambi Rise, Noosa Heads
NSW Skinners Shoot 307 Skinners Shoot Rd, Skinners Shoot
NSW Byron Bay 18 Pacific Vista, Byron Bay
QLD Sunshine Beach 40 Seaview Tce, Sunshine Beach
SOURCE: RAY WHITE
$33,500,000
$27,500,000
$23,338,618
$22,500,000
$20,600,000
$17,600,000
$16,900,000
$16,500,000
$15,000,000
$15,000,000
$14,445,000
$13,750,000
$13,100,000
$12,869,290
$12,250,000
$11,500,000
$11,300,000
$11,200,000
$11,110,000
$11,000,000
$11,000,000
$11,000,000
$10,550,000
$10,550,000
$10,500,000
QLD Noosa Heads 23 Bayview Rd, Noosa Heads
NSW Avoca 868 Sheepwash Rd, Avoca
NSW Fingal Head 14 Queen St, Fingal Head
QLD Sunrise Beach 66 Tingira Cr, Sunrise Beach
NSW Brooklet 44 Rishworths Lane, Brooklet
NSW Byron Bay 20 Pacific Vista, Byron Bay
QLD Noosaville 45 Saltwater Ave, Noosaville
QLD Marcus Beach 51 Tristania Dr, Marcus Beach
QLD Sunshine Beach 38 Enterprise St, Sunshine Beach
QLD Sunshine Beach 30 Enterprise St, Sunshine Beach
QLD Noosa Heads 4 Kareela Ave, Noosa Heads
NSW Burradoo 15 Patchway Pl, Burradoo
QLD Noosa Heads 14 Key Ct, Noosa Heads
QLD Noosa Heads 20 Cooran Ct, Noosa Heads
NSW Byron Bay 17 Marvell St, Byron Bay
NSW Merewether 22 John Pde, Merewether
NSW Woodlands 75 Springhill Rd, Woodlands
NSW Byron Bay 4 Giaour St, Byron Bay
QLD Peregian Beach 90 Lake Vista, Peregian Beach
NSW Burradoo 16 Ranelagh Rd, Burradoo
NSW Orange 671 Ophir Rd, Orange
QLD Noosa Heads 15 Allambi Tce, Noosa Heads
NSW Uralba 528 Uralba Rd, Uralba
QLD Sunshine Beach 19 Crank St, Sunshine Beach
QLD Sunshine Beach 72 Tingira Cr, Sunrise Beach
$10,500,000
$10,200,000
$10,000,000
$9,800,000
$9,786,000
$9,700,000
$9,600,000
$9,300,000
$9,250,000
$9,250,000
$8,755,000
$8,700,000
$8,500,000
$8,500,000
$8,450,000
$8,330,000
$8,250,000
$8,250,000
$8,200,000
$8,150,000
$8,000,000
$8,000,000
$7,975,000
$7,800,000
$7,500,000
Top 10 fastest growing areas (SA3) per state
NSW Upper Hunter
NSW Tamworth - Gunnedah
NSW Upper Murray Exc. Albury
NSW Tumut - Tumbarumba
NSW Lachlan Valley
NSW Inverell - Tenterfield
SOURCE: NEOVAL
Campaspe
Shepparton
Wellington
Valley
Glenelg - Southern Grampians
Loddon - Elmore
VIC
VIC
VIC Moira
VIC
VIC Mildura
VIC Latrobe
VIC
VIC
Ray White Economics Team


NERIDA CONISBEE Chief Economist
VANESSA RADER Head of Research
JORDAN TORMEY Strategy Analyst
ATOM GO TIAN Senior Data Analyst
PAOLO SUMULONG Data Analyst
ANITA VENKATESH Content Strategy and Production Lead
KRISTEN PURCELL Senior Graphic Designer