FOR IMMEDIATE RELEASE
March 28, 2024
Contact: Bryan Wachter (775) 771-8969 | Bryan@RANNV.org
FOR IMMEDIATE RELEASE
March 28, 2024
Contact: Bryan Wachter (775) 771-8969 | Bryan@RANNV.org
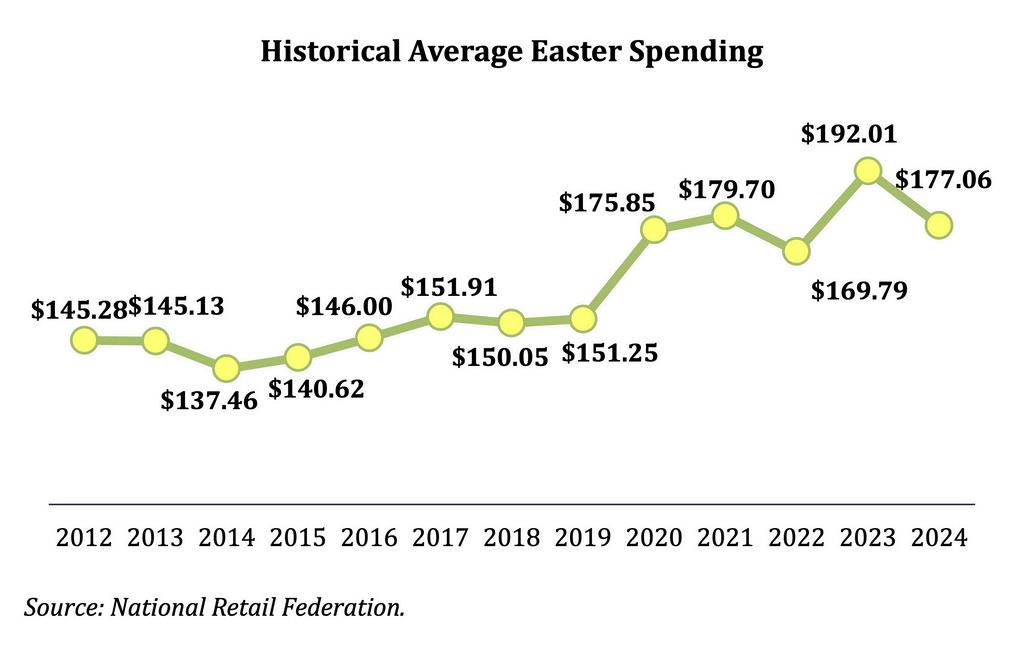
Nevadans are poisedtospend $365.0 million on Easter celebrations this year, the Retail AssociationofNevada (RAN) projects. The average per-person expenditure for holiday itemsisestimatedat$177.06, marking the third-highest spending level in the history of the surveyfollowing last year's $192.01 and 2021's $179.70, according to survey data fromthe NationalRetail Federation (NRF).
Spending on food willbe the largest category, with 89.0 percent of celebrants in Nevada spending$118.6 million. Following closely is clothing, with $57.9 million earmarked by49.0 percentofconsumers,while gifts accounted for $56.0 million among 62.0 percent of consumers.Nearly ninein 10 celebrants will spend $51.1 million on candy from the Easter Bunny. Furtherallocationsinclude$25.7 million for flowers (43.0 percent), $25.3 millionfor decorations (48.0 percent), and $16.4 million for greeting cards (45.0 percent).
Cookingaholidaymeal stands out as the most favored activity among popular Easter activities,with57.0percent of celebrants intending to spend time eating and drinking together. Visitingwithfamily or friends follows closely, with 53.0 percent of respondents planningto partakein social gatherings. Attending church services also holds significance, with43.0percent of respondents expressing their intention to participate in Easter services. About half ofcelebrants(51.0 percent) will participate in a traditional Easter egg hunt.
Consumers sought out diverse shopping destinations to fulfill their holiday shopping needs. The primary choice for 53.0 percent of shoppers was discount stores, with department stores following closely at 40.0 percent. Online shopping ranked third at 33.0 percent, while small businesses captured 22.0 percent of the market. Specialty stores and specialty clothing stores were favored by 20.0 percent and 10.0 percent of consumers, respectively, with catalogs being the least popular option at 2.0 percent.