Your Guide To The Latest Australian Real Estate Market Insights JUNE/JULY 2023
2 Harcourts MarketWatch

to Harcourts MarketWatch – your must-read property market brief to keep you abreast of movements that matter to help make informed decisions about life’s biggest asset.
To ensure you get the latest and highest quality information, we’ve teamed up with the highly sought after and experienced housing market analyst - Michael Matusik

Michael will be providing us with an analysis of the Australian housing market, and with that we’ll add our collective experience and ‘on the ground’ acumen to it, giving you the best of both worlds.
In this edition of Harcourts MarketWatch, we’re going to provide you an update on the current Australian housing market and what we think the future holds.
Before you get into your first edition, it would be remiss of me to not thank you. Thank you for your support of our business, and to those of you who helped us be recognised as having the most satisfied Buyers and Sellers of any real estate brand in Australia by Australia’s most trusted comparison service, Canstar Blue.
Happy reading and be sure to reach out to your local Harcourts team today if we can help you in any way with your real estate needs.
Despite the gloom and doom spruiked by many economists and market commentators - the housing market downturn has been milder than many anticipated.
The current annual fall in house values across our capital cities has been just 4.7%, and even less for attached dwellings (mostly apartments). Some locations have been doing better than others as shown below.
ProTrack. As at March Qtr. 2023. Annual change between March Qtrs. 2022 and 2022.
We do expect further falls in values but history, the current statistics and overall state of play, suggests that such falls are likely to be limited and short lived. Let’s start by looking at the past housing cycles. Our first chart below shows the past nine house price cycles across Australia.
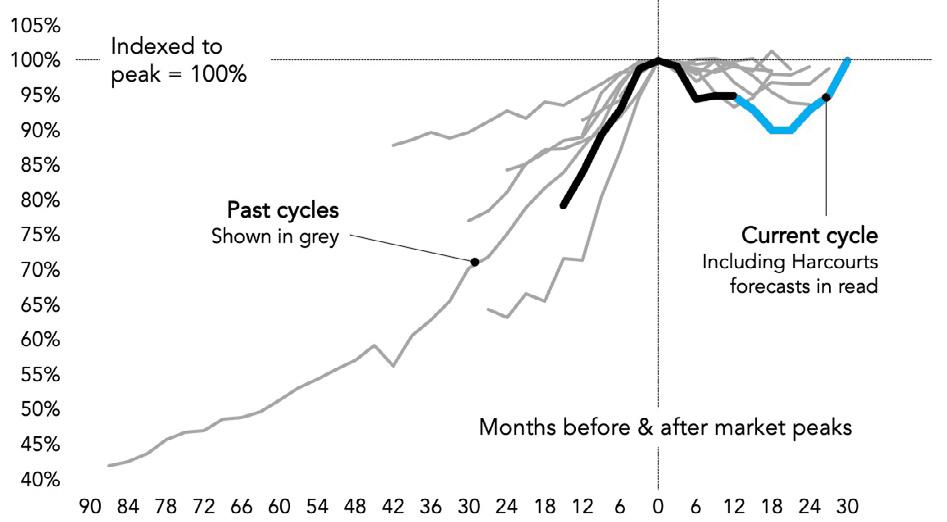
Including Harcourts forcast in cyan
REIA, Domain + Matusik estimates
Indexed to peak = 100%
The current housing cycle – shown in black and cyan on the chart – peaked early last year with a median Australian house sales price of just under $920,000.
The median house sales price rose by 21% over the 15 months leading up to the early 2022 market peak - and we will go out on a bit of a limb here - and say that we believe the median Australian house sales price will decline by 10% from the $915,000 peak - dropping to a median value somewhere around $840,000 in the second half of calendar 2023.
We then think that housing values should start to rise in early 2024, and the median Australian house sales price could over $900,000 by the second half of next year.
So, we believe that the Australian housing market will recover any losses, by the end of calendar 2024. If that happens, that will bring median house values back to where they were at the start of this current cycle, being in late 2020.
What actually happens depends a lot on inflation and interest rates. At Harcourts we think the evidence suggests:
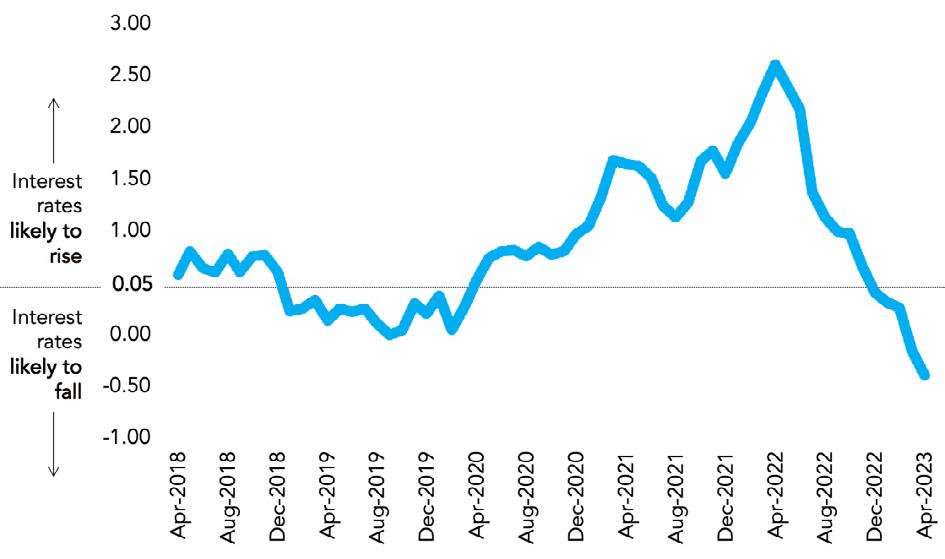
• Interest rates are likely to start to fall later this year which will increase borrowing capacity and mortgage demand. The chart below shows what Economists call the Yield Curve and is a very reliable indicator of future interest rate settings
• In concert with falls in the RBA cash rate, the Australian Prudential Regulatory Authority (APRA) is likely cutting its mortgage serviceability buffer from 3%, further increasing borrowing capacity and demand.
• The existing housing market’s supply lines will further tighten. Table 1 on the page adjacent shows that they remain very tight, and any rise in sales demand should see prices increase. Real estate after all is all about supply versus demand.
If there is under six months ‘supply’ of homes on the market, then typically, house prices are likely to rise. When that result is under three or four months, it means that any price increases are likely to be strong. On the flipside, when we see this move to between six and nine months supply, it usually means house prices will stabalise, and conversely, over nine months supply means that prices could fall.
When we talk about ‘supply’ and ‘how long it will take’, under the worse case scenario, this relates to the time to sell a home. This time does vary depending on different metrics - e.g. the mindset of the seller and their time frame; the method of sale; marketing budget allocated and of course the appointed real estate agency and agent.
Given these variables are impossible to implement across a wide area, statistically our figures are worked out using annual sales versus the number of homes advertised to sale in a given area. For example, if there are 1,000 house sales in a location, and 500 houses are currently for sale in that same location, then there is about six months supply.
• Current record immigration levels will increase housing demand, both to buy and rent. Australia’s population growth has bounced back big time after the Covid restrictions and the country’s annual increase is currently 420,000.
• The latest statistics from the Australian Bureau of Statistics suggest that Australia’s population is expected to increase by 487,000 new people per annum over the next decade and this is 25% higher than the annual increase (excluding the Covid period) within the previous ten years.
• New housing supplies are also tight, with the current Australia building market about 18% or 33,000 shy of the number of new homes needed to be built to house the current increase in annual population.

• Looking forward there will be a need to build between 220,000 and 230,000 new dwellings per year. Despite record low interest rates in the recent past the best Australia has been able to supply is 190,000 annual dwelling starts.
• Despite this growing need new housing construction will likely continue to fall, owing to builder collapses and ongoing materials and labour price increases.
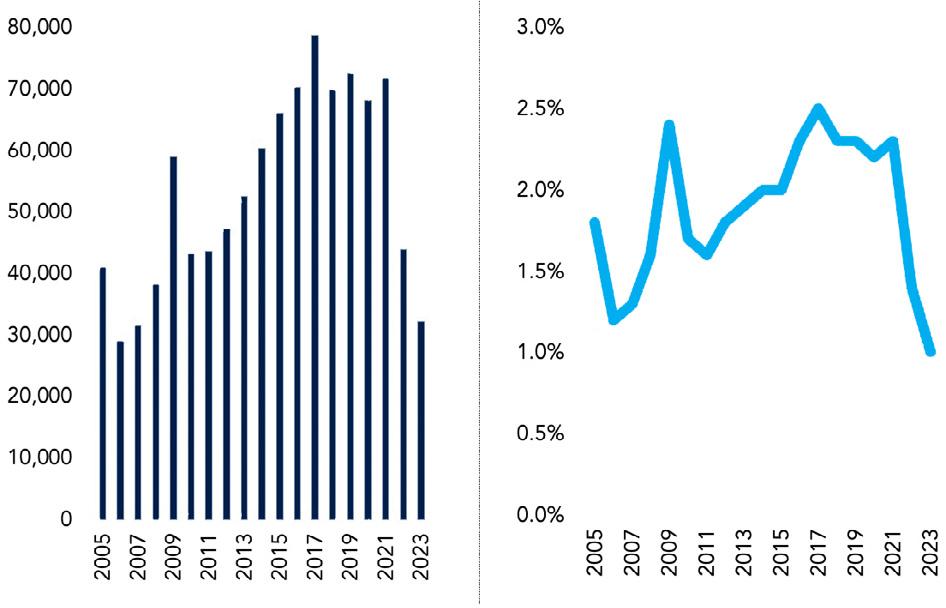
• There are currently just 35,000 vacant rental dwellings listed for long-term lease across Australia. This translates to a very tight vacancy rate of 1% - see the charts on the page adjacent.
• Increases in demand and limits to new dwelling supply should see the rental market tighten further, prompting those renters that can afford it, to purchase.
• Foreign buyer demand is also rising – with new figures from the National Australia Bank – suggesting that 4% of existing homes and 8% of new dwellings/land is currently being purchased by overseas buyers. Much of this demand is being led by China and India.
• Past peaks suggest that overseas buyer interest can rise as high as 10% for existing properties and over 25% for new dwellings. A return to such proportions are likely in coming years, as Australia attempts to attract more immigrants.
• To many overseas residents, Australia is a very attractive place to live. And rightly so!
Right now, while the overall housing market conditions have proven to be challenging, the second half of 2023 – to us at Harcourts - looks better than the first half, with interest rate rises over and confidence returning to the housing sector. What does this mean for you? Well, we think it’s a great time to buy, with values and rents likely to be higher in 2024 and beyond.
Our next Harcourts MarketWatch will look into population growth and outline where this growth is expected to take place, and what it means to the housing market. Keep an eye on your inbox for the next edition.
•
•
Disclaimer
• This report has been prepared by Harcourts with input from Matusik Property Insights Pty Ltd. This content has been prepared without considering the objectives, financial situation or needs of any particular individual. It does not constitute formal advice. For this reason, any individual should, before acting, consider the appropriateness of the information, having regard to the individual’s objectives, financial situation and needs; and if necessary, seek appropriate professional advice.
• Information herein includes material obtained from third parties, considered to be accurate.
• Whilst this information has been carefully compiled, no warranty or promise as to its correctness is made or intended. Interested parties should undertake independent inquiries and investigations to satisfy themselves that any details herein are true and correct.
• In addition, no forecasts are being made about potential capital gains or rental returns. Past information about capital gains or rental growth does not imply such gains or growth will be made in the future.
• Harcourts and Matusik Property Insights Pty Ltd disclaims all liability for any loss or damage suffered by any person of, or in connection with, the provision of information herewith, or the reliance thereon by any person.