

ENGINEERING
TECHNICAL PAPERS:
Machine-learning-based fatigue life prediction of metal components subjected to block loading
Evaluation of non-proportional multi-axial stress states in drive-train components related to contacts


Developed for Extreme Conditions
The IPE853 is the ideal data logger for tests under extreme conditions with various vehicles and test profiles, including extensive hot and cold climate test drives during which the complete vehicle as well as its components are being tested. Scan the QR code for further product information
Switchable CAN FD (SIC) / LIN inputs
Integrated GPS, 4G and WiFi
New USB-C & bluetooth interfaces
* Compared to IPElog2 Data Logger
Processing power increased by +50 %*
IPEmotion RT remote operation
Rugged and durable design

New Exciting Location!
The 2025 event will be held in Halls 4 & 5, providing a vibrant and dynamic environment with panoramic views of the racetrack.


Tuesday 29 April 2025
Silverstone Wing, Silverstone Race Circuit
Free Entry and Seminars
Complimentary Refreshments
Over 80 Exhibitors
Latest Technological
Developments:
The exhibition is an ideal opportunity for visitors to view and explore the latest advancements in instrumentation, analysis and testing technologies across various engineering sectors.
Networking Opportunities: The event provides a friendly and engaging atmosphere for networking with engineers and other professionals from automotive, aerospace, rail, power generation, off-highway, material handling, motorsport, medical and general research industries.


HONORARY EDITOR
Dr Spencer Jeffs
E-mail: s.p.jeffs@swansea.ac.uk
MANAGING EDITOR
Rochelle Stanley
Tel. +44 (0)7979 270998
E-mail: managingeditor@e-i-s.org.uk
MARKETING & EVENTS MANAGER
Sara Atkin
Engineering Integrity Society
6 Brickyard Lane, Farnsfield, Notts., NG22 8JS
Tel: +44 (0)1623 884225
E-mail: info@e-i-s.org.uk
WWW: www.e-i-s.org.uk
EDITORIAL POLICY
Engineering Integrity contains various items of information of interest to, or directly generated by, the Engineering Integrity Society. The items of information can be approximately subdivided into three general categories: technical papers, topical discussion pieces and news items. The items labelled in the journal as technical papers are peer reviewed by a minimum of two reviewers in the normal manner of academic journals, following a standard protocol. The items of information labelled as topical discussions and the news items have been reviewed by the journal editorial staff and found to conform to the legal and professional standards of the Engineering Integrity Society.
COPYRIGHT
Copyright of the technical papers included in this issue is held by the Engineering Integrity Society unless otherwise stated.
Photographic contributions for the front cover are welcomed.
ISSN 1365-4101/2024
The Engineering Integrity Society (EIS) Incorporated under the Companies Act 1985.
Registered No. 1959979
Registered Office: c/o Hollis & Co., 35 Wilkinson Street, Sheffield S10 2GB
Charity No: 327121
ADVERTISING RATES
& DATA
EngineeringIntegrity is published twice a year
Black and White
Full Page
Half Page
1 insert 2 Inserts
£280.50
£506 annual
£174 £313.50 annual
Quarter Page £102 £192.50 annual
Full Colour
Full Page
Half Page
1 insert 2 Inserts
£489.50
£305.80
£880 annual
£550 annual
Quarter Page £176 £319 annual
Full Page 297mm (depth) x 210mm (width) and 3mm bleed
Half Page 255mm (depth) x 86mm (width) or 125mm (depth) x 180mm (width)
Quarter Page 125mm (depth) x 86mm (width)
Space is limited so place your order soon to avoid disappointment.
A copy of the latest issue of EngineeringIntegrity is published on the website and includes all advertisements.
Loose Inserts £150 per A4 sheet (up to 160 gsm)
PRINCIPAL ACTIVITY OF THE ENGINEERING INTEGRITY SOCIETY
The principal activity of the Engineering Integrity Society is the arrangement of conferences, seminars, exhibitions and workshops to advance the education of persons working in the field of engineering. This is achieved by providing a forum for the interchange of ideas and information on engineering practice. The Society is particularly committed to promoting projects which support professional development and attract young people into the profession.
EngineeringIntegrity, the Journal of the Engineering Integrity Society is published twice a year.
EngineeringIntegrity is lodged with the Agency for the Legal Deposit Libraries on behalf of the Bodleian Library Oxford University, the Cambridge University Library, National Library of Scotland, National Library of Wales and Trinity College Dublin.

Editorial Dr Spencer Jeffs, Honorary Editor

Welcome to the Summer 2024 edition of the Engineering Integrity journal.
To begin, I wanted to say a huge thank you to all those who contributed to the Fatigue 2024 conference at Jesus College in Cambridge. Whether in organising the conference, preparing articles and presenting, exhibiting, reviewing or attending, it is you who made the conference such a success. It was wonderful to see such an excellent standard across the conference, as well as meeting new people and catching up with colleagues to discuss the state-of-the-art in fatigue. Upcoming EIS events in October include a seminar on maximum insights from data at MIRA Technology Institute and exhibiting at the Advanced Engineering Show, Birmingham. The 2025 Instrumentation, Analysis and Testing exhibition at Silverstone has been scheduled for 29 April, with this year’s show proving a triumph with over 70 exhibitors.
The UK has seen a change of government after 14 years of Conservatives at the helm, with the July general election results giving Labour a significant majority. Keir Starmer’s party have plenty of challenges to address including the cost of living, ongoing worker strikes, the NHS, house building and water infrastructure to name just a few. There is also the ongoing question around the funding and sustainability of universities in the UK, I do wonder what the breaking point will be if no action is taken. With A-level results now released, I hope students find a degree scheme and location that is right for them, with reports suggesting more UK students are attaining their first-choice university.
Analysis by Make UK, who represents manufacturers in the UK, has seen the UK manufacturing sector drop out of the top 10 manufacturing nations for the first time ever. The drop has been considered a result
of trends rather than a decline in UK industry itself. Although, it does emphasise the requirement for a longterm strategy to exploit the UK’s extensive capability, expertise and innovation. For example, there has been excellent industry news recently, including the MIRA technology park expansion, Jaguar Land Rover creating jobs to support its electrification programme and construction work to begin on the UK’s biggest electric car battery factory. Furthermore, the Farnborough International Airshow saw deals announced worth an estimated £13 million to the UK, according to ADS, the trade organisation representing the aerospace, defence, security and space industries in the UK.
On 19 July 2024, we saw a software update from CrowdStrike affect approximately 8.5 million Windows devices, leading to a global IT outage at an unheard scale. It led to the cancellation of over 5,000 flights, outages in banking and financial services, disrupted healthcare systems with hospitals cancelling appointments and surgeries, along with media and communications services being interrupted. While the error was quickly discovered and a fix released, this had to be done manually on all computers, meaning disruption continued for some time. The cost was estimated to be at least $10 billion, and no doubt litigation will be forthcoming to those who were affected. The incident certainly highlighted our reliance and the implicit trust we place in global software IT systems, and it could lead to “auto-updates” becoming a disabled feature for many.
Two technical papers are found in this issue: the first from the 2024 Peter Watson Prize winner Kris Hectors (Ghent University, Belgium), who gave an excellent presentation of the paper at Fatigue 2024, on the topic of machinelearning-based fatigue life prediction. The second paper, from Jonathan Schanner (Chemnitz University of Technology, Germany), investigates the influence of non-proportional multi-axial stress states in drive-train components. In addition, this issue presents the poster of the Fatigue 2024 poster competition winner Matthew Hulbert (University of Southampton, UK).
Finally, with the Olympic Games now closed in Paris, which I have thoroughly enjoyed, I am looking forward to the Paralympic Games starting at the end of August. And while the athletes themselves are incredible, the engineering, design, and technology behind the equipment used in both games is exceptional, from the custom bicycles and shoes to prosthetics and wearables.
Spencer Jeffs
A New Director of the EIS: Connor Bligh

It is with great pleasure that we announce Connor Bligh of Dewesoft as our newest Director. Connor's dedication and contributions to the EIS over the past few years have been outstanding and we are thrilled to welcome him into this leadership role. Connor's involvement within the EIS has included organising and presenting enlightening seminars and webinars as well as actively supporting our Young Engineers Forum. He brings with him a wealth of experience from past positions at JCB and Rail Ability.
“My involvement in the EIS has been one of the most rewarding aspects of my engineering career to date,” explained Connor. “To be able to promote the sharing of knowledge and best practices with like-minded engineers around the country is highly valuable, and to be involved with a society dedicated to this is an honour and a privilege."
We are excited about the fresh perspectives and energy that Connor brings to the team and we look forward to working closely with him in the years ahead. Call: +44 (0) 1264 316470
Diary of Events
SEMINAR | Maximising Insights from Data: Processing, Analysis and Beyond, MIRA Technology Institute, Nuneaton | 1 October 2024
EXHIBITION | Advanced Engineering Show, NEC, Birmingham | 30–31 October 2024
EXHIBITION | Instrumentation, Analysis and Testing Exhibition, Silverstone Wing, Silverstone Race Circuit | 29 April 2025
Discover The PressurEvolution
Introducing the EvoS cann® P16-D.
The most advanced miniature true-differential 16 channel digital pressure scanner available.
Ÿ 0.1% Full Scale Accuracy
Ÿ Data output directly in engineering units
Ÿ Lightweight - <45g (including 1m cable)
Ÿ Small - dimensions: 50 x 32.4 x 10mm
Ÿ True-differential measurement , shared static reference
Ÿ Lightweight carbon fibre external construction
Ÿ Integral microprocessor
Ÿ CAN-FD output
Get your competitive advantage now. Book a demonstration or request a quotation.


EvoScann® P16-D
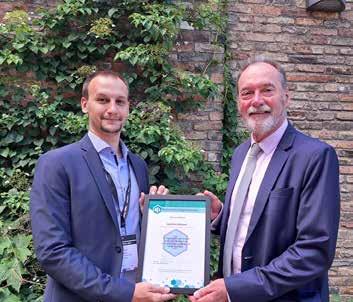
Kris Hectors Wins the Peter Watson Prize for Young Engineers in 2024
The Engineering Integrity Society continues to champion and celebrate the achievements of young engineers through the prestigious Peter Watson Prize. Named after the EIS founding president, Dr Peter Watson, this award aims to provide support to emerging talents in the field of engineering, specifically those at the beginning of their careers. The 2024 award, held during the Fatigue 2024 conference, showcased exceptional presentations and culminated in the recognition of Kris Hectors from Ghent University as the winner at the conference dinner held in the magnificent Hall at Jesus College in Cambridge.
This year we received over 30 abstract submissions for the prize as part of applications to present at the conference. Shortlisted candidates were invited to present their work as part of the conference programme with judges assessing their performance from both technical and presentation perspectives.
Kris’s victory followed his outstanding presentation on an innovative application of machine learning to the problem of fatigue life prediction of components under block loading spectra. His presentation was excellent, incorporating a good mix of mathematical modelling and experimentation, along with clear and professional delivery. The judges were highly impressed by the depth and significance of his research, highlighting the exceptional quality of his work in the field of engineering. The competition was intense, with Jonathan Schanner of Technical University of Chemnitz highly commended for his presentation titled " Evaluation of non-proportional
multi-axial stress states in drive-train components related to contacts." The judges faced a challenging task, as the standard of presentations covering a diverse range of topics was exceptional. John Yates, Chairman of the Society, remarked, " Once again, we have seen a high quality of abstracts submitted for the award and shortlisting to thirteen finalists was a difficult task. The final presentations were varied and interesting and all the candidates did exceptionally well. It was extremely difficult to decide the winner and the judges deliberated long and hard, which is a testament to the high standard of presentation from our finalists."
Papers from both winners are featured in this issue and can be found on pages 14 and 38.
Looking ahead, the Peter Watson Prize for 2025 will be held in October 2025 and submissions will be accepted from the start of the year. Presentations will not be restricted to the field of fatigue and all areas covered by the work of the EIS will be welcome. This could include, but is not limited to, simulation, testing, measurement, analysis, fatigue, durability and NVH. The EIS is committed to supporting and recognising the work of young engineers and encouraging the next generation of engineering talent reinforces the importance of innovation and excellence in the ever-evolving field of engineering.
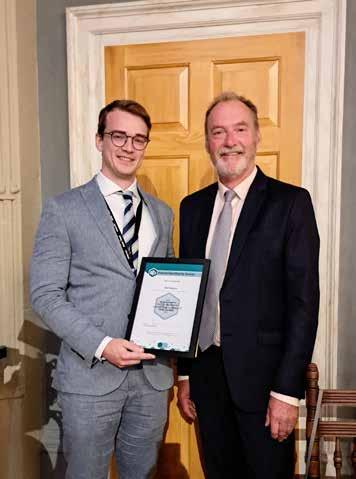
Winner Kris Hectors receives his award from John Yates, EIS Chairman.
Jonathan Schanner, highly commended in this year's competition.
News from British Standards


Lots of news so far in 2024 from BSI’s engineering design and product specification standards committees. To begin with, the TPR/1 – Technical Product Realization – area was very sorry to see the retirement of longstanding TPR/1/7 Subcommittee Chair, Professor Brian Griffiths. Brian had been chairing the BS 8887 committee for a long number of years.
The group is responsible for the BS 8887 series of standards on Design for Manufacture, Assembly, Disassembly and End-of-life processing (MADE). A committee meeting was held at the end of February to mark Brian’s retirement after 40 years of standards work; Brian first joined BSI committees back in 1984.
Brian’s replacement – Cormac O’Prey – has been confirmed as the new TPR/1/7 Chair. Cormac comes from an engineering and product design background and is particularly interested in the design of medical devices. Cormac also chairs a BSI standards group – TPR/1/7/5 – looking into the remanufacture (reprocessing) of medical devices work that feeds into the sustainability agenda for this important industry sector.
In terms of other national activities, a number of our remanufacturing committees have been actively meeting throughout 2024. TPR/1/7/4, the group of lighting remanufacturers who are developing a brand new part of the BS 8887 series – BS 8887-221 – were pleased to see the document move to its main public commenting stage (DPC – draft for public comment).
All draft standards are made available for public comment on the BSI’s Standards Development website (https:// standardsdevelopment.bsigroup.com/). Users of the BS 8887 series – and anyone else with an interest in standards – can review drafts and submit comments, as appropriate. It is free to register to the Standards Development website which also offers a whole lot more in the way of information about standards, committees and their work programmes as well as the public commenting portal.
TPR/1/7/4, under the leadership of Tom Ruddell from Egg Lighting, will be meeting towards the end of July to review any public comments received and to update the draft accordingly. Once an agreement has been reached on any changes to the document, it will be prepared for publication – which is eagerly awaited by the lighting industry. Tom was recently awarded BSI’s Young Professionals Award for 2024 at the BSI Conference and Awards on 22 May – a great accolade and very well deserved for all of his work with this new committee.
In terms of other remanufacturing work, another Subgroup – TPR/1/7/3 – also has a new Chair. Dr Yan Wang of Brighton University has recently taken over this committee, previously chaired by Professor Brian Griffiths. This is the general remanufacturing group that brings together all of the different industry sectors currently active in standards remanufacturing activities: automotive, ICT, medical devices, lighting, office furniture, to name a few. The TPR/1/7/3 meeting on 11th of July was the first for a number of years and was a very enjoyable and interesting event.
With all of this ongoing work and activity, the TPR/1area committees are always looking for new committee members and experts to join its standards drafting groups, national committees, and international working groups. Further general information on taking part in BSI’s standards work can be found at : https://www.bsigroup.com/en-GB/about-bsi/uknational-standards-body/how-to-get-involved-withstandards/
If you would like more information on any of TPR/1’s projects or work programme – or if you would like to get involved in any way in the committee’s activities –please contact Sarah Kelly, Lead Standards Development Manager and Committee Manager for TPR/1, at BSI on sarah.kelly@bsigroup.com.


News from the Institution of Mechanical Engineers

Why factories need to tackle extreme heat sooner rather than later
The headlines write themselves. Our planet is warming three-times faster than it was before the 1980s. 2023 was the warmest year since records began, while the last decade has, year by year, provided the 10 warmest years in recorded history.
The climate emergency is affecting all of us. But it’s impacting manufacturers as much as any sector. “Manufacturers risk being prime casualties of climate change, as commodities, ports, infrastructure and factories fall victim to extreme weather disruption the world over,” says Gemma Thompson, senior consultant for strategy and growth at Proxima consultancy.
From hurricanes and typhoons closing plants that supply vital parts in the manufacturing process, to extreme weather preventing the manufacture of products themselves, our changing environment can have significant impacts.
Take one of the main innovations driving our economy. “Semiconductor manufacturing requires large quantities of water to keep machinery cool and wafer sheets free of debris,” says Anirudh Singh Munder, assistant manager for business intelligence firm The Smart Cube. “However, ongoing climate change issues pose a huge risk to the industry.”
Taiwan is the main hub for manufacturing computer chips, which end up in our computers, our phones and our cars. But the country has faced significant droughts since 2021, putting 90% of the world’s supply of semiconductors at risk.
Water scarcity is a pressing issue facing the manufacturing industry. Many processes are highly water-intensive, and regions experiencing prolonged droughts or water shortages are seeing a direct impact on production capabilities. Companies are being forced to invest in water-efficient technologies and alternative water sources, such as desalination or recycled water, to mitigate these risks – changes that can also result in broader shifts in the manufacturing process.
The opposite problem is at the heart of the shipping industry’s issues. Last year, the Panama Canal had to throttle traffic through it due to a historic drought at Gatún Lake.
“Restrictions on shipping through the Panama Canal have wide-ranging global impacts,” says Singh Munder. “For example, several ships had to take longer shipping routes, worsening delays at other ports and driving demand for trucking and rail services, increasing costs and greenhouse gas emissions.”
But it’s not just in the supply chain that the effects of climate change can be felt. Rising temperatures can affect everything from obtaining raw materials to manufacturing methods. Some processes that require air curing might need artificial cooling to work – any process that involves concrete has trouble setting properly
above 32ºC, for example. And inclement conditions can affect the running of factories to the point that they become unviable. Manufacturing activity in the United States has dropped more in smaller facilities than large ones, according to recent research. That’s because, the authors of the study believe, smaller facilities are less well-equipped to handle the changing temperatures inherent in climate change, and so have had to close to ensure the manufacturing process is done correctly and to maintain the safety of workers.
Research commissioned for the European Union suggests that worker productivity begins to drop at around 25ºC. A 2017 study found that a hot day in China, where temperatures reached 32ºC, cost a single factory more than $10,000 in lost production.
Plants employing fewer than 50 people were more likely to have to shut or slow down their output in response to rising temperatures, the researchers found over the four-decade-long study.
“It’s important to know that even in developed economies like the US, the effects of climate change are present and significant,” says Jacopo Ponticelli, associate professor of finance at the Kellogg School of Management at Northwestern University. “We need to understand that our economy is not immune to these effects.”
The impact is being felt in all areas of manufacturing, in all parts of the world – big and small, developed and developing. It’s therefore vital that manufacturers try and head off some of the most dangerous impacts proactively – not reactively.
“More and more, supply chain disruption of any form is highlighting the need for resilience,” says Gemma Thompson. That should take a number of forms. One is strengthening supply chains against climate-related risks. “This might look like enlarging inventories to account for shortages, or dual sourcing – obtaining the same product through two different geographical sources, in case of the disruption of one.”
Yet avoiding that risk can cause its own issues. “The trade-off, as with most cases, though, is cost,” says Thompson. “Both solutions increase production costs, but manufacturers must weigh this up against the cost – and risk – of doing nothing in an increasingly unpredictable climate.”
Chris Stokel-Walker
Product News
HBK launches ground-breaking remote probes-based power analyser
Hottinger Brüel & Kjær (HBK), a leader in innovative power analysis solutions, has launched Fusion Probes, a ground-breaking product set to redefine power measurement standards across multiple industries, with applications in industrial, automotive and aerospace.
Fusion Probes promise unmatched accuracy and worryfree power measurements in a wide range of applications, including simple electric component testing, dynamic automotive drive cycle testing and complex aerospace copper bird tests.
Representing the cutting edge in power analysis technology, they are designed to excel in diverse application areas and will redefine power measurements with several key advantages:
• Minimized EMC issues: By separating the Fusion Probes from the power analyser receiver card and mainframe, they can be positioned closer to the measurement point, reducing electromagnetic compatibility (EMC) interference significantly. The fibre-optical connection cables and the digital data transfer between probes and mainframe ensure fast and disturbance-free data transfer to the mainframe.
• Distributable and scalable: Fusion Probes can be integrated into distributed measurement systems, with modules situated close to the device under Test (DuT), enabling metres. This makes them ideal for large-scale measurements, as the channel count is scalable from 4 power channels to 68 power channels in a single power analyser mainframe.
• Safe and simple cabling: The position of the Fusion Probes close to the DuT enables to use ultra short high voltage cables, eliminating intrinsic and emitted noise as well as preventing reflections seen in long cables that can decrease measurement data quality. The fibre-optical connection back to the power analyser is another safety barrier between hazardous high voltages and the user.
This new family of fibre-optically isolated probes is available in 4 and 8 power channel packages, with a sample rate of 2 MS/s.
These power analyser packages offer an industryleading accuracy and can be expanded with other inputs for temperature, NVH, or various bus connections. They come with the Perception ePower software suite for setup, real-time power analysis and post-processing capabilities.
www.hbkworld.com
Apex Dynamics’ new MG and MGH gearboxes ideal for high loads and rack and pinion applications
Apex Dynamics has launched its new high-performance MG/MGK and MGH/MGHK series planetary gearboxes. Both ranges have been specifically designed for enhanced axial and radial loads, with easy installation and adjustment for rack and pinion applications.
The new gearboxes are ideally suited to CNC machine tools, robotics and heavy-duty automation applications, and have been optimized for rack and pinion applications. Both the high efficiency MG and MGH ranges come with optimised moment of inertia, long service life, best backlash of ≤ 3 arc per min and long-term persistence of low backlash, while the hypoid right-angle K-series offers identical input-output rotating direction.
www.apexdynauk.com
Ruby® Laser Software by Trotec
Ruby® Laser Software is a powerful laser software. As a universal software solution, Ruby® is compatible with almost all Trotec laser machines. This allows companies to efficiently manage their entire machine park and maximize production capacities. From small workshops to industrial production, Ruby® offers customised solutions for every requirement. Thanks to an intuitive user interface, Ruby® combines processing and design functions in one platform that offers laser users an ideal solution for their projects.
Ruby® software features a self-explanatory user interface that seamlessly integrates the entire process from editing to design. Users can effortlessly import files from a variety of programs and process them directly in the software, including formats such as pdf, cdr, ai and dxf. This universal program compatibility saves valuable work time by eliminating cumbersome steps and allows minor customisation directly in the software, which increases flexibility and reduces the need for multiple correction loops. With an improved work process, Ruby® ensures accurate processing without delays.
www.troteclaser.com
ABB creates world’s first medium-voltage, speed-controlled motor concept
• The new concept introduces complete speed control for an MV motor in a single energy-efficient package.
• High improvement potential as 10% of the world’s electricity is converted into motion by large motors.
• This solution will offer energy savings of up to 40 percent for pumps, compressors, fans and other applications across multiple industries.
ABB’s MV Titanium concept is the world’s first mediumvoltage (MV), speed controlled, industrial motor, in the 1-to-5-megawatt (MW) range that brings connectivity and control features in an easy to specify and install package. The all-in-one concept brings the benefits of energy efficiency to MV motor-driven processes, which today account for 10% of the world’s electricity.
In this pursuit, ABB has developed the MV Titanium concept to address the main perceived obstacles related to installing a drive with a large motor. These include not only the initial cost of a separate drive, but also its associated electrical house (e-house), transformers, switchgear and cabling that multiply the capital cost and increase the complexity of installation, especially on existing sites where space is at a premium. In addition to these savings, it will also provide OPEX savings due to the energy efficiency it will provide.
The MV Titanium motors are intended for use with pumps, compressors and fans as typical applications, where they could reduce energy consumption by up to 40 percent as well as enhancing productivity and minimising downtime. They will be used across a wide range of sectors including power and renewables, processing, mining, cement and water.
www.abb.com
Alleima unveils new compressor valve steel for more sustainable and energy-efficient refrigerators and freezers
Alleima is thrilled to announce its latest compressor valve steel Freeflex® Versa, a successor of the awardwinning Freeflex® Core. The new material contributes to designing smaller, more sustainable and more energyefficient compressors for refrigerators and freezers. It is pioneering compressor valve steel with exceptional fatigue resistance, residual stresses and wear resistance.
During past decades, Alleima, a global manufacturer of high value-added products in advanced stainless steels and special alloys, has pioneered advancements in compressor valve steels to meet the latest energy efficiency standards in HVACR (heating, ventilation, air conditioning and refrigeration) applications. Freeflex® Versa represents substantial progress in compressor valve steel technology. Building upon the success of its predecessor Hiflex™ and Freeflex® Core, this martensitic stainless steel is engineered with a focus on catering
to the unique requirements of reciprocating and linear technologies. Notable features of Freeflex® Versa include exceptional fatigue resistance, outstanding wear resistance, and the ability to contribute to noise reduction and downsizing.
www.alleima.com
Engineers torque technology to medics
Medical experts and sports scientists are becoming increasingly reliant on engineers as their disciplines become more and more technical. Sensor Technology helps to provide solutions to complex but critical problems using an out-of-the-box technology.
One research programme used a Sensor Technology TorqSense industrial sensor to analyse the performance of implanted replacement knee joints. To do this, Sensor Technology helped develop a rig centred on a 100Nm TorqSense transducer with an extended through-shaft supporting crank arms on both ends. Data collected from the TorqSense during a test sequence builds up a profile of the knee's performance. TorqSense is based on a full fourelement strain gauge bridge design, and the transducers have the ability to accurately measure and record sudden spikes in torque load. This ability is becoming increasingly important in automated machinery, integrated systems, test rigs and continuously monitored plants.

TorqSense measures the torque 4000 times per second and uses high performance signal conditioning to provide a corruption-free, high-bandwidth torque-monitoring solution. This is further enhanced by 250% overrange and 400% overload capabilities, the elimination of side and end load errors and real-time temperature compensation.
Most medical pumps are driven by stepper motors, which can be tested by driving them against a DC motor acting as a brake. In one programme a TorqSense was mounted between the two motors to record the instantaneous shaft torque during test sequences. This data was then analysed and a model of the motor’s characteristics built up. In a more conventional engineering environment, TorqSense is helping ensure the reliability of powered wheelchairs, having been incorporated into a dynamometer rolling road built by PG Drives in Dorset.
www.sensors.co.uk
Contributions to Product News may be emailed to managingeditor@e-i-s.org.uk. The nominal limit for entry is 250 words.
Kris Hectors was the winner of the Peter Watson Prize, held in June 2024.
Technical Paper:
Machine-learning-based fatigue life prediction of metal components subjected to block loading
Kris Hectors, Quinten Bouckaert, Jelle Plets and Wim De Waele
Department of EMSME, Laboratory Soete, Faculty of Engineering and Architecture, Ghent University, Technologiepark 46, BE-9052, Zwijnaarde, Belgium
Author correspondence: Kris.Hectors@UGent.be
Accurate lifetime prediction of metal components subjected to cyclic loading remains challenging. Many analytical, (non)linear fatigue damage accumulation models have been developed since the Palmgren–Miner rule was first presented. Analytical models are often strongly biased towards particular datasets and limited by simplifications and assumptions. Machine learning, however, offers a promising solution by learning relationships directly from the data without human bias. In this work, 13 different machine learning models are trained for fatigue life prediction of metal components subjected to block loading. The number of high-quality datasets in literature was rather limited, hence nearly 160 fatigue experiments were performed to improve the training set. A comparison study is performed to determine the best-performing machine learning model. Finally, the best performing models are compared to Miner’s rule. The results show that the machine learning models consistently outperform Miner’s rule.
Keywords : Metal fatigue, Machine learning, Damage accumulation, Life prediction.
INTRODUCTION
Fatigue damage is one of the most common reasons for the engineering failures of metal components and structures across many industries. For over a century, researchers have been developing fatigue damage accumulation models based on empirical observations or on theories derived thereof. Such models aim to estimate the fatigue life of a component subjected to variable amplitude cyclic loading. The linear damage accumulation rule (LDR) developed by Palmgren and Miner [1] is the most widely used model. Due to its inherent linearity, fatigue life estimations obtained with the LDR can be extremely conservative, or even non-conservative up to a factor 10 [2]. Many nonlinear damage models have been developed [3], yet none have been universally accepted. They only account for a limited number of phenomenological factors, which limits their effectiveness to specific materials and loading conditions [4],[5].
Data-driven models can describe highly nonlinear relationships, which has made them popular for the prediction of fatigue strength and other mechanical properties. Gautham et al. [6] were the first to investigate data-driven methods to predict fatigue strength. They used a database comprising 450 constant amplitude fatigue experiments of 20 different steels. Their model predicted the experimental fatigue strength within
a 10% error band. Agrawal et al. [7] recognized the potential of this approach and decided to explore it further. They investigated the use of feature selection in combination with regression methods such as polynomial regression, K-Nearest Neighbors (KNN), neural networks and decision trees. They achieved R2 values higher than 0.95 when predicting fatigue strength with support vector machines (SVM) and variations of decision trees. Agrawal et al. [8] continued to build on their previous research by comparing 40 supervised machine learning models to each other. They employed advanced ensemble modeling techniques to develop a high-performance model which forms the basis of an open-access online web-tool called the ‘Steel Fatigue Strength Predictor’. The work of Agrawal et al. has been a basis for multiple other research studies on data-driven prediction of material properties [9]–[11] and constant amplitude fatigue lives, e.g. [12]–[16]. For a more detailed overview of machine learning for materials science, the reader is referred to the review paper of Sparks et al. [17].
Data driven methods have proven to be powerful for modelling the fatigue strength and estimating fatigue life of various materials subjected to constant amplitude loading. However, research on the use of data-driven methods for fatigue life estimation of metals subjected to variable amplitude fatigue ([18]–[21]) is very limited. Most papers are limited to two-level block loading, the simplest form of variable amplitude loading and others (e.g. [20]) only consider a very small set of multi-level block loading experiments. One of the primary reasons is that the use of data-driven methods for fatigue life prediction is hindered considerably by the sparsity of experimental data in open literature. This was addressed in a previous work by the authors of this paper [22], where an open-access dataset of variable amplitude fatigue experiments was presented.
To train the selected models, a large database of experiments was collected from literature. This database was extended with the dataset obtained by the authors in [22]. To the best of the authors’ knowledge, the resulting block-loading fatigue database is the largest and most complete one to date. This database was used to train various machine learning models, which involves data preprocessing, model training, tuning, and finally performance evaluation. Finally, it is determined which of the considered machine learning models performs best for fatigue life prediction of components subjected to block-loading spectra.
MACHINE LEARNING MODELS
In the context of fatigue life predictions, the model should be capable of predicting numerical values. Therefore, a supervised machine learning (ML) model suitable for regression tasks is necessary. It was decided to limit the scope of this work to ‘popular’ ML models that are readily available as open-source Python routines. Most models that are considered in this work have been implemented in scikit-learn, a machine learning library for the Python programming language [23]. This study includes the following models: Ridge & Lasso Regression, Polynomial Regression, Gaussian Process Regression (GPR), Support Vector Regression (SVR), K-Nearest Neighbors (KNN), Random Forest (RF) & Extra Trees (ET), Gradient Boosting Regressor (GBR) and Symbolic Regression (SR). For an overview of these models reference is made to the scikitlearn documentation [23].
EXPERIMENT DATABASE
As mentioned in the introduction, within the context of variable amplitude fatigue life prediction using machine learning, only two-level block loading predictions are reported in literature as of today. The most influential features generally are the cycles to failure N1for the first stress level, the applied cycles in the first block n1, the cycles to failure N2 for the second stress level, and the stress amplitudes. The use of machine learning for multilevel block loading life prediction would be a significant jump in research. The main reason why this has not yet been done is the lack of a representative dataset.
The performance of machine learning models depends on both the quantity and quality of the training data.
A higher-quality training dataset requires a lower quantity of training data to achieve good results. A database is established based on data acquired from literature and experiments previously performed by the authors. It contains results of 969 block loading experiments in total, of which 833 two-level block loading and 136 multi-level (three or more level) block loadings. The database covers 26 different materials. Table 1 shows an overview of the datasets included in the database. Four block loading types are distinguished, High-Low (H-L), Low-High (L-H), multi-level (ML) and repeated two-level block loading. They are illustrated in Figure 1. In H-L loading, specimens are first subjected to stress amplitude Sa1 for n1 cycles and then subjected to a lower stress amplitude Sa2 for n exp cycles until failure. For multi-level loading, the specimens are first subjected to more than two different stress amplitudes before failure. In repeated two-level block loading experiments, an H-L or L-H sequence with a predefined number of cycles in each block is chosen. The chosen H-L or L-H sequence is then repeated until the specimen fails. Finally, there are also experiments with a fully random loading sequence. In this work, the choice was made to exclude stochastic loading sequences as the number of these experiments with respect to the size of the database is very limited. Nonetheless, for the sake of completeness, it is mentioned in Table 1 if one of the datasets does contain this type of data. Only experiment datasets where constant amplitude fatigue lives were reported could be used since this material data is required as input for the models. The database contains a variety of experiment types (rotating bending, axial fatigue, …); for detailed information the reader is referred to the references in Table 1 and the open-access material database [24] where all the experiments have been collected.
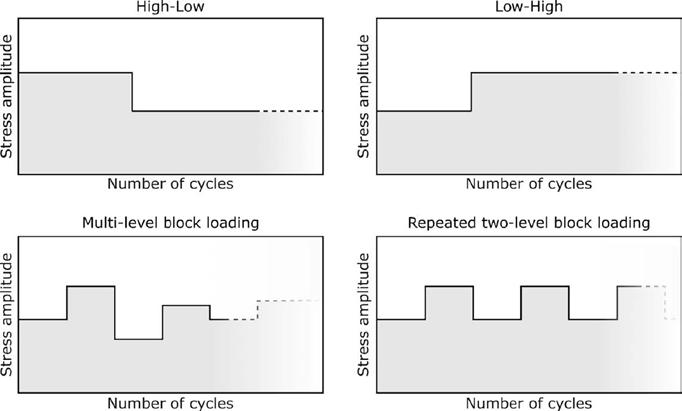
Figure 1: The different block loading sequence types in the experiment database.
Source Material(s) Loading Type
Rey et al. [25] SAE 4130 Alloy H-L, L-H, ML
Liu and Corten [27]
Spitzer and Corten [29]
Manson et al. [31]
Al2024-T4
Al7075-T6 Hard-drawn steel
Al7075-T6
AISI 4130
AISI E52100
AISI 304 ELC Al5456-H311
Manson et al. [33] 300CVM SAE 4130 (Soft) SAE4130 (Hard)
Manson and Halford [35]
Repeated two-level block loading
Al7075-T6
Repeated two-level block loading
Source Material(s) Loading Type
Dattoma et al. [26] 30NiCrMoV12 H-L, L-H, ML
Zhao and Jiang [28] Al7075-T651 H-L
Pereira [30] P355NL1 H-L, L-H
Colin and Fatemi [32]
H-L, L-H, twolevel alternating block loading
Ti-6Al-4V D.T.D. 683 H-L, L-H, ML
Palin-Luc (1996) GS61 spheroidal graphite castiron H-L, L-H
Shang and Yao [38] C45 16Mn hot-rolled 16Mn normalized H-L, L-H
Pavlou [40] Al2024-T42 H-L, L-H
Jin [42] Ti-6Al-4V H-L, L-H
AISI 304 ELC Al7075-T6 H-L, L-H, Random
Zhu et al. [34] 41Cr4 C45 ML
Aid et al. [36] Al6082-T6 H-L, L-H, ML, Random
Peng [37] 30CrMnSiA H-L, L-H
Zhu et al. [39] P355NL1 H-L, L-H
Gao et al. [41] C35 P355NL1 Q235B 41Cr4 H-L, L-H, ML
Hectors et al. [22] S275 H-L, L-H, ML
Table 1: Overview of block loading experiment datasets used to construct the experiment database that is used as training data for the machine learning models.
TWO-LEVEL BLOCK LOADING
Data preprocessing
Data quality significantly impacts model performance. Datapoints with missing values especially. Hence, all datapoints with missing values were removed from the database prior to model training. In addition, only high-cycle fatigue behavior is considered, therefore any datapoint with n1 or n2 values lower than 500 cycles was not considered. Finally, any features still containing NaN values are removed from the dataset. This results in a dataframe of 375 data points with each 15 features. These features are reported in Table 2.
To ensure that the training data is of high quality, outliers
are removed since they can adversely affect model performance. In this work, the outliers were filtered out based on the Z-score which measures exactly how many standard deviations above or below the mean a data point is. Data points with a Z-score greater than 3.0 (for features n1 and n2) are removed, i.e. all data points for which n1 or n2 deviate more than 3 times the standard deviation from the mean. The resulting dataset contains 354 data points. To build an effective model, it is crucial to select features with strong correlations to the target variable n2. The data correlation was investigated using Pearson’s correlation coefficient, which measures the linear association between features. Figure 2 presents the correlation matrix for two-level block loading data. The features N2, N1, and n1 have the highest positive correlation with the target variable n2. Notably, Sa2 exhibits the highest negative correlation.
Feature(s) Definition
E Young’s Modulus [GPa]
UTS
C, Mn, P, S, Si
Sai
ni
Ri
Ni
Ultimate tensile strength [MPa]
Weight percentages of C, Mn, P, S and Si
Stress amplitude in the ithloading block
Number of cycles in the ith loading block
Stress ratio in the ith loading block
Total number of cycles to failure at a constant amplitude stress Sai at the ith loading block
Table 2: Remaining features after pre-processing of the data obtained from the literature.
Further analysis was conducted using Spearman’s correlation. Here, input features, N2, C, and N1 showed the highest positive correlation, while Sa2, UTS , and Sa1 exhibited the highest negative correlation. The stress ratios and chemical composition features had only weak correlations with the target variable n2. To identify potential nonlinear dependencies, mutual information regression was performed. The analysis revealed that features such as N2, Sa2, N1, Sa1, and UTSshared the most mutual information with the target variable n2. On the other hand, the stress ratios showed minimal relation to the target variable, and n1 exhibited only a small amount of mutual information, contrary to physical expectations. Based on data correlation and recursive feature elimination, the most important features were determined to be: N1, Sa1, n1, N2, Sa2 and UTS
The results suggest that the stress ratios R1 and R2 have almost no dependency with the target variable. This can be attributed to the fact that most of the stress ratios in
the database have a value of -1, resulting in a very low level of variation in this feature. This uniformity leads to a biased correlation between the stress ratios and target variable, resulting in a weak or non-existent relationship between them. Furthermore, with the purpose to improve model’s performance, seven new features were engineered based on domain knowledge:
(1) n1 /N1 : The cycle ratio, calculated as the ratio of the applied number of cycles n1 to the number of cycles to failure N1 at stress amplitude Sa1. The cycle ratio is the fundamental basis of most analytical models (e.g. Miner's rule).
(2) Sa2/ Sa1 : The stress amplitude ratio indicates the type of loading transition. If this feature has a value smaller than 1, it means that the loading sequence is high-low. If this feature is greater than 1, it is a low-high loading sequence. The loading sequence has a significant impact on fatigue life.
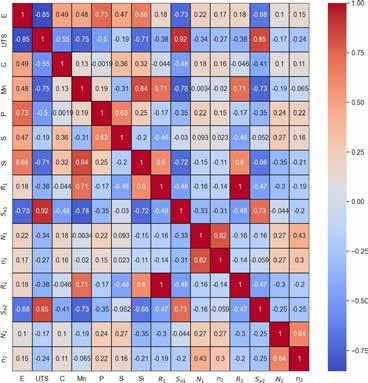
Figure 2: Pearson correlation matrix for two-level block loading data.
(3) E/UTS: The material's strength-to-stiffness ratio. It is a dimensionless number.
(4) Nlast: This feature corresponds to the number of cycles to failure for the stress amplitude of the last block of the loading history.
(5) n exp: This feature represents the remaining fatigue life for the last loading block reported in the experimental dataset.
(6) Dminer: This feature represents the theoretical initial damage according to Miner's rule, which is calculated as the sum of the cycle ratios before the last block, as shown in Equation (1). It represents the accumulated damage prior to the last loading block.
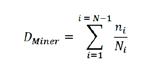
(7) DDCA: Initial damage based on damage curve approach (DCA) of Manson and Halford [35]. It takes the loading sequence effect into account and it only uses the applied cycles niand cycles to failure Ni. The initial damage DDCA is calculated with Equation (2) by excluding the last loading block.

The last four features have the benefit of being applicable to multi-level block loading predictions, which makes them very valuable to use for both two- and multi-level machine-learning-based predictions.
To ensure consistent scaling of the input features, standardization is applied to all dataframes in this work. Standardization scales the data by accounting for mean and standard deviation, facilitating the training process of machine learning models. In the end, six different preprocessed dataframes are created. These will be used for training and evaluating the machine learning models. Each dataframe contains 354 data points, but differs in the number of features included. Table 3 provides an overview of these six dataframes.
Model training & tuning
Model training and tuning is a critical step in the machine learning workflow where the model is fit to the training
Dataframe
set and hyperparameters are adjusted to achieve optimal performance and accuracy. Each of the models described in the previous section is evaluated for it capabilities of predicting fatigue life under block loading. In total 13 models are evaluated: Random Forest (RF), K-Nearest Neighbors (KNN), Support Vector Regression (SVR), Lasso and Ridge Regression, Polynomial Regression, Extra Trees (ET), AdaBoost, Gradient Boosting Regression (GBR), Extreme Gradient Boosting Regression (XGBR), Bayesian Ridge Regression, Gaussian Process Regression (GPR), Symbolic Regression (SR). Furthermore, a voting regression is employed to combine predictions from the top three models, improving generalization and robustness [8].
The hyperparameters of the considered models were tuned using a random search algorithm with 10-fold cross-validation. The algorithm explores a predefined search space in 90 iterations and identifies the top 5% combinations of hyperparameters with a 99% probability. Prior to training the models, the data from the dataframes is split into training and test sets using an 80%–20% split. This ensures that the models are trained on a sufficiently large dataset, while still having a good amount of data for testing and evaluation [8].
Since the test set only contains 20% of the total dataset, the optimal fit often requires fewer estimators. Nevertheless, the discrepancy between the best scores on the training and test sets were found to be small.
Model evaluation
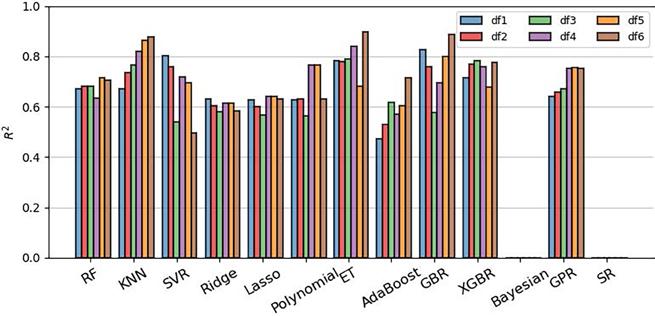
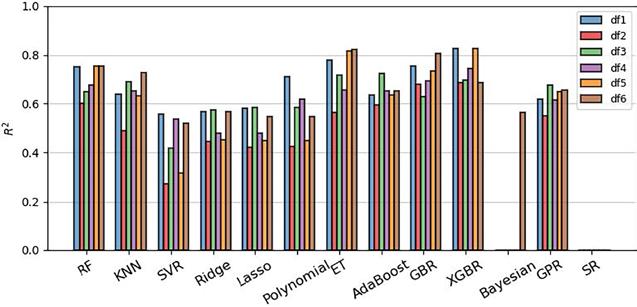
The R² and Mean Absolute Error (MAE) metrics are used to assess model performance. The MAE represents errors in the same unit as the target variable, while being less influenced by outliers than R2 . All the models studied in this work where trained on each of the datasets reported in Table 3. Figure 3 shows an overview of the model performances for the models trained on the different dataframes. Overall the ET, KNN and GBR exhibit the highest accuracy. The KNN model performs better for dataframes with engineered features. The KNN model is affected by the curse of dimensionality, i.e. high-dimensional data is detrimental to its performance. The general impression is that feature engineering improves the performance of the models. The linear-regression-based models (e.g., Ridge, Lasso, polynomial and Bayesian regression), the SVR and the SR model are the worst-performing models.
As mentioned in the introduction, Agrawal et al. [8] demonstrated that combining the best performing models using a voting regressor improves the prediction accuracy. Hence, for each dataframe, a voting regressor
Features
df1 C,Mn,P,S,Si,E,UTS,N1,Sa1,n1,N2,Sa2,R1,R2
df2 UTS,N1,Sa1,n1,N2,Sa2
df3 E/UTS,n1/N1,Sa2/Sa1,E,UTS,N1,Sa1,n1,N2,Sa2
df4 E/UTS,n1/N1,Sa2/Sa1,N2
df5 E/UTS,Sa2/Sa1,Dminer,Nlast
df6 E/UTS,Sa2/Sa1,DDCA,Nlast
Table 3: Overview of dataframes used as input for two-level block loading predictions.
(1)
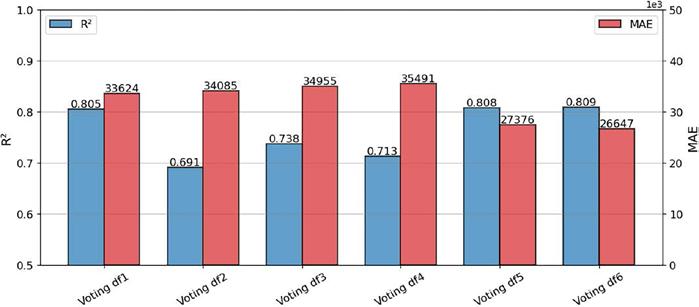
was constructed based on the three best-performing models. The performance of the voting regressor trained on the six different dataframes is presented in Figure 4. The performance of the voting regressors was found to be slightly better than the best-performing ‘conventional’ model. The voting regressors improve both the R² and MAE compared to the ET.
Considering both Figure 3 and Figure 4, it can be observed that the ‘conventional’ models and the voting regressors trained on dataframe 6 perform best. Dataframe 6 introduces the feature DDCA. This indicates that introducing some prior information on the effect of load interaction effects could lead to better prediction results. The fact that the models trained on dataframe 6 perform better than those trained on dataframe 5, with
feature Dminer, could be expected since the DCA generally outperforms Miner’s rule for two-level block loading [4],[22]. Figure 5 shows a plot of the predicted versus experimental values for each voting regressor trained on each dataframe for the two-level block loading dataset. It shows that the majority of the model predictions lie within a 50% error band around the mean.
MULTI-LEVEL BLOCK LOADING
Data preparation
Most data preparation steps are analogous to the steps for two-level block loading. In this case, in addition to the two-level block loading data, 136 multi-level block
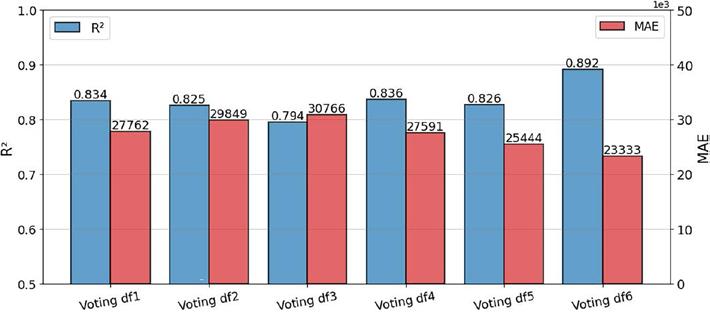
Figure 3: R² for all models trained on each dataframe for the two-level block loading dataset.
Figure 4: R² (blue, left vertical axis) and MAE (red, right vertical axis) for each voting regressor trained on each dataframe for the two-level block loading dataset.
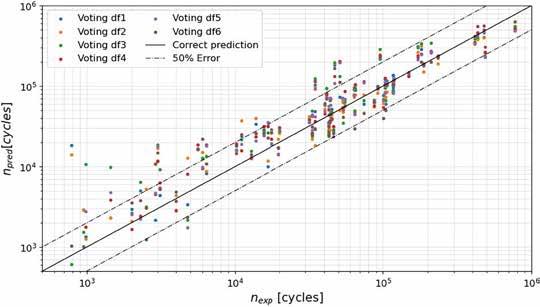
Figure 5: Predicted vs experimental values for each voting regressor trained on each dataframe for the two-level block loading dataset.
loading experiments are added to the dataset. The added data comprises 34 three-level, 11 four-level, 9 five-level, 2 eight-level block loading experiments and 80 two-level repeated block loading experiments. Dataframes are created that either contain up to threelevel block loading (e.g. df3 in Table 4) or up to five-level block loading (e.g. df6 in Table 4). These dataframes are reported in Table 4.
Dataframes 3 and 6 contain stress amplitude, applied number of cycles and cycles to failure data for each block. Zero-padding was applied to these dataframes. This is a data preprocessing technique commonly used to handle situations where some features may not be available for certain data points.
Model evaluation
Figure 6 shows the R² for the models trained each of the dataframes. It can be seen that ET, GBR and XGBR are the best-performing models. Similar to how it was discussed in the previous section, these three models were combined to build a voting regressor. However, in this case the voting regressor did not always outperform the conventional machine learning models. Out of all
models, SR and Bayesian linear regression perform the worst.
A voting regressor was constructed with the three best performing models for each dataframe. The performance of each voting regressor is visualized in Figure 7. Overall, the performance for the models trained on the dataframes with Dminer or DDCA is worse than for the ones with zero-padding. The models trained on the dataframe with Dminer exhibit the highest MAE. Figure 7 also shows that the performance of the models for multi-level block loading, trained on dataframes containing five-level block loading data, is better than that of those trained on dataframes containing only twoand three-level block loading experiments. This could be an indicator that the interaction effects observed in two-level block loading experiments do not contain sufficient information for the development of multi-level block loading models (both analytical and data-driven). Hence, strengthening the conclusions made in [22] that future experimental research should focus on multi-level block loading compared to two-level block loading. In addition, researchers should be encouraged to publish multi-level block loading experiment datasets in openaccess literature.
Dataframe Features
df1
df2
df3
df4
df5
df6
E/UTS,Sa2/Sa1,Dminer,Nlast
E/UTS,Sa2/Sa1,DDCA,Nlast
E/UTS,n1,N1,Sa1,n2,N2,Sa2,N3,Sa3
E/UTS,Sa2/Sa1,Dminer,Nlast
E/UTS,Sa2/Sa1,DDCA,Nlast
E/UTS,n1,N1,Sa1,n2,N2,Sa2,n3,N3,Sa3,n4,N4,Sa4,N5,Sa5
Table 4: Overview of dataframes used as input for multi-level block loading predictions.
Comparison of Figures 4 and 7 shows that the machine learning models perform better for the two-level block loading than for multi-level block loading. This is because the number of multi-level block loading experiments in the database is significantly smaller. In addition, the similarity between two-level block loading experiments and multi-level block loading experiments diminishes as the number of blocks increases and as such also the training value of the two-level block loading experiments.
CONCLUSIONS
This work presented the use of machine learning models for fatigue life prediction of metal components
subjected to block-loading. Tree-based models, such as Random Forest, Extra Trees, Gradient Boosting Regressor, and Extreme Gradient Boosting Regressor, emerged as the best-performing models. These were also combined in a voting regressor for both two-level and multi-level block loading predictions. In most cases the voting regressor outperformed the other models. Additionally, the feasibility of applying a two-level machine learning model for multi-level block loading predictions was explored. It was found that, despite the limited amount of data, the machine learning models successfully learned patterns that can be generalized to multi-level block loading predictions. The use of analytical models for introducing prior knowledge could be observed to have a positive influence, however this should be reevaluated as more experimental data becomes available.
Figure 6: R² for all models trained on each dataframe for the multi-level block loading dataset.
Figure 7: R² (blue, left vertical axis) and MAE (red, right vertical axis) for each voting regressor trained on each dataframe for the multi-level block loading dataset.
[1] Miner, M. A. JApplMech1945, Vol. 12, No. 3, pp.159–164.
[2] Schütz, W. EngFractMech1996, Vol. 54, No. 2, pp.263–300.
[3] Hectors, K. and De Waele, W. Metals(Basel)2021, Vol. 11, No. 2, pp.1–32.
[4] Hectors, K. and Van Hecke, T. and De Waele, W. FatigueFractEngMaterStruct 2022, Vol. 45, No. 11, pp.3319–3332.
[5] Fatemi, A. and Yang, L. IntJFatigue1998, Vol. 20, No. 1, pp.9–34.
[6] Gautham, B. P. and Kumar, R. and Bothra, S. and Mohapatra, G. and Kulkarni, N. and Padmanabhan, K. A. More Efficient ICME through Materials Informatics and Process Modeling. In 1st World CongressonIntegratedComputationalMaterials Engineering ; 2011.
[7] Agrawal, A. and Deshpande, P. D. and Cecen, A. and Basavarsu, G. P. and Choudhary, A. N. and Kalidindi, S. R. IntegrMaterManufInnov2014, Vol. 3, No. 8,.
[8] Agrawal, A. and Choudhary, A. IntJFatigue2018, Vol. 113, pp.389–400.
[9] Shiraiwa, T. and Miyazawa, Y. and Enoki, M. Mater Trans2019, Vol. 60, No. 2, pp.189–198.
[10] Xiong, J. and Zhang, T. Y. and Shi, S. Q. Sci China TechnolSci2020, Vol. 63, No. 7, pp.1247–1255.
[11] Bock, F. E. and Aydin, R. C. and Cyron, C. J. and Huber, N. and Kalidindi, S. R. and Klusemann, B. Front Mater2019, Vol. 6,.
[12] Ruiz, E. and Ferreño, D. and Cuartas, M. and Arroyo, B. and Carrascal, I. A. and Rivas, I. and GutiérrezSolana, F. IntJFatigue2022, Vol. 159,.
[13] He, L. and Wang, Z. L. and Akebono, H. and Sugeta, A. JMaterSciTechnol2021, Vol. 90, pp.9–19.
[14] Bao, H. and Wu, S. and Wu, Z. and Kang, G. and Peng, X. and Withers, P. J. EngFractMech2021, Vol. 242,.
[15] Chen, J. and Liu, Y. ExpertSystAppl2021, Vol. 168,.
[16] Gan, L. and Wu, H. and Zhong, Z. IntJFatigue2022, Vol. 158,.
[17] Sparks, T. D. and Kauwe, S. K. and Parry, M. E. and Tehrani, A. M. and Brgoch, J. Annu Rev Mater Res 2020, Vol. 50, pp.27–48.
[18] Gao, J. and Wang, C. and Xu, Z. and Wang, J. and Yan, S. and Wang, Z. IntJFatigue2022, Vol. 158,.
[19] Gan, L. and Zhao, X. and Wu, H. and Zhong, Z. Int J Fatigue2021, Vol. 148, No. October 2020, p.106190.
[20] Gan, L. and Wu, H. and Zhong, Z. IntJFatigue2022, Vol. 161,.
[21] Gan, L. and Wu, H. and Zhong, Z. IntJFatigue2022, Vol. 156,.
[22] Hectors, K. and Vanspeybrouck, D. and Plets, J. and Bouckaert, Q. and De Waele, W. Metals (Basel) 2023, Vol. 13, No. 3.
[23] Pedregosa, F. and Varoquaux, G. and Gramfort, A. and Michel, V. and Thirion, B. and Grisel, O. and Blondel, M. and Prettenhofer, P. and Weiss, R. and Dubourg, V. TheJournalofMachineLearningResearch2011, Vol. 12, pp.2825–2830.
[24] Hectors, K. and De Waele, W. Fatigue Block Loading Experiment Database. 2023.
[25] Rey, W. K. TechnicalNote4284:CumulativeFatigue Damage at Elevated Temperature ; Washington, 1958.
[26] Dattoma, V. and Giancane, S. and Nobile, R. and Panella, F. W. Int J Fatigue 2006, Vol. 28, No. 2, pp.89–95.
[27] Liu, H. W. and Corten, H. T. Technical Note D-256: FatigueDamageduringComplexStressHistories ; Washington, 1959.
[28] Zhao, T. and Jiang, Y. IntJFatigue 2008, Vol. 30, No. 5, pp.834–849.
[29] Spitzer, R. and Corten, H. T. T&AMReportNo.193: EffectofLoadingSequenceonCumulativeFatigue Damageof7075-T6AluminumAlloy ; 1961.
[30] Pereira, H. F. S. G. and De Jesus, A. M. P. and Ribeiro, A. S. and Fernandes, A. A. JPressVesselTechnol2009, Vol. 131, No. 2,.
[31] Manson, S. S. and Nachtigall, A. J. and Ensign, C. R. and Freche, J. C. SAETechnicalPapers1964.
[32] Colin, J. and Fatemi, A. FatigueFractEngMaterStruct 2010, Vol. 33, No. 4, pp.205–220.
[33] Manson, S. S. and Freche, J. C. and Ensign, C. R. Application of a Double Linear Damage Rule to Cumulative Fatigue Damage ; Washington, DC, 1967.
[34] Zhu, S. P. and Huang, H. Z. and Wang, Z. L. International JournalofDamageMechanics2011, Vol. 20, No. 6, pp.876–899.
[35] Manson, S. S. and Halford, G. R. IntJFract1981, Vol. 17, No. 2, pp.169–192.
[36] Aid, A. and Amrouche, A. and Bouiadjra, B. B. and Benguediab, M. and Mesmacque, G. Mater Des 2011, Vol. 32, No. 1, pp.183–191.
[37] Peng, Z. and Huang, H. Z. and Zhou, J. and Li, Y. F. Metals(Basel)2018, Vol. 8, No. 6,.
[38] Shang, D.-G. and Yao, W.-X. IntJFatigue1999, Vol. 21, No. 2, pp.187–194.
[39] Zhu, S. P. and Liao, D. and Liu, Q. and Correia, J. A. F. O. and De Jesus, A. M. P. IntJFatigue2019, Vol. 128, No. June, p.105185.
[40] Pavlou, D. G. Eng Struct 2002, Vol. 24, No. 11, pp.1363–1368.
[41] Gao, K. and Liu, G. and Tang, W. IntJFatigue 2021, Vol. 151,.
[42] Jin, O. and Lee, H. and Mall, S. JEngMaterTechnol 2003, Vol. 125, No. 3, pp.315–323.

Industry News
EngineeringUK tells new government "no time like the present" to solve STEM skills and workforce shortage
With engineering and technology predicted to grow faster than any other sector between now and 2030, it is imperative the new government works with industry to address barriers standing in the way of young people joining the workforce.
The skills shortage in engineering and technology is already limiting growth. A strategic approach to addressing the problem will support current projects and power large-scale developments such as Great British Energy. EngineeringUK, along with the National Engineering Policy Centre, is keen to see a National Engineering and Technology Workforce Strategy.
The Labour manifesto also pledged to tackle careers education, promising to recruit an extra thousand careers advisers, develop a broader curriculum, and address STEM teacher recruitment and retention. With severe and growing STEM teacher shortages – just over 1,600 vacancies compared to around 1,300 a year ago – EngineeringUK is urging the government to commit to investing in teacher professional development, which research shows is not just "nice to have" but can significantly prolong teaching careers.
www.engineeringuk.com
Schneider Electric tops TIME magazine's 2024 sustainable companies list
Schneider Electric, the leader in the digital transformation of energy management and automation, has topped the "World's Most Sustainable Companies for 2024" list by TIME magazine and Statista. This recognition reflects Schneider Electric's ambitious goals to reduce its own emissions, but also the company’s commitment to helping its customers to become more energy-efficient and reduce their emissions.
TIME and Statista used a transparent, multi-stage methodology to identify the world's most sustainable companies for 2024. The process began with a pool of over 5,000 of the world's largest and most influential companies. Following a rigorous four-stage assessment, the final ranking excluded unsustainable industries and considered factors like external sustainability ratings and commitments, corporate reporting practices, and environmental and social performance indicators. This comprehensive approach produced a ranking of 500 companies from over 30 countries.
Schneider Electric have also used their vision in the UK&I to create a best-in-class approach to training, unifying specialist academies, courses and digital campuses into a holistic offering – Schneider Electric Training. The move is in response to the chronic skills gap in engineering and
the vital role that training plays in addressing the growing complexities associated with digital transformation. Two academies are already up and running, with three more due to be launched by the end of the year.
www.se.com/uk www.time.com
Moog is committed to innovation and continuity in pump production
Moog Inc. announced that the production of radial piston pumps will continue at the Böblingen site after the closure of the Nuremberg plant at the end of 2026. As Moog announced in September 2023, the current production facility for radial piston pumps (RKP) in Nuremberg will be closed by the end of 2026. In this course the RKP value chain will be transferred to Moog's largest German site in Böblingen.
For customers, this step means continuity in product quality and availability. They can continue to rely on the proven range of new radial piston pumps, spare parts and comprehensive repairs and services.
This step is part of Moog’s strategy to simplify the business by consolidating global locations. The resulting synergy from bringing together the sales and service, engineering expertise and manufacturing operations at Böblingen will enable Moog to build up an even stronger competitive advantage in hydraulic products and more effectively meet the needs of the customers.
www.moog.com
UK drops out of top ten manufacturing nations for first time
Dr Graham Hoare OBE, Chief Executive Officer at the Manufacturing Technology Centre (MTC), reacts to the UK falling out of the top 10 manufacturing nations for the first time:
“This is a major body blow to UK manufacturing. We are home to some of the most innovative manufacturers and research facilities in the world. We must do everything possible to harness this expertise to reinvent ourselves as a manufacturing superpower.
"The government’s plans to change UK manufacturing’s fortunes through a new industrial strategy and key investments from the National Wealth Fund can’t come soon enough. But, as part of this, a major upskilling and reskilling programme will be critical. Without the right people with the right skills, we won't be able to hit productivity targets, even with the latest ideas, technology and funding in place.”
www.the-mtc.org
Lola Cars commits to GEN4 era of Formula E Lola Cars (Lola) has today announced that it will compete in the ABB FIA Formula E World Championship for the GEN4 era, which runs until 2030. The next-generation GEN4 technology will be introduced in season 13 (2026/2027), boasting significant advancements in energy efficiency, race performance and safety –the perfect opportunity for Lola to further develop sustainable e-mobility-related technology.
While the complete technical details for the GEN4 era of the ABB FIA Formula E World Championship are still under development, the cars will feature 600kW of power and 700kW regenerative braking – a significant increase on the GEN3 era figures of 350kW and 600kW respectively.
www.lola-cars.co.uk www.fiaformulae.com
Cambridge Vacuum Engineering shortlisted for national engineering award
Cambridge Vacuum Engineering (CVE) – a specialist in power beam welding technologies – has been shortlisted for a prestigious Engineering & Manufacturing Award for its ground-breaking Ebflow™ technology, which is fast emerging as a key enabler in the transition towards a net-zero future. This category recognises innovative manufacturing techniques that are having a tangible impact across the industry. CVE’s Ebflow™ technology, which is currently making waves across the energy sector and helping to speed up the construction of key infrastructure components such as wind turbines and small modular nuclear reactors, clearly impressed the judges with its capabilities.
Ebflow™ was recently used to fast-track the production of a monopile foundation for an offshore wind turbine for Dogger Bank, the world's largest offshore wind farm. The monopile transition piece, created using Ebflow™, was part of RapidWeld – a ground-breaking project funded by Innovate UK and led by a consortium including SSE Renewables, CVE, DNV, Sif Netherlands B.V, Agile NDT and The Welding Institute (TWI). The RapidWeld project team achieved welding speeds at least 25 times faster than the current default manufacturing method. Production required 90% less energy, costs 88% less and produced 97% less CO2 emissions.
www.camvaceng.com
Engineers Without Borders UK reveal the winners of the Engineering for People Design Challenge 2023/2024
Engineers Without Borders UK, part of an international movement putting global responsibility at the heart of engineering, has announced the UK and Ireland winners of the Engineering for People Design Challenge 2023/2024. The Engineering for People Design Challenge this year was organised jointly by Engineers Without Borders UK and South Africa, in conjunction with educators. The awards are open to first- and secondyear undergraduates as a mandatory part of their degree course and 1 in 4 engineering students in the UK currently participate.
The aim is to encourage budding engineers to broaden their awareness of the social, environmental and economic implications of their engineering solutions. Participants this year were asked to consider the engineering challenges arising in the rural village of Pu Ngaol, situated in the forested hills of Mondulkiri Province in eastern Cambodia.
Beating tough competition from 36 participating university teams, the winning entry was SIPS, a solarpowered water filtration system, from University College Dublin. The winners received the Grand Prize of a £2000 educational bursary. Second prize went to University College London for their innovative rice husk briquetting machine, which utilises waste by-products to provide less-polluting cooking fuel. Judges praised its potential to be adopted by other rice-growing populations around the world.
www.ewb-uk.org
Artificial blood vessels could improve heart bypass outcomes
3D-printed blood vessels, which closely mimic the properties of human veins, could transform the treatment of cardiovascular diseases. Strong, flexible, gel-like tubes – created using a novel 3D printing technology – could improve outcomes for heart bypass patients by replacing the human and synthetic veins currently used in surgery to re-route blood flow, experts say.
The development of synthetic vessels could help limit scarring, pain and infection risk associated with the removal of human veins in bypass operations of which some 20,000 are carried out in England each year. The products could also help alleviate the failure of small synthetic grafts, which can be hard to integrate into the body.
In a two-stage process, a team of researchers led by the University of Edinburgh’s School of Engineering used a rotating spindle integrated into a 3D printer to print tubular grafts made from a water-based gel. They subsequently reinforced the printed graft in a process known as electrospinning, which uses high voltage to draw out very thin nanofibers, coating the artificial blood vessel in biodegradable polyester molecules.
Tests showed the resulting products to be as strong as natural blood vessels. The 3D graft can be made in thicknesses from 1 to 40 mm in diameter, for a range of applications, and its flexibility means that it could easily be integrated into the human body, the team says.
The next stage of the study will involve researching the use of the blood vessels in animals, in collaboration with the University of Edinburgh’s Roslin Institute, followed by trials in humans. The research, published in Advanced MaterialsTechnologies , was carried out in collaboration with Heriot-Watt University.
www.ed.ac.uk
www.hw.ac.uk
Contributions to Industry News may be emailed to managingeditor@e-i-s.org.uk. The nominal limit for entry is 250 words.
Fatigue 2024 A Resounding Success at Jesus College, Cambridge
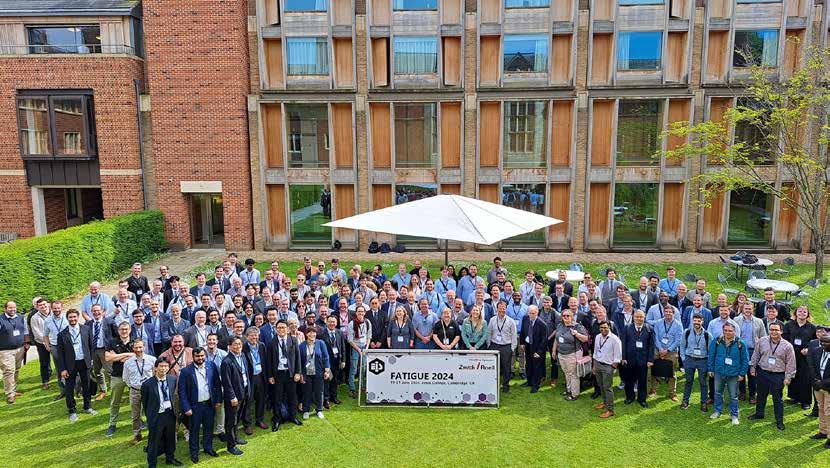
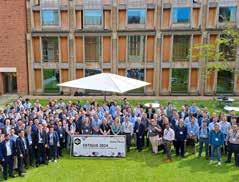
The Fatigue 2024 conference took place from 19–21 June 2024 at the historic Jesus College, Cambridge, UK. With over 100 papers presented and 167 attendees from 19 countries, the event was nearly at full capacity. Delegates from Europe, Asia and the Americas were pleased to gather in Cambridge for the first physical conference since 2017, following the global COVID-19 pandemic.
The Engineering Integrity Society has a proud history of organising international conferences for nearly 40 years. Over this time, the Society has cultivated a unique culture that brings together practicing engineers and researchers from both industry and academia. These gatherings facilitate the exchange of insights, understanding and expertise. The Fatigue conference series supports the international fatigue and durability community by providing a platform for sharing knowledge and information about the challenges of using high-performance materials for reliable and costeffective products.
An Ideal Setting
Jesus College, with its extensive grounds and purposebuilt conference centre, proved to be an outstanding


venue for Fatigue 2024. The facility featured a large lecture theatre and two plenary rooms, allowing for three parallel sessions to run simultaneously throughout most of the conference to accommodate the large number of presentations. The Elena Hall provided an ideal space for exhibitors, including the Headline Sponsor, ZwickRoell, alongside Altair, Beta CAE Systems, Dassault Systèmes, HBK, Severn Thermal Solutions, STEP Lab and Texys. The Instron Networking Zone was well-utilised, with attendees meeting in an informal setting to discuss the latest research and form new connections.
The conference was also sponsored by Darvick, Kent Energy, Swansea Materials Research and Testing Ltd and TWI, and their support was greatly appreciated.
Inspiring Keynotes
Keynote speakers included Professor James Newman from Mississippi State University, Dr Mark Hardy from Rolls-Royce and Professor Philippa Reed from the University of Southampton. Their presentations were highly valued, particularly by the younger engineers who relished the opportunity to engage with worldrenowned experts.


Promoting Young Talent
To further support early-career engineers, the conference offered a poster presentation competition for those not yet ready to deliver full presentations. Seven entries were displayed in the main exhibition room, with entrants also making one-minute pitches in the main Frankopan lecture theatre. Matthew Hulbert from the University of Southampton was awarded the prize for the best poster and presentation, and his poster is featured as a centre spread in this issue.


A Memorable Conference Dinner
A highlight of Fatigue 2024 for many was the conference dinner held in the Hall, a magnificent room that has been the heart of Jesus College since its foundation in 1496. The tall windows and vaulted ceilings with chandeliers provided a stunning backdrop for the formal dinner, leaving a lasting impression on all attendees. President of the EIS, Roderick Smith, welcomed delegates and introduced the guest speaker Professor Norman Fleck.

Looking Ahead
The conference was widely praised for its excellent organisation and the opportunities it provided for networking and collaboration. Attendees appreciated the friendly atmosphere and the unique setting which helped build new professional relationships. A highlights video summarising the enthusiasm and positive feedback from attendees can be seen on our YouTube channel.
Supporting early-career engineers is a key aim of the EIS and it was encouraging that approximately one-third of the papers were presented by this cohort. The Peter Watson Prize, awarded this year at the conference, saw a high standard of entries. Kris Hectors from Ghent University was awarded the prize and Jonathan Schanner from the Technical University in Chemnitz was Highly Commended. More details about the winners can be found on page 9.
The success of Fatigue 2024 was made possible by the dedicated efforts of the entire conference team, including the Organising Committee, Local Technical Committee and International Scientific Committee. Special thanks go to Dr John Yates, the Conference Convenor, whose commitment and hard work were instrumental in making the event our most successful conference to date.
Plans are already underway for the next conference, Fatigue 2027, to be held in summer 2027. The organising team will convene in the coming months to discuss preparations for what promises to be another outstanding event.

f f e c t o f B u i l d O r i e n t a t i o n o n t h e F a t i g u e R e s p o f A s B u i l t A M I N 7 1 8 a t E l e v a t e d T e m p e r a t u
E
Figure 5: EBSD scans of cracked region
M a t t h e w H u l b e r t , P r o f . P h i l i p p a R e e d , P r o f . A n d r e w H a m i l t o n 1 1 1
E m a i l : m h 1 4 g 2 0 @ s o t o n a c u k
3 . V e r t i c a l B u i l d R e s u l t s

E n g i n e e r i n g M a t e r i a l s , M e c h a n i c a l E n g i n e e r i n g , U n i v e r s i t y o f S o u t h a m t p o n , U K 1 F i g u r e 3 : s h o w i n g K 1 a n d K 2 f o r a
D e f l e c t e d c r a c k p a t h
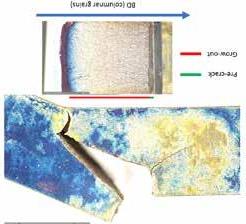
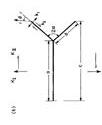
Figure 2: Deflected crack in horizontal build

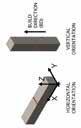
B a c k g r o u n d
1 .
P o w d e r B e d F u s i o n ( L P B F ) R e s u l t i n g a n i s o t r o p i c m i c r o s t r u c t u r e , w i t
p a r a l l e l t
n
t h e b u i l d d i r e c t i o n B u i l d o r i e n t a t i o n h a s a s i g n i f i c a n t e f f e c t o n c r a c k g r o w t h
b e h a v i o u r , e v e n a f t e r h e a t t r e a t m e n t [ 1 ]
I N 7 1 8 o f t e n s e e s s e r v i c e t e m p e r a t u r e s u p t o a n d e x c e e d i n g 4 5 0 ° C ,t e m p e r a t u r e e f f e c t s m a y i m p a c t f a t i g u e
c r a c k b e h a v i o u r i n s e r v i c e
C a u s e s o f c r a c k d e f l e c t i o n
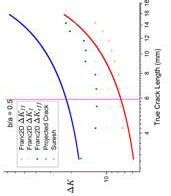
D e l t a K E s t i m a t i o n s
S u r e s h m o d e l [ 2 ] a n d Ji n t e g r a l
c a l c u l a t i o n s f o r Δ K c a l c u l a t i o n s
a r e a n a l y s e d
S u r e s h m o d e l i s t h e o r e t i c a l l y v a l i d f o r d e f l e c t e d c r a c k l e n g t h s w h e r e b / a > 0 5 JI n t e g r a l a p p r o a c h c a l c u l a t e d w i t h
F r a n c 2 D s o f t w a r e [ 3 ] p r o v i d e s t h e
h i g h e s t c o n f i d e n c e l e v e l , u s e d
h e n c e f o r t h
Figure 4: Δ K evaluations for deflected crack
S i g n i f i c a n t c r a c k d e f l e c t i o n c a n h a v e m u l t i p l e k n o c ko n e f f e c t s i n t e r m s o f f a t i g u e b e h a v i o u r C o n s i d e r
Figure 6: Crack deflection in 17-4 PH [5]
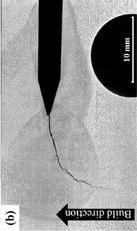
2 . M e t h o d o l o g y
3 p o i n t b e n d l o n g c r a c k t e s t s o n S i n g l e E d g e N o t c h B e n d
( S E N B ) s p e c i m e n s , s t a r t i n g a / W = 0 . 2 5
S a m p l e s p o l i s h e d t o a 1 μ m f i n i s h P r ec r a c k e d a t r o o m t e m p e r a t u r e f r o m Δ K 2 0 M P a √ m t o 1 5 M P a √ m C r a c k p r o p a g a t i o n d a t a w a s r e c o r d e d u s i n g a D i r e c t
C u r r e n t P o t e n t i a l D r o p ( D C P D ) a p p r o a c h D C P D d a t a c a l i b r a t e d p o s tt e s t u s i n g m e a s u r e d p r ec r a c k a n d f i n a l c r a c k l e n g t h s A l l t e s t s c o n d u c t e d i n a t m o s p h e r e a t 6 5 0 ° C
Figure 1: Example crack growth through horizontal and vertical build
W a

4 . H o r i z o n t a l B u i l d R e s u l t s 5 . C o n c l u s i o n s
c
l
c k g r o w t h u n d e r m o d e I I l o a d i n g , r e s u l t i n g i n o r d e r o f m a g n i t u d e h i g h e r
c r a c k g r o w t h r a t e s i n v e r t i c a l s a m p l e s t h a n h o r i z o n t a l
a r r e s t s m a y p r e s e n t a n i m p o r t a n t a s p e c t o f h i g h t e m p e r a t u r e c r a c k g r o w t h i n a sb u i l t m i c r o s t r u c t u r e u n d e r m o d e I l o a d i n g
6 . F u t u r e W o r k
C r a c k
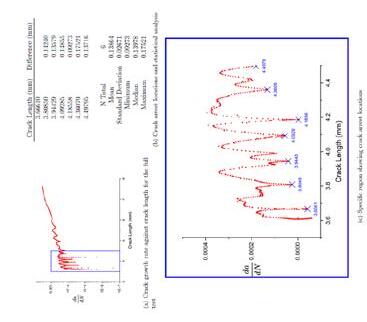
R e g u l a r c r a c k g r o w t h o b s e r v e d i n l i n e w i t h p r e -
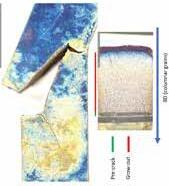
c r a c k D i s t i n c t i v e s h e a r l i p s v i s i b l e i n t h e b o t t o m c o r n e r s o f t h e f r a c t u r e s u r f a c e ( F i g . 7 ) P r ec r a c k : g r e e n G r o wo u t : r e d F u r t h e r t e s t i n g o f b o t h h o r i z o n t a l a n d v

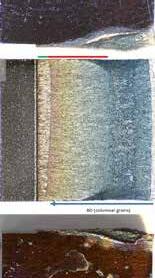
D C P D d a t a s h o w s r e p e a t e d c r a c k a r r e s t s i n e a r l y s t a g e s o f c r a c k g r o w t h
C r a c k a r r e s t s o c c u r a t c o n s i s t e n t c r a c k l e n g t h i n t e r v a l s o f a r o u n d 0 . 1 3 9 m m
M i n o r c r a c k a r r e s t s a r e o b s e r v e d i n t h e l i t e r a t u r e , m o s t s i m i l a r b e i n g M a r t i n e z d e
L u c a [ 1 ] s h o w i n g c r a c k a r r e s t s i n h e a t t r e a t e d L P B F I N 7 1 8 v e r t i c a l s a m p l e s , a t t r i b u t e d t o c r a c k d e f l e c t i o n s r e d u c i n g Δ K
I n t e r v a l b e t w e e n c r a c k a r r e s t s a l i g n w i t h t h e n u m b e r o f l a y e r s r e q u i r e d f o r t h e
s c a n p a t t e r n t o r e t u r n t o t h e o r i g i n a l o r i e n t a t i o n ( 6 7 d e g r e e s c a n p a t t e r n , 5 l a y e r s b e f o r e o v e r l a p ) O v e r a l l g r o w t h r a t e u p t o a n o r d e r o f m a g n i t u d e l o w e r t h a n v e r t i c a l b u i l d
e f e r e n
t
e r v e d i n t h i s w o r k [ 1 ] D i e g o M a r t i n e z d e L u c a . “ I n f l u e n c e o f b u i l d o r i e n t a t i o n o n h i g h t e m p e r a t u r e f a t i g u e c r a c k p r o p a g a t i o n m e c h a n i s m s i n I n c o n e l 7 1 8 f a b r i c a t e d b y l a s e r p o w d e r b e d f u s i o n ” . P h D t h e s i s . U n i v e r s i t y o f S o u t h a m p t o n , 2 0 2 2 [ 2 ] S . S u r e s h . “ C r a c k d e f l e c t i o n : I m p l i c a t i o n s f o r t h e g r o w t h o f l o n g a n d s h o r t f a t i g u e c r a c k s ” I n : M e t a l l u r g i c a l T r a n s a c t i o n s A 1 4 1 1 ( 1 9 8 3 ) [ 3 ] C o r n e l l F r a c t u r e G r o u p F r a n c 2 D
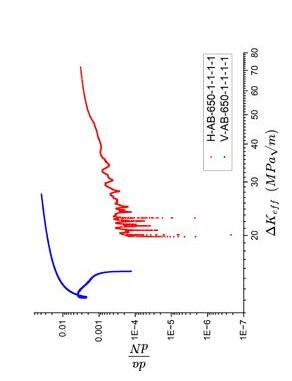
G r o w t h r a t e i n c r e a s e s d e s p i t e r e d u c i n g Δ K d u e t o D C P D m e a s u r i n g e f f e c t s o f 2 c r a c k s
Figure 9: paris Law plots for horizontal and vertical build tests
5 . C o m p a r i s o n The winning poster
P a r i s L a w p l o t ( F i g 9 ) s h o w s v e r t i c a l b u i l d s p e c i m e n g r o w t h r a t e s i n e x c e s s o f a n o r d e r o f m a g n i t u d e h i g h e r t h a n t h e h o r i z o n t a l b u i l d O p p o s e s t h e e x p e c t e d r e s u l t , l i t e r a t u r e r e p o r t s o r d e r o f
m a g n i t u d e h i g h e r g r o w t h r a t e s f o r h o r i z o n t a l l y b u i l t s p e c i m e n s [ 1 ] H o r i z o n t a l l y b u i l t s p e c i m e n s a l s o e x p e c t e d t o h a v e h i g h e r g r o w t h r a t e s d u e t o h i g h e r m o d e I l o a d i n g a n d s t r a i g h t
c r a c k p a t h S u g g e s t s e m b r i t t l e d g r a i n b o u n d a r i e s a r e p a r t i c u l a r l y s u s c e p t i b l e t o s h e a r o r m o d e I I l o a d i n g , c a u s i n g a c c e l e r a t e d
c r a c k g r o w t h i n t h e v e r t i c a l b u i l d s p e c i m e n
L a c k o f c r a c k a r r e s t s p r e s e n t i n v e r t i c a l b u i l d s u g g e s t s m o d e
I I l o a d i n g a l l o w e d f o r c o n t i n u o u s c r a c k g r o w t h , a s m i c r o s t r u c t u r a l d i f f e r e n c e s b e t w e e n b u i l d o r i e n t a t i o n s a r e
n e g l i g i b l e , a n d t h e o r i e n t a t i o n o f t h e g r a i n s i s r e l a t i v e l y
s i m i l a r i n c o m p a r i s o n t o t h e c r a c k g r o w t h d i r e c t i o n

When it comes to competitive race car design, aerofoils are not well shared online. Aerofoil tools have a library of documented aerofoil profiles however, there is limited information regarding camber. This study explores the effect ground clearance as well as the effect of modifying the aerofoil camber on downforce and drag. Additionally, it considers the effect of duel and multi aerofoil designs on these elements.
1.1 Ground Clearance CFD Analysis
Initially, CFD analysis was undertaken to validate optimal ground clearance for the main plane of the front wing. Measuring lift and drag at intervals of 10mm. The equations used for this analysis are as follows:
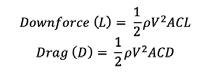
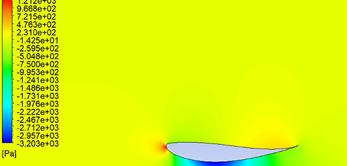
University of Wolverhampton Racing Sponsored
by the EIS
Research into Competition Car Aerodynamics

where density , velocity (V) = 45m/s, Area (A = chord length) = 0.3m CL = lift coefficient (dimensionless) & CD = drag coefficient (dimensionless).
With reference to Table 1, it can be seen that optimal downforce can be witnessed at a ground clearance of 40mm then downforce values start to drop off the closer the main plane is to the ground. It should also be considered through rules and regulations that minimum ground clearance for any part of the body is 40mm.
Through visual representation of Figures 1 and 2 there is a larger net low pressure on the main plane with a 40mm ground clearance then there is to a 10mm ground clearance. It can also visually be seen on the leading edge of the main plane of Figure 2 that there is a noticeable high-pressure area where assumptions can be made that there is physical limit to how close a body can be to the floor, where the air particles do not have enough space to squeeze to the underside of the aerofoil body.
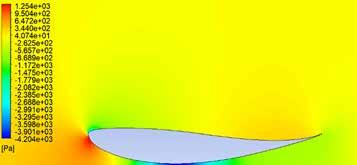
Table 1: Lift and drag calculated values through Ansys simulation. Wortman FX 63-137 2D Analysis 100mph Chord Length: 300mm
Dan Copson, Aerospace Engineering Student
Figure 1: Ground clearance of 40mm.
Figure 2: Ground clearance of 10mm.
This phenomenon is also known as “airflow choking.”
In conclusion, initially the closer the main plane is to the ground a noticeable increase in drag and downforce is witnessed, however through physical limitations, downforce values start for degrade when the aerofoil is closer to the ground from 40mm ground clearance.
1.2 Dual Wing Analysis
“The accepted wisdom in aeronautical texts is that more camber gives more lift at a given angle.” (Simon Mc Beath, 2006)
Initial research was undertaken upon dual wing analysis where suggestions made Simon McBeath book, CompetitionCarAerodynamicsin modifying an aerofoil for a wing flap an increasing the camber. Figures 3 and 4 show a NACA 63-3-618 in its original and modified state of 18% camber.
CFD simulations were then carried out by varying the angle of attack (AoA) of the wing flap and finding optimal % overlap and % gap between the two aerofoils. This led to physically modifying an aerofoils camber shown in Figure 4. Through CFD analysis a noticeable increase in downforce is witnessed from a single element with a ground clearance of 40mm (550.7N) to a maximum of (1782.9N) with an implemented dual-wing element of 60 degrees.
Although an increase in downforce can be witnessed by increasing the AoA of the wing flap there is also limitations that should be consider where flow separation can be witnessed from an AoA of 50 degrees between the upper and lower surface of the wing flap; with this comes a noticeable increase in drag. Additionally, through visual representation of the velocity streamline by adding a wing flap, the airflow from the mid-plane wing sticks to the lower surface of the wing flap. This could help benefit in preventing airflow from being interrupted from less aerodynamically shaped profiles such as the tyres and the wishbones.
By preventing contact with the buff body profiles, this will help prevent increase in drag due to the airflow having to work its way around these bodies. Due to this analysis, further consideration of a dual-wing analysis of 40 degrees has been put forward and further analysis for the considerations of gap and overlap % was undertaken for dual-wing analysis of a 40-degree setup.
Initial setup was an overlap of 16% of chord and 4% gap. Varying the gap via % of chord length was firstly undertaken where variation between 2%, 4% and 16% were analysed. These same effects from ground clearance could be witnessed where an increase in downforce can be seen by decreasing the gap between wing flap and main plane. However, limitations are witnessed again by seeing a drop in downforce at a 2% gap where the phenomenon of “airflow choking” can be witnessed. For this reason, a gap of 4% will be selected for setup.
The % chord overlap was then analysed at a constant 4% gap where optimal positioning shows that by having a 12% overlap produces the optimum of downforce values.
When analysing these parameters, an increase in downforce from a single element with a ground clearance of 40mm of 550N has more than tripled in downforce to 1660N by implementing an additional wing element. The next step was to create a multi-element wing setup.

3: NACA 63-3-618 unmodified.

1.3 Multi-Element Wing Analysis
An additional wing element was added to produce a multi-wing element analysis setup. Although again an increase in downforce can be witnessed, this is not as much as an improvement from single- to dual-wing analysis. Additionally, the values in drag have noticeably increased from the dual-wing setups.
This shows that there is less downforce to drag efficiency and may be initially disregarded for a setup. However, this may change as by adding an additional wing the airflow is further raised sticking to the third-element wings profile, depending upon the clearance needed for airflow to clear the buff bodies downstream of the race car. The trade-off, of overall reduction in drag, may further show considerations of adding an additional third-element wing.
2. Next Steps
The next planned steps into the aerofoil design will involve researching materials and manufacturing processes for FRP structures, and then modelling in 3D the front- and rear-wing setups, and research into the fundamentals of floor design.
3. References
[1] McBeath (2006) CompetitionCarAerodynamics2nd Ed. Veloce Publishing
[2] McBeath (2016) CompetitionCarComposites2nd Ed. Veloce Publishing
Figure
Figure 4: NACA 63-3-618 with a modified 18% camber.
News from the Institute of Measurement and Control


On 11th April, the InstMC National Metrology Skills Alliance (NMSA) had a virtual launch event to introduce the now completed Metrology Skills competency standard.
The event was introduced with a presentation by Dr Mike Percival – Global Head of Manufacturing Engineering, Rolls-Royce – who talked about the importance of an industry-supported approach to skills.
We also heard from AWE and Resilience Engineering on the ways the industry has been supported so far and plans to implement the standard. You can watch a recording of the event on the InstMC YouTube channel at https://www.youtube.com/watch?v=4bJPgOLbwf0.
PDFs of the standard are now available to download for free from the InstMC website and are available for anyone to start implementing in their organisations, or you may find them helpful to you as an individual to identify skills gaps or to support with your professional development.
We offer the Core standard, which looks at the general competencies and skills required for all metrologists. We have also completed and published two specialism specific annexes to provide competency and skills guidance for those working in specific fields. These annexes focus on Manufacturing and Flow.
The NMSA is continuing to develop additional annexes to support the Core standard, and these will be published as and when they are ready.

Now that the first edition of the underpinning standard is available, the NMSA will be focusing on the development of professional qualifications for metrologists, as well as an endorsement scheme for metrology training and courses.
The intention is for the qualification to be a peer review competency-based assessment process, taking a similar approach to the Engineering and Science Councils, and we hope to be able to start offering this to members in early 2025.
The NMSA is run as a Special Interest Group of the Institute of Measurement and Control, and we welcome

input and questions from anyone with an interest. If you would like to find out more about the work of the NMSA, or discuss how you, or your organisation, can be involved, please send an email to NMSA@instmc.org.
Our newly formed network, Women in Measurement, Automation and Control (WiMAC) is off to a flying start. We have established a core group of regular members which we are looking to grow as the year progresses. To date we have hosted three meetings, begun work on a mentoring platform and established our mission and values which are: "To raise awareness of women in measurement, automation and control and to empower women across engineering industries and backgrounds to cultivate a strong network of support, mentorship and opportunity."
At present, the group is only open to InstMC members, but as it grows, we hope to open up to non-members in 2025. To find out more about the group, visit https:// www.instmc.org/womens_network/about.aspx.
Jane Seery Marketing and Communications Manager www.instmc.org

ACM Hints & Tips
With David Ensor
A column with useful hints, tips or ideas on analysis, collection and measurement.
I am often asked, “How do you know if you have enough test data”? I have covered this in my seminars, but it seems the question always comes up. The answer depends a little on the aims of the exercise.
Firstly, for instance, if collecting data for comparison purposes, such as two types of oil additive, or a system with/without a modified component, then one “run” as the original and then with modification is not enough. You need enough information to show a statistical difference between the two. This will mean multiple runs, for the original and the modified, even at different times or even with multiple users, and the many other conditions that can affect the outcome. Often you are looking for small percentage increases and these variables, day to day, run to run, user to user, can be much larger than the change. I would suggest using a “T” Test to provide sanity –look it up. It can be found in “statistics books” or even the internet (https://www.scribbr. com/statistics/t-test/); Excel, and many other tools, have the function.
Secondly, how long should the data set be? I have seen engineers either obtain test data that is obviously too short (one lap of a track, one even, etc) and others that collect hours and hours of data that will just take forever to analyse. What is a good strategy? One way is to determine what is in your data that characterises it for your needs. Is it the frequency content, cyclic information, average, standard deviation, sound power or another statistic? The strategy is to monitor the main statistic, as you are collecting it ideally, and “signal average” it until when adding more data you see no change. In which case you have collected enough data to cover the need.
Exactly how this is done is quite straightforward. You can sample packets of data, of equal times, points, buffers, rotations, or distances to calculate the statistic (cycle count, spectra, etc). Continuously average these as you progress and you will see that, after a number of iterations, the statistic will not change and adding more data becomes superfluous.

What to Expect at the 2025 Exhibition
Free Entry and Seminars
Attendees can enjoy free access to the exhibition and a series of informative mini seminars held throughout the day.
Complimentary Refreshments and Lunch Vouchers
Complimentary refreshments will be available throughout the day. Additionally, a limited number of lunch vouchers will be distributed on a first-come, first-served basis, which can be redeemed at the adjacent cafeteria.
Networking Opportunities
The exhibition offers a unique opportunity to network with professionals and engineers from diverse sectors, including automotive, aerospace, rail, power generation, off-highway, material handling, motorsport and general research industries. The

friendly atmosphere, always evident at this event, allows for meaningful interactions and knowledge sharing between visitors and exhibitors.
Live Racetrack Views
The Silverstone Wing’s strategic location means visitors might catch some live action on the racetrack, viewable from the exhibition halls and the external viewing platform in Hall 5, adding further excitement to the day.
Extensive Industry Support
Widely advertised across the UK, the event is cosponsored by a number of well-known engineering institutions and societies, ensuring a high-quality and well-attended exhibition.
Join us at Silverstone Race Circuit for an unforgettable day of innovation, networking and cutting-edge technology. For more details about the exhibition and to book a table, visit www.e-i-s.org.uk.
The Instrumentation, Analysis and Testing Exhibition continues to be a key event in the engineering calendar, drawing visitors from all over the UK. Known as the goto exhibition for cutting-edge testing and analysis technologies, it continues to grow in popularity and significance.
Due to the ever-increasing demand for tables and ongoing success of the event, we are delighted to announce that the 2025 exhibition will be held in a larger space at Silverstone. Still located in the Silverstone Wing, Halls 4 and 5 provide a spacious and inspiring setting with fabulous panoramic views of the iconic racetrack.

Instrumentation, Analysis and Testing Exhibition 2025
A Must-Attend Event for Engineers


News from the Women's Engineering Society
The Women’s Engineering Society (WES) envisions an engineering world that embraces the diversity of the society it serves, addressing some of today's biggest challenges. Celebrating this vision, for the 2024 International Women in Engineering Day (INWED) we adopted the theme 'Enhanced by Engineering'. This theme showcased the broad impact of engineering across different sectors and highlighted the vital contributions of engineers in improving our lives.
INWED 2024 aimed to demonstrate that engineering offers diverse and rewarding opportunities for individuals with various interests, talents, and backgrounds. Innovation thrives on diversity of thought and this is especially true in engineering. Different perspectives, particularly from women, can lead to unique solutions to problems, for example the introduction of the threepin plug by one of our founders in 1919, Caroline Haslett.
Once again the 2024 INWED campaign was a huge success with over 1 million social media impressions and hundreds of events worldwide, from Australia to Saudi Arabia. Here in the UK the INWED Big Weekend began on 21 June at the Royal Society of Medicine, where over 100 people joined us to celebrate the 10th anniversary of INWED. Throughout the following day, social media was overtaken with posts highlighting INWED over the years. Sunday 23 June was obviously the main event and INWED and the theme 'Enhanced by Engineering' took over social media. The celebration wrapped up on Monday with a webinar featuring a keynote by Dr Nikita Hari, a fireside chat between INWED Founder Dawn Bonfield and WES Heritage Manager Helen Close, and a panel of WE50 award winners.
The "Enhanced by Engineering" theme also guided the WES Top 50 Women in Engineering Awards (WE50). These awards celebrate women who have excelled in their fields, creating safer, healthier and more sustainable futures. This year's winners came from a diverse range
of sectors including transportation, construction, technology and healthcare. Raising the visibility of women in engineering is crucial for inspiring future generations. By showcasing diverse role models who have made significant contributions, WES encourages more young women to pursue engineering careers. The theme "Enhanced by Engineering" highlights the role of engineering in modern life, from communications and transportation to building infrastructure and developing life-saving medical equipment.
Diversity is key to solving engineering problems. A variety of perspectives leads to innovative solutions, as demonstrated by the Electrical Association for Women (EAW), founded 100 years ago. The EAW educated women on using electricity to improve their lives, bridging the gap between technical engineers and domestic users, showing that diverse input drives innovation. Women engineers serve as role models, inspiring future generations regardless of gender. Showcasing their achievements is essential not only for equity but also for driving innovation and meeting the needs of a diverse society. INWED plays a vital role in promoting the long-term success and inclusivity of the engineering profession.
Candi Colbourn Events and Marketing Manager www.wes.org.uk

Technical Paper:
Evaluation of non-proportional multi-axial stress states in drive-train components
related to contacts
J. Schanner, A. Hasse, L. Suchý
Institute for Engineering Design and Drive Technology, Chemnitz University of Technology, 09126 Chemnitz, Germany
Author correspondence: jonathan.schanner@mb.tu-chemnitz.de
Estimating the fatigue strength of multiaxially loaded components using current standards has shortcomings for certain stress conditions. Therefore, different methods to estimate the severity of non-proportionality of load cases are investigated. First, four integral-based calculation methods of a non-proportionality factor are analysed on a simple plane stress load case. Their spatial capabilities are then tested for contact on an example of a shaft-hub shrink fit model. Qualitative two of the four selected methods perform well for this type of loading. Consequently, the basis for subsequent quantitative fatigue analyses with experimental validation has been prepared.
Keywords : multi-axial fatigue, non-proportionality, stress state analysis, contact stresses evaluation
INTRODUCTION
In all areas of engineering, relevant standards and guidelines form the basis for the design of components and component contacts. Particularly in the field of drive technology, calculations of highly dynamic systems with complex stress conditions emerge. Although current standards and guidelines (e.g. FKM guideline [1] or DIN 743 [2]) provide calculation bases for shaft-hub connections, these only use simplified methods that abstract the complicated local stress situation. Both guidelines enable a local strength verification, often using additional calculation algorithms (e.g. FE method). In most cases, the correction factors derived here relate to the maximum occurring stress amplitudes or critical load spectra. In the field of drive technology in particular, however, there is a superposition of differently composed stress curves. The resulting effect of the non-proportional stresses on the multi-axiality has not yet been taken into account [1, 2]. Depending on the material and type of load, this can lead to a reduction in strength and thus reduce the lifespan of the analysed components, as shown by Sonsino et. al. [3] and Hassan and Kyriakides [4], as well as Susmel [5].
Based on these findings, adjustment formulae were developed by Itoh et. al. [6] and Fesich [7], which enable the implementation of a correction factor for multiaxiality in the calculation methods. The factor K'is described here as an adjusted parameter, which is based on the material parameter α and the degree of non-proportionality of the load fNP , the so-called non-proportionality factor. The parameters K and K' can be selected as strength parameters of the guidelines, equivalent stresses or equivalent strains, depending on the specific situation, see Riess et. al. [8].
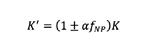
The sign in front of the relationship refers to the application in each case, as a safety factor K < 1 or a utilisation factor K >1 is calculated depending on the application. Without the influence of the material (i.e. α =1), a value range between 0 to 1 results for fNP, whereby fNP=0 corresponds to a proportional load case.
At this point it should be mentioned that the evaluation of non-proportionality always involves a transient stress state σ(t). Thus, an independent temporal change of the stress components is possible.
There are various approaches for defining fNP. One major group is based on the critical plane method. Well-known representatives of this group are the works of Fesich [7], Kanazawa et. al. [8], Papuga [10] as well as Skibicki and Sempruch [11]. What they all have in common is that before this method can be used, the critical component cross-sections must be defined in order to determine a critical plane. For a discrete system, this means that for each element n and each time t , a complete rotation of the intersection plane over two Euler angles must be performed in order to determine the most critical value of fNP, Susmel [12].
In order to reduce the calculation intensity, methods have been developed that directly take into account the temporal course of the stress tensor. For example, Chu et. al. [13] show for the plane case that an enclosing ellipse of the stress path in the σ-τ coordinate system can be used to describe the non-proportionality of the stress state. The non-proportionality factor fNP is calculated according to Eq. (2) on the basis of the main axis ratio of the ellipse. The smaller of the two main axes in the numerator must always be selected with h < w. Here h defines the height and w the width of the ellipse.
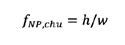
(2)
Many other envelope shapes can be selected in this way to determine the non-proportionality, e.g. Chen et. al. [14] or [10]. However, the application of this method fails for three-dimensional stress tensors or requires significant adjustments, which is why no further attention is paid to them. Nevertheless, this idea forms the basis for further formulations of non-proportionality, which have been extended to the spatial stress case relevant for contacts. Bishop [15] and Gaier et. al. [16] use the area
(1)
moment of inertia of the stress trajectory instead of an enclosing form in stress space. To account for any stress components, the resulting tensor of moments of inertia is treated in R 6 space. This is achieved by transforming the stress tensor from σ(t) R 6. The shear stresses are provided with a pre-factor √2 in order to achieve coordinate invariance. The reason for this lies in the symmetry of the stress tensor. In [15], Bishopdescribes a numerical algorithm to implement the calculation. With reference to [15], the following equations are given:
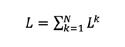
where Lk= ||x (k+1) – x k ||, x k=x (tk) describes the distance between two points. Afterwards the mean value corrected stress component y = x– is used for further calculations. The non-proportionality is determined as the ratio of the maximum eigenvalues of the inertia tensor. Thus, an eigenvalue along the first-principal axis a1 can be determined for each timestep t . Similar to equation (6) the next smaller value along ai can be determined.

A variation of the presented approach is given by Gaier [16]. While the calculation still uses the R 6 space the definition of the evaluation values is changed. It must be emphasised that no mean stress correction happens in this calculation.
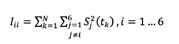
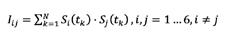
The determination of the non-proportionality factor is inverted in comparison to Bishop so that the following applies to the eigenvalue consideration:
A significantly different method is proposed by
Bolchoun et. al. [17]. Here, the proportionality of the load is to be estimated on the basis of the correlation of the transient behaviour of the stress components. Cor describes the correlation coefficient between two stress components. A correlation of 1 or –1 for σx and τ xy would describe a proportional stress state. The formulation can be regarded as spatial, as the correlation is integrated over the angles θ and ψ and finally minimised over ξ . The angular limits of the integrals and the minimisation operator are to be equated with a spatial rotation, which seeks the weakest correlation of the normal and shear stress.
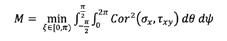
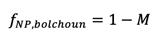
The last non-proportionality factor analysed here was formulated by Itoh et. al. [18]. Itoh describes the non-proportionality as the deviation of the maximum principal stress SI at time t from the maximum amplitude of the principal stress SI,max. The time at which the maximum stress occurs is referred to as t0
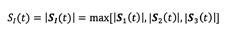
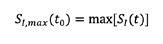
The non-proportionality factor is then described as the curve integral of the absolute maximum principal stress SI(t)and the deviation of the resulting vector eR from the initial vector eI(t).
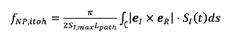
The pre-factors SImax and Lpath are used for normalisation of the equation for the non-proportionality factor. normalises in case that the absolute maximum principal stress describes an ideal circular path.
ANALYSIS OF DIFFERENT STRESS STATES ON THE NON-PROPORTIONALITY FACTORS
In the following, the integral non-proportionality factors described above will be examined with regard to their behaviour under different stress states. For this purpose, a theoretical 2-component stress state according to equation (18) is used.
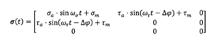
(18)
(12)
(13)
(16)
(17)
Δφ stands for the phase shift between normal and shear stress. For all variations, the influence of individual factors is analysed over a phase range of Δφ =[0;π].
The factors analysed that influence non-proportionality can be divided into the Amplitude ratio Va, frequency ratio Vf and mean stress ratio R σ,τ (eg. FIGURE 1). For the simplest case, in which only one normal stress and one shear stress are present, the influencing factors are defined as follows:


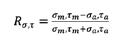
As a reference state to analyse each influence the following parameters are set: V a =1;Vf=1;Rσ =R τ =–1. This allows for an initial test where only the phase shift is of
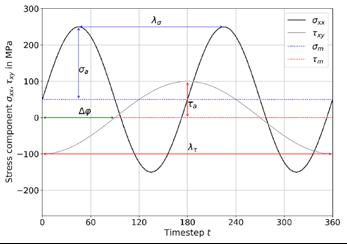
importance for the non-proportionality. The given nonproportionality factors fNP are shown in FIGURE 2.
All the non-proportionality factors reach their maximum at a phase shift of Δφ = 90°, consistent with literature [7, 17, 18]. The maximum values range from 0.7 to 1. Bishop , Gaier , and Itoh show a linear increase in the non-proportionality factor initially, while Bolchoun's behavior resembles a distribution function. Bolchoun underestimates non-proportionality for Δφ < and overestimates it for Δφ > , when compared to the other methods. This non-linear behavior is due to the quadratic consideration of the correlation coefficient. Bolchoun alone reaches the maximum value of fNP=1 for the defined initial state. Bishop and Gaier do not reach fNP=1because their calculation scales shear stress components, where shear stresses influence the stress course more than normal stress, as detailed in [16].
Below, the individual influencing factors are adjusted in isolation from each other in order to be able to evaluate the individual influences. The variation of the individual components can be seen in Table 1.
The influence of the amplitude ratio is analyzed according to equation (19), varying the normal stress amplitude while keeping the shear stress amplitude
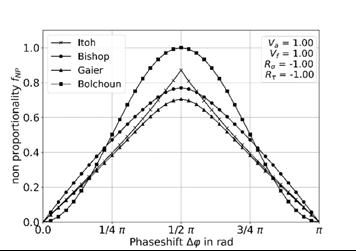
Parameter
Table
Figure 1: Parameter definition of different parameters: Δφ phase shift; λ σ,τ wavelength; σa,τa stress amplitude; σm,τm mean stress.
Figure 2: Non-proportionality factors at different phase shifts for the reference state V a =1;Vf=1;Rσ =R τ =–1.
1: Parameter set for the analysis of the influencing factors.
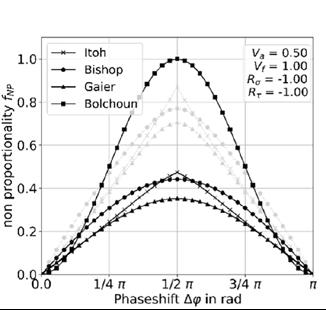
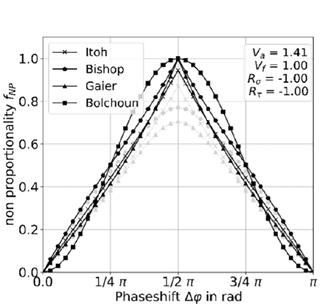
constant. FIGURE 3 shows the results. For Bishop , Gaier , and Itoh , changing the amplitude ratio scales the nonproportionality values, with the maximum remaining at a phase shift of Δφ = 90°. Scaling the normal stress to σa=√2 τ a makes the non-proportionality factors for Bishopand Gaierreach the maximum value of fNP=1. This behavior is linked to the stress tensor definition in R 6-space. Itoh also shows scaling with amplitude ratio changes, but the progression over the phase shift is more linear. If the amplitude ratio exceeds √2, the non-proportionality factor decreases, as the normal stress predominates. Unlike the others, Bolchoun'snonproportionality remains unchanged with different stress ratios, due to its correlation definition, which evaluates the stress functions independently of the amplitude.
As a second factor the frequency ratio is analyzed according to equation (20) by varying the normal stress frequency while keeping the shear stress frequency constant. FIGURE 4 shows the results. Unlike the amplitude ratio, the frequency ratio significantly affects the non-proportionality course, altering both the magnitude and the maximum position. All factors exhibit
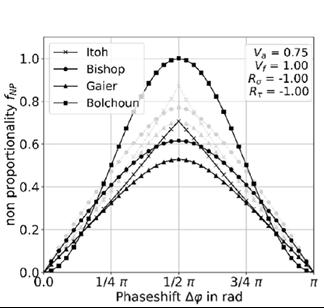
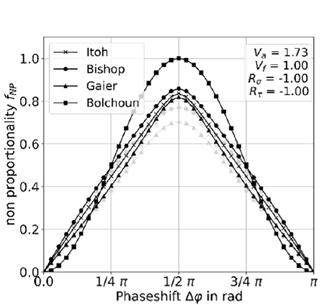
non-proportionality for all phase shifts. For Vf =0.5, the maximum non-proportionality shifts by 90°. Bolchoun consistently reaches fNP=1 at certain phase shifts, indicating zero correlation. Itoh shows discontinuities at Vf = 0.25 due to numerical issues with low frequency causing an open stress path. Similar, but less abrupt, observations occur at Vf = 0.75 and Vf =1.25. This issue can be resolved by ensuring closed stress paths in the stress curve.
The influence of the normal stress ratio R σ , according to Eq. (21), is analyzed with a mean stress applied in addition to the cyclical normal stress. Bolchoun's nonproportionality factor shows no dependence on the stress ratio due to its correlation definition. Bishop also shows no influence because the mean stress component corrects the stress paths, shifting the tensor path's origin at the mean stress level. In contrast, Gaier , who does not correct for mean stress, shows a clear influence, with non-proportionality in the in-phase positions Δφ =0°,180°. As the stress ratio increases, Gaier's nonproportionality rises in the in-phase positions until flattening out between R σ =-0.33 and R σ =0. With a further increase in Rσ, fNP is approaching a constant non-
Figure 3: Non-proportionality factors at different phase shifts for a variable amplitude ratios.
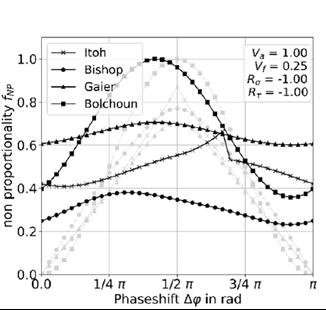
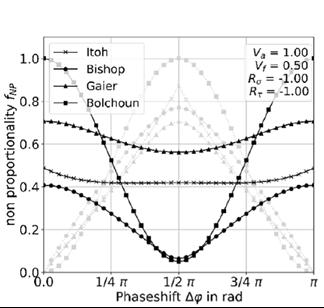

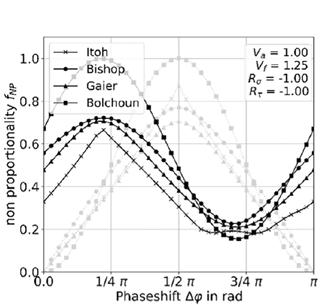
proportionality level dependent on the mean stress. Itoh also shows dependence on the stress ratio; mean stress in the in-phase position is evaluated as nonproportionality. Unlike Gaier , Itoh does not reach the initial state's maximum value, and a strong increase in mean stress results in a flatter non-proportionality curve over the phase angle.
Similar behaviour to the normal stress ratio R σ can be observed for the shear stress ratio R τ . The nonproportionality factors according to Bishopand Bolchoun show no change due to an inserted mean stress. Gaierand Itoh show a decrease in non-proportionality compared to the initial state. For both, the flattening of the curve is significantly faster than for the case of normal mean stress. It can also be observed that the values in in-phase positions are significantly lower than for the normal mean stress. The reason for this behaviour is the scaling of the shear stress in Gaierand the influence of the shear stress in the principal stress system in Itoh .
To summarize the analysis, the dependence of the stress state on the calculation method used to determine non-proportionality varies. The frequency ratio Vf is the most universally influential factor. Bolchoun's nonproportionality factor is the least sensitive due to its correlation definition, disregarding mean stresses and amplitude changes. For a constant frequency, all factors reach maximum non-proportionality at a phase shift of 90°. An amplitude ratio of √2 leads to the highest assessment of the damaging effect caused by non-proportional stress, primarily due to the scaling of shear stresses in Bishop and Gaier's methods. Only Itoh and Gaier respond to mean stress, detecting nonproportionality at in-phase positions. Beyond a certain stress ratio, the maximum non-proportionality decreases as the mean stress becomes the main component of the stress tensor.
Figure 4: Non-proportionality factors at different phase shifts for a variable frequency ratios.
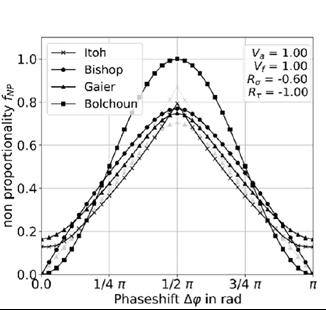
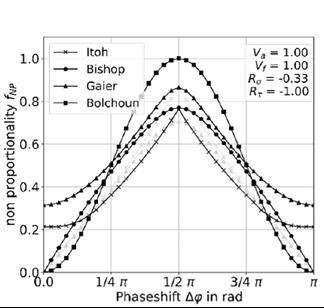
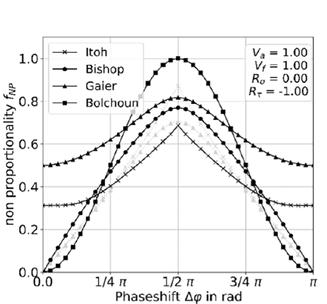
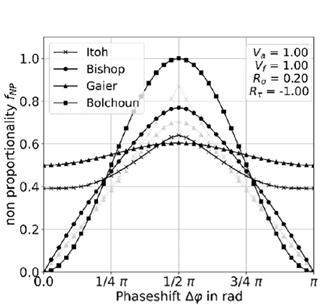
APPLICATION OF NON-PROPORTIONALITY FACTORS TO SHAFT-HUB PRESS-FITS
The non-proportionality factors will now be applied to a drivetrain, focusing on individually or combined loaded shaft-hub press-fit connections. The interference fit introduces additional normal stress components perpendicular to the surface, leading to a complex three-dimensional stress state within the shaft-hub connection. This is ideal for analyzing the influencing factors.
Three FE models were analyzed to determine the stress tensors: one for the press-fit under pure torsional load, one under rotating bending load, and one under
combined rotating bending-torsional load. Due to the connection's symmetry, a single model is sufficient for the superimposed load to analyze the phase shift between bending and torsional stress. Adjusting the evaluation position on the circumference influences Δφ by the temporal occurrence of bending stress at the evaluation position.
The models for single loads require evaluation at one critical point, as no additional phase shift between normal and shear stress components occurs. The evaluation zone is located on the shaft side near the hub edge, avoiding the singularity by evaluating a few nodes below the contact zone and axially inside the shaft.
Figure 5: Non-proportionality factors at different phase shifts for a variable normal mean stress ratios.
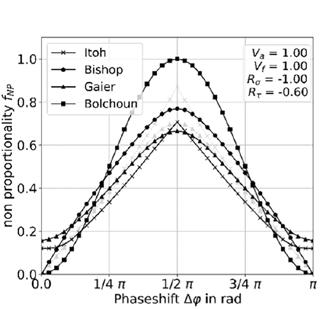
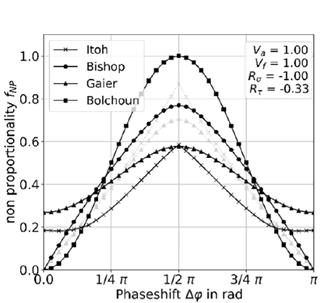

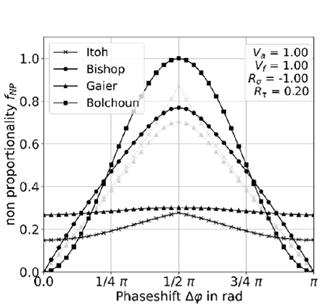
FIGURE 7 shows the model structure. Depending on the load, the bending moment MB , the torque MT , or both are activated. The hub is fixed at the back. The FE mesh has a fractal-like structure at the contact edge, where the greatest damage is expected. The simulation sequence starts with applying pressure without active friction to minimize introduced shear stresses. After setting the pressure as an interference fit, friction is activated using a simple penalty algorithm. In an intermediate step, the initial bending moment is set for rotating bending, applying bending moments in the x and y directions as opposing sine and cosine functions to simulate the rotating effect. Finally, the other loads (opposing bending component and torsion, if applicable) are applied, matching the fatigue strengths from the respective tests [19].
After completion of the load cycles, the area marked in FIGURE 7 is continuously evaluated for the superimposed load. For the individual loads, only one point in the x-zplane is analysed.
The evaluation begins with an analysis of the stress state, scaling the individual components to the Lamé pressure
Figure 7: Finite-element model of a shaft-hub press-fit.
Figure 6: Non-proportionality factors at different phase shifts for a variable shear mean stress ratios
pL=134 MPa. FIGURE 8 shows the temporal progression of the stress components for bending (a), torsion (b), and superimposed loads at 0° phase shift (c) and 90° phase shift (d). Additionally, the stress component interactions are presented in matrix form, allowing analysis of the stress paths without scaled shear stresses for the individual components.
As described earlier, the unique feature of contact stress states compared to free surface stress states is the occupancy of the tensor points, which include both cyclic stresses and constant mean stresses in space. Generally, normal mean stresses initially occur on the shaft surface near the hub edge after joining the press fit.
In rotating bending, the stress state is characterized by cyclic components due to stress concentrations at the notch. Initially, pressure intensifies on the bending compression side and diminishes on the opposite

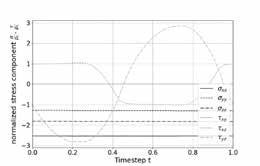
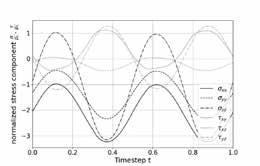
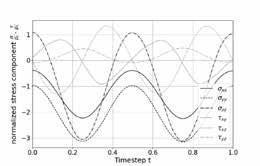
tension side. Axial shear stress arises from friction within the slip zone of the interference fit, its magnitude contingent upon the coefficient of friction.
In pure alternating torsion, normal direction mounting stress remains unaffected. The stress state features two shear stress components: surface shear stress akin to contactless notches and radial-tangential shear stress. Due to the slip condition, the latter does not exhibit a harmonic curve and is "cut off" within the contact area. The plateau height depends on the coefficient of friction, which can vary significantly from its initial value due to minor surface damage in this region.
In simplified terms, it can be concluded that the described stress states of the individual loads are also superimposed for the rotating bending and the alternating torsion (see FIGURE 8). However, additional alternating mechanisms occur, which change the amplitude ratios. These cannot
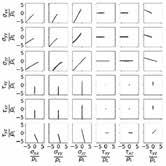
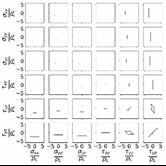
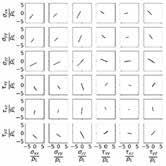
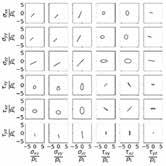
8: Transient stresses in shrink fits underneath the contact hub edge; a) rotating bending, b) alternating torsion, c) superposition of rotating bending and torsion at φ = 0°, d) at φ = 90°.
Figure
Table 2: Results of non-proportionality factors of uniaxially and multiaxially loaded press fits.
easily be described analytically and depend heavily on the geometric contact design. It can be stated that all components have an oscillating and mean-stress character. The type of load superposition results in a phase shift of the nominal loads over the circumference, as described in detail in [18]. This is also reflected in the local stress in the shear stress component.
The analysis initially shows that non-proportionality is also pronounced for individual loads, depending on the approach. With the exception of Bolchoun , low values between fNP = 0.07…0.21 are calculated for pure rotating bending. Bolchoun calculates fNP = 0.99 as the most damaging effect of the stress state. This may be due to low amplitude oscillation of shear stress components.
In the case of pure torsion, the calculation is divided into two groups. While the approaches according to Bolchoun and Gaier predict the highest non-proportionality with an almost fully non-proportional stress state, the values according to Itohand Bishopare fNP= 0.33…0.40.
When superimposing rotating bending with alternating torsion, the loads are dependent on the circumferential position and thus the phase position. Here, the 90° phase position proves to be the most critical stress state. The calculations result in fNP= 0.56…1. At 0°-phase shift Itoh and Gaier predict a non-zero non-proportionality of fNP = 0.41…0.43. In contrast, Bishopand Bolchounevaluate the stress state at the hub edge as proportional.
SUMMARY – OUTLOOK
The approaches presented here for calculating the nonproportionality of a transient stress state are of great interest for a simple strength assessment. An integration into one of the known strength analyses would enable an estimation of the durability of components without complex numerical investigation of the strength hypotheses. Previous studies on non-proportionality mainly relate to the low cycle fatigue strength and the plane stress state. An analysis of selected calculation approaches for non-proportionality factors (Bishop, Gaier, Itoh, Bolchoun) clearly show the influence of the amplitude and frequency ratios as well as the mean stresses on the degree of non-proportionality at different phase shifts of the normal and shear stresses. Qualitatively, all calculation methods show a similar tendency, but quantitatively there are large differences. For example, Bolchoun in particular shows major weaknesses in the calculation due to the correlation definition.
For components with contacts, however, analysing the two-dimensional stress state is not sufficient, as a spatial stress state exists at the interface due to the contact pressures applied. In practice, the non-proportional stress states are considered using notch factors, however these have to be determined experimentally by time-consuming model tests. For this reason, the methods of non-proportionality factors were investigated in more detail using a shaft-hub press-fit typical of drive technology. Although Itoh shows clear numerical instabilities for frequency deviations, the nonproportionality estimation for the three-dimensional stress space appears to be plausible. Bishop seems to underestimate the non-proportionality as he does not consider the mean stress, especially for superimposed loading. But it is not clear, if this effect is already included in the common mean stress consideration in the calculation standards. In contrast, Gaier overestimates the influence of the mean contact stress for the load case of pure torsion and underestimates the nonproportionality in the 90° phase shift for combined loading, where the maximum non-proportionality is to be expected.
To summarise, it can be seen that it is still difficult to assess non-proportionality without a strength verification with experimental validation. However, a qualitative assessment using numerical methods appears to make sense in order to check the robustness of existing calculation concepts. Here Bishop and Itoh show promising results for complex stress states. Further investigations with integration of the nonproportionality factors into a strength verification are being sought after.
LIST OF SYMBOLS
ai … principle axis of stress tensor
b… second axis of stress tensor
e … Eigenvector of stress tensor
f… frequency
fNP … non-proportionality factor
h… height of enclosure ellipse
s … length between two points in stress space
t… time component
w … width of enclosure ellipse
x … stress component in R6
y … stress component in R6 without mean stress
I… inertia component
K… safety factor for multiaxial stress
L… length of the stress path
M… integrated correlation value
R… mean stress ratio
S… stress tensor/component
α … material hardening parameter
σ … normal stress
τ … shear stress
φ … phase shift
θ,ψ,ξ… coordinate angles
REFERENCES
[1] FKM Richtlinie: “Rechnerischer Festigkeitsnachweis für Maschinenbauteile”, 2002.
[2] DIN 743 (2012-12): Tragfähigkeitsberechnung von Wellen und Achsen, Beuth Verlag.
[3] Sonsino C.M. and Grubisic V., ASTMSTP853, 1985, pp. 586–605.
[4] Hassan T. and Kyriakides S., Int.J.ofPlasticity , Vol. 10, 1994, pp. 185–212.
[5] Susmel L. and Taylor D., Fatigue and Fract Engng Mater StrucVol. 31, 2008 pp. 1047–1064.
[6] Itoh T., et. al., EuropeanStructuralIntegritySociety , Vol 25, 1999, pp.41–54.
[7] Fesich T., Dissertation , 2012.
[8] Riess C., et. al, FratturaedIntegritaStrutturale , Vol. 10, 2016, pp. 52–59.
[9] Kanazawa K., et. al., FractureofEngineeringMaterialsand Structures , 1979, pp. 217–228.
[10] Papuga J., Int.J.ofFatigue , Vol. 33, 2011, pp. 153–65.
[11] Skibicki D., Sempruch J.,FractureofEngineeringMaterials andStructures , 2004, pp. 369–377.
[12] Susmel L., Int.J.ofFatigue , Vol. 32, 2010, pp. 1875–1883.
[13] Chu C.C., et. al., VDI , Nr. 1283, 1996, pp.337–348.
[14] Chen X., et. al., Fracture of Engineering Materials and Structures , 1996, pp. 839–854.
[15] Bishop J.E., Fracture of Engineering Materials and Structures , 2000, pp. 1019–1103.
[16] Gaier C., et. al., Int.J.ofFatigue , Vol. 26, 2004, pp.331–337.
[17] Bolchoun A., et. al., FratturaedIntegritaStrutturale , Vol. 9, 2015, pp. 238–252.
[18] Itoh T., et. al., Int.J.ofPressureVesselsandPiping , Vol. 110, 2013, pp. 50–56.
[19] Suchý L., Hasse A., Proc. of the 8th Int. C. on Fracture FatigueandWear , 2021, p. 473–487.
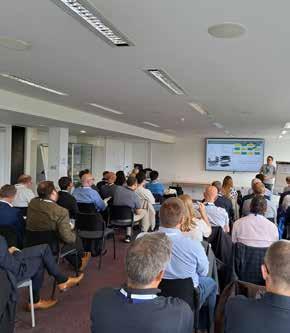
Instrumentation, Analysis and Testing Exhibition 2024


The annual Instrumentation, Analysis and Testing Exhibition, held earlier this year at the Silverstone Wing at Silverstone Race Circuit, was once again a huge success. Drawing attendees from all over the UK, the exhibition featured 70 exhibitor tables showcasing the latest technologies across diverse sectors including automotive, aerospace, motorsport, rail, off-highway, mechanical handling, civil engineering, industrial and power generation.
This year's exhibition was well-attended, with visitors praising it as the go-to event for testing and analysis technologies.
The bustling venue was filled with useful conversations and knowledge sharing, creating a buzz that underscored the event's importance as a meeting point for industry professionals. Attendees highlighted the fantastic opportunity to connect with peers, exchange ideas and establish valuable contacts.
Complementing the exhibition were a series of mini-seminars held throughout the day. These short presentations covered a wide range of topics, delivered by well-respected engineers from various sectors, further enhancing the value of the event.
The Instrumentation, Analysis and Testing Exhibition 2025 will take place in April next year. With tables likely to sell out quickly, exhibitors are advised to book early to avoid disappointment. More information is available at www.e-i-s.org.uk.
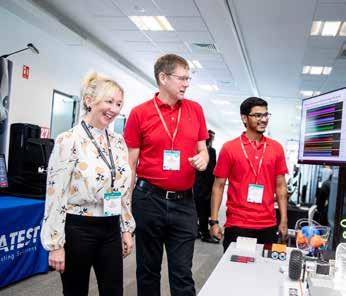


Group News

Durability & Fatigue Group
The Fatigue 2024 conference was a great success, with a broad range of delegates and a wide selection of topics within our remit (and being in the UK, we must should also note the fact that the weather was lovely!). We express huge gratitude to our Convenor Dr John Yates, Deputy Convenors, Dr Hollie Cockings and Professor Svjetlana Stekovic and our Marketing & Events Manager, Sara Atkin, for all their hard work.
Aligning with the thrust of research and engineering focus, there were a large number of papers presented on work targeting a real understanding of material performance under aggressive conditions, such as higher temperatures and challenging media, especially hydrogen. Environmentally, as a society, we must improve our energy efficiency and eliminate a majority of our carbon emissions. Overall, this drives an underpinning need to operate systems only when we need to, scrupulously at the minimum level we require, but this creates very different cyclic loading scenarios, those of which formed the basis of our legacy design data and test data.
The two sides of this theme, from materials performance and systems performance and maintainability, have always been important work for our community, but seem certain to attract increasingly wide public attention over the next few years. Now that the conference has concluded, the Durability and Fatigue Group will focus its efforts on holding a number of topical seminars and planning will commence at our next meeting this month.

Simulation, Test & Measurement Group
The Data Collection seminar, again with the focus on data acquisition, sensors and processing, was held on 27th February at the MIRA Technology Institute and was well received and created interesting discussion.
The second part of this seminar, Maximising Insights from Data, is going to be held on 1st October, again at the MTI, which I hope will attract more members to come along and generate further discussion. I hope you can join us or recommend it to your colleagues if they have not attended before.
The next Instrumentation, Analysis and Testing Exhibition is in two larger halls at Silverstone on 29th April 2025. The large exhibition is to meet demand, and it’s great to see this is still a popular event and attracting more interest. It is the 40th anniversary of the EIS next year so it is a great time to increase our activity and celebrate at the Exhibition; I hope to see you there.
We are still keen to pursue more seminars, possibly one in the autumn – about tyres! The intention is this will cover the development of tyres particularly for electric vehicles (EVs) and particulate legislation. If you are interested in attending or supporting any of the above events, please let myself or Sara Atkin (EIS Marketing & Events Manager) know.
Peter Bailey Chairman
Steve Payne Chairman

Sound & Vibration Product Perception Group
Sound quality is at the core of product perception. From electric drills to luxury cars, the science behind sound quality has grown up along with the increased manufacturing and materials capabilities and the expectations of customers for refined products.
In this light, we see the need to support engineers in their understanding of the psychoacoustic principles and see how sound quality tools and techniques are being implemented in product development. We will continue to progress a sound-quality-themed seminar through the summer and early autumn.
In principle this will be a seminar of two halves: psychoacoustics and fundamentals, followed by case studies. It is expected that they will be a mix of workshops and presentations. As soon as the presentations and workshops have been confirmed, we anticipate they will be run over two separate days in 2025.
If you would like to contribute please contact Sara Atkin (EIS, Marketing and Events Manager).
Dave Fish Chairman
Corporate Members
The following companies are corporate members of the Engineering Integrity Society. We thank them for their continued support which helps the Society to run its wide-ranging events throughout the year.
Aircraft Research Association
AMETEK Vision Research
Axiometrix Solutions
CATS3
CentraTEQ
CoMech
Correlated Solutions
Darvick
Dassault Systemes
Data Acquisition and Testing
Services Ltd
Data Physics
Datron Technology
Delta Motion
Dewesoft
Frazer-Nash Consultancy
GI Systems
HBK
HEAD acoustics
HORIBA-MIRA
Instron
Intrepid Control Systems
Interface Force Measurements
iPetronik
Kistler
M&P International
McLaren Applied
Mecmesin
Micro Measurements
Micro-Epsilon
Moog
Nprime
ODOSOLUTIONS
PCB Piezotronics
PDS Hitech
Polytec
Prosig
Relyence UK Ltd
Rutherford Appleton Lab
Sensors UK
Servotest
Siemens
Star Hydraulics
Strainsense
Stress-Space
Technica Engineering GmbH
Techni Measure
Texys
THP Systems
Torquemeters
UTAC
Yokogawa
ZEISS
ZwickRoell
Committee Members
President
Professor Roderick A Smith, FREng. ScD
Directors
Peter Bailey, Instron
Connor Bligh, DEWESoft UK Ltd
Robert Cawte, HBK
Dave Fish, JoTech Ltd
Graham Hemmings, Engineering Consultant
Alex O'Neill, GCAPS (Global Center for Automotive Performance and Simulation)
Jamie Shenton, JCB
John Yates, Engineering Consultant
Chairman
John Yates, Engineering Consultant
Vice-Chairman
David Fish, JoTech
Marketing & Events Manager
Sara Atkin
Communications Sub Committee –‘Engineering Integrity’ Journal of the EIS
Honorary Editor
Spencer Jeffs
Managing Editor
Rochelle Stanley
Sound & Vibration Product Perception Group
Chairman
David Fish, JoTech
Deputy Chairman
Keith Vickers, HBK
Members
Dave Boast, DB Engineering Solutions
David Bryant, Bradford University
Mark Burnett, HORIBA-MIRA
Max Chowanietz, Aston Martin
Martin Cockrill, RLE International
Paul Francis, JCB
Jonathan Joy, UTAC
Amir Khan, Bradford University
Andrew McQueen, Siemens
Alexander Shaw, Swansea University
Tony Shepperson, HEAD acoustics
James Wren, Spectral Dynamics
Ying Yi, University of Southampton
Simulation, Test & Measurement Group
Chairman
Steve Payne, HORIBA-MIRA
Deputy Chairman
Alex O'Neill, GCAPS (Global Center for Automotive Performance and Simulation)
Members
Jack Allcock, Tata Steel
Oliver Best, Williams F1
Connor Bligh, DEWESoft UK Ltd
Marc Brown, Vibration Research
Darren Burke, Servotest
Steve Coe, Data Physics (UK)
David Copley, Consultant
David Ensor, Engineering Consultant
Graham Hemmings, Engineering Consultant
Richard Hobson, Engineering Consultant
Jerry Hughes, Moog
Ben Huxham, Prosig
Shak Jamil, Techni Measure
Chris Johnson, Wacker Neuson UK Ltd
Virrinder Kumar, Engineering Consultant
Trevor Margereson, Engineering Consultant
Anton Raath, CATS3
Gary Rands, Siemens
Paul Roberts, HBK
Raul Rodriguez, Hyster Yale
Jarek Rosinski, Transmission Dynamics
Jason Truong, Safran
Darren Williams, UTAC
Rob Wood, ZEISS
Jeremy Yarnall, Data Acquisition and Testing Services Ltd
Durability & Fatigue Group
Chairman
Peter Bailey, Instron
Secretary
Jamie Shenton, JCB
Members
Hayder Ahmad, Safran
Andrew Blows, Jaguar Land Rover
Robert Cawte, HBK
Amir Chahardehi, Kent Energies
Hollie Cockings, Frazer Nash
Richard Cornish, Birmingham City University
Farnoosh Farhad, Northumbria University
Hassan Ghadbeigi, Sheffield University
Lee Gilbert, Element
Oliver Greenwood, Rolls-Royce
Angelo Maligno, IISE, University of Derby
Andrew Mills, Siemens
Giovanni De Morais, Dassault Systèmes Simulia
Giora Shatil, Darwind
Niall Smyth, Coventry University
John Yates, Engineering Consultant
Young Engineers Forum
Members
Rebecca Ellis, HBK
Sean Fitzakerley, The Open University
Olawale Kila, University of Northampton
Martin Muus, Rail Ability
Lazuardi Pujilaksono, University of Oxford
Committee members can be contacted via the Marketing & Events Manager, Tel: 01623 884225.
Corporate Member Profiles
CATS3
Unit 14, Insight Park, Welsh Road East Southam, CV47 1NE
Tel: +44 (0)2477 360202
Email: anton.raath@cats3.com
Website: www.cats3.com
Contact: Anton Raath
CATS³ (pronounced “Cats cubed”) is a leading specialist in design, development and supply of digital controllers and software for materials, components and structural integrity testing.
Used in many test laboratories around the world, our products are applied in simple single axis to high channel count multi-axis simulation test rigs. Working in close co-operation with the leading, global supplier ZwickRoell, we offer the perfect solution to new systems as well as controller/ software modernisations to give older generation systems a new lease of life. Despite the wealth of advanced functionality, extreme simplicity and ease of use are a key to our Control Cube servocontroller and Cubus software.
Dassault Systèmes SIMULIA
Willis House, Peel Street Sheffield, S10 2PQ
Tel: +44 (0)1925 830900
Email: Simulia.uk.info@3ds.com
Website: www.3ds.com/productsservices/simulia/
As an integral part of the Dassault Systèmes 3DEXPERIENCE platform, SIMULIA applications –including Abaqus, fe-safe, Isight, Tosca, SimpoeMold and Simpack – enable users to leverage physics-based simulation and high-performance computing to accelerate the evaluation and optimization of product performance, reliability and safety – before committing to costly and timeconsuming physical prototypes. fe-safe is at the forefront of durability analysis for FEA technology, interfacing with all major FEA software. With a focus on the accuracy of fatigue life predictions, regardless of the complexity of your analysis, fe-safe fits smoothly into your design process, enabling you to develop products that are designed for durability.
CoMech
Unit 1 Victoria Way Pride Park, Derby DE248AN
Tel: +44 (0)1332 867700
Email: sales@comech.co.uk
Website: www.comech.co.uk
Contact: Matt Pallett
CoMech provides calibration services to organisations across the UK. Our headquarters and laboratories are strategically situated at the heart of the UK in Derby. Our technicians are highly trained and adhere to the UKAS 17025 standards for calibration.
Starting in the rail sector, we have diversified our capabilities acquiring proficiency and knowledge across multiple industries such as aerospace, engineering, and food and beverages.
Data Physics (UK) Ltd
South Road Hailsham East Sussex BN27 3JJ
Tel: +44 (0)1323 846464
Email: stephen.coe@dataphysics.com
Website: www.dataphysics.com
Contact: Steve Coe
Data Physics is a total solution supplier of dynamic test equipment for noise, vibration and structural dynamics.
With a wide range of analysers, vibration controllers, electrodynamic shakers and high energy acoustic noise generators, Data Physics has a solution for virtually every form of dynamic testing requirement.
Datron Technology Limited
5-7 Potters Lane
Kiln Farm
Milton Keynes MK11 3HE
Tel: +44(0)1908 261655
Email: info@datrontechnology.co.uk
Website: www.datrontechnology.co.uk
Contact: Alex Exhareas
Datron Technology was formed in 1990 and has been supplying specialised vehicle test systems and sensors to all forms of automotive, rail and motorsport engineers. Our main area of expertise is non-contact sensors, offering accurate vehicle speed, slip-angle, pitch, roll etc. We also offer a wide range of sensors, data acquisition systems and analysis software that covers applications from motorcycles to F1 or HGV to railways. GPS has become a large part of vehicular testing and we have products that overcome GPS limitations with inertial solutions.
STFC Rutherford Appleton Laboratory
Harwell Campus, Didcot Oxford, OX11 0QX
Tel: +44 (0)1235 445000
Email: ralspaceenquiries@stfc.ac.uk
Website: ralspace.stfc.ac.uk/Pages/ Space-Test-Facilities
Contact: RAL Space Business Development Team
RAL Space is the space hub for UK Research and Innovation, supporting its mission to create the best possible environment for research and innovation to flourish. RAL Space offers state-of-the-art facilities for the design, build, and test of space hardware and instruments.
The facilities at RAL Space have been created to meet the comprehensive and exacting needs of customers and collaborators, providing capabilities for the needs of the next generation of spacecraft and instruments. We are certified to ISO 9001:2015.
HORIBA MIRA Ltd
Watling Street
Nuneaton
Warwickshire
CV10 0TU
Tel: +44(0)247 635 5000
Email: miraenquiries@horiba-mira.com
Website: www.horiba-mira.com
Contact: Kristy Thompson, Marketing Manager
HORIBA MIRA is a highly customer-focused, world-class, independent vehicle engineering consultancy, shaping everything we do around the partnerships we create. We harness the skills, experience and knowledge of our talented experts to provide our customers with intelligent solutions to their challenging problems. HORIBA MIRA offers full system design, test and integration expertise to the global automotive, defence, rail and transport industries. HORIBA MIRA’s technical facilities provide a truly global centre of excellence from which to innovate, engineer, test and implement market-changing solutions.
Servotest Testing Systems Ltd
Unit 1, Beta Way
Thorpe Industrial Estate Egham TW20 8RE
Tel: +44 (0)1784 274410
Email: info@servotestsystems.com
Website: www.servotestsystems.com
Contact: Darren Burke
Servotest design, manufacture and supply servohydraulic systems for motion simulation, characterisation and endurance testing. Bespoke solutions can be provided for special testing requirements. The systems provided cover a wide spectrum of applications including, for example: Damper testing, 4 and 7 post vehicle test rigs, MAST systems for automotive and earthquake simulation, high-temperature highrate deformation of materials and many more. The equipment includes hydrostatic bearing actuators, test frames, hydraulic supply and distribution, Pulsar digital controllers for single and multi channel requirements.


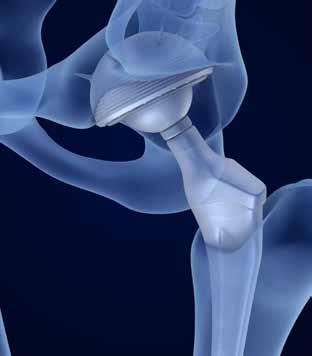


Changing the World of High Channel Count Vibration Testing
Designed to specifically address high channel count testing challenges, the Data Physics 900 Series platform suffers none of the shortcomings inherent in competitive systems. Up to 72 channels per chassis. Combine and configure any number of chassis together in seconds. Run thousands of channels with zero data bottlenecks. Industryleading phase synchronization delivers the most true-to-life data. Scan the code for more.
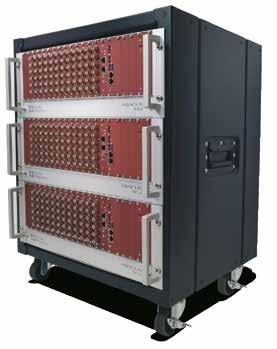
Model 912 shown