The way we produce, distribute, and consume food has evolved dramatically over time, shaped by technological advancements, cultural shifts, and economic transformations. This chapter explores the historical milestones that have defined our modern food systems, from ancient agricultural practices to the industrialization of food production. We will examine key moments such as the Green Revolution, the rise of global food supply chains, and the transition from local markets to multinational food empires. Understanding this historical progression provides insight into how past innovations and challenges have shaped the present, offering valuable lessons for the future of food sustainability and security.
This section explores the socioeconomic impact of food, examining how accessibility, affordability, and industry practices affect communities. Additionally, we analyze the health and environmental consequences of food production and consumption, from nutritional disparities to sustainability challenges. To illustrate successful approaches, we present case studies of innovative foodscapes that promote equitable, resilient, and sustainable food systems.
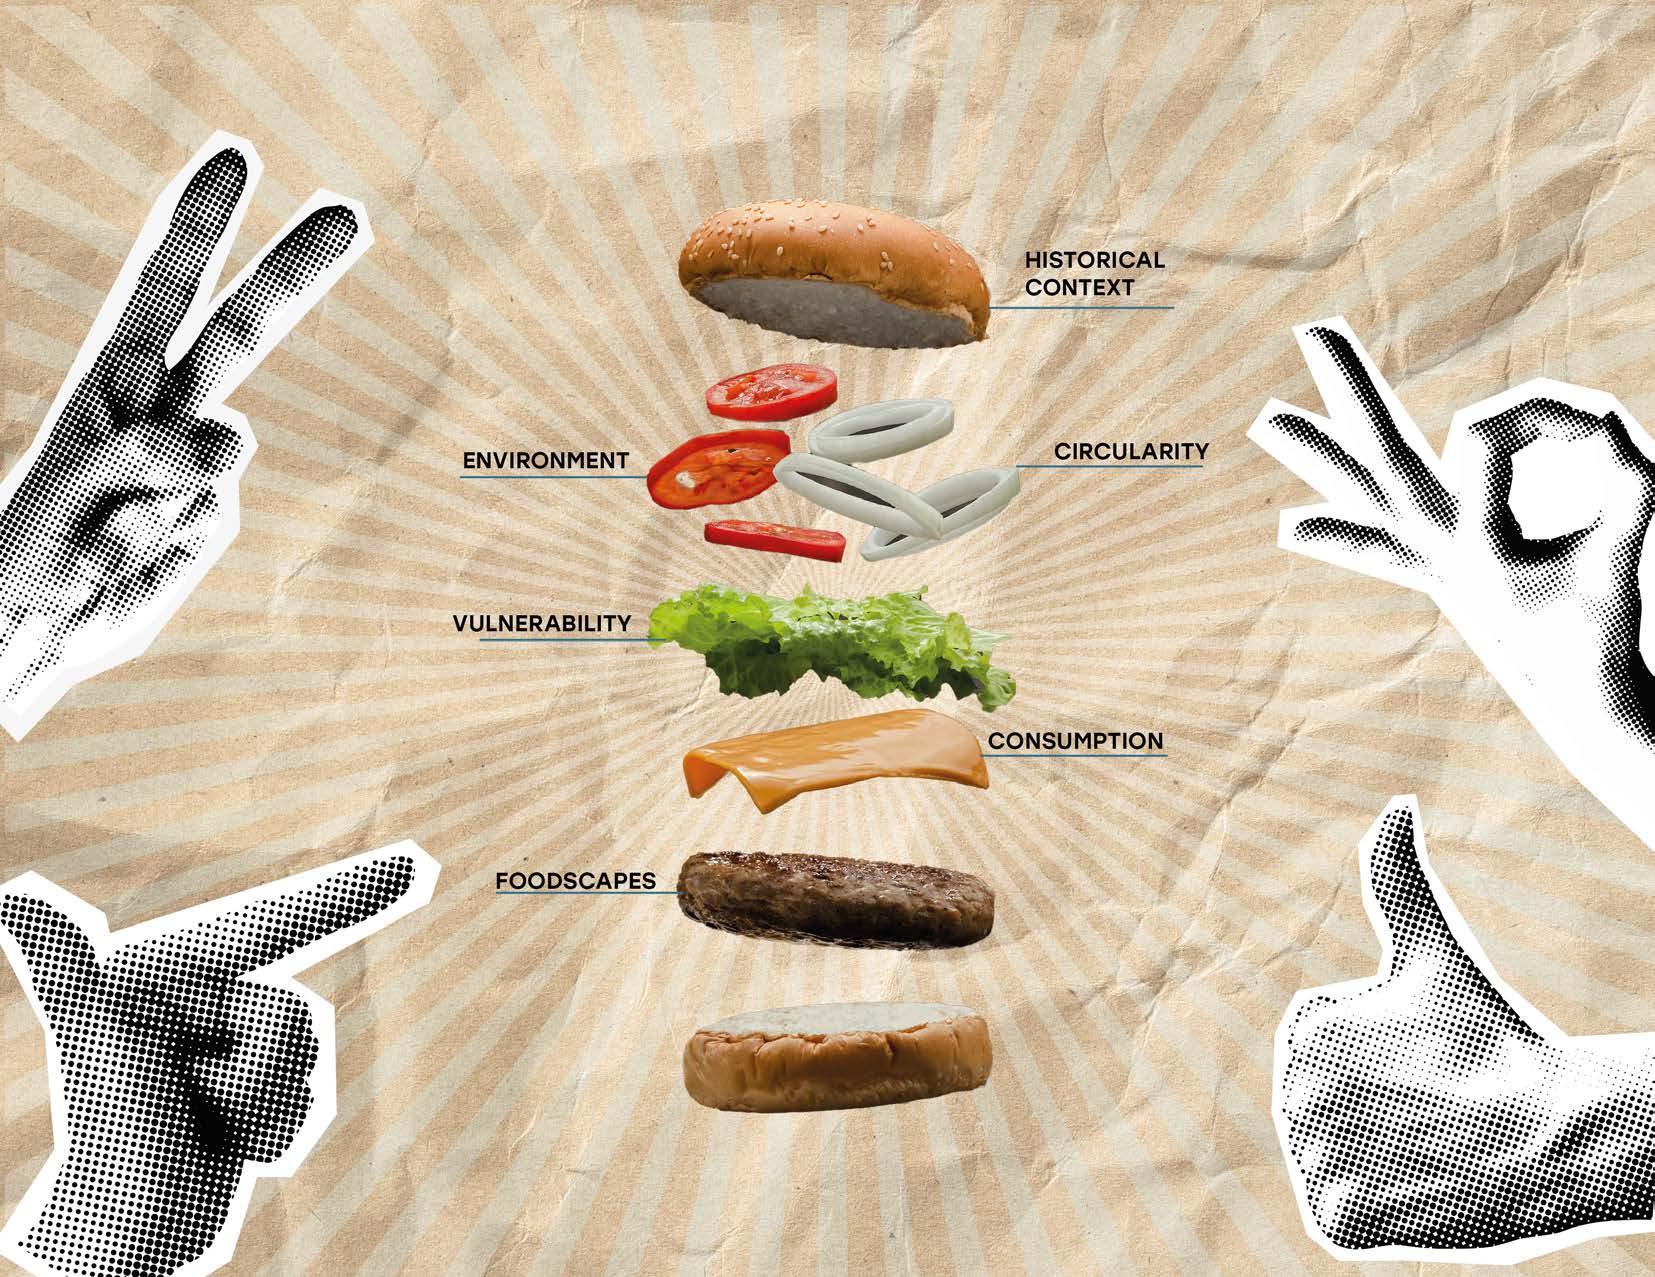
FOODSCAPES
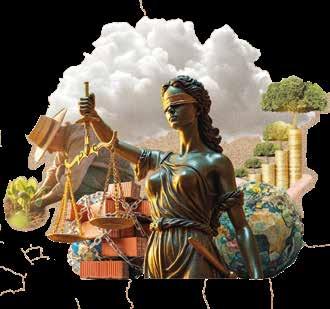
Foodscapes are defined as the spaces and systems where food is produced, distributed, prepared, and consumed. These include farms, markets, restaurants, and waste management facilities. These foodscapes reflect a variety of cultural traditions, social interactions, economic and political influences, such as policies and accessibility. Additionally, foodscapes impact the environment through agriculture, waste, and sustainability efforts. Regardless of scale, foodscapes shape communities’ relationships with food and are crucial for urban planning, sustainability, and public health.
Figure # . Foodscape. Collage by Natalia Vega
“GREEN REVOLUTION”
1. 500,000 B.C. - Hunter-gatherers consumed fruits, roots, vegetables, and game meat. Fire is discovered, revolutionizing food preparation.
2. 9000 B.C. - Domestication of sheep leads to early consumption of dairy products.
3. 8000 B.C. - Development of agriculture and livestock farming, with a diet primarily based on whole grains. First domestication of pigs in China.
4. 4000 B.C. - 1800 B.C. - In Ancient Egypt, agriculture, livestock, hunting, and fishing were practiced. Trade of oil and wine. Discovery of cereal fermentation; the wheel and metals begin to be used to make agriculture and livestock farming more efficient.
5. 1200 B.C. - The pyramid of Chichén Itzá is built.
6. 900 B.C. - 1400 A.D. - Mesoamerican civilizations domesticated chili peppers, avocados, squash, corn, and beans.
7. 776 B.C. - In Ancient Greece, the diet consisted of grains, beef, goat, pork, milk, cheese, and salt.
8. 100 A.D. - The oldest surviving Roman cookbook, *De Re Coquinaria*, is written.
9. 476 A.D. - 1492 (Middle Ages) - Food consumption was divided between kings, aristocrats, and nobles, and that of peasants, with a significant difference in quality and availability.
10. 765 A.D. - The first restaurant is established in Paris, changing the gastronomic experience.
11. 1492 - Christopher Columbus' voyages introduce foods like tomatoes, potatoes, and cacao to Europe.
12. 1519 A.D.- Hernán Cortés’ expedition arrives in Veracruz, Mexico.
13. 1521 A.D. - The Spanish conquest introduces wheat, rice, chickpeas, pork, sheep, chickens, eggs, wine, distilled spirits, milk, and dairy products to Mexico.
14. 1650 - The first café in Europe (Oxford) opens, marking the beginning of coffee culture.
15. 19th Century - Agricultural revolution with new technologies and food preservation methods.
16. 1800 A.D. - French influence introduces sweet bread and chocolate to the Mexican diet, alongside the Trigarante Army.
17. 1810 - Nicolas Appert invents canning, revolutionizing food preservation.
18. 1821 A.D. - The story of *Chiles en Nogada* becomes popular during Mexico’s nationhood.
19. 1893 - The first hamburger is sold at the Chicago World's Fair.
22. 1920 - 1921 - Álvaro Obregón decrees the creation of the SEP (Secretary of Public Education), influencing milk and sugar consumption in Mexico.
23. 1921 - The ketogenic (keto) diet is developed as a treatment for epilepsy.
24. 1929 - Coca-Cola arrives in Mexico City through the Mundet bottling company and in Guadalajara via La Favorita.
25. 1940 - The first drive-thru opens, allowing food purchases without leaving the car.
26. 1949 - The first McDonald’s restaurant opens in San Bernardino, California.
27. 1960 - Processed foods like instant noodles and frozen meals become household staples.
28. 1978 - The first OXXO store opens in Monterrey, Nuevo León.
29. 1980 - The *Slow Food* movement is born in Italy. Increase in processed food consumption and decline in fresh food intake.
30. 1980 - 1982 - Peso devaluation and advancement of food industrialization in Mexico.
31. 1980 - 1990 - Rise of the fitness industry in Mexico.
32. 1982 - Development of genetically modified crops, transforming food production.
33. 1985 - The first McDonald's in Mexico opens in Mexico City.
34. 20th Century- Mass food production and distribution in Western countries, leading to increased obesity.
35. 1988 - 1994 - Presidency of Carlos Salinas de Gortari: globalization of food through the signing of the North American Free Trade Agreement (NAFTA).
36. 1998 - Rise of *light* (low-calorie) products.
37. 2000 - 2006 - Vicente Fox increases taxes on food and medicine.
38. 2002 - Starbucks arrives in Mexico, operated by Alsea (company behind Domino’s, Burger King, Vips, among others).
39. 2006 - 2012 - Felipe Calderón implements a plan to combat the food crisis and poverty.
40. 2011 - Lab-grown meat is created for the first time.
41. 2012 - Enrique Peña Nieto announces the *National Crusade Against Hunger*. The Sustainable Development Goals (SDGs) are introduced.
42. 2013 - The first synthetic hamburger is presented.
43. 2014 - 2015 - Food delivery platforms such as Uber Eats and Rappi emerge.
44. 2015- Rise in popularity of plant-based meat substitutes.
45. 2019 - 2023 - The COVID-19 pandemic drives the consumption of fresh and home-cooked foods. A new food labeling system is implemented in Mexico.
46. 2020- Alternative proteins, such as insect-based foods and lab-grown meat, become a trend.
HOW IT WORKS
1. High-Yield Varieties (HYVs) – Specially bred crops that produce more grains per plant.
2. Chemical Fertilizers & Pesticides – Boost soil nutrients and protect against pests.
3. Irrigation Techniques – Advanced irrigation systems ensure crops get sufficient water.
4. Mechanization – Use of tractors, harvesters, and other machines increased efficiency.
5. Multiple Cropping – Growing more than one crop per year on the same land.
POSITIVE IMPACT
1. Increased Food Production – Global agricultural output surged, preventing widespread famines.
2. Economic Growth – Many farmers, especially in countries like India and Mexico, experienced increased income.
3. Population Growth Support – Higher food production helped sustain a rapidly growing population.
4. Higher Crop Yields – Crops like wheat and rice saw significant yield increases.
5. Food Security – Reduced hunger and malnutrition in many developing nations.
6. Technological Advancements – Introduced modern farming tools, irrigation systems, and genetically improved seeds.
7. Economic Development – Strengthened agricultural economies, leading to rural job creation.
NEGATIVE IMPACT
1. Social Inequality – Large landowners benefited more than small farmers, widening economic disparities.
2. Soil Degradation – Overuse of chemical fertilizers reduced soil fertility.
3. Water Crisis – Excessive irrigation led to groundwater depletion.
4. Loss of Biodiversity – Farmers abandoned traditional crops in favor of high-yield varieties.
5. Health Issues – Chemical pesticides and fertilizers have caused health problems in farmers.
THE GREEN REVOLUTION TRANSFORMED GLOBAL AGRICULTURE, CHANGING HOW FOOD IS GROWN, DISTRIBUTED, AND CONSUMED. IT INTRODUCED NEW TECHNOLOGIES AND FARMING METHODS THAT RESHAPED ECONOMIES, SOCIETIES, AND THE ENVIRONMENT.
Figure # .Green Revolution . Collage by Ivanna de la Torre
WORLD POPULATION (2023)
8.062 billion
30 MILLION CHILDREN grow up poor in the richest countries in the world
127 MILLION TONS OF PRODUCED FOOD
Food for 36 million people
1/3 OF FOOD IS WASTED
780 million people are hungry worldwide
while 34.3 million remain hungry.
The world’s population surpassing 8 billion and heading toward 9.7 billion by 2050 is intensifying pressure on food, water, and resources. Despite producing enough food for 10 billion, 780 million still face hunger due to unequal distribution, waste, and economic barriers. Conflicts, inefficient agriculture, and environmental damage exacerbate the issue, with one-third of food wasted. Without urgent reforms, 2 billion could suffer from hunger by 2050.
The food system, while supporting 1 billion jobs and contributing 10% to GDP, is a major driver of climate change, deforestation, and biodiversity loss, accounting for 35% of emissions and 70% of water use. As arable land diminishes and farmers struggle, sustainable solutions such as improving agricultural efficiency, reducing waste, and implementing fair food policies are critical to feeding the growing population without further harming the planet.
Figure # World Today. Collage by Valentina Bottle
FOOD EMPIRE CHAINS
The global food system, dominated by multinational corporations, prioritizes profit over sustainability, nutrition, and equity. Corporate control has led to monoculture farming, patented seed dependency, and the marginalization of small farmers, replacing traditional food practices with mass-produced, processed alternatives. Industrialized agriculture disconnects consumers from food sources, exacerbates waste, and worsens global food inequalities.
Food scarcity is exploited in conflicts, while subsidies and deregulated markets in wealthy nations drive overproduction and inefficiency. This system fuels environmental destruction, threatens food security, and deepens inequality. Urgent reforms are needed to curb corporate dominance, promote sustainable agriculture, and ensure fair food distribution.
The Global Food System Map, created by the National Academies of Science, Engineering and Medicine, is a profound representation of the sheer complexity and interconnectivity that define the modern food system. It is not just a static diagram but a dynamic model that exposes the intricate relationships between agriculture, economics, environment, and society. Every element— whether it be food production, supply chains, or consumer behavior—is deeply intertwined with global forces such as climate change, trade policies, technological advancements, and resource availability. The map’s value lies in its ability to visualize these dependencies, demonstrating how even minor shifts—like a drought in one region or a change in consumer preference — can have cascading effects across the entire global food network. It highlights how food is not merely a commodity but a complex system of flows, pressures, and interactions that require a deep understanding to manage effectively.
At its core, the map reinforces the undeniable importance of food as the foundation of human survival, economic stability, and ecological balance. With food accounting for half of the bio-economy’s revenue, it is not just a necessity but a driving force of global development. The way food is produced, distributed, and consumed determines not only nutrition and health but also social equity, geopolitical stability, and environmental sustainability. By mapping out these intricate connections, this tool provides a crucial framework for decision-makers to address food security, sustainability, and economic resilience. It is a stark reminder that food is not just about feeding people—it is the backbone of civilization, and understanding its complexity is essential for shaping a more sustainable and equitable future.
Figure Global Food System Map. Edited by Ivanna de la Torre
Figure # . Food Journey. Collage bVlentina Bottle
The food cycle was once a simple, natural process that sustained life for centuries. Before industrialization and the Green Revolution, people grew food using natural soil fertility, consuming what they harvested, and returning organic waste—such as food scraps, manure, and plant material—back to the land. This cycle enriched the soil, allowing new crops to grow each season without depleting nutrients. Farmers understood the importance of maintaining soil health, often using composting and manure to keep the land fertile. This balance ensured food production remained sustainable for generations. However, with industrial agriculture and modern waste disposal, much of this organic matter is now discarded instead of recycled, disrupting the natural cycle and depleting soil fertility.
Figure # . Food Journey. Collage By Ivanna de la Torre
Food systems have become increasingly complex over time, shaped by technological advancements, globalization, and evolving consumer demands. What once was a simple process of planting, harvesting, and consuming has now expanded into a vast, interconnected system involving large-scale farming, food processing industries, extensive transportation networks, and global supply chains.
The journey begins with planting seeds, tending crops, or raising livestock—activities that require significant resources, technology, and sustainability efforts. Once food is harvested, it undergoes processing to enhance preservation, safety, and convenience before being packaged for distribution. From there, it travels long distances via trucks, trains, or ships to reach supermarkets, restaurants, and markets worldwide.
Upon purchase, food enters yet another stage: preparation. Whether cooked at home, served in restaurants, or turned into ready-to-eat meals, the process of washing, chopping, and cooking is essential before food reaches the plate. But the journey doesn’t end there. After cooking and preparation, food waste, packaging materials, and residues from cleaning products contribute to environmental pollution. These discarded materials often make their way into landfills, waterways, and even the ocean, impacting marine ecosystems and adding to the growing issue of waste management.
Despite modern advancements, food production remains a labor-intensive and resource-demanding process, one that links agriculture, industry, transportation, and waste management. Each meal represents not just nourishment but the culmination of a vast, intricate network that spans the globe.
3
TYPES OF FOOD ENVIRONMENTS
Consumer (store availability, price, nutrition information) Community (stypes of outlets, accesibility)
Organizational (home, school or work)
Vendor / product properties and convenience (quality, safety, level of processing, shelf life, packaging, time allocation, preparation facilities)
THE ROLE OF FOOD ENVIRONMENTS
4
DIMENSIONS OF FOOD ENVIRONMENTS
Prices and affordability (cost of products and purchasing power)
Marketing, regulation and desirability (branding, advertising, sponshorip, labelling)
Availability and (distance, tim daily
mobili individual activi
Figure # . The Role of Food Enviorments. Collage by Valetina Bottle
and accesibility time, space, mobility, activity spaces)
Spatial (diversity of urban foodscapes and impacts on diet and health)
4 APPROACHES OF FOOD ENVIRONMENTS
Social and cultural (foodscapes are socially shaped and highlight structural inequalities)
Behavioral approaches (perceptions of foodscapes and food behaviors)
System approaches (global corporate food regime and local, ethical, sustainable food networks)
Food environments significantly influence dietary behaviors by shaping what people eat and how they access food. Supermarkets provide healthier options like fresh produce, while fast-food outlets and convenience stores often promote processed, calorie-dense foods.
Low-income neighborhoods frequently face food deserts and food swamps, limiting access to nutritious food and increasing reliance on unhealthy options. Beyond access, factors such as affordability, marketing, and cultural preferences also impact food choices. Processed foods are typically cheaper and more heavily advertised, making them more appealing, especially to those with limited financial resources. Even when healthy foods are available, cost and convenience often drive people toward less nutritious options.
To improve public health, interventions should address food environment disparities. Key strategies include expanding access to supermarkets, subsidizing healthy foods, regulating fast-food density, and offering nutrition education. These efforts can help promote healthier eating habits and reduce nutritional inequalities..
OBESITY
SOCIOECONOMICS & CULTURE
DIABETES CARBON ANIMAL PRODUCTS MALNUTRITION
CONSUMPTION
Figure # . Food System Branches. Diagram by Santiago Tello
SOIL EROSION
ENVIRONMENT
SOIL EXPLOTATION
SOIL RESTORATION
FOOD CIRCULARITY
CIRCULARITY
SUSTAINABILITY
Figure # . Use of Land in Food. Diagram by Valentina Bottle
Figure # . Soil. Diagram by Valentina Bottle
SOIL DEGRADATION
ENVIRONMENTAL IMPLICATIONS
Intensive farming depletes soil nutrients, reduces fertility, and increases erosion, making land less productive over time.
PLASTIC POLLUTION
Large amounts of fresh water
The food industry relies heavily on plastic for packaging, storage, and agricultural materials like mulch, contributing to plastic waste and microplastic contamination.
Food production requires vast amounts of water for irrigation and processing, often leading to water depletion and contamination of water bodies with fertilizers, pesticides, and animal waste.
Greenhouse gas Emissions
PESTICIDE CONTAMINATION
Agriculture is a major contributor to climate change, emitting carbon dioxide from deforestation, methane from livestock, and nitrous oxide from fertilizers.
The widespread use of pesticides and synthetic fertilizers contaminates soil and water, harming beneficial organisms and disrupting ecosystems.
Enourmouse Land Use
DEFORESTATION
Expanding agricultural land leads to deforestation and destruction of natural habitats, reducing biodiversity and disrupting ecosystems.
Food production leads to deforestation as forests are cleared for crops and livestock, disrupting ecosystems and increasing carbon emissions.
Reducing Biodiversity
Expanding agriculture reduces habitats, causing species loss and decreasing biodiversity, which harms ecosystems.
Soil Degradation
Intensive farming depletes soil nutrients, reduces fertility, and increases erosion, making land less productive over time.
Plastic Pollution
The food industry relies heavily on plastic for packaging, storage, and agricultural materials like mulch, contributing to plastic waste and microplastic contamination.
Pesticide Contamination
The widespread use of pesticides and synthetic fertilizers contaminates soil and water, harming beneficial organisms and disrupting ecosystems.
Deforestation
Food production leads to deforestation as forests are cleared for crops and livestock, disrupting ecosystems and increasing carbon emissions.
The environmental impact of food production and consumption is a pressing issue, as it drives resource depletion, greenhouse gas emissions, and waste accumulation. Agriculture consumes significant amounts of water and energy, while food waste exacerbates climate change and biodiversity loss. These challenges are closely linked to how food is grown, distributed, and discarded, making it essential to rethink our food systems. Integrating sustainability into food practices can help mitigate environmental harm, reduce waste, and promote more responsible consumption within existing foodscapes.
Plastic pollution is a growing crisis, with 9.2 billion tons produced and only 9% recycled. Single-use plastic, especially packaging, is a major contributor due to its short lifespan. If trends continue, plastic production will quadruple by 2050, worsening environmental damage and microplastic contamination. Urgent action is needed to reduce waste and improve recycling.
Seafood: Fish & marine life consume microplastics Crops: Plastics in soil & water absorbed by plants Packaged Food: Plastic leaches from containers
Humans consume plastic through food & water Health risks: toxic chemicals, hormonal imbalances, inflammation
Figure # . Plastic Pollution. Diagram by Ivanna de la Torre
Food transportation plays a significant role in global greenhouse gas emissions, with food traveling an average of 1,500 miles from farm to plate. This long-distance shipping relies heavily on fossil fuels, increasing carbon emissions and contributing to climate change. Studies show that eating locally and seasonally can reduce food-related emissions by 5-7 times, as it eliminates the need for extensive transportation and refrigeration. By supporting local farmers and choosing seasonal produce, we can lower our carbon footprint, promote fresher and healthier food, and take a meaningful step toward a more sustainable food system.
Figure # . Transportation. Diagram by Ivanna de la Torre
The percentage of people using at least basic dinking waterservices
The percentage of people using at least basic santitation services.
Degree of IWRM implementation (1 - 100).
Annual freshwater withdrawls, total (% of internal reasources).
Renewable Internal freshwater reasources per capita(cubic meters).
Enviroumental flow requirements (106 m3/ annum).
Average precipitation in depth (mm per year)
Access to electricity (% of population).
Electric power consuption (KWh per capita).
Renewable energy consumption (% of total final energy consumption).
Renewable electricity output (% of total electricity output).
CO2 emissions (metric ions per capita).
Energy imports, net (% of energy use).
Prevalence of undernourishment (%).
Average protein supply (gr/bodyweight/day).
Percentage of children under 5 years of age affected by wasting (%).
Percentage of children under 5 years of age who are stunted (%).
Prevalence of obesity in the adult population (18 years and older).
Cereal yeld (kg per hectare).
Average dietary energy supply adequacy (ADESA) (%).
Average value of food production ($ per capita).
Figure # . Water Enery Food Nexus . Diagram by Natalia Vega
Figure # . WaterCrisis. Collage by Natalia Vega
2.4 billion people now live in countries confronting water stress and almost 40 percent of global croplands already experience water scarcity.
All told, agriculture accounts for 72 percent of global freshwater withdrawals — amounting to nearly 3,000 cubic kilometers of water — taken from the world’s rivers, lakes, and groundwater aquifers each year.
Crop production is directly linked to transpiration levels, with greater production requiring more water.The evapotranspiration (ET) process, involving evaporation and transpiration, is a significant factor in crop yield. It takes between 500 and 4,000 liters of ET to produce one kilogram of grain.When this grain is used as animal feed, producing a kilogram of meat requires even more water, ranging from 5,000 to 15,000 liters.
While the average adult requires just 2 to 5 liters of drinking water and 20 to 400 liters of water for household use each day, in reality, individuals consume significantly more. On average, people use 2,000 to 5,000 liters of water per person per day. This figure is influenced by factors such as agricultural productivity and dietary habits.
Molden, David, Charlotte de Fraiture, and Frank Rijsberman. “Water Scarcity: The Food Factor.” Issues in Science and Technology 23, no. 4 (Summer 2007).
Mexico’s footprint is high, indicating alarming water scarcity. This issue is currently impacting the country, but it will be even more relevant for future water use.
AgroDer, 2012. The Water Footprint of Mexico in the context of North America. WWF Mexico and AgroDer. México DF
AgroDer, 2012. The Water Footprint of Mexico in the context of North America. WWF Mexico and AgroDer. México DF
GREEN WATER FOOTPRINT
RAIN WATER
Water from precipitation stored in the soil and evaporated, transpired and incorporated by plants. Amount of water needed to purify contaminants.
BLUE WATER FOOTPRINT
IRRIGATION WATER
Surface water or groundwater found in lakes, rivers, and aquifers.
GREY WATER FOOTPRINT
CONTAMINATION
Amount of water needed to purify contaminants
The spatial distribution of the green, blue, grey, and total water footprint (WF) in Latin America and the Caribbean (LAC) varies across the region’s major river basins. The Paraná Basin has the largest WF, reaching 336 billion m³ per year, representing 19% of the total. Other significant river basins include the Amazon (73 billion m³/year), Salado (52 billion m³/year), Uruguay (48 billion m³/year), Magdalena (36 billion m³/year), and Tocantins (34 billion m³/year). Together, these six basins account for approximately 50% of the total WF of production in LAC.
Regarding the blue water footprint, the largest is also found in the Paraná Basin, accounting for 10% of the total within the region. The Amazon, Santiago, and Uruguay basins also have a high blue WF, each contributing 4% of the total.
Figure 2.The green, blue, grey and total water footprints within Latin America & Caribbean (1996-2005). The data are shown in mm/y on a 5 by 5 arc minute grid. Data source: Mekonnen and Hoekstra (2011b).
indicates mounting pressure on global water resources, posing challenges for both rural farming communities and urban areas dependent on these food supplies.
Figure # . Food time . Collage by Valentina Bottle
The water footprint of food varies significantly between animal products and crops, with animal agriculture generally demanding more water. Beef production and consumption, in particular, require a concerning amount of water due to the resources needed to grow feed, provide drinking water for cattle, and process meat. In contrast, vegetables like lettuce, tomatoes, and potatoes use considerably less water, making them more sustainable choices in terms of water usage. This disparity underscores the importance of promoting plant-based diets and adopting water-efficient agricultural practices to address the growing strain on global water supplies, especially as urban food demand continues to rise.
Bovine
Figure # Food time . Collage by Valentina Bottle
Circularity in food systems focuses on creating a regenerative cycle where resources are continuously reused and waste is minimized. This chapter delves into innovative approaches such as composting, regenerative agriculture, and food waste reduction strategies that contribute to a more efficient and sustainable food chain. We will also explore how traditional agricultural practices once maintained natural balance and how modern industrial food systems have disrupted these cycles. By reintroducing circular principles, we can work toward a more resilient and less wasteful approach to food production and consumption.
Stage 0: Germination, Sprouting Or Bud Development
Germination, sprouting and bud development are part of the primary growth phase of the plant, require adequate water, temperature and oxygen, and can deplete their nutritional reserves without additional fertilization.
At this stage of plant growth, genuine leaves, essential for photosynthesis, are produced and require fertilization to ensure healthy growth.
The tillering is the stage in which new vertical shoots are formed next to the initial shoot, increasing the number of “daughter plants” and developing articulated stems with nodes and internodes.
Plant senescence, marked by cellular alterations and metabolic changes, is influenced by environmental factors such as photoperiod and temperature, and can be modulated by hormonal treatments in annual crops.
During this ripening stage, the increase in ethylene activates the production of enzymes that modify the color, texture, flavor and aroma of the fruit, facilitating ripening.
Stage 9: Senescence, Beginning Of Dormancy
Stage 8: Fruit and Seed Ripening
Stage 1: Leaf Development
Stage 2: Side Shoot Formation Or Macollation
Figure # . Food time . Collage by Natalia Vega
Stage 3: Longitudinal Stem Growth or Rosette Growth, Shoot Development
Indeterminate growth allows stems and roots to continue to develop throughout the life of the plant, influenced by temperature and with variations according to the species.
At this stage, the fruit develops from the ovary after fertilization, passing through four stages until ripening, where phosphate and potassium are key to improving quality and yield.
Stage 4: Development of Harvestable Vegetative Parts of the Plant or Propagation Organs
Stage 5: Inflorescence (Main Stem) Emergence or Spiking
The vegetative stage is characterized by the development of strong stems and abundant green leaves, essential for photosynthesis, and benefits from the use of nitrogen fertilizers for vigorous growth.
At this stage, flowering plants develop their reproductive structures, a process influenced by gibberellin, temperature and photoperiod, with potassium as a key nutrient for flowering and fruiting.
Stage 6: Flowering
Stage 7: Fruit Development
Food waste represents a significant environmental challenge; however, it concomitantly presents opportunities for innovation and economic benefits. By increasing awareness and education on the issue, businesses, producers, retailers, and consumers can implement effective strategies to reduce waste, lower costs, boost profits, and contribute to climate change mitigation. Integrating these solutions into foodscapes, where food production, distribution, and consumption intersect can create more sustainable and efficient food systems.
FOOD WASTE
The global estimate of food waste in 2022 was derived from per capita data and United Nations population statistics, although the lack of evidence on manufacturing waste prevented its full inclusion in the report.
The results show that approximately 1.05 billion metric tons of food will be wasted in 2022 across three key sectors: households, foodservice and retail. This equates to an average of 132 kilograms per person per year, with households contributing around 60% of the total waste, followed by foodservice at 28% and retail at 12%.
Figure # . Foodwaste. Collage by Natalia Vega
Programme, U. N. E. (2024, March 1). Food waste index report 2024. think eat save: Tracking progress to halve global food waste.
Tracking Food Storage
Businesses should utilize food waste tracking technology to identify financial losses resulting from wasted food.
Food Rescue System
A web-based platform facilitates the connection between surplus food and local needs, employing volunteers for distribution purposes.
Consumer and Producer Education
Educating the public on the value of food and waste through programs, particularly in educational institutions, raises awareness.
Food handling and processing infrastructure
Prioritize upcycling food (e.g., processing tomatoes into sauce) and enhancing infrastructure for transportation and storage.
Expanding composting alternatives
Local an statewide practices can significantly reduce landfill waste and save costs.
Effective and accessible on-farm storage
Facilities for farmers can reduce post-harvest losses, with potential financial support programs.
Upcycling products
Such as creating insect protein from organic waste, can reduce waste and enhance product value.
Secondary Markets
Farmers can collaborate with businesses offering direct food delivery services to control food production and reduce waste.
Farmers can donate excess produce with legal protections and incentives, helping to provide fresh food to those in need.
Food scraps can be used as animal feed, though methods like insect farming are needed to reduce methane emissions from livestock.
Figure # . Wasteoptions. Collage by Natalia Vega Lewis, J. (2024, March 5). 11 effective solutions for food waste. Earth.Org.
The global food system is marked by significant inequalities, leaving many populations vulnerable to food insecurity, malnutrition, and economic instability. This chapter investigates the factors that contribute to food vulnerability, including economic disparities, climate change, and political influences. We will explore how food access varies across different regions, the challenges of food deserts, and the consequences of an unequal distribution of resources. By understanding these vulnerabilities, we can identify solutions to build more equitable food systems that prioritize resilience and social justice.
Long & healthy life
DIMENSIONS
INDICATORS
- Life expenctancy at birth
Knowledge
- Expected years of schooling
- Mean years of schooling
Decent standard of living
- GNI per capita (PPP $)
DIMENSION INDEX
- Life expenctancy index - Education index - GNI index
HUMAN DEVELOPMENT INDEX
The Human Development Index (HDI) is a measure that evaluates a country’s average achievements in three key areas: health, education, and standard of living. It is calculated using the geometric mean of normalized indices for these dimensions. Health is assessed through life expectancy, education through years of schooling, and standard of living through gross national income (GNI) per capita. The HDI is useful for comparing development outcomes between countries with similar income levels and questioning policy choices. However, it does not account for inequalities, poverty, or empowerment, requiring additional indicators for a more comprehensive analysis.
To understand the context of the quality of life in our study area, it is important to have an overview of the HDI in Mexico and the world in order to understand the situation in Querétaro.
Mexico is ranked 77th in the world HDI ranking (out of 193). It is 8 positions away from reaching a very high level in the HDI (a group that includes countries such as Costa Rica, Uruguay, Argentina and Chile).
Food consumption is at the heart of human health, cultural identity, and economic stability. However, modern consumption patterns have led to rising health concerns, environmental degradation, and unsustainable demand for resources. In this chapter, we will examine the effects of processed foods, shifting dietary trends, and the growing divide between overconsumption and malnutrition. We will also discuss the role of food policies, education, and consumer awareness in shaping healthier and more sustainable consumption habits. By addressing these challenges, we can move toward a food system that nourishes both people and the planet.
Food is a fundamental component of human health, influencing physical growth, cognitive function, and overall well-being. However, modern food systems has lead to a increasing consumption of processed foods, often high in additives, refined sugars, and unhealthy fats, contributing to health risks. Socioeconomic factors like income, education, and food availability further influence dietary choices, exacerbating global health disparities. While some populations suffer from undernutrition, others are affected by obesity and chronic illnesses such as diabetes and cardiovascular diseases.
Figure # . Malnutrition. Collage by Valentina Bottle
Physical availability
Economic and physical access to food
Food Security
Food utilization
Stability of the other dimensions over time
Food security is defined when all people, at all times, have physical and economic access to sufficient safe and nutritious food that meets their dietary needs and food preferences for an active and healthy life.
GLOBAL SECURITY FOOD SECURITY SCORES
Map tracking Affordability, Availability, Quality and Safety and Sustainability and Adaptation of food by GFSI.
Map tracking Affordability, Availability, Quality and Safety and Sustainability and Adaptation of food
ZERO HUNGER END HUNGER, ACHIEVE FOOD SECURITY AND IMPROVED NUTRITION AND PROMOTE SUSTAINABLE AGRICULTURE
ZERO HUNGER GOAL AT RISK
Little to no progress has been made in reducing anemia worldwide since 2000
Prevalence of anemia in woman aged 15 - 49. Around 30% has remained stagnant.
More than 600 million people are projected to face hunger in 2030.
1/3 people worldwide struggle with moderate to severe food insecurity
High food prices continue to plague many nations (21.5% of countries)
Children under age -5 affected by:
Malnutrition persists worldwide, jeopardizing children’s well-being and future development.
STUNTING 148 M - WASTING 45 M - OVERWEIGHT 37 M
Food security remains a critical global issue, with millions facing hunger, undernutrition, and food insecurity. By 2030, over 600 million people are projected to be hungry, while 1 in 3 people currently experience moderate to severe food insecurity. Efforts to combat malnutrition have been slow, particularly in addressing anaemia among women aged 15–49, which has stagnated at 30% since 2000.
In 2023, approximately 281.6 million people in 59 countries faced a food crisis or worse, according to the Global Report on Food Crises (GRFC 2024). Chronic hunger affects 783 million people globally, with the highest rates in Africa and Asia, underscoring the persistent and widespread nature of global food insecurity. Infographic
about Hunger Crisis and the Sustainable Development Goals Report 2023: Special Edition.
A person’s diet plays a critical role in physical and cognitive development, especially during childhood. Poor nutrition in early life can lead to stunting, cognitive delays, and weakened Globally, 21.3% of children experience stunting, and 6.9% suffer from wasting due to insufficient nutrient intake.
Beyond childhood, malnutrition has lifelong consequences, including higher risks of chronic diseases, lower productivity, and economic burdens on healthcare systems. Societies with high levels of food insecurity often experience lower educational performance and reduced workforce efficiency, further perpetuating poverty cycles.
Noncommunicable diseases (NCDs), or chronic diseases, are longlasting conditions caused by genetic, physiological, environmental, and behavioral factors. The main types include cardiovascular diseases (heart attacks, strokes), cancers, chronic respiratory diseases (COPD, asthma), and diabetes. NCDs disproportionately affect low- and middle-income countries, accounting for nearly 75% of global NCD deaths (32 million), with 82% of premature deaths in these regions.
Key metabolic risk factors include unhealthy diets, physical inactivity, high blood pressure, elevated blood glucose, high blood lipids, and obesity. The rise of NCDs threatens poverty reduction efforts, especially in low-income countries, as healthcare costs increase. Vulnerable and disadvantaged populations are more affected due to limited access to health services.
Figure # . Impact of Food Health . Collage by Valentina Bottle
Infographic about Hunger Crisis and the Sustainable Development Goals Report 2023: Special Edition.
THE IMPACT OF FOOD ON HEALTH
Age-standardized DALY (Disability-Adjusted Life Year) rates per 100,000 individuals from non-communicable diseases (NCDs). One DALY equals one lost year of healthy life.
DALY rates from non-communicable diseases (NCDs), 2020
Age-standardized DALY (Disability-Adjusted Life Year) rates per 100,000 individuals from non-communicable diseases (NCDs). One DALY equals one lost year of healthy life.
Rates of obesity are rising, but still relatively low in debeloping
The world faces a double burden of malnutrition, where undernutrition and obesity coexist, highlighting global nutritional inequalities. In 2022, more than 2.5 billion adults were overweight, including 890 million who were obese, while 390 million were underweight. This paradox stems from inequities in food access - some populations face hunger and nutrient deficiencies, while others consume excessive calorie-dense, ultraprocessed foods that drive obesity and metabolic disease.
Obesity has increased globally, particularly in the Americas, Europe and Oceania, where more than 25% of adults are obese. Widespread availability of inexpensive processed foods and sedentary lifestyles accelerate weight gain and diet-related diseases. Studies, including NIH research, link ultra-processed foods to overeating and weight gain, underscoring the role of the food environment in rising obesity rates.
Diagram illustrating the randomized crossover experiment showing increased energy intake and weight gain during the ultra-processed diet phase compared to the unprocessed diet, despite matched calories and nutrients.
Northern Africa (FAO)
Southern Asia (FAO)
Sub - Saharan Africa (FAO)
World
South America (FAO)
South - eastern Asia (FAO)
Central Asia (FAO)
Undernourishment, a key sign of food insecurity, arises from inadequate intake of calories and nutrients, causing stunted growth, weakened immunity, and cognitive issues. Severe forms like marasmus and kwashiorkor are common in regions facing conflict, climate challenges, and economic instability, particularly in Sub-Saharan Africa and South Asia. While global rates have improved since the 1970s, progress has slowed, and hidden hunger persists when people consume enough calories but lack essential nutrients.
The FAO tracks undernourishment using calorie availability, energy needs, and calorie intake inequality via the Coefficient of Variation (CV). A high CV indicates uneven food distribution, with some populations overconsuming while many go hungry. In 2020, these inequalities remained significant, especially in low-income regions, underscoring the need for more equitable food access.
Chart with share of the population that is undernourished by Hannah Ritchie, Food and Agriculture
Organization of the United Nations (2023).
South Asia
West and Central Asia
Middle East and North Africa
East and Southern Africa
East Asia and the Pacific
Child malnutrition and childhood diabetes are global health challenges marked by significant disparities. Stunting and wasting impair growth, cognitive development, and immunity, with nearly half of child deaths under five linked to undernutrition, driven by food insecurity and poor sanitation. Childhood diabetes cases are rising globally, with 222,310 new cases in 2021. Although mortality and DALYs have declined due to better care, many regions still face a high disease burden due to healthcare inequities.
From 2019 to 2021, diabetes incidence grew, especially among children aged 5–9 years, with higher rates in young females. Despite improved management, low- and middle-income regions experience greater mortality and disease burden. Projections to 2045 show a slight global decline in incidence but ongoing regional and demographic disparities, underscoring persistent child health challenges.
Figure # Child Development . Collage by Valentina Bottle
The increased consumption of processed foods has led to a rise in the use of food additives, including preservatives, artificial flavors, and sweeteners. While these additives help extend shelf life and enhance taste, they have been linked to negative health effects such as obesity, diabetes, and metabolic disorders.
Certain food preservatives, such as sodium nitrite, have been associated with increased cancer risk, while sulfites can cause allergic reactions. To minimize risks, experts recommend reducing processed food intake and choosing natural preservatives such as salt and vinegar.
Improving global food security and health requires sustainable policies that promote nutritious, minimally processed foods. Governments must invest in local agriculture, regulate ultra-processed food marketing, and implement educational programs to encourage healthy eating habits.
CONCLUSIONS ON FOOD AND HEALTH
There are significant disparities in food security and health outcomes across different socioeconomic regions. Low-income countries continue to experience severe food insecurity, leading to undernourishment, child stunting, and developmental challenges that impact long-term economic growth. In middle-income nations, there is a double burden of malnutrition, where undernutrition persists alongside a rise in obesity and noncommunicable diseases (NCDs) due to increased consumption of processed foods. High-income countries, while having lower levels of food insecurity, face rising obesity rates and health risks associated with ultra-processed food consumption. Additionally, childhood malnutrition in countries such as India, Nigeria, and the Democratic Republic of Congo poses long-term consequences for workforce productivity and national development.
The research also highlights a global paradox where obesity and undernutrition coexist, affecting different populations in varying ways. In Africa and South Asia, undernutrition remains a dominant issue, leading to weakened immune systems and cognitive delays, whereas Latin America and the Middle East experience an increase in obesity despite ongoing food insecurity. North America and Europe struggle with high rates of obesity and diet-related illnesses due to the widespread consumption of processed and energy-dense foods. Furthermore, NCDs, once considered diseases of affluence, are now rapidly increasing in developing nations such as India, Brazil, Mexico, and Egypt, largely due to dietary shifts toward processed foods. The rise in ultra-processed food consumption globally is contributing to obesity, metabolic disorders, and long-term health risks, marking a shift in the global food crisis from scarcity to the impact of poor-quality diets.
Concluding Map of Food Security and its impact on Human Health according to socioeconomic factors. Created by author.
Food environments consist of various opportunities, conditions, and factors, such as physical, economic, political, and socio cultural elements that shape the relationship between people and the food system,
The distance food travels from where it is grown or raised to where it is
Community with easy access to affordable, nutritious food, and many grocery stores.
Food Oasis
Underserved areas with limited access to healthy and affordable food. On the other hand, food oases are areas with ample access to nutritious foods. Lastly, food swamps are locations where food is abundant, but the available options are typically high-calorie, unhealthy choices that overshadow healthier alternatives.
Food
Neighborhood where unhealthy food options, like fast food and convenience stores, outnumber access to fresh and nutritious foods.
Urban Food Landscapes
Spaces where food is produced, sold, and consumed in cities, including markets, restaurants, and gardens.
Food Desert
Swamps
Figure # . Food Definitions. Collage by Ivanna de la Torre
Figure # . Food Comparisons . Collage by Ivanna de la Torre
Physical Geography
Food production is based on diverse geographic characteristics, including soil composition, climate, terrain, land cover, access to fresh water, and seabed conditions.
Managment patterns
Methods farmers use to grow food, such as irrigation systems, tillage, and nutrient management.
Socioeconomic Influences
A broader perspective on the food system that considers market dynamics, distribution barriers, government policies, and the influence of local communities and cultures.
Figure # . FoodscapeLayers. Collage by Natalia Vega
Figure 1. Map of global foodscapes. Taken from Bossio et al. (2021, pp. 9-10, 98). Retrieved from https://www.nature.org/content/dam/tnc/nature/en/documents/TNC_FoodscapesReport.pdf
Over 80 unique foodscape classes shaped by biogeographic and sociocultural factors.
AREAS WITH LITTLE OR ONLY SUBSISTENCE FOOD PRODUCTION
ENTISOLS ON PLAINS WITH BARE LAND, LITTLE FOOD PRODUCTION AND GRASS COVER
ENTISOLS ON PLAINS WITH GRAZED BARE LAND AND GRASS COVER
ENTISOLS ON PLAINS WITH BARE LAND AND SCATTERED MIXED CROP PRODUCTION AND LOW NUTRIENT APPLICATION RATE
ENTISOLS ON DRY PLAINS AND LARGE CULTIVATED FIELDS AND LIVESTOCK
ENTISOLS ON DRY RAINFED PLAINS WITH LEGUMES AND PULSES PRODUCTION AND OCCASIONALLY OTHER CROPS
ENTISOLS ON DRY PLAINS AND BARE LAND WITH MIXED IRRIGATED CROP PRODUCTION
ENTISOLS ON DRY PLAINS AND BARE LAND WITH IRRIGATED VEGETABLE PRODUCTION AND HIGH NUTRIENT APPLICATION RATES
INCEPTISOLS ON HUMID HILLY TREE-COVERED LAND WITH SCATTERED CROP PRODUCTION
INCEPTISOLS ON HUMID MOUNTAINOUS LAND WITH TREE COVER AND SCATTERED MIXED CROP PRODUCTION
INCEPTISOLS ON HUMID HILLY-MOUNTAINS WITH TREE COVER AND SMALL FARMED MIXED AND INTENSIVE DIVERSE PRODUCTION
INCEPTISOLS ON HUMID FORESTED HILLS WITH INTENSIVE MIXED CROP PRODUCTION AND GRAZING
INCEPTISOLS ON HUMID HILLY MIXED TREE-COVERED LAND WITH RAINFED PERENNIAL CROPS AND OTHER LIVESTOCK
MIXED RAINFED HIGHLY PRODUCTIVE LAND WITH AGROFORESTRY AND DIVERSE CROPS
INCEPTISOLS ON HUMID LAND WITH INTENSIVE MIXED PERENNIAL TREE CROPS AND NON-RUMINANT GRAZING
INCEPTISOLS ON HUMID HILLY LAND WITH INTENSIVE MIXED LIVESTOCK AND OTHER CROPS GROWN WITH HIGH NUTRIENT APPLICATION RATES
MIXED URBAN AND PERI-URBAN AREAS WITH SOME AGRICULTURE AND LIVESTOCK
PERI-URBAN AREAS WITH MARGINAL AGRICULTURE AND LIVESTOCK
PERI-URBAN AREA INTERSPERSED WITH INTENSIVE IRRIGATED AGRICULTURE AND LIVESTOCK
OXISOLS ON HUMID TREE-COVERED LAND WITH LITTLE FOOD PRODUCTION
OXISOLS AND ULTISOLS ON HUMID TREE-COVERED LAND WITH SCATTERED CROPLAND AND LIVESTOCK
OXISOLS AND ULTISOLS ON HUMID HILLY TREE-COVERED LAND WITH AGROFORESTRY AND SOME LIVESTOCK
OXISOLS AND ULTISOLS ON HUMID TREE-COVERED LAND WITH DIVERSE SMALL FIELD PRODUCTION AND AGROFORESTRY
OXISOLS AND ULTISOLS WITH RAINFED PERENNIAL CROPS AND AGROFORESTRY AND SOME LIVESTOCK
OXISOLS AND ULTISOLS WITH MIXED GRAZING AND CROP PRODUCTION ON LARGE FIELDS
OXISOLS AND ULTISOLS WITH RAINFED PERENNIAL CROPS AND AGROFORESTRY AND HIGH NUTRIENT RATES AND LIVESTOCK
OXISOLS AND ULTISOLS ON LAND WITH HUMID RAINFED AND IRRIGATED PERENNIAL PRODUCTION AND OTHER MIXED CROPS AND LIVESTOCK
OXISOLS AND ULTISOLS ON HUMID IRRIGATED INTENSIVE PERENNIAL PRODUCTION AND OTHER MIXED CROPS AND LIVESTOCK
ULTISOLS ON HUMID TREE-COVERED LAND WITH LITTLE CROP PRODUCTION
ULTISOLS ON HUMID TREE-COVERED LAND WITH SCATTERED CROP PRODUCTION
ULTISOLS ON HUMID TREE-COVERED LAND WITH SCATTERED CROP PRODUCTION ON LARGE FIELDS
ULTISOLS ON HUMID TREE-COVERED LAND WITH DIVERSE CROP PRODUCTION
ULTISOLS ON HILLY AND MOUNTAINOUS TREE-COVERED LAND WITH DIVERSE CROP PRODUCTION AND HIGH NUTRIENT APPLICATION RATES
ULTISOLS WITH MIXED CROP AND LIVESTOCK PRODUCTION AND HIGH NUTRIENT APPLICATION RATES
ULTISOLS ON HUMID TREE-COVERED LAND WITH DIVERSE CROP PRODUCTION AND SOME LIVESTOCK
ULTISOLS WITH MIXED CROPS INCLUDING PERENNIALS AND LIVESTOCK PRODUCTION
ULTISOLS WITH INTENSIVELY CULTIVATED RAINFED AND IRRIGATED MIXED CROP AND LIVESTOCK PRODUCTION
ULTISOLS WITH INTENSIVELY CULTIVATED RAINFED AND IRRIGATED MIXED CROP AND LIVESTOCK PRODUCTION AND HIGH NUTRIENT APPLICATION RATES
ALFISOLS IN PLAINS AND GRASSLANDS WITH LITTLE CROP PRODUCTION AND GRAZING
ALFISOLS IN SHRUBBY PLAINS THAT ARE GRAZED WITH SCATTERED CROPLAND
ALFISOLS IN MIXED FOOD PRODUCTION LANDSCAPES WITH SCATTERED GRAZING
ALFISOLS IN MIXED DIVERSE CROP SYSTEMS ON SMALL FIELDS WITH SOME LIVESTOCK AND AGROFORESTRY AND LOW NUTRIENT APPLICATION RATES
ALFISOLS WITH MIXED CROP PRODUCTION, SOME RUMINANTS, AND HIGHER NUTRIENT APPLICATION RATES
ALFISOLS WITH RAINFED CROP PRODUCTION ON LARGE FIELDS WITH SOME LIVESTOCK
ALFISOLS WITH RAINFED DIVERSE CROP PRODUCTION WITH SOME LIVESTOCK
ALFISOLS WITH IRRIGATED INTENSIVE MIXED CROP PRODUCTION AND RUMINANTS
ALFISOLS WITH MIXED IRRIGATED INTENSIVE CEREAL PRODUCTION AND LIVESTOCK WITH HIGH NUTRIENT APPLICATION RATES
ALFISOLS WITH RAINFED INTENSIVE CEREAL PRODUCTION AND LIVESTOCK WITH HIGH NUTRIENT APPLICATION RATES
ANDISOLS ON BARE LAND WITH LITTLE CROP PRODUCTION
ANDISOLS ON HILLY LAND WITH LITTLE CROP PRODUCTION
ANDISOLS ON HILLY AND MOUNTAINOUS LAND WITH SPARSE CROP PRODUCTION AND RUMINANTS
ANDISOLS ON HILLY TREE AND SHRUB LAND WITH SCATTERED CROP PRODUCTION
HISTOSOLS AND SPODOSOLS ON WET MOUNTAINOUS LAND WITH LITTLE CROP PRODUCTION
SPODOSOLS ON HILLY TREE-COVERED LAND WITH SCATTERED CROP PRODUCTION
HISTOSOLS AND SPODOSOLS WITH RAINFED MIXED CROP PRODUCTION AND LIVESTOCK INCLUDING RUMINANTS
HISTOSOLS AND SPODOSOLS IN TREE-COVERED LANDSCAPES WITH SCATTERED CROP PRODUCTION ON LARGE FIELDS
HISTOSOLS AND SPODOSOLS ON MOUNTAINOUS LAND WITH GRAZING AND INTERSPERSED FOOD PRODUCTION
HISTOSOLS AND SPODOSOLS ON HILLY TREE-COVERED LAND GRAZED AND CULTIVATED WITH HIGH NUTRIENT APPLICATION RATE
HISTOSOLS AND SPODOSOLS ON INTENSIVELY CULTIVATED LAND WITH HIGH LIVESTOCK PRODUCTION
SPODOSOLS ON INTENSIVELY CULTIVATED LAND HIGH LIVESTOCK PRODUCTION AND NUTRIENT APPLICATION RATE
MOLLISOLS IN MOUNTAINOUS BARE AREAS WITH LITTLE CROP PRODUCTION AND GRAZING
MOLLISOLS IN MOUNTAINOUS-HILLY AREAS WITH LOW DENSITY LIVESTOCK GRAZING AND SCATTERED CROP PRODUCTION
MOLLISOLS IN MOUNTAINOUS-HILLY CULTIVATED LAND WITH GRAZING RUMINANTS AND RAINFED MIXED CROPS
MOLLISOLS IN HILLY CONVENTIONALLY TILLAGED CULTIVATED LAND WITH INTERSPERSED GRAZING
MOLLISOLS AND INCEPTISOLS IN PLAINS WITH IRRIGATED INTENSIVE CROP PRODUCTION
MOLLISOLS IN PLAINS WITH INTENSIVE IRRIGATED CEREAL AND OIL CROP PRODUCTION AND HIGH NUTRIENT APPLICATION RATES
MOLLISOLS IN INTENSIVE RAINFED CEREAL AND OIL CROP PRODUCING LAND WITH HIGH NUTRIENT APPLICATION RATES
MOLLISOLS IN PLAINS WITH INTENSIVE RAINFED LARGE FIELD WITH CEREAL AND OIL CROP PRODUCTION
MOLLISOLS IN PLAINS WITH INTENSIVE RAINFED CEREAL AND OIL CROP PRODUCING LAND THAT IS SINGLE CROPPED
VERTISOLS IN PLAINS WITH GRAZED SHRUBBY LAND AND SCATTERED MIXED CROP PRODUCTION
VERTISOLS IN PLAINS DIVERSELY CULTIVATED LAND AND INTERSPERSED GRAZING
VERTISOLS IN PLAINS WITH MIXED CROP AND LIVESTOCK PRODUCTION
VERTISOLS IN PLAINS WITH MIXED IRRIGATED AND RAINFED PRODUCTION WITH MIXED CROP PRODUCTION
VERTISOLS IN PLAINS WITH RAINFED INTENSIVELY CULTIVATED LAND WITH MIXED PRODUCTION AND SPARSE GRAZING
VERTISOLS IN PLAINS WITH LARGER INTENSIVELY CULTIVATED FIELDS WITH REDUCED TILLAGE
INCEPTISOLS ON BARE GRASSY LAND WITH SCATTERED GRAZING
INCEPTISOLS ON MIXED FOREST AND GRASSLAND
INCEPTISOLS IN HILLY GRASSY LAND WITH SCATTERED GRAZING AND MARGINAL CROP PRODUCTION
INCEPTISOLS IN MOUNTAINOUS BARE LAND WITH SMALL FIELDS AND TRADITIONAL TILLAGE
INCEPTISOLS IN FORESTED LAND WITH FEW SCATTERED LARGE FARMS AND LOW CROP DIVERSITY
INCEPTISOLS IN HILLY LAND WITH MIXED PRODUCTION OF CONVENTIONAL TILLAGE AND HIGH NUTRIENT APPLICATION
INCEPTISOLS IN ARID HILLY LAND WITH RAINFED CEREAL AND LEGUME PRODUCTION AND OTHER LIVESTOCK
INCEPTISOLS IN HILLS AND MOUNTAINS WITH IRRIGATED INTENSIVE MIXED CROP PRODUCTION
INCEPTISOLS IN HILLY SHRUBLAND WITH IRRIGATED INTENSIVE MIXED CROP PRODUCTION AND HIGH NUTRIENT APPLICATION
MAP KEY
These indicators, provided by The Nature Conservancy, serve to differentiate various types of foodscapes, offering insights into how food systems interact with nature. By analyzing these factors, we can better understand the dynamics of food production and consumption, enabling the development of more sustainable solutions that nourish the world while safeguarding the environment.
Environmental Factors – Biodiversity, emissions, soil carbon, water management.
Case Studies
HIGH-TECH RURAL GROCERY SHOPS
HIGH-TECH RURAL GROCERY SHOPS
SIERRA MIXE CORN
SIERRA MIXE CORN BIOACTIV
TOTONTEPEC, OAXACA, MEXICO
TOTONTEPEC, OAXACA, MEXICO
STOCKHOLM, SWEDEN STUTTGART, STOCKHOLM, SWEDEN
small shops fully automated, with no staff attending the point of sale, open 24 hours a day in regions without small groceries
SMALL SHOPS FULLY AUTOMATED, W TTENDING THE POINT OF SALE, OPEN 24 HOURS A DAY IN REGIONS WITHOUT SMALL GROCERIES
sierra mixe corn, grown in mexico, secretes nitrogen from its roots through bacteria, offering ecological benefits by reducing fertilizer use and water contamination
SIERRA MIXE CORN, GROWN IN MEXICO, SECRETES NITROGEN FROM ITS ROOTS THROUGH BACTERIA, OFFERING ECOLOGICAL BENEFITS BY REDUCING FERTILIZER USE AND WATER CONTAMINATION
CHARACTERIS
A NEW PACKA
BIOACTIVE PAPER
BIOACTIVE PAPER
20.606 LAW
20.606 LAW
STUTTGART, GERMANY
STUTTGART, GERMANY
a new packaging for transporting food and preserving its characteristics
A NEW PACKAGING FOR TRANSPORTING FOOD AND PRESERVING ITS CHARACTERISTICS
SANTIAGO DE CHILE, CHILE
SANTIAGO DE CHILE, CHILE
ur hted ood-
nating the abeling
chile’s labelling law has become a global model for food consumer protection
ING LAW HAS BECOME A GLOBAL MODEL FOR FOOD OTECTION
ion to t ound t re not essible healthy ons lik lds a ovative ome nies, su oactive rate environmental pollution These findings empha the ongoing challenges and creative solutions the food industry, accessibility, and sustainability
The battle across these foodscapes involves finding ways to balance sustainability, efficiency, and socioeconomic viability. Each innovation seeks to address waste reduction, resource optimization, and the promotion of healthier practices, but they all face challenges of scalability, cost-effectiveness, and industry resistance. What they achieve collectively is the demonstration that innovative, eco-friendly approaches can reshape agricultural and food systems, but their true potential hinges on overcoming the hurdles of large-scale implementation and regulatory support.
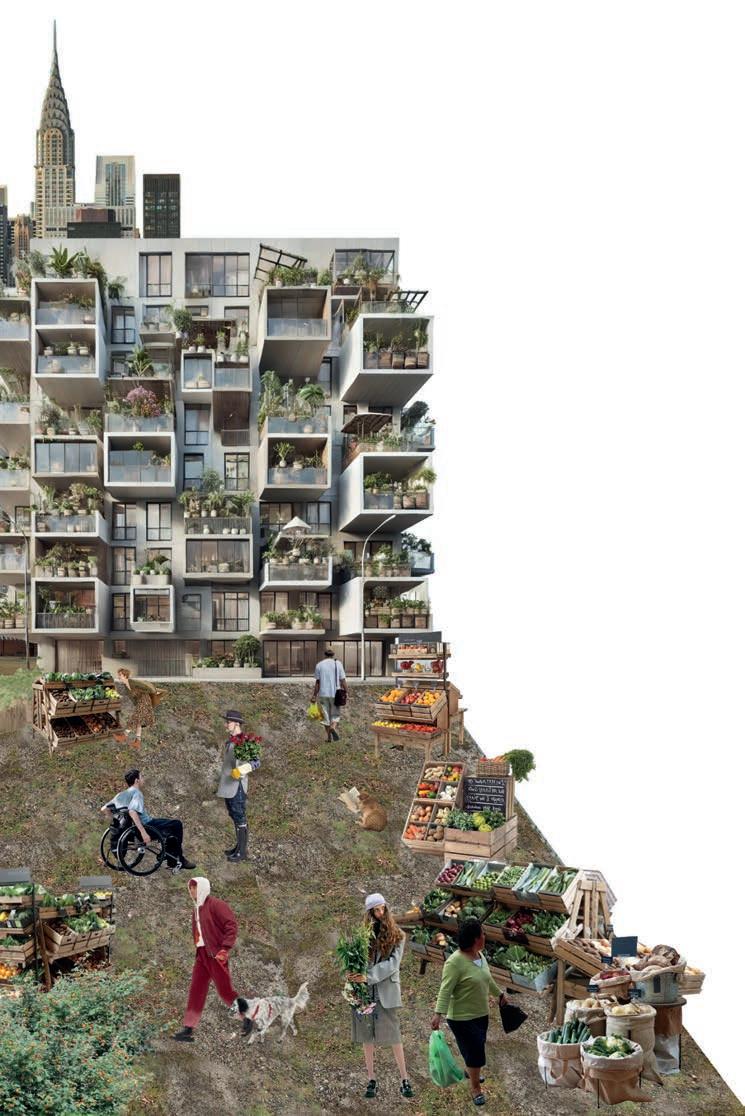
URBAN
Underutilized spaces are transformed into urban gardens, local markets, and food corridors, significantly reducing the time required for food transportation and introducing green landscapes to the urban environment.
ENVIRONMENT
Foodscapes are essential to counteract today's environmental problems It increases biodiversity, improves air and water quality and helps reduce the carbon footprint. Leading to more sustainable resource management and a resilient urban environment.
SOCIAL
Foodscapes represent a necessary change in today's urban lifestyle They create community spaces that promote social encounters and raise awareness of sustainable practices, encouraging engagement with their communities.
HEALTH
Urban agriculture improves access to fresh, nutritious food, reduces food deserts, helps prevent diet-related diseases and facilitates maintaining a healthy diet
ECONOMIC
Urban agriculture supports job creation in local food production, distribution, and sales while promoting affordable prices and a circular economy through organic waste reuse.
Foodscapes and urban agriculture respond to different environmental issues related to the food industry, climate change and soil erosion. We can see positive impacts on the following areas.
This section explores the socioeconomic impact of food, examining how accessibility, affordability, and industry practices affect communities. To fully understand foodscapes, we analyze the health and environmental consequences of food production and consumption, from nutritional disparities to sustainability challenges.
The global food system has evolved into a complex network shaping the way food is produced, distributed, and consumed. While technological advancements and industrialization have allowed humanity to sustain a rapidly growing population, they have also introduced significant challenges related to environmental degradation, economic inequality, and public health crises. Foodscapes, the spaces and systems that define our relationship with food, have become a battleground where hunger coexists with excessive waste, and undernutrition persists alongside obesity. Without urgent reforms, the ability to sustainably nourish a global population projected to reach 9.7 billion by 2050 will be increasingly compromised.
One of the most pressing concerns in today’s food system is its environmental impact. Agriculture now occupies 50% of the world’s habitable land use, contributes to 26% of global greenhouse gas emissions, and is responsible for 70% of global freshwater withdrawals. While industrial farming has significantly increased food production, it has also led to 33% of global soil degradation, threatening long-term agricultural sustainability. Additionally, livestock production alone accounts for 94% of global mammal biomass, demonstrating the vast ecological footprint of meat production. These alarming statistics highlight the urgent need to shift towards regenerative agricultural practices, improved land management, and a drastic reduction of food waste, which currently surpasses 1.05 billion metric tons annually, equivalent to 132kg per person per year.
Ironically, despite producing enough food to feed 10 billion people, 780 million individuals still suffer from hunger, and projections indicate that 2 billion could experience food insecurity by 2050. This paradox is not due to food scarcity but inequitable distribution, economic barriers, and inefficiencies in global supply chains. The Green Revolution, while increasing crop yields and preventing famines, also contributed to soil depletion, water shortages, and widened economic disparities, favoring large-scale agribusiness while marginalizing small farmers. Today, government policies and corporate dominance continue to deepen food injustices, prioritizing profits over access to affordable, nutritious food.
The consequences of food insecurity extend beyond hunger, as the world now faces a double burden of malnutrition. 783 million people suffer from chronic hunger, with 21.3% of children experiencing stunted growth due to nutrient deficiencies. Meanwhile, over 2.5 billion adults are overweight, including 890 million classified as obese. The widespread consumption of ultra-processed foods, high in sugar, salt, and unhealthy fats, has contributed to rising rates of diabetes, cardiovascular diseases, and metabolic disorders, particularly in middle-income nations. This crisis is not merely a result of personal choices but is deeply shaped by food environments, where unhealthy, calorie-dense options are often more accessible and affordable than fresh, nutrient-rich foods.
Another critical issue threatening food security is water scarcity. Agriculture consumes 72% of the world’s freshwater, with certain foods, such as beef, requiring an astonishing 15,000 liters of water per kilogram. As 2.4 billion people already live in water-stressed regions, unsustainable irrigation practices pose a severe risk to future food production. The document also explores case studies of innovative food sustainability solutions, demonstrating how localized efforts can contribute to broader global change.
To address the failures of the global food system, urgent action is needed in several key areas. First, reducing food waste through better storage, distribution, and donation programs can help bridge the gap between food abundance and hunger. Second, reforming industrial agriculture by investing in regenerative farming, organic production, and biodiversity conservation is essential for longterm sustainability. Third, ensuring food justice by supporting small farmers, regulating corporate monopolies, and improving access to nutritious food can help combat systemic inequalities. Finally, promoting sustainable diets, such as reducing reliance on resource-intensive foods like beef and shifting toward plantbased alternatives, can alleviate both health crises and environmental damage.
Ultimately, food is more than just a commerce product, it is one of the pillars of human health, social equity, and ecological balance. The decisions made today regarding food production, policy, and consumption will shape the future of food security, policy, and environmental sustainability. By reimagining foodscapes, investing in sustainable innovations, and enforcing equitable food policies, humanity has an opportunity to build a more resilient, just, and thriving global food system for future generations.
Bossio, D., Obersteiner, M., Wironen, M., Jung, M., Wood, S., Folberth, C., Boucher, T., Alleway, H., Simons, R., Bucien, K., Dowell, L., Cleary, D., & Jones, R. (2021). Foodscapes: Toward food system transition [Map, pp. 9-10]. The Nature Conservancy, International Institute for Applied Systems Analysis, & SYSTEMIQ. De Representación Arquitectónica, F. M. M. /. T. (n.d.). Paisaje | TRA. http://www.mindeguia.com/temas/paisaje_cs.html
De Rooden, P. (Ed.), Grubb, A., & Wiskerke, H. (2012). Food for the city: A future for the metropolis. nai010 publishers.
Division, I. a. E., Forbes, H., Peacock, E., Abbot, N., & Jones, M. (2024, March 1). Food Waste Index Report 2024. Think Eat Save: Tracking Progress to Halve Global Food Waste. https://wedocs.unep.org/handle/20.500.11822/45230
Downs, SM, Ahmed, S, Fanzo, J et al. (2020) Food environment typology: advancing an expanded definition, framework, and methodological approach for improved characterization of wild, cultivated, and built food environments toward sustainable diets. Foods 9, 532.CrossRefGoogle ScholarPubMed
Food History Timeline, Events in Food History, 50,000 BC to 2024. (n.d.). https://www.foodreference.com/html/html/yearonlytimeline.html
Fujs, T., & Kashiwase, H. (2024, March 16). Strains on freshwater resources: The impact of food production on water consumption. World Bank Blogs. https://blogs.worldbank.org/en/opendata/strains-freshwater-resources-impactfood-production-water-consumption#:~:text=Today%2C%20around%2070%20percent%20of,goes%20to%20the%20industrial%20sector.
Future Foodscapes Research Unit (FFRU). (n.d.). Future Foodscapes Compendium: An index of agro-architectural models for a viable planetary future. Retrieved from https://foodscapescompendium.es/
Rooden, P. (Ed.). (2012). Food for the City: A Future for the Metropolis. NAI Publishers.
Lewis, J. (2024, March 5). 11 Effective solutions for food waste. Earth.Org. https://earth.org/solutions-for-food-waste/
New cases of type 1 diabetes (0-14 Y), in 1,000s. Type 1 diabetes estimates in children and adolescents. (n.d.). https://diabetesatlas.org/data/en/indicators/9/
Méjean, C., & Recchia, D. (2022). Urban foodscape and its relationships with diet and health outcomes. Proceedings of the Nutrition Society, Cambridge University Press. Retrieved form: https://www.cambridge.org/core/journals/ proceedings-of-the-nutrition-society/article/urban-foodscape-and-its-relationships-with-diet-and-health-outcomes/CD7EA0A874D9210A66AE15703B8E7018
Ritchie, H., Rosado, P., & Roser, M. (2022, December 2). Environmental impacts of food production. Our World in Data. https://ourworldindata.org/environmental-impacts-of-food
Ritchie, H. (2022, February 4). What is undernourishment and how is it measured?. Our World in Data. https://ourworldindata.org/undernourishment-definition
Ritchie, H., Rosado, P., & Roser, M. (2023, June 19). Hunger and undernourishment. Our World in Data. https://ourworldindata.org/hunger-and-undernourishment
Sharma, S. (2015). Food preservatives and their harmful effects. International Journal of Scientific and Research Publications, 5(4), 1-2. Retrieved from https://citeseerx.ist.psu.edu/ document?repid=rep1&type=pdf&doi=5385ad183ba002dcc6d91b1fd228068dbcca31a2
Smoor, T. (2023, August 27). 6 facts you should know about water use in agriculture. Cargill. Retrieved February 17, 2025, from https://www.cargill.com/story/agriculture-water-use
World Health Organization: WHO. (2023, November 16). Food additives. https://www.who.int/news-room/fact-sheets/detail/food-additives
World Health Organization: WHO. (2024, March 1). Malnutrition. https://www.who.int/news-room/fact-sheets/detail/malnutrition
World Health Organization. (n.d.). Malnutrition in children. World Health Organization. https://www.who.int/data/nutrition/nlis/info/malnutrition-in-children
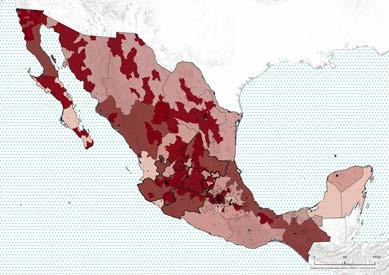
As seen in the previous chapter, the concept of foodscapes not only highlights how food production and consumption are influenced by geographical and cultural factors but also how agricultural practices interact with nature. In the case of Mexico, the diversity of its food landscapes is due to its vast territory, which has a wide climatic variability that contributes to the country’s agricultural production diversity.
However, according to a study on water body protection (2018), more than 70% of rivers, lakes, and reservoirs present some degree of contamination (National Human Rights Commission and the National Autonomous University of Mexico). The high demand for water resources, combined with a lack of education on the subject, has led to this issue directly affecting food production for the population. For this reason, this layer of information has been incorporated into most of the maps presented below. The following topics will be covered to explain the country’s physical context:
1. CLIMATOLOGY
2. HYDROLOGY
3. LAND USE FROM 1997 TO 2021, ALONG WITH SOIL DEGRADATION
4. RELATIONSHIP BETWEEN SOIL DEGRADATION AND THE EXPLOITATION OF WATER RESOURCES
5. DIVERSITY OF SOIL TYPES IN THE CENTER OF THE COUNTRY
6. DIFFERENCES BETWEEN OPEN-FIELD AND GREENHOUSE CULTIVATION
7. CROP PRODUCTION, HIGHLIGHTING AREAS WITH EXTREME DROUGHTS
8. LIVESTOCK PRODUCTION
9. WATER CONSUMPTION IN LIVESTOCK FARMING, IRRIGATION, AND URBAN USE
10. RAILWAY AND HIGHWAY INFRASTRUCTURE FOR THE DISTRIBUTION OF GOODS IN THE COUNT
Symbology
Scale | 1: 11,000,000
Queretaro
The Bajío Region
State borders
Contour lines
Urban Areas
Territory of Mexico
Three climate types dry, warm, and temperate as well as their variations exist in Mexico. In addition to its rocky terrain brought about by the Sierra Madre Occidental, the north of our nation is known for its arid climate. With a few arid areas, the climate in the middle is primarily temperate. Lastly, the climate in the south is generally warm.
According to Inegi (2022), the state of Queretaro has a “dry and semi-dry” climate, which affects 52% of its surface area. 25% of the warm-weathered Sierra Madre Oriental region is next.
Symbology
Hidrology
Perennial River
Non-perennial rivers
Waterbody
Annual Precipitation
1000-2000 mm
2000-4000 mm
+4000 mm
Base Map
Scale | 1: 11,000,000
Queretaro
The Bajío Region
State borders
Contour lines
Urban Areas
Water Deficit
About 633,000 kilometers of rivers and streams make up Mexico’s vast water system. Lake Chapala is the largest lake, and the Bravo is the longest river. The nation is divided into 1,471 water basins and 37 hydrological zones, with the largest being the Bravo, Balsas, and Nazas rivers.
Chihuahua, Sonora y Jalisco has some of the most important aquifers. Although Mexico has a large expanse of hydraulic resources throughout the country, we can see how in some parts of the north, mainly, there is water scarcity due to the region and consumption demand.
Another problem the population faces regarding the country’s water sources is pollution due to industrial waste, wastewater, and agricultural pollutants within the running water.
Scale | 1: 11,000,000
Symbology
Land Use
Forest Agriculture
Urban Area
Protected natural areas
Soil degradation
Base Map
Queretaro
The Bajío Region
State borders
Contour lines
Urban Areas
Water Deficit
SERIE 2, 2001
SERIE 1, 1997
SERIE 3, 2005
SERIE 4, 2009
These maps show the soil status over time, specifying the areas that are forests, urban areas, agriculture related, and areas with soil degradation from 2001 to 2021. It is noticeable that due to soil degradation, protected areas had to be implemented.
The 2021 map highlights the most significant amount of soil degradation in the northern part of the country, where extreme weather conditions, civil development, and pollution have contributed to its expansion. However, the protected areas aim to preserve and create a balance to help restore sustainable soils.
SERIE 5, 2013
SERIE 6, 2016
SERIE 7, 2021
RELATIONSHIP BETWEEN SOIL DEGRADATION AND NATURAL RESOURCE EXPLOTATION
Symbology
Hydrology
Perennial River
Non- perennial rivers
Soil degradation
Base Map
Scale | 1: 11,000,000
Queretaro
The Bajío Region
State borders
Contour lines
Urban Areas
Water Deficit
Soil degradation can have a correlation with many factors, however, in particular in this map shows one of the most obvious and is related to the exploitation of soil in the agricultural sector, being an industry that is mainly one of the main consumers of water we can see that the water deficit is related to the most overexploited areas for this activity which in turn coincides with the main agricultural producing States of the country.
Weathered Rock Base – 60 cm+ → Semi-consolidated bedrock with high permeability.
O Horizon – 0-3 cm → Decomposing organic matter.
A Horizon – 3-10 cm → Thin loamy-sandy soil with low water retention.
C Horizon – 10-30 cm → Weathered rock fragments.
R Horizon – 30 cm+ → Compact bedrock (limestone or basalt).
A Horizon – 0-15 cm → Clayey soil with high organic matter content.
C Horizon – 40-80 cm → Clayey parent material with carbonate accumulation. Bss Horizon (Crack Horizon) – 15-40 cm → Expansive clay with deep cracks.
R Horizon – 80 cm+ → Bedrock with hardened clay sediments.
O Horizon – 0-5 cm → Leaf litter and decomposing plant residues.
B Horizon – 30-70 cm → Clays and base accumulation. A Horizon – 5-30 cm → Black soil with high humus content.
C Horizon – 70-100 cm → Less developed soil with mineral deposits.
O Horizon – 0-5 cm → Decomposing organic matter.
E Horizon – 20-50 cm → Leached zone with nutrient loss. A Horizon – 5-20 cm → Brown soil with high iron and aluminum content.
B Horizon – 50-100 cm → Accumulation of clays and metallic oxides.
C Horizon – 100 cm+ → Weathered parent material with high permeability.
B Horizon – 30-60 cm → Accumulation of minerals such as iron and aluminum. A Horizon – 5-30 cm → Dark-colored soil, rich in humus. O Horizon – 0-5 cm → Decomposing organic matter.
C Horizon – 60-100 cm → Rock fragments and parent material.
R Horizon – 100 cm+ → Slightly altered bedrock.
A Horizon – 0-5 cm → Thin layer of organic material and volcanic ash.
C Horizon – 5-30 cm → Weathered rock fragments.
R Horizon – 30 cm+ → Solid, unaltered volcanic bedrock.
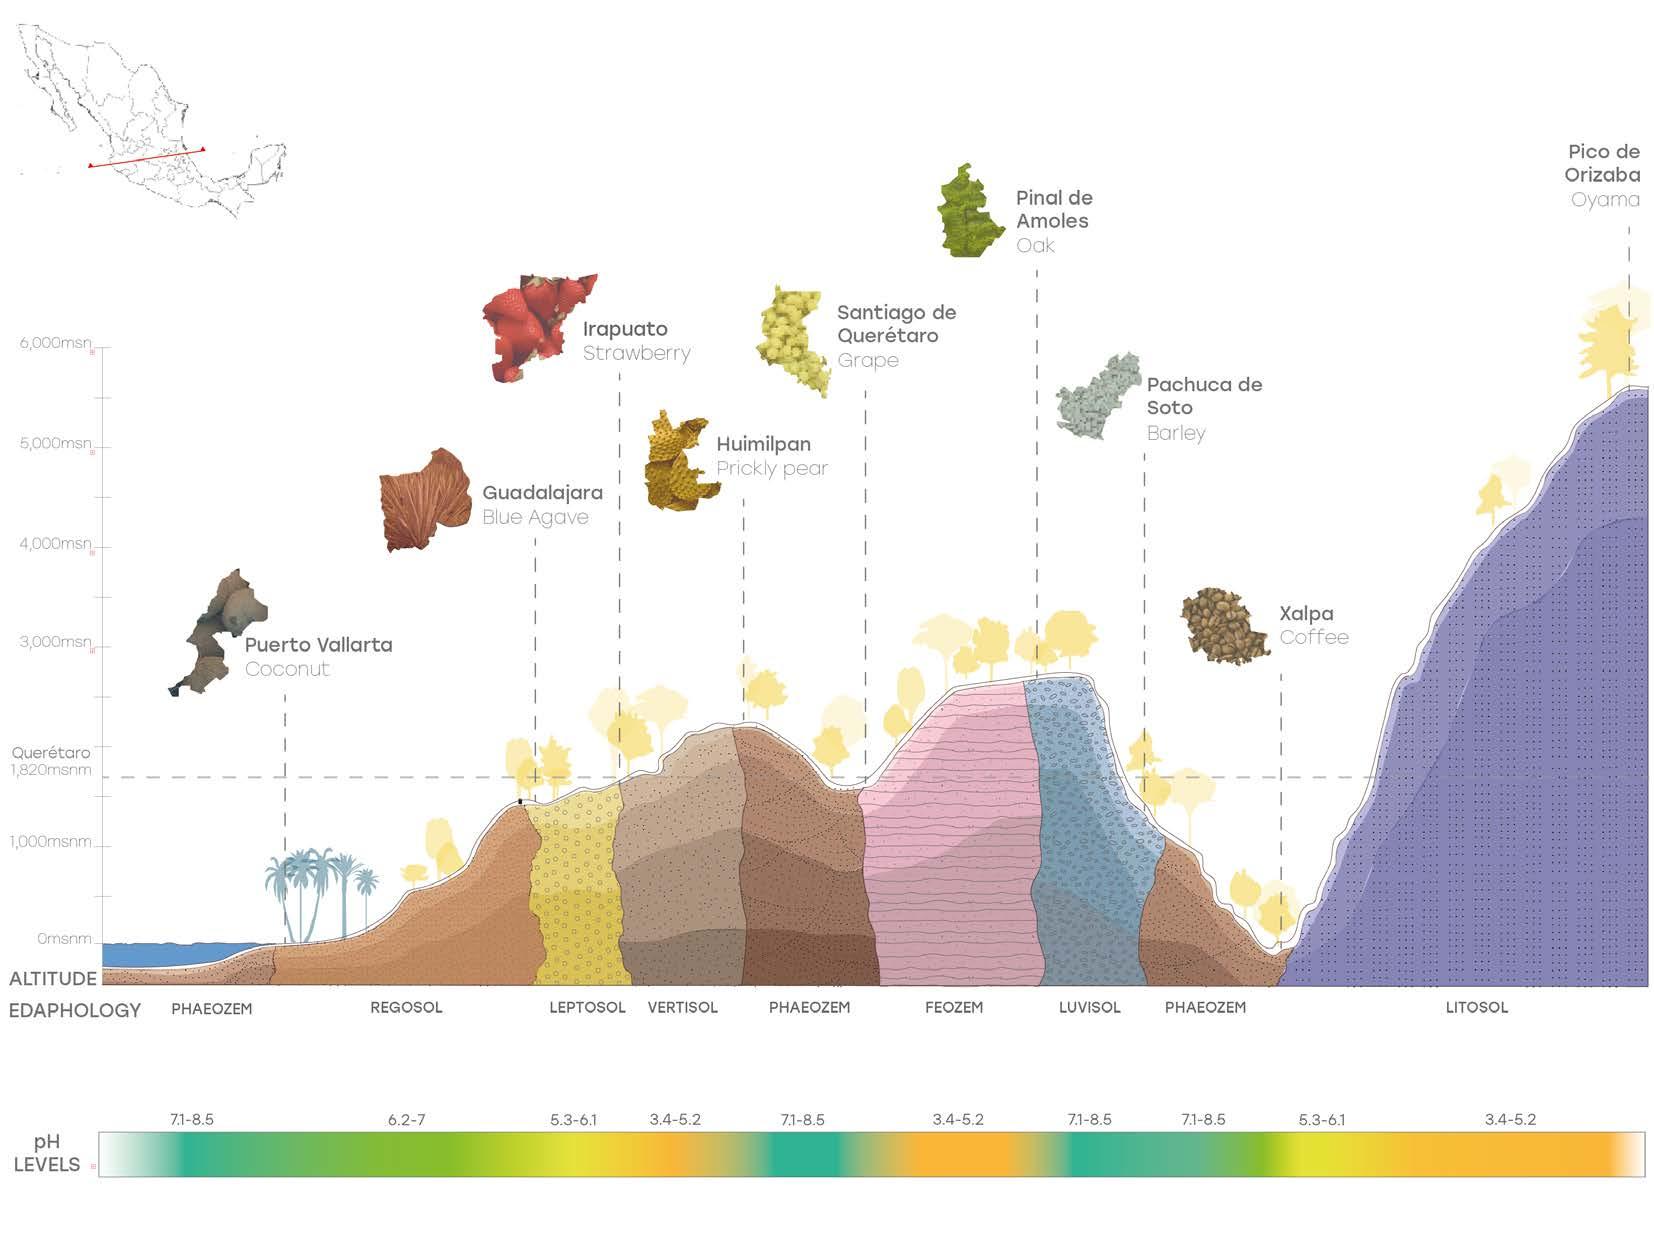
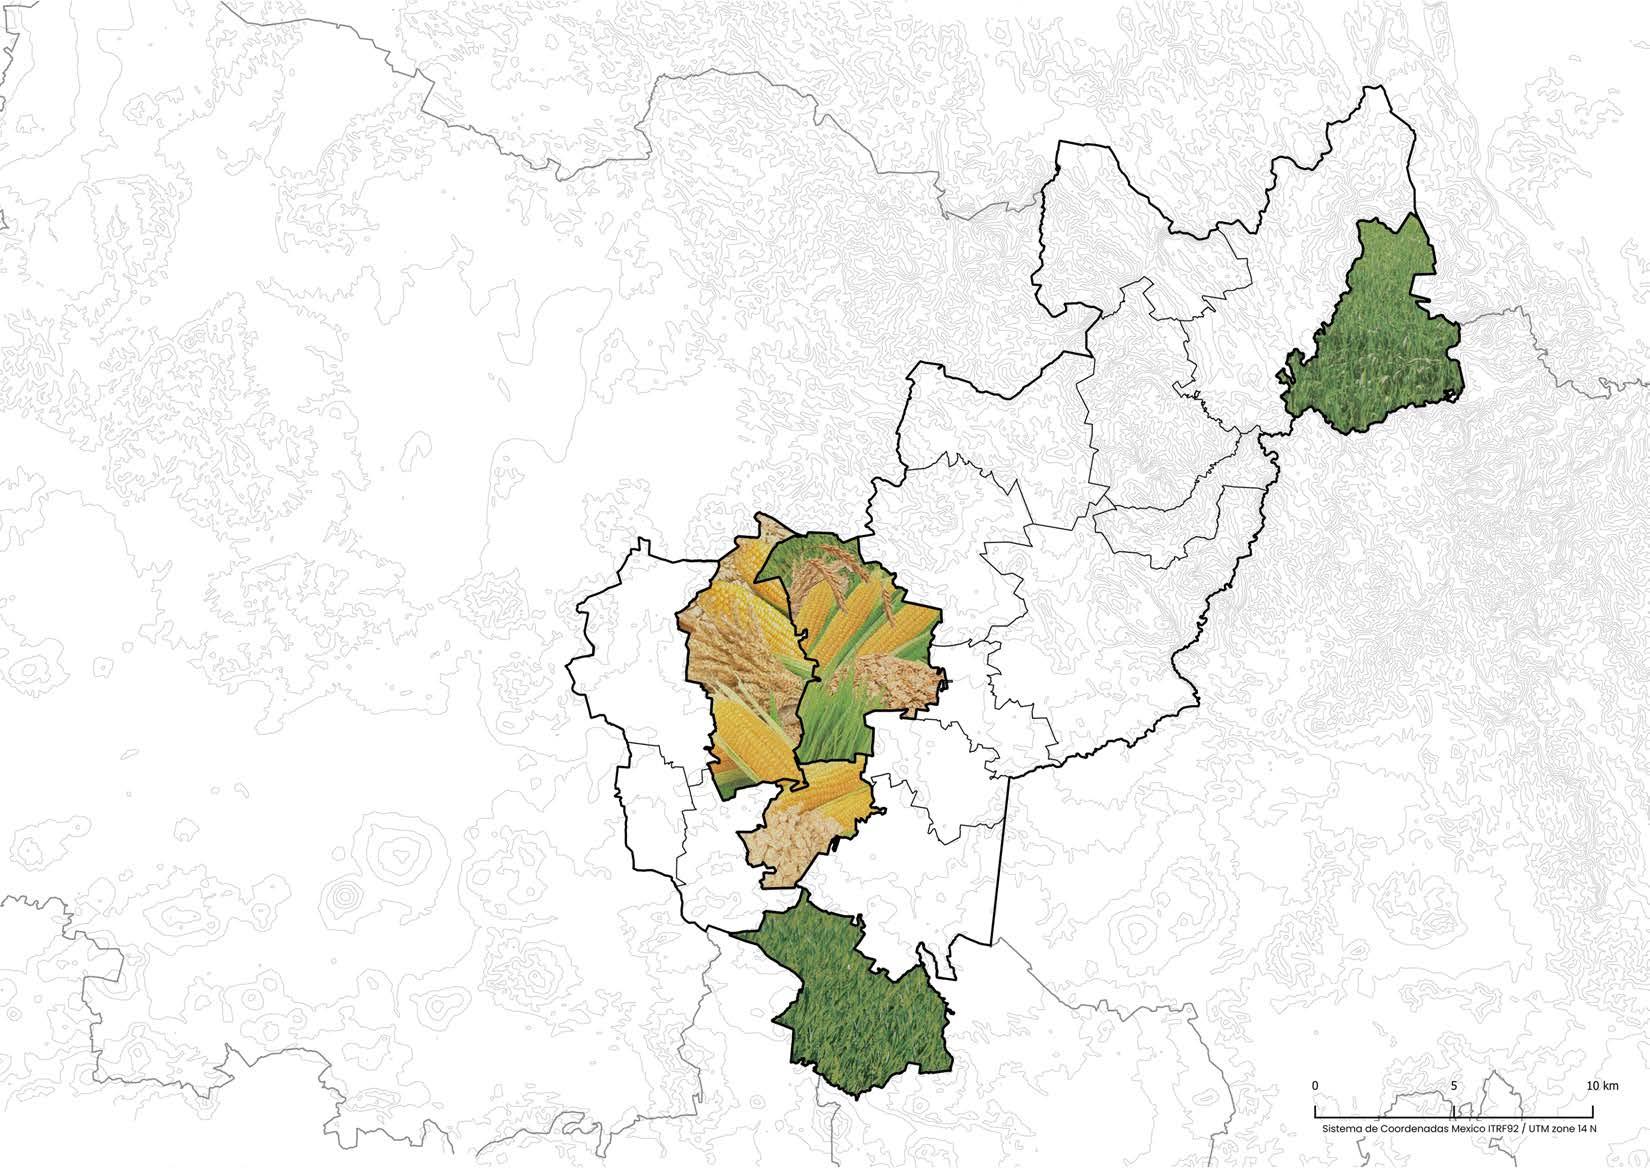
The geographical, climatic and soil characteristics of each region of the Bajío and surrounding areas influence the types of crops that can be sown and their profitability. Higher areas favour crops that are more resistant to cold and have moderate water needs, while low-lying and coastal areas allow the cultivation of tropical species that require stable temperatures and high humidity. The diversity of conditions between different places, such as altitude, soil type, pH, temperatures and precipitation, allows each region to develop an agricultural specialization, optimizing the production of specific crops that better adapt to their local conditions. For producers, understanding these variations is essential to choosing the right species and maximizing the profitability of their crops.
DIFFERENCES BETWEEN OPEN-TOP AND CONTROLLED CULTIVATION
Open-air and greenhouse farming have specific advantages and challenges. Open-air farming benefits from natural conditions and appropriate soil management, but is vulnerable to climatic factors and pests. In contrast, greenhouse cultivation provides more precise control over the environment, reducing vulnerability to extreme weather conditions and pests, but requires greater investment in infrastructure and management of humidity, temperature and ventilation. If the goal is to maximize production under controlled conditions and minimize climate risk, the greenhouse is the most appropriate option. However, open field cultivation remains a cost-effective option when space and climate conditions are favourable.
Symbology
Base map
LOCAL PRODUCTS
Scale | 1: 11,000,000
Contour lines
Urban Areas
State borders
The first map shows the most important producing states in Mexico according to the INEGI 2022 agricultural census, highlighting their main crops. Some of these states belong to the metropolitan category. Climatic and geographical conditions influence the variety and quantity of production, as factors such as altitude, humidity, sun exposure, and water availability affect crop growth. Although water levels do not directly determine the quality and quantity of the harvest, other factors, such as biological resistance to extreme conditions, can limit the variety of species. Additionally, the profitability of products also influences production, with more profitable crops being produced in larger quantities.
The Bajio Region
Queretaro
AGRICULTURE + SEVERE DROUGHT
National Agricultural Production 2023 (Percentage)
Base map
Scale | 1: 11,000,000
borders
lines
Areas
Severe Drought
Agriculture in Mexico is undoubtedly a significant sector, occupying approximately 15% of the national territory (20.6 million hectares are under agricultural cultivation). The most representative products include corn, sugarcane, avocado, sorghum, green chili, tomato, beans, barley, and wheat, among others. Additionally, Mexico is the world’s leading exporter of tomatoes, watermelon, cucumber, avocado, onion, lime, papaya, tequila, and beer, ranking seventh globally in agricultural production. In 2023, corn production surpassed 27 million tons, making it the most harvested crop in the country.However, Mexico’s agricultural sector faces significant challenges such as water scarcity and climate change. The overexploitation of aquifers and pollution have contributed to the reduction of water availability for agriculture, raising concerns about production and food security. Furthermore, climate phenomena such as droughts and floods have negatively impacted crop yields.
Symbology
Urban
Contour
State
The Bajio Region
Queretaro
LIVESTOCK FARMING
Scale | 1: 11,000,000
Symbology
National Livestock Production 2023 (Percentage)
Livestock production plays an important role in Mexico, ncludes the raising of sheep, chickens, pigs, and cattle. Each type of livestock is raised in different regions, adapted to climatic and geographical conditions. Sheeps provide wool, meat, and milk, while chickens are raised primarily for eggs and meat. Pigs are a major source of pork, a basic meal in Mexican cuisine. Cattle are a major contributor to both beef and dairy production, supporting domestic consumption and export markets.
Chicken
Pigs Sheep Cattle
Water Consumption for Agriculture Water Consumption for Urban Use
Water Consumption for Livestock
Although the agricultural sector is the largest water consumer, the specific water consumption of the livestock sector is not clearly detailed in the available statistics. However, it is known that livestock, like agriculture, heavily relies on water for the supply and maintenance of animals. The lack of specific data on water consumption in the livestock sector makes it difficult to assess its precise impact on the country’s water resources.
Symbology
Nacional Road Network
Main Roads
Railway Roads
Base Map
Scale | 1: 11,000,000
The Bajío Region
State borders
Contour lines
Urban Areas
Mexico has its connectivity in the central region of the country, especially in “Estado de México”. The map highlights the national roads and rails network in order of priorities. In central Mexico, where the “Estado de México” is located, lanes and roads interact creating a strong link of inter connectivity, leading to a successful transfer of national products and transportation, along with passenger services and tourist purposes.
Highlighting the FERROMEX route, the most relevant in the country, which crosses through the capital city, “Ciudad de México”.
Queretaro
The Bajío region is one of Mexico’s most vital agricultural hubs. However, the overexploitation of water resources and unsustainable farming practices have pushed it toward a critical tipping point. If these issues persist, the region—and potentially the entire country—faces the looming threat of a food security crisis, bringing the prospect of “Day Zero” closer than ever.
In light of this situation, several questions arise:
• What will happen when the Bajío’s resources are depleted and the agricultural sector is forced to decentralize? Where will these practices take place, and what consequences will they bring to other regions?
• What alternatives or possible futures can ensure food security in Mexico?
• Is the modernization of agriculture and soil regeneration the solution, or are more comprehensive strategies needed?
As we can see, Mexico is a country of great ecological and cultural diversity that faces complex challenges in relation to food security, natural resource management and the impact of industry.
The export and import of food products is another relevant factor in Mexican foodscapes. Through commercial exchanges, Mexico is positioned as one of the main actors in food exports to other countries, but this also implies a dependence on internal and external policies, as well as an effect on local availability and cost overruns. In addition, the growing food waste in the Mexican food industry is a serious problem that aggravates both food insecurity and environmental impact.
This chapter seeks to explore how these factors are interrelated in the context of Mexican foodscapes. It seeks to understand the implications of these processes on the sustainability of the country’s food system and its capacity to guarantee equitable access to sufficient, nutritious and culturally and economically adequate food for the entire population.
1. IMPORTS AND EXPORTS
2. EXPORTS AND WATER FOOTPRINT
3. FOOD INDUSTRY AND ITS WASTE
4. FOOD SECURITY
In this map we can see what is produced in each state of Mexico and also what exports and imports are made from Mexico
Brasil China
Made by actor.
Main countries that Mexico exports food (2023)
Main countries that import food to Mexico (2023)
In the first diagram tells us that the majority of exports are made to the United States and that only smaller parts go around the world. We also realize that many products leave Mexico to the United States for packaging and return to supermarkets in Mexico.
In the second one We note how the United States is also our main importer and the great relationship we have with this country.
Mexican products with the highest exports (2024)
Millions of dollars
Sweets
-Units: No data
-900 mod
-Units: 880.34 million kilograms
-772 mod
Pepper -1,400 mod
-Units: 1,114.5 million kilograms
Beer
-Units: 3,150 million liters
-6,163 mod
Tomato -2,988 mod
-Units: 2.5 million tons of avocados
Avocado -3,200 mod
-Units: 2.5 million tons of avocados
Tequila -2,600 mod
-Units: 418.9 million liters
The production of our products has a great relationship with the exports and exports of our country, 3 of the products that we export the most, 2 of them are ultra-processed (beer and tequila) while the other is one of agricultural origin (avocado). Meaning that some of them mostly require additional processes and therefore more natural resources.
Cucumber
Made by actor.
Water footprint of Mexico's most exported foods
Water footprint of Mexico's most exported foods
of water
1L 4L of water
1L = 10L of water
1Kg = 2000L of water 1Kg 1Kg 1Kg = = = = 200L of water 560L of water
1500-2000L of water
The consumption of water in the cultivation and processing of products is key to the development of the region, however the overexploitation of the hydrobasins should be an area of concern, for example if we put in comparison the 1kg of avocado and 1kg of traditional sweets consume the same level of water. This is especially relevant if we see that the use of water is similar for several ultra-processed products. 1L 10L of water 1Kg = 2000L of water
1500-2000L of water
of water 400L of water
The food industry constitutes a substantial proportion of the nation’s economic activity, accounting for approximately 55.06% of total economic units, as indicated by data provided by the Secretaría de Economía (Ministry of Economy).Consequently, its substantial influence on Mexican society, both economically and environmentally, signifies a paramount concern due to its considerable size and impact within the national context.
Chart created with information obtained from DATA MEXICO and Secretaria de Economia (2022)
As it is a major industry, it is crucial to talk about the waste it can generate, to be more specific, according to the latest report of the Diagnostico Basico para la Gestión Integral de los residuos carried out by the Secretaría de Medio Ambiente y Recursos Naturales, the average percentage composition of waste related to food waste is 33.07%, while the rest is made up of materials that can be used and others.
Chart elaborated with information from “Diagnóstico de Básico para la Gestión Integral de los Residuos (2020)”
Food security is the right of all people to have access to safe, nutritious and sufficient food. Knowing this, focusing on Mexico, almost a third of the population suffers from moderate or severe food insecurity. This means that some 35 million Mexicans have not eaten for a day or more, they do not know if they will be able to eat today or they will sacrifice the quantity or quality of their food.
We observe the diversity that exists in the food sector and the great responsibility that comes with being one of the main economic forces of the country, especially in such a multidimensional issue as food.
Do companies have a shared responsibility for being the basis of food for millions of Mexicans?
Should alternative techniques that favor local production of products for consumption be explored?
Why are there not stricter regulations in a national context with regards to waste?
This raises a series of questions that present us with diverse scenarios that make us imagine and think about possible futures and concrete lines of action
Now it is time to delve into issues of social and cultural relevance with a broad vision of health, such as the relationship between the minimum wage and the basic food basket, which reflects one of the main barriers to adequate access to food. Despite the progress made, many sectors of the population face difficulties in meeting their basic nutritional needs, which contributes to problems such as malnutrition and increased obesity, especially among children. These challenges are increasingly serious due to poor dietary education and institutional practices, which reduce the ability of individuals to make informed decisions about their diet.
In this context, this chapter will delve into the food landscape of the country which encompasses both obesity and malnutrition, creating a cycle of inequality and public health that requires a comprehensive and multidimensional approach to its resolution with a shared vision for the future of the Mexican diet.
3. FOOD EDUCATION
6. CHILDHOOD OBESITY
7. MALNUTRITION
1. THE LINK BETWEEN THE MINIMUN WAGE AND THE BASIC FOOD BASKET
2. FOOD ACCESSIBILITY
The concept ofThe Basic Food Basket (CBA) was introduced in 1982 by COPLAMAR. Currently. According to CONEVAL’s findings, PROFECO has identified 24 basic necessities, including personal hygiene products and foodstuffs. The amounts were calculated based on the weekly consumption of a four-member household, as reported by the 2020 Population and Housing Census conducted by the Institutito Nacional de Estadística y Geografía (INEGI).The average cost of the basic food basket is subject to variation; however, according to PROFECO, the average cost is 910 pesos per week.
Using data from the Encuesta Nacional de Ingresos y Gastos de los Hogares 2022 (ENIGH), we analyze the change in household composition based on the average number of members per household from 2000 to 2020. Knowing the household composition and the average cost of the monthly basic basket, a family of 4 in 2025 could cost approximately 3640 pesos.
Graph of Family Composition, Elaborated with information from the Encuesta Nacional de Ingresos y Gastos de los Hogares (ENIGH) 2022.
Basic food basket
According to the Secretaria del Trabajo y Previsión Social and the Comisión Nacional de Salarios Mínimos (National Minimum Wage Commission). The minimum wage in Mexico is as follows Zona Libre de la Frontera Norte $419.88 pesos per day and in the General Minimum Wage Zone $278.80 pesos per day.
If we make a comparison, in the Northern Border Free Zone it takes approximately 2.16 minimum wages to acquire it, while in the rest of the country it would take approximately 3.26 minimum wages per week. However, this information is only if we take the average, without considering externalities such as the variation of prices in supermarkets or convenience stores, etc. Also, the consumption of these products may vary by family or region.
Self-made collage
Made by actor.
Made by actor.
How
is it today?
Education in Mexico has increased through new programs with educational campaigns within schools. These campaigns cover topics such as balanced diets, the importance of reducing sugar intake, and the prevention of the sale of ultra-processed foods in schools. On the other hand, it is still common to see the presence of “tienditas” (small shops), where the most sold products are soft drinks, candy, cookies, chips, chocolates, etc. The traditional Mexican food pyramid is distributed with a large portion dedicated to cereals and a very small portion for animal-based products (which are the most nutritious and important), as this latter group tends to be harder to access and generally more expensive within the basic grocery basket.
Made by actor.
Vegetables
“The Mexican plato del buen comer”
Fruits
Animals-based products and legumes
Made by actor.
Cereals
A significant segment of the inhabitants in Mexico has a high rate of malnutrition and obesity, especially in impoverished and segregated areas.
Obesity is defined as a body mass index greater than 30 kg/m2 and is the main risk factor for the development of type 2 diabetes and cardiovascular diseases, which are the main causes of death in our country. According to the most recent Encuesta Nacional de Salud y Nutrición (2022), in Mexico 75% of adults, 41% of adolescents and 35% of children live with overweight or obesity.
The causes of obesity are multiple, but they all derive from the lifestyle of our modern society, which includes industrialization, urbanization and the overexploitation. The north Side reports higher obesity.
Increase of obesity and overweight in Mexico (Total population)
Made by actor.
CHILDHOOD OBESITY IN MEXICO
Childhood overweight and obesity in Mexico is one of the most important public health problems. Childhood obesity is a chronic disease that is characterized by excess fat in the body and occurs when the child is more than 20% overweight than ideal.
In Mexico, 12.6% of children under 5 suffer from stunting, reflecting the long-term effects of malnutrition.
Obesity is mainly related to a genetic aspect, but currently lifestyle has taken an important role since the intake of high-calorie-dense foods, sugary drinks and the lack of physical activation directly affects these diseases.
Something important is the education in food that is given to children today.
Made by actor.
Symbology Base Map
Level 1
Level 4
Level 5
Level 3 Obesity Railway Roads Main Roads Level 2
Bajío Region Contour lines State borders
National Road Network
This map shows two relevant connections in regards to obesity and the road network that surrounds our country. According to CONEVAL data, one of the main causes of food-related health problems in general has to do with supply chains. That is, the ease of access to certain products in certain areas of the country.
This map shows the relationship between the states with the highest obesity rates being Campeche, Tamaulipas and Baja California Sur and their poor connection with transportation networks.
1 in every 10 Mexican children suffer from malnutrition
MALNUTRITION IN CHILDREN AND ADULTS
Malnutrition in Mexico is a significant problem that affects both children and adults. but mostly children.
Child Malnutrition:
It mainly affects children in rural and marginalized areas.
Causes: Poverty, lack of access to nutritious food and frequent illness.
Consequences: Delayed physical and cognitive growth, greater vulnerability to diseases and learning problems.
Malnutrition in Adults:
It especially affects older adults and people in extreme poverty.
Causes: Unbalanced diets, chronic diseases and difficulties in accessing healthy foods.
Consequences: Fatigue, weakness, increased susceptibility to illness and mental health problems.
Contributing Factors:
Socioeconomic inequality, poverty, lack of access to healthy foods and poor nutritional education.
Made by actor.
Government to reduce child malnutrition by 2023, Sen David
Symbology
Demography
6,815,000 - 67,440,000
2,805,000 - 6,815,000
1,755,000 - 2,805,000
1,390,000 - 1,755,000
930,000 - 1,390,000
665,000 - 930,000 DEMOGRAPHY+ ROAD NETWORK
485,000 - 665,000
240,000 - 485,000
66,500 - 240,000
o - 66,500
Scale | 1: 11,000,000
Base Map
Queretaro
The Bajío Region Contour lines
State borders Urban Areas
The relationship between population and connection networks is crucial to understand the relevance of the Bajio scale in our country. For this reason, here is an example of how the population density is directly connected to the main connection networks of the country, making it a unique logistic point and a great part of them are located in the main logistic centers of the country’s cities.
Symbology
Base Map
Queretaro
The Bajio Region
State borders
Scale | 1: 11,000,000
Contour lines
Urban Areas
Having clear the relevance of the center of the country as part of an interconnected network of economic and mobility hubs in the country. A concept called Diamonf of Mexico arises, which proposes the connection of the main cities of the country, being Morelia, Guadalajara, Queretaro, Leon, Aguascalientes, Estado de Mexico and Ciudad de Mexico part of this concept.
The relevance of this polygon in our line of research is to understand how the center of the country becomes a focus of attention in regards to social, economic and political mobility, among others. Understanding the importance of this geographic space in the national context allows us to have a broader worldview regarding food-scapes. An opportunity to rethink our way of seeing the model that has been established in this country, but above all an opportunity for the development of focused proposals for the common good.
A large part of the population in Mexico faces obesity problems, and the main causes include difficulty accessing healthy food due to high prices and economic inequality. Thanks to the connections and accessibility offered by the “Diamond of Mexico,” where much of the country’s production and economy are concentrated, it is increasingly easy to access ultraprocessed or altered foods, which worsens the situation.
Additionally, eating habits in Mexico are not always health-oriented. The country’s food education is inadequate, as reflected in the “Plato del Buen Comer” (Good Eating Plate) from the Ministry of Health, which recommends a diet based mainly on cereals, with little emphasis on animal-based products that are costly and hard to access for many people.
Food insecurity, which affects about 35 million Mexicans, creates uncertainty about whether they will be able to obtain enough food each day, contributing to serious health problems such as obesity, diabetes, and cardiovascular diseases.
What will happen when the Bajío region’s natural resources are depleted, and the agricultural sector is forced to decentralize?
Where will these agricultural practices be relocated, and what environmental and socio-economic consequences will this shift bring to other regions?
What alternative strategies or future scenarios can ensure Mexico’s food security in the face of growing challenges?regions?
Is the modernization of agriculture and soil regeneration the key solution, or is a more comprehensive, systemic approach required?
Are current public policies on food education aligned with modern consumption habits and lifestyles of the Mexican population?
Is there still a direct correlation between poverty and public health issues such as obesity and malnutrition, or is it now more closely tied to distribution networks and the overwhelming availability of ultra-processed products in the market?
To fully understand the diversity of Mexico’s food systems, must we adopt a multidimensional perspective, considering the economic, geographic, and cultural factors shaping consumption patterns across the country’s different regions?
Do agribusinesses bear shared responsibility as they form the backbone of food supply for millions of Mexicans?
Should alternative agricultural techniques be explored to favor localized production and reduce reliance on large-scale industrial farming?
Why are there no stricter national regulations on agricultural waste management and economic policies, such as the IEPS (Special Tax on Production and Services) or punitive taxes, which theoretically function but have proven ineffective in practice?
We need to begin with the physical and immediate contexto of Querétaro to understand what can cultivated and produced in its climate, soil quality and elevation.
Understanding the physical aspects of the state can also helps us understand context of agricultural activity thoughtout different municipalities, and how our site is not only relevant but important in the scope of what the urban stain of the Metropolitan area is.
Symbology
Queretaro regions
Sierra Gorda
Semi-desert
South region
Metropolitan region
QUERETARO REGIONS
Scale | 15:40000
Base map
Municipality division
Limit state
Urban stain
Level lines
Queretaro is located within the Central-Bajío region, one of the most vital areas of Mexico for agriculture and food production. El Bajio is located in the most important industrial corridor in the country, with access to highways, railroads, and airports that facilitate logistics and trade. It is made up of the states of Zacatecas, Guanajuato, Queretaro, San Luis Potosi, Aguascalientes & Jalisco, sometimes Michoacan is considered as well. One of its most important highways is the Queretaro - Mexico highway, which facilitates the transportation of goods to the entire area.
The Queretaro - San Luis Potose and Querétaro - Irapuato highways also stand out, as they are important for connectivity between the state of Queretaro and the rest of the entities. Likewise, the railways and the Queretaro international airport are of utmost importance for the transportation of food products every day.
Figure 3.1.1: Regions in Querétaro based on data from INEGI.
NATURAL PROTECTED AREAS - CONSERVATION AREAS
Symbology
Natural Protected Areas have a very important role when it comes to ecological stability, not only in certain areas, but globally as well. In Querétaro we have a variety of NPA, which help keep balance in ecological processes. Some of this NPA have been listed as NPA but algo into Conservation Areas, which gain a legal protection in order to protect its natural richness. This special areas include “El Tangano”, “El Cimatario”, “Pinal del Zamorano” and “El Pinalito”. The NPA/CA listed above, have an important impact in the ecological processes such as water absorption, which helps prevent the degradation of the water bodies in Querétaro, such as the “Acuífero del Valle de Querétaro”, which is currently overexploited. Also the NPA help being home of a veriety of endemic flora and fauna.
Figure 3.1.2: Conservation of natural areas based on data from, INEGI.
The NPA of “El Tangano”, is located in Queretaro, El Marques and Huimilpan municipalities, having an area of 718 hectares. It holds vegetation such as tropical deciduous forest and crassicaule scrub. It also has a very important fauna presence such as coyotes, white-tailed deer and birds such as golden eagles.
The NPA of “El Cimatario” is located in the southern part of the Zona Metropolitana de Queretaro, main urban area in Queretaro state, having an area of 1,450 hectares approximately. It holds various flora such as Guayabillo,Red Cedar and Palo Arco. It also has an important presence of fauna such as Northern Cacomixtle, Queretaro Gourd and Swainsoni.
“El Tangano” “El Cimatario”
The NPA of “El Pinalito” is located in El Marqués municipality, having an area of 1,593 hectares approximately. It hold various flora such as pines, oaks and cacti mainly. It also has a very important fauna such as Peregrine falcon, puma and white-tailed deer.
The NPA of “Peña Colorada” is located in the northern part of the Zona Metropolitana de Querétaro, inside Queretaro state, having an area of 4,844 hectares approximately. It holds various flora such as Barrel Crabapple, wild Laurel and Cedar. It also has an important presence of fauna such as Northern Cacomixtle, Monarch Butterflie and Leopard frog.
“El Pinalito” “Peña Colorada”
Symbology
Hydrology and energy
Valle de Queretaro Aquifer
Bodies of water
Metropolitan region
Rivers
Scale | 15:40000
Base map
Municipality division
Limit state
Urban stain
Level lines
Rio Montezuma, located in the region “Panuco”, which from the Infiernillo springs, supplies about 40% of the drinking water through the “Aqueduct II” system with an approximate length of 123 km. “Queretaro Valley Aquifer”, which due to overexploitation and contamination, has a drop of up to five meters per year, supplies the rest, 60%.
Energy production in the state of Queretaro comes mainly from nonrenewable sources, such as the Combined Cycle Plant “El Sauz”, which is the main source of energy in the state and uses natural gas for its operation
Figure 3.1.4: Water and energy based on data from INEGI.
Querétaro has a very critical water crisis due to population growth and having the same water sources, which generates a large water deficit in relation to supply-demand and a reduction of the anual water availability
According to the CEA, Queretaro has an average demand of about 4.43 m3/s, against a lower supply, with a deficit of at least 0.13 m3/s, which represents 11,232,000 lt per day, which according to the average daily water expenditure per person of approximately 236 lt, would be equivalent to that of 47,593 people.
Figure 3.1.5: Water demand and supply.
In terms of population and water availability in Querétaro, about 98% of the state’s population has uninterrupted access to drinking water, with 2% of the population, about 50,000 inhabitants, having no continuous access due to water leaks, clandestine connections and a lack of connection to the CEA’s water network. Some of the most affected areas are “Mompani” and “La Cañada” located in the periphery of the Metropolitan Zone of Queretaro (ZMQ).
Figure 3.1.6: Population increase, water decrease.
Symbology
Hydrology and land use
SOIL TYPES AND AGRICULTURE
Scale | 15:40000
Luvisol
Valle de Querétaro Aquifer
Bodies of water
Rain-fed agriculture
Irrigated agriculture
Edaphology
Vertisol
Feozems
Kastanozem
Cambisoles
Yermosol Haplico
Base map
Municipality division
Limit state
Urban stain
Level lines
Although a significant portion of Queretaro’s territory is classified as rural, agricultural activity is concentrated in specific areas due to the limited availability of fertile soil. In fact, only about 38% of the state’s total surface consists of arable land suitable for cultivation. These fertile areas are primarily found in the municipalities of Pedro Escobedo, San Juan del Rio, parts of Colon, Corregidora, El Marques, and Queretaro. As seen in the map, he most agriculturally productive areas are dominated by vertisols, a highly fertile but challenging soil to work with due to its high plasticity. Additionally, pheozems are present, offering well-drained and highly fertile soil, further supporting agricultural productivity.
NPA
Planasol
Regosol
Rendzina
Litosol
Figure 3.1.7: Land and soil based on data from INEGI.
SOIL TYPES IN CROSS-SECTION
Scale | 15:40000
Symbology
Horizon A (Superficial layer)0-10 cm Sand, silt and mineral fragments with little organic matter
Horizon C (parent material)10-30 cm Unconsolidated sediments, coarse sands and gravels
Rocky substratum - 30-60 cm Little altered material, unstable soils
Weathered bedrock - 60 cm+ Semi-consolidated bedrock with high permeability
Horizon O - 0-5 cm Leaf litter and decomposing plant debris
Horizon A - 5-30 cm Black soil with high humus content
Horizon B - 30-70 cm Clays and base accumulation
Horizon C - 70-100 cm + Less developed soil with mineral deposits
Queretaro’s location between the Bajio and the Sierra Gorda gives it a key geographic importance, facilitating regional connectivity and climatic diversity. This transition favors the economic, ecological and social development of the state.
Type of soils presented:
- Feozem: Dark soil, rich in organic matter, good drainage and structure.
- Regosol: Poorly developed soil, with little differentiation of horizons, high erosion and rapid drainage.
Feozem
Regosol
Figure 3.1.8: Agriculture based on altitude, climate and soil type.
CRITICAL SOIL EROSION AND DEGRADATION
Symbology
Climates
Arid semi-hydrous
Arid temperate
Warm sub-humid
Semi-arid temperate
Semi-arid warm
Semi-arid semicalid
Semi-warm humid
Semi-warm sub-humid
Temperate sub-humid
Scale | 15:40000
Hydrology
Bodies of water
Rivers
Base map
Municipality division
Limit state
Urban stain
Level lines
1. Irrigated Agriculture in a Semiarid Climate: This area is located in a semiarid climate, where irrigated agriculture enables constant production despite low precipitation. However, the intensive use of water poses significant risks, such as aquifer overexploitation and soil salinization. The insufficient recharge of groundwater and the increased evaporation due to high temperatures can worsen soil degradation, reducing its fertility in the long term.
2. Rainfed Agriculture in a Temperate Subhumid Climate: This area is characterized by a temperate subhumid climate and rainfed agriculture, which depends on seasonal precipitation. Soil erosion in this region is linked to irregular rainfall, which can generate intense runoff and loss of fertile soil. The lack of irrigation infrastructure increases crop vulnerability to prolonged droughts, affecting agricultural stability and soil sustainability.
Valle de Querétaro Aquifer
Figure 3.1.9: Soil erosion and degradation conclusions.
CRITICAL SOIL EROSION AND DEGRADATION
3.1.10: Droughts introduction.
In Queretaro, droughts, erosion, and air quality have shifted over the years due to industrial expansion and human activity, impacting ecosystems, water availability, and agriculture—especially the food industry. Major pollution sources include livestock and agriculture, which contribute to emissions and resource depletion, while construction and industry further degrade air quality and land use. Tackling these challenges requires sustainable policies to balance economic growth and environmental preservation.
DROUGHTS, EROSION, AND AIR
Figure 3.1.12: Pollution in Queretaro
SOIL DEGRADATION AND ITS LINK TO AGRICULTURE
Symbology
Drough classification
Critic
Extremely vast
Very severe
vast Severe
Soil degradation
Scale | 15:40000
Light
Hydrology and land use
Bodies of water
Rain-fed agriculture
Irrigated agriculture
Base map
Municipality division
Limit state
Urban stain
Level lines
1. Soil Erosion and Degradation in Irrigated Agriculture
Excessive irrigation and lack of vegetation cover are accelerating soil erosion and degradation, reducing its fertility and long-term productivity. The loss of soil affects irrigation efficiency, as degraded land retains less water, leading to increased water waste and greater dependence on aquifer resources.
2. Soil Erosion and Degradation in Rainfed Agriculture
Irregular rainfall and the absence of conservation measures have intensified soil erosion, depleting the fertile layer and reducing crop productivity. The slope of the terrain and surface runoff further accelerate soil loss, increasing the risk of desertification and making ecosystem recovery more difficult.
Figure 3.1.12: Land and soil based on data from INEGI.
The state of Querétaro, located in central Mexico, presents a unique intersection between rapid urban development and a still-active agricultural sector. While often recognized for its industrial growth and technological advancements, agriculture remains a foundational component of the region’s identity and economy. Understanding the percentages related to agricultural production, the structure and scale of its industries, and the types of food produced and consumed in Querétaro offers critical insights into how the region balances modernization with tradition.
XVIII (Viceroyalty)
Growth of agriculture, textile and tobacco industries; Querétaro becomes subordinate to Mexico City.
XIX (Porfiriato)
Recovery of the textile industry, economic revival and partial modernisation.
1810
It was emphasized as a successful moment for Queretaro's economy.
1880
During Gonzalez Casio's governorship traditional crops such as beans, corn and squash are promoted.
1532
Founding of Queretaro as an agricultural center that supplied the nearby mines.
1846
Second industrialization stage.
Opening of the Hercules Factory.
1882
Third industrialization stage.
Modern industrialization. First industrial exhibition in Queretaro.
XX (Post-Mexican Revolution)
Industrialisation and shift from rural to urban economy.
1957
Kellogs establishes factory in Queretaro.
1938
Permission granted to sell coca-cola in Santiago de Queretaro.
XIX (Independence)
Economic crisis due to the War of Independence; collapse of mining and trade.
1838
First stage of industrialization. Manufacturing industry becomes the economic mainstay of the economy.
1881
Arrival of the railroad in Queretaro.
1917
Promulgation of the 1917 Constitution in the “Teatro de la República.” Querétaro becomes a key point in Mexico's political history.
1948
Coca cola opens bottling plant in queretaro.
Second half of the XX (Neoliberalism)
Arrival of industrial parks and accelerated urban rowth.
1973 - 1979
Arrival of more than 30 national and foreign industrial groups.
1969
Mexico - Queretaro highway inauguration.
1967
The city featured local fast food options, such as the famous “La Congregación Hot Dogs”.
1972
Industrial Park
Benito Juarez is inaugurated.
1990
Industrial park
Bernardo Quintana is inaugurated.
90s
Arrival of Cotsco in the 90s
1997
It is established that 31% of the land is made up of livestock and agricultural valleys.
1991
The main products were corn, beans and barley.
1986
1979
Inauguration “Josefa Ortiz de Dominguez” market
Oxxo opens in Queretaro.
1991
Arrival of the Walmart group in Queretaro.
1996
The Historic Centre of Querétaro is declared a World Heritage Site by UNESCO, boosting tourism.
2007
2014
The food industry sector is the second largest manufacturing industry in Queretaro.
Siglo XXI
Transformation of Querétaro into a metropolitan city, with strong participation of businessmen and real estate developers
237 hectares of Queretaro are agricultural land.
2017
Uber Eats arrives Querétaro
Queretaro’s economy is based on a combination of industry, livestock and agriculture; however, industry has played an important role in its economic growth. From the first stage of manufacturing industrialisation, economic development was evident, but it was in the second and third stages that significant changes took place with the arrival of the Hercules factory, the construction of the railway line and, later, modern industrialisation. Over the years, Queretaro’s growth has been remarkable, always accompanied by livestock and agriculture, which continue to be fundamental pillars of its economy thanks to its production of foodstuffs and raw materials.
Today, the arrival of foreign supermarkets and industries in Queretaro has boosted its economy, generating employment, strengthening trade and diversifying the supply of products and services.
Figure 3.2.2: Industry images.
Figure 3.1.12: Industrial activity in Queretaro
PRINCIPAL FOOD INDUSTRIES IN QUERÉTARO
PRINCIPAL FOOD INDUSTRIES IN QUERETARO
TRADITIONAL
Nestle produces of products under the CARNATION brand, the plant produces powdered milk, such as whole milk, skim milk and infant formulas.
GERBER cener creating more natural products with lower sugar, salt content, dairy products and cereasl.
Milk
Yogurt Desserts
Butter Cream and cheeses.
The Loma Linda ranch in Querétaro is one of Alpura's 342 dairy farms engaged in milk production.
Chicken
Egg
Pork
Beef
Operates several farms and processing plants in the state of Querétaro.
Wines including reds, whites, rosés and sparkling wines
bakery cream pancake
QUERETARO BAKERY
NESTLE ALPURA
BACHOCO LA REDONDA
Produces and distributes refrigerated and frozen foods, including dairy products and sausages.
Production of bread and bakery products.
Production and distribution of products such as milk, yogurt, cream and cheese.
flavored water), Topo Chico, Del Valle (Nectars and 100% Juices), Del Valle Frut Santa Clara (Juices and Milks),Santa Clara (Milk, Cream, Yogurt and Ready to Drink Coffee)
SIGMA BIMBO
LALA
PRIMUS BREWERY COCA-COLA
Scale | 15:40000
Symbology
Land use
-USD$ 1,000M/100M
-USD$ 100M/10M
-USD$ 10M/10k
-USD$ 10k/100
-USD$ 100/10
USD$ 10/100k
Base map
Municipality division
Limit state Level lines
Urban stain
In 2006, the municipality of Queretaro reflects a higher volume of both international sales and purchases, which suggests a high concentration of exporting and importing companies. However, it has a significant trade deficit (-US$1,231m) since it imports more than it exports. The same is true for El Marques, San Juan del Río and Corregidora, Colón and Ezequiel Montes. This means that there is a dependence on imports
Scale | 15:40000
Symbology
Land use
-USD$ 1,000M/100M
-USD$ 100M/10M
-USD$ 10M/10k
-USD$ 10k/100
-USD$ 100/10
USD$ 10/100k
Base map
Municipality division
Limit state Level lines
Urban stain
Compared to 2023, the differences in international sales and purchases are greater, indicating a growth in the state’s commercial activities. Colón and Cadereyta de Montes present a positive net balance, so they export more than they import. Likewise, the other municipalities reflect a greater dependence on imported inputs to sustain their economic development.
Main domestic sales destinations: State of Mexico, Guanajuato, Jalisco, Nuevo Leon. Main domestic purchasing destinations: Sinaloa, Michoacan, Veracruz, Guanajuato, Nuevo Leon, Baja california, Tamaulipas, Jalisco, Puebla. Queretaro’s main buying and selling destina- tions internationally: United States, Germany, Italy, United Kingdom, France, Canada, Switzerland and Japan.
Figure 3.1.7: Mercado de La Cruza, Queretaro
Queretaro spans a total area of 1.2 million hectares, of which 1.1 million are classified as rural. Of these rural areas, 36.8% is used for agricultural purposes. Even though only 20% of the territory used for crops is destined for forage, in terms of open pit agriculture production, a little more than half is destined for this type of cultivation. In addition to this, even though the state is known to be in a semi-arid region, most of what is planted is maintained through rain-fed agriculture.
Figure 3.1.7: Agricultural areas based on data from INEGI.
Cultivation products for forage
As previously mentioned, the majority of agricultural production is dedicated to forage crops, which serve as essential feed for livestock. The most prominent among these is forage corn, followed closely by fodder oats and cultivated grass. These crops are vital for sustaining the livestock industry, contributing to both local and regional agricultural economies. The production of these forage crops is primarily concentrated in the municipalities of Colon, El Marques, and Pedro Escobedo, where favorable climatic and soil conditions support their growth.
Forrage corn (25 6517.56 ton)
Fodder oats (16150.01 ton)
Cultivated grass (36 64.18 ton)
Fodder oats (21 338.68 ton)
Cultivated grass (5 540.75 ton)
Forrage corn (180 807.86)
El Marqués
Forrage corn (174 719.48 ton)
Fodder oats (10 790.46 ton)
Amealco de Bonfil
Pedro Escobedo
Colón
Landa de Matamoros
Cultivated grass (407.8 ton)
Figure 3.2.8: Crops for forage.
Cultivation products for human consumption
Regarding agriculture for human consumption, among the seasonal crops, the most significant are white grain corn, tomatillo, and broccoli, all of which play a crucial role in local and regional food production. On the other hand, the perennial crops include alfalfa—ranked as the second most-produced crop overall—along with asparagus and grapes, both of which contribute significantly to agricultural output. Lastly, the protected crops, which the main product is red tomato.
Pedro Escobedo
White grain corn (34 875.31 ton)
Broccoli (5 151.51 ton)
Asparagus (1 426.84 ton)
Huimilpan
Broccoli (2 490 ton)
Amealco de Bonfil
White grain corn (15 103.4 ton)
El
Colón
Tomatillo (2 695.44 ton)
Red tomato (290 ha)
Marqués
Broccoli (6 118.13 ton)
Alfalfa (90 629.79 ton)
Asparagus (16 28.55 ton)
Grapes (211 ton)
Ezequiel Montes
Tomatillo (11 262.26 ton)
Grapes (1 155.16 ton)
Tequisquiapan
Tomatillo (6 929.84 ton)
Grapes (432.45 ton)
Alfalfa (79 337.64 ton)
San Juan del Rio
White grain corn (51 979.07 ton)
Alfalfa (90 760.57 ton)
Asparagus (2 274 ton)
Red tomato (166 ha)
Tolimán Red tomato (314 ha)
Figure 3.2.10: Production for human consumption.
Main livestock products
Poultry farming stands out as the dominant sector in livestock production, largely due to the presence of major companies such as Pilgrim’s and Bachoco. These corporations account for 88.4% of total poultry production. In addition to poultry, cattle are raised for both meat and milk, along with pig farming. However, poultry farming significantly surpasses the production of these other livestock categories.
Milk (220 v873 lts)
Colón
Milk (299 479 lts)
Beef cattle (44 234 heads)
Eggs (579.031 ton)
Poultry meat (72 614.43 ton)
Milk (365 306 lts)
Pigs (35 807 heads)
Eggs (14 765.13 ton)
Pigs (45 368 heads)
Beef cattle (96 681 heads)
Poultry meat (81 213.96 ton)
Pigs (54 784 heads)
Poultry meat (86 624.11 ton)
Beef cattle (41 240 ton)
Eggs (4 010.92 ton)
Ezequiel Montes
Tequisquiapan
San Juan del Rio
Pedro Escobedo
El Marqués
Querétaro
Figure 3.2.12: Livestock production.
Asparagus has the highest water footprint, for 1kg produced there is a need of 1319L of water, but it can go up to 2150L, depending on the soil and irrigation methods, followed by white grain corn and alfalfa with a need of around 900L of water, even though the alfalfa can have lesser needs, and around 700L can be enough if the conditions allow it.
Grapes and forage corn have similar requirements, needind 442 L and 465 L respectively, tomatos require around 215L of water while the crops with the least impact are broccoli and forage grass, which need approximately 82 and 50L of water to produce 1kg of dry product respectively. It’s important to note that the water requirements for grass are estimated from those of a similar species (see reference list).
Figure 3.2.14: Water print by crop.
Figure 3.2.15: Industries and water.
FOOD PRODUCTION ON QUERÉTARO STATE
Scale | 15:40000
Symbology
Hydrology and land use
Low production
Medium production
High production
Bodies of water
Rain-fed agriculture
Irrigated agriculture
Wholesale trade of poultry meat and eggs
Wholesale trade of red meat
Wholesale trade of fruit and vegetables
Wholesale trade of livestick and poultry on the hoof
Wholesale trade of milk and diary products
Despite being a primarily manufacturing state with a mostly arid climate, Querétaro manages to have a good production of different vegetables and crops, as well as standing out in the production of poultry and eggs. Most of the production is concentrated in the municipalities of Pedro Escobedo, El Marqués, Colón and San Juan del Rio. These municipalities are the ones that stand out the most in agricultural production. However, when it comes to marketing these products, the large companies dedicated to their distribution are more concentrated in the state capital, due to its connection.
Figure 3.1.7: Agricultural areas based on data from INEGI.
Food security is a critical issue in Querétaro, where rapid urbanization and economic development coexist with persistent inequalities in access to nutritious food. While the state boasts a growing industrial base and increasing investment in infrastructure, not all of its residents benefit equally from these advancements. Many communities—particularly those on the urban periphery and in rural areas—face barriers to maintaining a healthy and balanced diet due to the rising cost of living, limited availability of fresh produce, and the dominance of ultra-processed foods in the market.
Figure
Also:
7.30% of children suffer from obesity
1.40% of children suffer from emaciation
According to the Encuesta Nacional de Salud y Nutrición (ENSANUT), almost half of the population in Querétaro suffers from obesity, therefore a lack of good nutrition. This places Quéretaro as the 12th state with the most percentage of obesity per population. This indicates a lack of food security in the state.
Figure 3.3.2: Obesity based on ENSANUT’s percentage of population with obesity in Querétaro. (2025)
According to ENSANUT (2018), the prevalence of overweight plus obesity in children under five years of age in the state of Querétaro in 2018 was 3.6%.
Data from 161 boys and girls aged 5 to 11 years of age were also analyzed. in the survey. The results showed that the prevalence of overweight and obesity was 23.4 and 10.8% respectively, giving a joint percentage of 34.3%.
Data from 129 Queretaro adolescents were also analyzed, and the results by sex in 2018 showed a prevalence of overweight and obesity in women of 31.4%, while in men it was 44.2%. The same survey in 2012 showed that 32.8% of male and female adolescents were overweight and/or obese, a figure that in 2018 was 37.5%.
Figure 3.3.3: Overweight and obesity in children based on data from ENSANUT.
Data was taken from people from both urban and rural environments. It can be seen that urban areas have a higher prevalence of overweight, but a lower prevalence of obesity, compared to rural areas, where the figures are closer. It should be noted that adding the percentages of obesity and overweight, gives 71.1% of people overweight in urban areas, and 70.7% in rural areas, so both types of environments have similar prevalences and are consistent with the national average, which is 70%.
Figure 3.3.5: Measuring food security based on ECLSA’s scale of food insecurity. (2025)
The Escala Latinoamericana y Caribeña de Seguridad Alimentaria (ELCSA), measures food security in three levels (mild, moderated and severe) based on 6 questions for families of adults and 12 for families with children. These question based themselves upon the frequency and nutritional quality of the meals consumed.
Symbology Scale | 15:40000
The Querétaro government calculated the porcentage of population per municipality that had food insecurity. This map shows the level os food insecurity, and as we can see, the most densely populated localities in the state tend to have more food availabilty as a whole. It is important to mention that the municipalities with the more severe food security also show a high poverty and salary rate, as well as lower total population, which makes affordable and variable food options a mayor scarcity. Limit state
Densily populated cities
Figure 3.3.6:: Food Security and Population Density, based on data made available by INEGI.
HEALTH: A MULTIDIMENSIONAL
Health is also greatly affected by immediate conditions. 75% of the Querétaro´s working force works over hours. This increases the chances of workers to have health affectations like obesity, such as the combination of working extra hours, night shifts, and having a bad work condition in stressful scenerios being of 92.80%, compared to all negative answers being 19.20%.
Figure 3.3.8: Work hours for Querétaro´s working population based on data from thesis.
FOOD INSECURITY: A MULTIDIMENSIONAL ISSUE
Here we compare Queretaro municipality with low food insecurity to the most vulnerable municipalities as shown in the prior map.
Poverty and health care are strictly linked with food security, proving it is a more complicated issue to tackle,
Figure 3.3.8: Work hours for Querétaro´s working population based on data from thesis.
Data on the number of health units by type of institution. The comparison of the metropolitan area of Queretaro with the State of Queretaro is shown, where it is observed that in the State of Queretaro there are more outpatient institutions and in both it is shown that there are no social assistance institutions.
Figure 3.3.10: Units by health institution.
Lack of access to health services in Queretaro remains a significant challenge, with 32% of the population without IMSS or ISSSTE coverage, this is due to the high level of informal employment, voluntary affiliation costs and lack of information about health services. This places the state in 13th place nationally in terms of lack of health services. It is important to mention that Servicios de Salud de Querétaro (SESEQ) manages state hospitals and health centers, which offer free or low-cost care to those who are not affiliated with IMSS or ISSSTE.
The proposed budget for the health sector for 2025 is approximately 7,085 million pesos.
Figure 3.3.11: Health coverage for population.
Population without IMSS or ISSSTE coverage.
Queretaro state place nationally in terms of lack of health services.
Symbology
INTERCONNECTION OF AVAILABILITY
Scale | 15:40000
Rain-fed agriculture
Irrigated agriculture
Rivers
Base map
Municipality division
Hydrology and land use
Bodies of water
Urban stain
Limit state Level lines
1. Most enrichment, agriculture, and population is located in the metropolitan area, granting it economic growth and an ever changing industry. It not only poses a central point for production, it is also strategically located near urban green spaces and even protected zones. Here we can also find one the most delicate and limited resource, water. Querétaro’s Aquifer, being one of the most privileged locations in the whole state, and overall being over exploited with the continued growth of population and the urban stain of the city. All of this combined prove to give the main urban stain a real sense of food security for most of its population.
2. Toliman and Cadereyta de Montes in the center of the state poses one of the most complicated disparities in the entire state. Its location is disconncted from industries and agricultural production, high social deprivations cause an alarming food insecurity in the area.
3. Amealco, in the other hand, is located in the heart of agricultural production, but its high indicators in poverty and lack of health services position it in the number one state with highest food insecurity, proving hunger and nutritional security is a multidimensional issue.
Valle de Queretaro Aquifer
Figure 3.3.12: Food security and agriculture conclusions.
A secure food system is one that ensures consistent access to affordable, culturally appropriate, and nutritionally adequate food for all. In Querétaro, this means not only increasing local food production, but also strengthening distribution networks, supporting local farmers and vendors, and rethinking the presence and layout of food outlets across the state. The importance of a good diet cannot be overstated: it is directly linked to public health outcomes, educational performance, and long-term economic resilience. Diet-related diseases such as obesity, diabetes, and hypertension are increasingly prevalent in Mexico, and Querétaro is not exempt from these national trends.
Symbology Scale | 15:40000
Retail store’s walkable accesibility
1km radius
500m radius
Walkable accesibility
Retail food stores
Base map
Municipality division
Limit state Level lines
Urban stain
15% of the population in the Metropolitan area have walkable accesibility to retail stores such as Walmart, HEB, and smaller businesses like fruit shops.
This presents a clear challenge, making good nutritional foods less readily available for most of the population.
Figure 3.4.2: Food Availability and Food Swamps, based on data made available by INEGI.
Symbology
Retail store’s walkable accesibility
1km radius
500m radius
Walkable accesibility
Oxxos
Scale | 15:40000
Base map
Municipality division
Limit state
Urban stain
Level lines
90% of the population, on the otherhand, have direct walkable access to convenience stores, such as Oxxo, Asturiano, and Extra. This shows how much of food swamps are predominant in the area, and how availability of nutritionally valuable food is much harder to access. Non nutrionally valuable food is not only prevalent, but also more easy to access.
Figure 3.4.2: Food Availability and Food Swamps, based on data made available by INEGI.
Scale | 15:40000
Symbology
Distrito Qro
Metropolitan area
Base map
Municipality division
Limit state
Urban stain
Level lines
In the state of Queretaro there is a variety of citizen and government initiatives that aim to supply and distribute food for the population in the metropolitan area. Comedor en tu calle, for example, has fed about 115,000 people just between 2020-2021.
It is important to note that there are other initiatives that have a national range and which benefict the whole state, among these programs we can find the LICONSA Milk Social Supply Program, which aims at the easy access of basic products for communities of high and very high marginalization. The DICONSA Rural Supply Program also has the purpose of easing the access of rural and marginalized communities to food products, which ensures the effective compliance of the social rigth to food.
Figure 3.4.3: Government food ineciatives.
FOOD INICIATIVES AND PROGRAMS IN QUERETARO
There are over 175,000 out of the 1,049,777 citizens (around 16%) who benefit from government aid programs in the Querétaro municipality, these include food support initiatives such as Comedor contigo, as well as health and transport initiatives which ultimately contribute to the improvement of the life quality of the population.
Alongside these programs, in the city of Santiago de Querétaro, there are food-related initiatives that are led by the citizens, including urban gardens and non-profit community kitchens.
Figure 3.4.4: Affectation of food iniciatives in the population.
Figure 3.4.5: Civilian food iniciatives and its accesibility.
Scale | 15:40000
Symbology
Initiatives
5min walkable radius
10min walkable radius
Community kitchens
Urban gardens
Urban gardens
Base map
Municipality division
Limit state
Urban stain
Distrito Qro
Level lines
As seen in this map, Santiago de Querétaro counts with four urban gardens, an entrepreneurship which seeks to help families and businesses to grow their own food and have a more sustainable lifestyle, as well as a communitary kitchen that opperates through donations and is often giving meals to families and children in vulnerable situations.
Figure 3.4.5: Civilian food iniciatives and its accesibility.
We have to understand the limitations of food that Querétaro currently has:
Can food pose a solution for climate degradation?
What food can enrich soils, lessen the water print, and nourish the population´s diet?
Can the population´s health improve with the proximity and disponibility of fresh produce?
Can water consumption be reduced with a change in what we eat?
Food security can be achieved with shorter food to plate distribution, healthier options, a more centralized agriculture and by using processes with less water consumption.
Figure 3.4.5: Civilian food iniciatives and its accesibility.
Santiago de Queretaro is one of the fastest-growing cities in Mexico, standing out for its economic, industrial, and educational importance. This chapter analyzes its urban and demographic context, exploring its role in the state and national economy, the relevance of its metropolitan area, and the challenges posed by its rapid growth. It examines the stark contrasts between urban and rural areas, as well as the issues of marginalization and social lag resulting from poor urban planning.
The Metropolitan Area of Queretaro is one of Mexico’s main urban centers. It maintains close ties with other metropolitan areas, such as Guadalajara, Mexico City, León, and San Luis Potosí, due to their geographical proximity and the economic and social integration that define the Bajío region. These cities share similar patterns of urban growth, industrialization, and infrastructure development, further strengthening their interconnection. Urbanization within a state does not occur in isolation; rather, it is shaped by the growth and development of its major cities and their connections with surrounding urban centers.
URBAN GROWTH
Urban area growth has accelerated in recent decades, particularly since the 1990s and 2000s, due to the industrial boom and the influence of both national and foreign investments. This expansion intensified between 2010 and 2020, driven by the development of the real estate sector, the expansion of industrial parks, and increased migration as people sought better opportunities.
GROWTH IN QUERETARO
Queretaro’s population has surged due to economic growth and job opportunities, surpassing the city’s urban planning capacity. This rapid expansion has led to unstructured development, causing the loss of green spaces, urban fragmentation, and excessive housing expansion, putting significant pressure on available land.
CONSECUENCES OF URBAN GROWTH
The accelerated urban growth in Querétaro has brought various problems that affect the quality of life and environmental balance. Uncontrolled expansion has led to soil degradation due to the excessive number of industries, resulting in the loss of fertile land and increased pollution. Additionally, the lack of proper urban planning has caused issues in infrastructure, leading to severe traffic congestion, longer travel times, and mobility difficulties. This growth has also prevented many neighborhoods from accessing basic services. Furthermore, pressure on water resources continues to rise due to the arrival of new industries and population growth, which has already put water supply at risk. Likewise, urban fragmentation has made it difficult to integrate communities, resulting in unequal and disorganized development. Given this scenario, we must ask ourselves: Do we really need all this in Querétaro?
Scale | 1:1000000
Base Map
Bodies of water
Urban green space
Farming area
Qro limit
Urban blocks
Train tracks
The polygon exhibits a predominantly urban environment, similar to the surrounding areas. As a result, this space hosts a high concentration of services, facilities, industries, and businesses, along with well-developed infrastructure and a diverse food offering. However, at a distance of one kilometer, rural areas can be identified, which may present opportunities for peri-urban agriculture. It is essential to analyze how these rural areas can be integrated into Distrito QRO and what agro-food security strategies can be implemented to benefit both urban and rural areas.
Distrito
Zones
Symbology
Figure 3.1.1: Regions in Querétaro based on data from INEGI.
SOCIAL GAP
Scale | 1:1000000
Symbology
Base Map
Bodies of water
Urban green space
Farming area
Distrito Qro limit
Urban blocks
Train tracks
High social lag
Low social lag Lag per block
Medium social lag
Marginalization
In the rural areas, it can observe a significant social backwardness and marginalization, along with an excessive accumulation of garbage in the space. The polygon seems to end right when this social backwardness begins. What actions could be implemented in Distrito QRO to address these issues and improve the quality of life for the people living in these areas.
Distrito QRO is an innovative project aimed at transforming 470 hectares into a hub for economic, social, and educational development. This chapter presents the district’s vision, objectives, and the key stakeholders involved in its implementation. It analyzes its strategic location within the university corridor and compares it with similar innovation districts to evaluate strengths and areas for improvement. Finally, surveys are included to assess public perception of the project.
Distrito QRO is an innovation and development hub that includes the Tecnológico de Monterrey (Tec de Monterrey) Queretaro campus, the Autonomous University of Querétaro (UAQ), and the National Institute of Mexico. It is a 470-hectare zone designed to be “the best option for university life.” It is an inclusive model aimed at generating well-being and prosperity for people. It consists of traditional neighborhoods, adequate housing, infrastructure, services, commerce, public spaces, a network of green areas, and spaces for innovation and entrepreneurship.
Figure 3.1.1: Regions in Querétaro based on data from INEGI.
The Distrito QRO project is an initiative aimed at bringing together efforts from the private sector, academic institutions, and the government to promote coordinated development. In this framework, the participation of citizens, universities, and authorities is crucial to achieving a positive impact on the community.
This district aims to: -Promote research, entrepreneurship, and innovation. -Strengthen cooperation between various institutions. -Encourage the creation of innovative companies. -Generate high-value jobs. -Provide solutions to social and environmental issues.
Additionally, the project focuses its efforts on three key areas of research: the evolution of the food industry, environmental sustainability, and the development of responsible manufacturing processes.
Distrito Querétaro is an urban ecosystem that brings together various key actors for its development and operation. At its core, the main academic institutions—UAQ, Tec de Monterrey, and ITESM—play a fundamental role in talent development and knowledge generation. Surrounding them, students, residents, the private sector, and the government drive the district’s social and economic dynamics. Additionally, the community, industry, the municipality of Querétaro, and the state government contribute to establishing this space as a hub for innovation, education, and sustainable development.
IS AN INNOVATION DISTRICT?
An innovation district is an urban and economic development strategy aimed at transforming a specific area of the city into an ecosystem of knowledge, technology, and entrepreneurship. Unlike traditional technology parks, which are usually located on the outskirts of cities, innovation districts are developed in well-connected urban areas, allowing for greater interaction between companies, universities, and the community. In Mexico, two important examples are Distrito TEC and the Yucatán Science and Technology Park. WHAT
Located near Merida, Yucatan; It was created to be the scientific and technological hub for higher education institutions in Yucatán, aiming to drive technological development and enhance the state’s competitiveness.
DistritoTec, located in Monterrey, NL. This proiect aims to revitalize the campus to create and maintain an environment that fosters Innovation, creativity, and entrep.
DistritoQRO is an initiative that fosters innovation and sustainable growth in Queretaro by linking universities, businesses, and the government to drive research, technology, and urban development.
Yucatan Science and Technology Park
Distrito TEC
Distrito QRO
The urban morphology of the district is defined by land use, urban image, and the distribution of infrastructure and neighborhood landmarks. This chapter examines built and unbuilt spaces, highlighting opportunities for growth and consolidation. It also identifies tourist attractions and areas with potential for increasing the district’s appeal. The chapter concludes with an analysis of public spaces, emphasizing the lack of parks and recreational areas.
Symbology
Base Map
Bodies of water
Urban green space
Farming area
Distrito Qro limit
Urban blocks
Train tracks
Land Use
Scale | 1:1000000
Residential
Traditional neighborhoods
Residential outside the polygon
Industrial zone
Industrial zone outside the polygon
The polygon features diverse land uses, including residential areas, traditional neighborhoods, industrial zones, and commercial establishments. Industry plays a major role, and Distrito QRO seeks to integrate these environments for balanced development.
Traditional neighborhoods are vital to Querétaro’s identity, with some preserving their customs while others have been urbanized. Disused industrial areas are being repurposed into mixed-use housing, revitalizing communities and enhancing urban dynamics.
Manufacturing is Querétaro’s leading sector, but the sharp transition between industrial and residential areas raises a crucial question: Should land use be modified to align with Distrito QRO’s objectives?
Figure 3.1.1: Regions in Querétaro based on data from INEGI.
Symbology
Base Map
Bodies of water
Urban green space
Farming area
Distrito Qro limit
Urban blocks
Train tracks
URBAN VOIDS
Scale | 1:1000000
Constructed area
Constructions
The Nolli map allows to visualize urban voids, offering valuable insight into areas of opportunity both within and outside the defined boundary. By highlighting these voids, the map serves as a tool for urban planning, helping to identify locations where new developments or interventions could be implemented. Additionally, it makes it possible to pinpoint areas where intervention might be challenging due to the high density of existing constructions, guiding planners in understanding where future growth might be restricted or where strategic approaches are needed.
Figure 3.1.1: Regions in Querétaro based on data from INEGI.
Symbology
Base Map
Bodies of water
Urban green space
Farming area
Distrito Qro limit
Urban blocks
Train tracks
Equipment
Scale | 1:1000000
Public healthcare
Public education
In the QRO District, there are various public schools ranging from elementary to high school. Additionally, the polygon includes several healthcare areas, contributing to the well-being of the community.
Figure 3.1.1: Regions in Querétaro based on data from INEGI.
LANDMARKS AND MEETING POINTS
Symbology
Base Map
Bodies of water
Urban green space
Farming area
Qro limit
Equipment
Scale | 1:1000000
Landmarks
Meeting points
The Nolli map allows to visualize urban voids, offering valuable insight into areas of opportunity both within and outside the defined boundary. By highlighting these voids, the map serves as a tool for urban planning, helping to identify locations where new developments or interventions could be implemented. Additionally, it makes it possible to pinpoint areas where intervention might be challenging due to the high density of existing constructions, guiding planners in understanding where future growth might be restricted or where strategic approaches are needed.
Distrito
Urban blocks Train tracks
Figure 3.1.1: Regions in Querétaro based on data from INEGI.
Symbology
Base Map
Bodies of water
Urban green space
Farming area
Distrito Qro limit
Urban blocks
Train tracks
TOURISTIC AREAS
Equipment
Inside the area
Outside the area
Potential touristic
Most of the tourist attractions are located outside the defined polygon. Within the polygon, there are very few established attractions, but several spaces could be utilized. This could be achieved either by proposing the construction of entirely new facilities or by adapting existing infrastructure, such as Alcanfores Park, which could be repurposed for tourism or recreational purposes.
Figure 3.1.1: Regions in Querétaro based on data from INEGI.
Scale | 1:1000000
Symbology
Base Map
Bodies of water
Urban green space
Farming area
Distrito Qro limit
Urban blocks
Train tracks
Equipment
Alcanfores Park-North section
Alcanfores Park-South section
Ejido San Pablo Sports facility
Querétaro 2000 Park
Sport faccilities
Most of the tourist attractions are located outside the defined polygon. Within the polygon, there are very few established attractions, but several spaces could be utilized. This could be achieved either by proposing the construction of entirely new facilities or by adapting existing infrastructure, such as Alcanfores Park, which could be repurposed for tourism or recreational purposes.
Figure 3.1.1: Regions in Querétaro based on data from INEGI.
The concept of “15-minute cities” suggests that all essential services should be within a 15-minute walk. A City Observatory study found that only three areas, all near the center, meet this criterion, while most neighborhoods are over 30 minutes away from services, increasing car dependence. Interestingly, although some areas are within a 30-minute walk, the analyzed area is relatively well-connected compared to the city’s outskirts, where services are an hour away. This highlights broader urban development issues. How can we improve walkability in neighborhoods to benefit the entire city?
Figure 3.1.1: Regions in Querétaro based on data from INEGI.
Distrito QRO must address Santiago de Queretaro’s environmental challenges, considering its topography, climate, and natural resources. This chapter explores the impact of the urban heat island effect, floodprone areas, and water supply issues. Using maps and graphics, it proposes a sustainable approach to mitigate these risks and improve the district’s resilience to climate change.
The predominant winds come for a large part of the year from the east and to a lesser extent from the northeast. Queretaro annually receives an average of 2,785 hours of light or 7.6 hours of sunshine daily.
North 8:00 am 3:00 pm
7:00 pm
Figure 3.1.1: Regions in Querétaro based on data from INEGI.
Figure 3.1.1: Regions in Querétaro based on data from INEGI.
FLOODS
Scale | 1:1000000
Symbology
Base Map
Bodies of water
Urban green space
Farming area
Distrito Qro limit
Urban blocks
Train tracks
Equipment
Potentially flooding area
Queretaro is not considered a fully flood-prone state, but there are some areas that are susceptible to flooding, especially during the rainy season. The polygon in question, being close to a river, has a higher risk of flooding. Additionally, other areas are affected by floods due to the lack of adequate drainage infrastructure, which worsens water accumulation problems in these areas.
Figure 3.1.1: Regions in Querétaro based on data from INEGI.
Figure 3.1.1: Regions in Querétaro based on data from INEGI.
The socioeconomic context of the district is crucial for its planning. This chapter presents demographic data, surveys on employment and income levels, and an analysis of population density. Additionally, it reflects on the district’s potential impact on the local community, questioning the risks of displacement and possible effects on the local economy due to the reorganization of industrial and commercial activities.
According to INEGI 21,553 people reside in the polygon.Within this population, a classification is carried out taking into account various factors, such as age, gender, and disabilities.
Image: Population data by locality-Own elaboration, information collected from INEGI
Image: Population data by locality-Own elaboration, information collected from INEGI
The population distribution indicates a community mainly in the productive age group (15-59 years), highlighting strong demands for employment, higher education, and affordable housing. A notable child and youth population underscores the need for educational infrastructure and recreational areas. Additionally, a significant elderly population points to the necessity for healthcare services and accessible mobility spaces. Finally, the presence of individuals with disabilities emphasizes the importance of creating inclusive urban infrastructure.
Scale | 1:1000000
Symbology
Base Map
Bodies of water
Urban green space
Farming area
Distrito Qro limit
Urban blocks
Train tracks
Equipment
0-0.0024
0.0024-0.0076
0.0076-0.0143
0.0143-0.0246
0.0246-2.8664
Most of the tourist attractions are located outside the defined polygon. Within the polygon, there are very few established attractions, but several spaces could be utilized. This could be achieved either by proposing the construction of entirely new facilities or by adapting existing infrastructure, such as Alcanfores Park, which could be repurposed for tourism or recreational purposes.
Figure 3.1.1: Regions in Querétaro based on data from INEGI.
Housing typologies
House Bussines
• 1-2 floors
• 2+ bedrooms
• 250 m²
• 1-2 floors
• 50-80m²
Mixed-use housing Colective housing
• 1-2 floors
• 100-250 m²
• 1 floor
• 2-3 bedrooms
• 80-100 m²
According to the data provided by INEGI, the QRO District has a total of 5975 homes, of which 98.09% are private homes. Of these private homes, 85.86% are inhabited, while 10.81% are not inhabited. This indicates that the vast majority of the homes are private, and a significant portion of them are inhabited, although a small percentage remains unoccupied.
The mobility system within Distrito QRO is shaped by major avenues, public transportation, and bicycle routes. This chapter explores traffic patterns, physical barriers, and accessibility within the area. Using maps and surveys, it analyzes the efficiency of the current transportation system and the challenges of ensuring safe, efficient, and sustainable mobility.
MAIN ROADS
Scale | 1:1000000
Symbology
Base Map
Bodies of water
Urban green space
Farming area
Distrito Qro limit
Urban blocks
Train tracks
Roads
Bernardo Quintana Boulevard
5 de Febrero Avenue
Primary roads Roadways
Metropolitan roads
Secondary roads
In the district, there are three main avenues that define the boundaries of the polygon: Av. 5 de Febrero, Bernardo Quintana, and Av. Universidad. These avenues limit the opportunity to expand into other neighborhoods due to their poor design and limited walkability. How can we create facades to connect these neighborhoods and ensure that the polygon doesn’t close off access to other areas?
Figure 3.1.1: Regions in Querétaro based on data from INEGI.
AREAS WITH THE HIGHEST VEHICLE TRAFFIC
The traffic flow in the Qro District is usually calm, as there are few streets with traffic lights there is no flow problem, the only spaces where there is greater traffic intensity is in the university corridor that covers Ejido, José Amílcar Vidal and Avenida Tecnológico only because of the traffic lights, even so this does not imply a time greater than 15 minutes, everything else is very accessible.
Symbology
Base Map
Bodies of water
Urban green space
Farming area
Distrito Qro limit
Urban blocks
Train tracks Scale
Routes
Route 09
Route 12
Route T-03
Route T-04
Route T-06
Route T-10
The Qrobus is the main bus route in Queretaro and covers a large part of the city, but its route is concentrated on main streets and roads. This makes it an efficient option for traveling along the busiest corridors, although in some areas, it may be necessary to walk more or make transfers to reach specific destinations.
Figure 3.1.1: Regions in Querétaro based on data from INEGI.
Symbology
Base Map
Bodies of water
Urban green space
Farming area
Distrito Qro limit
Urban blocks
Train tracks
UNIVERSITY TRANSPORT ROUTE
Equipment
Scale | 1:1000000
Most university routes cross Distrito QRO, concentrating around UAQ. Some of the institutions that are part of this project include UVM, UTEQ, UPQ, UAQ, ITQ, among others. These routes aim to pass through areas near residential zones to maximize convenience for university students.
Figure 3.1.1: Regions in Querétaro based on data from INEGI.
Scale | 1:1000000
Symbology
Base Map
Bodies of water
Urban green space
Farming area
Distrito Qro limit
Urban blocks
Train tracks
Equipment
Cicleways
Figure 3.1.1: Regions in Querétaro based on data from INEGI.
How close are you to your work/School?
Access to healthy and sustainable food is a key factor in the quality of life for district residents. This chapter addresses food security through the concept of foodscapes, examining consumption patterns, public health impacts, and the availability of supermarkets, markets, and small food businesses. Through maps and graphics, it analyzes where residents purchase their groceries and how this influences their well-being.
The Querétaro District is a key space to discuss foodscapes due to its urban development and inequalities in food access. Despite having an urban environment, the district lacks nearby supermarkets, markets, and fruit and vegetable stores, which limits access to fresh and healthy foods, especially for low-income families. The food offering in the area is dominated by processed and low-nutritional-value products, contributing to issues such as obesity and other related diseases. It is essential to implement public policies that promote the accessibility of fresh products and the integration of urban gardens to improve the health and wellbeing of the community.
DO YOU HAVE OR KNOW PEOPLE WITH A CONDITION SUCH AS OBESITY, HYPERTENSION, OR DIABETES?
In Querétaro, various initiatives drive the development of the agri-food sector. The Querétaro Agri-Food Cluster provides advisory services, training, and evaluations to improve business models, exports, and sustainability in the industry. The Diploma in Innovation Management, offered by INNOVAGRO, trains professionals in strategic planning and intellectual property within the agri-food sector. CIMMYT offers training in sustainable agricultural practices, promoting technologies to enhance productivity and sustainability. Meanwhile, the Agricultural Markets Consulting Group (GCMA) provides market analysis, consulting, and training to strengthen the sector’s competitiveness. These initiatives aim to modernize and strengthen agri-food production in the region.
In Querétaro and nationwide, spending on non-alcoholic beverages, prepared foods, and dining out has increased, while the consumption of basic foods has declined due to high prices. A significant percentage of the population, including preschoolers, regularly consumes nonrecommended products such as sweetened beverages and snacks, contributing to the rise in chronic diseases like obesity and diabetes. Despite food availability, malnutrition and anemia persist among vulnerable groups. To address these challenges, the Querétaro government has implemented food assistance and nutritional education programs, along with policies to regulate the sale of unhealthy foods in schools and improve access to nutritious options in local markets and stores.
Symbology
Base Map
Bodies of water
Urban green space
Farming area
Distrito Qro limit
Urban blocks
Train tracks
Equipment
Supermarkets
Markets
On the map, it can be seen that there are only two supermarkets within the polygon, and they are not in a central area accessible to everyone. Instead, they are located in a corner, making it necessary for people in the southern part of the polygon to travel a long distance. Likewise, there is no market within the polygon, making it more difficult to buy healthier and more affordable products.
Figure 3.1.1: Regions in Querétaro based on data
Symbology
Base Map
Bodies of water
Urban green space
Farming area
Distrito Qro limit
Urban blocks
Train tracks
Equipment
MINIMARKETS
Scale | 1:1000000
Minimarkets
This map shows the location of the various minimarkets within the polygon, allowing us to infer that they are distributed across different points. In the northern area, there are only 7, in the center 6, and in the south 8.
Although their distribution appears to be balanced, their close proximity to each other creates an accessibility issue, as they are located on the outskirts of residential areas rather than in more central locations. This may make access difficult for residents, especially those living in areas farther away from these establishments.
Figure 3.1.1: Regions in Querétaro based on data
Symbology
Base Map
Bodies of water
Urban green space
Farming area
Distrito Qro limit
Urban blocks
Train tracks
Food establishments Equipment
Local cornershops
On the map, it can be seen that there are only two supermarkets within the polygon, and they are not in a central area accessible to everyone. Instead, they are located in a corner, making it necessary for people in the southern part of the polygon to travel a long distance. Likewise, there is no market within the polygon, making it more difficult to buy healthier and more affordable products.
Figure 3.1.1: Regions in Querétaro based on data from INEGI.
Symbology
Base Map
Bodies of water
Urban green space
Farming area
Distrito Qro limit
Urban blocks
Train tracks
Equipment
Scale | 1:1000000
Soda fountains
Fast food stands
Local restaurants
On the map, it can be seen that there are only two supermarkets within the polygon, and they are not in a central area accessible to everyone. Instead, they are located in a corner, making it necessary for people in the southern part of the polygon to travel a long distance. Likewise, there is no market within the polygon, making it more difficult to buy healthier and more affordable products.
Figure 3.1.1: Regions in Querétaro based on data from INEGI.
Yucatan Science and Technology Park
Symbology
Base Map
Bodies of water
Urban green space
Farming area
Distrito Qro limit
Urban blocks
Train tracks
Equipment
Scale | 1:1000000
Inside the area
Outside the area
Potential touristic
Most of the tourist attractions are located outside the defined polygon. Within the polygon, there are very few established attractions, but several spaces could be utilized. This could be achieved either by proposing the construction of entirely new facilities or by adapting existing infrastructure, such as Alcanfores Park, which could be repurposed for tourism or recreational purposes.
Figure 3.1.1: Regions in Querétaro based on data
VEGETABLE GARDENS INITIATIVES
Symbology
Base Map
Bodies of water
Urban green space
Farming area
Distrito Qro limit
Urban blocks
Train tracks
Equipment
Scale | 1:1000000
Inside the area
Outside the area
Potential touristic
Most of the tourist attractions are located outside the defined polygon. Within the polygon, there are very few established attractions, but several spaces could be utilized. This could be achieved either by proposing the construction of entirely new facilities or by adapting existing infrastructure, such as Alcanfores Park, which could be repurposed for tourism or recreational purposes.
sustainability and UAQ, sustainable develop society and industry, academic institutions, major challenges
The District QRO seeks to promote agri-food sustainability through a consortium formed by UNAM, ITESM, and UAQ, driving interdisciplinary projects that foster sustainable agri-food production. The main objective is to develop solutions that have a positive impact on society and industry, strengthening collaboration between academic institutions, companies, and the public sector to address major challenges in the agri-food sector.
Strengths:
-Vacant land that can be efficiently repurposed for urban gardens or markets.
-Promotion of research and entrepreneurship in the agri-food sector.
-Collaboration between major companies and universities.
-Variety of land uses, allowing integration of productive and commercial projects.
-Policies focused on food and sustainable production.
-Existing urban gardens within the district.
-Involvement of governments and relevant agencies.
-Development of projects and competitions with agri-food approaches.
Opportunities:
-Transform vacant land or building rooftops into food production spaces.
-Development of apps or digital platforms that connect local producers with end consumers.
-Utilize underused spaces in the district for efficient food production through urban gardens.
-Expand the district to more neighborhoods with agro-food planning.
-Improve pedestrian infrastructure and access to markets.
-Use available spaces for sports and wellness activities.
-Establish local markets and greengrocers to improve access to fresh food.
-Promote research programs and the development of agricultural technologies applied to the district.
Weaknesses:
-Lack of markets and greengrocers within the district.
-Physical and urban barriers that hinder pedestrian mobility and access to fresh food.
-Limited availability of fresh and healthy food, with fast food dominating the area.
-Proximity to socially disadvantaged areas, increasing the food accessibility gap.
-Limited public transportation, making it difficult to purchase healthy products.
-Distant facilities, requiring long commutes to access markets and essential services.-Difficulties in modifying land use
Threats:
-Dependence on ultra-processed food due to a lack of accessible healthy options.
v-Expansion of the district without considering agri-food infrastructure.
-Lack of investment in markets and urban agriculture.
-Community and economic actors’ resistance to change.
-Rising costs of basic food products, reducing access to nutritious options.
-Difficulties in modifying land use
MANIFESTO
Our manifesto is essential because it provides all teams with a shared vision and strategic direction. It aligns our efforts around common goals and ensures that we are not working in silos, but rather moving forward together with purpose. By clearly defning our values, priorities, and ambitions, the manifesto helps every team identify where they can contribute most effectively.
Additionally, it highlights key challenges and areas of opportunity across the organization. This clarity empowers teams to focus their energy on solving the right problems—those that have the greatest impact on our mission. With a unifed strategy and a clear understanding of where we can improve, we can innovate more effectively, collaborate more meaningfully, and grow stronger together.
DISRUPT THE NORMS: QUESTION WHO CONSTROLS OUR FOOD AND CITIES
We challenge and dismantle the social structures that dictate our surroundings and food consumption habits. We refuse to accept the economic systems that normalize inequality and unsustainable practices, where profit is prioritized over people and the environment. We demand a shift towards values that center justice, sustainability, and collective prosperity.
CITIES THAT HEAL: DESIGN FOR LIFE, NOT EXPLOITATION
We reclaim cities as spaces of healing, nourishment, and coexistence, where urban design prioritizes both human and non-human life. Cities must regenerate rather than extract, in all scales, from individuals to the collectives as communities in the urban landscape.
REVOLUTIONIZE FOOD: EDUCATE, INNOVATE, LIBERATE
We demand the evolution and technologization of food systems based on the informed valorization of food. Education must drive a cultural shift toward responsible production and consumption. Awareness must be raised about where food comes from, how it is processed, and the people behind its production. Transparency in every step of the food journey is essential, ensuring this knowledge is accessible to everyone.
POWER TO THE PEOPLE: FOOD JUSTICE STARTS WITH US
We insist on public policies that actively combat economic, social, and climate disparities. Producers, consumers, and the public must co-govern food systems to ensure justice and resilience.
food sovereignty
food education
food insecurity
deserts and oases
the paradox of health and food
food alternatives
food waste
carbon footprint
Energy consumption
Air Quality
Soil Degradation
Water Stress
Connection of the district with the urban and rural areas
Patterns between industry, school, and residence
Queretaro as a distribution center
Universal Accessibility
Social Backwardness
Economic Systems
Collective Participation
Local Production
Awareness of the current landscape
Technify processes Care Cities
Creation of green and regenerative public spaces from an interspecies coexistence perspective using urban voids.
Local Production
Awareness of the current landscape
Contribute to agricultural sustainability through the design of infrastructures that reduce water consumption.
Technify processes Care Cities Food Pollution
Soil degradation
Return to traditional food consumption practices by incorporating new adaptable and replicable technologies, and producing food in the urban environment.
Creation of green and regenerative public spaces from an interspecies coexistence perspective using urban voids.
Create environments that promote healthy eating by designing spaces that offer fresh and local foods.
Create efficient solutions for food production in urban environments through hydroponics and aquaponics inside buildings.
Contribute to agricultural sustainability through the design of infrastructures that reduce water consumption.
Return to traditional food consumption practices by incorporating new adaptable and replicable technologies, and producing food in the urban environment.
Create common spaces that promote food-related dialogue among civil society, governments, and institutions fostering co-governance, aiming to address issues such as equity in food access and promoting more inclusive and sustainable public policies.
Reuse underutilized infrastructure to develop production and circular economy strategies through the revitalization of public life.
Create environments that promote healthy eating by designing spaces that offer fresh and local foods. Create efficient solutions for food production in urban environments through hydroponics and aquaponics inside buildings.
Promote inclusive and accessible spaces that address the food needs of communities in their immediate surroundings through participation strategies.
Create common spaces that promote food-related dialogue among civil society, governments, and institutions fostering co-governance, aiming to address issues such as equity in food access and promoting more inclusive and sustainable public policies.
Reuse underutilized infrastructure to develop production and circular economy strategies through the revitalization of public life.
Promote inclusive and accessible spaces that address the food needs of communities in their immediate surroundings through participation strategies.
Minimize food waste through short marketing and distribution circuits, encouraging the decentralizatio n of supply points.
Reduce the carbon footprint by designing spaces that optimize the use of limited land, such as rooftops, promoting self-sufficiency.
Raise awareness about consumption trends through food sovereignty, highlighting production processes and water consumption to promote a cultural shift.
Promote care in cities through innovation in urban spaces, encouraging self-care to achieve community care.
Provide alternatives of nutritious and affordable food through a community system of self-production and local exchange.
Reduce dependence on the water system by incorporating rainwater harvesting, treatment, and storage systems at community production sites.
BIBLIOGRAPHY
Bossio, D., Obersteiner, M., Wironen, M., Jung, M., Wood, S., Folberth, C., Boucher, T., Alleway, H., Simons, R., Bucien, K., Dowell, L., Cleary, D., & Jones, R. (2021). Foodscapes: Toward food system transition [Map, pp. 9-10]. The Nature Conservancy, International Institute for Applied Systems Analysis, & SYSTEMIQ. De Representación Arquitectónica, F. M. M. /. T. (n.d.). Paisaje | TRA. http://www.mindeguia.com/temas/paisaje_cs.html
De Rooden, P. (Ed.), Grubb, A., & Wiskerke, H. (2012). Food for the city: A future for the metropolis. nai010 publishers.
Division, I. a. E., Forbes, H., Peacock, E., Abbot, N., & Jones, M. (2024, March 1). Food Waste Index Report 2024. Think Eat Save: Tracking Progress to Halve Global Food Waste. https://wedocs.unep.org/handle/20.500.11822/45230
Downs, SM, Ahmed, S, Fanzo, J et al. (2020) Food environment typology: advancing an expanded definition, framework, and methodological approach for improved characterization of wild, cultivated, and built food environments toward sustainable diets. Foods 9, 532.CrossRefGoogle ScholarPubMed
Food History Timeline, Events in Food History, 50,000 BC to 2024. (n.d.). https://www.foodreference.com/html/html/yearonlytimeline.html
Fujs, T., & Kashiwase, H. (2024, March 16). Strains on freshwater resources: The impact of food production on water consumption. World Bank Blogs. https://blogs.worldbank.org/en/opendata/strains-freshwater-resources-impactfood-production-water-consumption#:~:text=Today%2C%20around%2070%20percent%20of,goes%20to%20the%20industrial%20sector.
Future Foodscapes Research Unit (FFRU). (n.d.). Future Foodscapes Compendium: An index of agro-architectural models for a viable planetary future. Retrieved from https://foodscapescompendium.es/ Rooden, P. (Ed.). (2012). Food for the City: A Future for the Metropolis. NAI Publishers. Lewis, J. (2024, March 5). 11 Effective solutions for food waste. Earth.Org. https://earth.org/solutions-for-food-waste/
New cases of type 1 diabetes (0-14 Y), in 1,000s. Type 1 diabetes estimates in children and adolescents. (n.d.). https://diabetesatlas.org/data/en/indicators/9/
Méjean, C., & Recchia, D. (2022). Urban foodscape and its relationships with diet and health outcomes. Proceedings of the Nutrition Society, Cambridge University Press. Retrieved form: https://www.cambridge.org/core/journals/ proceedings-of-the-nutrition-society/article/urban-foodscape-and-its-relationships-with-diet-and-health-outcomes/CD7EA0A874D9210A66AE15703B8E7018
Ritchie, H., Rosado, P., & Roser, M. (2022, December 2). Environmental impacts of food production. Our World in Data. https://ourworldindata.org/environmental-impacts-of-food
Ritchie, H. (2022, February 4). What is undernourishment and how is it measured?. Our World in Data. https://ourworldindata.org/undernourishment-definition
Ritchie, H., Rosado, P., & Roser, M. (2023, June 19). Hunger and undernourishment. Our World in Data. https://ourworldindata.org/hunger-and-undernourishment
Sharma, S. (2015). Food preservatives and their harmful effects. International Journal of Scientific and Research Publications, 5(4), 1-2. Retrieved from https://citeseerx.ist.psu.edu/ document?repid=rep1&type=pdf&doi=5385ad183ba002dcc6d91b1fd228068dbcca31a2
Smoor, T. (2023, August 27). 6 facts you should know about water use in agriculture. Cargill. Retrieved February 17, 2025, from https://www.cargill.com/story/agriculture-water-use
World Health Organization: WHO. (2023, November 16). Food additives. https://www.who.int/news-room/fact-sheets/detail/food-additives
World Health Organization: WHO. (2024, March 1). Malnutrition. https://www.who.int/news-room/fact-sheets/detail/malnutrition
World Health Organization. (n.d.). Malnutrition in children. World Health Organization. https://www.who.int/data/nutrition/nlis/info/malnutrition-in-children