ARCH 753 : BUILDING PERFORMANCE SIMULATION EVIDENCE BASED ANALYSIS
CLIMATE ZONE: 4A
PRIYAL PAREKH
SITE CHOSEN : St. Louis, Missouri

Climate Zone : 4A


Climate type : Humid subtropical
The hot summer season lasts for around 4 from JunetoSept , with an average daily high temperature above 26°C. The hottest month of the year in St. Louis is July, with an average high of 26°C and low of 21°C. The cold season lasts for around 3 months, from NovembertoFebruary , with an average daily high temperature below 10°C.


The coldest month of the year in St. Louis is January, with an average low of 3°C.
The relativity humidity is extremely high most times of the year with rainfall throughout the year high probability in summer months.

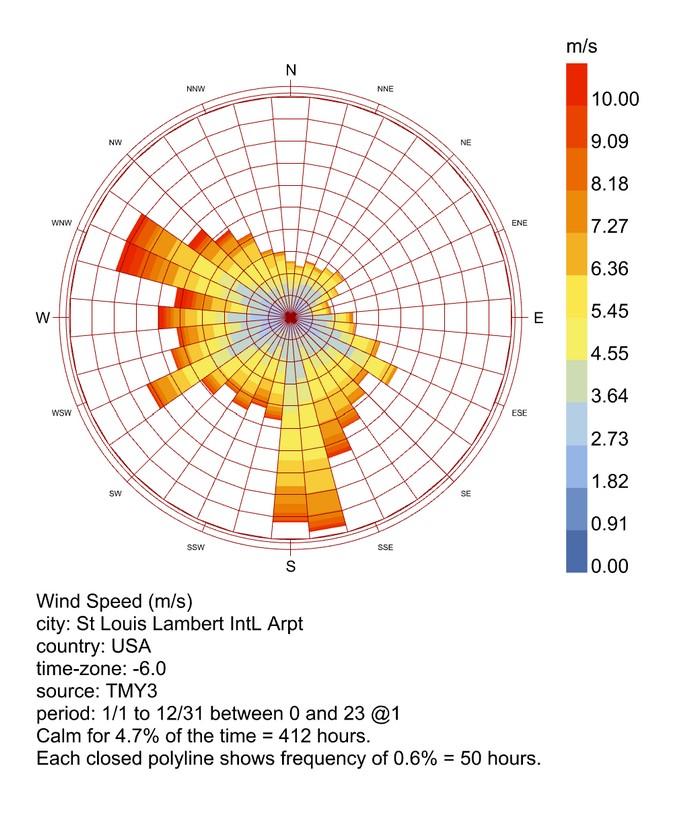
Strong winds blow from the north-west and south which are the two main directions need to be shielded from strong winter winds.
WIND ROSE
RELATIVITY HUMIDITY
DEW POINT TEMPERATURE
MACROCLIMATE SITE ANALYSIS
DRY BULB TEMPERATURE
SPRING SUMMER FALL WINTER
ARCH 753: EVIDENCE BASED ANALYSIS
The psychometric chart is a measure to show comfort hours in summer and winter respectively. Being a tropical climate, the summer is much harsher which is why higher discomfort hours exist during these month, the higher humidity adds to this. Passive strategies like occupant cooling with fans, dehumidification, capturing internal heat and correct placement and sizing of openings.

The sun path charts show the sun angles move lower from summer to winter as time of the day progresses. The sun angle moves southward from spring to winter, and the angles get lower as well which makes the south receive the winter sun the most. Moving from east to west throughout the day the east side receives most of the radiation throughout the year. This needs to be shielded from in summer.


SKY DOME
TOTAL RADIATION DIRECT RADIATION DIFFUSE RADIATION


PSYCHOMETRIC CHART ( SUMMER)

PSYCHOMETRIC CHART (WINTER)

SUNPATH
MACRO CLIMATE SITE ANALYSIS
SPRING SUMMER FALL WINTER
ARCH 753: EVIDENCE BASED ANALYSIS
The massing of the building was explored with different floor ratios for the total area. The different options iterated showed good results but the floor plan would get too narrow which would be not an ideal design option.
The aim is to achieve an even distribution of the daylighting metrics, thermal comfort and even energy optimization.

The selected option fulfils these criteria and optimizes a floor ratio of 15 which is oriented towards east-west so the longer facades face north and south and can gain heat from these two mainly.


MASSING STRATEGIES
FLOOR RATIO : 10
The angles in summer are more overhead and northward more steeper angles. The highest temperature sun rays fall from the west direction which is why the west wwr ratio is chosen to be lesser.

The angles during winter moving southward are at a lower angle, more gentler toward the windows. The aim is to bring in the winter sun, desired to allow heat in and make the space warmer passively.
FLOOR RATIO : 15
FLOOR RATIO : 20
FLOOR RATIO : 25
MICROCLIMATE SITE ANALYSIS
SUMMER WINTER
ARCH 753: EVIDENCE BASED ANALYSIS
DESIGN MASSING & STRATEGIES
To select the correct ratio for massing for the apartment, and wall window ratio a study of different scenarios by running iterations was run to understand how they would perform in means of occupant thermal comfort and optimize daylighting. These iterations were tested for Useful daylight illuminance and then one ratio was chosen for the massing of the apartment .


ARCH 753: EVIDENCE BASED ANALYSIS
DESIGN MASSING & STRATEGIES
• The best option of massing and orientation chosen for this apartment would be along the East west axis.
• This climate has high humidity in winter months - December to February – shading on that side Northwest – lesser WWR
• The South façade can have the highest WWR to allow the winter sun to penetrate inside.
• The west WWR should be smallest or negligible since the strongest wind direction blows so to avoid it into spaces.
• The highest temperature sun rays fall from the west direction which is why the west WWR ratio is chosen to be lesser.
• North can have a lesser WWR than south – summer sun angle
According to these passive design strategies and massing iterations, a WWR was chosen & the program of the spaces was divided accordingly.
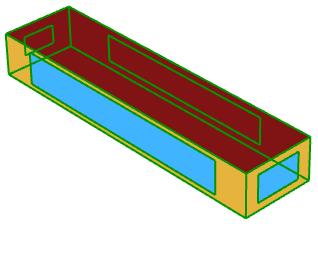
• The space is divided to place the office space In the west direction and the main apartment in east.
• The aim was achieve maximum gain from east in the early morning which is optimized with this placement.
• The office is a space used more throughout the day so west façade can be optimized for allowing sunlight during evening timings.
• The total area of 150 sq mts. is divided into a 50 sq meter west office and remainder 100 sq meter bedroom space.
CHOSEN WALL WINDOW RATIOS :


North Façade = 0.4
East Façade = 0.2
South Façade = 0.6
West Façade = 0.2
ARCH 753: EVIDENCE BASED ANALYSIS OFFICE SPACE 50 sq mts. APARTMENT SPACE 100 sq mts.
ANNUAL DAYLIGHT ANALYSIS OFFICE BEDROOM OFFICE BEDROOM
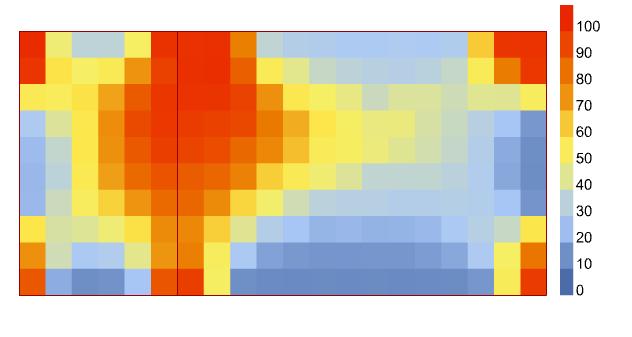
The daylighting in the above charts is the point in time analysis charts show the distribution of useful daylight in the apartment through different seasons of spring summer & winter. As per the sun angle and solar radiance the lux levels are highest in the spring months during afternoon specially from the south since angles are lower. Shading devices like louvers could help reduce this high amount, but in winter the lux levels are much lower.


SPRING SUMMER WINTER 9 AM 9 AM 9 AM 12 PM 12 PM 12 PM 6 PM 6 PM 6 PM LUX ARCH 753: EVIDENCE BASED ANALYSIS
POINT IN TIME DAYLIGHTING ANALYSIS


9 AM 21ST JUNE DGP = 0.37 12 PM 21ST JUNE DGP = 0.38 6 PM 21ST JUNE DGP = 0.21 9 AM 21ST DECEMBER DGP = 0.23 12 PM 21ST DECEMBER DGP = 0.26 6 PM 21ST DECEMBER DGP = 0 GLARE ANALYSIS ARCH 753: EVIDENCE BASED ANALYSIS 9 AM 21ST JUNE DGP : 0.45 12 PM 21ST JUNE DGP : 0.47 6 PM 21ST JUNE 9 AM 21ST DECEMBER DGP : 0.28 12 PM 21ST DECEMBER DGP : 0.31 6 PM 21ST DECEMBER
BASELINE MODEL


ASSUMPTIONS :
A base model with certain assumptions on its construction type and material property values are taken which creates a scenario to analyze this apartment if it were constructed using a wood framed building.

INPUTS:
2019: ClimateZone4: Wood Framed
R Value – 12
U value : 0.38
SHGC – 0.5
PERCENT OF PEOPLE DISSATISFIED
Average PPD for Apartment 22.21 %
Average PPD for Office = 51.02 %
Construction types : Typical Insulated Wood Framed Exterior Wall-R16 - 25mm Stucco ; 5/8 in. Gypsum Board Typical Insulation-R15 ; 5/8 in. Gypsum Board
PREDICTED MEAN VOTE
Average PMV for Apartment : -0.501858 (in the slightly cool range)

Average PMV for Office = -0.91478 (extreme during both seasons)

R VALUE = 12 U VALUE = 0.38 Btu/hr-ft2-F 1.81 KwHr/ m2 SHGC = 0.5
ARCH 753: EVIDENCE BASED ANALYSIS
BASELINE ENERGY ANALYSIS
TOTAL LOADS
Due to being a tropical climate most of the loads are heating and cooling, mostly through mechanical ventilation. These can be reduced through various passive strategies. The thermal load charts show that most of the energy consumed is due to heating loads in winter which cause more than 50% of the total energy used throughout the year.
TOTAL EUI = 424.611kWh/m2
Heating=254.167kWh/m2
Cooling=99.278kWh/m2
Interior Lighting=12.889kWh/m2
Electric Equipment=34.167kWh/m2
Water Systems=24.111kWh/m2
HEATING ENERGY CHART
COOLING ENERGY CHART
THERMAL LOAD BALANCE CHART
MONTHLY BALANCE CHART - Office


MONTHLY BALANCE CHART - Apartment

ARCH 753: EVIDENCE BASED ANALYSIS
ITERATIONS: WITH LOUVERS

A couple of iterations were tried to test the most optimum louver depths along with the north wwr sine it receives summer sun, the loads were monitored.

ARCH 753: EVIDENCE BASED ANALYSIS
OPTIMIZATION
This option uses a lightweight construction technique of a steel frame and minimal north openings had a barely any difference on the results of percent dissatisfied but the Eui ends up increasing which is why this option is not desired


This option with deeper 600mm louvers uses the same construction technique of wooden framed structure which brings a good amount of useful daylight inside the space but it does not reduce the EUI infact increases it which is why this option is not preferred to.
HB Construction Types : Metal Building
North WWR : 0.2
Louvers Depth : 0.30M
EUI : 452.889

PPD_1 : 22.464798
PPD_2 : 55.456388
UDI - APARTMENT : 59.652
UDI - OFFICE : 62.2615
HEATING LOAD : 91.278
COOLING LOAD : 12.889
INTERIOR LIGHTING LOAD : 34.167
HB Construction Types : Wood Framed
North WWR : 0.2
Louvers Depth : 0.60M
EUI : 450.833
PPD_1 : 22.460799
PPD_2 : 55.454632
UDI - APARTMENT : 66.061286
UDI - OFFICE : 67.9225
HEATING LOAD : 86.278
COOLING LOAD : 12.889
INTERIOR LIGHTING LOAD : 34.167
ARCH 753: EVIDENCE BASED ANALYSIS
OPTIMIZATION
This option uses a lightweight construction technique of a steel frame and minimal north openings and brings about less Eui with the least percent dissatisfied and high daylight illuminance which is a preferred scenario.
This option uses a lightweight construction technique of a steel frame and minimal north openings and brings about less Eui with the least percent dissatisfied and high daylight illuminance which is a preferred scenario.


HB Construction Types : Steel Framed
North WWR : 0.2
Louvers Depth : 0.45M
EUI : 451.722


PPD_1 : 22.450766
PPD_2 : 55.453561
UDI - APARTMENT : 62.936286
UDI - OFFICE : 65.076167
HEATING LOAD : 88.611
COOLING LOAD : 12.889
INTERIOR LIGHTING LOAD : 34.167
HB Construction Types : Steel Framed
North WWR : 0.2
Louvers Depth : 0.60M
EUI : 450.833
PPD_1 : 22.460799
PPD_2 : 55.454632
UDI - APARTMENT : 66.126857
UDI - OFFICE : 67.772833
HEATING LOAD : 86.278
COOLING LOAD : 12.889
INTERIOR LIGHTING LOAD : 34.167
ARCH 753: EVIDENCE BASED ANALYSIS
OPTIMIZATION

The results from the first optimization were not as expected and did not reduce the EUI to a great extent which has been the goal of the entire process. Another round of iterations was run to create and optimize by changing the material properties. The chosen modifiers were the R value of walls and interior ceiling and floors and U value for window glass material.
The R values were modified from a range of 12 to 16 and the U value is from 1.82 Kwh/-m to 1.94 kwh-/m which along with a couple of WWR options to understand the best possible option.
The optimization aim is to produce the lease EUI, to keep PPD to the least , highest UDI and Daylight autonomy and least heating & cooling eui’s.

ARCH 753: EVIDENCE BASED ANALYSIS
OPTIMIZATION – PART 2

HB Construction Types : Metal Building


North WWR : 0.2
East WWR : 0.2
South WWR : 0.4
R value : 12
U Factor : 1.81
EUI : 411.778
PPD_1 : 51.026088
PPD_2 : 22.654792
UDI - APARTMENT : 52.231
UDI - OFFICE : 55.862833
DA : 98.6815
HEATING EUI : 91.722

COOLING EUI : 12.889
INTERIOR LIGHTING EUI : 34.167
ARCH 753: EVIDENCE BASED ANALYSIS
OPTIMIZATION – PART 2


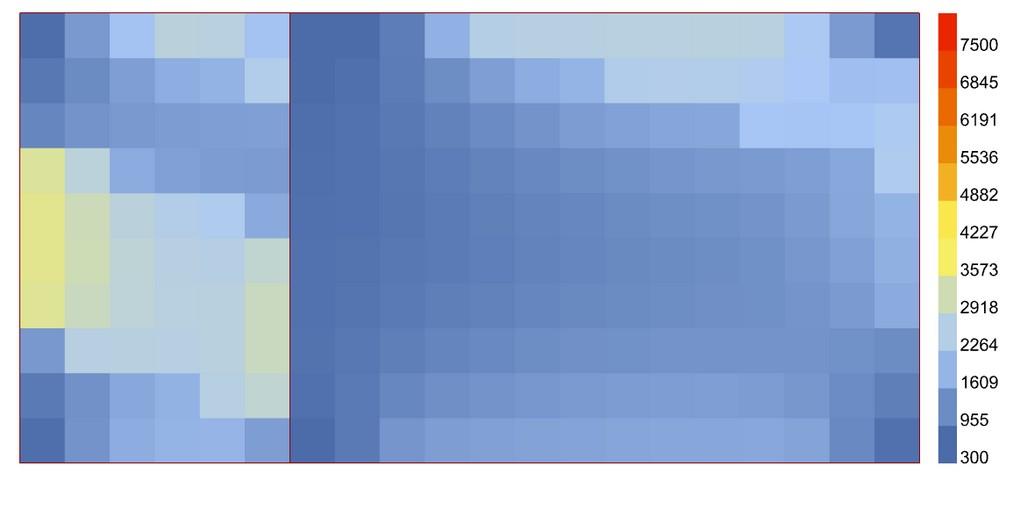
This option optimises the performance of the bedroom and office both by causing a significant decrease in Eui. The UDI levels are also high with less dissatisfied percent which brings about an optimum result. The monthly load charts show a decrease In the cooling loads as well compare to the baseline model.


ANNUAL LOAD BALANCE CHART
MONTHLY LOAD BALANCE CHART


HB Construction Types : Metal Building North WWR : 0.2 East WWR : 0.4 South WWR : 0.4 R value : 14 U Factor : 1.81 EUI : 406.333 PPD_1 : 22.583322 PPD_2 : 51.004363 UDI - APARTMENT : 52.318071 UDI - OFFICE : 56.091667 DA : 98.678833 HEATING EUI : 91.611 COOLING EUI : 12.889 INTERIOR LIGHTING EUI : 34.167
ARCH 753: EVIDENCE BASED ANALYSIS
CONCLUSION
It is observed that in the optimized version the end results by modifying the R value, U value and choosing optimum values of wall window ratios the end results are improved versions from the baseline model.
CHOSEN CASE BASELINE CASE
The optimized option in which the heating and cooling loads evidently reduce
TOTAL EUI = 406.333 kWh/m2
Heating=249.222kWh/m2

Cooling=85.944kWh/m2
Interior Lighting=12.889kWh/m2
Electric Equipment=34.167kWh/m2
Water Systems=24.111kWh/m2
The heating loads are quite high adding most to the total end use intensities
TOTAL EUI = 424.61 kWh/m2
Heating = 254.16 kWh/m2

Cooling = 99.27 kWh/m2
Interior Lighting = 12.88 kWh/m2
Electric Equipment = 34.16 kWh/m2
Water Systems=24.111 kWh/m2
ARCH 753: EVIDENCE BASED ANALYSIS
Total EUI PPD Office PPD Apartment UDI Office UDI Apartment Heating EUI Cooling EUI BASELINE 424.61 22.21 54.0 44.3 45.2 254.16 99.27 OPTIMIZED MATERIALS 406.33 22.58 51.00 56.09 52.31 249.22 85.94
