

Since its establishment in 2016, Cincinnati Preschool Promise (CPP), a non-profit initiative funded by a taxpayer levy, has focused on providing children with open access to high-quality preschools and resources for improving school readiness To achieve this, CPP helps families find high-quality preschool programs and offers Tuition Assistance (TA) funding for children ages 3 and 4 who live at or below 300% of the federal poverty level (FPL) to enroll. CPP also aids preschools with Quality Improvement (QI) and supports preschool teachers and Providers through grants and professional development opportunities. This report analyzes the effects of CPP funding and programs, including the results for preschoolers and the returns for Cincinnati. The evaluation is a mixed-methods evaluation conducted by CPP’s external independent program evaluator, INNOVATIONS in Community Research and Program Evaluation at Cincinnati Children’s Hospital Medical Center. The evaluation incorporates data from both agency-level and student-level sources provided by CPP, Cincinnati Public Schools (CPS), and collaborating agencies. INNOVATIONS’ timing in accessing, analyzing, and reporting data as an independent evaluator may result in minor reporting differences between INNOVATIONS and CPP The summary of variables included in this report are as follows:
• Kindergarten Readiness of CPP Participants Compared to Non-CPP Participants
• Preschooler Development and Progress as Measured by Preschool Assessments
• Progress of CPP Participants in Grades 1-3
REACH AND ACCESS
• Enrollment of Preschoolers in CPP Programs
• Preschool-Age Children Not Enrolled in CPP
• Preschool Programs Participating in CPP
• Social and Economic Characteristics of Preschoolers, Preschool Providers, and Neighborhoods
• Access to High-Quality Preschool Because of CPP TA Funding
• Utilization of TA Funding
• Seat Availability and Enrollment Capacity of High-Quality Preschools
KEY FINDINGS FROM THE YEAR EIGHT EVALUATION:
The evaluation of CPP in its eighth year revealed several outcomes demonstrating the initiative’s effectiveness. Key findings are summarized below. Kindergarten readiness, preschooler progress, and Grades 1-3 results represent TA preschoolers enrolled in the CPP Community Provider Network and CPS Preschools. Preschool enrollment, Provider characteristics, community stakeholder experiences, and financial-related results represent CPP Community participants only The report's main sections describe additional results, details, and definitions of CPP programming and the evaluation methodology.
CPP Tuition Assistance Participants Achieve Higher Kindergarten Readiness and Literacy Outcomes
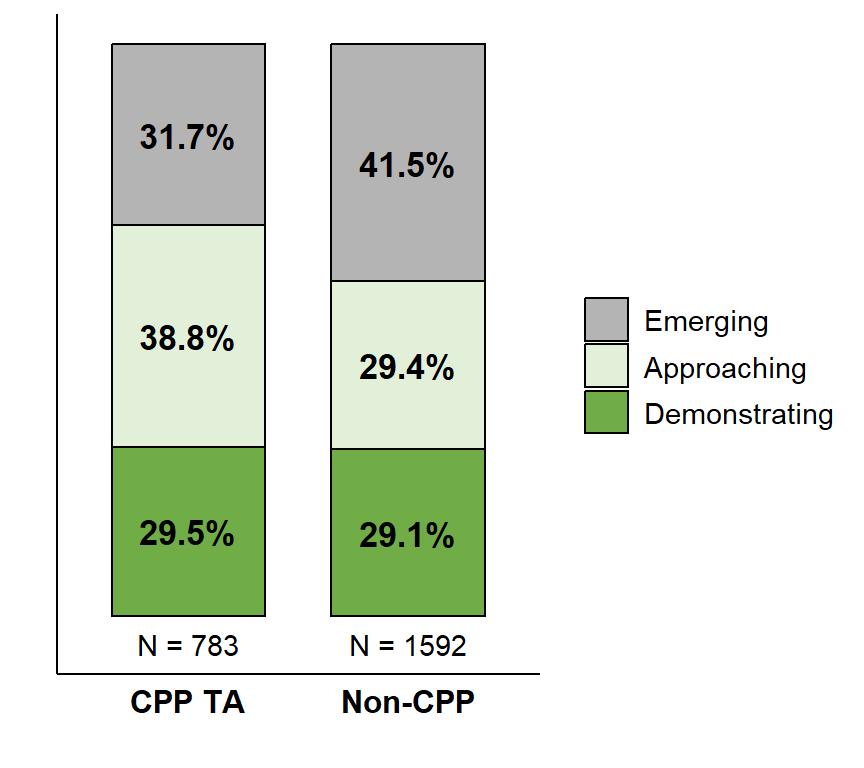
• CPP TA participants at community-based and CPS preschools were more frequently (68.3%) Approaching or Demonstrating readiness on the overall Kindergarten Readiness Assessment-Revised (KRA-R) compared to Non-CPP kindergarteners (58.5%).
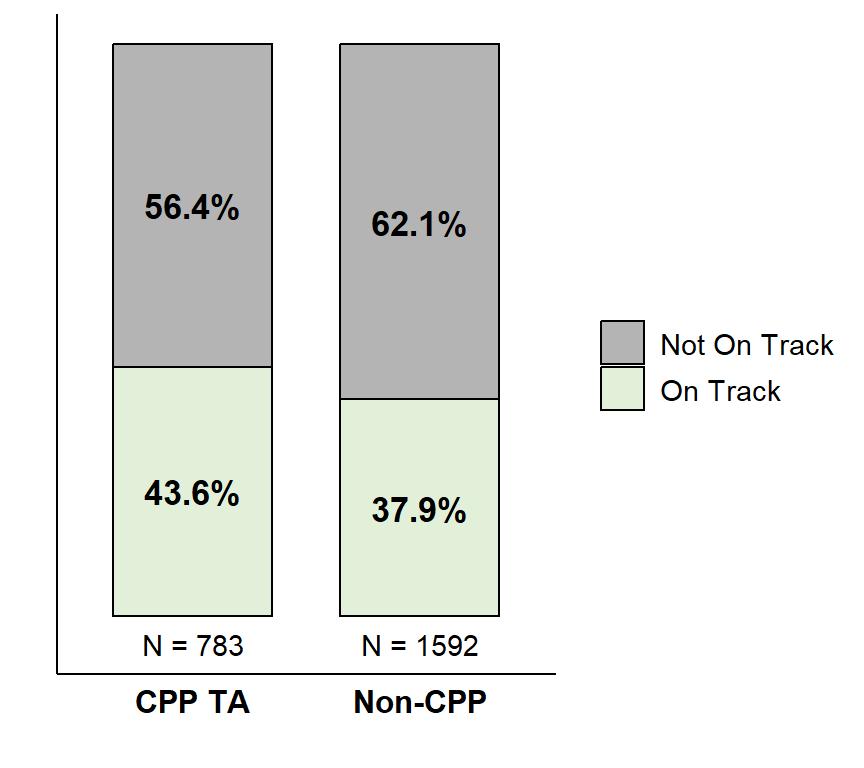
• Language and Literacy subtest results revealed that the percentage of CPP TA participants On Track for literacy by 3rd grade was 43.6% compared to 37.9% of Non-CPP kindergarteners.
• CPP TA participation increased the odds of Demonstrating readiness by 33.1% and the odds of being On Track by 62.9% when statistically controlling for the other predictors
Preschooler Assessments Show Universal Learning and Development from Fall to Spring
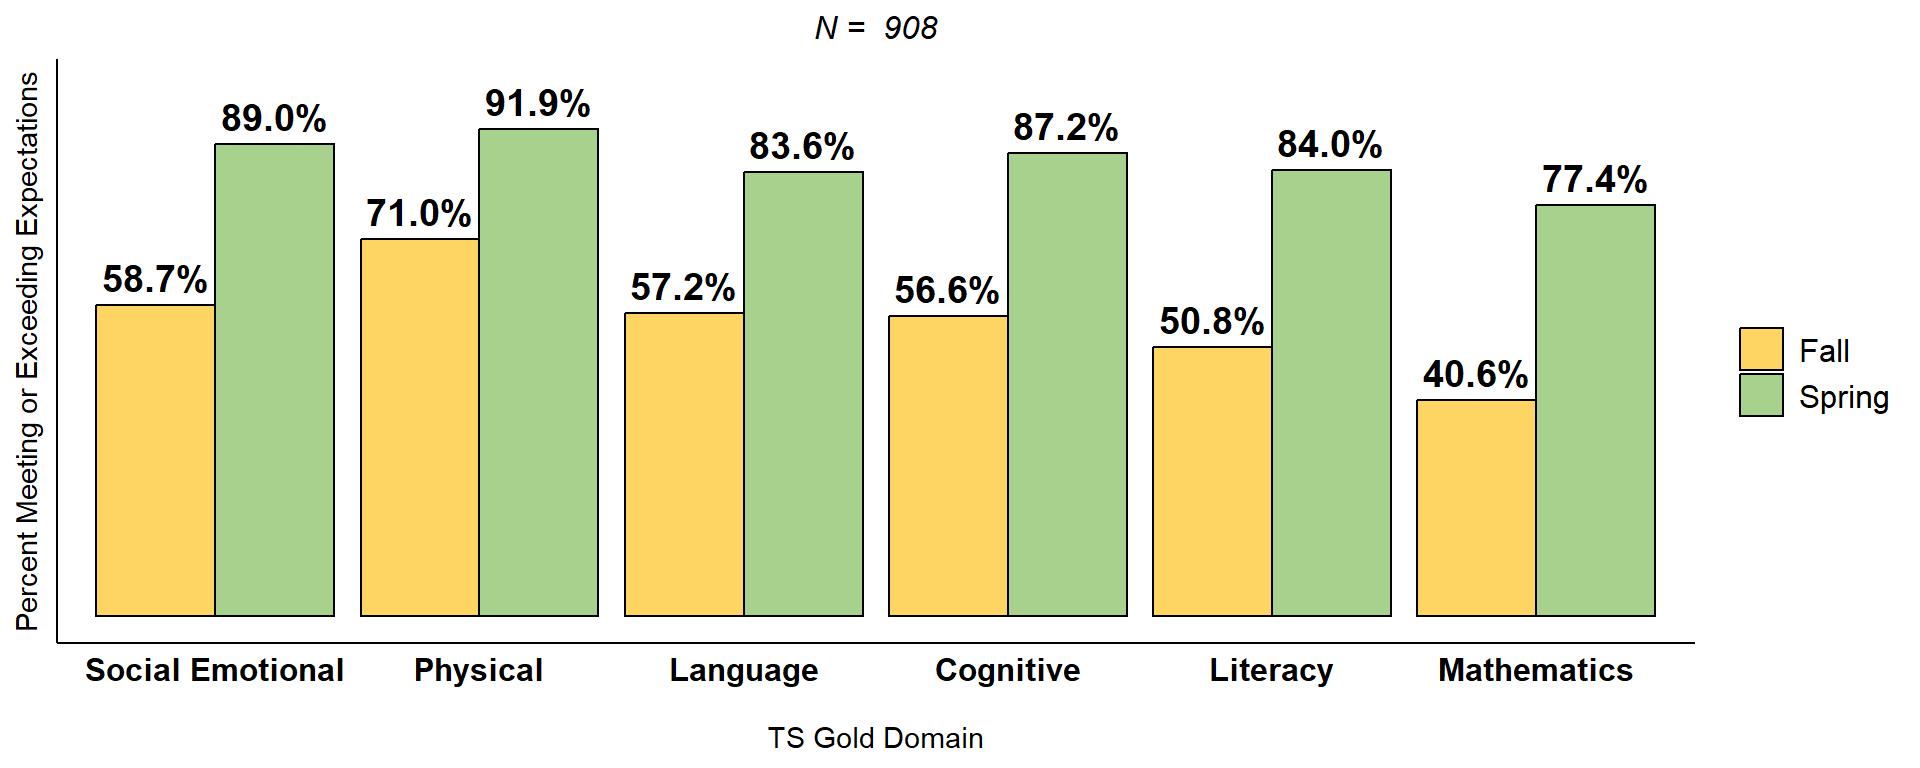
• Preschoolers at community-based and CPS preschools showed universal improvement across all domains of the Teaching Strategies GOLD® (TS GOLD®) from fall 2024 to spring 2025. In the spring, preschoolers met or exceeded expectations at high frequency within the Social Emotional (89.0%), Physical (91.9%), Language (83.6%), Cognitive (87.2%), Literacy (84.0%), and Mathematics (77.4%) domains of measurement, with Mathematics showing the largest amount of growth (an increase of 36.8 percentage points).

Former CPP Participants Show Improvement in Grades 1-3 Reading and Math Scores from Fall to Spring
• During the 2023-24 school year, 52.3% of a combined CPP TA cohort of 3rd graders scored proficient or higher on the Next Generation Assessment (NGA) English Language Arts (ELA) test compared to 52.1% of economically disadvantaged students districtwide. CPP and CPS 3rd graders also performed similarly on the NGA Math test.
• CPP TA participants in grades 1-3 showed growth in i-Ready Diagnostic Reading assessment scores from fall to spring.
CPP Community Providers Increase Enrollment and Attendance of Tuition Assistance Participants
• In 2024-25, 1,090 preschoolers received CPP tuition assistance to enroll in high-quality community-based preschools, the highest enrollment to date.
• These CPP TA preschoolers attended 89.1% of scheduled days, an increase of 5.7 percentage points since Year 1.
CPP Advances and Expands Quality Preschool Access Throughout the CPS District Community
• As of June 2025, there were 208 Providers in the CPP Community Provider Network representing a capacity of 3,749 quality and high-quality seats. Among them were 156 TA Provider sites representing a total capacity of 2,989 high-quality seats for children.
• A total of 100 Providers were located in quality gap neighborhoods representing a capacity of 1,803 seats.
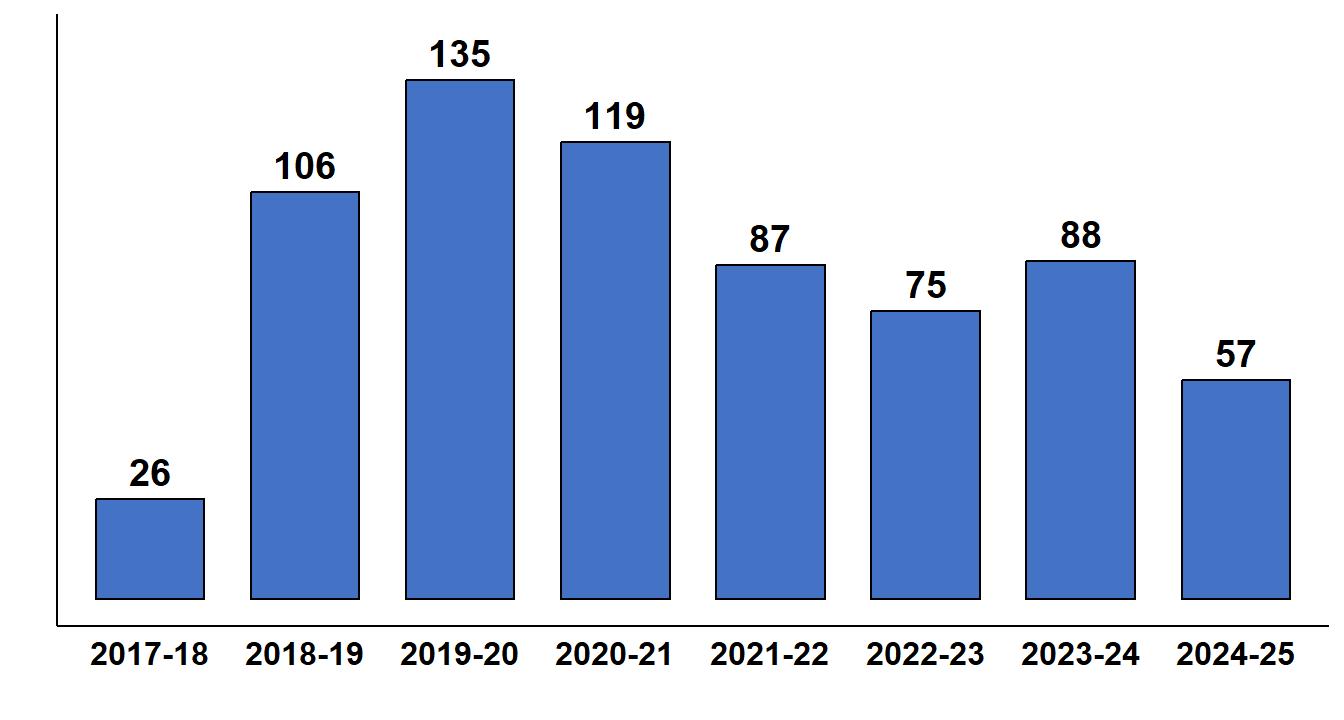
• In 2024-25, 13 CPP QI Providers reached high-quality and converted to TA preschools.
• There were 57 QI Provider sites, 30 of which are in quality gap neighborhoods.
NEXT STEPS AND OPPORTUNITIES
The following strategic actions and opportunities are recommended for CPP, policymakers, funders, and early education advocates. Recommendations align with CPP’s goal of ensuring that young children and families have access to quality preschool education and resources that meet their needs While some actions may be implemented with current resources, others will require additional investment, partnerships, and long-term planning.
• Continue ProvidingTuitionAssistance for Preschool Enrollment andSuccess: Continue supporting preschool enrollment through tuition assistance, which is strongly linked to kindergarten readiness and long-term academic success.
• Support Early Childhood Providers and Programs and Their Sustainability: Continue efforts like teacher and Provider grants that improve teacher compensation and retention and support the sustainability of high-quality early childhood programs. CPP’s support is especially important as funding for preschool education becomes more limited and educational policies are rapidly changing.
• Strengthen Support for Preschool Attendance Through Collaborative Parent Outreach: Additional family outreach efforts with schools and partners can strengthen efforts already in place and help raise awareness of the importance of regular school attendance, which is an early predictor of future academic achievement.
• Leverage Existing Partnerships to Enhance Public Communications of CPP’s Impact and Benefits: The reach of CPP’s public communications could be expanded through collaboratively developed communications. Tailored messages should amplify CPP’s role in improving early education outcomes and showcase existing public support for a broad range of audiences.
• Explore New Data Collaboration Opportunities to Understand Factors for Success: Consider ways to strengthen strategic data collaboration and resource coordination among CPP, educational institutions, community partners, and public agencies to better understand and predict the factors contributing to academic success for preschool through third grade students. Expanding data collection can identify students who may need additional support early on.
• Continue Working withPartners to Sustain Funding and Efforts: CPP and partners can work together to secure funding for future programs that advance access to high-quality preschool, support preschool teachers and Providers, and coordinate resources for parents.
Cincinnati Preschool Promise (CPP) is possible through a significant investment from a tax-funded levy that was approved in 2016 and again in 2020. Voters approved a 5-year levy for Cincinnati Public Schools (CPS), which allocated $33 million annually to enhance K-12 education and $15 million each year to expand access to quality preschool programs. CPP is a collaborative initiative involving the United Way of Greater Cincinnati, CPS, and other partners, with the goal of increasing the number of high-quality preschools, improving educational opportunities, and providing vital tuition assistance to families with the greatest need specifically those living at or below 300% of the federal poverty level. This investment laid a strong foundation for early education in Cincinnati while helping families access essential resources for their children's development, which in turn supports the local workforce and economy.
• The CPP mission is to ensure equitable access to high-quality preschool so that every Cincinnati child is prepared for kindergarten.
• The CPP vision is that preschool is an integral part of every child’s education, and it is equally important to the success of working families. With continuous access to top-rated education, beginning with high-quality preschools, the possibilities are endless. Kindergarten readiness and 3rd grade reading are short-term benefits of increased educational engagement, but in middle school, high school, and beyond, we can expect longterm benefits for our children as they excel in the workforce and thrive in their communities.
CPP strives to:
• Stabilize a skilled and qualified workforce
• Foster a highly-skilled preschool teaching workforce


• Work with all Provider types (in-home, parochial, public, private, and non-profit centers). The collection of Providers should be geographically dispersed and culturally and linguistically relevant to the children in their care, including, but not limited to:
o Students from non-English speaking backgrounds
o Students who have experienced trauma and adverse conditions (ACES)
o Students with special education needs
o Students residing in quality gap neighborhoods
o Provides options, including single-site, multi-site, and family child care Providers.
The development of foundational academic and social skills in children is crucial for their readiness for kindergarten and overall success in school. Comprehensive studies have shown that children who engage in high-quality preschool programs demonstrate better preparedness for formal education compared to those who lack access to such programs.1 Readiness for kindergarten is closely linked to improved academic performance throughout elementary, middle, and high school. Children who start kindergarten with a gap in readiness are more likely to face ongoing developmental difficulties. Therefore, enrolling children in a high-quality preschool program is an important step in helping ensure children are prepared for kindergarten.
The Kindergarten Readiness Assessment Revised (KRA-R)2 was used to evaluate the impact of CPP tuition assistance (TA) participation (i.e., CPP community and CPS preschool participants receiving CPP TA) on kindergarten readiness against Non-CPP participants (a cohort of CPS kindergartners who did not attend a CPP TA Provider). The KRA-R measures academic readiness and literacy skills as well as Social Foundations (socioemotional development), Mathematics, and Physical Well-Being and Motor Development. The KRA-R is administered to kindergartners enrolled in Ohio’s public and community schools, beginning as early as July 1 and ending no later than the twentieth day of instruction during the academic year.
The following analysis focuses on the KRA-R composite score (overall KRA-R score) and the Language and Literacy subtest score. The composite scaled score on the KRA-R is determined by a kindergartener’s set of skills and behaviors across four subtests. The KRA-R measures readiness through performance levels: Emerging Readiness (Scores of 0-257), Approaching Readiness (Scores of 258-269), and Demonstrating Readiness (Scores at or above 270). A scaled score of 263 and above on the Language and Literacy subtest indicates that a kindergartener is On Track for literacy in 3rd grade. The Social Foundations, Mathematics, and Physical Well-Being and Motor Development subtests do not have performance levels that correspond to their scaled scores to assess a kindergartener’s skills and behaviors within these specific areas.
A cohort of CPP TA participants (CPP community and CPS preschool participants receiving CPP TA) was examined to understand the status of kindergarten readiness as assessed by the KRA-R. A total of 1,449 children who received CPP TA funding during the 2022-23 and/or 2023-24 school year met the age cutoff for the 202425 kindergarten cohort (child reached age five by September 30, 2024). Parental consent for 1,391 (96.0%) CPP TA participants was obtained for matching with CPS KRA-R scores, if a completed test was recorded. Twentythree CPP TA participants matched to incomplete KRA-R tests. Preschoolers with missing or incomplete KRAR scores were excluded from the analyses. Reasons a child would not match to a KRA-R score at CPS include enrollment in a school outside of the district, inconsistent identifying information (e.g., name spelling, date of birth, race) across data sources, and other factors (i.e., school absence, parent refusal, etc.) beyond the control of CPP and CPS. Data for non-CPS students are not available at this time. A total of 783 CPP TA participants with consent completed the KRA-R at a CPS kindergarten in 2024-25, an increase of 2.6% from the 760 preschoolers who matched to 2023-24 KRA-R scores. CPP TA participant KRA-R scores were compared to 2024-25 KRA-R scores of 1,592 Non-CPP participants.

1 INNOVATIONS in Community Research and Program Evaluation. (2020). Kindergartenreadiness,preschoolattendance,andacademic achievement: Comprehensive and Longitudinal Outcomes. Retrieved from https://www.uwgc.org/wpcontent/uploads/2024/11/UWGC_SB6_CPS_CCHMC_Kindergarten-Longitudinal-Evaluation_Final_20200129.pdf
2 The 50 item Kindergarten Readiness Assessment (KRA) was used in Ohio from 2014-15 to 2019-20. The revised 27 item Kindergarten Readiness Assessment – Revised (KRA-R) has been used in Ohio since 2020-21. As of July 2024, the degree of concordance between the two assessments has not been reported by the Ohio Department of Education.

Socioeconomic status (SES) characteristics were determined for all CPS kindergarteners who were administered the KRA-R in 2024-25, including the CPP TA participants. Residential addresses of kindergarteners were geocoded to determine their census tract. Within census tracts, five SES indicators from the 2021 American Community Survey (ACS) - 5 Year Estimates were used to rank census tracts by socioeconomic risk: (1) median household income; (2) percent of the population 25 years of age or older with less education than a high school diploma; (3) percent of workers in unskilled and semiskilled occupations; (4) percent of children (under the age of 18) living in married-couple, family households; and (5) percent of housing units with more than one person per room. SES characteristics for Cincinnati city and metropolitan area census tracts were estimated using the methodology detailed in The Social Areas of Cincinnati (5th Ed.; Maloney & Auffrey, 2013). Ranked census tracts were divided into quartiles (SES 1-4), where lower SES quartiles have a higher concentration of families with socioeconomic risk factors. SES quartiles provide a frame of reference for each kindergartner based on the general socioeconomic makeup of their residential area, but it does not inform their individual income and living conditions. SES quartile ratings were used as a proxy for income.
Figure 1 contains 783 geocoded CPP TA participants who attended preschool between 2022-23 and 2023-24 and completed the KRA-R in 2024-25 within CPS. Participants were plotted and color-coded by SES quartile. The plotted points represent the addresses of CPP TA participants at the time of kindergarten.

The demographic characteristics of the 2024-25 KRA-R cohort are shown in Table 1. Notable differences can be seen in the distribution of race, where CPP TA participants are disproportionately Black/African American (74.6%) compared to Non-CPP kindergartners (49.6%). Other differences were present between cohorts within White and Hispanic kindergarteners. The distribution of SES quartiles varied where 67.2% of CPP TA participants lived in low SES (SES 1 or SES 2) communities compared to 60.3% of Non-CPP kindergartners. CPP TA participants were comprised of fewer children from SES 4 communities (12.3%) than Non-CPP kindergartners (18.9%).

Demographic Group
CPP TA Participants (N=783) Non-CPP Kindergarteners (N=1,592)
SES 2
SES 3
4
SES Unknown 0.0% 0.0%
KRA-R outcomes for 2024-25 kindergarteners are illustrated below in Figures 2 and 3. CPP TA (N = 783) participants outperformed Non-CPP (N = 1,592) kindergartners, where 68.3% of CPP TA participants were Approaching or Demonstrating readiness on the overall KRA-R in 2024-25 compared to 58.5% of Non-CPP kindergartners (Figure 2). Additionally, CPP TA participants exceeded the CPS district-wide result (61.8% Approaching or Demonstrating for the CPS district, which includes CPP TA participants).
Language and Literacy subtest results revealed that the percentage of CPP TA participants On Track for literacy by the 3rd grade was 43.6% compared to 37.9% of Non-CPP kindergartners (Figure 3). Similarly, CPP TA participants were On Track for literacy at a higher rate than the CPS district (37.9% On Track for the CPS district). Social Foundations subtest results showed that CPP TA participants scored similar to those of Non-CPP kindergarteners with average scores of 258.3 (standard deviation (SD) = 21.3) for CPP TA participants and 260.6 (SD = 16.1) for Non-CPP kindergarteners (subtest range: 202-298 points).
2. Overall KRA-R Performance Levels by CPP TA Participation (2024-25)


3. Percentage On Track in Language and Literacy by CPP TA Participation (2024-25)
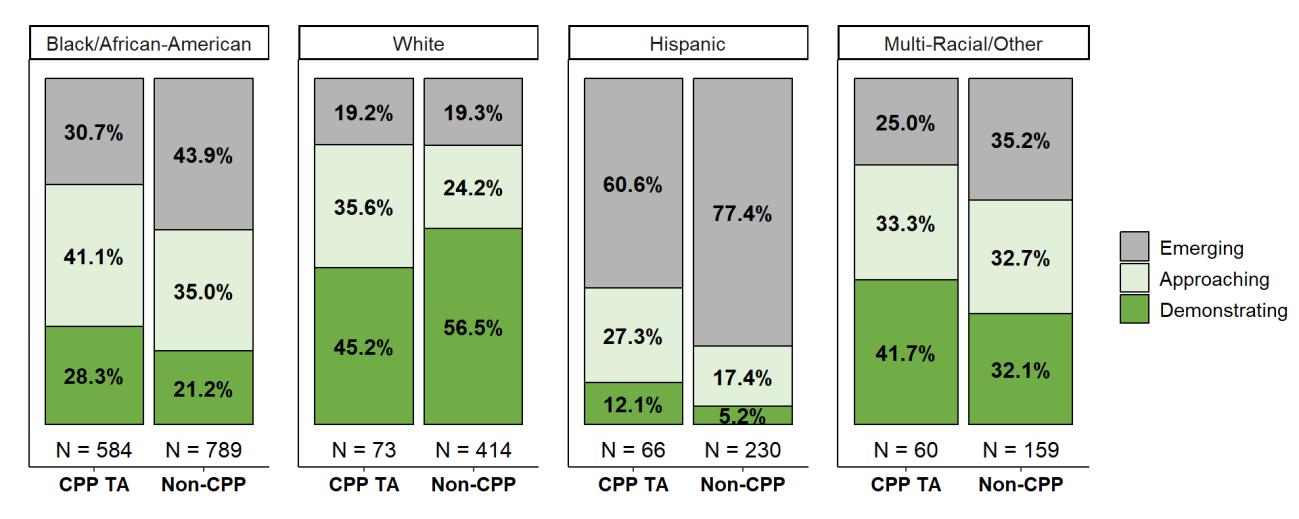
Figures 4-5 show that CPP TA benefited participants from racial and ethnic minority groups. CPP TA participants were more frequently Approaching or Demonstrating readiness on the overall KRA-R compared to Non-CPP kindergarteners by 13.2 percentage points among Black/African American kindergarteners, 16.8 percentage points among Hispanic kindergarteners, and 10.2 percentage points among Multi-Racial/Other kindergartners (Figure 4).
4. Overall KRA-R Performance Levels by Race and CPP TA Participation (2024-25)
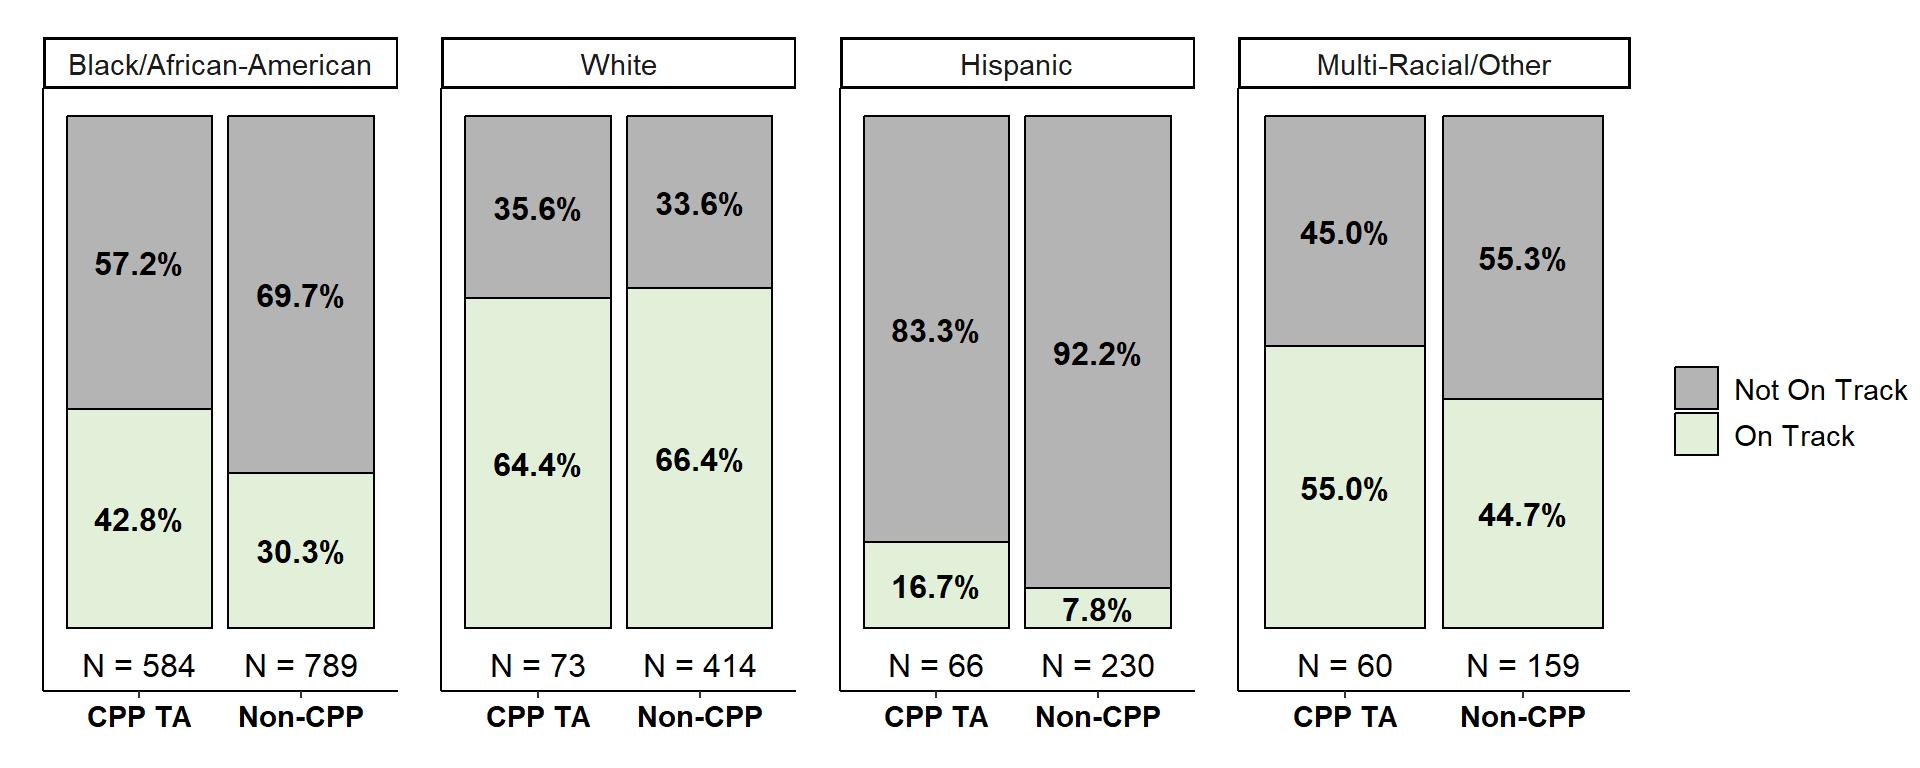
Likewise, CPP TA participants were more frequently On Track on the KRA-R Language and Literacy subtest compared to Non-CPP kindergarteners by 12.5 percentage points among Black/African American kindergarteners, 8.9 percentage points among Hispanic kindergarteners, and 10.3 percentage points among Multi-Racial/Other kindergarteners. This relationship was not observed among White kindergartners (Figure 5). Overall, results were higher for White and Multi-Racial/Other kindergarteners, though Non-CPP White kindergartners scored higher than those in CPP TA. This relationship may be due in part to the overrepresentation of White families below poverty in the CPP TA cohort compared to Non-CPP peers as a result of income eligibility requirements to receive CPP tuition assistance. In the city of Cincinnati, fewer White families with children under 5 years of age live in poverty (10.2%) compared to other races (e.g., 55.3% of Black/African American, 33.0% of Hispanic, and 11.3% of all other races) according to 2023 American Community Survey (ACS) 5-year estimates

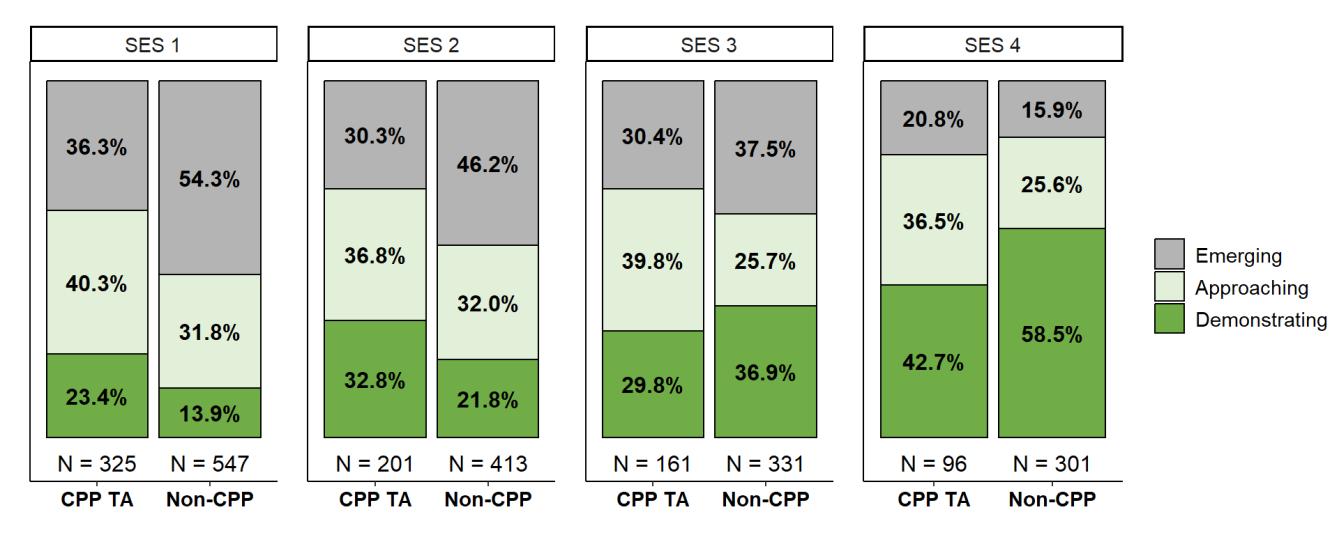
Figures 6 and 7 display that CPP TA participation was linked to stronger KRA-R performance than no CPP participation, primarily within lower SES quartiles (SES 1-2). CPP TA participants who live in higher SES census tracts (most notably SES 4) tend to not exhibit the same relationship SES 3 and 4 families are likely to have higher income levels, whereas CPP TA participants come from families under 300% of the federal poverty level. Therefore, CPP TA participants in SES 3 and 4 often differ from their Non-CPP peers. However, outcomes for CPP TA participants of SES 3 families exceeded those of Non-CPP in 2024-25.
CPP TA participants were more frequently Approaching or Demonstrating readiness on the overall KRA-R compared to Non-CPP kindergarteners by 18.0 percentage points among SES 1, 15.8 percentage points among SES 2, and 7.0 percentage points among SES 3 (Figure 6).

Similarly, CPP TA participants were more frequently On Track on the KRA-R Language and Literacy subtest compared to Non-CPP kindergarteners by 13.6 percentage points among SES 1, 15.3 percentage points among SES 2, and 5.0 percentage points among SES 3 (Figure 7).
7. Percentage On Track in Language and Literacy by SES and CPP TA Participation (2024-25)

KRA-R results were further evaluated by both race and SES (Figures 8 and 9). Due to small sample sizes (N<10) for select SES and race groups, some comparisons were not included in the figures below.
Among Black/African American and Multi-Racial/Other kindergarteners, CPP TA participants were Approaching or Demonstrating readiness on the overall KRA-R at a higher percentage than Non-CPP kindergartners in SES 1-4 (Figure 8). White kindergarteners with CPP TA participation also outperformed Non-CPP kindergarteners within SES 1-3, but not SES 4. Outcomes for Hispanic kindergarteners were limited due to small sample sizes. Hispanic kindergarteners in SES 1 and 2 with CPP TA participation performed better than their Non-CPP peers.
8. Overall KRA-R Performance Levels by Race, SES, and CPP TA Participation (2024-25)

Note. Figure 8 continued on next page. Comparisons are omitted if CPP TA sample sizes (Ns) are less than 10.

8 (Continued). Overall

Note. Comparisons are omitted if CPP TA sample sizes (Ns) are less than 10.
KRA-R Language and Literacy subtest outcomes closely mirrored those of the overall KRA-R. Black/African American kindergarteners with CPP TA participation were On Track in Language and Literacy at a greater frequency than their Non-CPP peers within SES 1-4. (Figure 9). A higher percentage of White kindergarteners with CPP TA participation were On Track compared to Non-CPP participants within SES 1-3. Again, outcomes for Hispanic kindergarteners were limited due to small sample sizes, showing similar relationships as reported above. Multi-Racial/Other kindergarteners were On Track at a higher frequency within SES 2-4, but not in SES 1 in contrast with their performance on the overall KRA-R. This can occur when an individual performs better on other subtests (i.e., Social Foundations, Mathematics, Physical Well-Being and Motor Development) while also scoring below the threshold for On Track in Language and Literacy. For more data from the KRA-R analysis, see Appendix A.

9. Percentage On Track in Language and Literacy by Race, SES, and CPP TA Participation (2024-25)

Note. Comparisons are omitted if CPP TA sample sizes (Ns) are less than 10.
Logistic regression analyses were used to predict KRA-R outcomes using gender, race, SES, and CPP TA participation. A sample of 2,375 CPS kindergarteners from the 2024-25 KRA-R cohort were included in the analyses, excluding cases with missing predictor data (i.e., missing SES). Two models were created: one to predict kindergarteners Demonstrating readiness on the overall KRA-R (i.e., composite scores at or above 270) and the other to predict kindergarteners On Track in Language and Literacy (i.e., Language and Literacy subtest scores at or above 263). See Appendix B for details about the KRA-R logistic regression models.
Results from the first model indicated that gender, race, SES, and CPP TA participation were all statistically significant predictors for Demonstrating readiness on the KRA-R. Most notably, CPP TA participation increased the odds of Demonstrating readiness by 33.1% when statistically controlling for the other predictors. The second model yielded similar results. Gender, race, SES, and CPP TA participation were all statistically significant predictors for being On Track in Language and Literacy. CPP TA participation increased the odds of being On Track by 62.9% when statistically controlling for the other predictors.
The logistic models showed that race is a strong predictor of KRA-R performance (Table 2). Controlling for other predictors, the odds of White kindergarteners Demonstrating readiness were 194.6% higher than Black/AfricanAmerican kindergartners, 1049.3% higher than Hispanic kindergartners, and 106.1% higher than MultiRacial/Other kindergartners. Likewise, the odds of White kindergarteners being On Track in Language and Literacy were 181.9% higher than Black/African-American kindergartners, 1134.8% higher than Hispanic kindergartners, and 93.2% higher than Multi-Racial/Other kindergartners. The odds of Black/African American kindergarteners Demonstrating readiness and being On Track in Language and Literacy were 290.1% higher than and 338.0% higher than Hispanic kindergartners, respectively. Lastly, the odds of Multi-racial/Other kindergarteners Demonstrating readiness were 457.8% higher than Hispanic kindergartners and 43.0% higher than Black/African-American kindergartners, while their odds of being On Track were 539.2% higher than Hispanic kindergarteners and 45.9% higher than Black/African-American kindergarteners.
Table 2. Percentage Difference in Odds of Demonstrating Readiness on the KRA-R and Being On Track in Language and Literacy: Comparisons by Race (2024-25)
Calculation
Odds for White Kindergarteners
Odds for Black/African American Kindergarteners
Odds for Hispanic Kindergarteners
Odds for Multiracial/Other Kindergarteners

% Difference in Odds of Demonstrating Readiness
% Difference in Odds of being On Track in Language and Literacy Comparison
194.6% higher than 181.9% higher than Black/African American
1049.3% higher than 1134.8% higher than Hispanic
106.1% higher than 93.2% higher than Multi-Racial/Other
66.1% lower than 64.5% lower than White
290.1% higher than 338.0% higher than Hispanic
30.1% lower than 31.5% lower than Multi-Racial/Other
74.4% lower than 77.2% lower than Black/African American
91.3% lower than 91.9% lower than White
82.1% lower than 84.4% lower than Multi-Racial/Other
43.0% higher than 45.9% higher than Black/African American
51.5% lower than 48.2% lower than White
457.8% higher than 539.2% higher than Hispanic
The findings for SES demonstrated the impact of social and economic factors on kindergarten readiness (Table 3). Controlling for all other predictors, the odds of an SES 4 kindergartener Demonstrating readiness were 238.4% higher than SES 1, 127.0% higher than SES 2, and 76.9% higher than SES 3. Additionally, the odds of an SES 4 kindergartener being On Track 246.4% higher than SES 1, 155.7% higher than SES 2, and 82.9% higher than SES 3 when controlling for other predictors.
Table 3. Percentage Difference in Odds of Demonstrating Readiness on the KRA-R and Being On Track in Language and Literacy: Comparisons by SES (2024-25)
Calculation
Odds for SES 1

% Difference in Odds of Demonstrating Readiness
% Difference in Odds of Being On Track in Language and Literacy Comparison
lower than SES 2
lower than
Kindergarteners 32.9% lower than
lower than
Odds for SES 2
Kindergarteners
Odds for SES 3
lower than SES 3
lower than SES 4
higher than 35.5% higher than SES 1
lower than
lower than
lower than SES 3
lower than SES 4
Kindergarteners 91.3% higher than 89.3% higher than SES 1 28.3% higher than 39.8% higher than SES 2
Odds for SES 4
Kindergarteners
lower than
higher than
higher than
higher than
lower than SES 4
higher than SES 1
higher than SES 2
higher than SES 3


The progress made by preschoolers enrolled in CPP can be seen during their time in preschool. To assess the influence of a high-quality preschool experience on CPP community and CPS preschoolers receiving TA, a preschool progress measure, the Teaching Strategies GOLD® (TS GOLD®), was included in the evaluation INNOVATIONS examined the overall pre- (fall) and post-assessment (spring) scores of CPP TA preschoolers who were assessed.
TS GOLD® is a formative assessment administered multiple times per year through which teachers document observations of a preschooler’s developmental level and growth along multiple domains of learning. This assessment is commonly administered to TA preschoolers attending community-based and CPS preschools with Head Start funding. TS GOLD® documents a preschooler’s development as Below, Meeting, or Exceeding expectations along six domains: Social-Emotional, Physical, Language, Cognitive, Literacy, and Mathematics.
Deidentified TS GOLD® scores were acquired for 2024-25 preschoolers. The cohort included preschoolers who attended select CPP community preschools or CPS preschools. TS GOLD® results were summarized by domain (Social-Emotional, Physical, Math, Language and Literacy). Preschool progress was defined as when a preschooler met or exceeded expectations on a TS GOLD® domain(s) or improved within these categories on the TS GOLD® from fall to spring. Measures of preschool progress are summarized below:
Deidentified preschool assessment data were obtained from 40 CPP TA Providers representing 67 classrooms throughout the CPS footprint. Preschoolers (N = 908) receiving CPP TA showed universal improvement across all TS GOLD® domains from the fall 2024 to spring 2025 (Figure 10). Mathematics had the lowest percentage of preschoolers meeting or exceeding expectations at baseline. Thus, Mathematics showed the largest amount of growth from fall to spring with an increase of 36.8 percentage points, followed by Literacy with an increase of 33.2 percentage points.
Figure 10. Percent of Preschoolers Meeting or Exceeding Expectations
TS GOLD® - Fall to Spring 2024-25
During year 8 of the CPP evaluation (FY25), a follow-up analysis was conducted to explore long-term outcomes for CPP TA participants enrolled in community-based and CPS preschools. Former CPP TA participant records were matched to the records of 1st, 2nd, and 3rd graders attending CPS elementary schools in 2023-24. This analysis uses districtwide, aggregate results for 3rd graders as a comparison. It lags a year because district comparison scores aren’t made publicly available until fall of the following year. Scores for 1st and 2nd graders are compared to the national norms of the assessment administered.
A cohort of 3,179 former CPP TA participants with parental consent were sent to CPS to determine linkages. In total, 1,926 (60.6%) were matched to CPS school records for grades 1-3. Of these, 708 were 1st graders, 625 were 2nd graders, and 593 were 3rd graders. Of the matches, 1,496 (77.7%) were CPP TA participants that have previously been linked to kindergarten enrollment records in previous evaluation years. The remaining 430 (22.3%) did not attend a CPS kindergarten but entered the CPS district sometime between grades 1 and 3.
Standardized test scores were used to evaluate the progress of the CPP TA cohort for grades 1-3. Of the 1,926 CPP TA participants matched to CPS school records, 1,577 had an associated English Language Arts (ELA) standardized test score and 1,576 had an associated Math standardized test score. For grades 1 and 2, i-Ready Diagnostic Reading and Math scores administered during the fall and spring were used to evaluate performance. The use of the i-Ready Diagnostic replaces the NWEA (Northwest Evaluation Association) MAP (Measures of Academic Progress) analysis from the previous evaluation year because NWEA MAP is no longer widely administered to grades 1-3 at CPS. Ohio Next Generation Assessments (NGA) for ELA (N = 499) and Math (N = 494) scores were used to evaluate 3rd graders, in addition to i-Ready Diagnostic scores, where available.
Standardized Test Results: NGA (Grade 3)
The following NGA results represent CPP TA participants who were in 3rd grade in 2023-24 and attended a CPP TA Provider sometime between 2018-19 and 2019-20. This cohort was enrolled in kindergarten at the height of the pandemic. The CPP TA cohort’s test scores were compared to the CPS overall district performance for CPS 3rd graders in 2023-24. Additional comparisons were made to disaggregated CPS results for the economic disadvantaged. This comparison uses aggregate data from CPS’ ODE report card for 2023-24 and does not exclude CPP TA participants from the calculation.
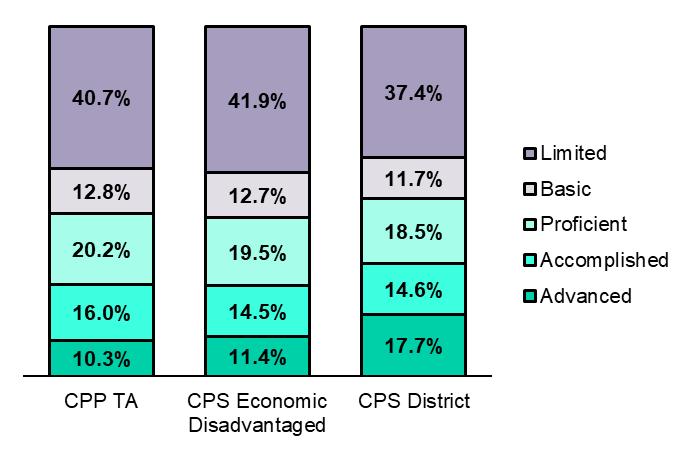
Of the matched CPP TA cohort of 3rd graders with NGA ELA (N = 499), 52.3% scored proficient or higher on their NGA ELA (Figure 11). That compares to 57.0% of the CPS district and 52.1% of CPS economic disadvantaged. For NGA Math, 46.6% of CPP TA participants (N = 494) scored proficient or higher compared to 50.9% of the CPS district and 45.4% of CPS economic disadvantaged (Figure 12). The performance of 2023-24 3rd graders with a history of CPP TA enrollment was below the districtwide results but exceeded those among the economic disadvantaged.
Figure 11. Grade 3 NGA ELA for CPP TA
Compared to 2023-24 CPS District Results

*Does not exclude CPP TA participants

Figure 12. Grade 3 NGA Math for CPP TA Compared to 2023-24 CPS District Results
*Does not exclude CPP TA participants

The i-Ready Diagnostic is a nationally normed standardized test that measures K-12 students’ academic progress at multiple points during the school year. The following summary analyzes i-Ready Reading and Math assessments taken by former CPP TA participants who are enrolled in grades 1-3 at CPS Each student in the cohort has a Baseline and Follow-Up assessment taken at two different time points during the school year. Baseline assessments were primarily taken in the fall (beginning of year to November 14) and Follow-Up assessments were primarily taken in the spring (March 1 to the end of year), with a few exceptions. Percentile scores at Baseline of CPP TA participants were compared to their percentile scores at Follow-Up to indicate growth within the context of national norms.
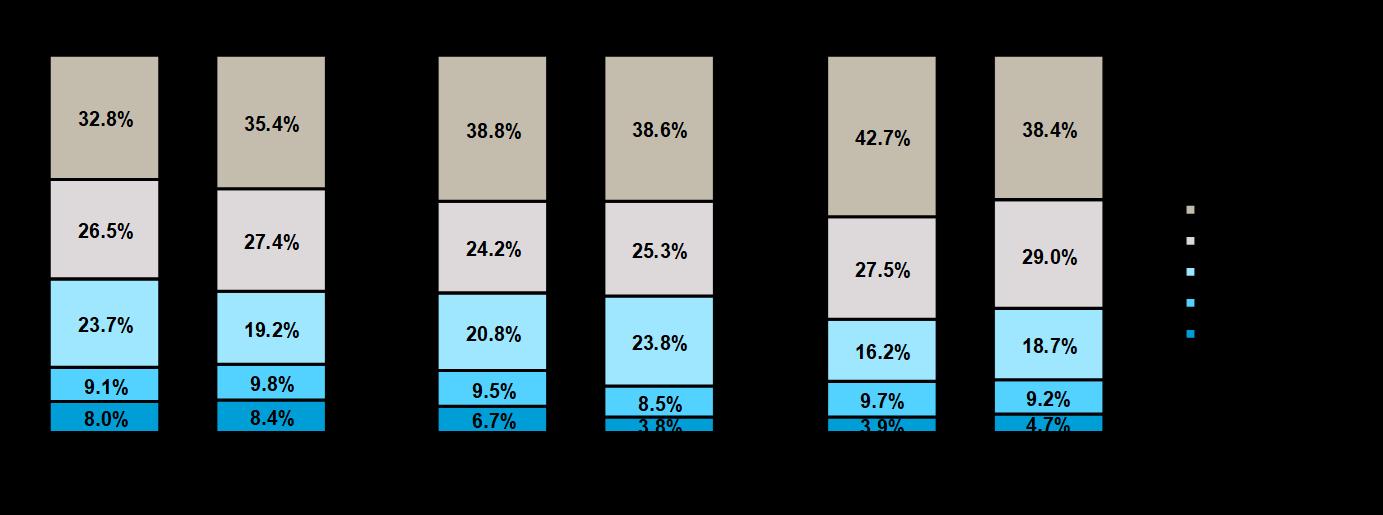
Figures 13-14 indicate the proportion of CPP TA participants in each of five percentile ranges (or quintiles) at Baseline and Follow-Up for i-Ready Reading and Math, respectively. The percentiles represent how students perform compared to their peers across the nation. CPP TA participants in grades 1-3 showed growth in the top three i-Ready Reading quintiles (percentiles 41-99) from Baseline to Follow-Up (Figure 13). The percentage of participants in the top three quintiles increased from 43.0% to 49.0% among 3rd graders, 42.7% to 47.0% among 2nd graders, and 39.8% to 49.0% among 1st graders. For i-Ready Math, the percentage of CPP TA participants in the top three quintiles increased from 29.8% to 32.6% among 3rd graders, but decreased from 37.0% to 36.1% among 2nd graders, and 40.8% to 37.4% among 1st graders (Figure 14).

Statistical tests for variability were performed to measure the relationship between i-Ready Follow-Up scores and prior KRA-R performance for CPP TA participants with both assessments. KRA-R scores explain 27.6% of the variability in i-Ready Reading scores for first graders (N = 531) and 26.6% of second graders (N = 419) KRA-R scores explain 27.1% of the variability in i-Ready Math scores for first graders (N = 532) and 27.8% of second graders (N = 419) There is a moderate relationship between how ready CPP students were for kindergarten (as measured by the KRA-R) and how they perform in reading and math in first and second grades. However, over 70% of the variability in reading and math scores is due to other factors. Data for other contributing factors, such as attendance, individual characteristics, and home environment, were unavailable for this analysis. Results for third graders are unavailable because the KRA-R was not administered in 2020-21 when they were in kindergarten.


Follow-up results for grades 1-3 were variable for the CPP TA participants linked to 2023-24 CPS test scores. Third grade NGA results showed that CPP TA participants were proficient or higher at a rate below the district rate (4.7 and 4.3 percentage points below district ELA and math, respectively), but comparable to that of economic disadvantaged students (0.2 and 1.2 percentage points above CPS economic disadvantaged ELA and Math). Results for i-Ready Reading revealed measurable growth from Baseline to Follow-Up within grades 1-3. CPP TA participants with scores in the top three quintiles (percentiles 41-99) increased for grades 1-3, signifying growth within the context of national norms. Results for i-Ready Math only exhibited growth from Baseline to Follow-Up within grade 3.
The contrast between i-Ready Math performance in first and second graders compared to third graders is not fully explained by current findings. Continued monitoring ofthese first and second graders into the next evaluation year will support further understanding of their growth and proficiency. Originally, it was intended that NWEA MAP scores of first and second graders from 2022-23 would be followed into 2023-24 for further analysis. This was not possible due to NWEA MAP no longer being widely administered to grades 1-3 at CPS.
CPP helps families find high-quality preschool programs and provides TA funding for eligible 3- and 4-year-olds who live at or below 300% of the federal poverty level (FPL) to enroll. CPP Providers are dispersed throughout the CPS geographic footprint, including quality gap neighborhoods.
Quality gap neighborhoods are defined as areas high in socioeconomic risk factors and low in supply of highquality (Silver or Gold-rated2) preschool seat capacity relative to their preschool-aged population (3-4 year olds). Evaluation reports prior to 2022-23 utilized quality gap neighborhoods as defined in a report on high-quality preschool access by RAND in 2016.3 As of December 2022, a new analysis was conducted to revise the quality gap neighborhood distinctions using more recent high-quality seat supply and risk statistics to adjust for the community changes that have occurred since CPP’s start.
High-quality preschool locations and Step Up to Quality (SUTQ) ratings4 were obtained from 4C for Children, the Southwest Ohio region’s statedesignated Child Care Resource and Referral Agency, for all Providers within the CPS service area footprint. High-quality seat capacity was estimated for center-based programs using a combination of data sources including CPP, CPS, and Ohio Department of Job and Family Services (ODJFS) Inspection Reports. Licensed capacity was used for family child care Providers (Type A and B) and if no other data sources were available for center-based Providers. Provider and seat counts were calculated as of December 2022. These are subject to variation over time as Providers experience changes in SUTQ ratings, enrollment, staff, and seat capacity.
To classify the Seat Supply for each neighborhood, preschool-aged population and high-quality seat estimates were used to calculate seat deficits and seat-to-child ratios. Cincinnati neighborhoods were flagged as having Low Supply if the seat capacity deficit was greater than 100 seats, or if the seat-tochild ratio was lessthan the city-wide average of 0.6, which is equivalent to three high-quality seats for every five children of preschool age.
Socioeconomic risk was the second component used to classify quality gap neighborhoods. Risk classifications were based on five key indicators: (1) median family income, (2) percent of single parent households, (3) percent of adults (25 years or older) with a high school diploma or higher, (4) unemployment rate, and (5) violent and property

HIGH QUALITY (SILVER OR GOLD RATED) PRESCHOOL SEAT SUPPLY
Neighborhoods Flagged as Low Supply if:
1. Seat Deficit is 100 Seats or Greater OR
2 Seat-to-Child Ratio is Less than City-Wide Rate (3 Seats per 5 Children)
Note. Population sizes of 3-4 year olds estimated using American Community Survey (ACS) 2021 5-Year Estimates High-quality (Silver or Gold-rated) seat capacity was estimated using multiple sources, including CPP, CPS, ODJFS Inspection Reports, and licensed capacity.
NEIGHBORHOOD RISK INDICATORS
1. Median Family Income1
2. Percent of Children Living in Single Parent Households1
3. Percent of Adults (25 Years or Older) With High School Diploma or Higher1
4. Unemployment Rate1
5. Violent and Property Crime2

1 American Community Survey (ACS) 2021 5-Year Estimates
2 City of Cincinnati Police Data Initiative (PDI) Crime Incidents

3 Karoly, Lynn A., Anamarie Auger, Courtney Ann Kase, Robert C. McDaniel, and Eric W. Rademacher. "Options for investing in access to high-quality preschool in Cincinnati" (2016). https://www.rand.org/pubs/research_reports/RR1615.html
4 A new, three-tier SUTQ rating system went into effect after the 2023-24 program year. High-quality programs remain highly rated under the new quality rating system.

crime rates. Neighborhoods were flagged as At Risk for an indicator if its risk estimate exceeded the collective, citywide estimate (e.g., a neighborhood with an unemployment rate higher than the city’s average would be flagged as At Risk under the unemployment indicator). Neighborhoods at risk in two or more of these indicators were flagged as having moderate risk or greater, relative to the rest of Cincinnati.
Quality gap neighborhoods were defined by assessing both Seat Supply and Risk. Thus, neighborhoods that were At Risk (having two or more flagged risk indicators) and Low Supply (having a seat capacity deficit greater than 100 seats, or a seat-to-child ratio less than the city-wide average) met the criteria to be classified as quality gap. Note that because this is a relative measure, results are not generalizable to areas outside of Cincinnati This is not meant to provide a universal definition of what constitutes “At Risk” or “Low Supply” neighborhoods. Rather, this is to help decision makers prioritize the Cincinnati neighborhoods with the most immediate need of resources. Additionally, neighborhoods that do not meet the criteria should not be interpreted as not in need of resources. For example, At Risk neighborhoods with at or above average seat supply are indicative of areas moving in the right direction, but these areas must still be monitored due to the risk factors affecting its population.
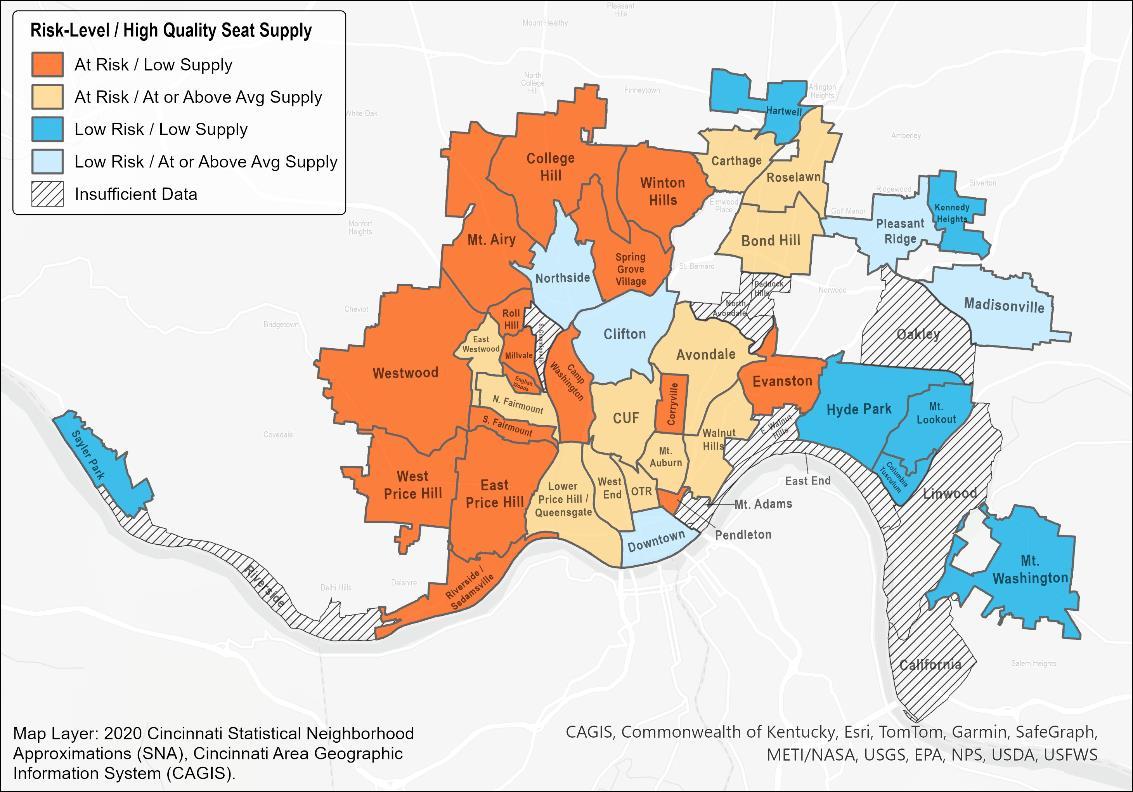
The results of the December 2022 Quality Gap analysis can be seen in Figure 15. Quality gap neighborhoods (At Risk/Low Supply) are shown in dark orange Classifications are given to the other neighborhoods for additional context. Dark blue neighborhoods, for instance, are Low Risk/Low Supply. Like the quality gap neighborhoods, they have a low supply of high-quality seat capacity in relation totheir preschool-aged population. However, the data indicate that they are ranked low on the five risk indicators. Efforts to expand the high-quality preschool Provider network in these areas are still necessary but should not prioritized above quality gap neighborhoods where the need for quality education is greater. Additionally, the map displays that several neighborhoods were not classified due to insufficient data.
Figure 15. Quality Gap Neighborhoods of Cincinnati as of December 2022
As shown below, CPP Providers are located throughout the Cincinnati area with representation in quality gap neighborhoods. As of June 30, 2025, there were 208 Providers in the CPP community-based network, comprised of 121 Family Child Care (FCC) Programs, 80 Centers, and 7 Parochial Schools. The Providers represent a capacity of 3,749 quality and high-quality seats (Figure 16). This is a decrease of 432 seats from the previous year due to fewer QI Providers participating in 2024-25 Furthermore, there were a total of 100 Providers in quality gap neighborhoods representing a capacity of 1,803 quality and high-quality seats (Table 4). See Appendix E for the list of Providers participating in the CPP community-based network.
ODJFS Provider inspection reports and 4C for Children data were obtained to estimate the actual enrollment (seats filled) of all preschoolers (CPP and Non-CPP) attending a CPP community-based Provider in 2024-25. These estimates show the total number of preschoolers that CPP funding and services impact, whether through TA, teacher professional development, classroom enhancements, and quality improvement supports The data showed that 2,330 preschoolers were enrolled across the CPP community-based network, an increase of 243 preschoolers enrolled at TA Providers and a decrease in 226 preschoolers enrolled at QI Providers compared to the prior year.
Table 4. Total CPP Providers and Seat Capacity (2024-25)
All CPP Community-Based Providers Providers in Quality Gap Neighborhood1 Funding

* Excludes QI Providers that converted to TA.
1 Providers located in Quality Gap neighborhoods as they are defined as of December 2022.
2 Total program seat capacity as reported on CPP Provider applications.
3 Total number of enrolled preschoolers (CPP and Non-CPP) based on annual ODJFS inspection reports.


According to American Community Survey (ACS) 2023 five-year estimates, there are 19,469 children under 5years-old in Cincinnati, and 7,255 are 3- to 4-year-olds. Among the population of children under 6-years of age, 36.9% are living below poverty (below 100 percent of the FPL). This was extrapolated to younger populations for an estimate of 2,672 3- to 4-year-olds living below poverty (below 100% FPL). Further extrapolations estimate that 1,462 3- to 4-year-olds are within 100 and 199% of the FPL, 715 are within 200 and 299% of the FPL, and the remaining 2,406 are at or above 300% of the FPL.
In 2024-25, CPP community-based TA Providers served 1,090 (22.5%) of the 3- to 4-year-old population living below 300% of the FPL (N = 4,849), an increase of 1.8 percentage points. Together, CPP community-based TA Providers and CPS Public TA Providers served 37.7% (n = 1,827 unduplicated students) of the 3- to 4-year-old population living below the 300% FPL in Cincinnati, a 2.3 percentage point decrease due to a lower combined enrollment as some preschoolers who would have received CPP TA received alternate financial assistance through a new state expanded voucher program this year. This percentage does not account for students enrolled at CPP QI Providers or children who aren’t eligible for CPP TA but may benefit from being enrolled at a TA Provider receiving supports and resources from CPP. Among the entire population of 3- to 4-year olds living in Cincinnati (N = 7,255), CPP TA Providers and CPS Public TA Providers enrolled 53.5% (n = 3,878), not accounting for FPL or socioeconomic factors.
CPP PROVIDER NETWORK REPRESENTATION IN
The total number of high-quality Providers in Cincinnati at the time of this analysis was 231 (156 TA, 41 CPS, and 34 Unaffiliated), which is an increase of six since last year. CPP TA community-based preschools and CPS preschools together make up 85% of high-quality Providers in Cincinnati.
The total number of Unrated/Bronze Providers in Cincinnati was 399 in 2024-25 with 52 (13.0%) being CPP QI Providers. In 2023-24, there were 402 Unrated/Bronze Providers in Cincinnati with 74 (18.4%) being CPP QI Providers. There was a decrease in Unrated/Bronze Providers in the CPP community-based network this year, but not in Cincinnati overall.


TUITION ASSISTANCE PROVIDER NETWORK
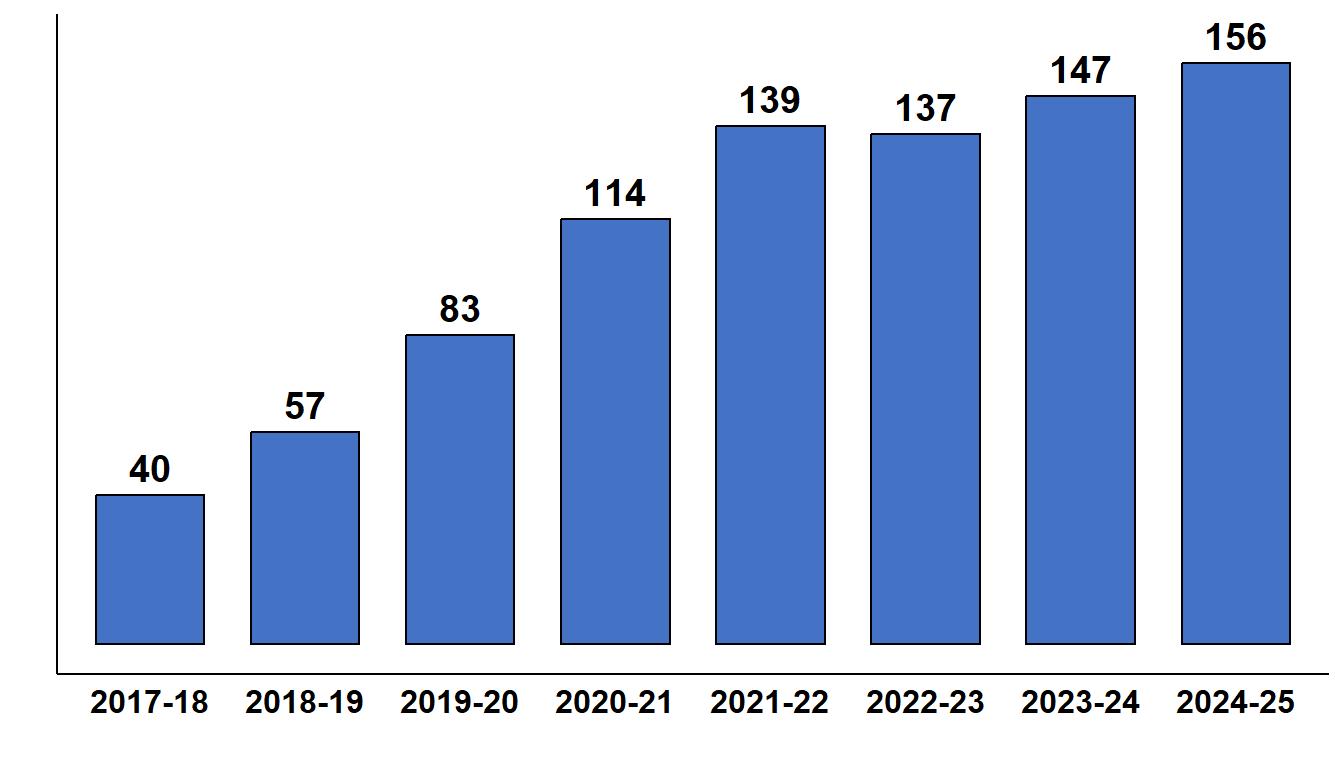
CPP Providers who are Gold or Silver (previously 3-, 4-, or 5-star) rated by Ohio’s Step Up To Quality (SUTQ) child care quality rating system are approved to receive Tuition Assistance (TA) reimbursements from CPP for eligible preschoolers enrolled in their programs. The number of community-based CPP Providers that have been approved to receive TA reimbursements increased from 2017-18 to 2024-25 (Figure 17). The number of approved CPP TA Providers in 2024-25 (156) increased by 9 since 2023-24 (147).
Figure 17. Number of Approved CPP TA Providers per Year
GEOGRAPHY AND REACH
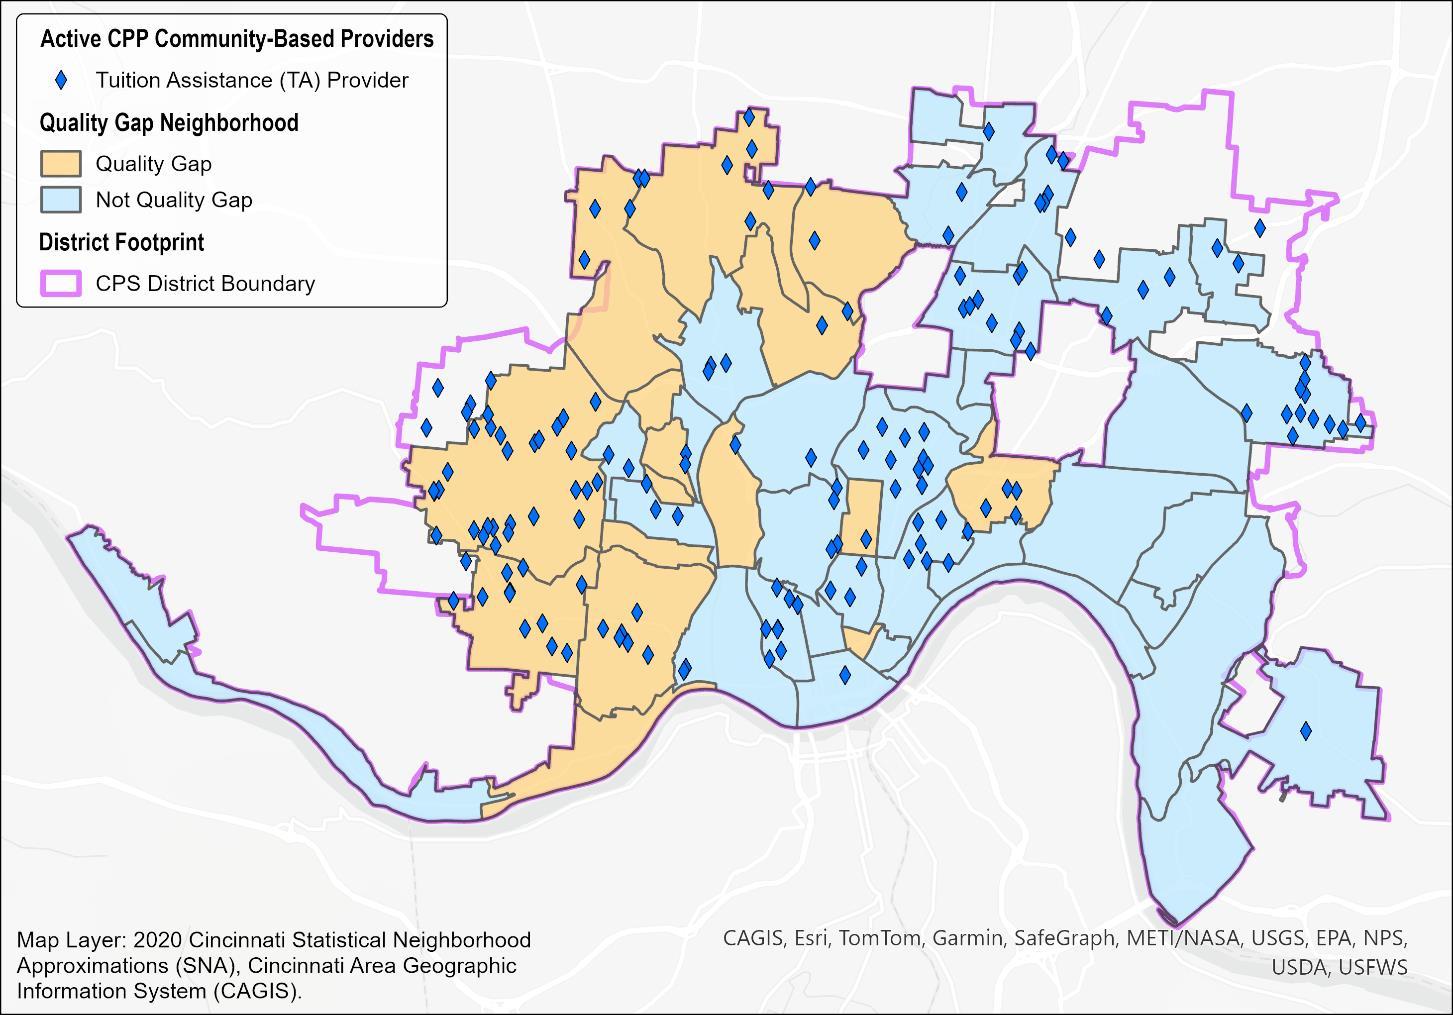
CPP community-based TA Providers are located throughout the Cincinnati area with representation in quality gap areas. There were 147 CPP TA Provider locations in 2023-24 and 156 in 2024-25, an increase of 9 CPP TA Providers (Table 5). The TA Providers represent a capacity of 2,989 high-quality seats, according to data submitted by TA Providers on their most recent CPP application. There are 70 TA Providers in quality gap areas representing a capacity of 1,410 high-quality seats (Figure 18).
Table 5. CPP TA Providers and Seat Capacity

1 Total number includes QI Providers that converted to TA.
2 Seat capacity data were not collected in 2017-18 and 2018-19.
* Quality Gap neighborhoods for TA Providers based on the updated Quality Gap neighborhood classifications established in December 2022. Prior years were based on the previous classifications established in 2015-16.

In 2024-25, CPP received a total of 1,518 preschool applications for TA and approved 75.2% (1,141) of them (Figure 19). The reasons for application denial are presented in Figure 20. The primary reasons for denial in 2024-25 were due to the child being too young for enrollment (40.2%) or their address not being located in the district (36.3%).
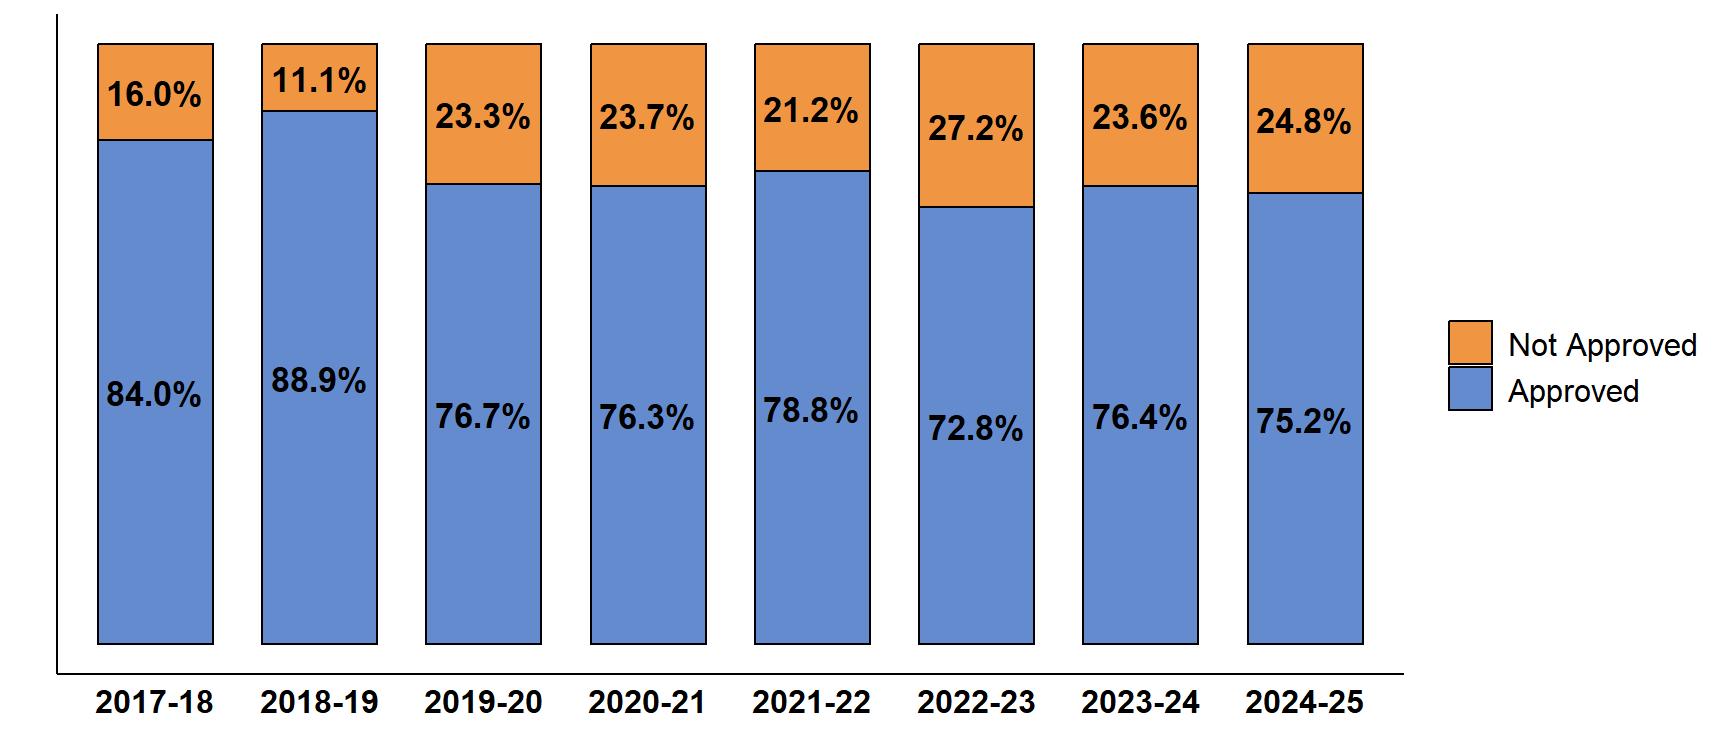
Note. Applications that are “Not Approved” can refer to those that are denied, inactive, pending or referred to Cincinnati Public Schools.

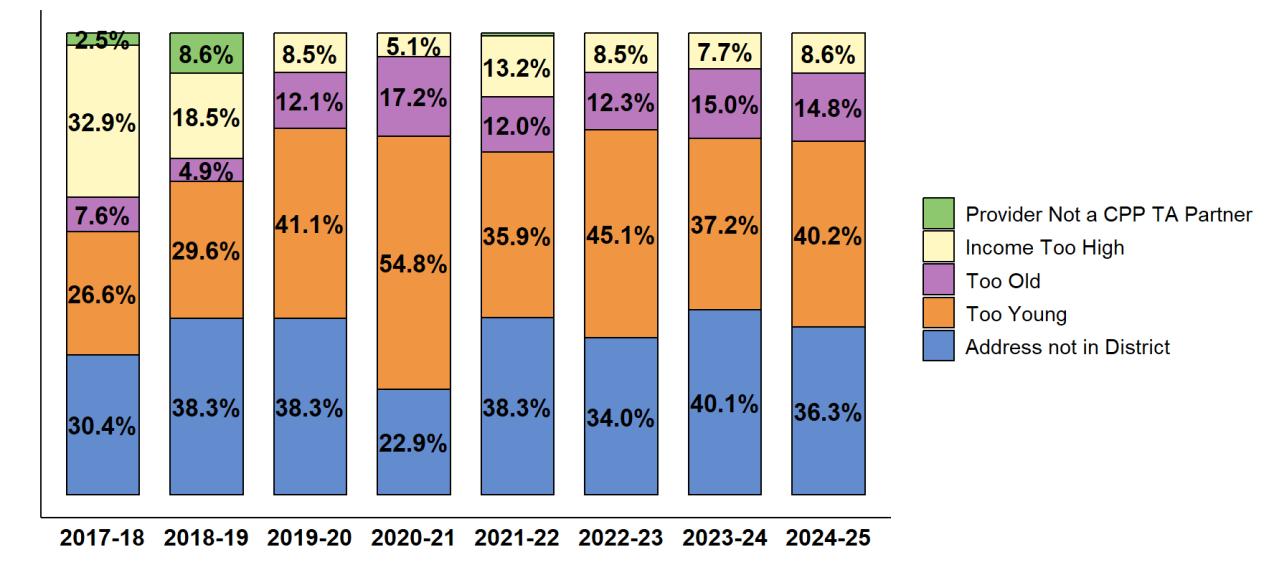
Note. Small value labels suppressed (<2%).
The total amount of TA reimbursed to Providers in 2024-25 was $6.25 million (Figure 21). The average annual TA reimbursement per preschooler was $5,746 (Figure 22) and the average monthly TA reimbursement per preschooler was $693 (Figure 23). The average TA amount reimbursed for 9.5 month participants was $7,865. The amount of TA reimbursed varied by preschooler with the annual amount ranging from $435-$11,439.16 and the monthly amount ranging from $18-$1,186 for participants enrolled for all 9.5 months (Figure 24) CPP TA funds are administered after other public funding sources through a collaborative funding model.


of

The number of community-based preschoolers enrolled receiving CPP TA reimbursements maintained similar levels between 2023-24 and 2024-25 (Figure 25). A total of 1,090 (471 3-year-olds and 619 4-year-olds) preschoolers received CPP TA in 2024-25. After experiencing set-backs due to COVID-19 during the 2019-20 and 2020-21 school years, enrollment has since rebounded, showing its highest enrollment totals to date occurring over the past two school years See Appendix D for CPP TA preschooler enrollment rate by month.
Figure 25. Number of Preschoolers Enrolled in CPP TA Preschools

Note. Preschoolers included in count if enrolled with at least 1 day of attendance. Enrollment may have been affected by COVID-19 during the 2019-20 and 2020-21 school-years.
Preschoolers enrolled in community-based CPP TA preschools were 53.4% female, mostly African American/Black (68.1%), and typically live in homes where English is the primary language (80.0% of 1,000 with primary language data). The majority (94.8%) of preschool children reside in a permanent residence and many (65.9%) have a total of 4 or fewer household members. A group of preschoolers had their income requirement waived (29.5%). A preschooler may have their income requirement waived if they have already met the income requirements for ODE (requiring 200% FPL or below), Publicly Funded Child Care (requiring 142% FPL or below), or Head Start (requiring 185% FPL or below). Of the 768 that did not have their income requirement waived, 60.9% were from households with an income that is less than 100% of the FPL (Table 6). FPL income charts and additional demographic data for prior years can be viewed in Appendix C
Table 6. Demographics of Preschoolers Enrolled in CPP TA Preschools for 2024-25

or Pacific Islander
* Waived if income requirements already met for the Ohio Department of Education (requiring
FPL or below), Publicly Funded Child Care (requiring 142% FPL or below), or Head Start (requiring
FPL or below)

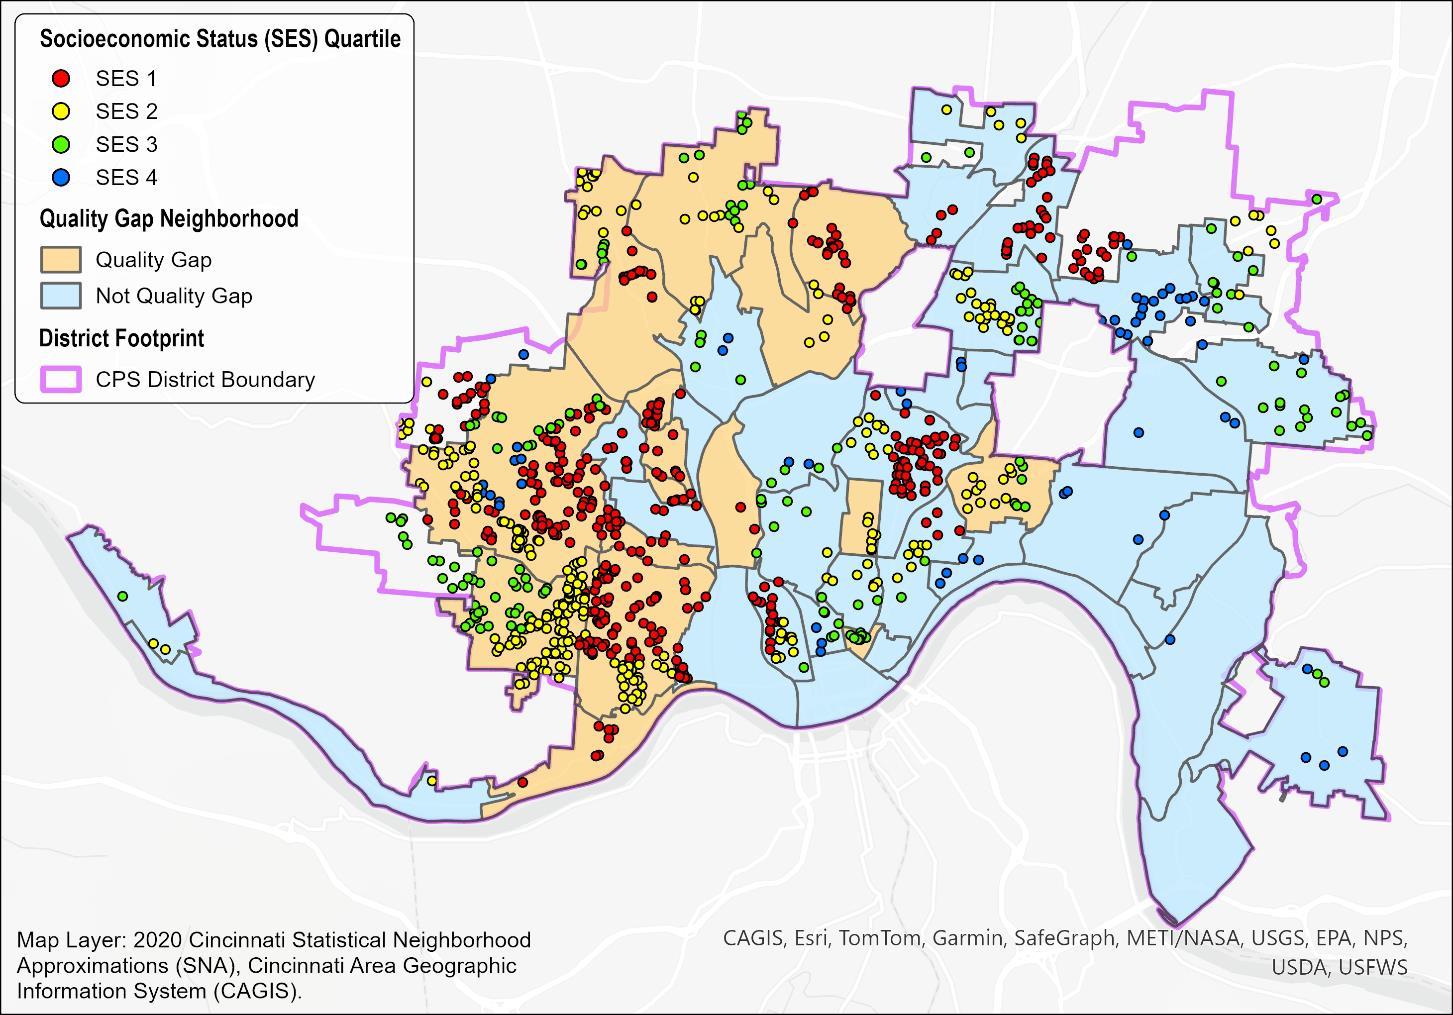
Figure 26 displays geocoded tuition assisted community-based preschoolers in 2024-25, color-coded by SES quartile. Among the 1,090 CPP TA participants in 2024-25 cohort, 46.1% were SES 1, 30.8% were SES 2, 16.9% were SES 3, and 6.1% were SES 4.
Figure 26. Geocoded CPP Community-Based TA Preschoolers by SES Quartile 2024-25
The average attendance rate (total days attended/total days scheduled) for 2024-25 CPP TA preschoolers enrolled in community-based Providers was 89.1%. CPP TA preschoolers’ attendance rate by month is reported in Appendix D Figure 27 indicates that attendance rates have gradually increased since 2021-22. Note that 2019-20 attendance rate has been adjusted and excludes attendance records from April-May 2020 due to monthly scheduled days continuing to be recorded in the database after the COVID-19 shutdown took place. Removing these two months provides a more accurate depiction of the attendance rates for 2019-20.

Note. Attendance rates are calculated by dividing CPP TA preschoolers’ total days attended by their total days scheduled.
* Adjusted for COVID-19 pandemic: Omits April-May 2020.

QUALITY IMPROVEMENT SUPPORT
CPP offers tangible support such as coaching, professional development, learning materials, gross motor equipment, curriculum and technology kits, and child and program assessments to improve quality and increase high-quality preschool seat capacity in the CPP Community Provider Network. CPP Quality Improvement (QI) Providers receive the majority of QI coaching; however, coaching and professional development opportunities are also available to TA Providers. Throughout 2024-25, CPP’s QI team provided nearly 3,300 hours of coaching to 61 CPP TA and QI Providers to foster professional development, personal growth, wellness, and ongoing quality improvement throughout the network. CPP also offered 42 professional development sessions with 250 TA and QI Providers attending them.
QUALITY IMPROVEMENT PROVIDER NETWORK
CPP QI Providers are either unrated or have a Bronze (previously 1- or 2-star) SUTQ rating. CPP’s Community Provider Network included 57 Active QI Providers during the 2024-25 academic year (Figure 28). A decreasing number was expected as some QI Providers reached high-quality and others left the network due to SUTQ requirements.
QUALITY IMPROVEMENT TO TUITION ASSISTANCE CONVERSIONS
CPP QI Providers can be converted to a TA Provider upon earning a Silver or Gold SUTQ rating. QI Providers who are still working to reach a high-quality level rating are described as non-converted for the purpose of the following analysis. QI Providers currently participating in CPP are described as Active while Providers who were Active in a prior schoolyear and left the network for unknown reasons but later returned are described as Inactive. During fiscal year 2024-25, CPP converted a total of 13 Providers from QI preschools to TA preschools (Figure 29). Among the converted, 5 were Active QI Providers during the fiscal year and 8 were Inactive QI Providers from a prior fiscal year that returned as a TA approved Provider.
Figure 29. Number of CPP QI Providers Converted to TA Providers per Year
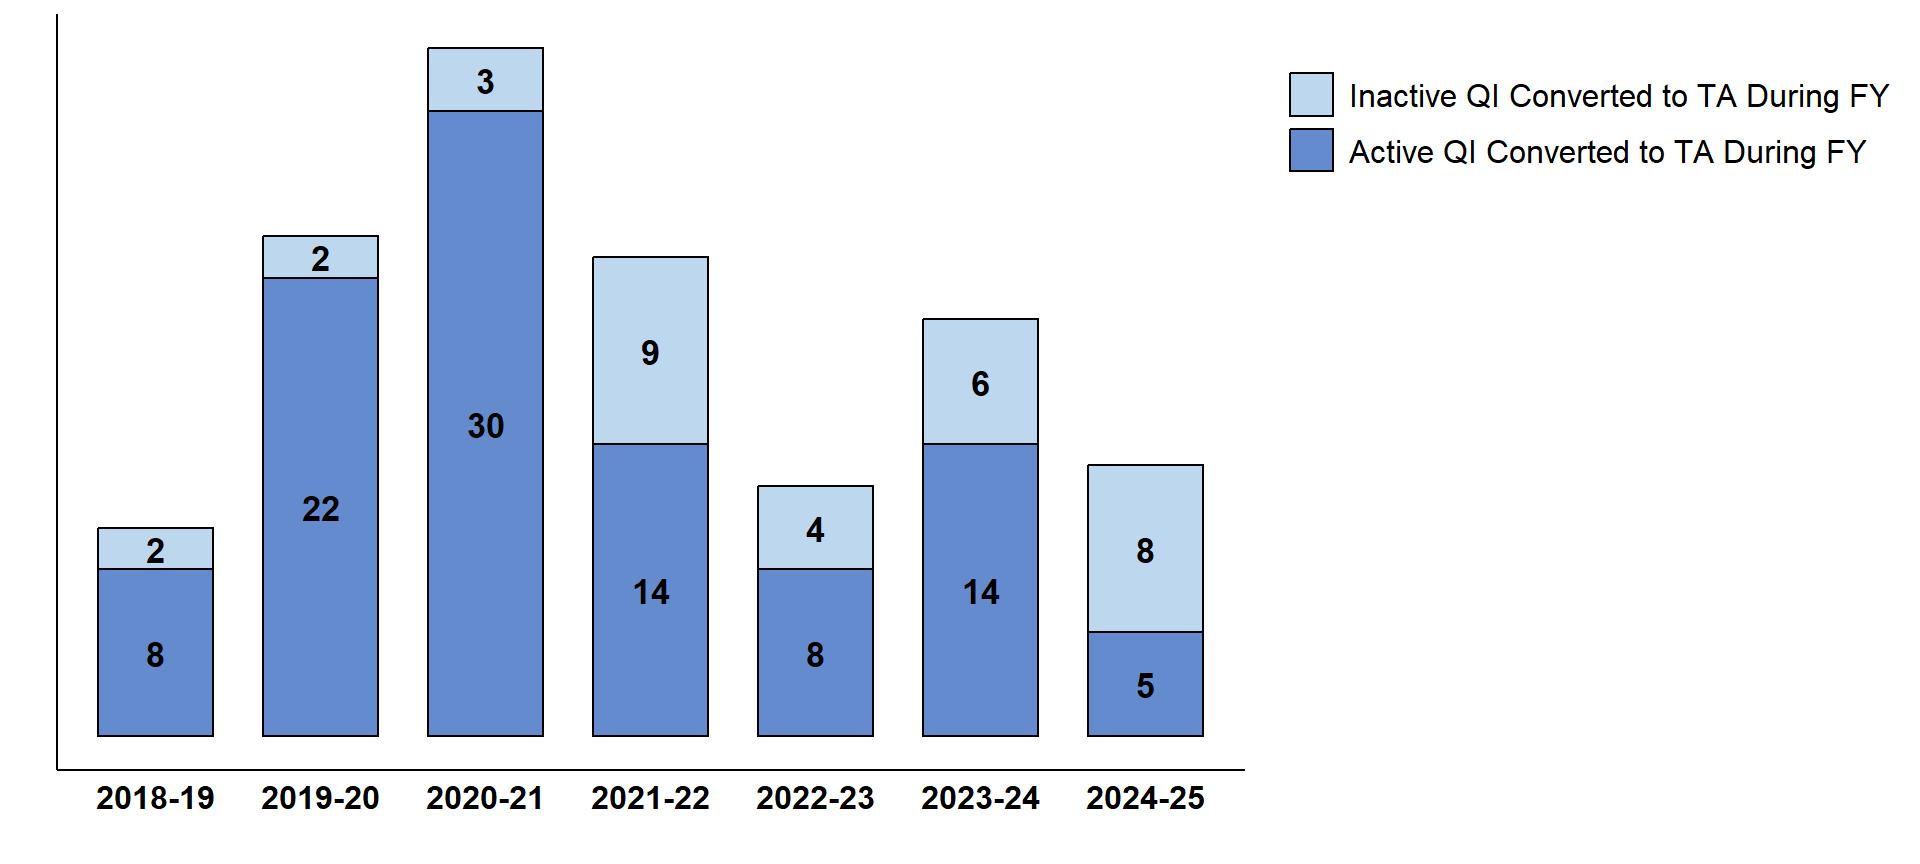
Note. Active QI Providers converted to TA during the fiscal year refer to QI Approved Providers whose QI Inactive date and TA Approval date occurred in the same fiscal year. Inactive QI Providers refer to QI Approved Providers whose QI Inactive date occurred in an earlier fiscal year than their TA Approval date. To date, 135 QI Providers have converted to TA Providers. Names of converted Providers for 2024-25 are listed in Appendix F
CPP QI Providers are located throughout the Cincinnati area with representation in quality gap neighborhoods. Figure 30 illustrates the 57 QI Providers in 2024-25, including those that converted to TA Providers during the school year. As of June 30, 2025, there were 30 non-converted QI Providers in quality gap neighborhoods (Table 7).

1Total number includes QI Providers that converted to TA.
2Not shown in map below (Figure 30).
3QI Providers that did not convert to TA and are in Quality Gap neighborhoods. These are Providers with the potential to increase high-quality seat capacity in Quality Gap neighborhoods.
*Quality Gap neighborhoods for QI Providers based on the updated Quality Gap neighborhood classifications established in December 2022. Prior years were based on the previous classifications established in 2015-16.

The program and evaluation show that CPP is working in alignment with its mission and vision by:
✓ Expanding access to affordable high-quality preschool for 3- and 4-year-olds in Cincinnati, providing tuition assistance to 1,090 preschoolers in 2024-25
✓ Building strong community partnerships, including with Providers to increase high-quality programs, resulting in 135 Providers achieving a high-quality rating since 2017
✓ Contributing to an inclusive early childhood community to sustain high-quality programs and prepare preschoolers for kindergarten, as demonstrated by CPP TA participation being a statistically significant predictor of kindergarten readiness.

To sustain and expand CPP’s impact, the following strategic actions and opportunities are recommended for CPP, policymakers, funders, and early education advocates. Recommendations align with CPP’s goal of ensuring that young children and families have access to quality preschool education and resources that meet their needs. This is important given that families face barriers to early childhood education, including the cost of quality preschool, preschool teacher workforce shortages, and shifts in policy

• Continue Providing Tuition Assistance for Preschool Enrollment and Success: The evaluation showed that high-quality preschool is a significant predictor of kindergarten readiness and long-term academic success. With resources to support the expansion of the Community Provider Network, CPP can further ensure that children have access to high-quality preschool and other important services.
• Support Early Childhood Providers and Programs and Their Sustainability: Continue efforts like teacher and Provider grants that increase teacher pay and retention. These programs and similar efforts expand quality educational opportunities for preschoolers and help support the sustainability of preschools. CPP’s ability to support teachers and Providers is especially important as funding for preschool education becomes more limited and educational policies are rapidly changing.
• Strengthen Support for Preschool Attendance Through Collaborative Parent Outreach: Preschool attendance is an early predictor of whether a child will be on track in preschool, kindergarten, and beyond, as early attendance patterns tend to continue throughout school. CPP nearly met its 90% attendance goal this year, with CPP community-based TA preschoolers attending 89.1% of scheduled days. Collaborative family outreach efforts could strengthen what is already in place and help raise awareness of the importance of regular school attendance. Some families may still need additional resources and services to overcome attendance barriers (e.g., transportation, non-traditional hours, resource-related challenges, understanding the importance of attending regularly).
• Leverage Existing Partnerships to Enhance Public Communications of CPP’s Impact and Benefits: CPP currently has more than 65 local, regional, and national strategic partners supporting its work, see list in Appendix G. The reach of CPP’s public communications could be expanded through collaboratively developed communications shared by partners Messaging should highlight CPP’s successes, measurable outcomes, and showcase existing public support for a broad range of audiences (e.g., parents, businesses, community) For example, CPP, CPS, and community partners could work together to develop shared communication efforts to connect CPP with broader educational goals within Cincinnati’s K-12 success strategy It may be beneficial for CPP to continue to explore new collaborations with local non-profits, faith-based groups, neighborhood councils, and the business community.
• Explore New Data Collaboration Opportunities to Understand Factors for Success: Strengthen strategic data collaboration and resource coordination among CPP, educational institutions, community partners, and public agencies to better understand and predict the factors contributing to academic success for preschool through third-grade students. By expanding data collection particularly on attendance, individual characteristics, home environments, and poverty-related barriers and leveraging insights from proven models and stakeholder input, CPP and partners can identify students who may need additional support early on. This collaborative approach will inform targeted interventions that promote academic, social, and emotional development, ensuring every child has the opportunity to thrive along the educational continuum.
• Continue Working with Partners to Sustain Funding and Efforts: CPP and partners can work together to secure funding for future programs that advance access to high-quality preschool, support preschool teachers and Providers, and coordinate resources for parents.

1 Comprised of CPS kindergartners that attended a CPP Community or CPS Preschool Provider in 2022-23 and/or 2023-24. Excludes students whose parents did not provide parental consent to match preschool records to kindergarten assessment scores.
2 Comprised of 2024-25 CPS kindergarteners who did not attend a CPP TA preschool prior to kindergarten enrollment.
Table A2 continues next page
3
Table A2 (continued). KRA-R Performance by CPP TA Participation, Race, and Socioeconomic Status (2024-25)
Note: Assessment scores were not summarized for samples less than 10.
1 Comprised of CPS kindergartners that attended a CPP Community or CPS Preschool Provider in 2022-23 and/or 2023-24. Excludes students whose parents did not provide parental consent to match preschool records to kindergarten assessment scores.
2 Comprised of 2024-25 CPS kindergarteners who did not attend a CPP TA preschool prior to kindergarten enrollment.
Table A3. Additional KRA-R Performance Factors (2024-25)
1 Comprised of CPP preschooler data available in the SugarCRM database operated by MetrixIQ.
Table B1. Binary Logistic Regressions to Predict Kindergarteners Demonstrating Readiness on the Overall KRA-R (Model 1) and On Track in Language and Literacy (Model 2) Within the Context of CPP TA Participation, Gender, Race, and Socioeconomic Status (SES)
Predictor
3
Note N = 2,375; B = unstandardized coefficients; SE = standard error; P = statistical significance; 95% CI for OR represents the lower-limit and upper-limit of the odds ratio confidence interval.
1 Model 1 Dependent: Demonstrating (KRA-R composite scores at or above 270); Intercept coefficient B = -1.88, SE = 0.12
2 Model 2 Dependent: On Track (Language and Literacy subtest scores at or above 263); Intercept coefficient B = -1.28, SE = 0.11
* Reference category
utcomes by Extended Learning Session (ELS) Participation
C1 (continued).
Table C2. United States Department of Health and Human Services 2024 Federal Poverty Guidelines (FPL), Office of Early Learning and School Readiness
APPENDIX D: MONTHLY ENROLLMENT AND ATTENDANCE FOR CPP TA PARTICIPANTS
The following figures show the total number of preschoolers enrolled and attending a CPP Community preschool each month.
Figure D1. Monthly CPP TA Enrollment 2024-25
Monthly TA Enrollment
Figure D2. Monthly CPP TA Attendance Rate 2024-25
Monthly TA Attendance Rate
Preschool Providers participating in the 2024-25 CPP Community Provider Network include 80 Centers, 121 Family Child Care Programs, and 7 Parochial Schools.
# 123 Apple Tree
24 Hour Child Care From The Heart
3T Learning Academy LLC 11
A A Mother's Love 24HR Childcare
A Place 2 Grow Childcare
ABC DayCare
Above & Beyond II
Alouette Learning Center
Alpha 2 Omega Learning Center
Alphabet Junction, Inc
Angela F. Lyshe-Thierry
B Barbara Dotts
Beautiful Beginnings Childcare
Best Early Development Center LLC
Beyond The Books Learning Center
Big Adventures Learning Center Corp
Bright Futures Home Daycare
Bubble Babies Learning Center
Building Better Futures
Busy Bee Toddler Care and Learning Center
C
C.A.R.E Home Childcare
CAA - Discovering Minds Learning Center
CAA - Life Learning Center
CAA - Millvale
CAA - Ted Berry
Calvary Kids Learning Center, LLC
Carmelia
Montgomery/SugarmamdaycareLLC
CCDC Family Childcare LLC
Chalies Howard
Champion Learning Center
Cherish Your Children Childcare
Children of Hope Learning Center
Children of the Future
Childtime Children's Center
Constant Care Learning Center
Corban Learning Center
Corrinda Ibrahim
Corryville Catholic
CoStars Early Education Center Westwood
Cozy Care Nursery School & Childcare
Creative Environment For Youths LLC
Creative Hearts
CWFF Child Development Center
D Daddy's Daycare - Linn Street
Denise Thompson
Destiny Childcare and Development Center
Discovery Cove Learning Center LLC
Divine Daycare Center Inc.
Donna Davis
Dornetta Williams
Dotty's Day Care LLC
D's Darling Daycare
E Elevated Minds Academy Incorporated
Elite Early Learning Center
Elizabeth Smith
Empower Learn Create, Inc.
Essential Learning Academy
Exploring Excellence Learning Center Corp
F Faith Love Hope Childcare
Frances Moore
Future Achievers Academy
G Generation Hope Childcare and Preschool
GG's TLC Childcare
Gingerbread House Childcare LLC
God's Little Angels Learning Center LLC
Gray's Creative Learning Daycare
H Happy Faces Childcare
Happy Feet Child Development
Happy Hearts & Bright Minds Child Care Center
Heavenly Playground Daycare
Holy Family School
I Imaginations at Work
In God's Hands Christian Youth Center
Inspired Kids Learning Center LLC
InVision Child Care
J Jacqueline's Loving Hearts
Janet Rolley
Jewels Under The Heaven Child Care
Joyce's Kiddie Korner
Just 4 Kids 2 Learning Center
K Kalei Night & Daycare
KB Karing for Babies Childcare
Kendra Pugh
Keneice's Loving Arms Child Care LLC
Kennedy Heights Montessori
KeyKey's Romper Room LLC
Kiara Jenkins
Kids Fun Zone Childcare
Kids Play 513 LLC
Kidsville Childcare and Development North LLC
Kidz R Us Childcare & Enrichment Center
Kila's Angels Learning Academy
Kimberly Satcher
Kings & Queens Unlimited LLC
KJM Childcare
Krayola Kidz Klub
L Land of Love Childcare
Latoya Dixon
Latoya's Daycare LLC
Learning & Lollipops Early Childhood
Education Center
Learning Grove - CityLink
Learning Grove - East Walnut Hills
Learning Grove - Future Environments
Learning Grove - Price Hill
Learning Grove - Schiff I
Learning Grove - Schiff II
Learning Grove - William Mallory Early
Learning Center
Leonna Larkins
Leyla House Learning Center
Lil Royalties Learning Palace
Lisa Cox-Wade
Little Footprints Learning Center
Little Leaders Academy
Little Minds Big Dreams Childcare
Little Promises (Operated by Cincinnati Urban Promise)
Little Steps Daycare Center LLC
Little Treasures Under Ms Chris' Care
Love and Grow Education Service LLC
Loving Kindness Education & Learning Center
Lynn's Loving Hands Family Childcare and Preschool
M Major Dreamers Montessori
Maria Bradley
Marshette Riggs-Smith
Mary's Little Lambs Learning Center
Maya Redman
Mimi's Learning Center llc
Mini Miracles Learning Center
Monica Thomas
Monica Watts
Morgan Phillips
Ms. Sophia Daycare
Mt. Washington Baptist Day Care & Preschool
My 2nd Home Childcare
Mylestones Early Learning and Development
N Nanna's House
Nanny's Multi Level Learning Centers, INC.
Nature w/ Nurture Preschool & Day School, LLC
Next Generation Early Learning Center
Nicole Burns
North Bend Learning Center
Northstar Academy Learning Center
Nurse Julie's Daycare
O Our Busy Bee'zz Childcare
P Palace of Joy Daycare, LLC
Peggy Glasper
Peggy's Precious Angels
Pleasant Ridge Presbyterian Preschool
Poohbears Playhouse
Q Que's Angels
R Rabiah Shakir
Rainbow Room Preschool Learning Center
Raising Children Child Care LLC
Ready Set Learning Center
Red Brick Childcare LLC
Regina Buchannon
Robyn Perkins
Romero Academy at Annunciation
Romero Academy at Resurrection Family Services, LLC
Rougui's Day Care
S Saint William School
Samantha Jackson
Sassafras House
Set For Success Family Child Care
Shawn Lewis Learning Center
Sherry Johnson
Shining Stars Learning Center of Cincinnati
Simpy's Playhouse and Learning Center
Sister/Sister Childcare
Solomon's Childcare (Owner - Sheila Solomon)
Sonya Woods
St. Boniface Preschool
St. Francis de Sales School
St. Lawrence Preschool
Susan Lemons
Sweetie Pie's Learning Center
T Tanya's Educational Child Care
Teefah's Learning Center
Tender Tots Daycare
The BeeHive Child Care
The Children's Home
The Educational Playhouse
The Little Daisy House LLC
The Little Tree House of Knowledge
The Salvation Army Learning Center
The Willow Tree House Daycare LLC
Tiny Steps Development Center Inc
Together We Grow Childcare
TOTally Kids Learning Center
U UC - Arlitt
V Velma's Daycare
Venessa Brogden
Vicky's Tender Heart Childcare
Vonda Cathey
W Water Lily Learning Center, East
Water Lily Learning Center, LLC
Wesley Education Center
Westwood United Methodist Church
Where The Sidewalk Ends Academy
Winton Hills Educational Center
Y YMCA - Christ Child
YMCA - Valley
Yolanda Champion
Young Scholars Academy
Your Learning Treehouse LLC
Youthland Academy of Beekman
Youthland Academy of Pleasant Ridge
Youthland Academy of Price Hill
Z Zion Temple Christian Academy
Table F1. QI Providers Reaching High-Quality Gold or Silver SUTQ Rating in 2024-25
Name of ConvertedProvider TA
Bright Futures Home Daycare 8/16/2024
Busy Bee Toddler Care and Learning Center 8/19/2024
CCDC Family Childcare LLC 8/14/2024
Destiny Childcare and Development Center 1/27/2025
Elite Early Learning Center 8/13/2024
Monica Watts 8/13/2024
Nanna's House 8/14/2024
Shawn Lewis Learning Center 12/11/2024
St. Boniface Preschool 8/19/2024
Tiny Steps Development Center Inc 8/19/2024
Winton Hills Educational Center 11/11/2024
Young Scholars Academy 11/11/2024
Youthland Academy of Beekman 6/3/2025
CPP has many strategic partners who support their mission and vision. Appendix G is a snapshot of CPP’s partners and supporters, provided by CPP.
Adspsoure
All-In Cincinnati Coalition
African American Chamber
AFSCME- American Federation of State, County, and Municipal Employees
American Legacy Theatre
Beech Acres Parenting Center
Best Point Education & BehavioralHealth
Black Child Development Institute Ohio
Central Clinic BehavioralHealth
CET, Public Media Connect
Child Care Choices
Children’s Funding Project
Cincinnati NAACP
Cincinnati Parent Empowerment Network
Cincinnati Recreation Commission
Cincinnati State Technical & Community College
Cincinnati-Hamilton CountyCommunity Action Agency
Cintexx
City of Cincinnati
Consortium for Resilient YoungChildren
CoStarsEarly Childhood Services
Cradle Cincinnati
Dressfor Success
Early Start Columbus
Ellequate
FutureReady 5
Great Start for Great Futures
Greater Cincinnati Foundation
GreenLight FundCincinnati
Guardian Savings Bank
Hamilton CountyJob and Family Services
Human Services Chamber of Hamilton County
Interact for Health
It’s Commonly Jazz
Invest in ChildrenCuyahoga County/UPK
Joseph BerningPrinting
Leadership Council for Nonprofits
Leading Men Fellowship
Learning Through Art, Inc.
Linton Chamber Music
Manley Burke
Mayo Home for Youth Development
Movers &Makers Cincinnati
Pre4CLE
Preschool Promise-Dayton
Project LIFT
Queen City Book Bank
RadioOne
Refined Vision Digital Media, LLC
Santa Maria Community Services
Southwest OhioAssociation for the Education of YoungChildren
Success By 6
The CEO Project
The Cincinnati Herald
The Literacy Lab
The Village Preschool in Anderson
The Voice of Your Customer
Tigerseye Creative
Union Savings Bank
United Way of Greater Cincinnati
University of Cincinnati,School of Education
University of Cincinnati,Lindner Collegeof Business, Urban Impact Studio
Urban League of Greater Southwestern Ohio US Bank
Women’s Fundof the Greater Cincinnati Foundation YWCA of Greater Cincinnati


