

Southport Market Update 1st Half 2025

In Q4 2024, Southport* had a median house price of $1,076,000 and a median unit price of $676,500.This represents anannual (Q4 2023 - Q4 2024)growth of 1.5% for houses and 14.4% forunits. Units saw a higher price growth thanhouses, due to buyers switching their focus to units; as there is low house stock available. Comparing Q4 2023and Q4 2024, total sales declined by -8.8% to (83sales) for houses and-12.7% (to 426 sales) for units. This confirms an undersupplied market in Southport*, which created a buffer against higher interest rates. On a half-year basis (Q2 2024-Q4 2024), median house and unit price saw a temporary dip, which creates a brief window of opportunity for buyers.
FROM LAST


Southport£ will see approximately $861.1Mofnewprojectscommencing constructionin2025
HALF YEAR
MEDIAN PRICE
RENTAL PRICE

PRICE Q4 2024
$1.0M $676K
MEDIAN PRICE Q4 2024
AVERAGE DAYS ON MARKET Q4 2024
49
AVERAGE DAYS ON MARKET Q4 2024


A key infrastructure project planned for 2025is the SouthportSupportive Housing Project. This will construct a supportive housing development for approximately 200accommodation units with communal areas, which targets social and affordable housing.
Key residential projects include:
• Marine Quarter Stage 2 - Scenic Tower (158 Apartments)
• 14-22 Meron Street (69 Units)
• 11-17 Spendelove Avenue Terrace Houses (29Terrace Houses)
• 86 Pohlman Street Townhouses (10 Townhouses)
Despite several residential projects planned in Southport, they will only add new units/apartments and townhouses. Atpresent, there are no new stand-alone dwellings in the 2025 development pipeline.
An absence of new dwellings will exacerbate the current undersupply, highly likely pushing both median house and unit prices higher.


AVERAGE VENDOR DISCOUNT*
Average vendor discount reflects the average percentage difference between the first list price and final sold price. A lower percentage difference (closer to 0.0%) suggests that buyers are willing to purchase close to the first asking price of a property.

Average vendor discounts between Q4 2023and Q4 2024 have tightened to -0.7% for houses but widened to -0.5% for units. Market conditions in Southport* favourbuyers, with owners willing to accept below the initial listed prices. However, Q4 2024average vendor discount is quite close to the first list price (0), and with no new houses planned in 2025; now is an ideal time to enter the market – before average vendor discount becomes a premium.


The suburb of Southport has historically provided a more affordable market than the Gold Coast Local Government Area (LGA) in bothhouse and unit median prices for the past 5years. This continued tobe the case in 2024, even with faster price growth in boththe suburb and the LGA.
The dominant proportion of homes sold in Southport* in 2024were in the premium price brackets, of $1.2M and above (38.1%) for houses and $800Kand above (27.4%)for units. The most affordable price brackets is still available, with 18.1%houses sold below $899,999and 12.7% units sold below $499,999;an opportunity for first home buyers. The market also offers options in the middle price brackets, providing opportunities for buyers with varying budgets.
MARKET COMPARISON
Southport (4215) House
Southport (4215) Unit
Gold Coast City (LGA) House
Gold Coast City (LGA) Unit
The market comparison graph provides
comparative trend for median price of houses and units over the past 5 years. The main LGA chosen was based on their proximity to the main suburb analysed, which is Southport.


PRICE BREAKDOWN 2024

to $1,199,999


Less than $499,999 $500,000 to $599,999 $600,000 to $699,999 $700,000 to $799,999 $800,000 and above
RENTAL GROWTH 2025€
House rental yields in Southport¥ was 3.9% as of December 2024, higher than the Gold Coast (3.4%) and Brisbane Metro (3.2%). Median house rental price did soften slightly, by -2.9% in the past 12months to Q4 2024,to$675 per week. This is due to current economic conditions, which creates an opportunity for renters. That said, the number of houses rented declined by -9.0% (to 111 rentals), which suggests there is still roomfor investors toenter the market.
4+ bedroom houses have provided investors with +1.5% rental growth annually, achieving a median rent of $690per week.
Southport¥ recorded a vacancy rate of 0.8%in December 2024, below the Gold Coast City LGA average of 1.1% and Brisbane Metro’s 1.2%. Vacancy rates have increased in the past 12months, due to investors returning to the market. Thatsaid, a 0.8%vacancy rate is significantly below the Real Estate Institution of Australia’s healthy benchmark of 3.0%,indicating a tight rental demand and quicker occupancy of rental properties in Southport¥ market. This creates a conducive environment for investors, even with a higher entry price in Q4 2024.
RENTAL VACANCY RATES 2025

Southport (4215) Gold Coast Main Brisbane Metro REIA 'Healthy' Benchmark


Southport¥
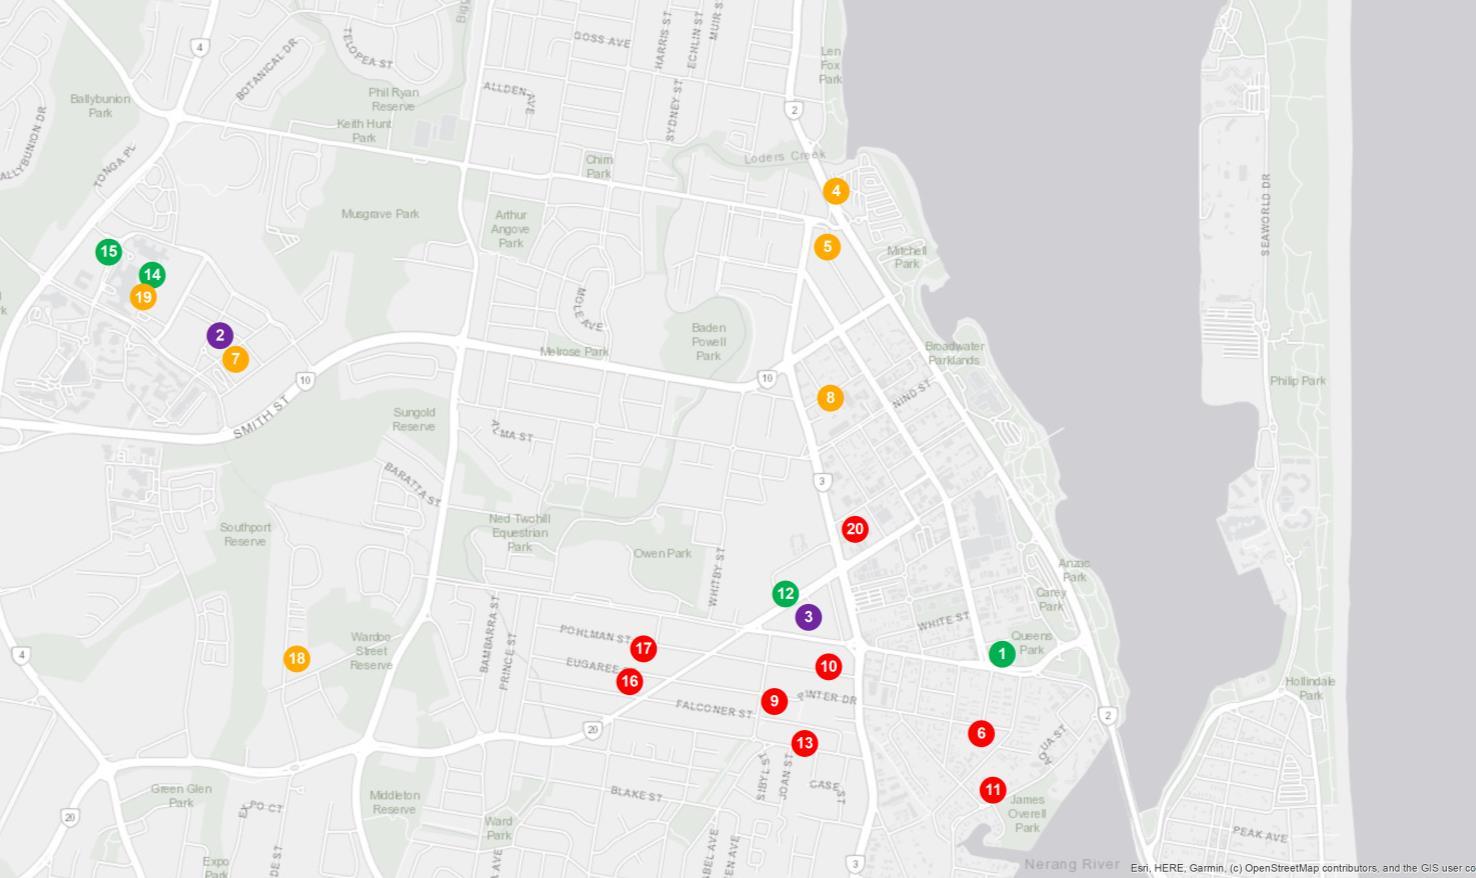
PROJECT DEVELOPMENT MAP 2025 ₳


RESEARCH SERVICES
Our research services span over every suburb, LGA,and state within Australia; capturedin a variety of standard and customised products, andinclude:
• Advisory and consultancy
• Market analysis including profiling and trends
• Primary qualitative and quantitative research
• Demographic and target market analysis
• Geographic information mapping
• Project analysis including product and pricing recommendations
• Rental and investment return analysis
OUR KNOWLEDGE
Access to accurate and objective research is the foundation of all good property decisions.
OUR PEOPLE
Our research team is made up of highly qualified researchers who focus solely on property analysis.


REFERENCES
* Southport sales market data and key indicators encapsulates aggregate property market conditions within the suburbs of Southport, Biggera Waters and Labrador.
** Estimated values are based on construction value provided by the relevant data authority and does not reflect commercial and/or re-sale value.
# 2024 encapsulates sales transactions for the 2024 full year (01/01/2024 – 31/12/2024).
€ Annual rental growth is a comparison between Q4 2023 (01/10/2023 – 31/12/2023)and Q4 2024 (01/10/2024 – 31/12/2024) house median rent figures.
¥ Southport rental market data encapsulates aggregate property conditions within the postcode of 4215.
§ Rental yields shown are as reported as of December 2024.
₳ Project development map showcases a sample of upcoming projects only, due to accuracy of addresses provided by the data provider for geocoding purposes.
£ Projects refers to the top developments within the suburbs of Southport, Biggera Waters and Labrador
µ Estimated value is the value of construction costs provided by relevant data authority, it does not reflect the project’s sale/commercial value.
ψ Commencement date quoted for each project is an approximate only, as provided by the relevant data authority, PRD does not hold any liability to the exact date.
Source: APM Pricefinder, Cordell Connect database, SQM Research, Esri ArcGIS.
Disclaimer: PRD does not give any warranty in relation to the accuracy of the information contained in this report. If you intend to rely upon the information contained herein, you must take note that the information, figures and projections have been provided by various sources and have not been verified by us. We have no belief one way or the other in relation to the accuracy of such information, figures and projections. PRD will not be liable for any loss or damage resulting from any statement, figure, calculation or any other information that you rely upon that is contained in the material.
Prepared by PRD Research. © All medians and volumes are calculated by PRD Research. Use with written permission only. All other responsibilities disclaimed. © Copyright PRD 2025.
