
Dapto Market Update 1st Half 2025

In Q1 2025,Dapto* recorded a median house price of $830,000and a median unit price of $740,000.This represents anannual (Q1 2024 – Q1 2025)price growth of 2.5%for houses and 18.4% for units. Comparing Q1 2024and Q1 2025,total sales increased by 11.3%(to 168sales in Q1 2025) for houses and by 115.8%(to 41 sales toQ1 2025) for units. This confirms a highly demanded market, with Q1 2025sales figures hitting record high. This created a buffer against higher interest rates and underpinned the high price growth, particularly for units. Now is anideal time for owners to capitalise ontheir investments. The gap between median house and unit prices are closing, thus now is anideal time for unit buyers to act.


Dapto£ plans to see approx. $353.4Mof newprojectscommencingconstruction between2025 and2026.


There are several residential & mixeduse projects in Dapto, set tocommence construction in 2025and 2026. These include but are notlimited to:
• 91A Byamee Street (14 Townhouses and 57Apartments)
• 98-100 & 102-110 Princes Highway Mixed Use (52Apartments)
• Bong Bong & Cleveland Roads Subdivision (187Residential Lots)
• Lot 501 Tharawal Drive (50 Dwellings)
The new ready-to-sell housing stock in the pipeline will assist with answering market demand, which cancreate a more sustainable price growth. That said, the number of houses planned is not enough (when compared to the number of sales in Q1 2025),and land lots require time to develop. Thus,in the short-term, higher prices are likely.


AVERAGE VENDOR DISCOUNT*
Average vendor discount reflects the average percentage difference between the first list price and final sold price. A lower percentage difference (closer to 0.0%) suggests that buyers are willing to purchase close to the first asking price of a property.


Average vendor discounts between Q1 2024 and Q1 2025 have tightened slightly at-3.4% for houses. Units however saw discounts widened over the past 12months to-4.1%.
The Dapto* market is still a buyer's market, with vendors willing to accept below the initial listing price. Buyers however should get in quick to take advantage of these discounts while they are still available.
The suburb of Dapto has offered a more affordable house and unit option compared to the wider Wollongong Local Government Area (LGA) for the past 5 years. This continued to be the case into 2025# for both house and unit prices. Thatsaid Dapto’s unit prices are becoming very close to the wider LGA, signalling limited time for unit buyers.
Most of the homes sold in Dapto* in 2024/25#were in the middle price bracket of between $800,000to $899,999 (28.6%) of sales. With a similar amount (21.3%) of affordable (between $700,000-$799,999)and premium ($1,000,000 and above)options available; there is an opportunity for buyers and sellers. Units had most sales, 47.2%, in the most affordable price bracketof less than$599,999 This is good news forfirst home buyers looking to enter the market.
MARKET COMPARISON


Less than $599,999
$600,000 to $699,999
$700,000 to $799,999
$800,000 to $899,999
$900,000 and above
Dapto.
Dapto House Wollongong LGA House Dapto Unit Wollongong LGA Unit
RENTAL GROWTH 2025€
House rental yields in Dapto¥ was 4.1% as of March 2025,higher thanthe Wollongong LGA (3.3%) and Sydney Metro (2.7%). Furthermore, the median house rental price increased by 7.9%in the past 12months to Q1 2025,at $680per week. In the same timeframe the number of houses rented decreased, by -16.8% (to 79 houses) in Q1 2025,suggesting an undersupply. The unit rental market shows a similar pattern, with stable median unit rental price. This indicates a highly demanded and competitive rental market in Dapto¥, which is beneficial to investors.
4+ bedroom houses have provided investors with +12.1% rental growth annually, achieving a median rent of $790per week.
Dapto¥ recorded a vacancy rate of 0.4% in March2025, slightly below Wollongong LGA average of 0.6%and well below Sydney Metro’s 1.3%. Vacancy rates remained relatively steady in the past 12months. Further, a 0.4%vacancy rate is still below the Real Estate Institution of Australia’s healthy benchmark of 3.0%, thus quicker occupancy of rental homes in Dapto¥. This suggests a conducive environment for investors, even with a higher house and unit entry price in Q1 2025.
RENTAL VACANCY RATES 2025

Dapto (2530) Wollongong LGA Sydney Metro REIA 'Healthy' Benchmark

RENTAL
Dapto(2530)¥

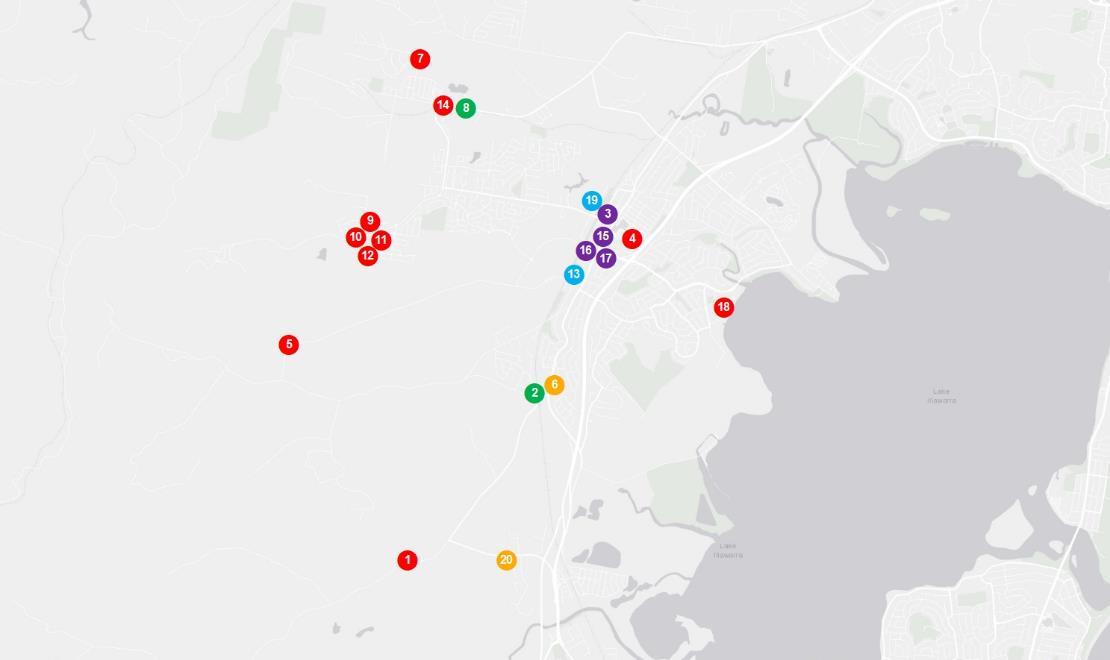
PROJECT DEVELOPMENT MAP 2025-2026 ₳


RESEARCH SERVICES
Our research services span over every suburb, LGA,and state within Australia; captured in a variety of standard and customised products, andinclude:
• Advisory and consultancy
• Market analysis including profiling and trends
• Primary qualitative and quantitative research
• Demographic and target market analysis
• Geographic information mapping
• Project analysis including product and pricing recommendations
• Rental and investment return analysis


OUR KNOWLEDGE
Access to accurate and objective research is the foundation of all good property decisions.
OUR PEOPLE
Our research team is made up of highly qualified researchers who focus solely on propertyanalysis.


REFERENCES
* Dapto sales market data and key indicators encapsulates aggregate property market conditions within the postcode of 2530
** Estimated values are based on construction value provided by the relevant data authority and does not reflect commercial and/or re-sale value.
# 2025 encapsulates sales transactions for Q1 (01/01/2025 – 31/03/2025) only, other years encapsulates sales transactions for the full year (i.e 01/01 to 31/12 of the relevant year).
€ Annual rental growth is a comparison between Q1 2024 (01/01/2024 – 31/03/2024) and Q1 2025 (01/01/2025 – 31/03/2025) house median rent figures.
¥ Dapto rental market data encapsulates aggregate property conditions within the postcode of 2530.
§ Rental yields shown are as reported as of March 2025.
₳ Project development map showcases a sample of upcoming projects only, due to accuracy of addresses provided by the data provider for geocoding purposes.
£ Projects refers to the top developments within the postcode of 2530.
µ Estimated value is the value of construction costs provided by relevant data authority, it does not reflect the project’s sale/commercial value.
ψ Commencement date quoted for each project is an approximate only, as provided by the relevant data authority, PRD does not hold any liability to the exact date.
Source: APM Pricefinder, Cordell Connect database, SQM Research, Esri ArcGIS.
Disclaimer: PRD does not give any warranty in relation to the accuracy of the information contained in this report. If you intend to rely upon the information contained herein, you must take note that the information, figures and projections have been provided by various sources and have not been verified by us. We have no belief one way or the other in relation to the accuracy of such information, figures and projections. PRD will not be liable for any loss or damage resulting from any statement, figure, calculation or any other information that you rely upon that is contained in the material.
Prepared by PRD Research. © All medians and volumes are calculated by PRD Research. Use with written permission only. All other responsibilities disclaimed. © Copyright PRD 2025.