
Macquarie Park Market Update 1st Half 2025

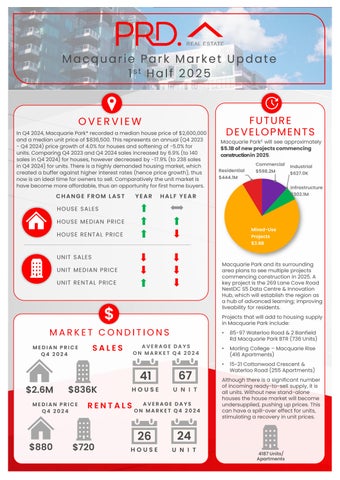
In Q4 2024,Macquarie Park* recorded a median house price of $2,600,000 and a median unit price of $836,500.This represents an annual (Q4 2023 - Q4 2024) price growth of 4.0% for houses and softening of -5.0% for units. Comparing Q4 2023and Q4 2024sales increased by 6.9% (to 140 sales in Q4 2024)for houses, however decreased by -17.9% (to 238sales in Q4 2024) for units. There is a highly demanded housing market, which created a buffer against higher interest rates (hence price growth), thus now is an ideal time for owners to sell. Comparatively the unit market is have become more affordable, thus an opportunity for first home buyers. 41 $2.6M $836K
FROM LAST


Macquarie Park£ will see approximately $5.1Bofnewprojectscommencing constructionin2025
MEDIAN PRICE
RENTAL PRICE


MEDIAN PRICE Q4 2024 MEDIAN PRICE Q4 2024
AVERAGE DAYS ON MARKET Q4 2024
AVERAGE DAYS ON MARKET Q4 2024
Macquarie Park and its surrounding area plans to see multiple projects commencing construction in 2025. A key project is the 269Lane Cove Road NextDC S5Data Centre & Innovation Hub, which will establish the region as a hub of advanced learning; improving liveability for residents.
Projects that will add to housing supply in Macquarie Park include:
• 85-97 Waterloo Road & 2Banfield Rd Macquarie Park BTR (736 Units)
• Morling College – Macquarie Rise (416 Apartments)
• 15-21 Cottonwood Crescent & Waterloo Road (255 Apartments)
Although there is a significant number of incoming ready-to-sell supply, it is all units. Without new stand-alone houses the house market will become undersupplied, pushing up prices. This can have a spill-over effect for units, stimulating a recovery in unit prices.

AVERAGE VENDOR DISCOUNT*
Average vendor discount reflects the average percentage difference between the first list price and final sold price. A lower percentage difference (closer to 0.0%) suggests that buyers are willing to purchase close to the first asking price of a property.


Average house vendor discounts between Q4 2023and Q4 2024have remained at a premium, however lessened toa premium of 2.9% in Q4 2024 Average unit vendor discount have widened to a greater discounts of -1.7% in Q4 2024. Whilst the housing market still favour sellers, and buyers must offer higher thanfirst listed price, there is a starting shift towards a buyer’s market – evidenced throughlower house premium and larger unit discount. This is good news for future home buyers.
The suburb of Macquarie Park has remained relatively on par with the wider Ryde Local Government Area (LGA) in median house and unit price for the past 5 years. Thatsaid, 2024saw Macquarie Park median house prices outperform the wider LGA, making it a premium market.
Most of the homes sold in Macquarie Park* across 2024 were in the most affordable price bracket of $2,299,999or less (34.0%). Units had most sales (26.2%) in the premium price bracket of above $1,000,000,however showed almost equally strong sales numbers in the most affordable price bracket (24.0%). Macquarie Park is a premium market, but there is still a home available for every budget.
MARKET COMPARISON
Park House Ryde LGA House Macquarie Park Unit Ryde LGA Unit
The market comparison graph provides a comparative trend for median price of houses and units over the past 5 years. The main LGA chosen was based on their proximity to the main suburb analysed, which is Macquarie Park.


PRICE BREAKDOWN 2024


Macquarie
RENTAL GROWTH 2025€
House rental yields in Macquarie Park¥ was 3.9%as of December 2024, well above the Ryde LGA (2.5%) and Sydney Metro (2.7%). Further, median house rental price increased by 1.1% in the past 12months to Q4 2024,at $880per week At the same time the number of houses rented declined, by -4.2%(to 159houses) in Q4 2024 This suggests an undersupplied and competitive house rental market in Macquarie Park¥, which is beneficial to investors.
2-bedroom houses have provided investors with +7.4%rental growth annually, achieving a median rent of $634per week.
Macquarie Park¥ recorded a vacancy rate of 2.2% in December 2024,slightly above the Ryde LGA average of 1.9% and Sydney Metro’s 2.1%. Vacancy rates have fluctuated in the past 12months, but overall showed a significant declining pattern, from 3.4%in December 2023. This indicates an even tighter rental market and brings back Macquarie Park¥‘s vacancy rate (2.2%) tounder the Real Estate Institution of Australia’s healthy benchmark of 3.0%. This suggests quicker occupancy of rental properties in Macquarie Park¥, which creates a conducive environment for investment.
RENTAL VACANCY RATES 2025

Macquarie Park (2113)
Ryde LGA

Sydney Metro
RENTAL YIELD 2025§

REIA 'Healthy' Benchmark
Macquarie Park¥
PROJECT DEVELOPMENT MAP 2025 ₳


MACQUARIE PARK


1
2
4

RESEARCH SERVICES
Our research services span over every suburb, LGA,and state within Australia; captured in a variety of standard and customised products, andinclude:
• Advisory and consultancy
• Market analysis including profiling and trends
• Primary qualitative and quantitative research
• Demographic and target market analysis
• Geographic information mapping
• Project analysis including product and pricing recommendations
• Rental and investment return analysis


OUR KNOWLEDGE
Access to accurate and objective research is the foundation of all good property decisions.
OUR PEOPLE
Our research team is made up of highly qualified researchers who focus solely on propertyanalysis.


REFERENCES
* Macquarie Park sales market data and key indicators encapsulates aggregate property market conditions within the suburbs of Macquarie Park, North Ryde, Epping, West Ryde and Eastwood.
** Estimated values are based on construction value provided by the relevant data authority and does not reflect commercial and/or re-sale value.
# 2024 encapsulates sales transactions for the 2024 full year (01/01/2024 – 31/12/2024).
€ Annual rental growth is a comparison between Q4 2023 (01/10/2023 – 31/12/2023)and Q4 2024 (01/10/2024 – 31/12/2024) house median rent figures.
¥ Macquarie Park rental market data encapsulates aggregate property conditions within the postcode of 2113.
§ Rental yields shown are as reported as of December 2024.
₳ Project development map showcases a sample of upcoming projects only, due to accuracy of addresses provided by the data provider for geocoding purposes.
£ Projects refers to the top developments within the suburb of Macquarie Park, North Ryde, Epping, West Ryde and Eastwood.
µ Estimated value is the value of construction costs provided by relevant data authority, it does not reflect the project’s sale/commercial value.
ψ Commencement date quoted for each project is an approximate only, as provided by the relevant data authority, PRD does not hold any liability to the exact date.
Source: APM Pricefinder, Cordell Connect database, SQM Research, Esri ArcGIS.
Disclaimer: PRD does not give any warranty in relation to the accuracy of the information contained in this report. If you intend to rely upon the information contained herein, you must take note that the information, figures and projections have been provided by various sources and have not been verified by us. We have no belief one way or the other in relation to the accuracy of such information, figures and projections. PRD will not be liable for any loss or damage resulting from any statement, figure, calculation or any other information that you rely upon that is contained in the material.
Prepared by PRD Research. © All medians and volumes are calculated by PRD Research. Use with written permission only. All other responsibilities disclaimed. © Copyright PRD 2025.
