Port Stephens Coastal Management Program – Stage 2

Reference: R.N21295.002.05_Draft_Report_MASTER.docx

Date: June 2021
Confidential

Reference: R.N21295.002.05_Draft_Report_MASTER.docx
Date: June 2021
Confidential
BMT Commercial Australia Pty Ltd Level 5, 99 King Street

Melbourne Vic 3000 Australia
Tel: +61 3 8620 6100
Fax: +61 3 8620 6105

ABN 54 010 830 421
www.bmt.org
Document: R.N21295.002.05_Draft_Report_MASTE R.docx
Title: Port Stephens Coastal Management Program – Stage 2
Project Manager: Dr. Tom Doyle
Author/s: Tom Doyle, Toby Devlin
Client: Port Stephens Council
Client Contact: Jessica Morris
Client Reference: RFQ34-2019
Synopsis: This report presents Stage 2 of Port Stephens Coastal Management Program completed by BMT for Port Stephens Council.
Copyright and non-disclosure notice
The contents and layout of this report are subject to copyright owned by BMT Commercial Australia Pty Ltd (BMT CA) save to the extent that copyright has been legally assigned by us to another party or is used by BMT CA under licence. To the extent that we own the copyright in this report, it may not be copied or used without our prior written agreement for any purpose other than the purpose indicated in this report.
The methodology (if any) contained in this report is provided to you in confidence and must not be disclosed or copied to third parties without the prior written agreement of BMT CA. Disclosure of that information may constitute an actionable breach of confidence or may otherwise prejudice our commercial interests. Any third party who obtains access to this report by any means will, in any event, be subject to the Third Party Disclaimer set out below.
Third Party Disclaimer
Any disclosure of this report to a third party is subject to this disclaimer. The report was prepared by BMT CA at the instruction of, and for use by, our client named on this Document Control Sheet. It does not in any way constitute advice to any third party who is able to access it by any means. BMT CA excludes to the fullest extent lawfully permitted all liability whatsoever for any loss or damage howsoever arising from reliance on the contents of this report.
Commercial terms
BMT requests the ability to discuss and negotiate in good faith the terms and conditions of the proposed terms of engagement, to facilitate successful project outcomes, to adequately protect both parties and to accord with normal contracting practice for engagements of this type.
Z:\N21295_Port_Stephens_CMP_Stage2\Docs\Report\R.N21295.002.05_Draft_Report_MASTER.docx

List of Figures
Figure
Figure E-6
Figure E-7
Figure E-8
Dune transgression hazard projections for the Middle (Part 1) AOI, and the 2040 timeframe.
Dune transgression hazard projections for the Middle (Part 1) AOI, and the 2070 timeframe.
Figure E-9
Figure E-10
Figure E-11
Z:\N21295_Port_Stephens_CMP_Stage2\Docs\Report\R.N21295.002.05_Draft_Report_MASTER.docx
Accommodation Space – an area that allows sediment to deposit into it and to accumulate without being readily available to erode again. Such areas serve to ‘capture’ sediments moving through them.
Accretion – the build-up of sediments, either to form shoals or increase in bed level, or to extend a beach or dune seaward.
Aleatory (uncertainty) – refers to uncertainty that is inherent to the process and can be defined by probabilistic distributions or quantities. For example, rolling a die has an aleatory uncertainty in that no single result is guaranteed, however the expected likelihood of results can be well-quantified.
Alongshore (Longshore) – parallel to the shoreline.
Beach Profile – A cross-section taken across the beach from the dune into the ocean in the nearshore zone.
Bedrock – a general term for rock underlying soil or sand.
Berm – A protruding horizontal sandform on the beach caused by wave action depositing sand.
Breaker zone – the nearshore area in which waves begin breaking.
Bruun Rule – A methodology for estimating coastal recession due to changes in sea level.
Closure depth – a depth beyond which changes in the seabed are not thought to occur.
Coastal Hazard – potential threats to assets defined under the Coastal Management Act (NSW, 2016) that encompasses: (1) beach erosion, (2) shoreline recession, (3) watercourse entrance instability, (4) coastal inundation, (5) cliff instability, (6) tidal inundation and (7) hazards due to the interaction of coastal processes and catchment floodwaters.
Coastal Management Plan (CMP) – as detailed in the Coastal Management Act (NSW, 2016) a strategy for managing land and assets within the coastal zone.
Cross-shore – normal to the shoreline.
Dune – shore-parallel sandforms that typically lie at the back of beaches. Formed by beach sand being blown landward and interact with the sand on the beach.
Epistemic (uncertainty) – refers to uncertainty due to a lack of understanding or potential error in the inputs to a process. For example, in a coastal management context, sea level rise in 2100 will be a fixed number, however as it relies on many assumptions about ongoing oceanic/atmospheric processes and potential emissions, it cannot be accurately predicted. Therefore, a range of potential scenarios and outcomes is used to attempt to quantify its epistemic uncertainty.
Foredune – Larger and more established vegetated dune systems that are often eroded under heavy storm activity (forming a dune scarp). Foredune sediments interact with the beach under erosion/recession processes.
Intermittently closed and open lakes and lagoons (ICOLL) – Coastal lakes and lagoons that are open to the sea from time to time, but also experience closure when sediments infill their entrances.
Littoral – pertaining to the shore. i.e. littoral sediment transport is sediment transport occurring in or adjacent to intertidal areas.
Z:\N21295_Port_Stephens_CMP_Stage2\Docs\Report\R.N21295.002.05_Draft_Report_MASTER.docx
Overwash – the effect of waves overtopping a beach berm and flowing into areas behind it. Typically, overwash might occur over a coastal barrier into the estuary behind it.
Probabilistic model – a mathematical tool for assessing a range of variables and outcomes based on their predicted probability of occurring.
Progradation – a movement (of a dune for example) towards the sea.
Recession – a movement (of the shoreline for example) landward. Typically used to refer to ongoing landward movement of the shoreline under a rising sea level or due to a net sediment deficit in the sediment subcompartment.
Sand Rose – Similar to a wind rose, but sand roses show the major wind directions impacting sediment transport in a certain area. Using average sediment grain size, and available wind data, the arrows indicate the main direction and potential sand may move to, while grey bars indicate the drift potential from the other key wind directions for the site (all onshore, offshore winds are not included as they generally blow sand out to sea).
Sediment Compartment – a section of the coast defined by similar sediment transport features. Often broken down into primary, secondary, and tertiary sediment compartments, that relate to increasingly specific and local sediment transport processes. Usually constrained at each end by significant landforms such as headlands, islands, etc.
Shoreface – the area of underwater land extending offshore from the beach. Usually partitioned into an ‘upper shoreface’ that experiences active sediment transport and wave breaking, and the lower shoreface which is generally stable over geologically small timescales (years to decades).
Z:\N21295_Port_Stephens_CMP_Stage2\Docs\Report\R.N21295.002.05_Draft_Report_MASTER.docx
AEP Annual Exceedance Probability
AHD Australian Height Datum
AOI Area of Interest
ARI Average Recurrence Interval
BMT BMT Commercial Australia Pty Ltd
BOM Bureau of Meteorology
CI Confidence Interval
CMP Coastal Management Program
DEM Digital Elevation Model
DP Drift Potentials
DPIE Department of Planning, Industry and the Environment
ECL East Coast Low
ENSO El Niño Southern Oscillation
EVA Extreme Value Analysis
GE Google Earth
HAT Highest Astronomical Tide
HHWSS Higher High-Water Solstice Spring
IPCC Intergovernmental Panel on Climate Change
LAT Lowest Astronomical Tide
LGA Local Government Area
MCA Multi criteria analysis
MHW Mean High Water
MHWN Mean High Water Neaps
MHWS Mean High Water Springs
NPWS National Parks and Wildlife
PoT Peak-over-Threshold
PSC Port Stephens Council
RCPs Representative Concentration Pathways
RDD Resultant Drift Direction
RDP Resultant Drift Potential
SLR Sea Level Rise
SROC IPCC Special Report on the Oceans and Cryosphere
Z:\N21295_Port_Stephens_CMP_Stage2\Docs\Report\R.N21295.002.05_Draft_Report_MASTER.docx

Port Stephens Council and BMT acknowledge the Worimi as the original custodians of Port Stephens. May we walk the road to tomorrow together as we care for this beautiful land and waters.
Port Stephens Council (Council) with the assistance of the NSW Department of Planning, Industry and Environment (DPIE) resolved to prepare a Coastal management Program (CMP) for the Port Stephens Coastline and estuary. The CMP shall define the long-term strategy for the coordinated, sustainable management of the coastal zone land and waterways, with the aim of achieving the objects of the Coastal Management Act 2016 (the CM Act). The key focus for this CMP is to manage the Port Stephens coastal environment in an ecologically sustainable way, for the social, cultural and economic well-being of the Port Stephens community.
This CMP is being prepared to meet the mandatory requirements for CMPs set by the CM Act and the accompanying NSW Coastal Management Manual (OEH, 2018) (the Manual). The Manual specifies 5 stages of preparation of a CMP, as shown in Figure 1-1. This report fulfils Stage 2 of the CMP preparation process.


Z:\N21295_Port_Stephens_CMP_Stage2\Docs\Report\R.N21295.002.05_Draft_Report_MASTER.docx


Currently, Council have completed Stage 1 of the CMP process (Scoping Study), which established the context for management, identified key risks and outlined the forward program for subsequent CMP stages and associated studies/tasks. This report will present Stage 2 of the program, which will address and fill knowledge gaps (previously identified in the Scoping Study) (Port Stephens Council, 2019). Council have engaged BMT to conduct these technical investigations for the Port Stephens study area (defined in Figure 1-2). As per the Manual, Stage 2 of the CMP preparation process “involves undertaking detailed studies that help councils to identify, analyse and evaluate risks, vulnerabilities and opportunities”.
The scope for this Stage 2 report is detailed below, based upon the requirements for Stage 2, and determined through the course of the Stage 1 Scoping Studies for the Port Stephens coastal environment.
• An assessment of governing physical coastal processes, and the development of sediment transport conceptual models for each key secondary sediment compartment contained within the study area.
• A probabilistic assessment of beach erosion and shoreline recession using Monte Carlo simulations, and based upon agreed model input parameters, as well as a NSW Sediment Compartment Framework. Outputs for beach erosion and shoreline recession were then used to develop maps of relevant probable erosion extents (e.g. 10th percentile, 50th percentile, 90th percentile, etc). This hazard mapping approach also incorporates the presence of bedrock and other such features that provide a limit to erosion extents.
• An assessment of coastal inundation for the study area, which incorporates various components of elevated oceanic water level (i.e. astronomical tide, wind set up, wave set up, barometric set up, wave run up, and future sea level rise and wave climate change), and was combined for relevant return periods and storm durations, at the timeframes of interest for Council. Considering the potential location of the shoreline in future with shoreline recession, the elevated ocean levels were mapped to illustrate potential areas of inundation from wave overtopping.
• An assessment of dune transgression at Stockton Bight, which was based upon BMTs recently developed dune transgression methodology to quantify rates of dune movement and determine sand drift hazard setback lines for future timeframes. Publicly available information, such as aerial photography and other available survey data (e.g. NearMaps imagery) was used to determine the long-term rates of dune transgression
• Updated audit of existing foreshore protection structures, which included an inception meeting with Councils project team to agree on project objectives, and priorities Followed by a desk top review and gap analysis, and based on the results of that, a tailored on-site condition assessment occurred, which categorised the suitability and condition of existing foreshore structures.
• An asset impact /exposure assessment for hazards investigated in this report. The erosion, recession, inundation, and dune transgression hazard mapping described above were used as the basis for determining potentially exposed assets behind / within the coastal systems. This information will provide Council with an understanding of the assets at risk from coastline related
Z:\N21295_Port_Stephens_CMP_Stage2\Docs\Report\R.N21295.002.05_Draft_Report_MASTER.docx
hazards, that can be used to guide a full-scale risk assessment and the development of management options in Stage 3 of the CMP
It should be noted that the CMP does not replace a flood study. This CMP will produce a set of hazard maps, which should be used for hazard assessments on the open coast, and within coastal process dominated areas. For key estuaries (i.e. Port Stephens), Council should consider conducting a flood study (or use a current flood study) that combines ocean water level events (coastal inundation), tides (tidal inundation), future sea level rise and catchment rainfall to more accurately determine the extent of inundation from both coastal and catchment flooding hazards.
The coastal zone is defined under the CM Act as comprising four coastal management areas (being, in order of priority, the coastal wetlands and littoral rainforest area, coastal vulnerability area, coastal environment area, and coastal use area).
Port Stephens Council is located on the NSW coast approximately 50 km north of Newcastle and 150 km north of Sydney (see Figure 1-2).
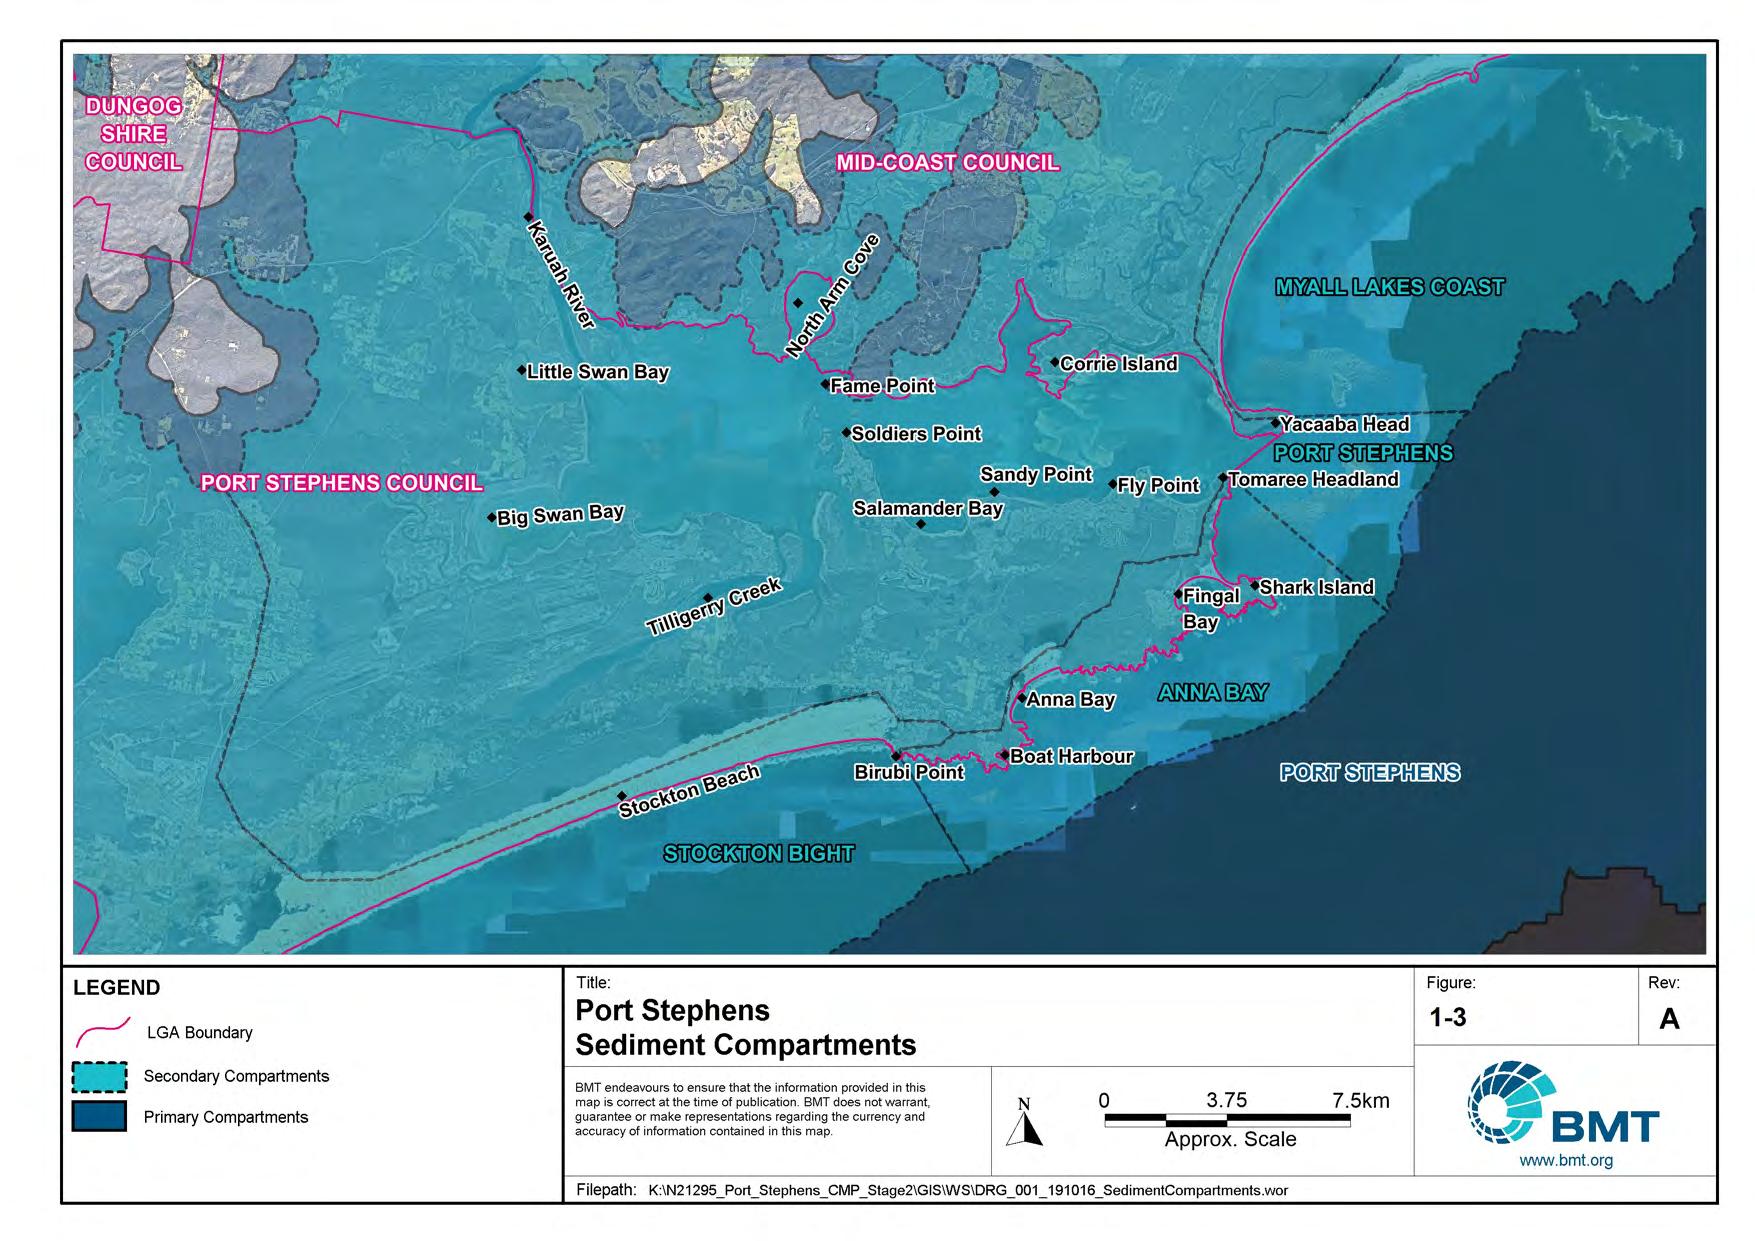
This region is part of the Port Stephens Primary Sediment compartment (Figure 1-3), which includes a range of physical settings – including coastal cliffs, rocky shores, open coast beaches, a vast estuary system, natural sandy shores and a significant transgressive dune system. For the purpose of the CMP Stage 2, the Tender Brief has identified three key management precincts which reflect the diversity of the study area, these being:
• Open coastline (sandy beaches);
• Port Stephens Estuary; and
• Stockton Bight transgressive dune system.
On the open coast, the study area begins partway through Stockton Beach which surpasses all other beaches in NSW in terms of length, wave energy, size of the barrier and sand dunes, and the age of its backing barriers. The 32 km Stockton Beach is one of the largest, most active coastal dune systems in NSW (Short, 2007). The landward transgression of sand within this dune system is part of the active coastal sand system transporting sediment in a net northwards direction along the NSW coast. Generally, the dunes are most mobile and variable within the unvegetated (bare) sand areas, with vegetated areas instead tending to capture and retain windblown sands. Newcastle Council will need to be consulted through the CMP process, with their LGA extending into Stockton Beach.
From the northern end of Stockton Beach at Birubi Point, the coastline changes to a steep rock shoreline with many small bays, sandy beaches, significant rocky reefs and headlands. The sandy beaches are a highly valued community asset. This section of the coastline extents up to the Yacaaba Head and contains the townships of One Mile and Fingal Bay.
Port Stephens estuary is a large tidal estuary that covers approximately 140 km2, with the total catchment area draining to Port Stephens being around 2,900 km2. The estuary has a predominantly east to west orientation, which can be divided into two embayment either side of Soldiers Point based
Z:\N21295_Port_Stephens_CMP_Stage2\Docs\Report\R.N21295.002.05_Draft_Report_MASTER.docx
on the differing physical characteristics. The Inner Port, to the west of Soldiers Point, is characterised by wide mud flats with mangrove and saltmarsh and is dominated by fluvial processes. Conversely, the area East of Soldiers Point (The Outer Port) is comprised of sandy marine originated sediments and dominated by tidal and wave processes which results in much clearer waters (Umwelt, 2009). Mid Coast Council will need to be consulted through the CMP process, as their LGA spans across the estuary’s northern shores.
The Port Stephens coastal zone has both economic and ecological significance for the surrounding communities and State. Port Stephens has a range of environmental assets (e.g. rocky shores, dune systems, reserve areas), economic benefits (e.g. tourism, oyster farming, foreshore residents and businesses, coastal economy) and social benefits (e.g. beach amenity, coastal recreation), in addition to significant cultural and heritage values. The waterway is also reserved under the Port Stephens – Great Lakes Marine Park, the largest marine park in NSW (Department of Primary Industries (DPIE)). As such, the Port Stephens coastal zone is integral to the social and cultural wellbeing of the Port Stephens community. Finally, a number of significant Aboriginal cultural and spiritual sites are within or adjacent to the park. NSW National Parks, NSW Marine Park Authority and the Worimi Aboriginal community will be important stakeholders in the CMP process.
The CMP will be prepared to extend for a 10-year period from 2021 to 2031. The following timeframes are considered by the CMP, including for completing the risk assessment in this Stage 2 Report.
• 2020 / Present Day
• 2040 (i.e. 20 years time)
• 2070 (i.e. 50 years time)
• 2120+ (i.e. 100 years time)
Consultation was undertaken throughout the preparation of this Stage 2 report with Council staff and DPIE – Biodiversity and Conservation Division / Coast and Marine Unit, Science Division, and several other key agencies. An Expert Panel Workshop was conducted with several agencies, council staff, and other relevant stakeholders. Invitees to the workshop included various representatives from the organisations listed in Table 1-1
Table
Organisation
Port Stephens Council (Council)
Department of Planning, Industry and Environment (DPIE)
Representative(s)
Kylie Kaye (Natural Resource Coordinator)
Jessica Morris (Environmental Officer)
Brock Lamont (Community and Recreation Coordinator)
Stuart Young (Biodiversity and Conservation Division)
Neil Kelleher (Biodiversity and Conservation Division)
Dr. Phil Watson (Climate Change and Sustainability)
David Hanslow (Science Division)
Z:\N21295_Port_Stephens_CMP_Stage2\Docs\Report\R.N21295.002.05_Draft_Report_MASTER.docx

This report presents the results of these technical investigations, separated into several key categories, as defined in the project brief. This document is therefore organised as follows:
• Section 1 – Introduction, background, project aims / objectives and description of study area
• Section 2 – A review of the coastal geomorphology and processes (inc. conceptual models)
• Section 3 – Presentation of coastal erosion modelling results and mapping (Open Coast)
• Section 4 – Presentation of Outer Port erosion hazard definition study results and mapping (Estuary)
• Section 5 – Presentation of inundation results and mapping (Open Coast and Estuary)
• Section 6 – Presentation of dune transgression study results and mapping (Stockton Dunes)
• Section 7 – A discussion of the uncertainty involved in hazard assessments and modelling used within this project
• Section 8
Presentation of results for the Port Stephens structure audit (Estuary)
• Section 9 – A synthesis of results for the exposure assessment studies and asset registers (Open Coast, Dunes and Estuary)
• Section 10 – Provides an outline of the way forward for the CMP
Additionally, there are a series of Appendices that provide detailed explanation of the hazard analysis methodologies, as well as the full compendium of hazard maps.
Z:\N21295_Port_Stephens_CMP_Stage2\Docs\Report\R.N21295.002.05_Draft_Report_MASTER.docx
An understanding of the critical influences on coastal hazards and processes in the study area and broader region is fundamental to the development of this coastal hazard risks, vulnerabilities and opportunities study (CMP Stage 2). This chapter details the understanding of the important delineations and processes within the study area, including the presentation of regional sediment transport conceptual models.
The Coastal Management Manual (NSW, 2018) recommends the use of sediment compartments as a framework for considering coastal processes to analyse coastal hazards. Sediment compartments are defined as an area of coast that behaves in a broadly homogenous way with respect to sediment transport processes, sources and sinks (Thom, et al., 2018)
The open coast of the study area, extending from Stockton Beach to Yacaaba Headland, sits within the primary sediment compartment of Port Stephens, which extends from Cape Hawke (near Forster) in the north to Nobbys Head in the south (CoastAdapt, 2018) (Figure 1-3). This area experiences primarily northward sediment transport in line with the predominant south-easterly wave direction. The compartment is exposed to storms, including east coast lows (extra-tropical cyclones) as well as climate variations due to the El Niño Southern Oscillation (ENSO).
The study area is also encompassed within three secondary sediment compartments (Figure 1-3), which include (from the north):
(i) Port Stephens, it extends from Yacaaba Headland in the north to Tomaree at Shoal Bay in the south (including the entrance to the Port Stephens estuary);
(ii) Anna Bay, it extends from Tomaree Head to Birubi Point in the south; and
(iii) Stockton Bight, which extends from Birubi Point to Nobbys Head, Newcastle
All these secondary compartments are separated by major rocky headlands, which also contain substantial submerged rocky reef / outcrops. These points control the movement of sediments, and subsequent sections of this report will discuss the process driving this sediment transport within and around these compartments (CoastAdapt, 2018). The sediments are largely composed of sands (Terrigenous Quartz), with some rocky outcrops offshore and in minor headlands.
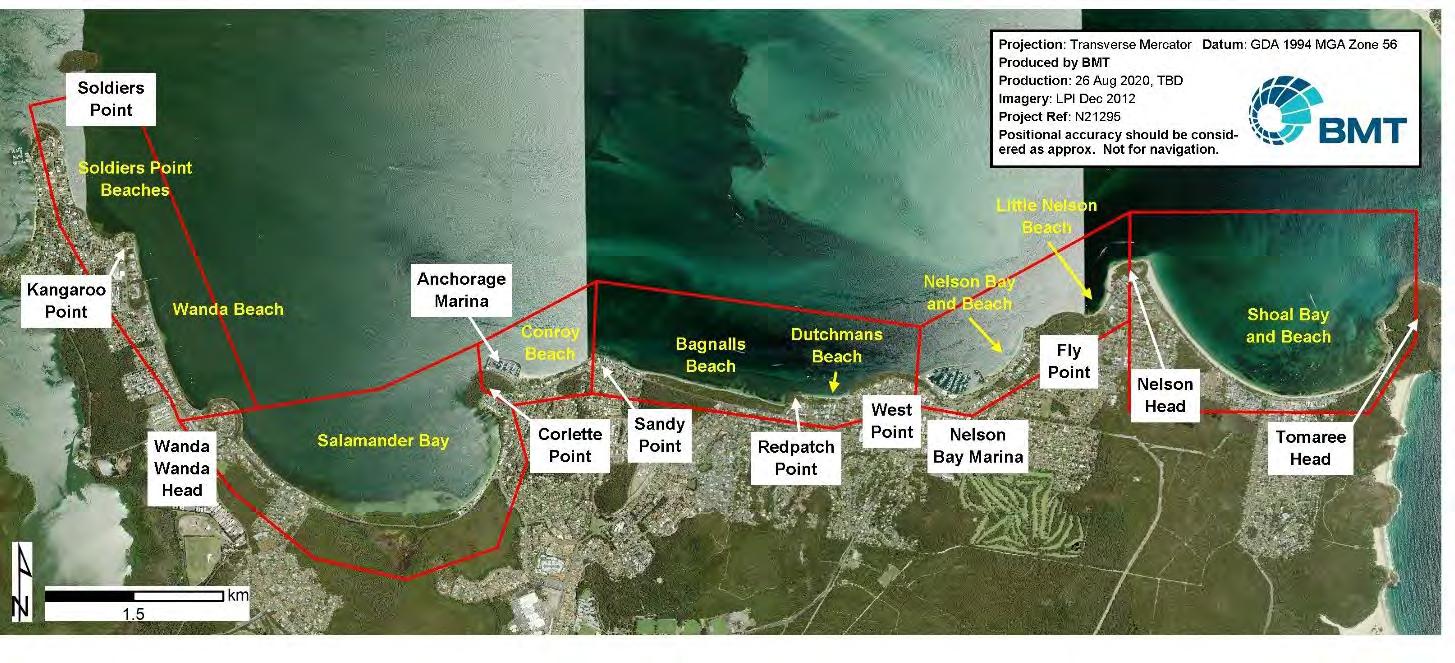
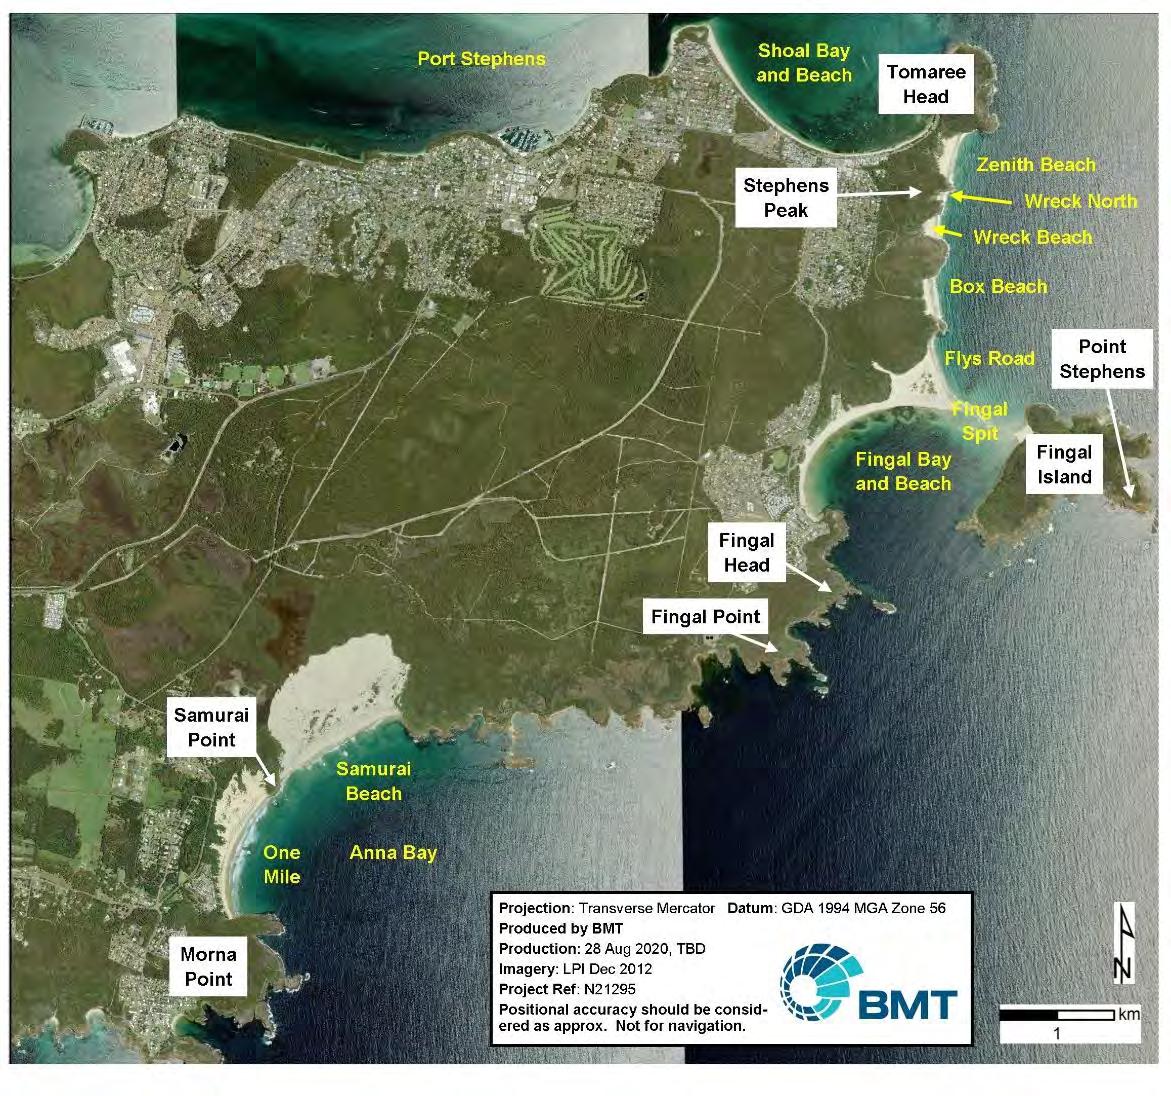
There are numerous key tertiary compartments within the study area. These are coastline sections on the scale of individual beach systems, each one affected by a set of coastal processes. The tertiary sub-compartments for this project, separated by secondary compartment, are illustrated in Figures 2-1 and 2-2 and are described in Appendix A
Z:\N21295_Port_Stephens_CMP_Stage2\Docs\Report\R.N21295.002.05_Draft_Report_MASTER.docx
Z:\N21295_Port_Stephens_CMP_Stage2\Docs\Report\R.N21295.002.05_Draft_Report_MASTER.docx
Z:\N21295_Port_Stephens_CMP_Stage2\Docs\Report\R.N21295.002.05_Draft_Report_MASTER.docx

Winds within the study area follow a generally seasonal pattern. During Spring and Summer, onshore winds dominate, with winds largely from the southeast to east-northeast. These conditions can drive strong wave events, with some offshore swell penetrating the Port Stephens estuary. During Autumn and Winter, offshore winds are more common, which may generate small wind waves within the estuary. Generally winds within the estuary are calmer and more sheltered than surrounding areas.
Seasonal windroses are shown in Figure 2-3 and Figure 2-4 for Nobbys signal station representing exposed offshore conditions, and Nelson Head representing conditions within the estuary respectively.
The nearest permanent wave buoy is at Crowdy Head, approximately 120 km north of the study area. WRL (2011) conducted an analysis of wave buoys along the NSW coast, including Crowdy Head. Extreme waves as taken from this study are shown in Table 2-1, showing 100-year ARI one-hour exceedance waves at Crowdy Head reaching 8.5 m. The Crowdy Head buoy is non-directional, however WRL (2011) present directional extremes for Sydney (south) and Byron Bay (north) which both show the strongest storm events coming from the southeast, with minimal conditions occurring from the northeast (shown in Table 2-2)

Z:\N21295_Port_Stephens_CMP_Stage2\Docs\Report\R.N21295.002.05_Draft_Report_MASTER.docx
It is important to understand wind and wave processes, as they are key drivers influencing sediment transport mechanisms on the coast, and hence needs to be considered when investigating and modelling coastal hazards. For example,while storm waves often produce devastating instantaneous damage and beach-dune erosion, the normal / calmer (or ‘ambient’) wave climate that continues post-storm is what is responsible for the beach and dune recovery, longer-term sediment delivery and shoreline orientation (i.e. swell waves bring sand back) (Ranasinghe et al. 2004; Harley et al. 2011; Mortlock and Goodwin 2015). The interaction of wind, waves and sediment transport is further explored in Section 2.6, while the relationship or influence these processes have in regard to coastal hazards (and hazard modelling inputs) is further developed in Section 3 (esp. 3.2), and Section 5 (esp. 5.2), and Appendix F (F 2).
Z:\N21295_Port_Stephens_CMP_Stage2\Docs\Report\R.N21295.002.05_Draft_Report_MASTER.docx
Z:\N21295_Port_Stephens_CMP_Stage2\Docs\Report\R.N21295.002.05_Draft_Report_MASTER.docx


Z:\N21295_Port_Stephens_CMP_Stage2\Docs\Report\R.N21295.002.05_Draft_Report_MASTER.docx

Tides at Port Stephens follow a macro-tidal (tidal range >1m), semi-diurnal pattern (two high/low tides per day). The nearest long-term tide gauge is at Fort Denison (Sydney), which shows that the highest astronomical tide is 1.23 mAHD, which is similar to the 1-year storm-tide level. Storms elevate these levels but only to extreme levels <1.5 mAHD at present-day. The extreme water levels (or storm water levels) were derived from the Fort Denison tide records, using extreme value analysis (EVA) and peak-over-threshold (PoT) methods to extract extreme / storm events (classed by water level peaks above 1 mAHD). The results are shown in table 2-4 and have been extracted / presented to match the selected planning timeframes set for this study (see Section 1.6). Details of the tidal analysis and extreme value analysis (EVA) and tidal planes analysis can be found in the Appendix
i.e. the highest astronomic high-tide possible.
Mean High Water Springs. The average high tide during spring tides.
Similar to wind and waves processes, it is important to understand tides and storms, as they are key drivers influencing sediment transport mechanisms and inundation on the coast, and hence needs to be considered when investigating coastal hazards. The relationship or influence these processes have regarding coastal hazards (and hazard modelling inputs) is further investigated in Section 3 (esp. Section 3.2), and Section 5 (esp. Section 5.2). and Appendix F.2
Z:\N21295_Port_Stephens_CMP_Stage2\Docs\Report\R.N21295.002.05_Draft_Report_MASTER.docx
A relative shift in all ocean water levels can occur for several reasons. The first is a change in the ground level due to geological effects. These effects are usually small, but localised areas may experience significant changes due to effects from the prevailing geology. The second is observed sea level rise due to ongoing climate change.
The Intergovernmental Panel on Climate Change (IPCC) is the most widely recognised body that disseminates objective science on climate change and its associated impacts. The IPCC has released several broad documents that detail the state of the current science and prediction, the latest of which is the Special Report on the Ocean and Cryosphere in a Changing Climate (SROCC) (IPCC, 2019). The SROCC details the following conclusions:
• Mean sea level has risen globally throughout that 20th century and has accelerated in recent decades.
• Total mean sea level rise from 1902 to 2015 is 0.16 m (likely range of 0.12-0.21 m).
• The rate of sea level rise over 2006-2015 is 3.6 mm/year (very likely range of 3.1-4.1 mm/year).
• The Greenland and Antarctic ice sheets are predicted to lose mass at an increasing rate throughout the 21st century.
• Strong reductions in greenhouse gas emissions in the coming decades are required in order to reduce further changes after 2050.
These projected changes (last two points) are based on a range of different global climate models that simulate several potential future scenarios of carbon emissions. These different scenarios are known as Representative Concentration Pathways (RCPs). While it is currently difficult to predict the pathway that the global society will ‘adopt’ over the longer-term, these different RCPs provide suitable pathways to quantify potential impacts that would result for each one.
For the purpose of coastal management planning in east coast Australia (and hence this study), it is suitable at this stage to adopt the most conservative RCP8.5. This represents a ‘business as usual’ pathway where limited success is achieved in reducing global carbon emissions. In the context of erosion risk, this represents sea level rise constantly accelerating throughout the 21st century and continuing to accelerate beyond 2100.
Offshore from Port Stephens, the projected sea level curves are summarised in Figure 2-5, of particular interest is the dark blue curve, as it represented the adopted RCP scenario for this study; RCP8.5. Table 2-5 outlines the projected sea levels (RCP8.5) at key planning timeframes (presentday, 20-years, 50-years and 100-years) relative to the 1986–2005 averages, for the Port Stephens study area
Z:\N21295_Port_Stephens_CMP_Stage2\Docs\Report\R.N21295.002.05_Draft_Report_MASTER.docx
* m above the 1986 – 2005 average sea level
Please note. for sea level rise timeframes considered in this CMP that go beyond the timeframes detailed in the latest IPCC publications (e.g. 2120), trend extrapolation of the IPCC data was used (IPCC, 2019; CSIRO, 2020).

Z:\N21295_Port_Stephens_CMP_Stage2\Docs\Report\R.N21295.002.05_Draft_Report_MASTER.docx
Active coastal dune systems are naturally dynamic and mobile systems that change over time through the action of wind. Windborne sediment transport drives changes in dune topography through the process of erosion and accretion. Transgressive coastal dune systems are a type of barrier dune that migrate landwards over time due to prevailing onshore winds, and Stockton Bight sand dunes are a perfect example of these. The movement of the sand dunes are influenced by wind direction, frequency and strength. Further information on dune formation, geomorphology and processes can be found in Appendix B
The Port Stephens study site contains one of the largest barrier systems in NSW, Stockton Bight, as well as the large Port Stephens flood tide delta. Combined, these features represent the largest sediment sinks on the NSW coastline, containing almost 4.5 km2 of marine sand, which equates to about 42,900 m3m-1 of beach (Short, 2020). Sediment loads in the order of 20-30,000 m2 year-1 has been estimated to be moving around this primary compartment, especially around Nobbys Head (Newcastle) (DHI, 2006). Sand is however, being lost to the large transgressive and mobile dunes within the Stockton Bight secondary compartment, and into the large Port Stephens flood tide delta. Thus, this is the highest energy and most dynamic coastal system on the NSW coast.
Sediment transport is mobilised through either longshore, or cross shore processes (driven primarily by wind or wave energy). Cross shore transport generally occurs during storm events, and is the movement of sand perpendicular to the shoreline, which occurs as a result of a change in the equilibrium conditions (e.g. storm surges, sea level rise and/ or wave forcing) (Cardno, 2020). High wave events erode the subaerial beach and move sand to the subtidal part of the beach profile where it forms sand bars typically 50 to 100 m from the shoreline and can happen over very short time periods (<24hrs). Part of the sand in these bars is not generally lost to the beach system, as it is subsequently worked back on shore during periods of lower wave energy. In addition to waves, wind energy also contributes to cross shore processes. In this area southernly winds play a large role in transporting sand form the beach face into the large transgressive dunes, such as those at Stockton, as well as One Mile and Samurai beaches.
Longshore sediment transport typically occurs over longer periods of time (e.g. seasonally or years), with wave action moving sediment along the shoreline. The following sections will describe the likely sediment transport trends for the 3 secondary sediment compartments found within the study area.
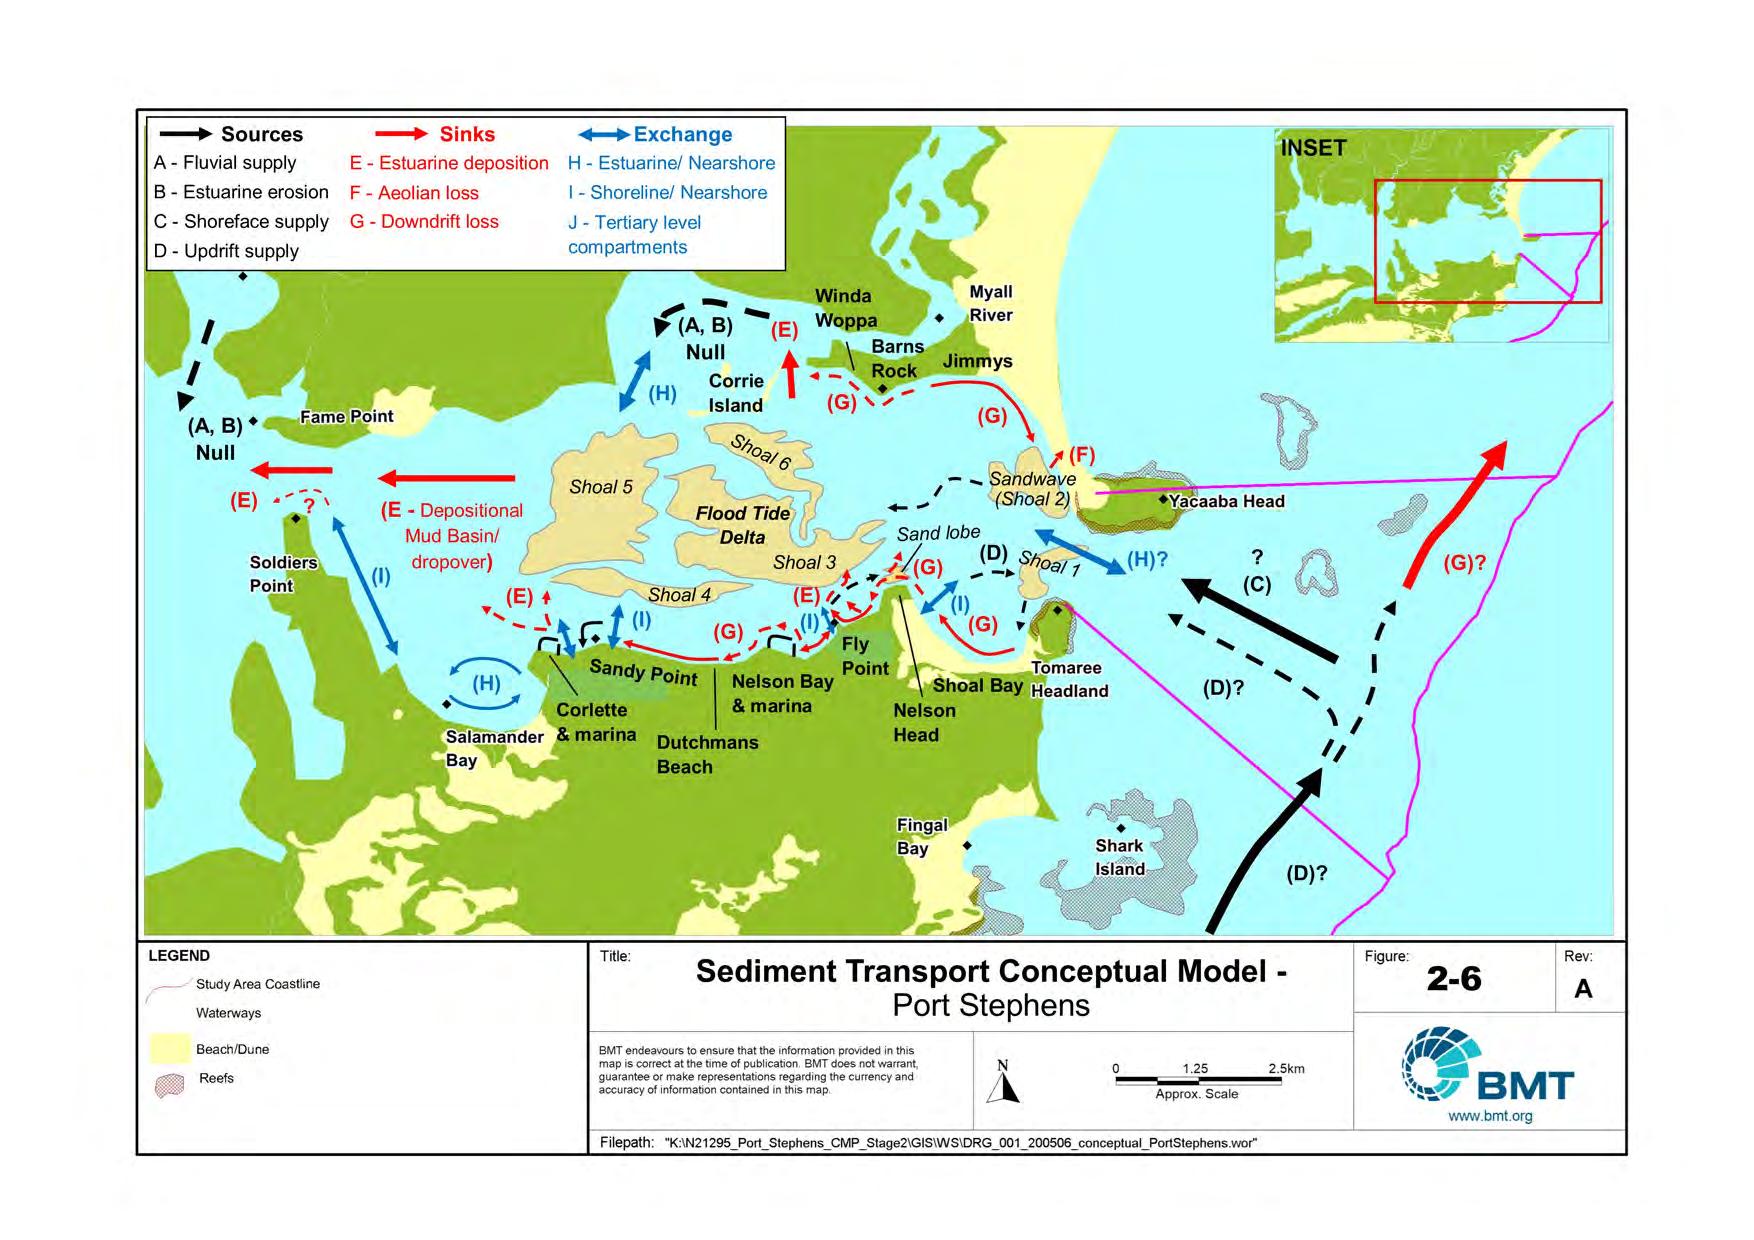
Based on the review of available literature and an air photo analysis, a conceptual model of sediment transport was developed for each secondary compartment within the study area. These conceptual models inform our assessment of the behaviour of the coastal environment, as well as possible erosion and recession trends. The conceptual models are illustrated in Figures 2-6 to 2-8 Arrows represent sediment transport pathways, as well as highlighting key sediment sinks, possible sources and exchanges of sand Please note, more detailed descriptions and explanations of sediment transport for each secondary compartment can be found in Appendix A.
Z:\N21295_Port_Stephens_CMP_Stage2\Docs\Report\R.N21295.002.05_Draft_Report_MASTER.docx
• Shoal Bay: Shoal Bay has a very dynamic shoreline that experiences both erosion and accretion. As shown in Figure 2-6, the western end of Shoal Bay is a highly reflective beach, that is aligned to the dominant ocean swell, and because of the dominant westward longshore transport found here, it has a wider beach and dune system. Intermittently, sand can either: a) build up at this end of the beach to such an extent that westward bypassing occurs around Nelson Head (BMT WBM, 2011; Wainwright, 2015), or b) storm events can erode the subaerial beach and move sand to the subtidal part of the bay, forming sand bars that usually return to the subaerial parts slowly, during calmer conditions. Sand from the sand bars can also be transported to the sand shoal (Shoal 1 in Figure 2-6) situated at the entrance to Port Stephens, which then can supply sand back to the eastern parts of Shoal Bay. The beach at the central to eastern end of Shoal Bay is narrow and flat and has been experiencing long-term erosion and recession (Harris, 2009). This indicates that the sand from the shoal does not always make it to the beach, but is captured in the westward longshore transport pathway, heading back to the western end of the bay where sand is predominantly accumulated (and sporadically lost to adjacent sub-compartments) (Figure 2-6)
• Nelson Head to Nelson Bay Marina: Little Nelson Beach is situated on western side of Nelson Head (Figure 2-1), and as implied above, receives intermittent amounts of sand from Shoal Bay via headland bypassing Sand builds up on the north-eastern end of Little Nelson, and slowly moves west with the dominant longshore current, which may either bypass Fly point into Nelson, or most likely, be lost in the strong eastward tidal current, situated just off the shoreline, and take the sands north of the point (Figure 2-6) (Royal Haskoning
Prior to the construction of the Nelson Bay Marina and the breakwaters, there was a continuous cycle of sediment movement along Nelson beach (both westward and eastward). The reason for the bi-directional movement of sand in this sub-compartment, is the dominance of either wind (strong westerlies drive an eastward movement), or wave energy (generally ocean swell drives the westward movement). Presently, sand accumulates at the western end, and during strong wind and wave events (or sand builds up to a certain extent), sand bypasses around the marina, or is captured in the strong eastward tidal current just off the shoreline, and deposited elsewhere in the estuary (possibly northeast to the sand lobe off Nelson Head?). Due to the eastward longshore current experienced within this bay, sand can also be lost off Fly Point, where sediment is likewise trapped in the strong tidal current and taken elsewhere in the port (Geomarine, 1987)
• West Point to Sandy Point: Between West and Sandy Points lie two beaches, Dutchmans in the east and Bagnalls to the west, split by Redpatch Point. Both beaches have been found to experience some minor erosion, and the dominant longshore transport for this area is also to the west, with any significant onshore/offshore transport limited to hard points on the shoreline (i.e. artificial coastal structures). For example, the groyne feature at the end of Bagnalls Beach (Sandy Point) obstructs longshore transport, until sand builds to a certain extent that it can bypass the tip of the structure. This sand is most likely then transported intermittently within the net westward longshore drift into the next sub compartment (i.e. Conroy Beach).
• Sandy Point to Anchorage Marina (Corlette Point): The stretch of shoreline between Sandy Point and the Anchorage Marina is known as Conroy Beach, and the coastal processes occurring within this area have been heavily modified since the construction of the Marina (i.e. obstruction
Z:\N21295_Port_Stephens_CMP_Stage2\Docs\Report\R.N21295.002.05_Draft_Report_MASTER.docx
of the dominant westward longshore transport) For example, since the construction of the Marina breakwaters, the western end of the beach has built about 50m into the port, and it will continue to trap sand until the beach progrades sufficiently to allow sand to be lost into the harbour, or bypass the harbour, and lost around Corlette Head (into either Salamander Bay or off the dropover of the Flood Tide Delta head) (Geomarine, 1991; PWD, 2000) While the western end of Conroy has accreted, the eastern end has eroded over the past 20-25 years (Wainwright, 2015)
• Corlette Point to Wanda Wanda Head: The two beaches found in between Corlette Point and Wanda Wanda Head are low energy and are fronted by sand flats. There is no significant bypassing of sand from around Corlette Head and into Salamander Bay (PWD, 2000) At present, there is still very little knowledge of the estuarine physical processes occurring within the bay. PWD (1987) found that the area is very protected/ isolated from the main flood tidal flows, thus it has slow tidal flows. It has also been proposed that a weak largescale reverse current circulation occurs within Salamander Bay (Figure 2-6), keeping sediment within the closed system (PWD, 1987).
Wanda Wanda Head to Soldiers Point: Three low energy beaches reside in this section of shoreline, with sand flats fronting them (some even with seagrass beds), reflecting the low energy nature of the environments found here. The ebb flows can be relatively strong from Soldiers Point to Wanda Wanda Head (generally occurring past the -10m contour), but once they enter the bay, they slow dramatically (PWD, 1987). Sand transport seems to be similar to Salamander Bay, in that it remains within this sub-system, with minimal to no reported losses around Soldiers Point or into the bay (Figure 2-6)
Z:\N21295_Port_Stephens_CMP_Stage2\Docs\Report\R.N21295.002.05_Draft_Report_MASTER.docx
• Tomaree Headland to Fingal Island: Immediately south of Tomaree Head are several east facing, small pocket beaches (north to south); Zenith, Wreck and Box Beaches (Figure 2-2). Zenith has a large foredune behind it, and along with Shoal Bay (within the estuary), they connect Tomaree Headland to the mainland (Short, 2007) Presently, the dunes backing each of these beaches capture sand from the beach, or exchange sand cross-shore during storm events. Storm waves move sand to the nearshore (and form sand bars), then it slowly works its way back to the beach during calmer conditions (Figure 2-7). Due to the protection of Fingal Island, and the embayed rocky nature of these pocket beaches, there seems to be no prominent longshore processes. Some sand might be exchanged between beaches during strong northerly wave events, however cross shore processes dominate There may be offshore sources of sand slowly making its way back onto these beaches, but this has not been confirmed for this location (Goodwin, 2015). The most southern beach in this sub-compartment is Fly Roads, and it forms the northern side of Fingal Spit, and during severe storm events the beach and spit can be breached resulting in Fingal Island becoming separated from the mainland (Short, 2007), and possible sand exchanges between the two compartments
• Fingal Bay: Fingal Bay is the next tertiary compartment, it is a semi-circular bay that forms the southern side of Fingal Split (tombolo). Intermittently, sand is involved in an exchange crossshore during storm events, or can be lost into the large dunes in the northern region of the bay. Longshore transport is negligible, and there has been no reported supply of sand from the inner shelf at this location, as it is quite a closed system (see Figure 2-7).
• Anna Bay: This tertiary compartment is predominantly backed by active transgressive dunes, which were formed from thousands of years ago (Roy, 1996). While these dunes formations are a sign that large amounts of sand have moved into these embayment’s over geologic timescales, it is unlikely that longshore processes deliver much (if any) supplies of sand, because the bay is surrounded by such prominent headlands and rocky shores. It has been suggested that sand bypasses this whole secondary compartment via the high energy shoreface, moving out of Stockton Bight and into either Port Stephens, Yacaaba or beyond (Short, 2020) Like the other tertiary systems within the Anna Bay compartment, cross shore processes dominate. Storm waves initiate the nearshore (sand bar) - shoreline sand exchange, and aeolian wind energy keeps the active transgressing dunes supplied of sand. Despite the losses of sand into the dunes, the system still maintains a positive sediment budget, and this is most probably due to small amounts of sand still being supplied to the system from the inner shelf (Goodwin, 2015) Figure 2-7

The Stockton Bight compartment contains only one beach, Stockton Beach. Stockton is roughly 31.8 km long, and curves in a southerly arc from Birubi Point in the north, to the trained mouth of the Hunter River (Newcastle) in the south (Figure 2-8). This beach is exposed to the high energy southerly swell and winds for most of its length. Wave processes have delivered masses of sand to Stockton from the Hunter River, as well as from longshore and offshore sediment sources, which have over time, have helped build one of the largest and most active coastal dune systems in NSW. Stockton receives all waves from the east through to the south, and its beach sediments are finer in the north (~0.25mm) and become coarser towards the south (~0.4mm; peaking at the location near the Sygna shipwreck) (Roy, 1980; Thom, 1992). The prevailing wave climate maintains a welldeveloped double bar system for most of the beach, three bars can even develop in the north during very high wave events (Short, 2007). The southernmost section of Stockton has only one sand bar off the shoreline, and this is due to the coarser sand, and much lower wave energy found there.
Stockton Bight is subject to large gross fluctuations in longshore sediment transport associated with variations in wave energy and direction (Gordon, 1980) Various modelling over time have predicted a net northward longshore sediment transport rate of approximately 20,000 - 30,000 m3 yr-1 (Umwelt, 2002), and these numbers increased northwards of the seawall (up to 53,000 m3 yr-1). However, depending on the prevailing wave climate, in some years this trend can be reversed (DHI, 2006) It was also found that a nodal (or neutral) point, where sediment transport splits from net north to south (or vice versa), occurs at the northern end of the Mitchell Street seawall (approx. red arrow in Figure 2-8). It is interesting, as this location is also the major eroding spot for southern Stockton (DHI, 2006). The wave climate experienced at Stockton (inc. the influence of the northern breakwall), produces a gradient in wave setup (south of the nodal point) that drives the southern longshore transport. This local current carries sand southward, then seaward, depositing sand just north of the breakwaters (see Figure 2-8). DHI (2006) also calculated that 33,000 m3 yr-1 of sand was bypassing Nobbys Head (i.e. updrift compartment), while Gordon and Roy, as well as WBM (Gordon, 1977; WBM, 1998) found that there was no significant longshore movement of sand into or out of the compartment, so any longshore movement was generally balanced in a north-south direction. This makes sense as there is only a minor rocky reef extending off Birubi Point (~1km from the shoreline, reaching roughly -20 m water depth), so it would only take a storm or high wave event to transport any significant amounts of sand around that headland and beyond
Human activities have also contributed to the sediment budget of the Bight. Dredging commenced within the port in 1859 and has been near continuous since that time Total dredging quantities (up to 1993) has been approximately 125 million m3, which was placed in the offshore spoil ground area south east of Nobbys Head, in around -30 to -40 m water depth (Port of Newcastle, 1993) A large, oblate shaped sand lobe extends off Nobbys Head in a south easterly direction, and whether this is a remnant of past dredging activities has yet to be confirmed, but it has been identified as a possible source for Stockton nourishment (NSW Government, 2020). More recently (i.e. post 1993) maintenance dredge volumes average around 300,000 m3yr-1 but it is highly variable depending on flood occurrence within the Hunter River (WorleyParsons, 2012) This recent dredge material is generally not suitable, nor used for beach nourishment (as its composed mainly of silts and muds).
The Hunter River training walls were constructed in 1846, which lead to the development of Nobbys Beach, as the walls interrupted the sand bypassing the river mouth, and into the Stockton compartment (Short, 2020) Since 2009 there has been on average 25,000 - 30,000 m3 yr-1 of sand dredged from the navigation channel of the Hunter River, predominantly around the breakwater heads, and deposited in about -8 m water depth off Stockton Beach (just offshore from the Mitchell St seawall) (see Figure 2-8) Southern Stockton has experienced erosion and recession since at least 1886 (Moratti, 1997), and the main mechanism for this ongoing sand loss appears to be an imbalance in littoral drift, particularly immediately north of the Mitchell street seawall. Majority of sand is being transported northwards, which much would most likely be lost into the active transgressive dunes found there While some sand may be bypassing Nobbys now, the area around the nodal point (Mitchell street seawall) has kept receding and will eventually threaten assets and infrastructure behind the beach environment (Short, 2020).
In terms of cross-shore processes, Stockton experiences periodic storm exchanges of sand, aeolian losses into the large transgressive dune fields, and possibly sand supply from the shoreface. Similar to the other compartments in this study, Stockton Bight receives semi-frequent storm waves that move sand to the nearshore (and form the double sand bar system present), which then slowly works its way back onto the beach during calmer conditions (Figure 2-8). Storm bites of 390 - 300 m3 m-1 have been estimated for Stockton Bight, however these are for extreme storm events (Gordon, 1977; Goodwin, 2015) There are also minor cross shore sand exchanges between the estuary inlet and the nearshore. For example, Horseshoe Beach accretion suggests some minor transport into the port (~3,500 m3 yr-1) (DHI, 2006)
Offshore supplies of sand may also be entering the Stockton compartment. It was found for Stockton Bight that is has a modern (1820 - 2010) net sand supply rate of 2.1 m3m-1yr-1 (Goodwin, 2015) Factoring in the alongshore supplies coming around Nobbys Head, and those being lost downdrift, approximately 66,780 m3 yr-1 of sand is potentially supplied to this compartment from the upper shoreface.
The extensive mobile and transgressive dunes found along Stockton Bight also pose as a major sediment sink (Figure 2-8). Sand is continuing to move from the beach and into the dunes, owing to the degraded foredunes found along the length of the bight. Gordon and Roy (Gordon, 1977) estimated approximately 300,000 m3 yr-1 of sand is lost into the transgressive dunes, with Roy and Crawford (1979) concluding that owing to the deficiency in the sediment budget from this large amount of sand lost, the beach recedes between 1 and 2 m yr-1 (Roy, 1979; Short, 2020)
It should be noted that the sediment transport conceptual model for Stockton Bight (and sediment transport rates presented) are based solely on a literature review of previous studies (in 2020). A more detailed Stockton Bight Sediment Study has recently been completed for the City of Newcastle by Bluecoast (2020). Bluecoast (2020) should be used for a more contemporary, detailed and up to date understanding of the coastal processes and sediment transport patterns occurring within this secondary compartment. It should also be stated that all these figures around sediment volumes have large error margins associated with them, and are just average figures to help describe and understand the sediment transport processes occurring here. A more detailed description and explanation of sediment transport for the Stockton compartment can be found in Appendix A

The projected extents of coastal erosion have been calculated using a probabilistic model developed by BMT. This model considers the key sediment transport processes (storm demand, net sediment movements and sea level rise impacts) and combines them for future years to estimate a future erosion hazard area.
In line with the recommendations of the NSW Coastal Management Manual, the modelling has been conducted in a probabilistic way. This means rather than needing to select a single set of values for model inputs, the probabilistic approach allows for the application of a distribution of inputs. These distributions represent the likely ‘range’ of values that are appropriate, factoring in natural variability (e.g. in the case of storm events) and future uncertainty (e.g. future sea level rise).
Probabilistic modelling of erosion provides an additional benefit for coastal managers in incorporating the sporadic and uncertain nature of coastal processes, and to assess the sensitivity of different areas of the coastline to these.
The distributions of input values and the method of incorporation are expanded on in the preceding section and Appendix D (D.2). In short, suitable ranges of the erosion volume associated with each of the key processes (listed below) have been randomly sampled over 1,000,000 iterations to produce a range of possible total erosion volumes. These volumes have then been converted to an associated setback by analysing the geometry of the beach/dune system in the 2018 Marine LiDAR. Finally, the erosion setbacks were ‘clipped’ where they intersected areas of likely bedrock to produce the final erosion extent.
The result of the probabilistic model is a range of potential erosion extents (1,000,000 different hazard extents). From this range, key ‘exceedances’ can be extracted that relate a hazard extent with its probability of occurring. The differences between these extents demonstrates the future uncertainty of erosion hazard. Areas that show large differences between exceedances are shown to be highly sensitive to the set of conditions (sea level rise, storm intensity, etc.) that may occur in the future. Further description of the model processes, formulations and inputs can be found below, and in Appendix D
For this study, the set of input parameters and distributions was developed based on the literature review underpinning the development of conceptual models of the study area (see Section 2) and refined in a modelling expert workshop (see Appendix C).
The key input variables for the erosion hazard modelling include:
• Storm demand (or “Fluctuating Erosion” – Appendix D.2.2)
• Net sediment supply / deficit (or “Cumulative Erosion” – Appendix D.2.3)
• Sea level rise (SLR) and the recession in response to that rise (or “SLR Recession and Accommodation Space” – Appendix D.2.1)
• Geological influences on erosion (see Appendix D.2.4)
The input parameters selected for use in the erosion hazard assessment for the Port Stephens coastline are briefly described in the following section, and more thoroughly described in Appendices D and F

The modelling approach requires that every input parameter be described as a probability distribution that captures the variability and uncertainty of the parameter. The distribution types (Figure 3-1) represent the collective understanding about a parameter’s likely range of values, with an appropriate degree of complexity. Naturally variable but well understood inputs are represented by ‘complex’ statistical distributions (such as normal distributions or gaussian curves) based on a detailed research. Less well understood parameters use simplistic distributions (such as the triangular distribution) that are suitable for representing an approximate range of probable values (upper and lower bounds), centred around a ‘best guess’ modal value. The bounds of these simplistic distributions are designed to capture a range of observed or potential values with an appropriate level of conservativism.
As per the requirements and recommendations of Council, and the Coastal Management Manual (OEH, 2018), the probabilistic modelling and hazard mapping has been conducted for the following timeframes:
• Present day (2020)
• 2040
• 2070
• 2120
Coastal sediment transport processes are in a constant state of flux. Figure 3-2 shows an idealised schematic representation of the different coastal zones involved with erosion processes, and within the modelling conducted within this report. Several driving forces serve to move sediments between beaches, between the lower beachface and the dune, and between the lower beachface and the shoreface (Figure 3-2). A sustained long-term imbalance in these processes can drive either an accretion or erosion effect on the beach. The model implemented by BMT considers the key sediment transport processes driving coastal erosion and shoreline recession, those primarily being storm demand, net sediment movements (longer-term) and sea level rise impacts

The most recognised form of beach erosion on sandy beaches is that due to storm activity. ‘Storm erosion is where large storm events cause sediment from the beach and dunes to be scoured out and pulled offshore into a sand bar. Usually this lost sand will recover in the weeks and months following the event as calmer conditions rework the sediments back onto the beach. ‘Storm demand’ is the volume of sand that is ‘lost’ from the beach, causing the shoreline to retreat, and often creating a near-vertical ‘scarp’ effect on the foredune.
Storm demand is usually considered a temporary process, but may trigger or exacerbate other more permanent processes. Regardless, a suitable ‘buffer’ of land needs to be established to account for intermittent storm erosion events, or a series of sequential events, without losing the whole dune before the beach recovery process can take effect.
The storm demand (or fluctuating erosion component) volumes used in the current modelling follows a similar method to that of Kinsela and others (et al., 2017), and this is further detailed in Appendix D.2.2).
Where beaches are gaining sediment faster (/ slower) than they are losing it, there will be a net sediment supply (/ deficit). The reason for this can be a short-term interruption in the ‘normal’ sediment transport processes (such as a new rock groyne blocking sediment from leaving a beach).
Quite often though, the causes of net sediment effects are long-term in nature and difficult to study. Many of these relate to changes in wind, wave and sea level conditions that may be cyclical over decades to millennia.
The open coast of Port Stephens is generally ‘metastable’, meaning that while it fluctuates in response to storm events and seasonal patterns, there is no sustained erosion or accretion processes that has been identified (see Appendix D.2.3 for further details about net sediment supply / deficit processes)
Sea Level Rise recession is where increasing sea levels results in a small amount of sediment from erosion events (e.g. storms) not being available for the ‘recovery’ process. The result is a steady retreat of the shoreline until the ‘shoreface’ (the underwater area of the nearshore beach) (Figure 3-2) rises proportionally to the sea levels. The response of the shoreface to sea level rise for the Port Stephens study area has been modelled using the Bruun Rule (Bruun, 1962) This rule uses several key inputs including ‘calibrated’ shoreface profiles, depth of closure (which is the natural limit for sand exchange between the beach and shoreface (see Figure 3-2)), and finally a SLR component.
This study has adopted updated SLR numbers, based on the recent SROCC report by the IPCC, and the RCP 8.5 scenario for all modelled coastal hazards. Further detail about the adopted RCP scenario (RCP8.5) and projected localised SLR curves are shown in Section 2.4.1. For shoreline recession modelling, the Sea Level Rise component is represented as a normally distributed input of values from the SROCC report summarised in Table 3-1
The methodology for calculating these parameters, and adopted input values / distributions for these model components are presented in more detail in Appendix D (D.2.1 – SLR Recession and Accommodation Space Parameterisation).
A key driver of uncertainty in erosion hazard analysis is the underlying geological influences This study has incorporated a treatment, which has applied a limit to the erosion hazard extent where known bedrock deposits are present. This likely bedrock extent has been developed based expert judgement drawing on quaternary geological information (Roy, 1980), the Marine LiDAR from 2018 (DPIE, 2018) and recent aerial imagery taken from Nearmap (see Appendix D.2.4 for more information)
A hazard assessment needs to factor all of these processes in, allowing for a large storm erosion event on top of the sustained shoreline recession that occurs at a future date. A more detailed description of the erosion hazard processes at Port Stephens can be found in Appendix D
As per agreement with Council, and considering the requirement of a set of outputs that convey the variability and magnitude of potential erosion recession hazards, several hazard exceedances have been presented:
• Almost Certain: Corresponding to a setback distance that has a high likelihood of being reached or exceeded (95% of 1 million simulations predicted shoreline setback greater or equal to this distance).
• Likely: Corresponding to a setback distance that is the most likely to be reached (50% of 1 million simulations predicted shoreline setback greater or equal to this distance).
• Unlikely: Corresponding to conditions that are only exceeded with combinations of high sea-level rise and extreme storm erosion (only 10% of 1 million simulations predicted shoreline setback greater or equal to this distance).
• Extreme: An upper bound setback extent (only 1% of 1 million simulations predicted shoreline setback greater or equal to this distance).
These exceedances can be interpreted as a probability of being exceeded. E.g. when examining the ‘Extreme’ exceedance hazard extent, there is less than a 1% chance that this will be exceeded over the timeframe of the projection. Such conditions provide Council with an improved decision-making tool where different ‘risk appetites’ can be adopted for different applications as required.
It should be noted however, that this probabilistic interpretation depends on the input distributions that have been applied and should be updated if further research or data becomes available on appropriate ranges of these.
Example probabilistic modelling outputs for a central location at One Mile Beach are provided in Figure 3-4. The histograms illustrate the density of modelling results and the relative contribution of the storm and sea level rise erosion components to the total coastal recession for each planning horizon. As expected, the contribution of sea level rise to the total coastal erosion increases with time.
Example exceedance probability curves for central One Mile Beach are also shown in Figure 3-4. These outputs (and the equivalent outputs for other locations) provide the basis for erosion hazard
mapping, such as that shown in Figure 3-3 for the coastline between One Mile and Tomaree (2120 erosion hazard extent). The full set of probabilistic modelling outputs and erosion hazard maps can be found in Appendix D and Appendix J


This section will expand on the findings presented in the conceptual model for the Port Stephens estuary, but will focus on the processes influencing each beach/section of the shoreline within the Outer Port (OP) (east of Soldiers Point). These areas will be delineated at suitable ‘sub-compartment’ breakpoints and will be assigned a qualitative erosion hazard profile (low, medium, high) based on consideration of likelihood of erosion, the timeline of the vulnerability, and consequent of erosion, as follows.
The likelihood of erosion will be assessed based on the following:
• Likely sources/sinks of sediment as detailed in the conceptual model (see Section 2.6);
• Key structural influences (headlands, groynes, breakwaters);
• Profile and development on the ‘dune’ and capacity to adapt to erosion;
• Wave/Currents exposure at different areas; and
• Potential changes to all of the above under future sea-level conditions.
Using the above criteria, BMT have developed three assessment categories to first estimate exposure to erosion for the outer port of Port Stephens. These include: Geomorphic classification, event exposure and net sediment transport. Table 4-1 outlines each of these key categories, along with each possible rating that make up each category. These ratings are based on available data from DPIE LiDAR, aerial imagery, literature review, and previous studies.
Table 4-1 Exposure to erosion key categories: Geomorphic classification, Exposure to coastal events, and Net sediment transport
* Based on modelling conducted in (WMAWater, 2010).
As shown in Table 4-1, the Geomorphic Classification deals with the natural landforms of the outer port. These can include large healthy foredunes, that have both a newly forming and more established dune present, fronted by a wide beach, to a narrow beach that could be fronted by a sand flat, or fronted by nothing at all. This rating is what split the out port into the smaller ‘areas of interest (AOI)’, so a more detailed investigation into erosion could occur. Figure 4-1 illustrates an example of how we have categorised Shoal Bay into these smaller AOI.
The exposure to coastal event rating was based on WMA Water wave modelling, which projected both locally generated wind waves and ocean swell waves impacting each AOI within the outer port of Port Stephens. Table 4-1 outlines 3 ratings: sheltered, semi-exposed and exposed, each separated with a range of wave conditions, which we compiled from WMA, and categorised based on the potential for those types of waves to mobilise and move sediment (i.e., exposed areas having a greater potential for sediment movement and storm impacts, than the sheltered areas). Figure 4-1 also illustrates how we have applied this exposure component for the Shoal Bay area.
The net sediment transport category extends the work done in Section 2, particularly the conceptual models of sediment transport within the port. Figure 4-2 illustrates how we have used the conceptual model, and applied it to form the net longshore transport component for the Shoal Bay area.
Using the combined results of all the above categories, the timeline of the vulnerability will then be considered, i.e. whether it is vulnerable to current erosion events, ongoing steady erosion, or will be vulnerable to these under future sea-level conditions. Figure 4-3 illustrates the erosion exposure rating for the Shoal Bay area, and how this was used to calculate the final erosion risk rating.


The calculated erosion exposure was then compared with the underlying land-use, assessing public and private land considerations, as well as access, safety, and potential heritage / ecological considerations (endangered habitat, etc.). Table 4-2 outlines the key adaptive capacity categories considered for this part of the study. Categories include, available space for shoreline recession, so there is time before management actions are required, to areas having no buffer and management actions are required imminently (see Table 4-2).
Adaptive capacity category Definition
Rocky Coast Low risk – slow landwards transgression (especially compared to sandy coastlines)
Space 40 m or more of available space / land for shoreline recession (i.e. backed by public land)
Some <40 m of public land available for shoreline recession, or minor infrastructure that can be relocated (e.g., car park, park area)
Key / Private No buffer, private land or key infrastructure directly behind the beach/ shoreline (i.e. no space for recession)
Once the adaptive capacity of the backing coastal areas was determined for each AOI within the outer port, the final step was to compare both the resultant erosion exposure and adaptive captivity using a risk matrix, which is displayed in Figure 4-3. The x-axis contains the projected exposure to erosion, and the y-axis captures the consequence or adaptive capacity of the backing land behind each studied section of coastline. This then determined the final erosion risk rating for each of the AOIs within the outer port. Figure 4-3 (panel c) displays how the risk matric was applied to the Shoal Bay area, highlighting areas at risk of immediate erosion, to areas that have allow risk and have time before erosion becomes an immediate risk. These consequence assessments will be flagged, mapped, and documented (see Section 4.2) relative to the vulnerability so that Council can prioritise management efforts.
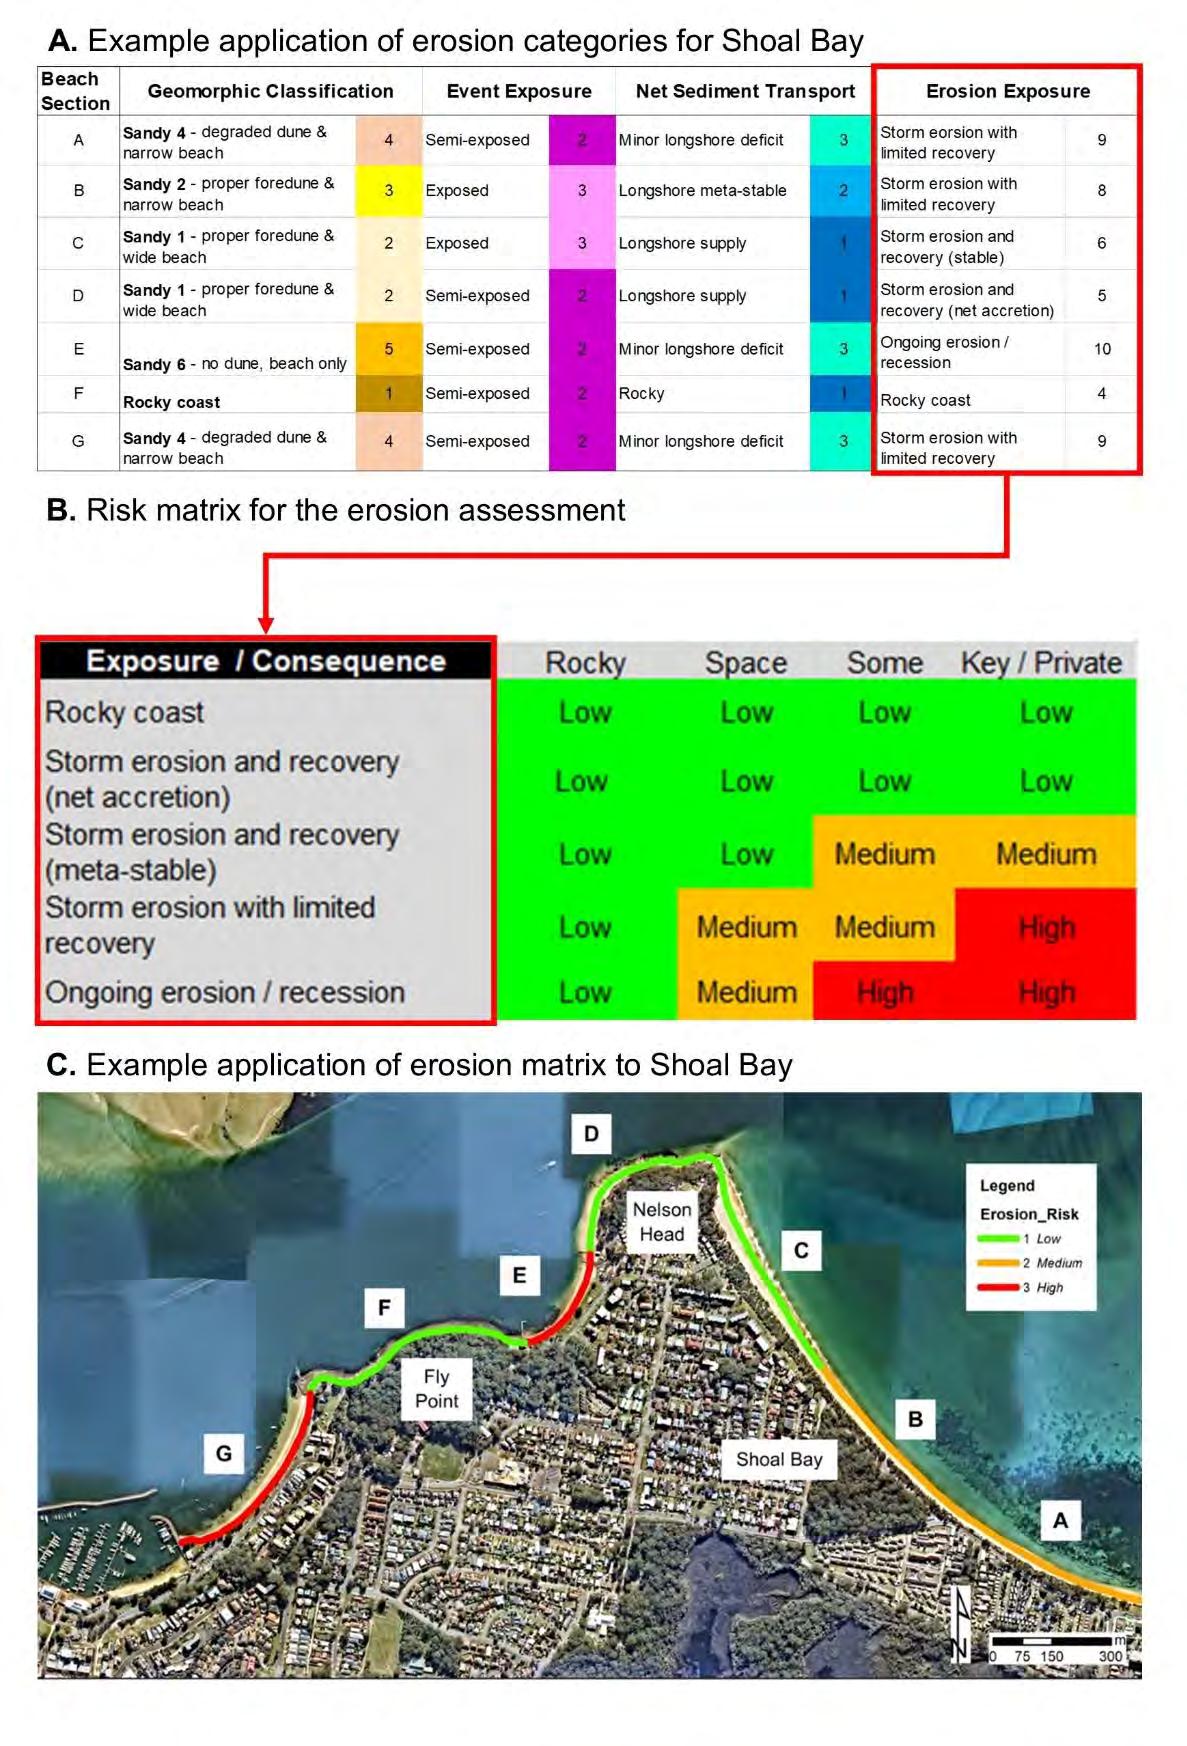
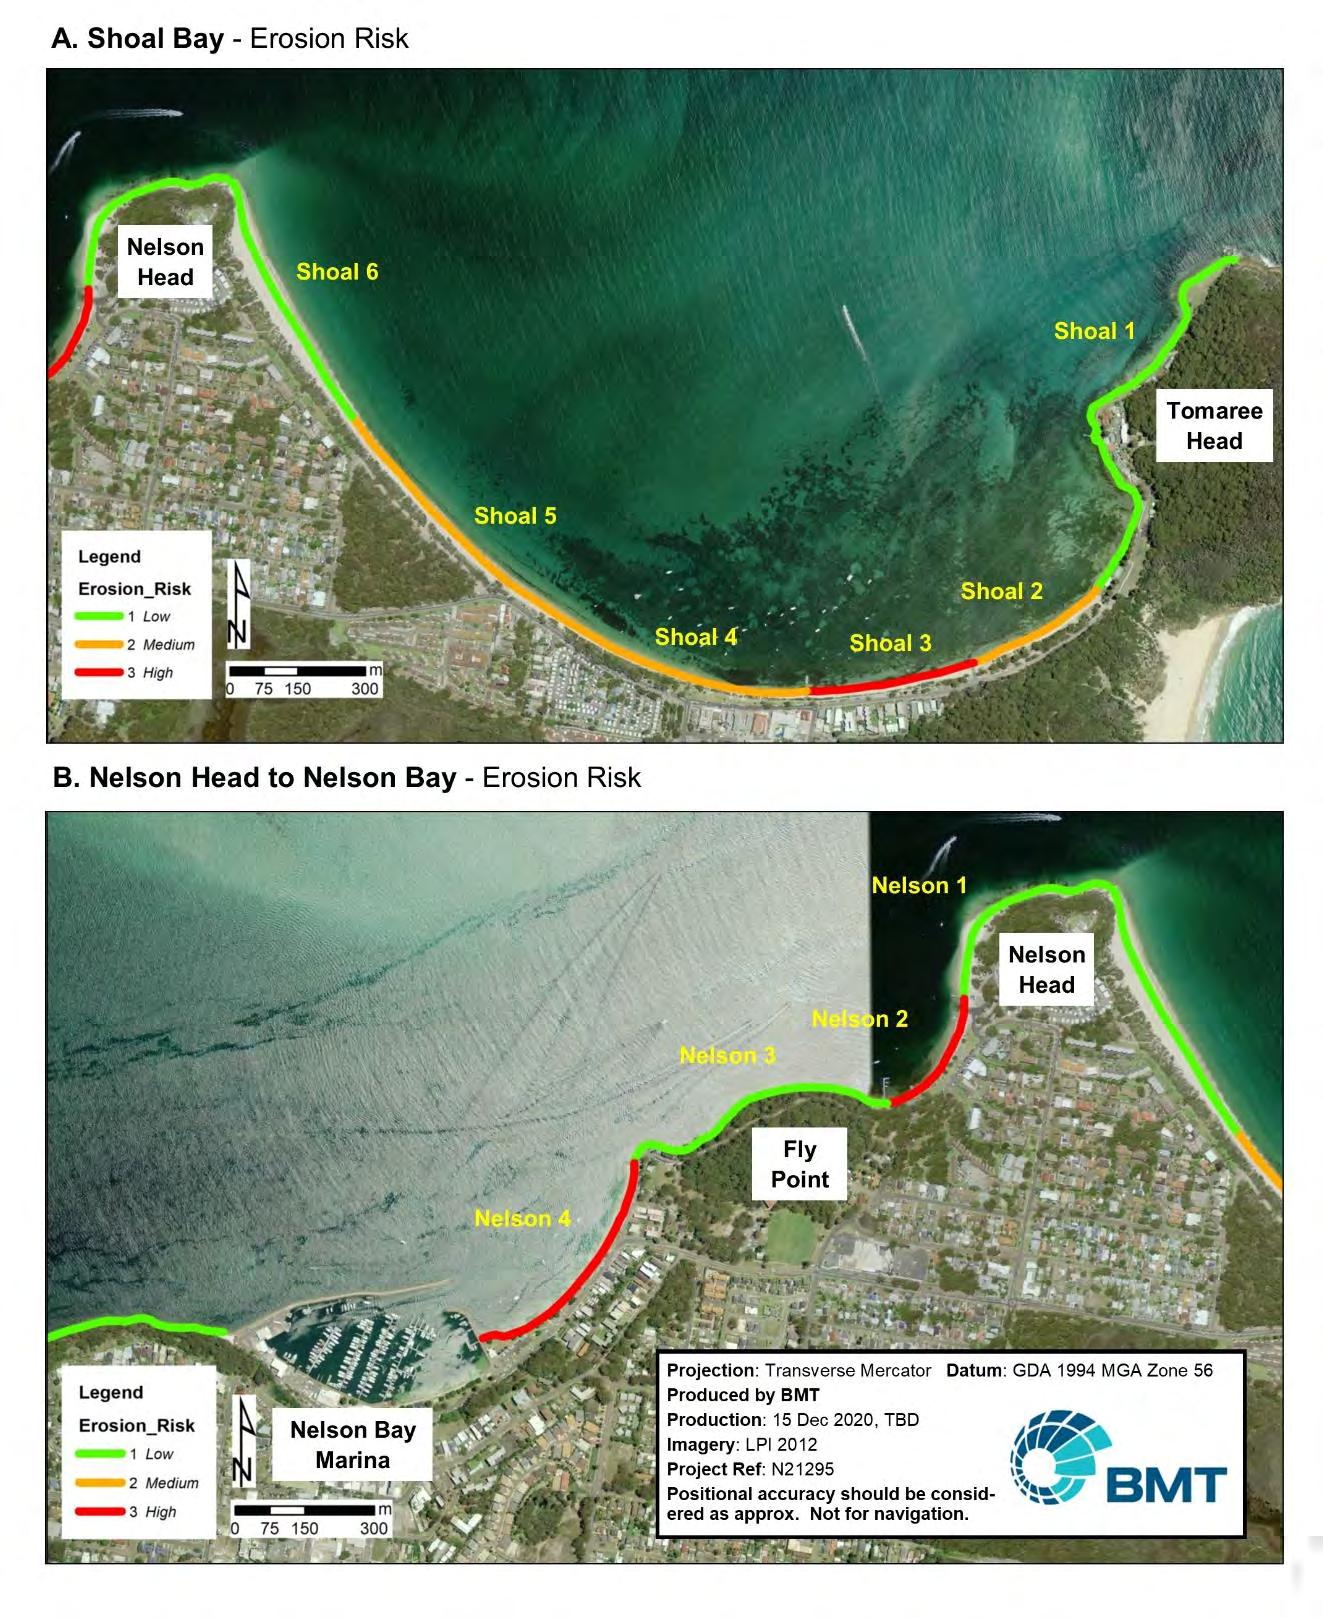
Shoal Bay extends for 2.5 km from Tomaree Headland to Nelson Head. It is the most easterly and more energetic of the beaches found in the southern half of Port Stephens (Figure 2-1, 2-5). Shoal Bay was split into six smaller AOI or sediment cells, based on clear geomorphological variations along the coastline. These AOI ranged from rocky coast in the east, to degraded, fragmented dunes with narrow beaches fronting them in the central area, to a wide beach and healthy foredune system in the west. Exposure to coastal events also transitioned from being sheltered in the east, to being semi-exposed in the centre, and exposed in the west (see Table 4-3). Table 4-3 outlines the results of the erosion risk assessment for Port Stephens, as well as the sub-ratings that make up that risk.
Shoal Bay has a long history of shoreline change (both erosion and accretion), which has been documented (Watson, 1997), and those studies indicate that Shoal Bay has a net westward longshore sediment transport. This longshore transport creates a deficit of sand in the central areas, but an abundance in the far west near Nelson Head (see Table 4-3 and Figure 4-4).
Combining all these ratings the exposure to erosion ranged from rocky coast in the east, storm erosion with limited recovery or ongoing erosion in the centre, to net accretion of sand in the west. Generally, the adaptive capacity for backing coastal land in Shoal Bay was adequate, meaning there was enough space for landward recession to occur (into Public land), except for the very central areas (e.g., Shoal 2, 3, 4, Figure 4-4) which had little to no room. Figure 4-4 (panel A) illustrates the final erosion risk rating for each of the AOI, and as is shown, the very east and west sections have a low risk to erosion, whereas the central areas have medium to high risk, so would require further monitoring, and an appropriate trigger system set up for future management actions. This could be done as part of subsequent stages of this CMP
Little Nelson stretches 200 m from the 30 m high Nelson Head to Fly Point in the west Nelson Bay curves gently to the northeast from the eastern side of the marina wall 550 m to the low rocky Fly Point. This section of the outer port was split into four AOI, all of which were quite diverse geomorphic sites. In the east, Nelson 1 had a healthy dune and wide beach, little beach then lost the dune and was beach only, a rocky coast separated Little and Nelson Beach, which was classed as a degraded dune system with a narrow beach (Table 4-3) Both beaches are reflective, and all 4 of the AOI are semi-exposed to coastal events. There seems to be strong currents present here, moving sands longshore (predominantly westward) to the marina’s east wall. There is a semi-frequent delivery of sand in the very east of this section of the port, it then becomes minor longshore deficit for Little and Nelson Beaches (Table 4-3)
Combining all these ratings, the exposure to erosion ranged from sand accretion in the east, storm erosion with limited recovery or ongoing erosion at Nelsons and Little Beach respectively, to rocky coast in the centre. Generally, the adaptive capacity for backing coastal land in this area was adequate, as there was some space to buffer shoreline recession. Figure 4-4 (panel B) illustrates the final erosion risk rating for each of the AOI, and as is shown, the eastern and central sections have a low risk to erosion, whereas both beaches here have a high risk, which would therefore
require further monitoring, and a trigger system set up for future management actions (can be set up as part of subsequent stages of the CMP)
Z:\N21295_Port_Stephens_CMP_Stage2\Docs\Report\R.N21295.002.05_Draft_Report_MASTER.docx
\N21295_Port_Stephens_CMP_Stage2\Docs\Report\R.N21295.002.05_Draft_Report_MASTER.docx
Dutchmans Beach is located between West and Redpatch Points, and is a 400 m long north facing, low energy, reflective, pocket of sand. Sandy Point is now backed by 500 m of private property, all of which have seawalls on and over the beach. As a result, Bagnalls Beach now commences at the eastern end of these walls and trends east for 1.3 km to Redpatch Point. Both beaches have been found to experience some minor erosion in the past (PWD, 2000) This section of Port Stephens has been split into six geomorphic AOI, and they range from rocky coastlines (at West and Redpatch Points), narrow beaches with healthy foredunes behind (most of Bagnalls Beach), or narrow beaches with degraded, fragmented dunes (Dutchmans Beach), to beaches only (with no dunes). Most of this area is sheltered from coastal wave events, except for Bagn 6 which is semi-exposed. Longshore currents are also present, which generally cause a minor deficit in sediment for the beaches within this area (Table 4-3).
Combining all these ratings, the exposure to erosion ranged from storm erosion with limited recovery or recovery (stable) in the east, to rocky coast in the centre, to again storm erosion (stable), storm erosion with limited recovery moving westward, or finally ongoing erosion at Sandy Point The adaptive capacity for backing coastal land in this area was diverse, in the east, rock or space for landward recession was adequate, while private properties back the beach closer to Sandy Point.
Figure 4-5 (panel A) illustrates the final erosion risk rating for each of the AOI, and as is shown the eastern and central sections have a low risk to erosion (or moderate at Dutchmans Beach), whereas western Bagnalls and Sandy Point have a high risk, which would also require further monitoring, and a trigger system set up for future management actions (can be set up as part of subsequent stages of the CMP).
Conroy Beach is found on the eastern side of the Anchorage Marina, it trends east-northeast for 650 m to Sandy Point, and the coastal processes occurring within this area have been heavily modified since the construction of the Marina (see Section 2.6.1). This section of Port Stephens has been split into only two geomorphic AOI, and they include two very different settings; a beach only (with no dunes), and a wide beach and healthy dune system (see Figure 4-5). Both these AOI are semi-exposed to coastal wave events, and have a strong westward longshore current, which causes a deficit in the east and an abundance of sand in the west (against the marina) (Table 4-3).
Combining all these ratings, the exposure to erosion ranged from on going erosion, to storm erosion, recovery, and net accretion. The adaptive capacity for backing coastal land in this area was also just as diverse, in the east (i.e., at Sandy Point), private properties back the beach, and in the west sufficient space is present to buffer some coastal recession. Figure 4-5 (panel B) illustrates the final erosion risk rating for these two AOI, and as seen the western AOI has a low risk to erosion, whereas the western side of Sandy Point (i.e., the eastern section of this region) has a high risk and will require further monitoring, and a trigger system set up for future management actions (see Table 4-3)

Salamander Bay lies on the western side of Corlette Point. The semi-circular bay faces to the north and contains two low energy beaches (fronted by sand flats), separated by a central section of mangroves. This section of Port Stephens has been split into five geomorphic AOI, which range from rocky coasts (Corlette Point and Wanda Wanda Head), mangroves to beaches fronted by either wide/ narrow sand flats and are backed by either narrow dunes (no dunes at all), or just private properties. All these AOI are sheltered to coastal wave events, except Corlette Point (Salam 1), which is semi-exposed. This is a very low energy part of Port Stephens, that has a cyclic sediment cycle, so any longshore losses are generally recovered over time (i.e., stable systems) (Table 4-3).
Combining all these ratings, the exposure to erosion ranged from storm erosion and recovery (stable), to rocky coast at the headlands. The adaptive capacity for backing coastal land in this area was either private properties, rocky coast or key land that protects mangrove forests. Figure 4-5 (panel C) illustrates the final erosion risk rating for this area, and as seen, most of Salamander Bay has a medium risk to erosion, with the two headlands having a low risk. This means no imminent monitoring is required, but longer-term planning/ monitoring/ management should be considered for the medium risk areas (see Table 4-3).
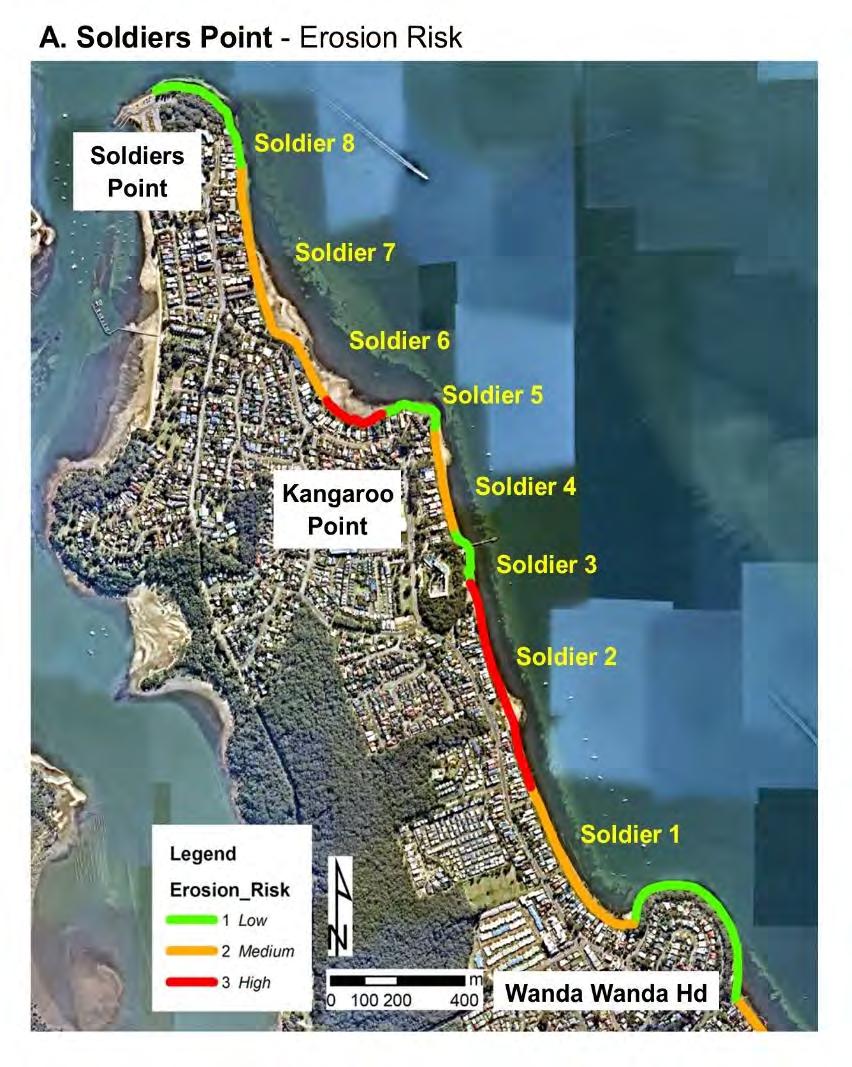
Wanda Beach commences on the northern side of the 40 m high Wanda Wanda Head, and trends due north-northwest for 1.6 km to Kangaroo Point. From Kangaroo Point another sandy shoreline stretches to Soldiers Point. This section of Port Stephens has been split into eight geomorphic AOI, which range from rocky coasts (Kangaroo and Soldiers Points), to beaches (only, no dunes) fronted by either wide or narrow sand flats. All these AOI are sheltered to coastal wave events, except the northern half of Wanda Beach (Soldier 2), which is semi-exposed to events (as it aligns to the port opening) Like Salamander Bay, there seems to be a cyclic movement of sand in this area, any longshore losses are generally recovered over time (i.e., stable systems) (Table 4-3).
Combining all these ratings, the exposure to erosion ranged from rocky coasts, storm erosion / recovery (stable), to storm erosion, and limited recovery (Soldier 2). The adaptive capacity for backing coastal land in this area was either private properties, or rocky coast Figure 4-6 illustrates the final erosion risk rating for these AOI, and as seen the rocky areas have a low risk to erosion
Most of the sandy stretches have a medium risk to erosion, except the northern half of Wanda Beach (Soldier 2), and a small section just north of Kangaroo Point (exposed peat/ coffee rock present, which is an indicative sign of sand deficit) which both have a high risk and will require further monitoring, and a trigger system set up for future management actions (which can be set up within subsequent stages of this CMP)(see Table 4-3, and Figure 4-6).
Like the erosion hazard modelling (Section 3.1), the inundation modelling has been assessed probabilistically. The components of storm-tide and sea level rise are both defined by statistical distributions of the most likely results. Most of the time, the average values of these distributions are reported as the most likely, with a 5-95% range often reported as the ‘error bounds’, or ‘confidence interval’.
For this study, the full distributions were statistically combined (integral convolution) and then any additional wave effects were added as required. The result was the following different levels:
• A 50% exceedance level, representing the most likely (highest probability) inundation level, with higher and lower levels being progressively less likely.
• A 5% exceedance level representing an upper-bound confidence interval, with only a 5% chance of inundation higher than this.
• A 95% exceedance level, representing a lower-bound confidence interval, with a 95% chance that inundation will be great than this.
Each of these different inundation extents were calculated and mapped for a Tidal Inundation HAT condition, as well as two Coastal Inundation conditions: a 20-year ARI; and a 100-year ARI.
For this study, the set of input parameters and distributions were developed based on a modelling expert workshop.
The key input variables for the tidal inundation hazard modelling include:
• Highest Astronomic Tide (HAT) (constant value, calculated using Fort Denison tide gauge record)
• Probabilistic future Sea level rise (RCP 8.5 values from SROC).
The key input variables for the coastal inundation (open coast) hazard modelling includes:
• Probabilistic Storm Tides and Tide Anomalies (or Open Coast Extreme Sea Levels)
• Waves (constant value, Wave Setup / Runup)
• Probabilistic future Sea level rise (RCP 8.5 values from SROC).
The key input variables for the coastal inundation (estuary) hazard modelling includes:
• Extreme water levels (combining tide, storm surge and catchment effects) and wave impacts (esp. wave run up) (WMAwater 2010 flood design levels)
• Probabilistic future Sea level rise (RCP 8.5 values from SROC).
As per the recommendations of the Coastal Management Manual (OEH, 2018), the probabilistic modelling and hazard mapping for inundation has also been conducted for the following timeframes:
• Present day (2020)
• 2040
• 2070
• 2120.
5.2.1
Coastal inundation occurs as a result of a combination of different processes, both permanent and temporary. In Port Stephens, the key processes driving the inundation hazard for the study areas are the tides, storm surge (which combined with tides is referred to as ‘storm tide’), wave setup and runup effects and sea level rise (SLR). Within the Port Stephens estuary, there is also a component of inundation that is caused by the interaction of catchment flood waters (runoff from inland rivers and the catchment) with storm surge, which may exceed the storm-surge-only effects on the open coast. This is shown in Figure 5-1, with storm surge potentially exceeding the highest tide, and wave setup/runup exceeding that.
On the open coast, the ‘still water level’ components of inundation (the storm tide and sea level rise) are considered to be uniform. Within the estuary, the sea level rise effects are uniform, but the effective storm tide levels vary throughout the estuary due to the influence of the catchment flows. Throughout all the study area, the wave heights are highly localised, and the beach slopes vary, leading to large differences in the wave setup/runup effects. This ranges from minor to no wave effects in the estuary backwaters, to large wave effects on exposed beaches on the open coast.

Extreme water levels on the open coast are made up of both the astronomic tide, and the additional surge caused by wind and pressure variations during storm events. These have been assessed by conducting an extreme value analysis (EVA) based on the historical record of extreme water levels at the long-term Fort Denison tide gauge. A detailed description of the driving forces of storm tide levels and the EVA process has been provided in Appendix F
The key outputs from this EVA are as follows:
• The 20-year extreme water level. This represents conditions that are likely to be experienced by most residents at some stage. There is a ~5% chance of these conditions being exceeded in any given year, and they occur on average once every 20-years.
• The 100-year extreme water level. This represents conditions that occur on rare timescales (on average these are exceeded only once per century) but are commonly used for planning purposes. There is a 1% chance of these conditions being exceeded in any given year.
The EVA carries with it a level of uncertainty that increases for rarer events (due to fewer such events on record). It is common for EVA results to be reported as a line of best fit through the observable record. For this study, a probabilistic approach was adopted that analysed a normal distribution of results around this mean to include the uncertainty bounds of these values.
Wave setup and runup effects have been derived based on the method of Stockdon et al. (Stockdon, et al., 2006). Extreme wave conditions were taken from the Crowdy Head waverider buoy, which have been transferred to the study area by use of a spectral wave model developed for this study. Details of the wave modelling can be found in Appendix G, and further details of the wave setup/runup calculations approach can be found in Appendix F
Within the Port Stephens estuary, the storm tide interacts and is partially correlated with catchment flow events, which serve to increase water levels at different locations. The exposure to wave effects is also different to the open coast, with many areas being sensitive to locally generated wind waves, and any exposure to ocean swell being heavily refracted and altered through the estuary entrance. As such, values of both the still water level extremes (combining tide, storm surge and catchment effects) as well as wave runup levels (including wave effects with the still water levels) have been taken from the existing flood design levels (WMAWater, 2010). Further details on the extraction and application of this data can be found in Appendix F
Sea level rise will increase the overall risk of coastal inundation. The increase in ‘base’ water level under a future climate scenario will increase the frequency at which certain elevations will be impacted by inundation from the coast. For example, some areas that are only inundated by the largest storms under present-day conditions will have the potential to be inundated by normal surf conditions by 2100 or beyond The probabilistic SLR component has been based on the latest
projections of sea level rise from the IPCC SROCC report, using the conservative RCP8.5 scenario (IPCC, 2019). Details of this selection and the sensitivity have been provided in Appendix F
Tides occur as a response to astronomic gravitational forces (largely the effects of the sun and the moon). In Port Stephens, the tides vary in a semi-diurnal pattern (two high, and two low tides per 24hours) and a moderate spring/neap variation (larger tides during full and new moons). Other longerterm variations also occur that mean certain high tides are larger than others.
The Highest Astronomical Tide (HAT) represents the highest water level that can be achieved due to tidal forces only (in the absence of any storm conditions). For this study it has been used as the benchmark for tidal inundation levels. The HAT was derived by analysing the tidal water level gauge data from Fort Denison, because it is one of the longest tide gauge records in the country. The analysis involves removing any non-astronomical effects, and Table 5-1 (below) outlines the results of this tidal analysis. It should be noted that these figures may be conservative at the extreme ends of creeks feeding into the Port Stephens estuary. While water levels will not reach this level on every high tide (such tidal levels are relatively rare), it can occur in the absence of any storm event/s. As such, anything within the HAT inundation extent can be considered ‘intertidal’ and effectively will be periodically inundated.
Further information on the methodology for analysing Astronomic Tide for the Port Stephens study area is presented in Appendix F (F.3 – Astronomic Tide).
Sea level rise will increase the overall risk of tidal inundation. The increase in ‘base’ water level under a future climate scenario will increase the frequency at which certain elevations will be impacted by inundation from the coast. For example, some areas that are only inundated by the HAT under present-day conditions will have the potential to be inundated by normal high tides by 2100 or beyond. Assessment of risk due to sea level rise has been based on the latest projections of sea level rise by the IPCC (and SROCC) (see Section 2.4.1). The tidal inundation probabilistic assessment adopts the sea level rise distributions presented in Section 3.2.3 (Table 3 1).
The extreme water levels (for Coastal Inundation mapping) and astronomic tide levels (for Tidal Inundation mapping) have been combined with projected sea level rise conditions probabilistically for each of the future planning years (2020, 2040, 2070 and 2120). This allows for the uncertainty of both datasets to be included in the future design levels. For the purpose of presenting appropriate probabilistic conditions, an ‘expected inundation extent’ based on the mean of each future inundation level distribution has been extracted along with an ‘Upper Confidence Interval’ (Upper CI) and ‘Lower Confidence Interval’ (Lower CI) based on the 95% and 5% values from the distribution respectively. These ranges can be used to show the uncertainty in the inundation extent at each location. The Lower CI represents an extent that future conditions are unlikely to be less than, whereas the Upper CI represents the extent that is unlikely to be exceeded. Over nearer timeframes, these extents are very similar, showing relatively limited uncertainty when compared with projections further into the future
The 20-year and 100-year design levels have a corresponding set of wave runup conditions that may increase the inundation extent nearshore. No wave runup is required for the HAT design levels as they have been treated as a ‘tide only’ condition.
A detailed description of the combination of inundation inputs has been provided in Appendix F
The total set of conditions for 2120 are shown in Table 5-2 for the reporting points shown in Figure 5-2
Z:\N21295_Port_Stephens_CMP_Stage2\Docs\Report\R.N21295.002.05_Draft_Report_MASTER.docx

The assessment of coastal inundation hazard has adopted the 100-year ARI and 20-year ARI for assessment. The 20-year ARI represents conditions that have a 5% probability of being met or exceeded within a given year. Similarly, the 100-year conditions have a 1% chance of occurring each year.
The 100-year conditions are typically used for planning and design purposes and are likely to be close to the highest recorded conditions in Australia. The 20-year conditions represent extreme events that are likely to have been experienced by most residents of an area at some stage.
Combined still water level and wave runup inundation conditions were mapped for this study using a GIS wave runup tool. This tool requires a simple definition of a ‘wave runup zone’ within which the wave runup levels are applied to define the peak inundation depth. For this study, the wave runup zone was defined as being within a 100m buffer of the shoreline. The influence of wave setup and runup processes beyond this zone (such as areas set back inland from the shoreline and up small creeks) is assumed to be minimal and therefore only the still water levels are applied there. This adopted approach produces a minor discontinuity at the 100m landward buffer location where there is a transition from the higher water level that includes wave influences to the lower water level that considers storm tide only.
The adopted mapping methodology within the GIS tool takes the analysed wave runup and still water level output at point locations along the coast (as shown in Appendix F) and extrapolates them overland based on a suitable DEM. The DEM has been developed based on LiDAR topographic survey data of the onshore areas at 1 m resolution for the Port Stephens and Newcastle regions. This data was collected by NSW Land and Property Information in 2012 (for Port Stephens and parts of Newcastle) and 2013 (for parts of Newcastle).
Smoothing and processing of this dataset is undertaken in GIS to fill small ‘holes’ in the inundation layers. The expected inundation extent, as well as the upper and lower confidence extents have all been included in the mapping.
An example map for the 2120 100-year ARI Coastal Inundation hazard is shown in Figure 5-3 for Anna Bay to Soldiers Point. A complete set of inundation hazard maps can be found in Appendix H (Coastal inundation extent), and Appendix I (Coastal Inundation peak flood depth)

The assessment of tidal inundation hazard has adopted the HAT as the defining inundation condition. HAT represents the highest water level that can be achieved by astronomic tidal forces alone. These conditions are likely to be exceeded by storm-tide conditions at least yearly, but are a good representation of areas that can be considered ‘inter-tidal’.
The adopted mapping methodology extrapolated the HAT conditions for different years (i.e. including Sea Level Rise) landward based on a suitable Digital Elevation Model (DEM) The DEM has been developed using the same method as the coastal inundation, which is based on topographic LiDAR survey data of the onshore areas at 1 m resolution for the Port Stephens and Newcastle regions. Smoothing and processing of the resulting inundation datasets was undertaken in GIS to fill small ‘holes’ in the inundation layers. The expected inundation extent (50th percentile), as well as the upper (95th percentile) and lower (5th percentile) confidence extents have been included in the mapping.
An example map for the 2120 HAT Tidal Inundation hazard (inc. peak flood depth) is shown in Figure 5-4 for Soldiers Point. A complete set of inundation hazard maps can be found in Appendix H (Tidal inundation extent) and Appendix I (Tidal Inundation peak flood depth)
Tidal inundation levels (HAT with Sea Level Rise added) are presented for the Port Stephens study region in Table 5-2
Title:
LowerCI(95%Likelihood)
ExpectedInundation(50%Likelihood)
UpperCI(5%Likelihood)
BMTendeavourstoensurethattheinformationprovidedinthis mapiscorrectatthetimeofpublication.BMTdoesnotwarrant, guaranteeormakerepresentationsregardingthecurrencyand accuracyofinformationcontainedinthismap.

Filepath:I:\N21295.i.ajs_Port_Stephens_CMP_Stage2\QGIS\Project\PeakWaterDepths_SoldiersPt.qgz


While Stockton Bight hosts one of the largest actively mobile dune systems in the southern hemisphere, the inland sand drift / transgression rates of those dunes have been identified as a coastal hazard/ risk for the study site in the recent Port Stephens CMP Stage 1 scoping study (Port Stephens Council, 2019). Long term rates of dune movement occurring there have been reported in excess of 5 metres per year at Fern Bay (BMT, 2019), which is only the southern area of Stockton BMT have been engaged to quantify rates of dune movement and determine sand drift hazard setback lines for future timeframes for the rest of Stockton Beach (esp. northwards)
BMT have chosen to use the vegetation line proxy shoreline indicator to assess dune transgression at Stockton Bight, due to data limitations and availability. This entails a series of vegetation line positions being digitised from a selection of georeferenced and orthorectified aerial photography of Stockton Bight. Aerial photos from 1984 to 2020 and sourced from either Google Earth (GE), NSW Spatial Services or Nearmap (see Table 6-1) were used Earlier and more frequent imagery was available (to a degree), but due to funding limitations and resources available and the adequacy of existing/ acquired data, the selected images listed in Table 6-1 were utilised.
A detailed description of the sand drift/ transgression approach, methodology and inputs can be found in (Appendix E).
In essence, the vegetation line for this project was defined as the interface between the most landward side of the transgressive dunes and stable/ tertiary vegetation (see inset in Figure 6-1) This interface was digitised (or drawn in a GIS) for each aerial image The Bight was split into four areas of interest (AOI), which are also illustrated in Figure 6-1, and they are based on the shoreline orientation, human impacts, major dune morphological features, dune activity/ transgression, and study area boundaries. The areas of interest include: The Far north (pink); North (red); Middle (orange) and South (yellow) (Figure 6-1). Transgression was measured in a northerly direction, as well as the general direction of the transgression (generally northeast) (see Figure 6-1 inset)
To create our hazard maps, the calculated rates for each AOI were used, along with GIS tools (in ArcMAP) and the 2020 vegetation line, to project future dune transgression regions. For example, the 2040 transgression hazard areas for the North AOI used a 20, 60, and 100 m buffer on the 2020 vegetation line, to represent the lower (yellow), average (orange) and upper (red) transgression rates for that area. Figures 6-2 to 6-5 illustrates this output and summarise the hazard maps for Stockton Bight dune transgression.
Figure 6-1 Areas of Interest used to split the analysis of dune transgression along Stockton Bight, using 2012 aerial image. Inset map shows location of vegetation lines through time (colours), as well as the different directions the dune transgression was measured (Imagery Source: LPI 2012).
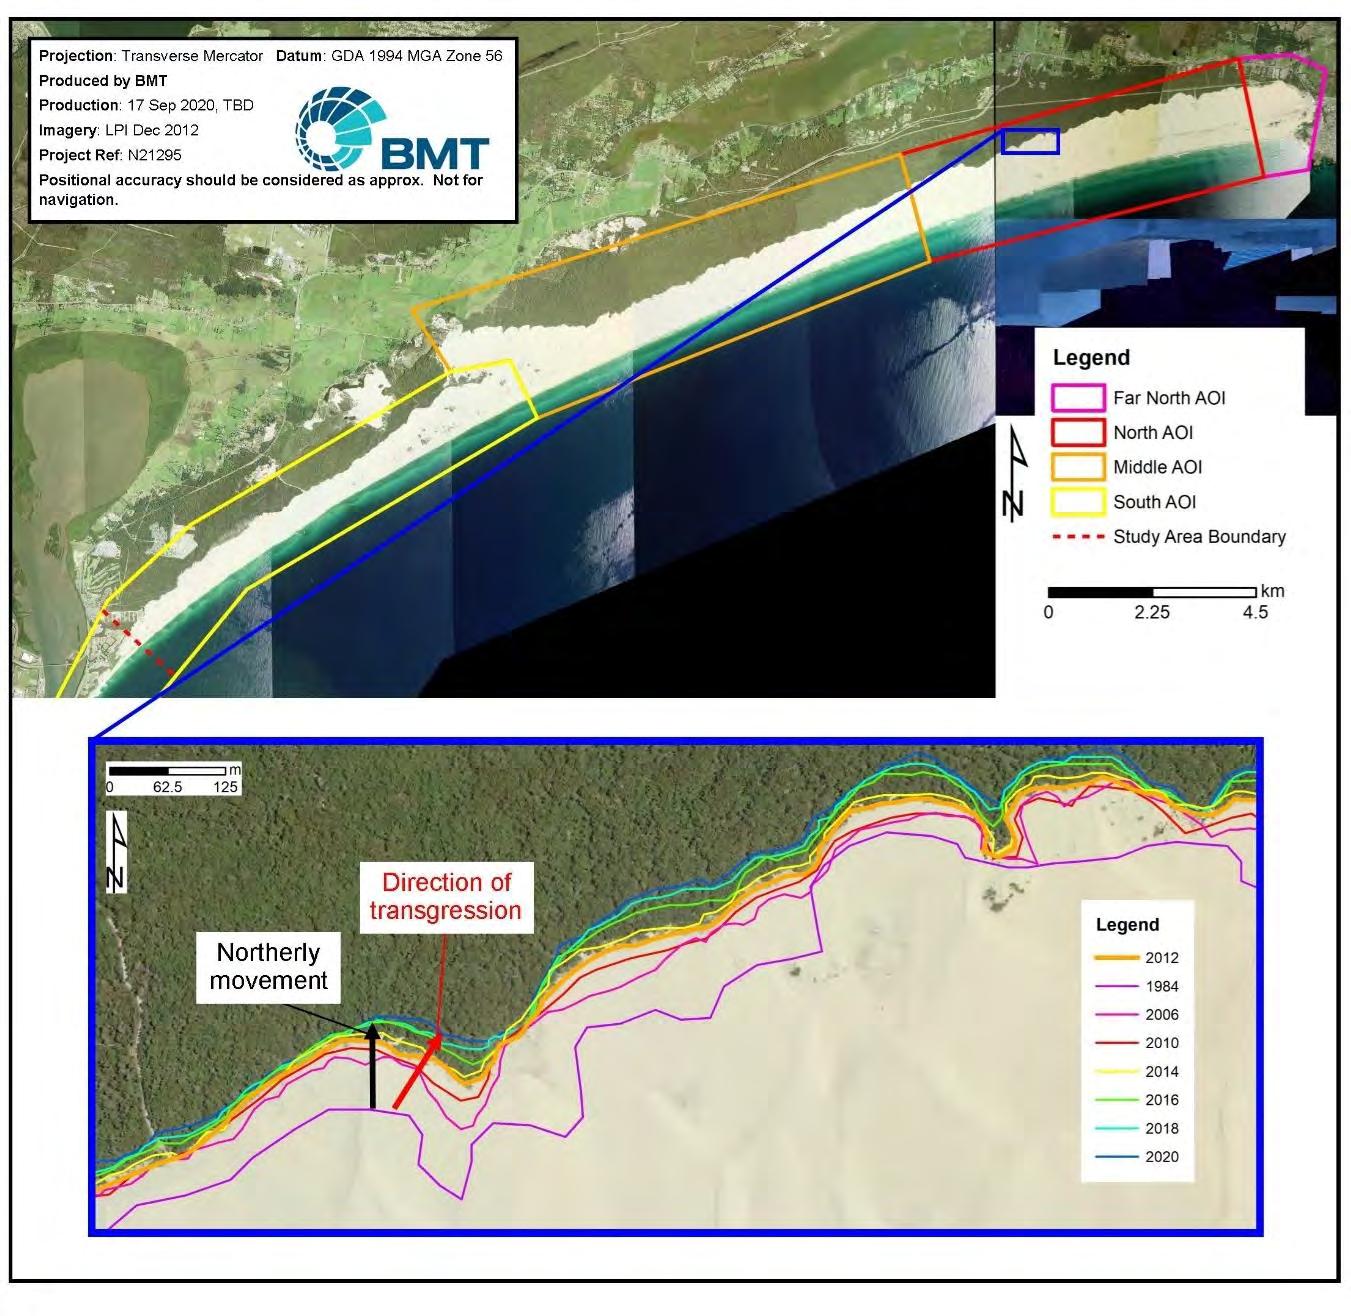
The wind analysis was derived from a 63 year (1956 – 2020) wind record (speed and direction) from the Auotmatic Wind Station (AWS) at Nobbys signal station (Newcastle), and collected by the Bureau of Meteorology (BOM). Figure 6-6 shows the location of this station, and was chosen in accordance with the World Meteorological Organization guidelines. The wind data, measured in meters per second (m. s-1) was analysed to obtain sand roses for the Stockton study site, so aeolian sediment drift potentials and direction could be compared (using the (Fryberger, 1979) methodology).
Sand roses were made for only two kinds of approach winds: onshore winds and onshore plus alongshore (or oblique) winds (i.e. offshore winds were not included in DP and RDP calculations), as they are the key types impacting dune morphology, development, and inland drift (DelgadoFernandez, 2011; Davidson-Arnott, 2018). Thus, for Stockton Beach, with an average orientation of 156o (or south-southeast) the onshore winds were those that approached the study site at 112.5o and 202.5o, and the alongshore winds were those approaching between 67.5o and 112.5o, and 202.5o and 247.5o to the shoreline. The rest of the methodology for the wind analysis follows the same steps taken by Miot da Silva and Hesp (Miot da Silva, 2010)
A detailed description of wind analysis methodology and inputs can also be found in (Appendix E).
As discussed above, aerial photography covering the period 1984 to 2020 were independently examined to understand the range, direction, and rates of dune transgression experienced within the Stockton Bight study area (see Figure 1-2). Stockton is an exposed, and high energy system that has extensive mobile dunes that have previously been found to be transgressing inland at rates of up to 7 m yr-1 inland, as well as 3 m yr-1 northwards (Gordon, 1977; Short, 2020)
The vegetation line was used to estimate dune transgression, and it was most dynamic within the North and Middle AOIs (as seen in Table 6-2) Table 6-2 presents the results of the aerial photography analysis, and the resultant transgression rates (for the northern, and dominant transgression directions respectively) observed at Stockton Bight Current rates were then projected to future timeframes (as stipulated and agreed upon by Council), which included 2040, 2070 and 2120. Please note that cells in Table 6-2 are organized to show the mean transgression rate in the top center, and the lower and upper bounds in brackets underneath. As evident in Table 6-2, dune transgression rates ranged from up to 5 m yr-1 in the north AOI, 2.5 - 4.5 m yr-1 in the middle AOI, 1 - 3 m yr-1 in the south, to 0.9 m yr-1 or no movement within the far north AOI. The no movement result in the far north AOI is most likely due to large amounts of human intervention and management that has occurred there, because of the close proximity of those dunes to infrastructure and settlement. It should also be noted that the rates found for the south AOI are consistent with a previous dune transgression work conducted in that region (BMT, 2019)
Hazard mapping used average rates between the transgression direction and northerly directions to estimate the potential impacts of the dune movement into the future (Table 6-2) As is evident in Table E-1 (Appendix E), the difference between the two directions was not substantial in any case. Key infrastructure, structures or human settlements that could be potentially impacted by dune transgression includes:
• Easement Trail (Far north and North AOI)
• Power lines (along Easement Trail; Far north and North AOI)
• Eastern Fort Wallace and the Defence Housing Australia (DHA) Rifle Range area
• Aboriginal artefacts as important culture heritage/assets (whole study area) – this is an unknown risk from 2020 (onwards, so all other timeframes) and further information is required in Stage 3 (or subsequent CMP) with collaboration from Worimi Local Aboriginal Land Council and Worimi Conservation Lands Board of Management as to locations of important cultural sites and aboriginal artefacts within the Stockton Bight.
2040
• Easement Trail (Far north and North AOI)
• Power lines (along Easement Trail; Far north and North AOI)
• Horse Trail, Quad Bike Trail, Sand Hill E and W Trials (North AOI)
• Boyces Trial, Oakfield Track (Middle AOI)
• Coxs Lane, Track behind Boral Quarries, Fern Bay Access Trail / Track and Aspin Trial (South AOI)
• Eastern area of the Defence Housing Australia (DHA) Fort Wallace and Rifle Range (DA proposals).
including current, 2040, 2070 and 2120 at Stockton Bight
• Far North AOI is same as 2040 – but more areas of the Easement Trial, and the south-eastern structure of the SS & LM Johnston Earthmoving site could be potentially impacted in this timeframe
• North AOI has similar projected impacts as the 2040 timeframe, with the addition of North and Cemetery Trials being potentially impacted, as well as the southern area/ garden/ crops of residential block (next to Baylife Church)
• The Middle AOI has similar projected impacts as the 2040 timeframe
• The Southern AOI also has similar projected impacts as the 2040 timeframe 2120
• Note and as stated above, the projections for this timeframe have many more uncertainties associated with the calculations, so may not provide reliable projections for council to use and thus have not been included in the final mapping products
• Far North AOI includes all projected impacts form the 2040 and 2070 timeframes – as well as most areas of the Easement Trial, large areas of the SS & LM Johnston Earthmoving site (esp. southern areas) and several residential lots at the southern reaches of the Anna Bay township (esp. south end of Jacaranda Street, and when you take into account the upper limit of the transgression rates).
• North AOI includes all projected impacts from the 2040 and 2070 timeframes – and when the upper limit of the transgression is taken into consideration, large areas of the Bayside Church, and eastward residential lot could potentially be impacted Southern areas of the Caltex petrol station and Anna Bay Cemetery could also be impacted, as well as much larger areas of the Easement Trial and accompanied power lines.
• Middle AOI includes all projected impacts from the 2040 and 2070 timeframes – and when the upper limit of the transgression is taken into consideration southern areas of a residential farm could be impacted during this timeframe (see location in Figure 6-4).
• South AOI includes all projected impacts from the 2040 and 2070 timeframes – and when the upper limit of the transgression is taken into consideration small sections the Seaside Fern Bay house development (esp. south-eastern area), and large sections of the DHA Fort Wallace and Rifle Range area could also be impacted by the mobile sands.
• Council have an interest in any possible dune transgression occurring in a section of bare sand, just behind the southern AOI (featured in Figure 6-6). Based on a high-level inspection of aerial imagery from 2010 to 2020, it seems that the bare area is quite stable, and the landward dune face has been stabilised by vegetation or obstructed by a dune lagoon. Figure 6-6 shows the changes in the bare sand area between 2010 and 2020 as well as the establishment of vegetation in the north-western area (see blue arrow in Fig. 6-6).
Note. Complete mapping output for the dune transgression hazard has been presented in Appendix E. The full set of vegetation lines, and hazard mapping layers have been provided to council.
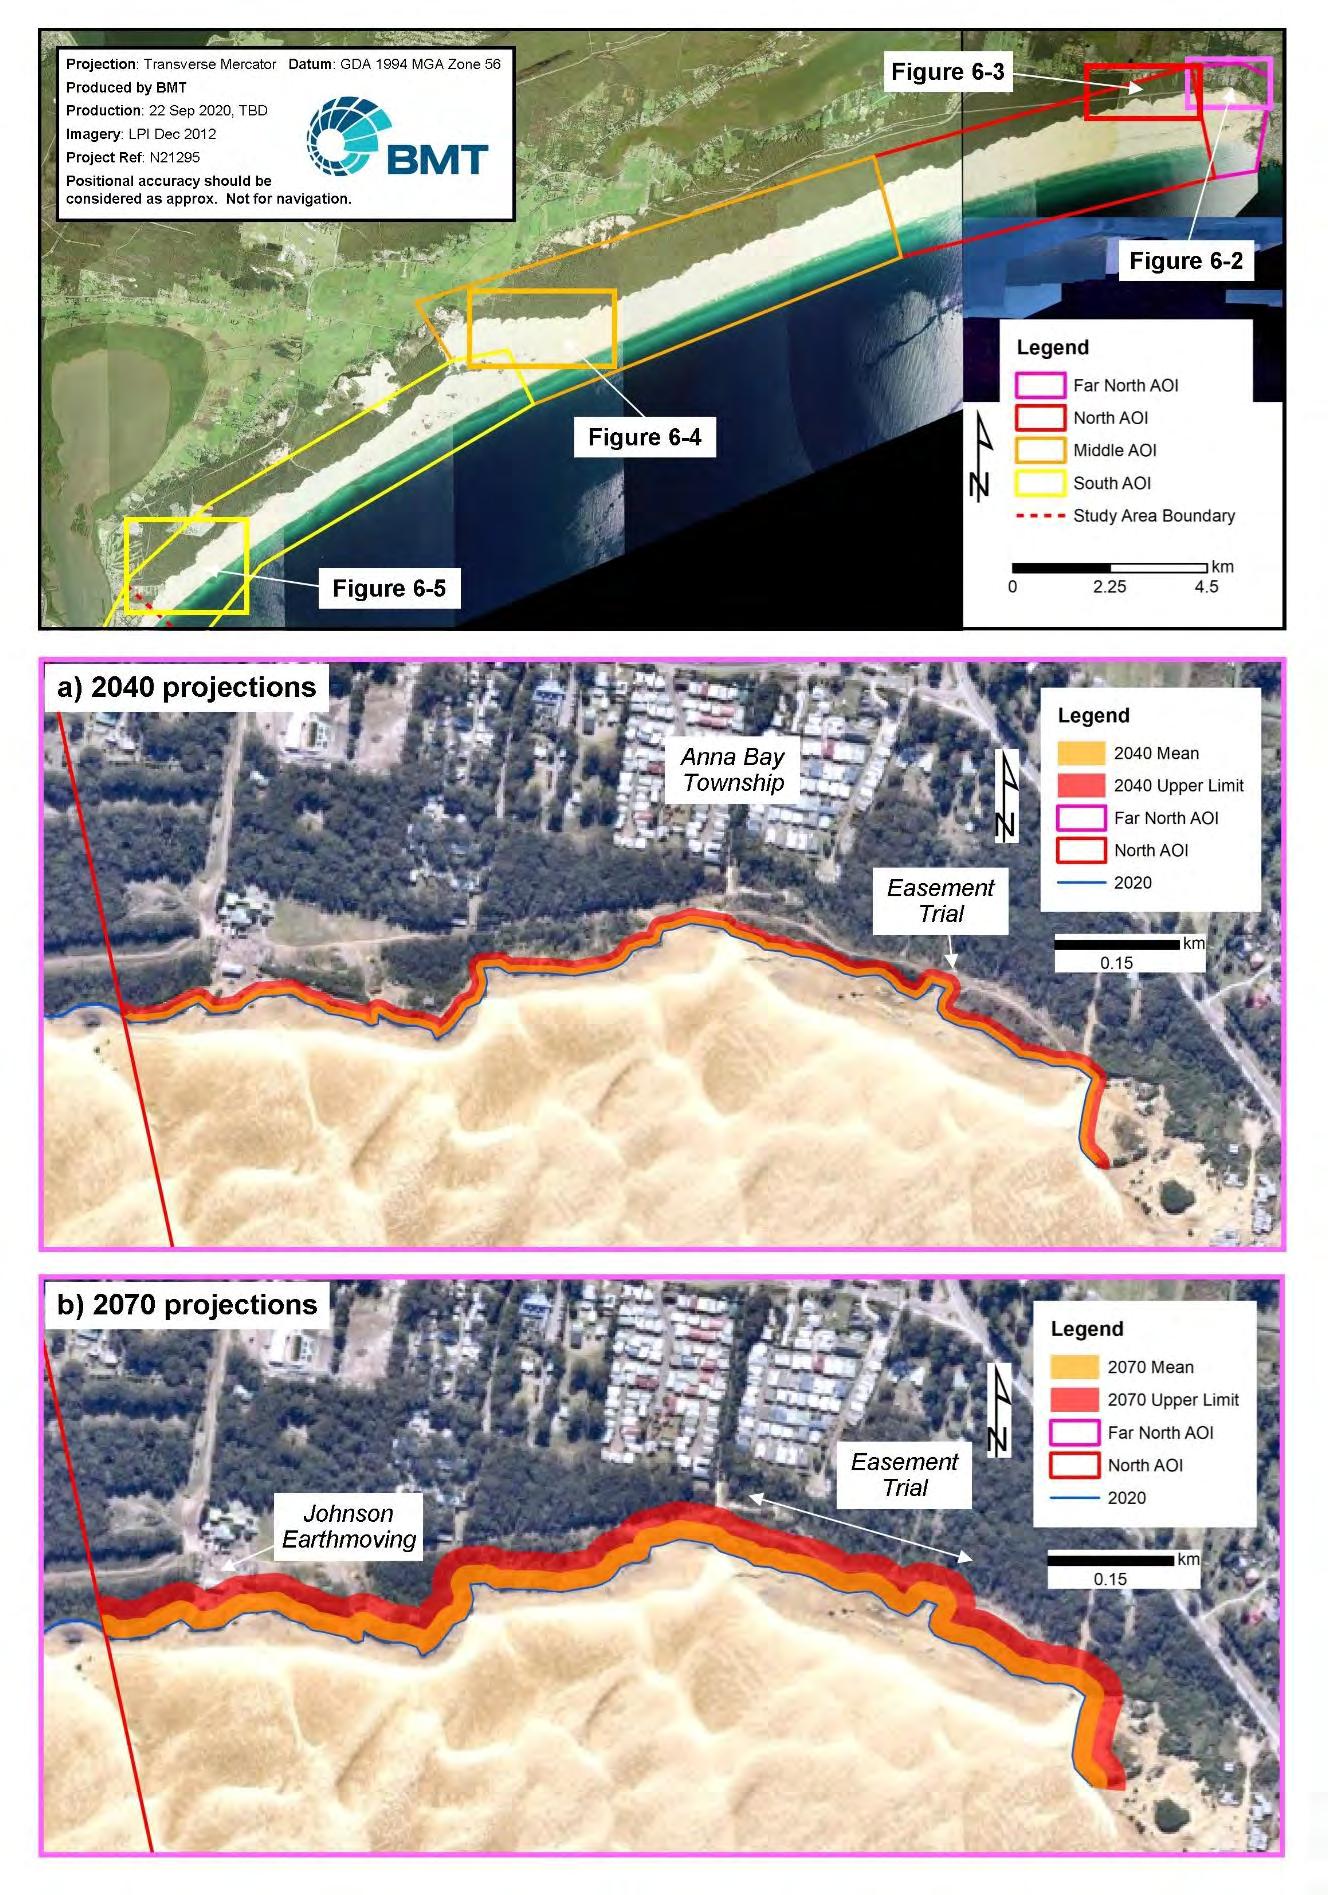

Z:\N21295_Port_Stephens_CMP_Stage2\Docs\Report\R.N21295.002.05_Draft_Report_MASTER.docx


Variation in grain size along Stockton Bight was found to strongly influence the magnitude of the calculated resultant drift potential (RDP). The areas in the north of the bight have finer sand grain size and a much greater potential for sand transport into the dunes than the southern areas (i.e. around Fern Bay), which have been found to have a much coarser grain size. Figure 6-7 shows the resultant sand roses for each key section of Stockton Bight The roses in Figure 6-7 represent RDP, (Resultant Drift Direction) RDD and Drift Potentials (DPs) results; onshore wind RDP and RDD are indicated by the dashed arrow, alongshore plus onshore winds are indicated by the continuous solid arrows. Arrows indicate the direction and potential (i.e. the RDP and RDD) sand may move to, while grey bars indicate the drift potentials from the nine key wind directions for the site (onshore and alongshore). While the arrows represent the dominant direction for sand movement, the sand roses show the other major wind directions also potentially influencing sediment transport.
Table 6-3 summaries the threshold velocity required for sand transport, RDP and RDD (for both onshore and onshore plus alongshore winds) for key section of Stockton Figure 6-7 and Table 6-3 both clearly illustrate that the greatest potential for sediment transport is in the northern areas of Stockton Bight, which makes sense as this is where the more extensive dunes are found and most transgression landwards occurred during this study (see Table 6-2). The most likely direction the sand is transported varies from almost north to north-northwest, which also is consistent with the finding of the vegetation analysis and the general movement of the mobile dunes. These RDP figures of 125 – 119 Vector units are quite high but are consistent with other calculations done around this region that also have mobile dune systems (e.g. Fingal Bay and Bennetts Beach, see (Doyle, et al., 2019))
Table 6-3 Potential for, and direction of sediment transport for Stockton Bight (north, middle and south).
Note. Table includes specific areas of interest (AOI), average grain size (mm) for the upper beach, and the calculated RDP and RDD for onshore (OW) as well as onshore plus alongshore winds (OAW).

Note
Z:\N21295_Port_Stephens_CMP_Stage2\Docs\Report\R.N21295.002.05_Draft_Report_MASTER.docx
Globally, local decision makers found within the coastal zone are confronted with uncertainties about future climate, sea level rise and associated impacts. It is therefore important to recognise that when predicting / modelling the future impacts of climate change, future projections are deeply uncertain and thus cannot be predicted with great certainty. Uncertainty about future climate projections come from several key sources, the first (which has the greatest unknown) is the future emissions of greenhouse gases and aerosols (AdaptNSW, 2020). This variable is impossible to quantify mathematically, so as described in Section 2.4.1, the IPCC have presented a series of emission pathways/ projections, known as Representative Concentration Pathways (RCPs). BMT have used the “global greenhouse gas emissions continue to rise” scenario, RCP8.5 to study the impact of a changing climate for Port Stephens. This is to ensure that management options and plans that come out of the CMP are apt to deal with severe impacts, but by taking an adaptive approach / strategy (through the NSW CMP process) they can also be scaled to a lower RCP, in response to a measured reduction in global greenhouse gas emissions. The IPCC is currently in its sixth assessment cycle with the final Synthesis Report due for release in 2022. At this time, future climate projections adopted for the CMP projects should be reviewed and considered in the context of the future climate coastal hazard and risk assessment outcomes. The second and third sources of uncertainty relate to the response of physical systems (i.e. coastal environment) to the increase in greenhouse gases and aerosols. Specifically, the second source is how large-scale systems (e.g. the whole ocean) will response to climate change, whereas the third source relates to local system responses (e.g. NSW coastal system), given the large scale changes (AdaptNSW, 2020).
The key climate impacts this study have investigated include sea level rise (SLR), storm events / impacts and changes to wave climate (and associated geomorphologic processes, i.e. sediment transport, storm bite etc.). Due to the many uncertainties involved in producing future coastal projections of these impacts, BMT have conducted the modelling in a probabilistic way, so rather than using a single set of deterministically selected inputs for modelled processes, the probabilistic methodology uses assumed ranges of inputs with associated probabilities. The result is a range of potential future conditions that can be quantified as having a certain probability of occurring (based on the underlying science and known assumptions).
The model that BMT have created and used is limited by the small amount of knowledge known for each process. Where possible, any likely error in the historical observations of different processes (for example, storm demand, or net sediment budget) has been accounted for with conservativism in the input distributions. However, there is a high degree of uncertainty as to whether these processes and distributions are valid for future climate scenarios. Chiefly, it is possible that climate change could alter the natural regional scale processes and/or the intensity and frequency of storms, both of which the model is highly sensitive to.
A key driver of uncertainty in erosion hazard analysis (and storm impacts) is the underlying geological influences. The study area is a complex mix of erodible sands, alluvial deposits, as well as high-level bedrock substrate and exposed rock cliffs. The methodology of the probabilistic erosion hazard model assumes that all topography is readily erodible and generally represents erodible sands. As such, a treatment has been applied to limit the erosion hazard extent where known bedrock deposits will limit the erosion hazard. To do this, a ‘likely bedrock’ extent has been developed and used to clip the extent of the erosion hazard so as to not extent into this area, please see Appendix D.2.4 for further details.
This analysis mainly relates to Stockton Dune transgression study (Section 6), and incorporates the available aerial / satellite imagery information, and LiDAR data used to conduct that study for the Port Stephens LGA portion of Stockton Bight. This carries several limitations and considerations as follows:
• Aliasing issues (distortion / mis identification issues), which can miss a lot of smaller temporal or spatial processes. This was less of an issue for this study, as aerial images were used to study larger scale processes like dune transgression (especially considering imagery accuracy ranged from 0.5 – 2.39 m)
• The number of data points / temporal frequency of imagery available for the study area, due funding and available data there was only a 36-year dataset, and therefore can have less certainty about the long-term variability of the dune transgression.
• Data points recorded after significant wind event/s may incorporate fluctuating transgression components that skew the analysis
• Historical data is not necessarily representative of sediment budget changes under long-term conditions due to long-period (multi-decadal) variations in sediment transport behaviour and due to climate change related effects.
• Digitiser / operator error (in the order of 0.25mm) when defining and mapping the vegetation lines. This can be subjective and result in a slightly different line depending on who mapping it.
• Please see Moore (2000) for more detailed information on uncertainty involved in shoreline mapping techniques.
There are also inherent uncertainties and limitations in the applied ‘multi-line’ 1-dimensional modelling approach used to address recession / decrease in accommodation space due to sea level rise (see Appendix D.2.1). It is not guaranteed that the shoreface will accrete at the same rate as the mean sea level, and overall changes to the sediment transport regimes and the natural beach slope may therefore occur. It is also unclear that there is a critical depth beyond which no sediment exchange (negative and positive) can occur (the so called ‘depth of closure’). However, it is likely that excepting for the other limitations detailed in this section, these assumptions are likely to be the best available tools and the assumption of an equal increase in the shoreface relative to sea level will result in a conservative estimation of the associated setback of the beach.
The Bruun rule was the underlying equation used to model long-term recession, and despite being questioned within the scientific literature (i.e. Ranasinghe et al., 2007), it is still considered an acceptable approach to use within the coastal industry.
The depth of closure (extent of which sand is mobilised by wave processes) is a key input to the Bruun rule. Within the modelling done by BMT, the depth of closure used for each coastal section was given a maximum where analysis of the cross-shore profiles demonstrates existing natural controls on the sediment exchange. These appear as convex features in the shoreface profile and often coincide with the bounds of rocky substrate that restricts further sediment transport. Examples of such features are shown in Appendix D.2.1
These adjustments reflect a potential inappropriateness of the Bruun model for such constrained sub-compartments. In reality, a ‘perched’ shoreface profile, or concave shoreface feature may have a surplus of sediment in the shoreface that can tolerate sea level rise without an associated shoreline recession (i.e. the ‘accommodation space’ is already at a stable capacity). However, given that the Kiama open coast is at a relatively low risk of erosion (due to steep topography, and prevalence of offshore rock features and underlying bedrock, it is considered fit-for-purpose to assume a Bruuntype recession effect for planning purposes, without introducing inappropriately high conservativism. For site-specific impact assessments where higher levels of precision are required (or can be achieved as new data may become available in future), this approach should be revisited.
The storm erosion volumes calculated as part of the probabilistic erosion hazard assessment have been converted into appropriate setbacks by applying the storm demand (in m³/m) to beach-normal profiles at 5m spacings along the shoreline as taken from the DEM above 0mAHD. This approach has not included an assessment of the sand dune slope instability zone. Nielsen et al. (1992) provide a conceptual model for dune instability that has been adopted in many previous coastal erosion assessments in NSW. The method includes a +50% ‘factor of safety’ in the angle of repose of sand. The method is highly dependent on dune elevation and local sand characteristics (WRL 2012) which vary throughout the study area.
Site-based consideration of the dune instability slope may be appropriate in some locations as part of adaptation option planning and design. This is likely to focus on at risk areas with existing and/or planned development. The method of Nielsen et al. (1992) may provide a useful first pass screening for dune slope instability in certain areas where it is identified as applicable (may be considered as part of the subsequent Stage 3 of the CMP). However, a detailed geotechnical assessment would be needed to support detailed planning and design activities.
This study assumes that there will be no intervention of erosion processes for the modelled periods. It is possible however, that significant erosion events may result in emergency measures to protect property and amenities, such as by creating seawalls or conducting beach nourishment. Such measures can disrupt the natural sediment transport processes and result in altered likelihoods of setback in different areas than has been identified. If such measures or events take place, updates to the assessments presented in this report may be warranted.
The following general limitations of the assessment approach and modelling apply to this study:
• Significant uncertainty arises from fitting and extrapolating statistical distributions to very limited historical datasets. It is not possible to estimate the resulting bias associated with this approach.
• The ability to predict wave runup over and beyond the sloping beach profile (into the residential and populated areas) is limited and has been approximated using an empirical relationship. Quantifying the risks to the community and/or existing assets from inundation and wave action are limited by the availability of nearshore and seabed elevation data and the assumption of a static coastal barrier. Site-based assessments of inundation and overtopping potential, building on the work described in this report, should be completed in support of detailed planning and design projects.
It is difficult to estimate the order of magnitude of the combination of these uncertainties due to the highly dynamic nature of storm tide events and the infinite variation in the physical parameters involved. It should be noted that statistical analysis and probabilistic modelling approaches, where thousands of events are used to provide long term estimates, tend to average out the variables and provide better accuracy in the result than that predicted for a single deterministic event.
BMT was commissioned by Port Stephens Council to carry out an update audit of existing foreshore protection structures as part of their Stage 2 CMP. The audit provides insight into the condition and functionality of the coastal structures to assist Council with ongoing maintenance activity, including planning of remediation and repair. This audit included a desktop review on the existing information, gap analysis, visual condition assessment and multi-criteria risk assessment.
The audit involved an assessment of the waterfront structures at Port Stephens, comprising approximately 6200m of authorised seawalls and 3000m of un-authorised seawalls. The audit excluded all jetties and boat ramp - associated structures (inc. both public (‘authorised’) and private (‘unauthorised’)).
This audit report presents the findings of an assessment that was undertaken as part of the Port Stephens Stage 2 CMP. It forms Appendix H of the main study report. For a more detailed description of the site locality and purpose of the overall audit, readers are referred to the contents of that report
The objectives of the audit included:
• Identify fitness of existing information
• Document condition and suitability of foreshore structures
• Identify remediation priorities of foreshore structures, considering the hazard information produced within this project
The outcomes of the risk-based assessment form a knowledge baseline for future assessments and provide guidance to Council for prioritisation of maintenance and remedial works. This will be further utilised in later stages of this CMP process (esp. Stage 3), when Council is collating key management options / objectives for the Port Stephens coastal zone
The evaluation process adopted for this audit was performance based; initially assessing the functionality and then the condition of each structure by:
• Desktop review of the infrastructure within the coastal context to establish the functional benchmark for each structure;
• Condition assessment against the functional benchmark (inc. USACE standards/ procedures), and;
• Gap analysis and limitations review to highlight any identified issues having a bearing on the condition assessment.
Using this approach made it possible to identify the performance requirements for each structure and evaluate whether each structure was in a condition sound enough to provide the intended performance. Through this approach, the structure's loss of function due to deterioration determined the need for remediation, rather than only considering the difference between current structure condition and the as-built condition.
More detailed information and explanation of the coastal structures audit (inc. gap analysis and limitations) can be found in Appendix K
Based on the inspection of structures, assessment of their condition and high-level assessment of their performance (now and into the future), the public authorised coastal protection structures considered at risk are presented in Table 8-1, and the unauthorised (private) strcutures considered at risk are presented in Table 8-2
Figure 8-1 and Figure 8-2 present these structures spatially for the outer and inner port areas of Port Stephens, with colour coding representing the level of risk for each structure, and the shape of the marker distinguishing authorised from un-authorised structures. It should be noted that these tables and figures list the structures that are anticipated to be affected within the investigation area as a result of either their condition or functional performance. This list is cumulative and does not include the already failed seawalls
These lists can be used to as an initial guide for planning and prioritising remedial works. However, it will be important to develop a more detailed value assessment for each segment of coast which will include the structure itself, geotechnical information surrounding the structure and the built infrastructure landward to further rank the priorities of where remedial action should be focused.
More detailed information and explanations into the coastal structures audit can be found in Appendix K.
Timeframe
Present Day (2020)
Structural Assets at Risk
CPKR-R1-SR1 (Carroll Park Reserve)
CPSP-R2-SR1 (Conroy Park/Sandy Point Seawall)
CPSP-R6-SR1 (Conroy Park/Sandy Point Seawall)
CPSP-R8-SR1 (Conroy Park/Sandy Point Seawall)
EPGR-R1-SR1 (Everitt Park Groyne)
EPGR-R1-SR3 (Everitt Park Groyne)
EPGR-R2-SR1 (Everitt Park Groyne)
EPSW-R1-SR1 (Everitt Park Seawall)
KPSW-R1-SR1 (Kooindah Park Sea Wall)
KPSW-R1-SR2 (Kooindah Park Sea Wall)
KRSW-R1-SR1 (Koala Reserve Seawall)
LBS1-R2-SR1 (Longworth Park Sea wall)
LBS1-R3-SR1 (Longworth Park Sea wall)
NBFE-R4-SR1 (Nelson Bay Foreshore Reserve Eastern Groyne)
Timeframe
Structural Assets at Risk
SBSW-R1-SR1 (Swan Bay Sea wall)
SBSW-R1-SR2 (Swan Bay Sea wall)
SBSW-R1-SR3 (Swan Bay Sea wall)
SBSW-R1-SR4 (Swan Bay Sea wall)
SBSW-R2-SR1 (Swan Bay Sea wall)
TBFS-R1-SR1 (Tanilba Bay Foreshore)
TBSW-R1-SR1 (Taylors Beach Sea Wall)
TBSW-R1-SR2 (Taylors Beach Sea Wall)
2040
EPSW-R3-SR2 (Everitt Park Seawall)
MPS2-R1-SR1 (Memorial Park Sea wall)
MPS2-R1-SR2 (Memorial Park Sea wall)
MPS2-R1-SR3 (Memorial Park Sea wall)
NBFE-R3-SR2 (Nelson Bay Foreshore Reserve Eastern Groyne)
PPSW-R1-SR1 (Peace Park Sea Wall)
PPSW-R1-SR2 (Peace Park Sea Wall)
TBSW-R2-SR1 (Taylors Beach Sea Wall)
2070
CPSP-R1-SR1 (Conroy Park/Sandy Point Seawall)
LBS1-R1-SR1 (Longworth Park Sea wall)
LBS2-R1-SR2 (Longworth Park Sea wall)
MPS1-R1-SR1 (Memorial Park Sea wall)
SSPS-R1-SR1 (Sunset Park Seawall)
SSPS-R2-SR1 (Sunset Park Seawall)
SSPS-R4-SR1 (Sunset Park Seawall)
SSPS-R5-SR1 (Sunset Park Seawall)
TBSW-R2-SR2 (Taylors Beach Sea Wall)
TBSW-R2-SR3 (Taylors Beach Sea Wall)
WWHS-R2-SR1 (Wanda Wanda Headland Seawall)
WWHS-R2-SR2 (Wanda Wanda Headland Seawall)
WWHS-R2-SR4 (Wanda Wanda Headland Seawall)
2120
CPSP-R3-SR1 (Conroy Park/Sandy Point Seawall)
CPSP-R5-SR1 (Conroy Park/Sandy Point Seawall)
CPSP-R7-SR1 (Conroy Park/Sandy Point Seawall)
CPSP-R9-SR1 (Conroy Park/Sandy Point Seawall)
CPSP-R9-SR2 (Conroy Park/Sandy Point Seawall)
DBRE-R1-SR1 (Dutchmans Beach Reserve Eastern Sea Wall)
DBRW-R1-SR1 (Dutchmans Beach Reserve Western Sea Wall)
EPGR-R1-SR2 (Everitt Park Groyne)
EPSW-R2-SR1 (Everitt Park Seawall)
EPSW-R2-SR2 (Everitt Park Seawall)
EPSW-R3-SR1 (Everitt Park Seawall)
LBRS-R1-SR1 (Little Beach Reserve Seawall)
LBRS-R1-SR2 (Little Beach Reserve Seawall)
NBFE-R1-SR1 (Nelson Bay Foreshore Reserve Eastern Groyne)
Timeframe Structural Assets at Risk
NBFE-R2-SR1 (Nelson Bay Foreshore Reserve Eastern Groyne)
NBFE-R3-SR1 (Nelson Bay Foreshore Reserve Eastern Groyne)
NBFI-R1-SR1 (Nelson Bay Foreshore Reserve Inner Harbour Seawall)
NBFI-R1-SR2 (Nelson Bay Foreshore Reserve Inner Harbour Seawall)
NBFI-R2-SR1 (Nelson Bay Foreshore Reserve Inner Harbour Seawall)
SSPS-R3-SR1 (Sunset Park Seawall)
WWHS-R2-SR3 (Wanda Wanda Headland Seawall)
Timeframe
Present Day (2020)
Un-Authorised Structural Assets at Risk
UASP-1-6 (Soldiers Point)
UASP-1-8 (Soldiers Point)
UASP-1-9 (Soldiers Point)
UASP-1-12 (Soldiers Point)
UASB-1-1 (Salamander Bay)
UASB-1-2 (Salamander Bay)
UASB-3-1 (Salamander Bay)
UASB-4-1 (Salamander Bay)
2040
UASP-1-3 (Soldiers Point)
UASP-1-4 (Soldiers Point)
UASP-1-5 (Soldiers Point)
UASP-1-7 (Soldiers Point)
2070
UASP-1-1 (Soldiers Point)
UASP-1-2 (Soldiers Point)
UASP-1-10 (Soldiers Point)
UASP-1-11 (Soldiers Point)
Z:\N21295_Port_Stephens_CMP_Stage2\Docs\Report\R.N21295.002.05_Draft_Report_MASTER.docx

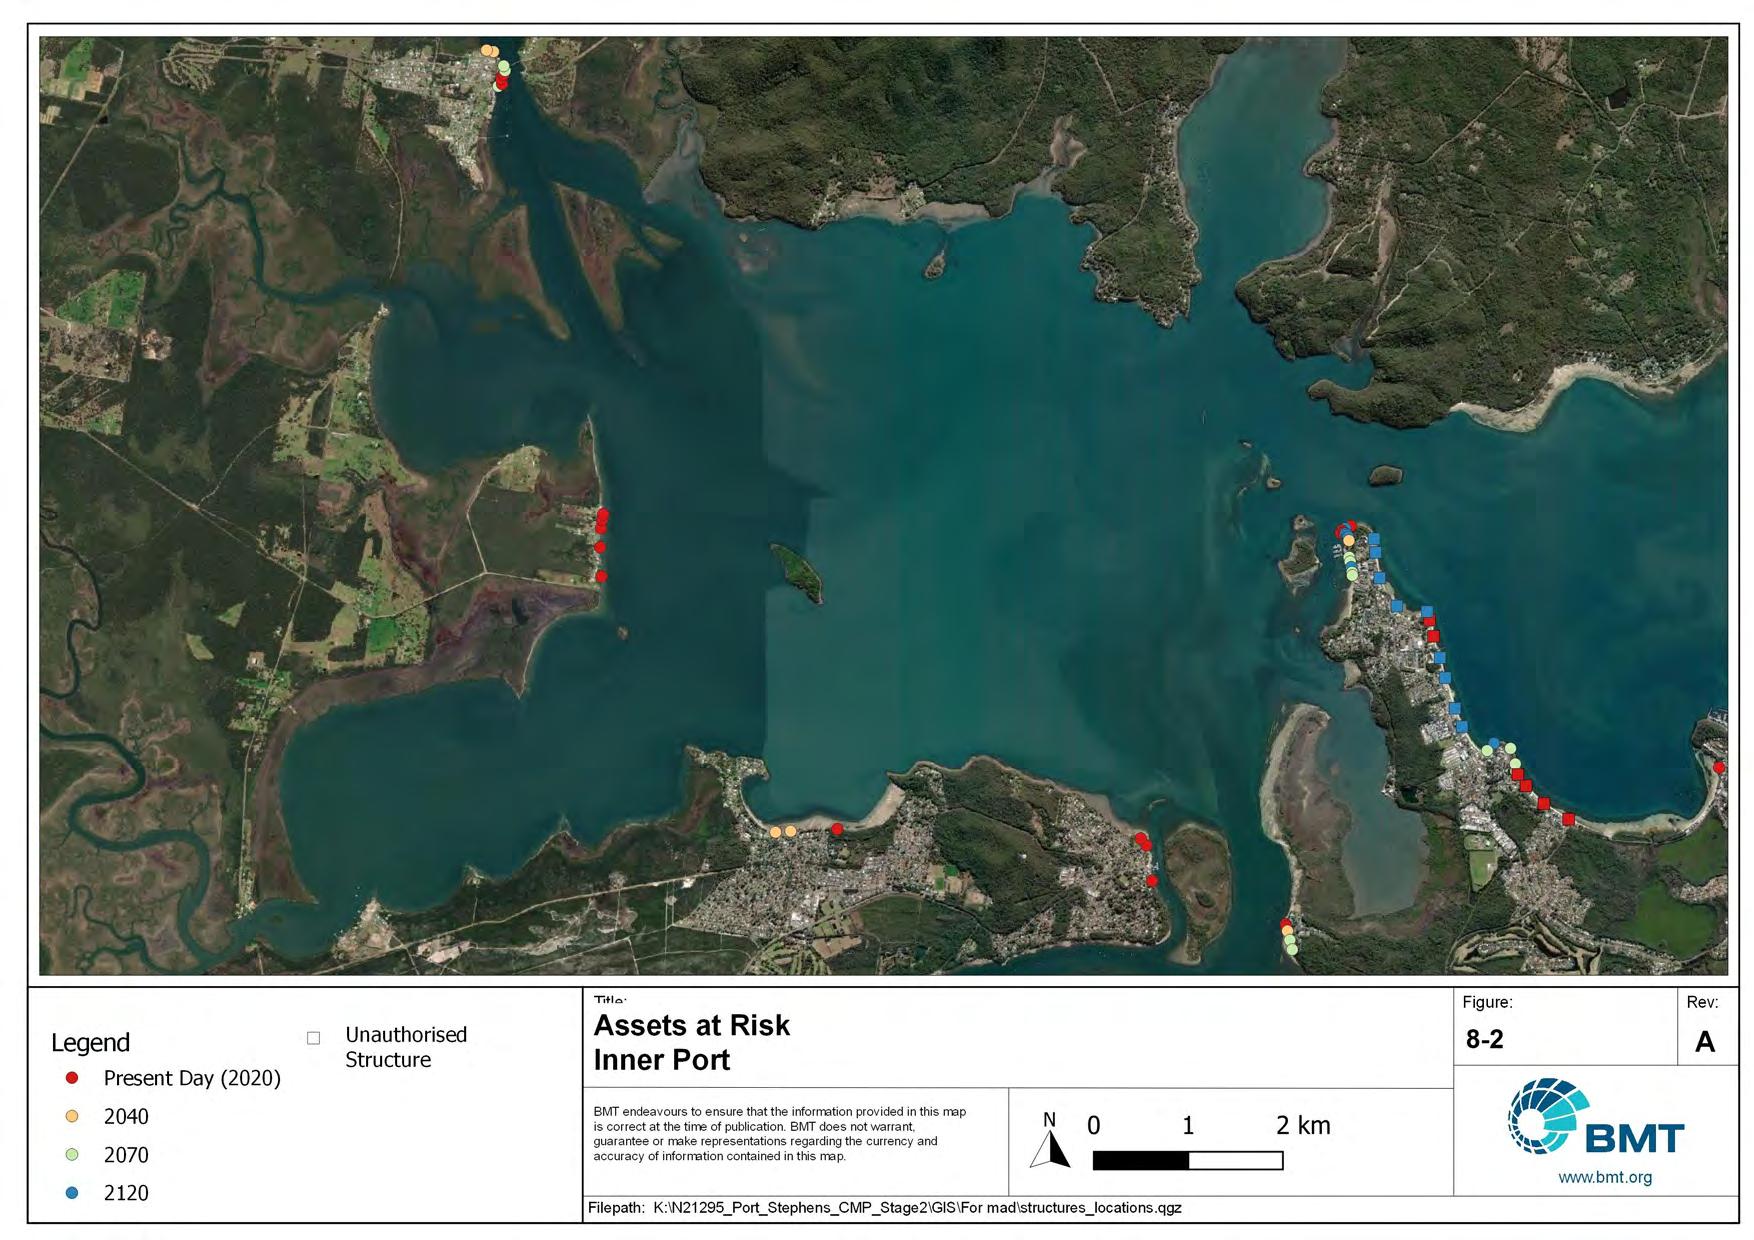
In addition to the assessment results provided in Table 8-1, Table 8-2, Figure 8-1, and Figure 8-2, general observations made during the inspections are summarised below for the concrete and rock armour seawalls:
• Based on BMT’s enquiries to Council and the information provided, there appears to be very little information on the design or baseline condition of the structures. Comparison between the limited seawall data held by Council and the data recorded as part of this works showed a few cases where structural levels deviated significantly. This can be mainly attributed to the holistic data logged by Council, lacking subdivision with seawall type, materials, function, and length.
• Large sections of the Port Stephens foreshore are at-risk due to implementation of protection structures that fall far short of sound coastal engineering design and construction standards. Consequently, a significant portion of structures are in poor to moderate condition (on average) showing evidence of deterioration and significant failure. Although the risk varies depending on the existing structure, its condition and the level of exposure to storm conditions within the Port, both now and into the future, a large percentage of structures require significant remediation to achieve an adequate level of shoreline protection.
• Desktop assessment and site observations of the coastal structures indicate that the protection measures in place fall short or fail to achieve the intended or required function to retain the foreshore and protect the land and infrastructure behind the walls, with inundation being a key factor effecting the long-term functional performance.
• Boat ramps front a number of residences across the foreshore, increasing levels of wave runup, overtopping and general inundation, accelerating the deteriorating condition of the foreshore and associated structures.
• Excluding overtopping failure resulting from insufficient seawall crest heights, the two most significant faults in design include a lack of suitably sized armour layers, the absence of geotextile between armour and the underlying material, and the lack of a structural toe (to withstand scour and undermining). The insufficient allowance in design for scour, piping and undermining is the cause of most of the structure failings observed.
• The functional requirements of the private ‘non-authorised’ structures inspected as part of this project tend to be higher than many of the other structures due to their exposed locations. The coastal protection in these areas appears to be below the required standard, with the large variance in design (type, material size etc) contributing to the poor condition and performance.
More detailed information of the coastal structures audit can be found in Appendix K
While the hazard mapping provides general extent of the hazards for assessing future impacts, a more detailed analysis of existing assets and council managed land provides a direct pathway for strategic decision making of the hazard areas.
Several GIS Layers have been provided by Port Stephens Council and formed the basis of this exposure assessment:
• Buildings.shp – Point locations of key council buildings
• Depots.shp – Point locations of council owned depots
• Emergency Key Facilities.shp – A layer with key emergency services (Police, Ambulance and Fire services and Evacuation shelters), vulnerable assets (schools, aged care, holiday parks, etc.) and key infrastructure (mobile phone towers, power substations, etc.)
• Road_Centrelines_2020-03-31.shp – A layer of the roads and road segments throughout the local government area
• PSC_Controlled_Land_2020-03-30.shp – A layer of all the land parcels under control of Council that may need to be prioritised and managed for their inundation risk.
It has been assumed that these layers are accurate and represent the true locations and categorisations of these different key assets.
These layers have been analysed using GIS tools to examine the likelihood of an impact (based on the probabilistic hazard extents) for each future planning year. This includes assessing the probability of these features being inundated under the different inundation conditions (20 and 100-year ARIs and HAT) and being impacted by erosion extents. It also included assessing the depth of inundation at key features, as well as some summary statistics of the percentages of areas impacted and the total lengths of roads impacted over different timeframes.
The key deliverable of the hazard exposure assessment is updated GIS features including additional attributes detailing hazard exposure likelihoods at different timeframes. In a GIS format, council can then assess by subregions and prioritise exposed areas for assessing the management options. The format for this output is the same as the input layers but with additional attribute fields detailing the likelihood of inundation under different years and event frequencies as calculated in the inundation hazard assessment (see Section 5).
For the different assets layers (point locations and roads) each location was flagged for each year/event type combination (e.g. 2020 HAT, 2070 20-year ARI) based on a probability of inundation as follows:
• Improbable – The location is not within the mapped inundation hazard extents, and has a <5% chance of being inundated.
• >5% – ‘Possible’ inundation occurring to that asset as it was within the upper CI inundation hazard extent only.
• >50% – ‘Likely’ inundation occurring to that asset as it falls within the ‘best estimate’ 50 percentile inundation hazard area.
• >95% – ‘Almost certain’ inundation occurring to that asset as it falls within the lower CI inundation hazard extent and therefore has a <5% chance of not being inundated under that event at that given timeframe.
The roads layer has been intersected with the inundation hazard areas to determine the likelihood of inundation under each year and event frequency. Table 9-1 presents the total length (in kilometres) of inundated roads under the different inundation scenarios (i.e., the event frequencies) for each future year. This shows that sea level rise will be the greatest threat on inundation of road areas. Tidal inundation (HAT levels) in 100 years’ time will exceed even large storm events in 50 years’ time. Most of the roads impacted exist either on the estuary foreshores and are prone to some influence of wave runup effects, or are in the low-lying areas branching from Tilligerry Creek. However, many of these roads are key connectors between the towns of the Outer Port area. Foreshore drive is a key connection that is impacted under present-day conditions and will only become more frequently inundated in future years. Similarly, Port Stephens Drive, Nelson Bay Road and Harris Road that all provide connection through Anna Bay to the townships in the Outer Port are all under threat of being inundated. This leaves the only other main road through these areas as Gan Gan Road, which is also under threat of partial inundation in within 50 years This area is shown in Figure 9-1, categorised by the likelihood of inundation exposure in a 2070 100-year ARI event.
It is noted that the locations of these points have been provided by council but may not perfectly represent the exact locations of all buildings associated with that asset (e.g. a public school). As such, this analysis may be somewhat sensitive to the positioning of these locations. The raw inundation hazard extents as well as the processed GIS tables have been provided to Council as part of this study and are available for inspection of this sensitivity and for recalculation of the exposure of any future new assets/buildings.
Table 9-2 presents the total number of key buildings with a greater than 50% likelihood of being inundated under each year/event-frequency combination. Table 9-3 presents similar data for key emergency facilities broken down by sub-class.
Unsurprisingly, the major threats occur to assets in low-lying areas and adjacent to the shoreline. There are several assets that are prone to potential inundation even under present-day conditions. Largely these are assets such as beach amenities buildings for the small beaches within the Port that are also exposed to the interaction with catchment flooding. There are also several community/public halls in low lying areas of the estuary adjacent to near-term inundation potential. Overall, many of the buildings are sufficiently elevated to avoid inundation even under future timeframes. Most key emergency facilities are not impacted with <5% of these facilities impacted under 2070 100-year ARI conditions. However two low-lying evacuation centres at the Bobs Farm Community Hall and Salt Ash Community Hall are prone to potential inundation at present day.
Finally, a general assessment of the percentage of Council controlled land that is exposed to inundation hazards was conducted. Table 9-4 presents the percentage of area (by sub-class) that is inundated under the different scenarios. This shows that a large percentage (up to 30%) of community/operational land is exposed to inundation hazards, with operational land and crown trustee land also showing high levels of exposure. Much of these land areas are already in intertidal areas (inundated by 2020 HAT extents) and are situated on the foreshore of the estuary and nearby creeks. Many of these areas do not contain significant built assets, but should be managed/assessed for their environmental and heritage values.
Z:\N21295_Port_Stephens_CMP_Stage2\Docs\Report\R.N21295.002.05_Draft_Report_MASTER.docx
Z:\N21295_Port_Stephens_CMP_Stage2\Docs\Report\R.N21295.002.05_Draft_Report_MASTER.docx
Z:\N21295_Port_Stephens_CMP_Stage2\Docs\Report\R.N21295.002.05_Draft_Report_MASTER.docx
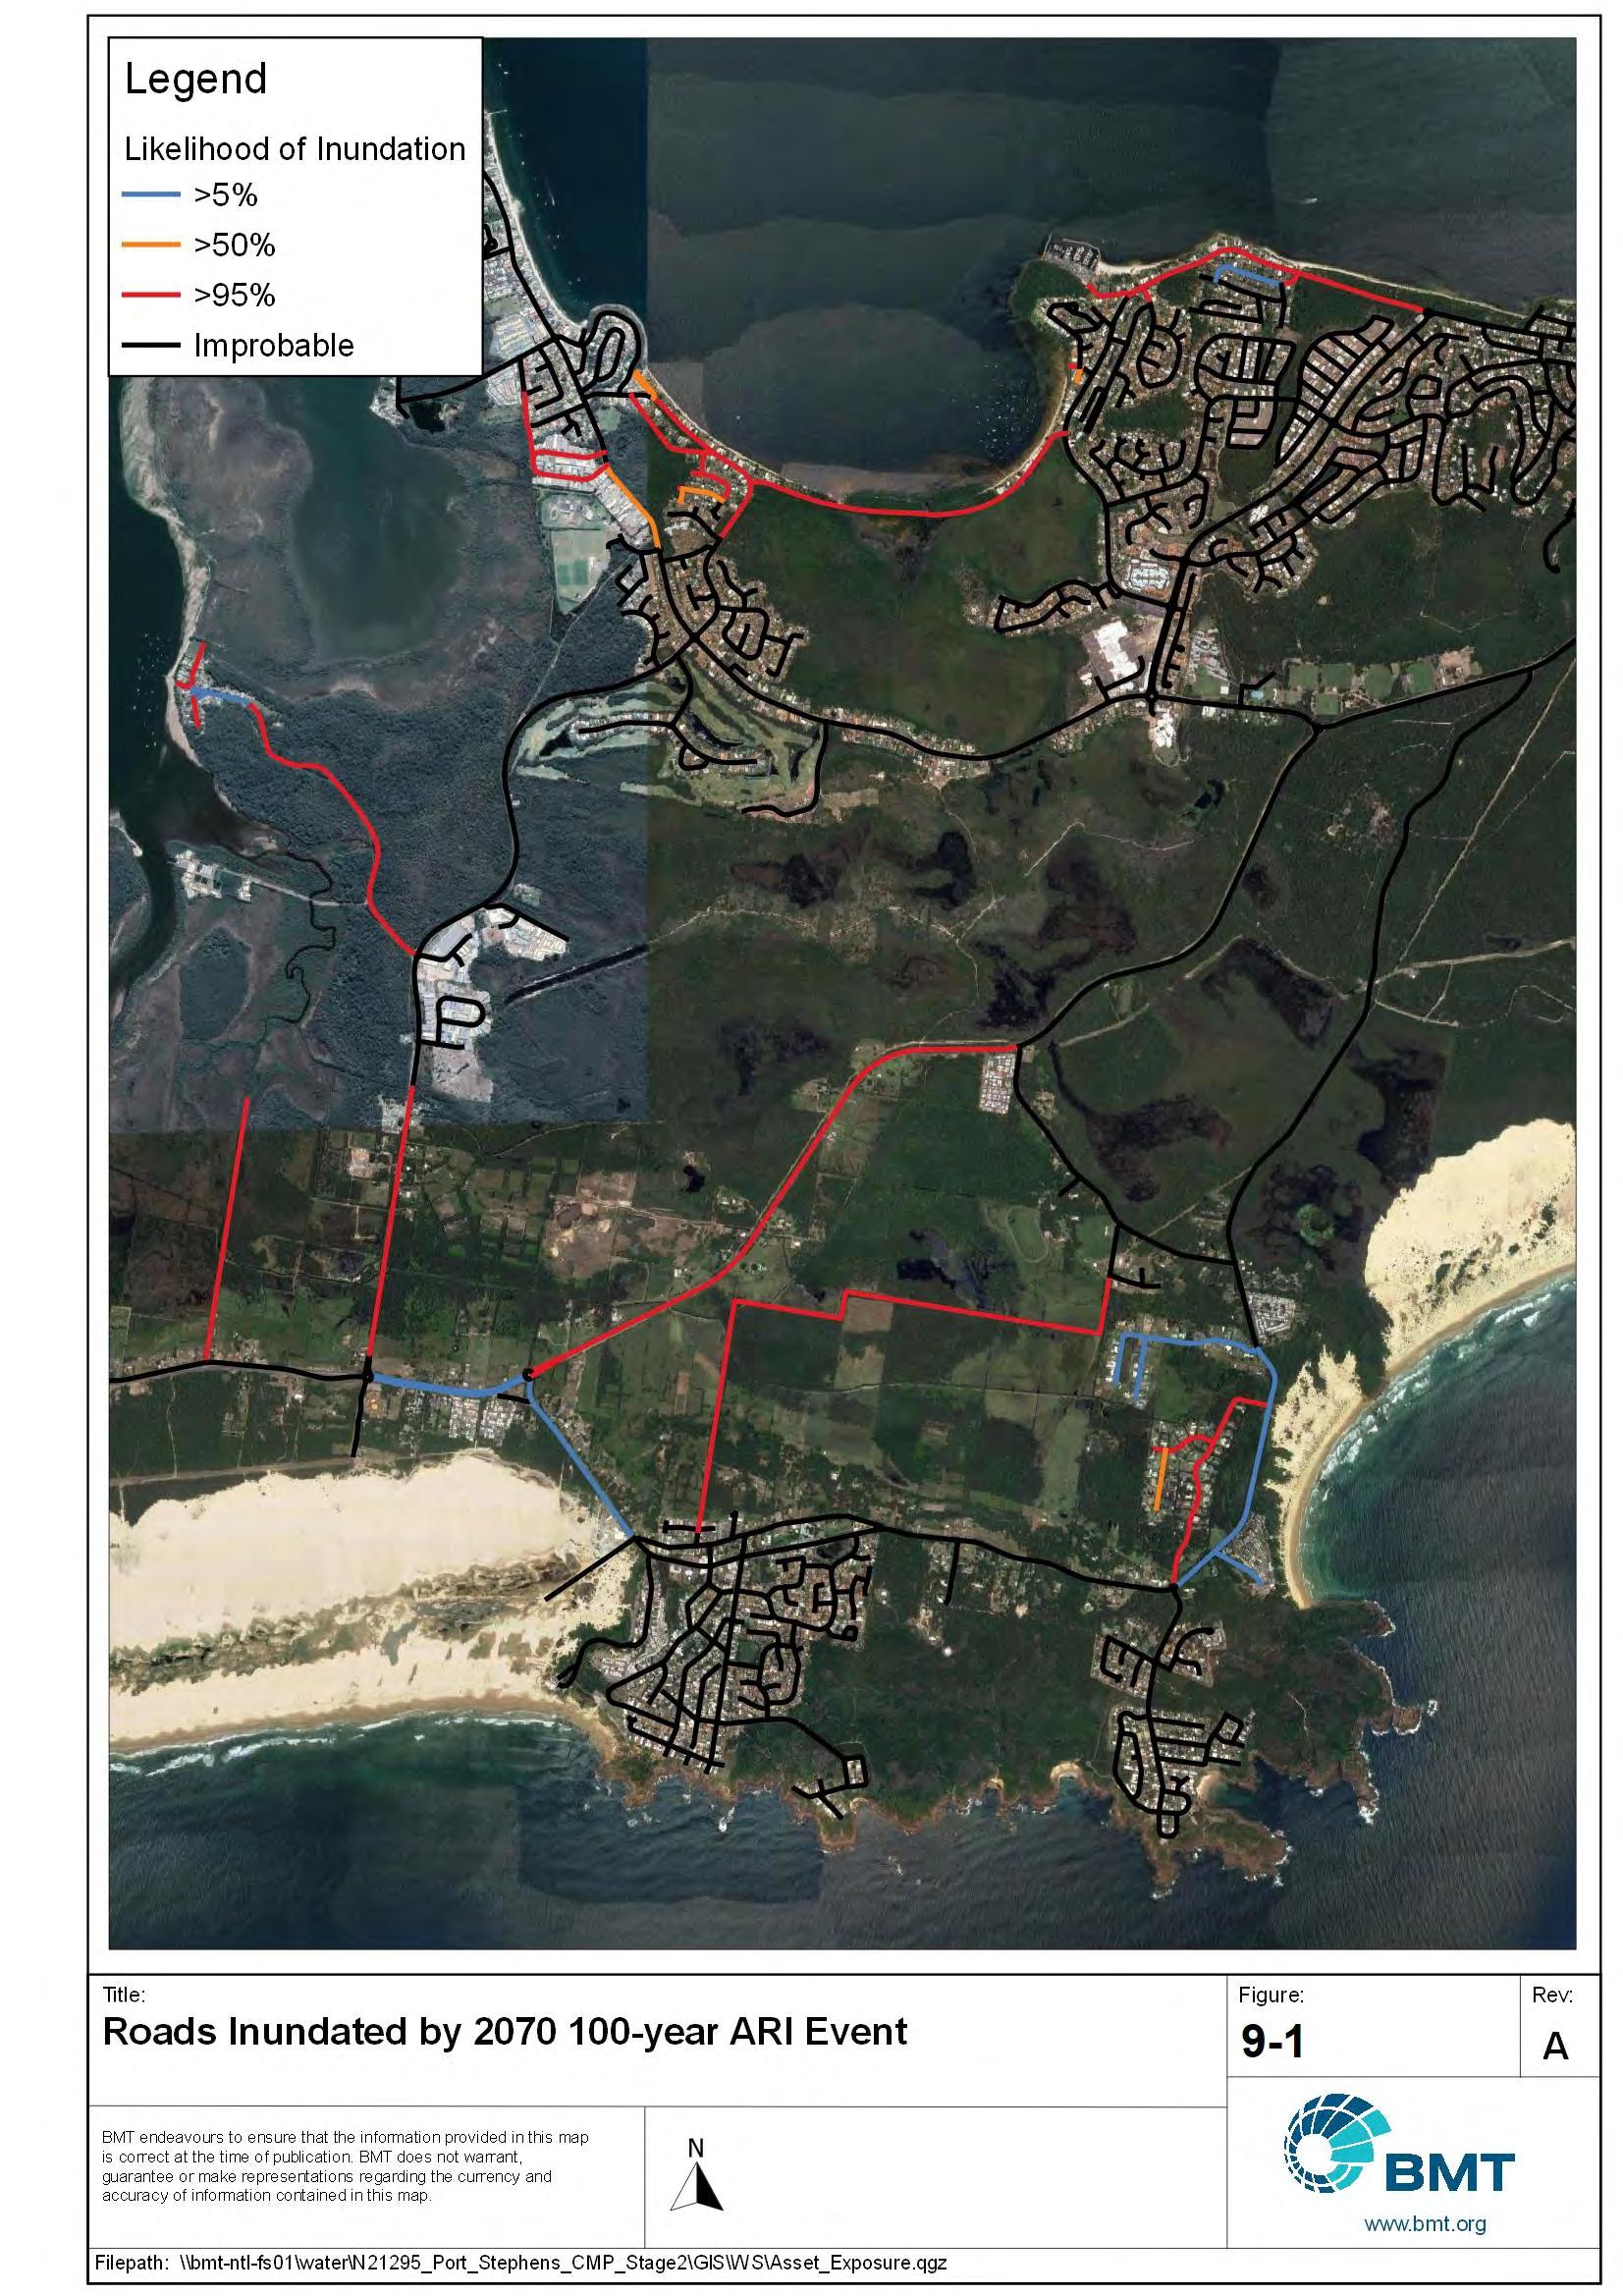
A property inundation and flood damage assessment has been undertaken to identify flood affected properties, quantify the extent of damages under existing and future flood conditions The general process for undertaking a flood damages assessment incorporates:
• Identifying properties subject to flooding;
• Determining depth of inundation above floor level for a range of design event scenarios;
• Defining appropriate stage-damage relationships for various property types/uses;
• Estimating potential flood damage for each property;
• Calculating the total flood damage for a range of design events; and
• Calculating the Average Annual Damages for the catchment.
A property database of floor levels was produced for residential properties that are located within the largest inundation extent that was assessed for flood damages (i.e the 1% AEP Event – 2120 Sea Level scenario). The building floor levels were either obtained from a Council GIS database that was provided to BMT or estimated via a desktop assessment. In total, 1,813 properties were identified within the 1% AEP Event – 2120 Sea Level scenario peak flood extent. Of these, 253 came from the Council floor level GIS database. The database contained information on the ground level and floor level for each building. For the remaining 1,560 properties, a desktop assessment was completed. The floor levels were estimated by using LiDAR to estimate ground levels at each building and adding a height-above-ground estimate. After an assessment of the height-above-ground levels in the Council database, it was found that 0.3m was a reasonable representation of affected properties. Therefore, a height-above-ground of 0.3m was adopted This approach provides a sufficient level of accuracy for undertaking flood damages.
The definitions and methodology used in estimating flood damage are summarised in the Floodplain Development Manual. Figure 9-2 summarises the “types” of flood damages as considered in this study. The two main categories are 'tangible' and 'intangible' damages. Tangible flood damages are those that can be more readily evaluated in monetary terms, while intangible damages relate to the social cost of flooding and therefore are much more difficult to quantify.
Tangible flood damages are further divided into direct and indirect damages. The existing flood damaged completed by as part of the ‘Port Stephens Foreshore Floodplain Management Study and Plan’ (WMAwater, 2002) flood damages database calculated direct damages only, therefore this study will adopt the same approach. Direct flood damages relate to the loss, or loss in value, of an object or a piece of property caused by direct contact with floodwaters.
The types of damages mentioned in the Floodplain Development Manual largely focus on tangible flood damages, particularly property related damages. Economic analysis for infrastructure projects within other Australian industries often includes a wider range of assessment criteria, such as the
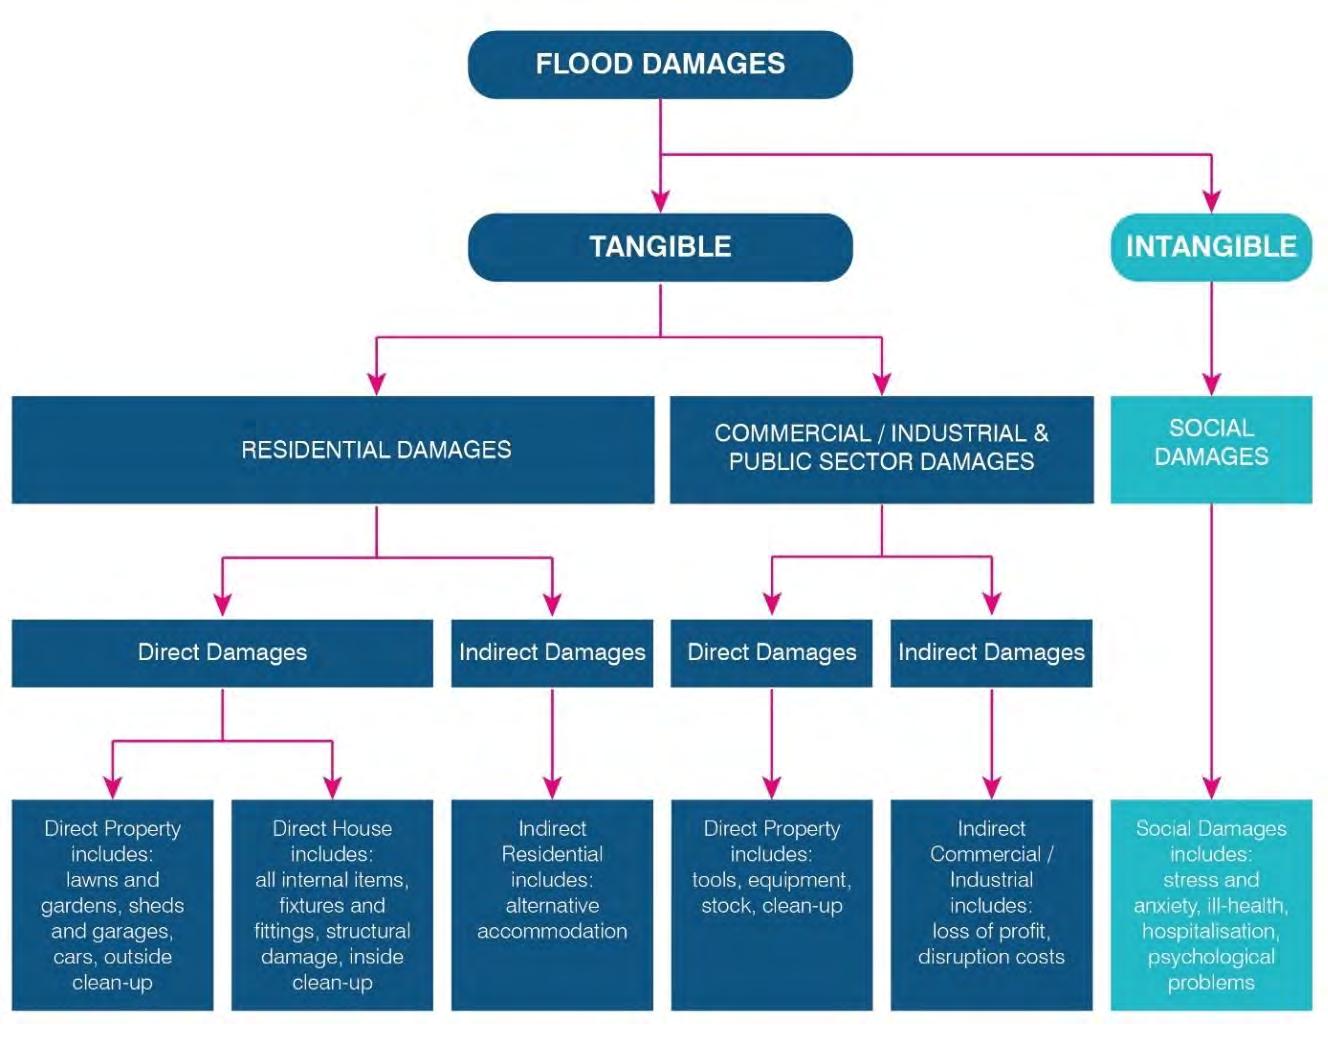
potential for fatalities, loss of transport connectivity, disruption to essential services (e.g. schools, medical facilities, sanitation) and other environmental values In certain floodplain areas, incorporation of such additional damage criteria provides for a more robust cost estimation of the consequence of flooding
The current study has updated the previous flood damages assessment (WMAwater, 2002) within the study area, based on an updated property database and new flood modelling. The current study includes the flood damages assessment for properties in the Williamtown, Salt Ash, Bobs Farm, Anna Bay, Karuah, Swan Bay, Lemon Tree Passage, Salamander Bay, and adjoining areas which are affected by flooding from the estuary. An outline of the flood damages assessment approach and outcome is presented below.
Flood damages have been calculated using a database of potentially flood affected properties and associated stage-damage curves. These curves relate the amount of flood damage that would potentially occur at different depths of inundation, for each property type. Residential damage curves are based on the stage-damage curves for residential property presented in WMAwater (2002).
For the purposes of the flood damage assessment, only residential properties were identified in the property database provided by Council. Hence, no commercial properties have been assessed for flood damages. All damage values are quoted in 2020 dollars.
The flood damages assessment is a useful tool to measure potential impacts from foreshore flooding under a variety of design flood conditions, flooding mechanisms and sea level rise scenarios, as opposed to an absolute measure of potential impacts. The extent of above floor flooding and associated impacts will depend on a range of factors, including:
• Wave runup: Wave runup impacts are difficult to quantify based on the available information, noting that wave runup levels have been modelled for a series of discrete foreshore profiles along the estuary. The height of wave runup is dependent on the ocean conditions and foreshore profile, which can vary from property to property (e.g. exposure, presence of ad hoc works). Also, the extent of above floor flooding will depend on whether wave driven elevated water levels propagate into building without interference. Future damage estimates have not taken into account any potential changes in foreshore position due to erosion for example.
• Future sea level rise: Future inundation impact estimates due to still water and wave runup flooding are significantly influenced by the extent of future sea level rise. Adopted sea level rise scenarios are consistent with the IPCC’s latest projections (SROCC report – see Section 2.4.1), which reflect global estimates. However, some uncertainty remains around the rate of sea level rise that will manifest over the medium to long term (see Section 7).
• Foreshore development profile: Foreshore development profile has been characterised by a combination of Council property survey data and GIS mapping undertaken in this study to fill in the gaps. The information is considered to provide a good representation of the present-day development profile. However, the available property database has been used as a proxy to assess medium to long term damages, while in reality the future development footprint is unknown.
The maximum depth of flooding expected during still water level and wave runup conditions was determined at each property. The flood modelling results for the 5% AEP (or 20-year ARI) and 1% AEP (or 100-year ARI) event inclusive of tidal and catchment influences were used to generate a continuous flood profile across the foreshore Simulated flood levels were queried from the GIS property database (detailed in Section 9.3.1) at each property . The resulting output was used to identify the number of properties affected, the frequency of inundation and the depth of inundation
The associated direct flood damage cost to each property was subsequently estimated from the stage-damage relationships (Appendix L). Flood damage curves include external damages incurred below floor level. Total damages for each flood event were determined by summing the predicted damages for each property.
The Average Annual Damage (AAD) is the average damage in dollars per year that would occur in a designated area from flooding over a long period of time. In many years there may be no flood damage, in some years there will be minor damage (caused by small, relatively frequent floods) and,
infrequently, there will be major flood damage (caused by large, rare flood events). Estimation of the AAD provides a basis for comparing the effectiveness of different floodplain management measures (i.e. the reduction in the AAD).
The assessment of the residential flood damages under existing climate conditions are presented in Table 9-5 Assessment of the residential flood damages under future 2040, 2070, 2120 conditions are presented in Table 9-6 to Table 9-8
*Wave Runup level (WRU) and Still Water level (SWL)
A summary of the number of residential properties potentially affected by above floor flooding from still water and wave runup flooding for the 5% AEP, and 1% AEP, inclusive of SLR scenarios is shown in Table 9-9.
This report has detailed the coastal hazards (i.e., coastal erosion / recession, coastal inundation, tidal inundation, and dune transgression) and associated risks to land and assets (built and natural) on the Port Stephens coastline.
The next stage of preparation of the CMP is to use the hazard information to not only provide Council with an understanding of the assets at risk from coastline related hazards but use the mapping outputs to guide a full-scale detailed risk assessment for the coastal area.
Following the risk assessment, the CMP Stage 3 involves the Options Assessment, during which options for managing the high/extreme risks from coastal hazards and other issues affecting the Port Stephens coastline will be investigated. The risk assessment outcomes, as well as hazard mapping provided in this report will form key inputs to Stage 3 of the CMP preparation process.
Stage 3 will also assess these management measures against multiple criteria to provide a short-list of preferred actions for implementation (and will be fully documented in a Stage 4 report).
Finally, the coastal zone is defined under the CM Act as comprising four coastal management areas being, in order of priority, 1) the coastal wetlands and littoral rainforest area, 2) coastal vulnerability area, 3) coastal environment area, and 4) coastal use area. To date, the Coastal Management SEPP maps include only areas 1, 3 and 4. Stage 3 of this CMP will also provide an opportunity for Council to update the SEPP mapping to include any identified coastal vulnerability areas (area 2), using the newly developed hazard maps, through a planning proposal. It is important to define the vulnerability areas, particularly for development purposes. For example, individual landholders that have land within the coastal zone (or coastal vulnerability area) will be able to utilise the Stage 2 hazard study / mapping / CMP rather than having to complete their own vulnerability assessments.
Barnard, P.L., Hoover, D., Hubbard, D.M., Snyder, A., Ludka, B.C., Allan, J., Kaminsky, G.M., Ruggiero, P., Gallien, T.W., Gabel, L., McCandless, D., Weiner, H.M., Cohn, N., Anderson, D.L., and Serafin, K.A. 2017. ‘Extreme oceanographic forcing and coastal response due to the 2015–2016 El Niño’, Nature Communications, 8, 14365.
Barnard, P.L., Short, A.D., Harley, M.D., Splinter, K.D., Vitousek, S., Turner, I.L., Allan, J. Banno, M., Bryan, K.R., Doria, A., Hansen, J.E., Kato, S., Kuriyama, Y., Randall-Goodwin, E., Ruggiero, P., Walker, I.J., and Heathfield, D.K. 2015. ‘Coastal vulnerability across the Pacific dominated by El Nino / Southern Oscillation’, Nature Geoscience, 8, 801–808.
Belly, P., 1964. Sand movement by wind., s.l.: U.S. Army Corps of Engineers, CERC, Washington, DC. Tech. Memo. 1.
Bluecoast, 2020. Stockton Bight Sand Movement Study (Report #: P19028_R4.00). City of Newcastle, Newcastle.
BMT WBM, 2011. Halifax Park / Fly Point Sand Accumulation Study (No. R.2128.001.01). Newcastle, Port Stephens Council.
BMT, 2019. Fern Bay Dune Management Report, Newcastle: Seaside Village, Fern Bay.
Bruun, P., 1962. Sea-level rise as a cause of shore erosion. Journal of Waterways and Harbours, Volume 88, pp. 117-130.
Cardno, 2020. Coastal Processes Assessment, Melbourne: Bayside City Council.
CSIRO, 2020. Regional Sea Level Data. CSIRO Sea Level, Waves and Coastal Extremes. Available: https://research.csiro.au/slrwavescoast/sea-level/measurements-and-data/sea-level-data/
Davidson-Arnott, R. H. P. O. J. W. I. B. B. D.-F. I. S. T., 2018. Sediment Budget Controls on Foredune Height: Comparing Simulation Model Results with Field Data. Earth Surface Processes and Landforms, 43(9), pp. 1798-1810.
Dean, R. G., 1991. Equilibrium beach profiles - characteristics and applications. Journal of Coastal Research, Issue 7, pp. 53-84.
Delgado-Fernandez, I., 2011. Meso-scale modelling of aeolian sediment input to coastal dunes. Geomorphology, 130(3-4), pp. 230-243.
DHI, 2006. Stockton Bight coastal process study, Newcastle: Newcastle City Council, DHI.
Doyle, T. B., 2019. Foredune morphodynamics in New South Wales, Australia. Ph.D thesis, School of Earth and Environmental Science, University of Wollongong, Wollongong, Australia.
Doyle, T., Short, A., Ruggiero, P. & Woodroffe, C., 2019. Interdecadal Foredune Changes along the Southeast Australian Coastline: 1942–2014. Journal of Marine Science and Engineering, p. 177.
DPIE, 2018. NSW Marine LiDAR Dataset. s.l.:Department of Planning Industry and Environment.
Ferland, M. A., 1990. Shelf Sand Bodies in Southeastern Australia, Sydney: PhD Thesis; University of Sydney.
Fryberger, S. D. D., 1979. Dune forms and wind regime.. In: E. McKee, ed. A Study of Global Sand Seas.. Washington: Geological Survey Prof. Paper, 1052. US Govt. Printing Office, pp. 137-170.
Geomarine, 1987. Jimmys Beach nourishment impact assessment of dredging Paddy Marrs Bar, s.l.: s.n.
Geomarine, 1991. Engineering Studies for a Small Boat Harbour, Port Stephens, New South Wales. s.l., Coastal Engineering: Climate for Change; Proceedings of 10th Australasian Conference on Coastal and Ocean Engineering, 1991.
Goodwin, I., Burke, A., Mortlock, T., Freeman, R. and Browning, S. A., 2015. Technical Report of the Eastern Seaboard Climate Change Initiative on East Coast Lows Project 4: Coastal System Response to Extreme East Coast Low Clusters in the Geohistorical Archive, Sydney: Adapt NSW and Macquaire University.
Gordon, A., 2015. Hazard Lines - Last Century's Thinking. Auckland, NZ, Australasian Coast & Ports Conference.
Gordon, A. D. a. L. D. B., 1980. An approach to understanding coastal processes.. Sydney, pp 1235 - 1254, In: Proceedings of the 17th international conference on Coastal Engineering.
Gordon, A. D. R. P. S., 1977. Sand movement in Newcastle Bight, Melbourne: 3rd Australian conference on coastal and ocean engineering, Institution of Engineers Australia, pp 64 - 69.
Hallermeier, R. J., 1981. A Profile Zonation for Seasonal Sand Beaches from Wave Climate. Coastal Engineering, Issue 4, pp. 253-277.
Hanslow, D., 2007. Beach erosion trend measurement: A comparison of trend indicators. Journal of Coastal Research, pp. 588-593.
Harley, M.D., Turner, I., Short, A., and Ranasinghe, R. 2011. ‘A re-evaluation of coastal embayment rotation in SE Australia: the dominance of cross-shore versus alongshore sediment transport processes.’, Journal of Geophysical Research, 116(F4).
Harley, M.D., Turner, I.L., Short, A.D., and Ranasinghe, R. 2010. ‘Interannual variability and controls of the Sydney wave climate’, International Journal of Climatology, 30(9), 1322 -1335.
Harris, D. B. J. A. T. V.-C. A., 2009. Multi-scale morphodynamic assessment of an embayed low energy estuarine beach, Shoal Bay, Port Stephens, NSW.. Sydney, East Coast Conferences, p. 19.
IPCC, 2019. Summary for Policymakers. In: IPCC Special Report on the Ocean and Cryosphere in a Changing Climate. s.l.: Intergovernmental Panel on Climate Change.
Kinsela, M. A., Morris, B. D., Daley, M. J. A. & Hanslow, D. J., 2016. A Flexible Approach to Forecasting Coastline Change on Wave-Dominated Beaches. Journal of Coastal Research, Issue 74, pp. 952-956.
Kinsela, M. M. B. L. M. H. D., 2017. Second-Pass Assessment of Potential Exposure to Shoreline Change in New SouthWales, Australia, Using a Sediment Compartments Framework. Journal of Marine Science and Engineering, 5(61), p. 40.
Lord, D. W. P. K. N. P. A., 1995. Offshore Dredging for Beach Nourishment; Shoal Bay, NSW. Newcastle, Institute of Engineers, Australia.
McInnes, K. & Hubbert, G., 2003. A numerical modeling study of storm surges in Bass Strait. Aust. Met. Mag., Volume 52, pp. 143-156.
MHL, 1997. Port Stephens Flood Study - Stage 2, Design Water Levels and Wave Climate, s.l.: MHL.
MHL, 2002. Hunter Estuary Process Study Summary Report, Sydney: NSW Department of Public Works and Services; Manly Hydraulics Laboratory.
Miot da Silva, G. H. P., 2010. Coastline orientation, aeolian sediment transport and foredune and dunefield dynamics of Moçambique Beach, Southern Brazil. Geomorphology, 120(3-4), pp. 258-278.
Moore, L. J., 2000. Shoreline mapping techniques. Journal of coastal research, 16(1), pp. 111-124.
Moratti, M., 1997. Stockton Beach Erosion, Monitoring and Management. Christchurch, NZ, Combined Australasian Coastal Engineering and Ports Conference.
Mortlock, T.R., and Goodwin, I.D. (2015) ‘Directional wave climate and power variability along the Southeast Australian shelf’, Continental Shelf Research, 98, 36–53.
Nielsen, P. & Hanslow, D. J., 1991. Wave Run-up Distributions on Natural Beaches. Journal of Coastal Research, Issue 7(4), pp. 1139-1152.
NSW Government, 2020. Review of potential marine sand resources for beach renourishment in the Hunter–Newcastle region, s.l.: Regional NSW.
Office of Environment and Heritage (OEH), 2018. NSW Coastal Management Manual Part A: Introduction and mandatory requirements for a coastal management program. Sydney: OEH, NSW Government.
Oppenheimer, M. et al., 2019. Sea Level Rise and Implications for Low-Lying Islands, Coasts and Communities. In: IPCC Special Report on the Ocean and Cryosphere in a Changing Climate. Intergovernmental Panel on Climate Change.
Pearce, K. & Walker, I., 2005. Frequency and magnitude biases in the 'Fryberger' model, with implications for characterizing geomorphically effective winds. Geomorphology, pp. 39-55.
Port of Newcastle, 1993. Mobility Study, Dumped Dredge Spoil - Outline of Stage 1 and Stage 2 Study findings, Newcastle: MSB Hunter Ports Authority.
Port Stephens Council, 2019. Coastal Management Program Stage 1 - Scoping Study, Port Stephens: Port Stephens Council.
PWD, 1987. Jimmys Beach Erosion Study., Newcastle: NSW PUblic Works Department - report 85042.
PWD, 2000. Jimmys Beach Coastline Management Review, Conceptual Sediment Budget and Beach Nourishment Practices., Newcastle: NSW Public Works Department.
PWDS, 1999. Port Stephens/Myall Lakes Estuary Processes Study, Sydney: Department of Public Works, and Manly Hydraulics Laboratory.
Ranasinghe, R., McLoughlin, R., Short, A., and Symonds, G. (2004) ‘The Southern Oscillation Index, wave climate, and beach rotation’, Marine Geology, 204(3–4), 273–287.
Royal Haskoning DHV, 2016. Little Beach Coastal Process Study, Newcastle, Australia: Port Stephens Council.
Roy, P. B. R., 1996. Quaternary geology of the southeast Australia: a tectonically stable, wavedominated, sediment deficient margin., Sydney: IGCP project # 367, Field Guide to the central New South Wales coast, NSW Geological Survey.
Roy, P. C. E. A., 1980. Quaternary geology of the Newcastle Bight Inner Continental Shelf, NSW, Australia, Sydney: NSW Geological Survey Records 19 (2), 145 - 188.
Roy, P. S. C. E. A., 1979. Quaternary geology of the Newcastle Bight inner continental shelf, NSW. NSW Geological Survey Records , 19(2), pp. 145 - 188.
Shand, T.D., Goodwin, I.D., Mole, M.A., Carley, J.T., Browning, S., Coghlan, I.R., Harley, M.D., and Peirson, W.L. 2011. NSW Coastal Inundation Hazard Study : Coastal Storms and Extreme Waves
Short, A., 2007. Beaches of the New South Wales coast: a guide to their nature, characteristics, surf and safety, 2nd edn.. Sydney: Sydney University Press.
Short, A., 2020. Southern NSW Region. In: C. R. Library, ed. Australian Coastal Systems - Beaches, Barriers and Sediment Compartments. Switzerland: Springer, pp. 601- 682.
Short, A. D. and Thom, B. G., 2018. Australian/NSW coastal sediment compartments. Concept and application. Merimbula, NSW, 27th NSW Coastal Conference.
Short, A.D., and Trenaman, N.L. 1992 ‘Wave climate of the Sydney region, an energetic and highly variable ocean wave regime’, Marine and Freshwater Research, 43(4), 765–791.
Stockdon, H. F., Holman, R. A., Howd, P. A. & Sallenger, A. H., 2006. Empirical parameterization of setup, swash and runup. Coastal Engineering, Issue 53, pp. 573-588.
Thom, B. et al., 2018. National sediment compartment framework for Australian coastal management. Ocean and Coastal Management, Volume 154, pp. 103-120.
Thom, B. S. M. L. C. R. P. B. G. H. P., 1992. Coastal Geomorphology and Quaternary Geology of the Port Stephens-Myall Lakes Area, Canberra: Department of Biogeography and Geomorphology, Australian National University, Monograph No 6.
Treloar, P. D. A. C. L., 1977. Investigation into the Cause of Severe Waves at the Entrance to Newcastle Harbour. Wallingford, U.K, Third Australian Conference on Coastal and Ocean Engineering, 1977: The Coast, the Ocean and Man, The. Barton, A.C.T.: Institution of Engineers, Australia.
Turner, I.L., Harley, M.D., Short, A.D., Simmons, J.A., Bracs, M.A., Phillips, M.S., and Splinter, K.D. 2016. ‘A multi-decade dataset of monthly beach profile surveys and inshore wave forcing at Narrabeen, Australia.’, Scientific data, 3, 160024.
Umwelt, 2002. Shifting sands at Stockton Beach, Toronto, NSW: SMEC and Newcastle City Council.
Wainwright, D. L. D. C. B., 2015. 40 Years of Change - Recent Evolution of the Port Stephens Flood Tide Delta. Forster, East Coast Conferences .
Watson, P., 1997. Port Stephens Sand Nourishment Projects - Evaluation, Monitoring & Sustainability. Christchurch, New Zealand, Centre for Advanced Engineering, pp. 453-458.
WBM, 1998. Newcastle Coastline Hazard Definition Study, Newcastle: Newcastle City Council.
WMAwater, 2002 Port Stephens Foreshore Floodplain Management Study and Plan. For Port Stephens Council.
WMAWater, 2010. Port Stephens Design Flood Levels Climate Change Review, for Port Stephens Council.
WorleyParsons, 2012. Stockton Beach Sand Scoping and Funding Feasibility Study, Sydney: Newcastle City Council.
WRL, 2011. NSW Coastal Inundation Hazard Study: Coastal Storms and Extreme Waves, Manly Vale, NSW: Water Research Laboratory - University of New South Wales.
Zingg, A., 1953. Wind tunnel studies of the movement of sedimentary material.. Iowa City, USA, Institute of Hydraulics, pp. 111-135.
Shoal Bay extends for 2.5 km from Tomaree Headland to Nelson Head. It is the most easterly and more energetic of the beaches found in the southern half of Port Stephens (Figure 2-1, 2-5). It is classed as a reflective beach, and curves initially facing northeast at Nelsons Head, then north, and finally northwest when it reaches Tomaree.
Shoal Bay has a long history of shoreline changes (both erosion and accretion) due to the dominant sediment transport processes occurring there (Watson, 1997). These changes have been documented since the 1960’s (Wainwright, 2015; Watson, 1997; Lord, 1995), and they indicate that Shoal Bay has a net westward longshore sediment transport. Figure 2-6 summarises the main sediment transport processes for Port Stephens, including Shoal Bay. The western end of Shoal Bay is a highly reflective beach, that is aligned to the dominant ocean swell, and because of the dominant westward longshore transport, it has a wider beach and dune system. Intermittently, sand can either: a) build up at this end of the beach to such an extent that westward bypassing occurs around Nelson Head (BMT WBM, 2011; Wainwright, 2015), or b) storm events can erode the subaerial beach and move sand to the subtidal part of the bay, forming sand bars that usually return to the subaerial parts slowly, during calmer conditions. Sand from the sand bars can also be transported to the sand shoal (Shoal 1 in Figure 2-6) situated at the entrance to Port Stephens, which then can supply sand to the eastern parts of Shoal Bay. The beach at the central to eastern end of Shoal Bay is narrow and flat and has been experiencing long-term erosion and recession (Harris, 2009). This indicates that the sand from the shoal does not always make it to the beach, but is captured in the westward longshore transport pathway, heading back to the western end of the bay where sand is predominantly accumulated (and sporadically lost to adjacent sub-compartments) (Figure 2-6).
Little Nelson stretches 200 m from the 30 m high Nelson Head to Fly Point in the west. Nelson Bay curves gently to the northeast from the eastern side of the marina wall 550 m to the low rocky Fly Point. Both beaches are reflective, and there seems to be strong currents present here, moving sands longshore (westward) to the marina’s east wall.
Little Nelson Beach receives intermittent amounts of sand from Shoal Bay via headland bypassing. It has been found that unprecedented levels of sand bypassing are occurring in recent years at this location, which has been be attributed to factors such as; ongoing erosion in Shoal Bay, stabilisation of Zenith Beach hind dunes, past nourishment of Shoal Bay, and a changing wave climate (PWDS, 1999). Sand builds up on the northeastern end of Little Nelson, and slowly moves west with the dominant longshore current, which may either bypass Fly point into Nelson, or most likely, be lost in the strong eastward tidal current off the point.
Nelson Bay Beach stretches from the western side of Fly Point to Nelson Bay Marina, and has had ongoing erosion issues since (at least) the 1940’s. Marked sand accretion has been reported to occur at the westward end of the beach while erosion is increasing at the eastern end (near Fly Point) (Geomarine, 1987). Prior to the construction of the Marina and the breakwaters, there was a continuous cycle of sediment movement along
the beach (predominantly eastward), now sand accumulates at the western end, and during strong wind and wave events (or sand builds up to a certain extent), sand bypasses around the marina, or is captured in the strong eastward tidal current just off the shoreline, and deposited elsewhere in the estuary (i.e. northeast to the sand lobe off Nelson Head?). Due to the eastward longshore current experienced within the bay, sand can also be lost off Fly Point, where sediment is likewise trapped in the strong tidal current and taken elsewhere in the port (Geomarine, 1987).
There is a 250 m stretch of sand within the marina, remnant of the former longer beach, when it connected with Nelson Bay. This is a very closed system, owing to the protection of the marina walls bordering it.
Dutchmans Beach is located between West and Redpatch Points, and is a 400 m long north facing, low energy, reflective, pocket of sand. Sandy Point is now backed by 500 m of private property, all of which have seawalls on and over the beach. As a result, Bagnalls Beach now commences at the eastern end of these walls and trends east for 1.3 km to Redpatch Point. Both beaches have been found to experience some minor erosion, which has been attributed to the destruction of Myall Point (a large sand spit extending into Port Stephens from the northern side) and the associated sand shoals around the middle of the port (PWD, 2000) Myall Point provided protection to Sandy Point and adjacent beaches from northeast wind-waves and ocean swells that are now directed right into this sub-compartment (PWD, 2000). The dominant longshore transport for this area is also to the west, with any significant onshore/offshore transport limited to hard points on the shoreline (i.e. artificial coastal structures). For example, the groyne feature at the end of Bagnalls Beach (Sandy Point) obstructs longshore transport, until sand builds to a certain extent that it can bypass the tip of the structure. This has been observed in aerial imagery, whereby sand spills over the rock groyne and buries the adjoining sea grass beds on the other side (PWD, 20000). This sand is most likely then transported intermittently within the net westward longshore drift into the next sub compartment (i.e. Conroy Beach).
Conroy Beach is found on the eastern side of the Anchorage Marina, it trends east-northeast for 650 m to Sandy Point, and the coastal processes occurring within this area have been heavily modified since the construction of the Marina (i.e. obstruction of the dominant westward longshore transport) (Geomarine, 1991; Short, 2007). For example, since the construction of the Marina breakwaters, the western end of the beach has built about 50m into the port, and it will continue to trap sand until the beach progrades sufficiently to allow sand to bypass the harbour, and lost around Corlette Head (into either Salamander Bay or off the dropover of the Flood Tide Delta head) (Geomarine, 1991; PWD, 2000; Short, 2007). While the western end of Conroy has accreted, the eastern end has eroded over the past 20-25 years (Wainwright et al. 2015). The sand transport rate at this location has been estimated at 3,000 m3/yr., and is thought to be primarily feeding the steep prograding face of the flood tide shoal off Corlette Head (Shoals 4 and 5 in Figure 2-6), which his developing westward at a rate of 0.5 – 1 m/yr. into the quieter waters of Salamander Bay (PWD, 2000). Conroy Beach is the western end of the sediment compartment that includes Dutchmans, Bagnalls Beaches and West Point in the east (see Figure 2-1) The longshore littoral drift in this sub compartment is being fed by the foreshore erosion of Dutchmans and Bagnalls Beaches, and is then being lost to the flood tide shoal off Corlette Point (PWD, 2000).
This section of shoreline within Port Stephens has been modified by the construction of the Pepper Anchorage Marina, on the eastern side of Corlette Point. It makes up 250 m of the point and extends 150 m into the port, altering longshore transport in the area.
Salamander Bay lies on the western side of Corlette Point. The semi-circular bay faced to the north and contains two low energy beaches (fronted by sand flats), separated by a central section of mangroves. From the 30 m high Corlette Head, the narrow high tide eastern beach is backed by a seawall for approx. 300 m, it then curves south-westward for 700 m, and is fronted by 50 m wide intertidal sand flats. The mangroves take up a 1.5 km section in the centre of the bay, with the western narrow high tide beach extending for 875 m to Wanda Wanda Head. There is no significant bypassing of sand from around Corlette Head and into Salamander Bay (PWD, 2000). Atpresent,there is still very little knowledge of the estuarine physical processes occurring within the bay. PWD (1987) found that the area is very protected/ isolated from the main flood tidal flows, thus it has slow tidal flows. It has also been proposed that a weak largescale reverse current circulation occurs within Salamander Bay (Figure 2-6), keeping sediment within the closed system (PWD, 1987).
Wanda Beach commences on the northern side of the 40 m high Wanda Wanda Head, and trends due northnorthwest for 1.6 km to Kangaroo Point. Wanda Beach is a low energy beach which also has sand flats fronting it, and a groyne adjacent to the beach 400 m south of the point.
Soldiers Point is a 10 m high northerly protruding headland that with Fome Point, divides Port Stephens into the eastern and western sections. There are two beaches between Kangaroo and Soldiers Point, the northernmost one, extends south (east facing) for 650 m. It is a 5 m wide high tide beach fronted by shallow seagrass flats, and a small groyne in the south. The southern beach is an extension of the previous, it is a curving north facing narrow strip of sand that terminates in lee of Kangaroo Point.
These 3 low energy beaches reside in a low energy coastal environment. The ebb flows can be relatively strong from Soldiers Point to Wanda Wanda Head (generally occurring past the -10m contour), but once they enter the bay, they slow dramatically (PWD, 1987). Sand transport seems to be similar to Salamander Bay, in that it remains within this sub-system, with minimal to no reported losses around Soldiers Point or into the bay.
Immediately south of Tomaree Headland, on the open coast side of the Port lies Zenith Beach. The 400 m long beach faces due east, is backed by 10-20 m high foredunes that link with Shoal Bay beach within Port Stephens, the two beaches connect Tomaree Headland to the mainland. Zenith ends at the 140 m high Stephens Peak in the south. South of Zenith are three similar east-facing beaches all within Tomaree National Park. The first (starting from the north) is just a very small 50 m accumulation of sand at the foot of Stephens Peak. Wreck Beach is next, it is a 200 m long and often has an attached sand bar with rips forming against the rocks during higher waves. The southernmost beach is Box Beach, which spans 350 m to the south. Finally, Fly Roads is the open bay and beach that makes up the northern side of Fingal Spit (which connects the mainland to Fingal Island and Point Stephens). This beach runs along the north side of the spit for 1.4 km, facing northeast, and is quite protected by Point Stephens. During severe storm events the beach and spit can be breached resulting in it separating into two and Point Stephens becoming an island (i.e. Fingal Island).
Zenith has a large foredune behind it, and before being highly vegetated, the foredunes behind Zenith would have provided sand to the Shoal Bay tertiary compartment (Short, 2020). Presently, the dunes capture sand from the beach, or exchange sand cross-shore during storm events. Storm waves move sand to the nearshore (and form sand bars), then it slowly works its way back to the beach during calmer conditions. Due to the protection of Fingal Island, and the embayed rocky nature of these pocket beaches, there seems to be no prominent longshore processes. Some sand might be exchanged between beaches during strong northerly wave events, however cross shore processes dominate these beaches. There may be offshore sources of sand slowly making its way back onto these beaches, but this has not been confirmed for this location (Goodwin, 2015). The most southern beach in this sub-compartment is Fly Roads, and it forms the northern side of Fingal Spit, and during severe storm events the beach and spit can be breached resulting in Fingal Island becoming separated from the mainland (Short, 2007)
Fingal Bay on the southern side of the split (or tombolo) forms the next embayment, with the Fingal barrier (i.e. the larger sand unit, including the nearshore, beach, dunes and hind dunes sandy areas) slowly receding deep into the bay eroding into Pleistocene Tomaree dune deposits, with relict swamp deposits becoming exposed occasionally after storm periods (Short, 2020; Thom, 1992) Fingal Bay Beach is a southeast-facing 1.5 km semi-circular sandy deposit, that has a 1 km wide rocky entrance between Point Stephens (Fingal Island) and Fingal Head. It can have a double entrance if the northern spit is breached during high wave events. Tomaree National park backs the beach in the north, while settlement and/ or foredunes back the central to southern sections.
There are several kilometres of rocky shore south of Fingal before Anna Bay is reached. Anna Bay is a 2 km wide south-east facing embayment that has the rocky shores of Fingal Head in the north and Morna Point bordering the south. Within this bay are two exposed beaches; Samurai Beach in the north, and One Mile in the south, split by Samurai Point. Samurai Beach curves southwest for 1.1 km, and is backed by active transgressive dunes, which rise to 30 m high (within Tomaree National Park). One Mile Beach extends
southward for 1.3 km from Samurai Point, it faces east, and also is backed by transgressive dunes at the northern end. At the southern end of the beach has only a narrow dune which is backed by recreational areas.
This tertiary compartment is backed by active transgressive dunes that extend up to 800 m inland (or 1.5 km of vegetated dunes), which were formed from older dune sands (Tomaree) exposed on the offshore seabed thousands of years ago (Roy, 1996). The combined barrier volume for this embayment (inc. Samurai and One Mile) totals 48 Million m3 (equating to 11,860 m3m-1), and while large amounts of sand have moved into these embayment’s over time, it is unlikely that longshore processes deliver much (if any) supplies of sand, because the bay is surrounded by prominent headlands and rocky shores. It has been suggested that sand bypasses this whole secondary compartment via the high energy shoreface, moving out of Stockton Bight and into either Port Stephens, Yacaaba or beyond (Short, 2020)? Like the other tertiary systems within the Anna Bay compartment though, cross shore processes dominate. Storm waves initiate the nearshore (sand bar)shoreline sand exchange, and aeolian wind energy keeps the active transgressing dunes supplied of sand. Despite these, the system still maintains a positive sediment budget, as it still might be being supplied from the inner shelf. It was found that for the higher energy northern end (Samurai) a modern net sand supply rate of 1.9 m3m-1yr-1 occurs, while the southern end (One Mile) receives about 0.9 m3m-1yr-1 (Goodwin, 2015). This energy grade (supply rate) is also reflected in the prevailing sand bar morphology; a single sand bar dominates One Mile, while the higher energy (and exposed) Samurai has two bars in the nearshore (Short, 2007)
The Stockton barrier system is one of the biggest in NSW. It is an exposed southeast facing beach-barrier that also has one of the highest energy coastal systems (rip dominated double bar) in the state. The present day transgressive dunes are very active the length of the beach, approximately 40% of the barrier is currently bare and unstable dune sands (Short, 2020). The barrier is made up of two parts: an older Pleistocene section (landward), and an outer (seaward) more modern Holocene section. This study will just focus on the Holocene section, as it remains within the active coastal zone. Thom et al. (1992) described the geological evolution of this system in detail and found that grain size varied along the length of the beach. In the northeast, grain size was finest (~0.25 mm), it became coarser towards the centre (0.3 mm), coarsest at around the Sygna historic shipwreck (~0.4 mm) (potentially attributed to an older river entrance), and then fines again closer to the mouth of the Hunter River (Roy, 1980; Thom, 1992). This is important, as grainsize plays a big role in determining modal beach state, as well as the rate and potential of aeolian (wind) sand transport.
As with other NSW beaches, Stockton Bight is subject to large gross fluctuations in longshore sediment transport associated with variations in wave energy and direction (Gordon, 1980). DHI (2006) modelled sediment transport from 1992 to 2004 near the southern end of the bight and found there was net an overall net northward sediment transport although in some years there was significant variability, and this reversed. For the period of 1866-2004, Umwelt (2002) predicted a net northward longshore sediment transport rate of approximately 20,000 - 30,000 m3 yr-1 for Stockton (Umwelt, 2002), and these numbers increased northwards of the seawall (up to 53,000 m3 yr-1) (DHI, 2006). The modelling done by DHI showed a nodal (or neutral) point where sediment transport splits from net north to south (or vice versa), and this point was predicted to occur at the northern end of the Mitchell Street seawall (approx. red arrow in Figure 2-8). It was also predicted that this location is the major eroding spot for southern Stockton (DHI, 2006). The wave climate experienced at Stockton, as well as the influence of the northern breakwall, produces a gradient in wave setup (south of the nodal point) that drives the southern longshore transport. This local current carries sand southward, then seaward, depositing (or accumulating) sand just north of the breakwaters. DHI (2006) also calculated that 33,000 m3 yr-1 of sand was bypassing Nobbys Head (i.e. updrift compartment), while Gordon and Roy, as well as WBM (Gordon, 1977; WBM, 1998) found that there was no significant longshore movement of sand into or out of the compartment, so any longshore movement was generally balanced in a north-south direction. In saying this, there is only a minor rocky reef extending off Birubi Point (~1km from the shoreline, reaching roughly -20 m water depth), so it would only take a storm or high wave event to transport any significant amounts of sand around this headland.
Human activities have also contributed to the sediment budget of the bight. Dredging commenced within the port in 1859 and has been near continuous since that time. This dredging is primarily for maintenance, and includes areas further upstream within the Hunter River and around the berth areas of the harbour Total dredging quantities (up to 1993, and for maintenance only) has been approximately 125 million m3, which was placed in the offshore spoil ground area south east of Nobbies Head, in around -30 to -40 m water depth (Port of Newcastle, 1993) More recent (i.e. post 1993) maintenance dredge volumes average around 300,000 m3yr1 but it is highly variable depending on flood occurrence within the Hunter River (WorleyParsons, 2012) This dredge material is generally composed of silts/muds/clays nowadays, which is not suitable, nor used for beach nourishment. However, in the early days of port dredging much of this material would have been marine sand (i.e. river entrance shoals and flood tide delta sands rather than the fine sediment being dredged now). This material was placed offshore and the general location now displays a significant morphological sandy lobe
(Port of Newcastle, 1993; MHL, 2002) It is unclear of the origin of this lobe, for example, whether it is a product of the dredging and dumping activities through time or a pre-existing natural feature that the dredging has further developed. Even despite being shown to have an unusual orientation (shore perpendicular, which is unlike other NSW seabed sand bodies) (Ferland, 1990), and the modelling to date does not suggest any potential mechanisms for its natural deposition, this issue is still a knowledge gap, and should be filled. It is important to note though, that the lobe increases waves off the river entrance and contributes to wave focussing at the Stockton erosion / nodal zone (Treloar, 1977; DHI, 2006)
The Hunter River training walls were constructed in 1846, which lead to the development of Nobbys Beach, as the walls interrupted the sand bypassing the river mouth, and into the Stockton compartment (Short, 2020) Since 2009 there has been on average 25,000 - 30,000 m3 yr-1 of sand dredged from the navigation channel of the Hunter River (estuary), predominantly around the breakwater heads, and deposited in about -8 m water depth off Stockton Beach (just offshore from the Mitchell St seawall). In addition to this obstruction of sand, the training walls have caused the southern shoreface of Stockton to steepen, because of the changes to the ebb tide delta, and channel depth around the river entrance (Umwelt, 2002; DHI, 2006). The walls have also caused the southern Stockton beach to realign itself, with the southern corner slightly seawards of the position in 1800’s (DHI, 2006). Southern Stockton has experienced erosion and recession since at least 1886 (Moratti, 1997), and the main mechanism for this ongoing sand loss appears to be an imbalance in littoral drift, particularly immediately north of the Mitchell street seawall. Majority of sand is being transported northwards, which much would then be lost into the active transgressive dunes found further north. While some sand may by bypassing Nobbys now, the area around the nodal point (Mitchell street seawall) has kept receding and will eventually threaten assets and infrastructure behind the beach environment (Short, 2020).
In terms of cross-shore processes, Stockton experiences periodic storm exchanges of sand, aeolian losses into the large transgressive dune fields, and possibly sand supply from the shoreface. Similar to the other compartments in this study, Stockton Bight receives semi-frequent storm waves that move sand to the nearshore (and form the double sand bar system present), which then slowly works its way back onto the beach during calmer conditions (Figure 2-8). Storm bites of 390 - 300 m3 m-1 have been estimated for Stockton Bight, however these are for extreme storm events (Gordon, 1977; Goodwin, 2015). There are also minor cross shore sand exchanges between the estuary inlet and the nearshore. For example, Horseshoe Beach accretion suggests some minor transport into the port (~3,500 m3 yr-1) (DHI, 2006).
Offshore supplies of sand may also be entering the Stockton compartment. The occurrence of prograded Holocene sand barriers along parts of the central / southern NSW coast, particularly where fluvial sources and alongshore sand transport are limited, suggests that shoreface sand supply was an important process during recent geological time, and may persist today (Kinsela, 2017) It was found for Stockton/ Newcastle Bight that is has a modern (1820 - 2010) net sand supply rate of 2.1 m3m-1yr-1 , which was derived from geohistorical records of the site, spanning the past several decades (Goodwin, 2015) Factoring in the alongshore supplies coming around Nobbys Head, and those being lost downdrift, approximately 66,780 m3 yr-1 of sand is potentially supplied to this compartment from the upper shoreface.
Stockton is an exposed, high energy system that has extensive mobile dunes which have been previously found to be transgressing inland at rates of up to 7 m yr-1 inland, as well as 3 m yr-1 northwards (Gordon and Roy, 1977; Short, 2020). Sand is continuing to move from the beach and into the dunes, owing to the degraded foredunes found along the length of the bight (and a result of frequent human / vehicle impacts) (Short, 2020).
Gordon and Roy (Gordon, 1977) estimated approximately 300,000 m3 yr-1 of sand is lost into the transgressive
dunes, with Roy and Crawford (1979) concluding that owing to the deficiency in the sediment budget from this large amount of sand lost, the beach recedes between 1 and 2 m yr-1 (Roy, 1979; Short, 2020). It should be noted that all these figures around sediment volumes have large error margins associated with them, and are just ballpark figures to help describe and understand the sediment transport processes occurring here
Like in Section 2.6.3, it should be noted that the sediment transport conceptual model for Stockton Bight (and sediment transport rates presented) are based solely on a literature review of previous studies (in 2020). A more detailed Stockton Bight Sediment Study has recently been completed for the City of Newcastle by Bluecoast (2020). Bluecoast (2020) should be used for a more contemporary, detailed and up to date understanding of the coastal processes and sediment transport patterns occurring within this secondary compartment. It should also be stated that all these figures around sediment volumes have large error margins associated with them, and are just average figures to help describe and understand the sediment transport processes potentially occurring here.
Active coastal dune systems are naturally dynamic and mobile systems that change over time through the action of wind. Windborne sediment transport drives changes in dune topography through the process of erosion and accretion. Transgressive coastal dune systems are a type of barrier dune that migrate landwards over time due to prevailing onshore winds. The movement of the sand dunes are influenced by wind direction, frequency and strength. Figure B-1 presents a schematic cross section that demonstrates typical transgressive dune. Newcastle Bight (Stockton Beach) has the largest actively mobile transgressive dune system on the NSW coastal zone.
Sand deposition can occur on the windward slope, causing the dune to build upwards (or accrete). Sand deposition can also occur on the leeward slope, causing the dune to build laterally (transgress) in a down wind direction. When the leeward slope becomes steepened to the angle of repose of dry sand (about 34°), sands literally fall (or slip) down the leeward slope and the dune moves forward as a whole (see Figure B-1). This over steepened leeward slope is also referred to as the dune ‘slip face’. The slip face depositional process (and dune form) is common for transgressive dunes built from prevailing onshore winds.

Dune erosion typically occurs on the windward slope of the dune. Progressive and persistent erosion can lead to formation of a dune deflation hollow along the downwind margins of the transgressive dune. This is a common feature within the Newcastle Bight transgressive dunes.
Sand drift is a known and documented “hazard” on the NSW coast, one that is required to be assessed when defining hazards in the coastal zone. Sand drift poses a nuisance where sand is being blown into developments, and a major risk where dunes are migrating to engulf houses and development.
Historically, the NSW Soil Conservation Service and others mitigated this risk by vegetating active and bare dunes, which captured and held the sand in place. This is suitable on a small(er) scale particularly for beaches with smaller sand dune reserves. However, there were some locations where stabilising the active dunes resulted in erosion of downdrift beaches because the coastal sand supply to these beaches occurred via the wind blowing sand along and through the active dunes.
Attendees
BMT: Tom Doyle TBD, Verity Rollason VR, Toby Devlin TD, Madelaine Broadfoot MB

Port Stephens Council: Jessica Morris JM, Kylie Kaye KK, Brock Lamont BL
DPIE: Stuart Young SY, Phil Watson PW, Neil Kelleher NK and David Hanslow DH
Can we record this workshop? Everyone agreed
Aims Intro
Introduction to Workshop: VR and TBD
Key outputs required
• Agree on methodologies (Bruun rule quick and simple? Inundation…) YES
• Identify any gaps, areas for further investigation YES
• Discuss key output needs (percentiles, overtopping, etc) YES and TBC
Items Discussed
• Conceptual model of open coast processes presented by TBD
• Erosion/Recession Modelling presented by TD
• Open Coast Inundation and Overtopping presented by TD
• Outputs required presented by TD
• Agree on methodologies (Bruun rule quick and simple? Inundation) presented by TD
• Identify any gaps, areas for further investigation
• Discuss key output needs (percentiles, overtopping, etc.)
Conceptual processes (diagram) – Open Coast (Stockton Bight and Anna Bay)
Stockton Bight Sediment Sources and Sinks
Stockton Barrier: Episodic Transgressive Dune Barrier
Sources: Offshore (C)? Longshore (D)?
Sinks: Aeolian losses (F), minor downdrift (G) (DH has recommended not to rule out)?
Exchange: Shoreline/ Nearshore – storm bite/ recovery (I)
TBD: Does the Hunter river provide sediment to Stockton bight?
DH: Port maintenance transfers sand from Nobbys to southern Stockton periodically. They have maintenance rescheme within the Port
SY: Since 2009 about 25 – 30 thousand cubes have been taken out of the Port. Peter Roy and another paper found that the hunter river is not providing a significant quantity of sediment to the compartment (Roy and Gordon/ Roy and Crawford, 1980 – Provided to BMT by SY)
TBD: Is sand bypassing the northern headland of Stockton beach?
DH: Would not rule it out but has not looked into it in great detail. Ian Goodwin has done a report on the onshore supply for beaches.
DH (phone chat Wed 13th May): History of Sand bypassing at Nobbys – started as a sea dumping licence - from OEH (at the time) – to place sand offshore → see Sediment Mobility Study (Worley Parsons) (Provided) → offshore sampling of mound of sand offshore of Nobbys breakwater and port (~120 M m3). In the early 2000s sand started bypassing Nobbys and accumulating in the entrance channel
now dumping on southern Stockton/ not offshore
Anna Bay Sediment Source and Sinks
Anna Barrier: Episodic Transgressive Dune Barrier
Sources: Offshore (C)?
Sinks: Aeolian losses (F)
Exchange: Shoreline/ Nearshore – storm bite/ recovery (I)
Fingal Bay Sediment Source and Sinks
Fingal Barrier: Receded Barrier – A Shorts Database
Sources: NULL Offshore (C)? None – closed system – sediment recirculates
Sinks: Aeolian losses (F), Downdrift (via spit leakage into northern systems during storms?)
Exchange: Shoreline/ Nearshore – storm bite/ recovery (I), Tertiary exchanges (Via spit – 5m water depth b/w sites)
Barriers: Mainland Beach/ pocket beaches
Sources: Offshore (C)? - minor
Sinks: Aeolian losses (F) (previously Zenith provided sand to Shoal Bay – but has ceased with recent vegetation stabilisation), Downdrift (G) – minor amounts
Exchange: Shoreline/ Nearshore – storm bite/ recovery (I)
SY: boat harbour is closed, what you are saying sound reasonable.
TBD: North of Fingal bay to Tomaree. What are the sources of sand? (shoreline and near shore exchange)
PW: they are very embayed – doesn’t think there is a lot going on that isn’t onshore and offshore
NK: Historically sediment was lost by aeolian processes to Shoal bay but since revegetation projects (Beach Improvement Program, 1990s) these areas have stabilised
PW: less sand is moving. There was previously headland bypassing into shoal bay, as above.
DH: LiDAR shows that south of Fingal is linked by the blow out of the spit.
Key Proposed methodology of using an altered Bruun rule approach
TD: Use a simple Bruun rule approach, reducing the accommodation space for beaches were a surplus of sand already occupies this space. Methodology will be conservative and a quick initial bruun rule investigation shows minimal areas impacted so no added value in more complex methodologies.
DH: This is approach is fit for purpose. What is the underpinning depth of closures? TD explained.
PW: Agrees with DH. Conceptually everything you have done here is fine but very conservative. You will need to justify this in the report. – Into the future a review at 10-year intervals will be required due to uncertainty in the science.
Key Output Requirements from E/R Modelling
BL: There is a spread of tenure at the open coast. BL Agrees that there is not a lot of high value assets but will need to consult some of these landowners here. Greatest impact will most likely be to recreational assets
TD: proposed that BMT would provide rough conceptual outputs and show council later so that the can figure out how they will use it.
SY: agrees with Toby. Likes the 50% percentile line and having the 10% and 1% will be good for council to assess there risk tolerance.
Storm Demand Approach of reducing Gamma Distribution based on wave model
TD: Use Gamma distribution for open coast storm demand in NSW and reduce based on wave energy transfer in BMT SWAN model.
SY: happy with this approach will need to justify. QU using 1 hour sigfig rather than 6 hour?
PW: this approach is suitable, and it’s fit for purpose.
DH- has used a weighted mean to approach for this and directionality is probably the most important and the main place to worry about is the southern end of Fingal. Tom Shand extreme wave height report which
SY: MHL has updated in 2018 “Extreme Wave height MHL 2017” - DH provided link to new document –
TD: Apply future SLR from IPCC SROCC RCP8.5 and add on waves from BMT SWAN model. Compare to previous values and justify in the context of the study.
DH: where are these RCPs from? Does flag that where the concern for a high value may need a high value Wave run up – will need some thought as water level will have a significant impact on the wave run up.
PW: refer to the Kiama comments. What you are suggesting is fit for purpose.
Output
SY: for overtopping it would be great to have a theoretical volume at the crest but unsure how you would do it or how rough it would be. An order of magnitude estimate.
TD: We can have a discussion down the track about how we can use the numbers on a map. Perhaps “categorical” values (high, moderate, minor…) to differentiate overtopping severities.
BL: at this section of coast it is not as important as the inner and outer coast. By putting numbers around it causes problems presenting the numbers in a different way is desirable. E.g. tier categorisation
Additional comments
DH- MHL 100y ARI for each of the ocean tide gauge report. Will send through the link
Actions
• BMT to proceed with erosion/recession modelling as discussed and to document methodologies/inputs in final report.
• BMT to investigate and document approach for wave transformation scaling of storm demand.
• BMT to further discuss/confirm with Council and SY key output requirements for inundation modelling based on some initial conceptual outputs. Confirmation of key outputs to derive from this (i.e. 50%, 10% and 1% exceedance).
• DH to provide Goodwin Report, 2015, as well as supplying Evans et al., 2000 - Nearshore – Inner Shelf Sediment Exchange on the NSW Central Coast (provided).
Key output required
• What do we agree on?
Confirmation of methodology → Tracking the position of the leading edge of the dune sheet / vegetation –using satellite imagery/ air photos Yes but include the extra photogrammetry at the north and discussions to be had with other land holder
• Identify key gaps or data sources available + Desired OUTPUT? Further discussions need to be had with land holders – but map the focus areas
Items Discussed
• Key methodology and data availability
• Mapping outputs: DPIE and Council expectations and requirements
Methodology
TBD: Limited photogrammetry, so suggested methods for transgressive dune investigation → Tracking the position of the leading edge of the dune sheet / vegetation – using satellite imagery/ air photos
PW: what are you trying to achieve?
BL-Crown and NP are pushing for this. As it covers their land tenure and dune transgression occurring into land parcels. Which has caused issues. And they want to know the rate and volumes of dune transgression.
DH- As well parks are interested in dune migration and uncovering of heritage listed items.
VR: Assessment of dune transgression at fern bay could be useful for a sanity check for the results here.
SY: other source of data Andy Short was employed in 2017 to study the potential impacts of quarries on the dunes. He found that the impacts were more from 4 WD. Parks has it.
PW: check with Bob Clout as there might be photogrammetry of the northern Stockton bight.
NK: there was a lot of money spent around tracking dune transgression around Anna Bay
Expected mapping outputs
JM: it might be worth consult the other land holders
BL: Just map the focus areas- where they are expecting dune transgression to impact
VR: we can provide initial mapping that council can share with land holders. We can provide a range rather than a number
• SY to try get BMT a copy of Andy Short study of dune impacts
• BMT to download the northern sub-section of photogrammetry at Stockton and get some rough volume transgression rates to add to the lead edge tracing
• BMT to investigate rates of encroachment by analysing aerial photography/satellite imagery. Approximate volumes to be investigated from limited photogrammetry
• Ranges of rates to be provided (quasi-probabilistic).
Key output required
• Confirmation of methodology- Will be formulated by BMT and need to be confirmed by council and SY
• Buffer distance agreement- Slight confusion but seemed that 100m was fine
• Output requirements- to talk to SY and council TBC
Items Discussed
• Exceptional needs Inner Port area relative to open coast
• GIS Toolkit methodology
• Mapping outputs: DPIE and Council expectations and requirements, including for a CVA
Discussion Points
Buffer distance agreement
Some confusion over requirement of buffer distance, but rationale explained by BMT. Buffer distance only an input for the distance over which wave runup is assumed to still apply – does not limit the influence of ‘still-water’ inundation.
SY: At inner port you might only get 50m of coast inundated so 100m might be fine
PW: Agreed as long are you justify it this is fine.
Output requirements
DH: A generally comment that the back end of Port Stephens is subject to tidal inundation. You need to think about how to present that. The way DPIE has been doing it. Is plotting up days when exceeding street levels now and how that will change into the future.
JM: thinks that this is one of the biggest risks for them and the community
BL: need to highlight were the priority areas are. Issues when roads are getting cut. Council need to cross check against their critical assets and Hunter water assets
TD: sounds that we can adopt exceedance levels (50%,10%, 1%) and confirm with council later on
PW: need to be careful not to over complicate it. Suggestion: don’t over complicate the issue as we need to be able explain the risk to the community. Keep it simple
TD: suggestion: We do the assessment with the same static levels as the northern side of the estuary (for Mid-Coast Council) and then use that to guide on key areas that may require a more detailed investigation as per DH’s comments.
PW: sounds excellent. Look into assets that are critical.
VR: will there be an issue with the open coast and estuary in terms of different selected sea-level rise numbers.
SY: you can use the same median value to link the estuary to the open coast.
PW: differences between open coast and estuary. Estuary we are trying to marry up with static
DH: I would take the existing gauge data and combine it with envelopes of uncertainty of sea level rise and apply it the WMA surface.
Inner Port Mapping
DH: If it’s probabilistic council has an assessment to under pin any future works that council wants to do. And could present inundation to the community as days per year.
SY: depth is important. You can have it in isolation.
TD: using the gauge data and taking the WMA surface to inform how that it changes in the estuary. We will need to put on static runup effects.
TD: Council does that add value for you needs?
BL: it has some value having a reality built into it
JM: agrees
SY: doing what Dave is talking about as a sensitivity test. And add the static SLR.
PW: this is a two-step process you want to rapidly identify areas that are at key hazard. No right way of doing this. But you need find what is fit for purpose in this area.
VR- There are two risks 1. tides and 2. storms these are managed differently.
TD: way forward- BMT will have a think about what council needs. Do something simple and for key areas and then do a focused area approach.
NK: agrees with this idea.
Additional Comments
BL: Hunter water has assets that may not be in councils’ layers
Actions
• BMT to confirm methodology with council. Methodology to be simple with ability to focus on key areas of concern if identified.
• Consideration of more frequent ‘nuisance flooding’ (as opposed to extremes) to be included
• BMT to confirm with council methodology outputs, I.e. depth/area mapping or frequency of indundation (days per year).
• Confirmation of mapping outputs to include how probabilistic values are reported (if required) and what outputs are most relevant considering potential to compare to open-coast methodology.
Key outputs required
• Exceptional needs relative to Inner Port
• Confirmation of methodology/scope / key processes- Same approach as Inner-Port
• Output requirements- more discussion to be had with Council
Items Discussed
• Exceptional needs Outer Port area relative to Inner Port?
• Coastal processes of Outer Port area
• Relevance of sediment processes in inundation mapping?
• Mapping outputs: DPIE and Council expectations and requirements, including for a CVA
BL: this is a high priority section for the community (Conroy park, Soldiers point). Owners and resident have tried to build their own ad-hoc coastal works.
BL Cont.: PS council is actively doing coastal management works at shoal bay/little beach boat ramp. Moving sand off Halifax point.
A defined methodology and priorities is really important here as people have different views of what the treatment should be for coastal protection treatment.
TD: BMT will develop a similar planned methodology for this as for the inner-port but what are the risk thresholds in the outer port relative to the inner port?
NK: agrees with TD. One size doesn’t fit all the port. During stage 2 it would be good to have a talk about the suitability of different types of treatments
TD: BMT to confirm in follow-up with council their needs for assessing inundation in this area and how to best consider hazard ‘thresholds’.
Port Stephens Sediment Sources and Sinks
AIM: looking at longer term processes driving sed movement
Sources: Offshore (C)? →minimal if any →further research needed; Updrift Supply (D) – minimal again
Sinks: Estuarine deposition (E) (ACTION: delete arrow E off JImmys), Aeolian losses (F) – limited, just off sandwave into sand split at Yaccabah; Downdrift losses (G). ACTION: Add info on dredging/ nourishment at Shoal Bay; ALSO, Corlette →limited bypassing around the headland →mgmt. occurring now where they moving sand build up near marina to eastern section of sandy point (eroding shoreline).
Exchange: Shoreline/ Nearshore (I) – storm bite/ recovery; Estuarine / FTD (H)
VR: Do we need an anthropogenic arrow for the sand movement from the upgraded boat ramp?
BL: difficult to say as not sure if this sand movement will continue into the future
SY: thinks in the immediate time frame that CMPs will continue to be reviewed and councils will protect the foreshore from erosion. And it will be very difficult to predict sand coming offshore and / or off the shoals/deltas
TBD: Are we getting any offshore sediment?
DH: million-dollar question! Conceptually there is linkage with the inner shelf and neighbouring beaches.
NK: it should be included on the conceptual model but the bottom line we don’t know.
----
JM: Smothering of sea sponges of sand is getting better
NK: During a nourishment campaign at shoal bay – it was dredged down to -7 at the entrance shoal and pumped the sand onto the eastern end of shoal bay. There was talk that it contributed to habitat destruction of the sponges.
----
TD: Conceptual model not relevant for inundation modelling (per se) but highly important for general Stage 2 identification of processes and feeds into potentially identify opportunities.
SY: around the bypassing of the two harbours. Council has a grant to redistribute sand to sandy point.
VR: anchorage point acting as a bit of a groin
JM: at kangaroo point Conroy Point a lot of erosion has occurred and white sandy beach was lost
----
VR: is there an interest or need for hazard mapping moving into stage 3.
JM: we are aware of where the problems are, and Council has management processes currently for outerport erosion. JM will talk to BL about this.
VR: the connectivity in terms of options
SY: question for council as when they want to do it
JM: including an implementation action
-----
TD: the conceptual model doesn’t have to answer all the questions, but it will be really important in moving into stage 3.
NK: they got money to dredge the short cut at Jimmies
DH: add a couple of arrows onto salamander bay, Pindimar and Soldiers point (western side)
JM: Kangaroo point a had a significant amount of erosion and ad-hoc illegal structures where put in.
----
TBD- So no fluvial supply from the rivers?
DH and NK agreed.
Additional Comments
DH - Are we considering run up in our inundation mapping? If so, MHL have released a report on PS which did produce some run up values, and they came up with different foreshore types around the bays (can contact DH for some resources if needed).
DH – Also consider how wave penetration into the port might change with CC and SLR
• BMT to confirm outer-port inundation methodology as per inner-port
• BMT to assume inundation modelling on a static coastline (not receeding), noting Council have a handle on erosion management in the outer-port currently.
• BMT to confirm with council exception output needs of this area as opposed to inner-port/open coast.
• BMT to finalise outer-port conceptual diagram as of key use for Stage 3 options assessments:
○ Add anthropogenic arrow within key areas (renourishment, etc.)
○ Add detail of arrows within Salamander Bay to Soldiers Point.
○ Flag possible source/sinks and unknowns, i.e. offshore sediment
M.N21295.001_PortStephens_Expert_WS_minutes_final

M.N21295.001_PortStephens_Expert_WS_minutes_final

All beach sediment systems are in a constant state of flux due to various processes either adding (accretion) or removing (erosion) sand from the beach system. These processes are highly complex and can interact with one another to cause sudden, or long-term continuous changes. While these systems are often ‘metastable’ (dynamically fluctuating, but returning to an average condition), they can be interrupted by permanent changes in the coastal processes, such as sea level rise, shifts in wind/wave directions, and any changes to the beach/shoreface system human construction and intervention.
The key driving processes of interest to the Port Stephens erosion hazard are as follows:
As waves approach the shore, they experience a friction effect from the bed. This friction effect reduces the energy of the wave and causes it to shoal up, and eventually to break. The shear stress on the bed can also cause sediments to move if it is strong enough to overcome the consolidation and weight of the sediment grains.
This creates a state that converges towards an ‘equilibrium profile’. If the shoreface is shallow enough to experience high enough shear-stresses to mobilise sediments then they will generally be suspended and pushed towards the beach. The theory shows that this profile should form an exponential curve proportional to the sediment grainsize (Dean, 1991) In reality, as the waves also rely on the shoreface profile, the target equilibrium profile will change as the sediment is reworked and the waves change in response. Moreover, as the water level (due to tide) and waves (due to wind) are not constant, the target equilibrium profile will adapt with time. As such, the equilibrium profile is a useful theory, but is a set of moving goalposts that may never be achieved.
Additionally, where large waves break nearshore, they can create undertow and rip currents that pull sediment from the beach offshore. During storms with elevated water levels this effect often occurs higher up the shoreface, creating a dune ‘scarp’. Sediments are drawn down to a depth beyond which sediment movement is minimal and creates a sand bar.
Many beaches experience a dynamic storm bite and recovery pattern where the nearshore sand bar is reworked back onto the beach in the weeks and months following a storm.
Cross-shore processes can be interrupted by submerged rocky reefs that do not converge towards an equilibrium profile. These features may be buried under normal conditions and become exposed during storms. Offshore breakwaters, artificial reefs and similar structures can result in similar effects, either by design or inadvertently. Seawalls and cliffs can also interrupt cross-shore processes as they limit the range of the shoreline retreat. Furthermore, waves incident on these features can create a scour effect at the toe. These scour effects mean that any shoreline retreat that reaches such a feature is often permanent as the shoreface effectively becomes vertical at this location.
Where the waves are incident at an angle to the beach, they can create the effect of pushing sediment along the beach. Often this process is steady, where the loss at one end is offset by a constant inflow from upwind. However, when the prevailing wind/wave direction changes over the long-term it can cause a beach rotation, which presents as accretion at one end of a beach and erosion at the other. In some cases, coastal currents that are not caused by wind-waves can also cause an alongshore movement of sediments.
Longshore processes are often constrained by rocky headlands, a process that can be artificially replicated with structures. The build-up of sediments behind such a feature can result in an accreting beach, or in a convex shoreface due to a surplus of sediments.
River and estuary entrances can also intercept sediments as they move alongshore, starving downwind beaches from this supply. As these entrances are sometimes dredged to maintain navigability, or scoured out during flooding, this effect can be temporarily increased.
Other processes can increase/decrease the supply of sediment to a beach but are usually considered minor relative to the wave/tide effects. Winds can cause beach sediments to be blown into a large sand-dune system, rivers can discharge large volumes of sediment during floods and organically derived calcium carbonate breakdown (from shells) can create an additional supply. Sediments can also be artificially extracted for sandmining or navigability.
Related to the above processes is the changes that can occur in response to permanently rising sea levels. As seas rise, the effective depths of the shoreface and estuarine entrances are increased. This creates an ‘accommodation space’ where sediment is deep enough to not be mobilised by the prevailing waves and currents so will stay there. As other processes move sediment into these areas, they will become caught and not be available for further transport. In the case of storm demand, some or all of the sediment that is eroded from the beach and dune system can become caught in the accommodation space, effectively causing the shoreline to permanently recede. Only when the accommodation space is filled will the recession process halt and return to a dynamically stable equilibrium.
This process assumes that regular sediment transport events occur, filling the accommodation space at the expense of the adjacent beach and dune. However, beaches with an existing surplus of sediment may experience no such recession at all, or in a localised area the accommodation space may be filled by sediment from outside of that beach system. Similarly, where the wave and current processes are significantly altered along with the sea level rise, the accommodation space may not eventuate. Finally, the presence of the accommodation space does not instantly result in shoreline recession. As this also requires ongoing sediment transport events, relatively calm and sheltered areas with minor erosive events will experience a significant lag (possibly decades to centuries) between the ‘creation’ of the accommodation space and the associated recession. This could be especially pronounced for beaches where the active part of the shoreface extends far offshore. In such scenarios many minor storm events may be able to effectively fill the nearshore part of the accommodation space but not have a great enough magnitude to mobilise sediments to deeper areas. In this case, the full extent of the possible recession will not be realised until a sufficiently large storm is encountered.
A traditional erosion/recession assessment approach involves developing parameterisations of each process and selecting appropriate values for each input (such as sea-level). This approach is inflexible in that it relies heavily on the selection of these input parameters and does not provide any understanding of the uncertainty associated with them.
To alleviate this limitation, a probabilistic (stochastic) model of the coastal erosion and recession hazard potential of the Port Stephens open coast has been developed following what is commonly referred to as a Monte Carlo approach. A Monte Carlo model uses probability distributions (ranges of values) for each parameter, based on the natural variability of the parameter (known as aleatory variability), or based on the uncertainty of that parameter (known as epistemic uncertainty). Therefore, instead of a single set of values being selected, many thousands of simulations are modelled, each with its own set of inputs randomly sampled from the distributions. The result is many thousands of outputs that form a probability distribution of erosion/recession hazard for the study area. The results can be interrogated to determine not just the likely shoreline erosion potential, but also the uncertainty and range of that hazard.
For this study, the set of input distributions was developed based on the literature review underpinning the development of conceptual models of the study area (see Section 2.6) and refined in a modelling expert workshop, the minutes for which are presented in Appendix C. Each distribution has been sampled one-million times (1,000,000), with the same number of outputs interpreted based on the percentage of simulations that exceed their magnitude (as exceedance probabilities). The model has been developed in the MATLAB programming platform (MATLAB, ver R2020a), which provides a random number generator (RNG) to rapidly select parameters and calculate the associated setback.
The response of the shoreface to sea level rise has been modelled using the Bruun Rule (Bruun, 1962) The Bruun rule assumes that the shoreface profile rises in line with the sea levels, and will retreat until the volume of set-back is equal to the accommodation volume. This model assumes that all other net inflows of sediment are negligible and that the sediment must come from the beach and dune part of the active profile. It also assumes that the shoreface is well-approximated by a Dean-type profile (Dean, 1991)
The Bruun rule relies on three key inputs, the sea level rise, the shoreface slope, and a ‘depth of closure’ (see Figure D-1) This depth of closure is the depth beyond which cross-shore sediment exchange is zero (or negligible) and will therefore not respond to sea level rise.
Shoreline recession (r) predicted by the Bruun Rile is given by:
where a (meters) is the sea level rise, B (meters) is the width of the bottom influenced by sea level rise extending to d (meters), where d is the depth of closure (or offshore limit to sand transport), and D (meters) is the depth to closure including the dune height. Both B and D can be calculated from the nearshore profile once d is known.
For this study, the Sea Level Rise component of the Bruun rule has been extracted from the IPCC RCP 8.5 projections, and the more contemporary SROCC report (levels downscaled to the Port Stephens region), and has been applied as a normal distribution within the model, as shown in Figure D-2, and described in Section 2.4.1, Section 3.2.3, and Appendix F

The shoreface slopes have been applied as Dean profiles (Dean, 1991) of the form:
Where x is the cross-shore distance and Z(x) is the depth associated with it. A and b have been calibrated for at least one cross-shore profile for each beach sub-compartment in the study area, based on the bathymetry

observed in the 2018 Marine LiDAR (DPIE, 2018) These cross-shore profiles were taken at several locations through each of the key beaches and are shown (along with the calibrated profiles) in Figure D-4 to Figure D-21
The depth of closure has been applied as a triangular distribution (Figure D-3) with bounds spanning from the Hallermeier littoral zone limit to the outer shoal depths (Hallermeier, 1981) based on the wave record at Crowdy Head (to 2017). This results in depths of closure from ~5m to ~35m respectively (for beach sand). Table D-1 outlines the minimum depth of closure values used for each beach, as well as the minimum and maximum Bruun Rule slope factor (B/D) at each beach.

These DOC values have been truncated by applying a maximum depth of closure where analysis of the crossshore profiles demonstrates existing natural controls on the sediment exchange (Table D-1). These appear as convex features in the shoreface profile and often coincide with the bounds of rocky substrate that restricts further sediment transport. The key location for this is Fingal Bay (cross-shore profile shown below in Figure D-8). The maximum depth seen within the bay is ~15m, with all sediment ‘held’ in the bay at this level by the rocky headlands.
These adjustments reflect a potential inappropriateness of the Bruun model for such constrained subcompartments. In reality, a ‘perched’ shoreface profile may have a surplus of sediment in the shoreface that can tolerate sea level rise without an associated shoreline recession. However, given that the Port Stephens open coast is at a relatively low risk of erosion (due to steep and well-developed dune systems and significant rocky features) it is considered fit-for-purpose and conservative to assume a Bruun-type recession effect for planning purposes. For site-specific impact assessments where higher levels of precision are required (or can be achieved as new data may become available in future), this approach should be revisited.
In the Port Stephens open coast area, no significant riverine or estuarine entrances exist that can intercept sediments and form an additional accommodation space.


The ‘fluctuating’ (storm demand) component of erosion corresponds to the natural short-term changes that largely occur in response to storm events. While such events may be a trigger or instigator of recession corresponding to sea level rise (by successive events taking more beach sediment into the shoreface accommodation zone), the fluctuating component only represents the volume that is likely to return to the beach after a period of stable conditions. This will usually be due to individual storms but may also include successive storm events that compound one another.
As it is assumed that this component is stable over the long-term, for the purpose of modelling coastal erosion hazard, the only factor of interest is an event that may occurs in the final year of the simulated period.
The fluctuating component used in the current modelling follows Kinsela et. al (2017), which used a gamma function derived based on earlier work by Gordon (2015) to define the storm demand for exposed open-coast beaches in NSW. This parameterisation was validated as fit-for-purpose by Kinsela et. al by comparing the predictions to observations of historical maximum erosion escarpments at exposed beaches.
As not all beaches within the study area are equally exposed to wave energy and the associated erosion hazard, scaling factors for the ‘exposure’ have been applied. These scaling factors have been based on the amount of wave energy that is able to make it to the nearshore areas rather than being dissipated or lost around headlands and shoals. Scaling factors on the fluctuating erosion component have been based on ratio

of significant wave height squared between the offshore and nearshore areas for a series of points along the coastline. This is a simplified approximation of wave energy, but is likely to provide an appropriate scaling factor for more sheltered beaches. This methodology is cautiously conservative as all offshore wave directions have been treated equally (see Appendix G) which may not represent the true exposure of some embayments. Adopted fluctuating erosion scaling factors are presented in Figure D-22
The volumes calculated by the above methodologies have been converted into appropriate erosion setbacks by applying the storm demand (in m³/m) to beach-normal profiles at 5m spacings along the shoreline as taken from the DEM above 0mAHD. The DEM has been developed based on LiDAR topographic survey data of the onshore areas at 1 m resolution for the Port Stephens and Newcastle regions. This data was collected by NSW Land and Property Information in 2012 (for Port Stephens and parts of Newcastle) and 2013 (for parts of Newcastle) This methodology allows equal storm demand volumes to result in varied setbacks along a beach where there may be breaks in the dune that would otherwise contain the erosion.

The open coast area of Port Stephens spans two different secondary sediment compartments, the Newcastle/Stockton Bight compartments and the Anna Bay compartment. Detailed photogrammetry is not available for the either compartment within the council boundary and as such a high level of precision on any ongoing sediment transport processes is unknown.
As shown in the conceptual model in Section 2.6.2, the Anna Bay region is made up of individual closed bay systems that are unlikely to exchange sediment via longshore processes. It is possible that shoreface supply or aeolian losses are driving a net sediment movement, however there is currently no existing data that could be used to confirm or quantify this. It is also likely that such terms would be minor relative to storm bite/recovery processes or a sea level rise recession response. As such, no additional sources or sinks have been added to the model within the Anna Bay compartment and these beaches are assumed to be meta-stable in the shortterm.
The Stockton beach system does have a noted longshore drift component of the order 20,000 – 30,000 m³/y moving predominantly northwards as shown in Section 2.6.3. In the north, it is likely that the build-up of sediment reaches a maximum and during large storm events sediment is able to bypass Birubi Point and move northwards. Additionally, Stockton is known to have significant exchange between the beach and the transgressive Stockton dune system due to aoelian transport. This may act as a net sink to the beach/shoreface system, but is likely to be offset by the longshore supply in the long-term. Detailed quantitative information on these net transport processes is unknown, though it is likely that they are minor relative to the significant storm exchange that would be experienced at this exposed beach. There is also no evidence significant erosion at the northern end of Stockton that would imply a long-term net deficit (in-fact there may be a short-term surplus of sediment). Finally, given that this area is generally more tolerant of erosion hazard given the significant dune system and lack of exposed assets in the coastal zone, there is limited sensitivity to the unknowns of potential net sediment movements. As such, no additional long-term cumulative effect has been applied to the erosion hazard modelling for the Stockton Beach system.
A key driver of uncertainty in erosion hazard analysis is the underlying geological influences. The study area is a complex mix of erodible sands, alluvial deposits, as well as high-level bedrock substrate and exposed rock cliffs. The methodology of the probabilistic erosion hazard model assumes that all topography is readily erodible and generally represents erodible sands. As such, a treatment has been applied to limit the erosion hazard extent where known bedrock deposits will limit the erosion hazard. To do this, a ‘likely bedrock’ extent has been developed and used to clip the extent of the erosion hazard so as to not extent into this area. This likely bedrock extent has been developed based expert judgement drawing on quaternary geological information (Roy, 1980), the Marine LiDAR from 2018 (DPIE, 2018) and recent aerial imagery taken from Nearmap. In many cases, clear rock and reef features can be seen in the Marine LiDAR, or the aerial imagery, as well as other hard structures that can limit erosion (e.g. seawalls). Where the topography or geological mapping suggests that bedrock may extent into an area, but the depth to the bedrock is unknown, it has been conservatively assumed that the overlying strata extend down to all depths that are likely to erode. Additionally, the study area contains regions of indurated sands (coffee rock), which may limit the erosion over the short-term (i.e. storm erosion) but will likely weather and erode over the longer-term (i.e. with recession).
These effects have not been accounted for within the modelling, and all such areas are assumed to erode as readily as beach sand.
These assumptions can be updated for site-specific studies by conducting detailed geotechnical investigations including boreholes and ground-penetrating radar (GPR) to determine accurate bedrock extents and depths.
Example exceedance probability curves for a central location at each beach within the study area are presented below. These outputs provide the basis for erosion hazard mapping presented in Appendix J


Aerial photography has been widely used in shoreline mapping, whereby a time series of proxy shoreline indicator positions are used to help explain shoreline changes and possible processes driving those changes (see (Moore, 2000; Hanslow, 2007; Doyle, et al., 2019) For example, studies have used different shoreline indicators (i.e. foredune volume) to assess shoreline stability, and potential sediment supply to the coast (see Doyle et al., 2019). This study has used the vegetation line proxy shoreline indicator to assess dune transgressionat Stockton Bight. This entails a series of vegetation line positions being digitised from a selection of georeferenced and orthorectified aerial photography of Stockton Bight. Aerial photos were captured for this beach irregularly between 1984 to 2020 and sourced from either Google Earth (GE), NSW Spatial Services or Nearmap (see Table 6-1). Earlier and more frequent imagery was available (to a degree), but due to funding limitations and resources available (to scan, and georeferenced to a usable accuracy) and the adequacy of existing/ acquired data, the selected images listed in Table 6-1 were utilised.
The aerial photographs sourced from Google Earth (GE) needed to be converted to a more usable form (i.e. georeferenced raster dataset), so they could be integrated into a GIS and used for calculation of dune transgression, and this was done through the following steps:
• GE image (.jpg file) saved with central GE placemark (.kmz file)
• GE image and GE placemark opened in TranzDEM
• TranzDEM locates, scales and rotates the GE image by means of the GE placemark and a Universal Transverse Mercator conversion and produces a georeferenced .gif image file
• image corner coordinates in WGS84 Longitude/Latitude produced during the georeferencing process are noted
• .gif image file opened in ArcMap and rectified using the image corner coordinates noted from TranzDEM
• this produces a .tif image file which is then assigned with the WGS84 Longitude/Latitude projection (this project opened and transformed the georeferenced .tif image to the projected coordinate system GDA2020, MGA Zone 56).
Once the two GE images were georeferenced, and all the listed aerial images (in Table 6-1) were in a GIS (i.e. ArcGIS / Map 10.8), the vegetation lines could be drawn or digitised for each of those images. The vegetation line for this project was defined as the interface between the most landward side of the transgressive dunes and stable/ tertiary vegetation. Figure 6-1 (inset) illustrates what is meant by this dune/ vegetation interface. Once the line was digitised for each image, any dune transgression could be measured, and resultant rates calculated. The Bight was split into four areas of interest (AOI), which are illustrated in Figure 6-1, and they are based on the shoreline orientation, human impacts, major dune morphological features. dune activity/ transgression, and study area boundaries. The areas of interest include: The Far north (pink); North (red); Middle (orange) and South (yellow) (Figure 6-1). It should be noted that by splitting the study area in to these four AOI, and having different rates of dune transgression along Stockton will result in discontinuities in the hazard zones. It was agreed that this was the best way to capture the changing rates of sediment movement along the bight (with the data available to use), and these types of issues are reflective of the types of future degrees of uncertainty involved in such investigations (see also Section 7 for more information).
Transgression was measured in a northerly direction, as well as the general direction of the transgression (generally northeast) (see Figure 6-1 inset). Up to 15 random points were selected for measurement in each AOI, and then recorded in Microsoft excel for further analysis (e.g. annual rate calculations).
For each AOI an average, upper and lower transgression rate was calculated, which basically divided the measured dune movement inland by 36 (i.e. the temporal range of the aerial images). These rates were then multiplied by 20 or 50 to estimate potential transgression hazard areas into the future and agree upon timeframes (2040 and 2070). 2100 rates were not mapped as these figures are associated with too many uncertainties to confidently map, or produce useful . To create our hazard maps, these rates, along with the digitised 2020 vegetation line were input into a GIS. The buffer tool (within the Analysis toolbox, ArcMap 10/.8) was used on the 2020 vegetation line, to project future dune transgression regions. For example, the 2040 transgression hazard areas for the North AOI used a 20, 60, and 100 m buffer on the 2020 vegetation line, to represent the lower (yellow), average (orange) and upper (red) transgression rates for that area.
The wind analysis was derived from a 63 year (1956 – 2020) wind record (speed and direction) from the Bureau of Meteorology (BOM), station number 061055, which is an Automatic Wind Station (AWS) situation in Newcastle, on Nobbys signal station Figure 6-7 illustrates the location of this station, and is was chosen in accordance with the World Meteorological Organization guidelines. That being, it was at 10m height from the ground (or higher), is within 30km of associated study site (i.e. Stockon Bight) and had at least 5 years of reliable wind records (Miot da Silva and Hesp 2010). The wind data, measured in meters per second (m. s-1) was analysed to obtain sand roses for the Stockton study site, so aeolian sediment drift potentials and direction could be compared (using the Fryberger and Dean 1979 methodology). A wind rose was also generated for this site to provide an overview of the dominant winds typically occurring for Stockon Bight, and this is shwon in Figure 6-7
The Fryberger and Dean (1979) method is a widely used method to determine potential sediment transport in aeolian environments (see Miot da Silva and Hesp 2010). The method makes use of historic wind records (speed and direction) to calculate the potential for sand drift, using several classes of wind velocity and direction. Potential errors related to this method are discussed in detail by Fryberger and Dean (1979), and Pearce and Walker (Pearce & Walker, 2005). Threshold velocity for sand transport was calculated following the methods outlined in Zingg (Zingg, 1953) and Belly (Belly, 1964). Threshold velocities vary from 9.28 m s-1 (southern Stockton) to 6.68 m s-1 (North Stokcton). The Fryberger and Dean (1979) method expresses the potential for sediment transport (Drift Potential – DP) in Vector Units (v.u) (Fryberger and Dean 1979; Pearce and Walker 2005).
Sand roses were made for only two kinds of approach winds: onshore winds and onshore plus alongshore (or oblique) winds, and drift potentials were calculated from those winds only (i.e. offshore winds were not included in DP and RDP calculations). These wind directions were included in this analysis, as they are the predominant types impacting foredune morphology and development (Delgado-Fernandez 2011; Davidson-Arnott et al. 2018). Thus, for Stockton Beach, with an average orientation of 156o (or south-southeast) the onshore winds were those that approached the study site at 112.5o and 202.5o, and the alongshore winds were those approaching between 67.5o and 112.5o, and 202.5o and 247.5o to the shoreline (Miot da Silva and Hesp 2010). Therefore, the sand roses in this study do not show the entire 16 direction classes, but just those that are deemed onshore and alongshore winds. The rest of the methodology for the wind analysis follows the same steps taken by Miot da Silva and Hesp (2010).
Dune Transgression Methodology and Mapping
Table E-1 Detailed rates of dune transgression for key timeframes including current, 2040, 2070 and 2120 for Stockton Bight.


In Planning for potential future inundation events there are four main components that are generally considered:
• Astronomical Tidal stage (i.e. high tide)
• Relative sea level rise (i.e. due to climate change or ground level change)
• Storm surge (combined effects of barometric pressure and wind setup effects)
• Wave setup/runup
On average, the study area experiences a moderate to high energy wave climate, it is exposed to a mean Hs of 1.6m (with Tp= 10 s) that originates principally from the southsoutheast, as swell waves (Short and Trenaman 1992; Turner et al. 2016). Superimposed on these background swell waves are storm events, which are distinguished by being over 3 m in significant wave height (Harley et al. 2010). These storm waves are also derived from several cyclonic systems, for southern NSW (which is where the study site is situated), the key systems producing major storm events include a combination of East coast cyclones (inc. Easterly Trough Lows), Midlatitude cyclones (from the south) and Mainland low pressure systems (Shand et al. 2011; Turner et al. 2016; Doyle 2019).
Previous studies have also shown that at inter-annual time scales, the wave climate can also be influenced by the El Niño/Southern Oscillation (ENSO) (Harley et al. 2011; Barnard et al. 2015), with La Niña periods producing a more energetic easterly wave climate, as opposed to El Niño periods, which typically produce less energetic, and more southerly wave climates. El Niño periods of the ENSO have been shown to also be associated with intense storm activity, which has increased in intensity in recent years, and has corresponded with large beach erosion, especially across the US West Coast (Barnard et al. 2017; Doyle, 2019).
It is important to understand wind and wave processes, as they are key drivers influencing sediment transport mechanisms on the coast, and hence needs to be considered when investigating coastal hazards. For example, while storm waves often produce devastating instantaneous damage and beach-dune erosion, the normal / calmer (or ‘ambient’) wave climate that continues post-storm is what is responsible for the beach and dune recovery, longer-term sediment delivery and shoreline orientation (i.e. swell waves bring sand back) (Ranasinghe et al. 2004; Harley et al. 2011; Mortlock and Goodwin 2015).
Tidal variation is the most easily observed variation in ocean water levels in most areas of the coast. Gravitational changes due to the rotating earth, sun and moon (and other ‘astronomic’ bodies) create a forcing on the oceans, which interact with local geographic features and create the resonances we refer to as ‘tide’.
Along the east coast of Australia, the tides typically follow a semi-diurnal (twice daily) pattern with two high tides and two low tides per day, corresponding to the rotation of the moon around the earth. As the position of the moon relative to the sun changes on a monthly scale (as seen in the phases of the moon), these high and low tides change in their amplitude throughout the month. This pattern is commonly known as the spring/neap cycle, with the spring tides occurring during the full and new moons when the sun and moon gravitational effects align, leading to the highest high-tides, and lowest low-tides at an approximately 14-day interval. Longer-term effects can also occur that relate to specific influences of the eccentricity of orbits and/or the relative angles of orbit to the earth’s axis. While much smaller than the semi-diurnal or the spring/neap effects, these can increase/decrease the tidal amplitudes over annual, or even less-frequent scales.
Astronomical tide effects can be used for tide prediction by calculating the relative amplitude and timing (phase) of each of these forcing components (constituents) using astronomic tidal analysis. This analysis is conducted by analysing tidal water level gauges and attempting to remove any non-astronomic effects. Relatively highquality predictions can be derived from long-term tide gauges and key levels (tidal planes) can be reported.
HAT Highest Astronomical Tide. The potential combination of all astronomic components. i.e. the highest astronomic high-tide possible.
Mean High Water Springs. The average high tide during spring tides.
Mean High Water. The average of all high tides.
Mean High Water Neaps. The average high tide during neap tides.
This study has adopted updated SLR numbers, based on the recent SROCC report by the IPCC, and the RCP 8.5 scenario for all modelled coastal hazards. Further detail about the adopted RCP scenario (RCP8.5) and projected localised SLR curves are shown in Section 2.4.1. For both erosion and inundation modelling, the Sea Level Rise component is represented as a normally distributed input of values from the SROCC report summarised in Table F-2, and Figure D-2.
For the purpose of coastal management planning in east coast Australia, it is suitable at this stage to adopt the most conservative RCP8.5. This represents a ‘business as usual’ pathway where limited success is achieved in reducing global carbon emissions. In the context of inundation risk, this represents sea level rise constantly accelerating throughout the 21st century and continuing to accelerate beyond 2100.
It should be noted that the sea level rise projections of the different RCPs are relatively similar prior to 2050, reducing the sensitivity for near-future planning horizons. With such potential catastrophic consequences, planning for excessive risk earlier is likely to be more cost-effective than insufficiently planning and requiring emergency mitigations with less time. As such, beyond 2050 it is more suitable to adopt the conservative ‘upper-bound’ values to prepare for longer-term mitigation/adaptation needs and revise down later if needed. It is therefore recognised that all assumptions based on sea level rise projections should be updated in the coming decades as the effects of the global effort to reduce emissions become clearer and as climate science is advanced.
Offshore from Port Stephens, the projected sea levels at key planning timeframes (present-day, 20-years, 50years and 100-years) relative to the 1986–2005 averages are shown in Table F-2
Ocean water levels can be increased or decreased relative to the notional astronomic tide level by local (nonplanetary) forces.
The most noticeable of these are those due to mesoscale and synoptic scale weather system such as different types of storms. In NSW, there are several modes of storms that commonly affect ocean water levels with subtle differences in their spatial scales, temporal scales and intensities (such as extra-tropical cyclones, east coast lows or tornados). Storms influence sea levels in two ways:
(1) By air pressure differences either lifting (low air pressure) or depressing (high air pressure) the ocean surface with the inverse barometer effect.
(2) By increased winds due to storm conditions creating a stress on the water surface that pushes water along, creating a so-called ‘setup’ in the direction that more water is being pushed, and a corresponding ‘set down’ in its wake. These effects are highly dependent on the wind direction and fetch length, as well as the nearby topographic features.
Beyond storms, other processes can have short-term impacts on sea-levels, such as geological releases of energy in earthquakes and landslips, or higher-order resonances of wind-waves, distant storms and seismic effects that interact with the continental shelf and the coastline (i.e. submarine landslides?).
These processes are all studied by using ‘Extreme Value Analysis’ (EVA). This methodology uses past observations of processes in an area to define a relationship between the magnitude of an event and its frequency. After a certain point (beyond normal tidal ranges), increasingly higher water levels occur at less and less frequent intervals. It is often the case that different ‘modes’ dominate different frequency ranges. For example in NSW, tidal water levels dominate the highest water levels expected in a typical day or week, mild storms may dominate over a monthly scale, and significant east-coast low conditions may dominate conditions that occur less frequently (once-in-a-generation events). Storms that persist longer than a tidal cycle are guaranteed to occur with at least one high-tide and therefore result in increases above astronomic tidal levels.
A fundamental problem with assessing the impacts of extreme events is that by their nature they are rare. It is therefore uncertain whether the largest event/s observed over a 100-year period (for example) is a 1-in-100year event, or whether that century was abnormally calm or extreme relative to an even longer-term record. It is also the case that the dominant modes and their associated magnitudes may increase or decrease over time (e.g. due to climate change) or operate in cycles of intensity over geological time-scales.
Not withstanding these uncertainties, longer-term datasets tend to provide robust estimates of extreme conditions. In the NSW context, the overall uncertainties in extreme water levels are lower than the uncertainties in future Sea Level Rise at this time.
For this study, observed extreme tidal water levels at the Fort Denison tide recorded have been analysed from 1965 to 2019. A peak-over-threshold (PoT) methodology was used to extract extreme events classed as water level peaks above 1 mAHD separated by a minimum 6-day period. These extremes have been fitted to a generalised pareto distribution for extrapolation. For each given ARI, the uncertainty bounds represent the 595 percentile range from a normal distribution around the mean. The results are shown in Figure F-1 and Table F-3
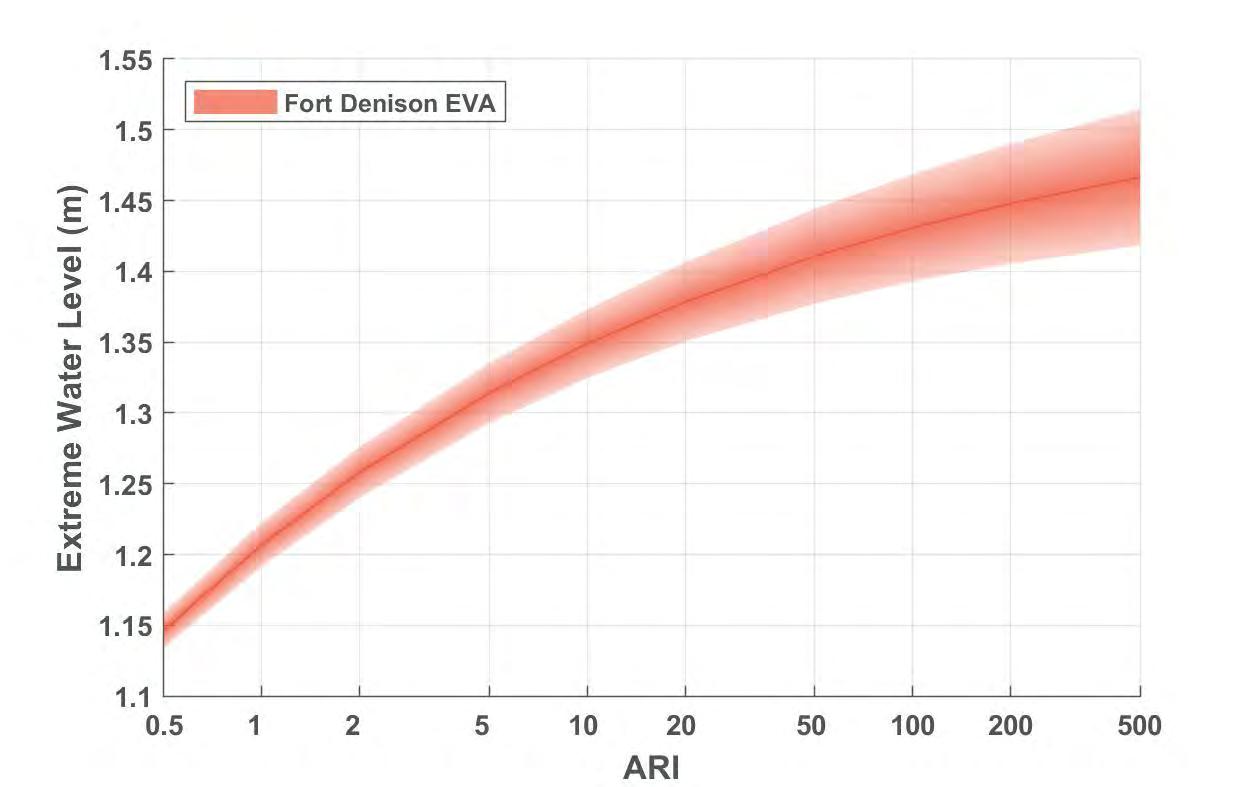
As wind waves approach the coast, they break and cause a release of the wave energy. This process generally serves to push water towards the shoreline, increasing water levels. There are two main components of this, a wave ‘setup’ associated with an increase in mean water levels near the coast due to breaking waves, and the wave ‘runup’, which is the effect of individual broken waves washing up the beach slope as swash.
These effects are very difficult to model accurately, with most methods deriving from empirical observations. The true effects change with each successive wave, and so are usually expressed as either the ‘maximum’ wave runup/setup effect or the 2% exceedance level over a given time period. Most empirical methods relate the wave runup to the wave height, wavelength (related to wave period) and the slope of the beach face at the water level.
In assessing wave runup effects for Port Stephens, two main approaches have been used. Within the estuary the levels have been taken from WMAWater (WMAWater, 2010), which used different methods for different sections of coastline to calculate key wave parameters and then applied the method of Nielsen and Hanslow (Nielsen & Hanslow, 1991) to calculate the wave runup.
Along the open coast, a spectral wave model was developed to calculate the relevant wave conditions using the modelling package SWAN (Delft University of Technology). The SWAN domain consisted of three levels of ‘nested’ grids at 800m, 200m and 50m resolutions respectively. These models were forced with offshore deep-water conditions taken from the Crowdy Head wave buoy extreme value analysis conducted by WRL (WRL, 2011). The applied conditions were the 6-hourly wave conditions, in order to ensure that they would coincide with a high-tide, and were taken at the same recurrence interval (ARI) as the storm tide (i.e. 100-year storm-tide combined with a 100-year wave height to calculate the wave runup level). The 100-year wave condition is not likely to be perfectly correlated with a 100-year storm-tide, however it is a conservative assumption and one that is commonly made.
These conditions were then interrogated nearer to the coast (beyond the surf zone) to extract the significant wave height and peak period to apply to the runup model of Stockdon et al. (Stockdon, et al., 2006). The beach slope varies along the each beach sub-compartment and may vary in response to future erosion and sea level changes, but a conservative value of 0.1 has been applied to all sections, which represents the upper-bound of existing beach slopes.
Wave conditions and associated runup levels are shown in Table F-4 for the wave extraction points shown in Figure G-1
Foreshore flooding within the estuary area is driven by a combination of catchment and coastal processes, which have been previously assessed in a series of studies. The catchment modelling completed in Stage 2 of the Port Stephens Flood Study (MHL, 1997) used the WBNM hydrological model and the MIKE-21 hydraulic model. The hydraulic model (MIKE-21) was used to output coastal flooding extents driven by storm surge and wave action. The modelling approaches and outputs in MHL (1997) are considered fit for purpose.
A review of flooding with respect to climate change was completed by WMAwater (WMAWater, 2010) which evaluated future flood levels based on ocean level rise affecting still water levels and wave runup levels. However, neither of these studies have undertaken any flood or risk mapping of these levels as detailed topographic and bathymetric information was not available at these times.
In assessing the impacts of sea level rise, WMAwater found that “increases in sea level will raise the design flood levels and wave runup levels by the same amount as the assumed ocean level rise”. Therefore, for the purpose of this study, projected sea level rise values have been added to the extreme water levels reported in WMAwater (2010), which were derived from MHL (MHL, 1997)
Design still water flooding levels were provided in WMAwater (2010) at point locations across the estuary foreshore, in addition to still water flood gradient maps. The WMAwater (2010) map was georeferenced in GIS and the flood gradient contours were digitised for the current study (see Figure F-3)
Additionally, MHL (1997) assessed wave runup levels throughout the estuary at 42 discrete points (shown in Figure F-2). These points are shown again in Figure F-3 along with polygons showing the corresponding sections of coastline to which each point has been applied for the purpose of wave runup inundation mapping.


In order to calculate appropriate inundation levels to assess for future planning timeframes, the various components of potential future inundation need to be combined. As each component is uncertain, a probabilistic approach has been used to incorporate the statistical distributions and derive a range of outputs based on certain likelihoods.
For each future timeframe (i.e. 2020, 2040, 2070, 2120), three different scenarios have been assessed:
(1) For Tidal Inundation: HAT, the highest astronomic tide, combining tidal effects and SLR. Areas inundated by the condition can be considered to be inter-tidal and therefore effectively regularly inundated. Note that no wave runup is added to HAT inundation levels as these levels can occur without any wind or wave activity.
(2) For Coastal Inundation (20-year ARI); This represents conditions that can be reasonably expected to be experienced within a lifetime, but it takes a large and rare event to do so. Statistically, these occur once on average in 20 years over a long period. However, they may occur multiple times in shortsuccession and then not for a long time. There is a ~62% chance of them occurring in any given 20year period.
(3) For Coastal Inundation (100-year ARI), this represents conditions that occur quite rarely. Inundation levels higher than this become substantially rarer and less certain. These conditions are often used to represent very high magnitude conditions for planning purposes. There is approximately a 1% chance of them occurring in any year.
Each of the coastal inundation scenarios have been calculated by combining the probability distributions of the storm-tide (or extreme sea levels) and the sea level rise. As described in sections F.4 and F.5, both of these can be described as normal distributions centred around a mean that is commonly reported as the given value. In order to probabilistically assess inundation extremes, these distributions can be added by an integral convolution of the normal distributions. The result is also a normal distribution with a mean and variance given as the sums of the means and variances of the input distributions. This relies on the assumption that there is no correlation between the sea level rise and storm tide distributions. While in reality there will be a small component of correlation due to the effects of existing sea level rise in the water level record, and/or any nonlinear interactions of water levels as they approach the shore, these effects are small (millimetres to centimetres) relative to the overall mean water level increases (meters). The use of the integral convolution negates the need for a stochastic sampling approach (so called ‘monte carlo’ simulation) and allows for exact percentiles to be extracted from the final distribution.
Constant wave setup/runup values have also been applied as additional offsets to the probabilistic still-water inundation levels for coastal inundation modelling. These have only been added in an area of ‘wave influence’ within 100m of the shoreline as described in Section F.6
The HAT levels (used for tidal inundation modelling) have been assumed to have a variance of zero (i.e. a constant distribution) when combined with SLR. Additionally, HAT levels have not been calculated with an additional increase due to wave runup as they are intended to represent a constantly inundated, inter-tidal area.
A wave model has been developed in the SWAN modelling package for the open coast Port Stephens area in order to translate offshore wave conditions (as recorded at the Crowdy Head wave buoy) into the nearshore. SWAN (Delft University of Technology, 2006) is a third-generation spectral wave model, which can simulate the generation of waves by wind, dissipation by white-capping, depth-induced wave breaking, bottom friction and wave-wave interactions in both deep and shallow water. SWAN simulates wave/swell propagation in twodimensions, including shoaling and refraction due to spatial variations in bathymetry and currents. This is a global industry standard modelling package that has been applied with reliable results to many investigations worldwide.
Three separate rectilinear grids have been developed to provide increasing resolution from offshore shelf conditions into nearshore areas. These grids are shown in Figure G-1, and span a 600m resolution regional extent, a 200m local extent, and a 50m extent resolving the small bays north of Stockton Beach.
Bathymetry has been inspected onto these domains based on the following sources (in order of precedence):
• NSW Marine LiDAR from 2018 (DPIE, 2018)
• Electronic Navigation Chart (ENC) Data for offshore areas, from the Australian Hydrographic Service AusENC Dataset.

Offshore wave conditions at the Crowdy Head wave buoy were applied as boundary conditions to the SWAN model to transform these into nearshore.
The 100-year and 20-year ARI \wave conditions at the Crowdy Head buoy were taken from the Extreme Value Analysis conducted by WRL (WRL, 2011). The 6-hour wave conditions were applied as they are likely to coincide with a high tide. The equivalent ARI storm tide level was applied to the SWAN model, which is likely to be a conservative estimate as the return intervals for storm tide and waves are not perfectly correlated. Wave periods were applied based on expert judgement after reviewing the peak periods of historical storm events as reported by WRL. This judgement was skewed towards higher wave periods which result in greater wave runup at the coast. Finally, as the Crowdy Head wave buoy does not record directions, these conditions were run at 15-degree increments ‘around the clock’ with the maximum nearshore wave conditions from any direction being adopted as an upper-bound estimate. The adopted conditions are shown in Table G-1
The inshore SWAN model output locations are shown in Figure G-1. At each location and for each ARI, the maximum inshore wave height from across the range of offshore directional scenarios was stored. A summary of the inshore wave transformation results is provided in Table G-2
The resulting outputs were used to develop relative weightings of wave energy penetration (as approximated by the square of the significant wave height, Hs 2). The larger of the effective weightings was adopted from the 20-year and 100-year outputs. The application of these weightings is also described in Appendix D (D.2.2).
The resulting nearshore wave conditions are shown in Table G-2, corresponding to output points shown in Figure G-1


Title:
LowerCI(95%Likelihood)
ExpectedInundation(50%Likelihood)
UpperCI(5%Likelihood)
BMTendeavourstoensurethattheinformationprovidedinthis mapiscorrectatthetimeofpublication.BMTdoesnotwarrant, guaranteeormakerepresentationsregardingthecurrencyand accuracyofinformationcontainedinthismap.
Filepath:I:\N21295.i.ajs_Port_Stephens_CMP_Stage2\QGIS\Project\PeakWaterDepths_OuterPort.qgz


Title:
LowerCI(95%Likelihood)
ExpectedInundation(50%Likelihood)
UpperCI(5%Likelihood)
CoastalInudation-ARI202020-OuterPort
BMTendeavourstoensurethattheinformationprovidedinthis mapiscorrectatthetimeofpublication.BMTdoesnotwarrant, guaranteeormakerepresentationsregardingthecurrencyand accuracyofinformationcontainedinthismap.
Filepath:I:\N21295.i.ajs_Port_Stephens_CMP_Stage2\QGIS\Project\PeakWaterDepths_OuterPort.qgz

Title:
LowerCI(95%Likelihood)
ExpectedInundation(50%Likelihood)
UpperCI(5%Likelihood)
CoastalInudation-ARI1002020-OuterPort I-3
BMTendeavourstoensurethattheinformationprovidedinthis mapiscorrectatthetimeofpublication.BMTdoesnotwarrant, guaranteeormakerepresentationsregardingthecurrencyand accuracyofinformationcontainedinthismap.
Filepath:I:\N21295.i.ajs_Port_Stephens_CMP_Stage2\QGIS\Project\PeakWaterDepths_OuterPort.qgz

Title:
LowerCI(95%Likelihood)
ExpectedInundation(50%Likelihood)
UpperCI(5%Likelihood)
CoastalInudation-ARI1002040-OuterPort
BMTendeavourstoensurethattheinformationprovidedinthis mapiscorrectatthetimeofpublication.BMTdoesnotwarrant, guaranteeormakerepresentationsregardingthecurrencyand accuracyofinformationcontainedinthismap.
Filepath:I:\N21295.i.ajs_Port_Stephens_CMP_Stage2\QGIS\Project\PeakWaterDepths_OuterPort.qgz

Title:
LowerCI(95%Likelihood)
ExpectedInundation(50%Likelihood)
UpperCI(5%Likelihood)
CoastalInudation-ARI202070-OuterPort
BMTendeavourstoensurethattheinformationprovidedinthis mapiscorrectatthetimeofpublication.BMTdoesnotwarrant, guaranteeormakerepresentationsregardingthecurrencyand accuracyofinformationcontainedinthismap.
Filepath:I:\N21295.i.ajs_Port_Stephens_CMP_Stage2\QGIS\Project\PeakWaterDepths_OuterPort.qgz

Title:
LowerCI(95%Likelihood)
ExpectedInundation(50%Likelihood)
UpperCI(5%Likelihood)
CoastalInudation-ARI1002070-OuterPort
BMTendeavourstoensurethattheinformationprovidedinthis mapiscorrectatthetimeofpublication.BMTdoesnotwarrant, guaranteeormakerepresentationsregardingthecurrencyand accuracyofinformationcontainedinthismap.
Filepath:I:\N21295.i.ajs_Port_Stephens_CMP_Stage2\QGIS\Project\PeakWaterDepths_OuterPort.qgz

Title:
LowerCI(95%Likelihood)
ExpectedInundation(50%Likelihood)
UpperCI(5%Likelihood)
BMTendeavourstoensurethattheinformationprovidedinthis mapiscorrectatthetimeofpublication.BMTdoesnotwarrant, guaranteeormakerepresentationsregardingthecurrencyand accuracyofinformationcontainedinthismap.
Filepath:I:\N21295.i.ajs_Port_Stephens_CMP_Stage2\QGIS\Project\PeakWaterDepths_OuterPort.qgz

LowerCI(95%Likelihood)
ExpectedInundation(50%Likelihood)
UpperCI(5%Likelihood)
CoastalInudation-ARI202120-OuterPort
BMTendeavourstoensurethattheinformationprovidedinthis mapiscorrectatthetimeofpublication.BMTdoesnotwarrant, guaranteeormakerepresentationsregardingthecurrencyand accuracyofinformationcontainedinthismap.
Filepath:I:\N21295.i.ajs_Port_Stephens_CMP_Stage2\QGIS\Project\PeakWaterDepths_OuterPort.qgz

Title:
LowerCI(95%Likelihood)
ExpectedInundation(50%Likelihood)
UpperCI(5%Likelihood)
BMTendeavourstoensurethattheinformationprovidedinthis mapiscorrectatthetimeofpublication.BMTdoesnotwarrant, guaranteeormakerepresentationsregardingthecurrencyand accuracyofinformationcontainedinthismap.
Filepath:I:\N21295.i.ajs_Port_Stephens_CMP_Stage2\QGIS\Project\PeakWaterDepths_OuterPort.qgz

LowerCI(95%Likelihood)
ExpectedInundation(50%Likelihood)

UpperCI(5%Likelihood)

LowerCI(95%Likelihood)
ExpectedInundation(50%Likelihood)

UpperCI(5%Likelihood)
LowerCI(95%Likelihood)
ExpectedInundation(50%Likelihood)

UpperCI(5%Likelihood)
LowerCI(95%Likelihood)
ExpectedInundation(50%Likelihood)

UpperCI(5%Likelihood)
LowerCI(95%Likelihood)
ExpectedInundation(50%Likelihood)

UpperCI(5%Likelihood)
LowerCI(95%Likelihood)
ExpectedInundation(50%Likelihood)

UpperCI(5%Likelihood)
LowerCI(95%Likelihood)
ExpectedInundation(50%Likelihood)

UpperCI(5%Likelihood)
LowerCI(95%Likelihood)
ExpectedInundation(50%Likelihood)

UpperCI(5%Likelihood)
LowerCI(95%Likelihood)
ExpectedInundation(50%Likelihood)

UpperCI(5%Likelihood)
LowerCI(95%Likelihood)
ExpectedInundation(50%Likelihood)

UpperCI(5%Likelihood)
LowerCI(95%Likelihood)
ExpectedInundation(50%Likelihood)

UpperCI(5%Likelihood)
LowerCI(95%Likelihood)
ExpectedInundation(50%Likelihood)

UpperCI(5%Likelihood)
LowerCI(95%Likelihood)


ExpectedInundation(50%Likelihood)
UpperCI(5%Likelihood)
LowerCI(95%Likelihood)

ExpectedInundation(50%Likelihood)
UpperCI(5%Likelihood)
LowerCI(95%Likelihood)
ExpectedInundation(50%Likelihood)
UpperCI(5%Likelihood)

LowerCI(95%Likelihood)

ExpectedInundation(50%Likelihood)
UpperCI(5%Likelihood)
LowerCI(95%Likelihood)
ExpectedInundation(50%Likelihood)
UpperCI(5%Likelihood)

LowerCI(95%Likelihood)
ExpectedInundation(50%Likelihood)
UpperCI(5%Likelihood)

LowerCI(95%Likelihood)

ExpectedInundation(50%Likelihood)
UpperCI(5%Likelihood)
LowerCI(95%Likelihood)

ExpectedInundation(50%Likelihood)
UpperCI(5%Likelihood)
LowerCI(95%Likelihood)
ExpectedInundation(50%Likelihood)
UpperCI(5%Likelihood)

LowerCI(95%Likelihood)

ExpectedInundation(50%Likelihood)
UpperCI(5%Likelihood)
LowerCI(95%Likelihood)

ExpectedInundation(50%Likelihood)
UpperCI(5%Likelihood)
LowerCI(95%Likelihood)

ExpectedInundation(50%Likelihood)
UpperCI(5%Likelihood)
Title:
LowerCI(95%Likelihood)
ExpectedInundation(50%Likelihood)
UpperCI(5%Likelihood)
BMTendeavourstoensurethattheinformationprovidedinthis mapiscorrectatthetimeofpublication.BMTdoesnotwarrant, guaranteeormakerepresentationsregardingthecurrencyand accuracyofinformationcontainedinthismap.
Filepath:I:\N21295.i.ajs_Port_Stephens_CMP_Stage2\QGIS\Project\PeakWaterDepths_SoldiersPt.qgz

Title:
LowerCI(95%Likelihood)
ExpectedInundation(50%Likelihood)
UpperCI(5%Likelihood)
CoastalInudation-ARI202020-SoldiersPoint
BMTendeavourstoensurethattheinformationprovidedinthis mapiscorrectatthetimeofpublication.BMTdoesnotwarrant, guaranteeormakerepresentationsregardingthecurrencyand accuracyofinformationcontainedinthismap.
Filepath:I:\N21295.i.ajs_Port_Stephens_CMP_Stage2\QGIS\Project\PeakWaterDepths_SoldiersPt.qgz

Title:
LowerCI(95%Likelihood)
ExpectedInundation(50%Likelihood)
UpperCI(5%Likelihood)
BMTendeavourstoensurethattheinformationprovidedinthis mapiscorrectatthetimeofpublication.BMTdoesnotwarrant, guaranteeormakerepresentationsregardingthecurrencyand accuracyofinformationcontainedinthismap.
Filepath:I:\N21295.i.ajs_Port_Stephens_CMP_Stage2\QGIS\Project\PeakWaterDepths_SoldiersPt.qgz

Title:
CoastalInudation-ARI202040-SoldiersPoint Legend
LowerCI(95%Likelihood)
ExpectedInundation(50%Likelihood)
UpperCI(5%Likelihood)
Filepath:I:\N21295.i.ajs_Port_Stephens_CMP_Stage2\QGIS\Project\PeakWaterDepths_SoldiersPt.qgz

PeakFloodDepth(m) <0.25 0.25to0.5 0.5to0.75 0.75to1.0 1.0to2.0 2.0to4.0 4-20
Title:
LowerCI(95%Likelihood)
ExpectedInundation(50%Likelihood)
UpperCI(5%Likelihood)
CoastalInudation-ARI1002040-SoldiersPoint
BMTendeavourstoensurethattheinformationprovidedinthis mapiscorrectatthetimeofpublication.BMTdoesnotwarrant, guaranteeormakerepresentationsregardingthecurrencyand accuracyofinformationcontainedinthismap.
Filepath:I:\N21295.i.ajs_Port_Stephens_CMP_Stage2\QGIS\Project\PeakWaterDepths_SoldiersPt.qgz

Title:
LowerCI(95%Likelihood)
ExpectedInundation(50%Likelihood)
UpperCI(5%Likelihood)
BMTendeavourstoensurethattheinformationprovidedinthis mapiscorrectatthetimeofpublication.BMTdoesnotwarrant, guaranteeormakerepresentationsregardingthecurrencyand accuracyofinformationcontainedinthismap.
Filepath:I:\N21295.i.ajs_Port_Stephens_CMP_Stage2\QGIS\Project\PeakWaterDepths_SoldiersPt.qgz

CoastalInudation-ARI202070-SoldiersPoint Legend
LowerCI(95%Likelihood)
ExpectedInundation(50%Likelihood)
UpperCI(5%Likelihood)
Filepath:I:\N21295.i.ajs_Port_Stephens_CMP_Stage2\QGIS\Project\PeakWaterDepths_SoldiersPt.qgz

PeakFloodDepth(m) <0.25 0.25to0.5 0.5to0.75 0.75to1.0 1.0to2.0 2.0to4.0 4-20
Title:
LowerCI(95%Likelihood)
ExpectedInundation(50%Likelihood)
UpperCI(5%Likelihood)
CoastalInudation-ARI1002070-SoldiersPoint
BMTendeavourstoensurethattheinformationprovidedinthis mapiscorrectatthetimeofpublication.BMTdoesnotwarrant, guaranteeormakerepresentationsregardingthecurrencyand accuracyofinformationcontainedinthismap.
Filepath:I:\N21295.i.ajs_Port_Stephens_CMP_Stage2\QGIS\Project\PeakWaterDepths_SoldiersPt.qgz

Title:
LowerCI(95%Likelihood)
ExpectedInundation(50%Likelihood)
UpperCI(5%Likelihood)
BMTendeavourstoensurethattheinformationprovidedinthis mapiscorrectatthetimeofpublication.BMTdoesnotwarrant, guaranteeormakerepresentationsregardingthecurrencyand accuracyofinformationcontainedinthismap.
Filepath:I:\N21295.i.ajs_Port_Stephens_CMP_Stage2\QGIS\Project\PeakWaterDepths_SoldiersPt.qgz
CoastalInudation-ARI202120-SoldiersPoint Legend
LowerCI(95%Likelihood)
ExpectedInundation(50%Likelihood)
UpperCI(5%Likelihood)
Filepath:I:\N21295.i.ajs_Port_Stephens_CMP_Stage2\QGIS\Project\PeakWaterDepths_SoldiersPt.qgz

PeakFloodDepth(m) <0.25 0.25to0.5 0.5to0.75 0.75to1.0 1.0to2.0 2.0to4.0 4-20
CoastalInudation-ARI1002120-SoldiersPoint Legend
LowerCI(95%Likelihood)
ExpectedInundation(50%Likelihood)
UpperCI(5%Likelihood)
PeakFloodDepth(m) <0.25 0.25to0.5 0.5to0.75 0.75to1.0 1.0to2.0 2.0to4.0 4-20

Title:
LowerCI(95%Likelihood)
ExpectedInundation(50%Likelihood)
UpperCI(5%Likelihood)
BMTendeavourstoensurethattheinformationprovidedinthis mapiscorrectatthetimeofpublication.BMTdoesnotwarrant, guaranteeormakerepresentationsregardingthecurrencyand accuracyofinformationcontainedinthismap.
Filepath:I:\N21295.i.ajs_Port_Stephens_CMP_Stage2\QGIS\Project\PeakWaterDepths_InnerHarbour.qgz


Drawing:
Rev:
Title:
LowerCI(95%Likelihood)
ExpectedInundation(50%Likelihood)
UpperCI(5%Likelihood)
CoastalInudation-ARI202020-InnerHarbour
BMTendeavourstoensurethattheinformationprovidedinthis mapiscorrectatthetimeofpublication.BMTdoesnotwarrant, guaranteeormakerepresentationsregardingthecurrencyand accuracyofinformationcontainedinthismap.
Filepath:I:\N21295.i.ajs_Port_Stephens_CMP_Stage2\QGIS\Project\PeakWaterDepths_InnerHarbour.qgz

Drawing:
Rev:
Title:
LowerCI(95%Likelihood)
ExpectedInundation(50%Likelihood)
UpperCI(5%Likelihood)
CoastalInudation-ARI1002020-InnerHarbour
BMTendeavourstoensurethattheinformationprovidedinthis mapiscorrectatthetimeofpublication.BMTdoesnotwarrant, guaranteeormakerepresentationsregardingthecurrencyand accuracyofinformationcontainedinthismap.
Filepath:I:\N21295.i.ajs_Port_Stephens_CMP_Stage2\QGIS\Project\PeakWaterDepths_InnerHarbour.qgz

Drawing:
Rev:
Title:
LowerCI(95%Likelihood)
ExpectedInundation(50%Likelihood)
UpperCI(5%Likelihood)
BMTendeavourstoensurethattheinformationprovidedinthis mapiscorrectatthetimeofpublication.BMTdoesnotwarrant, guaranteeormakerepresentationsregardingthecurrencyand accuracyofinformationcontainedinthismap.
Filepath:I:\N21295.i.ajs_Port_Stephens_CMP_Stage2\QGIS\Project\PeakWaterDepths_InnerHarbour.qgz


Drawing:
Rev:
Title:
LowerCI(95%Likelihood)
ExpectedInundation(50%Likelihood)
UpperCI(5%Likelihood)
CoastalInudation-ARI202040-InnerHarbour
BMTendeavourstoensurethattheinformationprovidedinthis mapiscorrectatthetimeofpublication.BMTdoesnotwarrant, guaranteeormakerepresentationsregardingthecurrencyand accuracyofinformationcontainedinthismap.
Filepath:I:\N21295.i.ajs_Port_Stephens_CMP_Stage2\QGIS\Project\PeakWaterDepths_InnerHarbour.qgz

Drawing:
Rev:
Title:
LowerCI(95%Likelihood)
ExpectedInundation(50%Likelihood)
UpperCI(5%Likelihood)
CoastalInudation-ARI1002040-InnerHarbour
BMTendeavourstoensurethattheinformationprovidedinthis mapiscorrectatthetimeofpublication.BMTdoesnotwarrant, guaranteeormakerepresentationsregardingthecurrencyand accuracyofinformationcontainedinthismap.
Filepath:I:\N21295.i.ajs_Port_Stephens_CMP_Stage2\QGIS\Project\PeakWaterDepths_InnerHarbour.qgz


Drawing:
Rev:
Title:
LowerCI(95%Likelihood)
ExpectedInundation(50%Likelihood)
UpperCI(5%Likelihood)
BMTendeavourstoensurethattheinformationprovidedinthis mapiscorrectatthetimeofpublication.BMTdoesnotwarrant, guaranteeormakerepresentationsregardingthecurrencyand accuracyofinformationcontainedinthismap.
Filepath:I:\N21295.i.ajs_Port_Stephens_CMP_Stage2\QGIS\Project\PeakWaterDepths_InnerHarbour.qgz

Drawing:
Rev:
Title:
LowerCI(95%Likelihood)
ExpectedInundation(50%Likelihood)
UpperCI(5%Likelihood)
CoastalInudation-ARI202070-InnerHarbour
BMTendeavourstoensurethattheinformationprovidedinthis mapiscorrectatthetimeofpublication.BMTdoesnotwarrant, guaranteeormakerepresentationsregardingthecurrencyand accuracyofinformationcontainedinthismap.
Filepath:I:\N21295.i.ajs_Port_Stephens_CMP_Stage2\QGIS\Project\PeakWaterDepths_InnerHarbour.qgz

Drawing:
Rev:
Title:
LowerCI(95%Likelihood)
ExpectedInundation(50%Likelihood)
UpperCI(5%Likelihood)
CoastalInudation-ARI1002070-InnerHarbour
BMTendeavourstoensurethattheinformationprovidedinthis mapiscorrectatthetimeofpublication.BMTdoesnotwarrant, guaranteeormakerepresentationsregardingthecurrencyand accuracyofinformationcontainedinthismap.
Filepath:I:\N21295.i.ajs_Port_Stephens_CMP_Stage2\QGIS\Project\PeakWaterDepths_InnerHarbour.qgz

Drawing:
Rev:
Title:
LowerCI(95%Likelihood)
ExpectedInundation(50%Likelihood)
UpperCI(5%Likelihood)
CoastalInudation-ARI202120-InnerHarbour
BMTendeavourstoensurethattheinformationprovidedinthis mapiscorrectatthetimeofpublication.BMTdoesnotwarrant, guaranteeormakerepresentationsregardingthecurrencyand accuracyofinformationcontainedinthismap.
Filepath:I:\N21295.i.ajs_Port_Stephens_CMP_Stage2\QGIS\Project\PeakWaterDepths_InnerHarbour.qgz

Drawing:
Title:
LowerCI(95%Likelihood)
ExpectedInundation(50%Likelihood)
UpperCI(5%Likelihood)
CoastalInudation-ARI1002120-InnerHarbour
BMTendeavourstoensurethattheinformationprovidedinthis mapiscorrectatthetimeofpublication.BMTdoesnotwarrant, guaranteeormakerepresentationsregardingthecurrencyand accuracyofinformationcontainedinthismap.
Filepath:I:\N21295.i.ajs_Port_Stephens_CMP_Stage2\QGIS\Project\PeakWaterDepths_InnerHarbour.qgz

Drawing:
Rev:
Title:
TidalInundation-HAT2020-TilligerryCreek Legend
ExpectedInundation(50%Likelihood)
UpperCI(5%Likelihood)
Filepath:I:\N21295.i.ajs_Port_Stephens_CMP_Stage2\QGIS\Project\PeakWaterDepths_TilligerryCreek.qgz

Drawing:
Rev:
I-61 A PeakFloodDepth(m) <0.25 0.25to0.5 0.5to0.75 0.75to1.0 1.0to2.0 2.0to4.0 4-20
Title:
LowerCI(95%Likelihood)
ExpectedInundation(50%Likelihood)
UpperCI(5%Likelihood)
Drawing:
Rev:
CoastalInudation-ARI202020-TilligerryCreek I-62 A
BMTendeavourstoensurethattheinformationprovidedinthis mapiscorrectatthetimeofpublication.BMTdoesnotwarrant, guaranteeormakerepresentationsregardingthecurrencyand accuracyofinformationcontainedinthismap.
Filepath:I:\N21295.i.ajs_Port_Stephens_CMP_Stage2\QGIS\Project\PeakWaterDepths_TilligerryCreek.qgz

Title:
LowerCI(95%Likelihood)
ExpectedInundation(50%Likelihood)
UpperCI(5%Likelihood)
CoastalInudation-ARI1002020-TilligerryCreek
BMTendeavourstoensurethattheinformationprovidedinthis mapiscorrectatthetimeofpublication.BMTdoesnotwarrant, guaranteeormakerepresentationsregardingthecurrencyand accuracyofinformationcontainedinthismap.
Filepath:I:\N21295.i.ajs_Port_Stephens_CMP_Stage2\QGIS\Project\PeakWaterDepths_TilligerryCreek.qgz
Drawing:

PeakFloodDepth(m) <0.25 0.25to0.5 0.5to0.75 0.75to1.0 1.0to2.0 2.0to4.0 4-20
Title:
Drawing:
Rev:
TidalInundation-HAT2040-TilligerryCreek I-64 A Legend
LowerCI(95%Likelihood)
ExpectedInundation(50%Likelihood)
UpperCI(5%Likelihood)
Filepath:I:\N21295.i.ajs_Port_Stephens_CMP_Stage2\QGIS\Project\PeakWaterDepths_TilligerryCreek.qgz

Title:
LowerCI(95%Likelihood)
ExpectedInundation(50%Likelihood)
UpperCI(5%Likelihood)
Drawing:
Rev:
CoastalInudation-ARI202040-TilligerryCreek I-65 A
BMTendeavourstoensurethattheinformationprovidedinthis mapiscorrectatthetimeofpublication.BMTdoesnotwarrant, guaranteeormakerepresentationsregardingthecurrencyand accuracyofinformationcontainedinthismap.
Filepath:I:\N21295.i.ajs_Port_Stephens_CMP_Stage2\QGIS\Project\PeakWaterDepths_TilligerryCreek.qgz

Title:
LowerCI(95%Likelihood)
ExpectedInundation(50%Likelihood)
UpperCI(5%Likelihood)
Drawing:
Rev:
CoastalInudation-ARI1002040-TilligerryCreek I-66 A
BMTendeavourstoensurethattheinformationprovidedinthis mapiscorrectatthetimeofpublication.BMTdoesnotwarrant, guaranteeormakerepresentationsregardingthecurrencyand accuracyofinformationcontainedinthismap.
Filepath:I:\N21295.i.ajs_Port_Stephens_CMP_Stage2\QGIS\Project\PeakWaterDepths_TilligerryCreek.qgz

Title:
LowerCI(95%Likelihood)
ExpectedInundation(50%Likelihood)
UpperCI(5%Likelihood)
BMTendeavourstoensurethattheinformationprovidedinthis mapiscorrectatthetimeofpublication.BMTdoesnotwarrant, guaranteeormakerepresentationsregardingthecurrencyand accuracyofinformationcontainedinthismap.
Filepath:I:\N21295.i.ajs_Port_Stephens_CMP_Stage2\QGIS\Project\PeakWaterDepths_TilligerryCreek.qgz

Drawing:
Rev:
Title:
LowerCI(95%Likelihood)
ExpectedInundation(50%Likelihood)
UpperCI(5%Likelihood)
CoastalInudation-ARI202070-TilligerryCreek
BMTendeavourstoensurethattheinformationprovidedinthis mapiscorrectatthetimeofpublication.BMTdoesnotwarrant, guaranteeormakerepresentationsregardingthecurrencyand accuracyofinformationcontainedinthismap.
Filepath:I:\N21295.i.ajs_Port_Stephens_CMP_Stage2\QGIS\Project\PeakWaterDepths_TilligerryCreek.qgz
Drawing:

Title:
LowerCI(95%Likelihood)
ExpectedInundation(50%Likelihood)
UpperCI(5%Likelihood)
CoastalInudation-ARI1002070-TilligerryCreek
BMTendeavourstoensurethattheinformationprovidedinthis mapiscorrectatthetimeofpublication.BMTdoesnotwarrant, guaranteeormakerepresentationsregardingthecurrencyand accuracyofinformationcontainedinthismap.
Filepath:I:\N21295.i.ajs_Port_Stephens_CMP_Stage2\QGIS\Project\PeakWaterDepths_TilligerryCreek.qgz
Drawing:

Title:
LowerCI(95%Likelihood)
ExpectedInundation(50%Likelihood)
UpperCI(5%Likelihood)
BMTendeavourstoensurethattheinformationprovidedinthis mapiscorrectatthetimeofpublication.BMTdoesnotwarrant, guaranteeormakerepresentationsregardingthecurrencyand accuracyofinformationcontainedinthismap.
Filepath:I:\N21295.i.ajs_Port_Stephens_CMP_Stage2\QGIS\Project\PeakWaterDepths_TilligerryCreek.qgz

Drawing:
Rev:
Title:
LowerCI(95%Likelihood)
ExpectedInundation(50%Likelihood)
UpperCI(5%Likelihood)
CoastalInudation-ARI202120-TilligerryCreek
BMTendeavourstoensurethattheinformationprovidedinthis mapiscorrectatthetimeofpublication.BMTdoesnotwarrant, guaranteeormakerepresentationsregardingthecurrencyand accuracyofinformationcontainedinthismap.
Filepath:I:\N21295.i.ajs_Port_Stephens_CMP_Stage2\QGIS\Project\PeakWaterDepths_TilligerryCreek.qgz
Drawing:

Title:
LowerCI(95%Likelihood)
ExpectedInundation(50%Likelihood)
UpperCI(5%Likelihood)
CoastalInudation-ARI1002120-TilligerryCreek
BMTendeavourstoensurethattheinformationprovidedinthis mapiscorrectatthetimeofpublication.BMTdoesnotwarrant, guaranteeormakerepresentationsregardingthecurrencyand accuracyofinformationcontainedinthismap.
Filepath:I:\N21295.i.ajs_Port_Stephens_CMP_Stage2\QGIS\Project\PeakWaterDepths_TilligerryCreek.qgz


Reference: P.N21295.003.02_PortStephens_CSA_final.docx
Date: June 2021
Confidential
BMT Commercial Australia Pty Ltd Level 1, 161 King Street Newcastle NSW 2300 Australia

Tel: +61 2 4940 8882
Fax: +61 2 4940 8887
ABN 54 010 830 421
www.bmt.org
Synopsis:
REVISION/CHECKING
Document: P.N21295.003.02_PortStephens_CSA_fin al.docx

Title: Port Stephens Coastal Structures Audit
Project Manager: Luke Lyons
Author: Luke Lyons
Client: Port Stephens Council
Client Contact: Jessica Morris
Client Reference: RFQ34-2019
Copyright and non-disclosure notice

The contents and layout of this report are subject to copyright owned by BMT Commercial Australia Pty Ltd (BMT CA) save to the extent that copyright has been legally assigned by us to another party or is used by BMT CA under licence. To the extent that we own the copyright in this report, it may not be copied or used without our prior written agreement for any purpose other than the purpose indicated in this report.
The methodology (if any) contained in this report is provided to you in confidence and must not be disclosed or copied to third parties without the prior written agreement of BMT CA. Disclosure of that information may constitute an actionable breach of confidence or may otherwise prejudice our commercial interests. Any third party who obtains access to this report by any means will, in any event, be subject to the Third Party Disclaimer set out below.
Third Party Disclaimer
Any disclosure of this report to a third party is subject to this disclaimer. The report was prepared by BMT CA at the instruction of, and for use by, our client named on this Document Control Sheet. It does not in any way constitute advice to any third party who is able to access it by any means. BMT CA excludes to the fullest extent lawfully permitted all liability whatsoever for any loss or damage howsoever arising from reliance on the contents of this report.
Commercial terms
BMT requests the ability to discuss and negotiate in good faith the terms and conditions of the proposed terms of engagement, to facilitate successful project outcomes, to adequately protect both parties and to accord with normal contracting practice for engagements of this type.
M:\WBM\1730_PtStephensAudit\001_AudFrshrStruc\3Dvrbles\3.1Rprts\P.N21295.003.02_PortStephens_CS

BMT was commissioned by Port Stephens Council (PSC) to carry out an update audit of existing foreshore protection structures as part of their Stage 2 Coastal Management Program (CMP). The audit provides insight into the condition and functionality of the coastal structures to assist PSC with ongoing maintenance activity including planning of remediation and repair. This audit included a desktop review on the existing information, gap analysis, visual condition assessment and multicriteria risk assessment.
The audit of existing foreshore protection structures involved an assessment of the waterfront structures at Port Stephens, comprising approximately 6200m of authorised seawalls and 3000m of un-authorised seawalls. The audit excluded all jetties and boat ramp-associated structures, both public (‘authorised’) and private (‘unauthorised’).
This audit report presents the findings of an assessment that was undertaken as part of the Port Stephens Stage 2 CMP. It forms Appendix H of the main study report. For a more detailed description of the site locality and purpose of the overall study, readers are referred to the contents of that report.
The objectives of the audit of PSC’s foreshore protections structures included:
• Identify fitness of existing information
• Document condition and suitability of foreshore structures
• Identify remediation priorities of foreshore structures.
The outcomes of the risk-based assessment of the existing structures form a knowledge baseline for future assessments and provide guidance to PSC for prioritisation of maintenance and remedial works.
The evaluation process adopted for this audit was performance based; initially assessing the functionality and then the condition of each structure by:
• Desktop review of the infrastructure within the coastal context to establish the functional benchmark for each structure;
• Condition assessment against the functional benchmark, and;
• Gap analysis and limitations review to highlight any identified issues having a bearing on the condition assessment.
Using this approach made it possible to identify the performance requirements for each structure and evaluate whether each structure was in a condition sound enough to provide the intended performance. Through this approach, the structure's loss of function due to deterioration determined
M:\WBM\1730_PtStephensAudit\001_AudFrshrStruc\3Dvrbles\3.1Rprts\P.N21295.003.02_PortStephens_CS
the need for remediation, rather than only considering the difference between current structure condition and the as-built condition.
The structure's functional performance is the most critical portion of the audit, with the physical condition playing a related but subordinate role. The performance of each structure was assessed how well it protected nearby structures and the foreshore or portions of itself, from wave attack, or coastal erosion damage. Groynes, however limited in this assessment, were also assessed on how well the structure-controlled movement, build-up, and/or loss of sediment within navigation areas and along adjoining shorelines.
To establish performance expectations, information provided on the existing foreshore structures (Table 1-1) was collated and reviewed. Two of the main gaps in information were identified at this stage for the majority of foreshore structures. These included:
• minimal to no as-built design records were able to be provided; and
• no detailed survey of existing structures was able to be provided.
In the absence of this detailed baseline data, BMT adopted the use of site observations and LIDAR (laser imaging, detection, and ranging) survey data to approximate functional performance for each foreshore structure. This approach has its limitations, which are described further in Section 1.2.2.
The original project brief included the task to update audit of the suitability of existing foreshore protection structures. Information provided for review did not include any prior audit of the structures.
M:\WBM\1730_PtStephensAudit\001_AudFrshrStruc\3Dvrbles\3.1Rprts\P.N21295.003.02_PortStephens_CS
Assessment of seawall performance is primarily a judgement of whether the structure can protect the area landward of the structure during anticipated ambient and extreme conditions, and whether in the course of this duty the structure is able to resist destructive forces and retain the structural integrity.
In assessing the performance of each structure, the primary criterion was the risk of overtopping and coastal inundation, with the performance index included as a rating out of 100, using the methods outlined in Van der Meer (2018) and CIRIA (2007). These manuals address various types of structures, providing direction on how to predict mean overtopping discharge for a range of structure geometries, using hydraulic and geometric parameters as input.
The discharges were calculated by applying the combined extreme water levels, astronomic tide levels and projected sea level rise (SLR) conditions probabilistically for each of the future planning years (2020, 2040, 2070 and 2120). The SLR component has been based on the latest projections of SLR from the IPCC SROCC report, using the conservative RCP8.5 scenario (IPCC, 2019). Details of this determination of water levels has been provided in Section 5.2 of the Port Stephens Coastal Management Program- Stage 2.
The wave conditions applied have been extracted from WMAWater (WMAWater, 2010), which used different methods for different sections of coastline to calculate key wave parameters. A spectral wave model was also developed to calculate the relevant wave conditions using the modelling package SWAN (Delft University of Technology). However, limitations on scoping for this portion of works meant that no hindcasting could be conducted and as a result, the preliminary findings based on the limited spectral wave modelling were overly conservative, producing unrealistic results to inform the performance assessment.
Geometric parameters for the structures were limited to those that could be derived from the available LIDAR data, augmented by observations made during site inspections. Geometric influences on the hydraulic input were taken into account in the assessment (for example, accounting for depth-limited waves in areas where the front of the foreshore structure was shallow for a significant distance offshore).
Although Van der Meer (2018) provides guidance on overtopping processes and tolerable discharges (including overtopping discharges), USACE (2011) illustrates critical values of the average overtopping discharge in a table that is more applicable for the variety of structures in this study (Figure 1-1). Performance ratings were then calculated based on the levels of allowable discharge volumes illustrated in Figure 1-1, expressing the results of the assessment numerically to provide a baseline for future assessment and maintenance management.
The following assumptions/limitations were applied in the assessment:
• Representative values of wall crest and toe elevations, and slope, are applied to each listed asset
M:\WBM\1730_PtStephensAudit\001_AudFrshrStruc\3Dvrbles\3.1Rprts\P.N21295.003.02_PortStephens_CS
• Wall roughness and permeability is estimated from categorisation carried out in the field and from photographs
• Influence of wave incidence angle is not included in the assessment
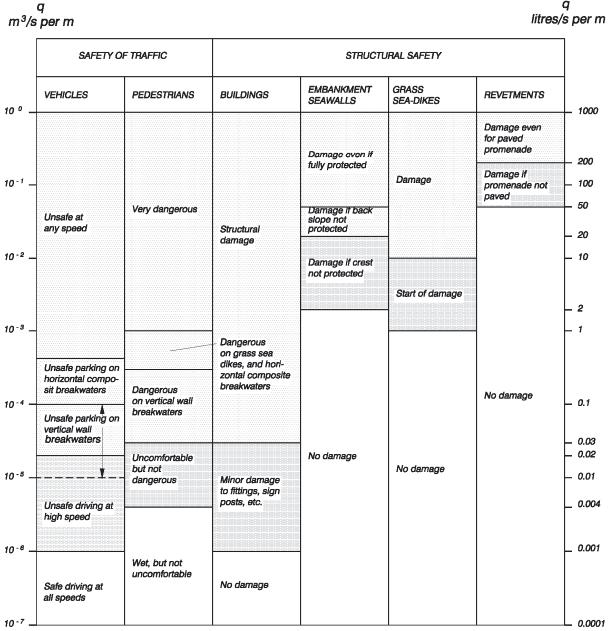
• The outcomes from the overtopping assessment are hazard levels for individual assets which are scaled relative to each other only. The assessment results should not be used for further detailed design or planning processes.
The future performance of the coastal structures is based on the desktop performance assessment and condition assessment. The performance values were moderated using engineering judgement and consideration of current structural condition to identify assets that are anticipates to not perform adequately at each of the future planning years (2020, 2040, 2070 and 2120).
M:\WBM\1730_PtStephensAudit\001_AudFrshrStruc\3Dvrbles\3.1Rprts\P.N21295.003.02_PortStephens_CS
While the performance assessment provides general extent of the risk associate with each coastal structure, a more detailed analysis and valuation of existing assets and council managed land provides a more direct pathway for strategic decision making of the areas at risk.
The audit of foreshore structures has been developed based on a variety of inputs not without its limitations. The desktop review of information identified several key limitations that influence the results of this study which are described below:
(1) After a review of available data, it was established that there was insufficient survey data to complete all parts of the desktop assessment. To fully assess the level of remaining functionality of each structure, survey data for key parameters (toe and crest levels) are required, as they are directly related to the level of overtopping discharge and undermining failure of the structure. Although the 2012 1m LiDAR digital elevation model (DEM) could be sourced from Land and Property Information (LPI), the resolution of this data meant a large increase in uncertainty associated with the aspects of the structure assessments depending on elevation and geometry. Additionally, the 1m LIDAR DEM was dated as 2012 and did not include bathymetry data to define seabed level at the toe of the structures. A 5m LIDAR bathymetric DEM (2018 NSW Marine LiDAR) was also available, however the coarse resolution (vertical and horizontal accuracy of 0.5m) of the DEM also introduced uncertainty in estimated overtopping discharge rates. To address these information gaps BMT recommended to PSC that a feature survey of the structures be carried out to facilitate greater confidence in outcomes from the audit. Budgetary constraints prohibited this survey within the Stage 2 CMP. Consequently, the performance assessment has a large confidence interval as a change of 0.25m in estimated crest or toe elevation results in a complete grade change (in the order of 10 performance indices points) and may affect the maintenance prioritisations.
(2) Lack of as-built records, survey, or design drawings for many of the structures resulted in rock stability assessments being relatively crude, with site observations determining the geometric inputs for performance assessment. Similar to Limitation-1, the inaccuracies associated with this approach are significant enough to shift performance results by a complete grade change (in the order of 10 performance indices points), subsequently effecting the maintenance prioritisations.
(3) Following review of existing information, it was established that very little (essentially nil) information on baseline condition existed, excluding an excel spreadsheet which noted minor geometric conditions. Having no prior condition assessment or inspection results made available meant it was difficult to give an accurate prediction on the expected remaining design life, as no rate of deterioration could be established. While detailed visual observations were made by a suitably experienced engineer, early/hidden signs of deterioration may have not been evident or observed.
Visual inspections of the foreshore protection structures were carried out on the 4th, 5th and 6th of August 2020 at a variety of water levels to ensure the most critical components of the coastal
M:\WBM\1730_PtStephensAudit\001_AudFrshrStruc\3Dvrbles\3.1Rprts\P.N21295.003.02_PortStephens_CS
structures could be safely assessed. The inspections were undertaken from the shore, making use of vantage points where possible. A minimum of three high-resolution photos were captured for each structure. Key photographs were selected for inclusion in this report to illustrate the noted high level observations of each structure.
It is noted that the inspections were limited to visual examinations only, with no intrusive investigations (e.g. drilling) conducted. Defects only detectable using such methods may not have been captured along with their potential to impact the structural stability.
For the purposes of inspection and reporting, the seawall segments are subdivided into reaches, each of which is reported on separately. This allows greater ease in specifying location of individual defects and parcelling of future remediation works. Subdivision into reaches was conducted in accordance with the USACE Condition and Performance Rating Procedures for Rubble Breakwaters and Jetties (1998), with divisions located at changes in seawall type, material type, function, and restricting the maximum reach length to approximately 100m. Maps showing reach subdivisions and discrete structures are presented in Appendix A. The maps also show colour-coded results from the condition assessment. The nomenclature for reach identities was derived by abbreviating the location of the seawall, and a sequential numbering system based on reach (R) or sub-reach (SR). For example, the first 100m sub-reach of Little Beach Reserve Seawall was denoted LBRS-R1-SR1.
Similar to the performance index, the structural index is a rating out of 100, determined using the USACE revetment rating system, and aggregates indices from the inspection into a single score.
The following information was documented during the condition assessment information:
• Date, time, location, and tide level at the time of inspection
• Type of seawall and a description of the area beyond and adjacent
• Condition of the seawall from an engineering perspective (refer Section 2.2.)
• Assets supported and protected by the wall
• Representative site photographs for each structure (refer Section 2.1).
It should be noted that the condition assessments were made solely on the visually observable elements. As such, there may be hidden factors that with potential to affect the structural stability of the structures that could not be identified from the investigation.
M:\WBM\1730_PtStephensAudit\001_AudFrshrStruc\3Dvrbles\3.1Rprts\P.N21295.003.02_PortStephens_CS
M:\WBM\1730_PtStephensAudit\001_AudFrshrStruc\3Dvrbles\3.1Rprts\P.N21295.003.02_PortStephens_CS

Little Beach Reserve Seawall (LBRS) is a stepped concrete block seawall extending from the boat ramp at the northern end to the fishing jetty at the southern end fronting a moderately size nature reserve. For the purposes of this investigation, the foreshore structure was split into two reaches of ~100m each. However, both reaches exhibited identical features aligned with a structure of good condition. Joints between each of the concrete units exhibited very minor evidence of settlement.
It was apparent that sediment transport is active in this area, with sand accreting adjacent to the boat ramp and along the north eastern end of the seawall. The toe along the length of the seawall was covered with sand at the time of the inspection.
The Nelson Bay Foreshore Reserve Eastern Groyne (NBFE) consists of rock revetment fronting a small park on Victoria Parade, adjacent to the Dolphin Watch Café, and a breakwater extending offshore which provides shelter for vessels within Nelson Bay’s D’Albora Marina. The structure was divided into several reaches and sub-reaches for the purposes of this investigation, with photos from the site visit illustrated in Figure 2-2 and Figure 2-3 below.
Overall, the condition of each of the structure reaches varies, with the crest of each displaying consistent evidence of deterioration. The foreshore east of the structure shows evidence of a large storm bite (erosion), with access blocked to the adjacent stairs for safety. This revetment appears in relatively good condition, with well-established closed grass cover without openings along the crest.


The internal revetments within the marina show minor gaps between armour exposing core and waviness to the profile but are generally in a fair condition.
The outer reaches and breakwater head display more concerning features, with the slope appearing uneven due to significant sliding. Armour interlock appears to have been completely lost at the crest with the core fully exposed, in a state that any overtopping wave would erode the underlayer and
M:\WBM\1730_PtStephensAudit\001_AudFrshrStruc\3Dvrbles\3.1Rprts\P.N21295.003.02_PortStephens_CS
leading to compromised integrity of the breakwater. Evidence demonstrates this has already occurred, with some undermining of the concrete path along the crest.

M:\WBM\1730_PtStephensAudit\001_AudFrshrStruc\3Dvrbles\3.1Rprts\P.N21295.003.02_PortStephens_CS A_final.docx


Nelson Bay Foreshore Reserve Inner Harbour Seawall is located inside the marina and forms part of a small remnant beach ~250 m long. The seawalls consist of a concrete abutment and geotextile container (sandbag) wall, with a rock revetment supporting the western corner embankment backed by a narrow grassy reserve.
Overall, the condition of the geotextile container seawalls was good to fair. The sand filling appears tight with limited opportunity for geotextile edges to displace under storm conditions. The stitching is mostly in good condition, with some evidence of minor degradation.

Generally, no movement at base or crest was evident. However, at areas where storm water outlets were located, undermining has begun, with minor displacement of the concrete abutment. The toe was unable to be inspected in most areas due to sand build up.


The stairs to access the beach were in excellent condition. However, the last step height was quite large because of sand erosion at the base of the stairs.
M:\WBM\1730_PtStephensAudit\001_AudFrshrStruc\3Dvrbles\3.1Rprts\P.N21295.003.02_PortStephens_CS


Dutchman’s Beach Reserve Eastern Seawall is a rubble mound revetment located at the Eastern end of Dutchmans Beach. Where exposed, the natural profile comprised a thin sand mantle covering weathered volcanic bedrock which extends to form part of the headland. Progressing west the rock revetment forms the foundation protection for the concrete footpath and stormwater outlet along the front of the hotel accommodation. The rock consists of cobbles and boulders up to about 1 m in size but typically less than 0.5 m in size.
The revetment itself appears to be covered in vegetation, with large amounts of sand accumulation. Although much of the wall was not visible during the inspections, armour stones are scattered on the beach indicating that the wall is in a poor condition. The lower drainage outlet appeared to be essentially blocked by accumulated sand.


M:\WBM\1730_PtStephensAudit\001_AudFrshrStruc\3Dvrbles\3.1Rprts\P.N21295.003.02_PortStephens_CS

Dutchmans Beach Reserve Western Seawall is a rubble mound revetment located at the Western end of Dutchmans Beach. The rubble consists of concrete debris and boulders up to about 1.0 m in size but vary in size from 0.2 m. The revetment fronts a small car park and grass nature strip with a footpath that continues west around the headland. It is noted there was previously a vertical block seawall which appears dilapidated and partially removed, likely to have previously functioned as shoreline protection. Concrete drainage pipes are evident throughout the seawall, presumably placed to act as armour.

Generally, this wall appears in poor condition. Specifically, the eastern extent which has an almost non-existent seawall. Progressing west in front of the carpark, the grass patch behind the wall is eroding and is causing the wall in areas to become unstable. The existing block wall appears to partially function but is being undermined at the toe. The remaining sections of rock revetment appear to have minimal (if any) interlock resulting in armour displacement. As a result, geotextile is exposed and has deteriorated to the point of failure, exposing core beneath.

M:\WBM\1730_PtStephensAudit\001_AudFrshrStruc\3Dvrbles\3.1Rprts\P.N21295.003.02_PortStephens_CS

Conroy Park/Sandy Point Seawalls comprise a wide variety of armoured rock and concrete structures, differing in all aspects of design, size, materials, and condition extending over the foreshore approximately 750m. Analogous to the type and condition of each, the adequacy of each section also varies. Small sections of the revetment are in fair condition and are functioning to some degree. However, the majority of the foreshore ‘structures’ are littered with poor design features suggesting they have not been constructed in accordance with sound coastal engineering principles and have subsequently failed through a variety of mechanisms.
Overall, the current foreshore protection measures require significant repairs and modifications to achieve an adequate level of functionality.


Of particular concern is the pedestrian access along the crest of the structures. During the site visit several members of the public were using the foreshore area for access from one beach to the next. The access path varies in composition, but in some areas is of such poor condition (attributed to both poor quality design and or construction and deterioration over time) that it should be considered a safety hazard to general users.
M:\WBM\1730_PtStephensAudit\001_AudFrshrStruc\3Dvrbles\3.1Rprts\P.N21295.003.02_PortStephens_CS
A large majority of the in-situ structures separating the revetment are boat ramps, constructed at the foot of dwellings, with varying slope and construction. The ramps split the revetment into several portions, facilitating localised undesirable overtopping and subsequent damage to the public reserve and private property. Overall, it appears the boat ramps hinder the performance of the revetment structures, preventing adequate foreshore protection. It appears the boat ramp owners have attempted to mitigate run-up using in-situ vertical walls along the revetment crest, but each walls effectiveness would likely be poor due to inadequate design and construction. In areas such as these, improved performance will require an integrated approach to remediation, which incorporates an understanding of amenity, options for alternatives, extreme conditions (present and future), and engineering design and proper construction.
Several groynes were also observed across the extent of the foreshore. The groynes appear to have a range of functionality from barely functional to working well in their intended purpose. The largest contributing factor to the limits in functionality can be attributed to their crest height, with some well below a common storm tide, evident by the presence of dried wrack covering the crest.
The geotextile container protection to the west appears to be deteriorating, with sand filling appearing loose in containers, leading to failure of seams. Other contributing factors to the deterioration include vegetation growth behind the structure (roots penetrating containers) and loss of backfill/undermining of the toe. Additionally, it appeared the foreshore protection measure was being undermined by erosion on its western edge.
M:\WBM\1730_PtStephensAudit\001_AudFrshrStruc\3Dvrbles\3.1Rprts\P.N21295.003.02_PortStephens_CS
M:\WBM\1730_PtStephensAudit\001_AudFrshrStruc\3Dvrbles\3.1Rprts\P.N21295.003.02_PortStephens_CS


Carroll Park Reserve Seawall is a rock revetment located at the Eastern end of Salamander Bay. The layered wall rock boulders are up to about 1.0 m in size but vary in size from 0.2 m with the western extent of the wall consisting of concrete and brick rubble. The revetment fronts the walkway to Corlette Point and grass nature strip with the footpath continuing east around the headland. Despite the relatively low crest height, the foreshore protection is aided by the presence of mangroves. The orientation of the bay and the relatively shallow water depth are also beneficial in terms of foreshore stability.


Generally, this wall appears in fair condition. However, the relatively poor condition of the southern extent has resulted in exposed geotextile and exposing core beneath, which has caused some loss of the underlayer core, leaving the wall in a vulnerable state.
The rubble mound revetment consists of several reaches with consistent upper levels of ~2m (AHD). The rubble comprises angular boulders up to about 1 m in size but typically less than 0.5 m in size. This structure appears to have been in place for a prolonged period. Some sections are in poor condition and presenting slope failures with dispersed rock and undulating profiles.

M:\WBM\1730_PtStephensAudit\001_AudFrshrStruc\3Dvrbles\3.1Rprts\P.N21295.003.02_PortStephens_CS A_final.docx
The ‘groyne’ at the southern end of the headland appears to have been man -made with rocks less than 1.0 m in size. The condition appears poor with no core and settlement with the crest below the water level at the time of inspection.

The Everitt Park Groyne consists of rock revetment supporting the side of the embankment before transitioning into a breakwater which provides shelter for a boat ramp facility.


The rubble mound revetment consists of several reaches with consistent upper levels of ~1.5m (AHD). The rubble comprises angular boulders up to about 1 m in size but typically less than 0.5 m in size. The condition of the revetment was generally good, with the offshore breakwater exhibiting poorer conditions on the harbour side with settlement and core loss.
M:\WBM\1730_PtStephensAudit\001_AudFrshrStruc\3Dvrbles\3.1Rprts\P.N21295.003.02_PortStephens_CS

The Everitt Park Seawall is a rock revetment supporting the embankment on the inner side of the Everitt park boat ramp. Behind the revetment is a carpark which sits at ~2.0m AHD. Towards the marina, the rock revetment begins to lower towards ~1.0m AHD. Erosion of the revetment toe may be hindered by the presence of mangrove trees. However, there appears to be a considerable level of foreshore erosion at the southern end of this rock revetment with collapsed concrete steps on the beach. The condition of the revetment was generally poor, with settlement, core loss and undermining observed.


M:\WBM\1730_PtStephensAudit\001_AudFrshrStruc\3Dvrbles\3.1Rprts\P.N21295.003.02_PortStephens_CS
Sunset Park Seawall consists of a variety of armoured rock and vertical concrete structures, differing in design, materials and condition extending just over the 200m of the foreshore south of the Soldiers Point Marina. The seawalls front a small nature strip and several residences along Sunset Boulevard.

Given the orientation and position of the seawalls within the inner port, the exposure to wave energy is expected to be minimal, with any substantial wind generated wave energy likely hindered by Dowadee and Bushy Island. As a result, inundation and toe scour would be the key concerns of this seawall.

The first sub-reach moving south from Soldiers Point Marina consists of a vertical cement block wall. This sub-reach is in relatively fair condition but presented evidence of scour of the mortar toe, consistent with expectations of the site.


Progressing south, the second sub-reach is a low crested rock revetment consisting of rocks up to 1.0m, but generally in the order of 0.5m in size. Across the crest of the wall was a thick layer of the common ‘pigface’ creeping succulent. Sections of rock revetment showed minimal interlocking of rocks resulting in armour displacement. Consequently, the geotextile is exposed and has begun deteriorating, but has not yet exposed the core underlayer. Along this reach is a set of stairs and universal access ramp to the beach which were in good condition. Progressing further, the low crested rock revetment’s change in construction is noted, with the rock sizing more generally
M:\WBM\1730_PtStephensAudit\001_AudFrshrStruc\3Dvrbles\3.1Rprts\P.N21295.003.02_PortStephens_CS
consisting of rocks of approximately 1.0m. The wall disappears into the accumulated sand and vegetation with no evidence of erosive scarp or damage noted.


The last sub-reach is a vertical block wall fronting a large, grassed nature strip in an overall good condition. The drainage outlet to the southern extent appears not to cause any issues of scour or undermining but could be considered a point from which deterioration may propagate, as the edge of the wall may be progressively undermined.
Taylors Beach Seawall is an armoured rock revetment, differing in condition across its length. Similar to Sunset Park Seawall, the wall fronts a small nature strip and several residential properties. The boat ramp itself was not part of this inspection, but it was noted that the lower portion was covered with a layer of accumulated sand.
The small portion, and the first sub-reach north of the boat ramp is a low crested grouted rock revetment, with rocks generally in the order of 0.3m in size. However, a thick layer of the common ‘pigface’ and wrack covering the structure made it difficult to assess the condition of the wall. The wall has experienced spot failures and loss of behind-wall material, leading to the formation of several


M:\WBM\1730_PtStephensAudit\001_AudFrshrStruc\3Dvrbles\3.1Rprts\P.N21295.003.02_PortStephens_CS
points of disaggregation of the wall. Beyond the condition of the structure, the ability for the wall to prevent inundation of the landward side by flooding and concurrent wave actions appears to be minimal, evident by the accumulated wrack along the top of the wall at the time of inspection.
Progressing south, the construction style shifts, using larger rock boulders of generally 0.6m to create a rock revetment. Overall, the condition of this wall is poor, with global displacement and sliding intermittent breaching of the crest and, and corresponding exposure of the geotextile and core layers. Erosion of the foreshore was noted, with exposed roots assisting with the stability of the remaining semi-scarped shore.
This degradation appears to be reduced towards the end of Albert Street where the condition of the wall is better. However, fissures in the wall split the revetment into several portions, facilitating undesirable overtopping and subsequent damage to the public reserve and private property.
The combination of the enhanced degrading conditions, likely manifesting through inundation and undersized armour appears to be leading to an unstable bank.
M:\WBM\1730_PtStephensAudit\001_AudFrshrStruc\3Dvrbles\3.1Rprts\P.N21295.003.02_PortStephens_CS


Koala Reserve Seawall consists of a rubble mounded seawall with a concrete/mortar capping on the northern end and a gabion rock basket for the southern extent.
There are several locations on the concrete capped revetment where capping breaches have been substantial resulting in zones of erosion. The slope of the rock wall face is quite steep (~1:1) and, as expected, in areas where the concrete binding has come loose, the rubble has been displaced with the wall becoming undermined. The condition of the mortar indicates that the wall is susceptible to spot failures through disaggregation leading to piping and erosion of retained material behind the wall. This spot degradation can be considered a point from which deterioration is likely to propagate as armour near the spot failure is progressively loosened.
Gabion baskets have been placed to form the southern portion of the structure, likely to prevent outflanking of the seawall. There did not appear to be any geotextile filter fabric placed behind or underneath the gabion baskets which raises questions about their ability to prevent the movement of soil material through the gabions. The parkland landward of the capped rubble mound seawall is grassed whereas the nature strip landward of the gabion seawall is generally ungrassed.
The orientation and location of the foreshore is sheltered such that no significant wind generated waves are expected to impact the wall condition and the presence of mangroves along foreshore will assist with wave attenuation associated with boat wake.


In summary, although this structure appears to be stable currently, degradation in the form of erosion of retained material, mortar loss and rubble displacement, are likely to continue.
M:\WBM\1730_PtStephensAudit\001_AudFrshrStruc\3Dvrbles\3.1Rprts\P.N21295.003.02_PortStephens_CS
Kooindah Park Seawall is a rock revetment of relatively sound construction and condition in comparison to the other foreshore protection structures inspected as part of this study. The wall itself fronts a large park on the northern side of the Lemon Tree Passage Boat Ramp Facility. The boat ramp itself was not part of this inspection but it was noted that it appeared in good condition and had a large amount of user traffic during the inspection.
The revetment consists of consistently well graded rocks between 0.6m and 1m, forming an even slope of ~20° to a crest height of ~1.3m AHD based on 2012 LIDAR Survey. The addition of mangroves along the toe of the wall would also appear to assist with wave attenuation.
Although the wall itself is in relatively good condition, some of the rubble armour is in a moderately degraded condition with signs of construction associated degradation, including cracking of the armour and occasional rock armour displacement resulting in exposure of the core.
Moving west there is an unprotected segment of shoreline between Kooindah Park Seawall and the un-authorised revetment to the west. As a result, the last sub-reach of the Kooindah Park Seawall appears to be getting outflanked during storm events, with resultant erosion penetrating behind the exposed end of the seawall, causing deterioration of the foreshore exposing tree roots. Nearby there is a large pile of rocks similar to those in the Kooindah Park Seawall, suggesting that either further shoreline protection works are planned, or are unfinished.
M:\WBM\1730_PtStephensAudit\001_AudFrshrStruc\3Dvrbles\3.1Rprts\P.N21295.003.02_PortStephens_CS


The Tanilba Bay Foreshore Seawall is a rock revetment which fronts a boardwalk and foreshore walking track from Caswell Reserve to the Tanilba Sailing Club. Inspection of the boardwalk was not part of the scope for this project however, the foundations observed adjacent to the revetment edge showed the early stages of significant undermining. Although it appears to be stable currently, further erosion of the bank is likely to continue to advance in this region and it could become a major safety risk to boardwalk users.
The foreshore itself is somewhat protected through the presence of well-established vegetation consisting of paperbark trees, swamp mahoganies and a range of ferns and wetland grasses. However, shoreline erosion has undercut the trees closest to the water exposing their roots. Ongoing erosion is likely to cause this portion of the foreshore to continue to deteriorate.
Localised breaching of the seawall capping and erosion of material from behind the wall was noted, with associated evidence for broader slope failure progressing westward but the structure was in generally fair condition up to the Sailing Club Boat Ramp. Further east of the Boat Ramp the wall was almost non-existent in places with a mix of core and larger armour rocks present at the toe of an eroded grassy shoreline.
The western edge of the rock revetment falls behind a storm water outlet, which appeared to have a heavily accreted beach at the foot of the outfall. The presence of gabion rock bags supported by timber piles indicate that there may have been issues with erosion at this location previously.
M:\WBM\1730_PtStephensAudit\001_AudFrshrStruc\3Dvrbles\3.1Rprts\P.N21295.003.02_PortStephens_CS


The Peace Park Seawall is a mix of rock revetments integrating a vegetation terrace between two revetments with the landward revetment crest typically higher than the seaward crest. The level of vegetated cover between the two crests appears to be minimal to nil, with the geotextile used to retain the terrace material exposed.
Overall, the walls themselves are in good condition, with the main issues being armour loss and exposure of the core. The underlayer core material can often be seen through gaps in the armour layer, but the level of core loss did not yet appear to be significant enough to destabilise the structure.
A portion of foreshore between Peace Park and Tanilba Bay Boardwalk was not highlighted as an asset in the information provided to BMT. However, observations were noted on site. This included poorly constructed rock revetments placed nearly vertically, with exposed geotextile at the rear of the crest and a discontinuous nature of the walls which may result in the failure of the walls in the future.


The Swan Bay Sea Wall is characterised by several ad-hoc foreshore protection structures in various states of disrepair. There is very little sand on the beach in front of the structures and erosion along unprotected sections was observed extending into terrestrial material. It appears that the various foreshore protection measures currently observed at Swan Bay have been constructed in a piecemeal fashion.
M:\WBM\1730_PtStephensAudit\001_AudFrshrStruc\3Dvrbles\3.1Rprts\P.N21295.003.02_PortStephens_CS
The southern portion of the first sub-reach is a derelict rock revetment with the foreshore scarped and the undermined. The remaining portions of the sub-reach contain portions of discontinuous vertical concrete seawalls with low crests, with gaps in the wall filled by residential rubble in piles, likely as a reactive measure to prevent further scarping of the foreshore. The presence of mangroves would likely assist in localised wave attenuation and as a consequence reduce the rate at which the foreshore deteriorates.
Progressing north the revetment is relatively of much better construction and condition. The armour on the revetment is of appropriate sizing and the condition indicates it has been recently constructed. However, the structure shows no signs of geotextile and the underlayer material is visible through large gaps in the armour layer, indicating existing damage which can be expected to continue leading to reduced structural stability. The crest has been breached in several places resulting in scarping of the foreshore a distance of up to one diameter of armour stone higher than the present crest level, with the Digital Elevation Models (DEM)’s indicating that the crest sits between 1.4m to 1.6m AHD. Poorly constructed in-situ boat ramps dissect the revetment, facilitating undesirable breaching and subsequent damage to the foreshore.
The third sub-reach is again a series of derelict ad-hoc structures that are almost none-functional. Of particular concern is the timber structure fronting 115 Waterfront Road, which has dilapidated to a point where it is unsafe for public use. The slab has been severely undermined and the timber has dilapidated rendering its structural capacity inadequate. The remaining portion of the sub-reach aids only in wave attenuation, with the structures ability to protect the foreshore region being nominal. Evidence of substantial scarping of the shoreline supports this conclusion.
Structures in the fourth sub-reach resemble the poorly constructed and derelict condition observed in the third sub-reach. The last of the sub-reaches differs completely from the other portions of the foreshore, with large concrete blocks being used to protect the shoreline however, being private property the structure was not inspected.
The condition and functionality of the foreshore protection structures along Waterfront Road are such that the stretch could be considered largely unprotected. The advanced degraded condition, likely manifesting through inundation and undersized armour appears to be leading to an unstable shoreline that will continue to degrade if no action is taken.
M:\WBM\1730_PtStephensAudit\001_AudFrshrStruc\3Dvrbles\3.1Rprts\P.N21295.003.02_PortStephens_CS


Longworth Park Seawall fronts a small park and swimming enclosure along the west bank of the Karuah River. From an asset management point of view, PSC have split the structures into two sets: Longworth Park Seawall 1 which protects the park , and Longworth Park Seawall 2 which protects the swimming enclosure.
For the purposes of this project, Longworth Park Seawall 1 was divided into 3 reaches around its perimeter. The first reach is a steep seawall with binding concrete and a concrete path along the crest. The mortar joints appeared to be slightly weathered, showing signs of decoupling from the blocks however, there was no notable block displacement or evidence of material loss. Most of the crest appeared flat with no settlement issues. However, one point at the corner of the wall adjacent to the Oyster Farm Shed showed signs of piping and indications of minor loss of retained material.


The second reach running parallel the Karuah River is of the same construction as the first reach, having irregular rocks bounded by concrete. The condition is similar to the first reach with no major condition concerns noted during the inspection. A safety hazard associated with the height of the wall was noted during the inspections.
The third reach is a rock revetment which lines the inside wall of the swimming enclosure fronting Longreach Park. The piled structure walkway and floating pontoon were not part of this inspection, but it was noted that it appeared in fair condition.


The revetment consists of consistently well graded rocks between 0.6m and 1.2m, forming an even slope of ~20° to a crest height of ~1.3m AHD based on 2012 LIDAR Survey. Generally, the wall itself is in a fair condition, however there is waviness in the crest profile, with several armour units missing completely in places, exposing core. As core is eroded, it will lead to further failure in the wall. The absence of geotextile in the structure will contribute to the deterioration.
Longworth Park Seawall 2 was split into 2 sub-reaches for the purposes of this investigation: one lining the foreshore adjacent to the swimming enclosure, the second at the foot of the bridge abutment adjacent to Memorial Park Sea Wall 2. The first of the sub-reaches was a steep seawall with binding concrete and a concrete path along the crest. The mortar joints appeared to be slightly weathered, showing signs of decoupling from the blocks, however, there was no notable block displacement or evidence of material loss. Most of the crest appeared flat with no settlement issues. However, one point at the corner of the wall adjacent to the Oyster Farm Shed showed signs of piping and indications of minor loss of retained material.
M:\WBM\1730_PtStephensAudit\001_AudFrshrStruc\3Dvrbles\3.1Rprts\P.N21295.003.02_PortStephens_CS
The rock revetment appears to be constructed from two layers; armour, and core. The first portion of the wall stretches 30m north west of the wooden platform surrounding the swimming enclosure. The armour layer here appears to be slightly undersized with several of the rocks displaced and strewn on the inside of swimming facility. The exposed underlayer shows no signs of geotextile, The crest also appeared visibly lower relative to other portions of the wall, with a wavy profile suggesting possible settlement. However, this cannot be confirmed without the use of a base survey.
The second revetment is located parallel to the foreshore and stretches around to the Memorial Park Seawall which protects the abutment of the Karuah River Bridge on Tarean Road. The residual profile was a thin mud mantle covering weathered volcanic bedrock, providing a fairly stable foundation for the rock revetment structure. Several of the armour blocks have been displaced towards the toe but overall, the wall is in a good to fair condition.


The Memorial Park Revetments have been split into two sets by PSC; one at the base of the Tarean Road Bridge (denoted Memorial Park Sea Wall 1), and another along the surrounds of the Karuah Boat Ramp (denoted Memorial Park Sea Wall 2).

The first of the structures is a rock revetment sitting at the base of the bridge, fronting the bridges abutment and a concrete footpath. On the northern side of the bridge, the path shows signs of settlement and the wall is beginning to steepen, indicating instability in the wall. Trees growing along
M:\WBM\1730_PtStephensAudit\001_AudFrshrStruc\3Dvrbles\3.1Rprts\P.N21295.003.02_PortStephens_CS
the crest of the wall are also contributing to the uneven nature of the footpath and displacement of armour at the crest. Consequently, the underlayer and core of the path and revetment has eroded causing further deterioration of the structure. South of the bridge abutment the crest has had a layer of shotcrete placed with no evidence of piping or other forms of deterioration.
To the north is an old concrete ramp which, following a desktop review, was found to be an old ferry access. Concrete block units line the foreshore of the historical ferry master’s cottage with portions of the foundations scattered approximately at MSL in front of the concrete blocks. The top of the concrete units is relatively flat, though undermining of the toe indicates that wall failure may occur soon. Overall, the structure at this section appears to be functioning well in protecting the foreshore.

The second of Memorial Park Revetments functions to protect the foreshore and support a concrete path along the crest. For the purposes of the inspection it was split into two sub-reaches reaches both of which are composed of a concreted rock revetment.


The first of the sub-reaches appears quite stable. However, failure of the binding concrete appears to have been caused by piping and subsidence of the now exposed sediments behind the structure. The level to which this has progressed appears to be minimal as the concrete path is relatively intact, though it is noted that this is an area where deterioration will propagate substantially if not remediated in the near term.

The second of the sub-reaches is of similar construction and is in a better condition with no major issues noted.
M:\WBM\1730_PtStephensAudit\001_AudFrshrStruc\3Dvrbles\3.1Rprts\P.N21295.003.02_PortStephens_CS
A high-level inspection of the private ‘un-authorised’ seawalls within the Inner Port was conducted, noting any distinguishing or concerning attributes. The two sections of coastline consisted of Salamander Bay and Soldiers Point, with the seawalls primarily fronting residential properties close to the foreshore. A high level functional assessment of the walls was conducted based on inundation and erosion hazard risks, with general notes on the expected performance provided.


This stretch of coast contains a variety of seawalls varying in construction type, scale, and condition. Some structures were substantial and vertical in nature, with the structures encroaching into reserve. Given the many and varied structures, it was not feasible to conduct a condition assessment of each. Rather, an overall comment on the foreshore protection measures is provided.
At the time of inspection, the crest height of the walls appeared to increase at the northern extent, with the beach narrowing in that area. The walls of the southern sub-reaches appear to be poorly constructed, offering only nominal protection of the foreshore. Progressing north towards the Wanda Wanda Headland, the walls appeared to be well constructed and in a relatively good condition. Dried
M:\WBM\1730_PtStephensAudit\001_AudFrshrStruc\3Dvrbles\3.1Rprts\P.N21295.003.02_PortStephens_CS
wrack above the crest of the walls suggests that the crest heights are inadequate for more severe storm events.
Despite the relatively sound structural condition, the observed wrack on/behind the crest indicates that the seawalls are subject to inundation which poses a risk to the assets in this area. Monitoring of this area during high water and wave events is recommended to assess the level and extent of inundation and to guide mitigation measures adopted in this region.
Similar to Salamander Bay (Section 2.1.20.1), the Soldiers Point Private Sea Walls consist of a variety of foreshore protection structures in varied condition along its ~1.5km extent, with the ‘crest height’ of the walls increasing toward the northern extent. Given the large variation in construction type, scale and condition, it was not feasible to conduct a condition assessment of each. Rather, an overall comment for the entire foreshore area is provided.
The southern portion of the foreshore protection consisting of UASP-R1-SR1 to UASP-R1-SR3 (Figure 2-27) have larger expanses of sandy beach along the foreshore and minimal protective structures. Progressing north, a litter of vertical seawalls and rock revetment structures have been placed along the foreshore before natural bedrock and larger rock revetment structures protrude from the coastline at Kangaroo Point (UASP-R1-SR6 and SR7). The structures up to this point along
M:\WBM\1730_PtStephensAudit\001_AudFrshrStruc\3Dvrbles\3.1Rprts\P.N21295.003.02_PortStephens_CS


the coast appear to be partially functional, with only a few areas showing dilapidation within subreaches SR6 and SR7 (See Figure 2-28).
Despite the structures being somewhat functional under current conditions, future predicted levels of inundation will rapidly increase the risk to assets fronting the foreshore in this area. This will also be the case where structures appear to be non-existent on the southern portions of the beach.
Slightly north, sub-reaches SR8 and SR9 show more concerning features of deterioration displayed in Figure 2-29. The majority of the foreshore ‘structures’ are rock revetment type, formed by placement of undersized armour rock on the sand present at the time and, as a result, are failing primarily through erosion at the toe. Other signs of deterioration such as crest settlement are also key indicators of poorly constructed sea walls. These structures require significant repairs and modifications to achieve an adequate level of protection for residence at this area of the foreshore.
The condition of the structures and the predicted increase in inundation mean that this stretch is at a higher level of risk than other portions of the coast along Soldiers Point.
Moving north, sub-reaches UASP-R1-SR10 displays similar characteristics as the first of the subreaches, consisting of broader beaches and minimal protective structures. UASP-R1-SR11 contains a variety of ad-hoc foreshore protection measures (Figure 2-30) which appear to be functioning to an adequate level. However, given the increasing exposure of these sub-reaches there is increased potential for damage to the foreshore by larger storm events posing a significant risk to assets in this area.
The bedrock visible at UASP-R1-SR12 provides a level of natural protection somewhat enhanced by the addition of poorly constructed rock revetments (Figure 2-31). Scarping of the shoreline in this location indicates that the protection currently in place is not sufficient.
M:\WBM\1730_PtStephensAudit\001_AudFrshrStruc\3Dvrbles\3.1Rprts\P.N21295.003.02_PortStephens_CS
M:\WBM\1730_PtStephensAudit\001_AudFrshrStruc\3Dvrbles\3.1Rprts\P.N21295.003.02_PortStephens_CS


M:\WBM\1730_PtStephensAudit\001_AudFrshrStruc\3Dvrbles\3.1Rprts\P.N21295.003.02_PortStephens_CS


Table 2-1 summarises the findings from the inspections, with the digital field sheets for the condition assessments included in Appendix B. The number of structures in each condition category are summarised in Table 2-2. The structural and performance indices have been included in Appendix C, with updated structure data also included for future reference.
M:\WBM\1730_PtStephensAudit\001_AudFrshrStruc\3Dvrbles\3.1Rprts\P.N21295.003.02_PortStephens_CS
M:\WBM\1730_PtStephensAudit\001_AudFrshrStruc\3Dvrbles\3.1Rprts\P.N21295.003.02_PortStephens_CS
The structural performance results assessed for present sea level and for predicted SLR have been shown in Table 2-3. The results show that, overall, low lying areas within the port in close proximity to the ocean will be heavily affected by future SLR, with areas sheltered from direct swell waves also susceptible to permanent or periodic inundation and erosion of the shoreline.
Areas with large shallows fronting the seawalls will be at an increased risk due to the influence of SLR on the hydrodynamic processes within the Port. The increase in water depth has the potential to decrease wave shoaling across the near shore or sandy shoals, alter wave propagation within the harbour and influence the complex feedback-dependent processes that govern coastal morphology. Consequently, shoreline recession, wave overtopping and structural damage due to increased wave heights at the shoreline can be expected to increase.
It should be restated that in the absence of documented quantitative geometric data, estimates from spatial data and site observations formed the basis of geometric parameters for the performance assessment. Furthermore, the performance assessment does not include a detailed evaluation of local metocean conditions.
M:\WBM\1730_PtStephensAudit\001_AudFrshrStruc\3Dvrbles\3.1Rprts\P.N21295.003.02_PortStephens_CS
M:\WBM\1730_PtStephensAudit\001_AudFrshrStruc\3Dvrbles\3.1Rprts\P.N21295.003.02_PortStephens_CS
M:\WBM\1730_PtStephensAudit\001_AudFrshrStruc\3Dvrbles\3.1Rprts\P.N21295.003.02_PortStephens_CS
The primary factors for evaluation of potential remedial work options should be based on PSC’s identified value of assets and the risk to those assets. The risks have been assessed as part of this investigation, with the rational discussed below.
Based on the inspection of structures, assessment of their condition and high-level assessment of their performance (now and into the future), the public authorised coastal protection structures considered at risk are presented in Table 2-4. It lists the structures that are anticipated to be affected within the investigation area as a result of either their condition or functional performance. This list is cumulative and does not include the already failed seawalls; CPSP-R4-SR1, WWHS-R1-SR2 and LBS2-R1-SR1.
This list can be used to as an initial guide for planning and prioritising remedial works. However, it will be important to develop a more detailed value assessment for each segment of coast which will include the structure itself and the built infrastructure landward to further rank the priorities of where remedial action should be focused. Furthermore, the decision whether to take remediation action should be consistent with the regional coastal adaptation Program.
Typically, limitations in available funding dictate that a risk-based asset management approach is necessary to target high-value assets at the highest risk, as opposed to focusing on structures that are failing, irrespective of their level of service, value or need.
Specific remediation strategies will vary for each coastline segment as will the associated risk. Following the prioritisation of required works, evaluation of potential remedial work options to identify cost-efficient responses should be completed in the form of an options assessment.
Timeframe
Present Day (2020)
Structural Assets at Risk
CPKR-R1-SR1 (Carroll Park Reserve)
CPSP-R2-SR1 (Conroy Park/Sandy Point Seawall)
CPSP-R6-SR1 (Conroy Park/Sandy Point Seawall)
CPSP-R8-SR1 (Conroy Park/Sandy Point Seawall)
EPGR-R1-SR1 (Everitt Park Groyne)
EPGR-R1-SR3 (Everitt Park Groyne)
EPGR-R2-SR1 (Everitt Park Groyne)
EPSW-R1-SR1 (Everitt Park Seawall)
KPSW-R1-SR1 (Kooindah Park Sea Wall)
KPSW-R1-SR2 (Kooindah Park Sea Wall)
KRSW-R1-SR1 (Koala Reserve Seawall)
LBS1-R2-SR1 (Longworth Park Sea wall)
LBS1-R3-SR1 (Longworth Park Sea wall)
NBFE-R4-SR1 (Nelson Bay Foreshore Reserve Eastern Groyne)
SBSW-R1-SR1 (Swan Bay Sea wall)
SBSW-R1-SR2 (Swan Bay Sea wall)
M:\WBM\1730_PtStephensAudit\001_AudFrshrStruc\3Dvrbles\3.1Rprts\P.N21295.003.02_PortStephens_CS
Timeframe
Structural Assets at Risk
SBSW-R1-SR3 (Swan Bay Sea wall)
SBSW-R1-SR4 (Swan Bay Sea wall)
SBSW-R2-SR1 (Swan Bay Sea wall)
TBFS-R1-SR1 (Tanilba Bay Foreshore)
TBSW-R1-SR1 (Taylors Beach Sea Wall)
TBSW-R1-SR2 (Taylors Beach Sea Wall)
2040
EPSW-R3-SR2 (Everitt Park Seawall)
MPS2-R1-SR1 (Memorial Park Sea wall)
MPS2-R1-SR2 (Memorial Park Sea wall)
MPS2-R1-SR3 (Memorial Park Sea wall)
NBFE-R3-SR2 (Nelson Bay Foreshore Reserve Eastern Groyne)
PPSW-R1-SR1 (Peace Park Sea Wall)
PPSW-R1-SR2 (Peace Park Sea Wall)
TBSW-R2-SR1 (Taylors Beach Sea Wall)
2070
CPSP-R1-SR1 (Conroy Park/Sandy Point Seawall)
LBS1-R1-SR1 (Longworth Park Sea wall)
LBS2-R1-SR2 (Longworth Park Sea wall)
MPS1-R1-SR1 (Memorial Park Sea wall)
SSPS-R1-SR1 (Sunset Park Seawall)
SSPS-R2-SR1 (Sunset Park Seawall)
SSPS-R4-SR1 (Sunset Park Seawall)
SSPS-R5-SR1 (Sunset Park Seawall)
TBSW-R2-SR2 (Taylors Beach Sea Wall)
TBSW-R2-SR3 (Taylors Beach Sea Wall)
WWHS-R2-SR1 (Wanda Wanda Headland Seawall)
WWHS-R2-SR2 (Wanda Wanda Headland Seawall)
WWHS-R2-SR4 (Wanda Wanda Headland Seawall)
2120
CPSP-R3-SR1 (Conroy Park/Sandy Point Seawall)
CPSP-R5-SR1 (Conroy Park/Sandy Point Seawall)
CPSP-R7-SR1 (Conroy Park/Sandy Point Seawall)
CPSP-R9-SR1 (Conroy Park/Sandy Point Seawall)
CPSP-R9-SR2 (Conroy Park/Sandy Point Seawall)
DBRE-R1-SR1 (Dutchmans Beach Reserve Eastern Sea Wall)
DBRW-R1-SR1 (Dutchmans Beach Reserve Western Sea Wall)
EPGR-R1-SR2 (Everitt Park Groyne)
EPSW-R2-SR1 (Everitt Park Seawall)
EPSW-R2-SR2 (Everitt Park Seawall)
EPSW-R3-SR1 (Everitt Park Seawall)
LBRS-R1-SR1 (Little Beach Reserve Seawall)
LBRS-R1-SR2 (Little Beach Reserve Seawall)
NBFE-R1-SR1 (Nelson Bay Foreshore Reserve Eastern Groyne)
NBFE-R2-SR1 (Nelson Bay Foreshore Reserve Eastern Groyne)
NBFE-R3-SR1 (Nelson Bay Foreshore Reserve Eastern Groyne)
M:\WBM\1730_PtStephensAudit\001_AudFrshrStruc\3Dvrbles\3.1Rprts\P.N21295.003.02_PortStephens_CS A_final.docx
Timeframe Structural Assets at Risk
NBFI-R1-SR1 (Nelson Bay Foreshore Reserve Inner Harbour Seawall)
NBFI-R1-SR2 (Nelson Bay Foreshore Reserve Inner Harbour Seawall)
NBFI-R2-SR1 (Nelson Bay Foreshore Reserve Inner Harbour Seawall)
SSPS-R3-SR1 (Sunset Park Seawall)
WWHS-R2-SR3 (Wanda Wanda Headland Seawall)
Exposure and levels of inundation are key drivers for elevated risk to assets along the foreshore at the outer port. Most of the exposed locations along Soldiers Point and Salamander Bay are fronted by unauthorised private structures. Inadequate design and construction are key contributors to observed areas of dilapidation and the significant variation in the level of coastal protection. This inconsistency in functionality contributes significantly to the risk to this area. Rather than trying to address separate portions of the foreshore protection in this area it is recommended that a competent and integrated approach to protection be adopted to mitigate against predicted future conditions.
The current and future performance of the unauthorised structures has been based upon observations of their overall condition and exposure to inundation and erosion. A detailed discussion of inundation and erosion hazard risks is provided in Section 8 and Section 3 of the PSC Stage 2 Coastal management Program (CMP) project, respectively.
Levels of risk have been cumulatively listed in Table 2-5 based on inspection observations and the predicted future conditions.
Timeframe
Present Day (2020)
Un-Authorised Structural Assets at Risk
UASP-1-6 (Soldiers Point)
UASP-1-8 (Soldiers Point)
UASP-1-9 (Soldiers Point)
UASP-1-12 (Soldiers Point)
UASB-1-1 (Salamander Bay)
UASB-1-2 (Salamander Bay)
UASB-3-1 (Salamander Bay)
UASB-4-1 (Salamander Bay)
2040
UASP-1-3 (Soldiers Point)
UASP-1-4 (Soldiers Point)
UASP-1-5 (Soldiers Point)
UASP-1-7 (Soldiers Point)
2070
UASP-1-1 (Soldiers Point)
UASP-1-2 (Soldiers Point)
UASP-1-10 (Soldiers Point)
UASP-1-11 (Soldiers Point)
M:\WBM\1730_PtStephensAudit\001_AudFrshrStruc\3Dvrbles\3.1Rprts\P.N21295.003.02_PortStephens_CS A_final.docx
Similar to the authorised structure list in the previous section, this list can be used as an initial guide for planning and prioritising remedial works. However, it will be important to develop a more detailed value assessment for each segment of coast which will include the structure itself and the built infrastructure landward to further rank the priorities of where remedial action should be focused. Although remedial works are likely to be undertaken is limited areas according to their risk and priority, it is recommended that such works be undertaken within the framework of an integrated and designed upgrade for the coastal protection across the wider area. Furthermore, the decision whether to take remediation action should be consistent with the regional coastal adaptation Program.
M:\WBM\1730_PtStephensAudit\001_AudFrshrStruc\3Dvrbles\3.1Rprts\P.N21295.003.02_PortStephens_CS
In addition to the assessment results provided in Table 2-1, Table 2-3 and Table 2-4, general observations made during the inspections are summarised below for the public concrete and rock armour seawalls:
• Based on BMT’s enquiries to PSC and the information provided, there appears to be very little information on the design or baseline condition of the structures. Comparison between the limited seawall data held by PSC and the data recorded as part of this works showed a few cases where structural levels deviated significantly. This can be mainly attributed to the holistic data logged by PSC, lacking subdivision with seawall type, materials, function, and length.
• Large sections of the Port Stephens foreshore are at-risk due to implementation of protection structures that fall far short of sound coastal engineering design and construction standards. Consequently, a significant portion of structures are in poor to moderate condition (on average) showing evidence of deterioration and significant failure. Although the risk varies depending on the existing structure, its condition and the level of exposure to storm conditions within the Port, both now and into the future, a large percentage of structures require significant remediation to achieve an adequate level of shoreline protection.
• Desktop assessment and site observations of the coastal structures indicate that the protection measures in place fall short or fail to achieve the intended or required function to retain the foreshore and protect the land and infrastructure behind the walls, with inundation being a key factor effecting the long-term functional performance.
• Boat ramps front a number of residences across the foreshore, increasing levels of wave runup, overtopping and general inundation, accelerating the deteriorating condition of the foreshore and associated structures.
• Excluding overtopping failure resulting from insufficient seawall crest heights, the two most significant faults in design include a lack of suitably sized armour layers, the absence of geotextile between armour and the underlying material, and the lack of a structural toe (to withstand scour and undermining). The insufficient allowance in design for scour, piping and undermining is the cause of most of the structure failings observed.
• The functional requirements of the private ‘non-authorised’ structures inspected as part of this project tend to be higher than many of the other structures due to their exposed locations. The coastal protection in these areas appears to be below the required standard, with the large variance in design (type, material size etc) contributing to the poor condition and performance.
To assist with ongoing maintenance activity and for planning of remediation and repair, BMT has carried out an Audit of Existing Foreshore Protection Structures as part of the PSC Stage 2 Coastal Management Program (CMP) project. Assessment of over 6km of seawalls was conducted with this report documenting the observed conditions and suitability of foreshore structures.
M:\WBM\1730_PtStephensAudit\001_AudFrshrStruc\3Dvrbles\3.1Rprts\P.N21295.003.02_PortStephens_CS
This study identified significant gaps in information held by PSC and highlights the need for more detailed and quantitative information on the structures (i.e. survey and aerial photos) to facilitate more detailed assessments of specific structures and as a baseline against which to undertake future comparative assessments of deterioration. The lack of quantitative baseline data hinders the ability to investigate the adequacy of a structure for water levels and wave conditions specific to the structures location and the ability to detect changes to structures and surrounds in response to extreme events or long-term trends including climate change. Consequently, it is recommended that PSC invest in conducting a baseline survey as a first step and commit to a monitoring program which will capture these changes into the future. Furthermore, such survey data will also be required if engineering designs are undertaken for significant remediation works. An affordable and time efficient use of available funding could involve the use of small Unmanned Aerial Vehicles (UAV’s or drones). This emerging technology can also track commonly occurring defects of seawalls, including issues such as intermittent crest breaching, intermittent armour displacement and associated slope steepening and sliding.
From the information that was able to be sourced, the outcome of the audit investigations found that generally, the coastal protection structures are in fair condition, with the primary concern being functional performance. Following the condition inspection it was found that there are several structures in a reasonably poor condition which, in an extreme event, would not provide protection from erosive or flooding impacts. The functional performance assessment highlighted that there are also a number of structures that appear to be in a relatively fair or good condition that would not provide the required protection due to insufficient design or construction. Insufficient crest heights, suitably sized armour layering, the absence of geotextile between armour and the underlying material, and the lack of a structural toe are some of the key reasons for poor functional performance. Consequently, the insufficient allowance in design and construction for scour, piping and undermining is the cause of most of the structure failings observed.
These conclusions highlight the need for remediation of unsuitable coastal protection structures within Port Stephens, or the introduction of more effective management options. However, any remediation or coastal protective work will need to fall within the context of an adaption plan developed and adopted by PSC which determines whether the overall goal for the sub-region is managed retreat, accommodation / intervention or acceptance of loss. Within the framework of a holistic adaptive plan developed by PSC, a range of different management options can be considered for each localised area, selecting one that best suits the risks, available resources, and stakeholder values. It is recommended that the options assessment and any subsequent structural designs should be prepared by a suitably qualified coastal engineer to ensure the objectives are achieved within the context of this adaptation program.
The outcomes of this assessment can be used by PSC to inform the development of the adaption plan and as high-level guidance on prioritisation of options assessments. However, it is recommended a more detailed investigation of stakeholder values be undertaken to better inform the risk-based assessment to prioritises these works.
M:\WBM\1730_PtStephensAudit\001_AudFrshrStruc\3Dvrbles\3.1Rprts\P.N21295.003.02_PortStephens_CS
CIRIA, CUR Centre for Civil Engineering , CETMEF. (2007). The Rock Manual: The Use of Rock in Hydraulic Engineering.
USACE. (1998). Condition and Performance Rating Procedures for Rubble Breakwaters and Jetties. REMR Management Systems - Coastal/Shore Protection Structures
USACE. (2011). Coastal Engineering Manual - Part VI. USACE.
Van der Meer, J. A. (2018). EurOtop, 2018. Manual on wave overtopping of sea defences and related structures. An overtopping manual largely based on European research, but for worldwide application.
M:\WBM\1730_PtStephensAudit\001_AudFrshrStruc\3Dvrbles\3.1Rprts\P.N21295.003.02_PortStephens_CS
A_final.docx
M:\WBM\1730_PtStephensAudit\001_AudFrshrStruc\3Dvrbles\3.1Rprts\P.N21295.003.02_PortStephens_CS


BMT has a proven record in addressing today’s engineering and environmental issues.
Brisbane Level 5, 348 Edward Street
Brisbane Queensland 4000 PO Box 203 Spring Hill Queensland 4004
Australia
Tel +61 7 3831 6744
Fax +61 7 3832 3627
Email environment@bmtglobal.com
Melbourne
Level 5, 99 King Street
Melbourne Victoria 3000
Australia
Tel +61 3 8620 6100
Fax +61 3 8620 6105
Email environment@bmtglobal.com
Newcastle Level 1, 161 King Street
Newcastle New South Wales 2300
Tel +61 2 4940 8882
Fax +61 2 4940 8887
Email environment@bmtglobal.com
Adelaide 5 Hackney Road
Hackney Adelaide South Australia 5069
Australia
Tel +61 8 8614 3400
Email info@bmtdt.com.au
Northern Rivers Suite 5
20 Byron Street
Bangalow New South Wales 2479
Australia
Tel +61 2 6687 0466
Fax +61 2 6687 0422
Email environment@bmtglobal.com
Sydney Suite G2, 13-15 Smail Street
Ultimo Sydney New South Wales 2007 Australia
Tel +61 2 8960 7755
Fax +61 2 8960 7745
Email environment@bmtglobal.com
Perth Level 4
20 Parkland Road
Osborne Park Western Australia 6017 PO Box 2305 Churchlands Western Australia 6018
Australia
Tel +61 8 6163 4900
Email environment@bmtglobal.com
London Zig Zag Building, 70 Victoria Street
Westminster London, SW1E 6SQ
UK
Tel +44 (0) 20 8090 1566
Email environment.uk@bmtglobal.com
Leeds Platform
New Station Street
Leeds, LS1 4JB
UK
Tel: +44 (0) 113 328 2366
Email environment.uk@bmtglobal.com
Aberdeen 11 Bon Accord Crescent
Aberdeen, AB11 6DE
UK
Tel: +44 (0) 1224 414 200
Email environment.uk@bmtglobal.com
Asia Pacific
Indonesia Office
Perkantoran Hijau Arkadia
Tower C, P Floor
Jl: T.B. Simatupang Kav.88
Jakarta, 12520
Indonesia
Tel: +62 21 782 7639
Email asiapacific@bmtglobal.com
Arlington 2900 South Quincy Street, Suite 210
Arlington, VA 22206
United States
Tel: +1 703 920 7070
Email inquiries@dandp.com
Our dedication to developing innovative approaches and solutions enhances our ability to meet our client’s most challenging needs.BMT in Environment Other BMT offices

BMT has a proven record in addressing today’s engineering and environmental issues.
Brisbane Level 5, 348 Edward Street
Brisbane Queensland 4000 PO Box 203 Spring Hill Queensland 4004
Australia
Tel +61 7 3831 6744
Fax +61 7 3832 3627
Email environment@bmtglobal.com
Melbourne
Level 5, 99 King Street
Melbourne Victoria 3000
Australia
Tel +61 3 8620 6100
Fax +61 3 8620 6105
Email environment@bmtglobal.com
Newcastle Level 1, 161 King Street
Newcastle New South Wales 2300
Tel +61 2 4940 8882
Fax +61 2 4940 8887
Email environment@bmtglobal.com
Adelaide 5 Hackney Road
Hackney Adelaide South Australia 5069
Australia
Tel +61 8 8614 3400
Email info@bmtdt.com.au
Northern Rivers Suite 5
20 Byron Street
Bangalow New South Wales 2479
Australia
Tel +61 2 6687 0466
Fax +61 2 6687 0422
Email environment@bmtglobal.com
Sydney Suite G2, 13-15 Smail Street
Ultimo Sydney New South Wales 2007 Australia
Tel +61 2 8960 7755
Fax +61 2 8960 7745
Email environment@bmtglobal.com
Perth Level 4
20 Parkland Road
Osborne Park Western Australia 6017 PO Box 2305 Churchlands Western Australia 6018
Australia
Tel +61 8 6163 4900
Email environment@bmtglobal.com
London Zig Zag Building, 70 Victoria Street
Westminster London, SW1E 6SQ
UK
Tel +44 (0) 20 8090 1566
Email environment.uk@bmtglobal.com
Leeds Platform
New Station Street
Leeds, LS1 4JB
UK
Tel: +44 (0) 113 328 2366
Email environment.uk@bmtglobal.com
Aberdeen 11 Bon Accord Crescent
Aberdeen, AB11 6DE
UK
Tel: +44 (0) 1224 414 200
Email environment.uk@bmtglobal.com
Asia Paci c
Indonesia O ce
Perkantoran Hijau Arkadia
Tower C, P Floor
Jl: T.B. Simatupang Kav.88
Jakarta, 12520
Indonesia
Tel: +62 21 782 7639
Email asiapaci c@bmtglobal.com
Arlington 2900 South Quincy Street, Suite 210
Arlington, VA 22206
United States
Tel: +1 703 920 7070
Email inquiries@dandp.com
Our dedication to developing innovative approaches and solutions enhances our ability to meet our client’s most challenging needs.
