Prof. Ailton de Souza Gomez

Volume XXXIII - Issue II - July., 2023
Emeritus Professor, IMA/UFRJ
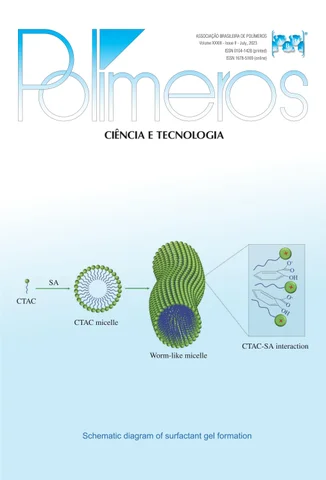
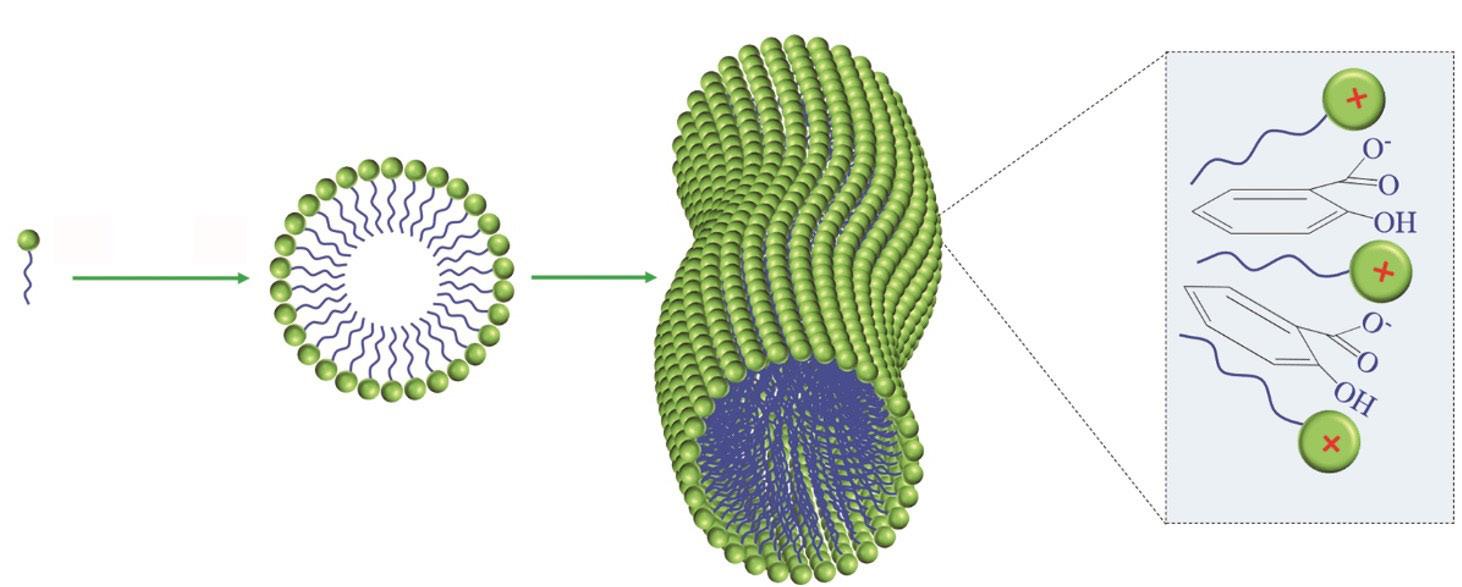
Schematic diagram of surfactant gel formation
CTAC
SA
CTAC micelle
Worm-like micelle
CTAC-SA interaction

P olímero S - I SS ue II - V olume XXXIII - 2023
I ndexed I n : “C hem IC al a bstra C ts ” — “ ra P ra a bstra C ts ” — “a ll - r uss I an I nst I tute of s CI en C e and t e C hn IC al I nformat I on ” — “ l at I ndex ” — “W eb of s CI en C e ”
P olímero S
e d I tor I al C ou NCI l
Antonio Aprigio S. Curvelo (USP/IQSC) - President
m ember S
Ailton S. Gomes (UFRJ/IMA), Rio de Janeiro, RJ (in memoriam)
Alain Dufresne (Grenoble INP/Pagora)
Bluma G. Soares (UFRJ/IMA)
César Liberato Petzhold (UFRGS/IQ)
Cristina T. Andrade (UFRJ/IQ)
Edson R. Simielli (Simielli - Soluções em Polímeros)
Edvani Curti Muniz (UEM/DQI)
Elias Hage Jr. (UFSCar/DEMa)
José Alexandrino de Sousa (UFSCar/DEMa)
José António C. Gomes Covas (UMinho/IPC)
José Carlos C. S. Pinto (UFRJ/COPPE)
Júlio Harada (Harada Hajime Machado Consutoria Ltda)
Luiz Antonio Pessan (UFSCar/DEMa)
Luiz Henrique C. Mattoso (EMBRAPA)
Marcelo Silveira Rabello (UFCG/UAEMa)
Marco Aurelio De Paoli (UNICAMP/IQ)
Osvaldo N. Oliveira Jr. (USP/IFSC)
Paula Moldenaers (KU Leuven/CIT)
Raquel S. Mauler (UFRGS/IQ)
Regina Célia R. Nunes (UFRJ/IMA)
Richard G. Weiss (GU/DeptChemistry)
Rodrigo Lambert Oréfice (UFMG/DEMET)
Sebastião V. Canevarolo Jr. (UFSCar/DEMa)
Silvio Manrich (UFSCar/DEMa)
e d I tor I al C omm I ttee
Sebastião V. Canevarolo Jr. – Editor-in-Chief a SS o CI ate e d I tor S
Alain Dufresne
Bluma G. Soares
César Liberato Petzhold
José António C. Gomes Covas
José Carlos C. S. Pinto
Paula Moldenaers
Richard G. Weiss
Rodrigo Lambert Oréfice
www.editoracubo.com.br
“Polímeros” is a publication of the Associação Brasileira de Polímeros
São Paulo 994 St. São Carlos, SP, Brazil, 13560-340
Phone: +55 16 3374-3949
emails: abpol@abpol.org.br / revista@abpol.org.br
http://www.abpol.org.br
Date of publication: July 2023
Financial support:
Available online at: www.scielo.br
Polímeros / Associação Brasileira de Polímeros. vol. 1, nº 1 (1991)
-.- São Carlos: ABPol, 1991-

Quarterly v. 33, nº 2 (July 2023)

ISSN 0104-1428
ISSN 1678-5169 (electronic version)
1. Polímeros. l. Associação Brasileira de Polímeros.
Website of the “Polímeros”: www.revistapolimeros.org.br
ISSN 0104-1428 (printed)
)
ISSN 1678-5169 (online
d e S kto P P ubl IS h IN g
Polímeros, 33(2), 2023 E1 E E
E
E
E E E E E
E E E E E
r e VI ew a rt IC le
Bibliometric survey of the PVC production – Part I: the continuous polymerization challenge
Rafael Lima, Jonildo Silva, Mateus Vasconcelos, Carlos Alberto Castor Junior and José Carlos Pinto .......................................... e20230013
o r I g IN al a rt IC le
Tuning the structure and properties of cell-embedded gelatin hydrogels for tumor organoids
Sarah Oliveira Lamas de Souza, Sérgio Mendes de Oliveira, Catarina Paschoalini Lehman, Mercês Coelho da Silva, Luciana Maria Silva and Rodrigo Lambert .......................................................................................................................................................................... e20230014
Oréfice Fabrication of fracturing fluid with cationic surfactants and carboxymethyl hydroxyethyl cellulose
Sanbao Dong, Wen Tian, Wenting Qiang, Long Jiao, Jie Zhang and Gang Chen e20230015
In-line rheo-optical characterization of PET hydrolysis and chain extension during extrusion
Luciana Assumpção Bicalho and Sebastião Vicente Canevarolo Junior e20230016
Active antimicrobial extruded films for mozzarella cheese from poly (butylene adipate co-terephthalate) (PBAT) and orange oil
Michelle Félix de Andrade, Ivo Diego de Lima Silva, Viviane Fonseca Caetano, Gisely Alves da Silva, Luiz Emílio Pessoa Timeni de Moraes Filho, Yêda Medeiros Bastos de Almeida and Glória Maria Vinhas e20230017
Thermal and flammability behavior of walnut shell reinforced epoxy composites
Menderes Koyunucu and Göksel Ulay e20230018
Study of mechanical properties of inner tubes exposed to gamma radiation
Sandra Regina Scagliusi, Elizabeth Leite Carvalho Cardoso, Fabio José Esper, Ademar Benevólo Lugão and Helio Wiebeck e20230019
Some mechanical properties of WPCs with wood flour and walnut shell flour
Bekir Cihad Bal e20230020
Development and characterization of sodium polyacrylate/bentonite hydrogel with epoxy resin coating
Marcia Murakoshi Takematsu, Amanda Faria Baruel, Silvana Navarro Cassu, Milton Faria Diniz, David Alexandro Graves and Rita de Cássia Lazzarini Dutra e20230021
Superabsorbent biodegradable CMC membranes loaded with propolis: Peppas-Sahlin kinetics release
Juliana Paes Leme de Mello Sousa, Renata Nunes Oliveira, Antonia Monica Neres Santos, Ormindo Domingues Gamallo, Leonardo Sales Araújo, Antonieta Middea, Yara Peluso Cid and Rosane Nora Castro e20230022
Cellulose fiber network as reinforcement of thermoplastic paraffin films
Matheus Fernandes Flores, Luciano Cordeiro and Antonio Aprigio da Silva Curvelo...................................................................... e20230023
Airbrushing of carbon nanotubes on glass fibers for electromagnetic shielding epoxy composites
Willian Rodrigo Schuster, Sérgio Henrique Pezzin and Fernando Humel Lafratta e20230024
e d I tor I al S e C t I o N News E4 Agenda ................................................................................................................................................................................................ E7 Funding Institutions E9
E2 Polímeros, 33(2), 2023 E i E E i
New hybrid PET/F polymer successfully moulded into preforms
Origin, Husky collaboration opens the door for more sustainable bottles
Origin Materials, Inc., a leading carbon negative materials company based in Sacramento, California and Canada-headquartered Husky Technologies, an injection moulding supplier of equipment and services to the plastics industry, have joined forces on the development and commercialisation of a hybrid polymer comprised of PET into which FDCA has been incorporated. The new polymer is called PET/F.
FDCA - furandicarboxylic acid - is a bio-based furanic monomer which may also be polymerised to produce PEF, or polyethylene furanoate, a biopolyester suitable for use in advanced packaging and other applications. Origin’s FDCA is cost-effectively produced from the company’s chloromethylfurfural, which is a carbonnegative precursor for many chemistries, including Origin’s PET material. Origin chloromethylfurfural (CMF) is made from sustainable wood residues, turning the carbon found in these residues into useful materials, while capturing carbon in the process.
Origin has now successfully combined FDCA with PET, producing a ‘tunable’ hybrid polymer offering improved performance properties compared with PET and full recyclability, the company said. A better mechanical performance and particularly, superior barrier properties will enable longer shelf life - properties that can be controlled by adjusting the manufacturing conditions and the quantity of FDCA copolymer used.
Husky moulded the resulting PET/F hybrid polymer into preforms that were then blown into bottles, using Husky’s injection moulding technologies and manufacturing equipment. The project showed the potential for integrating PET/F into existing PET production systems at a commercial manufacturing-scale processing level.
“Preserving and protecting what matters, in even more sustainable ways is foundational to everything we do at Husky. Our collaboration with Origin Materials is an exciting example of combining material innovation with state-of-the-art polymer processing technologies,” said John Galt, CEO of Husky Technologies.
Going forward, Origin expects to develop and sell a family of 100% bio-based, low-carbon fully recyclable PET/F polymers, promoting the adoption of FDCA as a drop-in for the production of biomass-based polymers using Origin technology. The company expects to achieve the commercial-scale production of FDCA, PEF, and PET/F using its patented technology platform.
As an alternative to PET, the biopolyester PEF also offers an attractive combination of sustainability and performance benefits for packaging, with the potential to replace glass and aluminium. Compared with glass and aluminium, PEF can offer superior break protection and light-weighting for shipping, making it especially suited for sensitive products.
“This is a key moment in the commercialisation of cost-effective, low-carbon FDCA and PEF and the development of next-generation sustainable polymers generally. We believe these materials have the power to transform plastics and the material economy,” said John Bissell, Co-Founder and Co-CEO of Origin Materials. “We are pleased to work with Husky […] to achieve this performance milestone, showing the ready processibility of our innovative hybrid polymers using Husky’s commercial-scale injection moulding equipment,” he added.
‘PET/F is expected to be fully recyclable, have attractive unit economics, and offer a significantly reduced carbon footprint, with superior strength, thermal properties, and barrier properties compared to today’s widely used petroleum-based materials’ stated Origin.
Source: Sustainable Plastics – sustainableplastics.com/news
Solvay launches SCS certified Rhodianyl polymer with 100% recycled content
A ground-breaking and rigorously audited chemical recycling process sets Solvay apart in the industry, enabling the company to deliver high-quality recycled polyamide 6.6 for the consumer goods and engineering plastic markets.
A ground-breaking and rigorously audited chemical recycling process sets Solvay apart in the industry, enabling the company to deliver high-quality recycled polyamide 6.6 for the consumer goods and engineering plastic markets.
Solvay, a leader of high-performance and sustainable polyamide 6.6 polymers, continues to drive innovation in its portfolio with the introduction of a new, specialized grade of Rhodianyl, made of 100% pre-consumer recycled polyamide, which is produced at its Santo Andre plant in Brazil. The product has achieved SCS Recycled Content Certification, reaffirming Solvay’s commitment to circular economy.
The internationally recognized third-party certification body SCS Global Services performed a rigorous audit to verify the traceability of the Group´s entire manufacturing process, including scrap management and the cutting-edge depolymerization reaction, which generates the final 100% recycled Polymer
Rhodianyl can be applied in engineering plastics for the automotive, small appliances and textile markets. It complements the Group’s wide range of innovative and sustainable polymers for today’s highest-quality textiles and fibers for the consumer goods industry.
“With over 70 years of expertise, Solvay has strengthened its position as a leading producer and supplier of highperformance and sustainable PA66 polymers. Certifying our recycling process is a significant step forward in meeting the stringent standards required by our European customers, who represent the primary market for this application due to the growing demand for recycled raw materials in the industry. We remain committed to
N E W S E4 Polímeros, 33(2), 2023
delivering excellence and advancing sustainability in our industry,” said Eduardo Girote, Marketing Director of Solvay’s Coatis Global Business Unit.
“Solvay’s commitment to producing 100% pre-consumer Recycled Content Certified polymer makes a positive impact on both the environment and the supply chain,” said Nicole Munoz, VP of Environmental Certification Services at SCS Global Services. “Using recycled content reduces waste, saves energy, and gives materials a new life, rather than creating new materials.”
This launch is also part of Solvay’s ambition to reduce the environmental impact of its polyamide supply chain in Brazil. Several pioneering initiatives have been implemented in recent years, such as achieving a 95% reduction in CO2 emissions at the Paulínia factory, obtaining the Gold Certification from the Wildlife Habitat Council for biodiversity preservation in its industrial areas, and launching a pioneering program for recycling polyamide uniforms, among other initiatives.
Source: Solvay – solvay.com
N E W S Polímeros, 33(2), 2023 E5

2023
September
PM15 — Polymer Meeting 15 in Bratislava
Date: September 4-7, 2023
Location: Bratislava, Slovakia
Website: pm15.sav.sk/
14th International Workshop on Polymer Reaction
Engineering
Date: September 5-8, 2023
Location: Fraunhofer-IAP, Potsdam, Germany
Website: dechema.de/en/PRE2023.html
Performance Polyamides Europe - 2023
Date: September 12-13, 2023
Location: Cologne, Germany
Website: go.ami.international/pa-register-interest-2023/?_ ga=2.161659068.1873836536.16697322131689573348.1669732213
8th International FAPS Polymer Congress
Date: September 12-14, 2023
Location: Istanbul, Turkey
Website: www.faps2023.com
11th European Symposium on Biopolymers
Date: September 13-15, 2023
Location: Brno, Czech Republic
Website: esbp2023.com/
October
Polyolefin Additives - 2023
Date: October 3-4, 2023
Location: Barcelona, Spain
Website: www.ami-events.com/event/3217a2fe-22bf-4751-b2415e15ad488df5/summary?RefId=Website_AMI
Plastics Recycling Technology
Date: October 10-12, 2023
Location: Vienna, Austria
Website: www.ami-events.com/event/04194add-97e5-4a3b-a5a410e937775a9f/summary?RefId=Website_AMI
Sustainable Polymers
Date: October 15-18, 2023
Location: Safety Harbor, Florida, United State of America
Website: www.polyacs.net/23sustainablepolymers
7th Global Summit on Polymer Chemistry
Date: October 18-19, 2023
Location: Paris, France
Website: polymerchemistry.annualcongress.com/
4th International Conference on Advanced Polymer Science and Engineering
Date: October 23-25, 2023
Location: Valencia, Spain
Website: polymersconference.yuktan.com/
17th Brazilian Polymer Congress
Date: October 29 - November 2, 2023
Location: Joinville, Brazil
Website: www.cbpol.com.br/
November
Controlled Radical Polymerization
Date: November 12-15, 2023
Location: Charleston, South Carolina, United State of America
Website: www.polyacs.net/crp2023
Polymer Testing World Expo: North America
Date: November 15-16, 2023
Location: Cleveland, Ohio, United State of America
Website: na.polymertestingexpo.com/
Asia Australia Regional Meeting of Polymer Processing Society, PPS-2023
Date: November 29 - December 2, 2023
Location: Kovalam, Trivandrum, Kerala, India
Website: pps2023india.com/
December
18th Pacific Polymer Conference - PPC 18
Date: December 3-7, 2023
Location: Puerto Vallarta, Mexico
Website: www.ppc18.com.mx/index.html
Polymers in Footwear
Date: December 5-6, 2023
Location: Nuremberg, Germany
Website: www.ami-events.com/event/ecf39069-81fa-414d-b1f800b020542568/summary?RefId=Website_AMI
Polymer Engineering for Energy
Date: December 5-6, 2023
Location: London, United Kingdom
Website: www.ami-events.com/event/ac4c147b-82c7-454090eb-f2fa9a2d4333/summary?RefId=Website_AMI
Polymers in Hydrogen and CCUS Infrastructure
Date: December 7, 2023
Location: London, United Kingdom
Website: www.ami-events.com/event/6a43b95c-4d3c-48fa-aed85448c37dbccd/summary?RefId=Website_AMI
2024
February
Polyethylene Films
Date: February 12-14, 2024
Location: Tampa, Florida, United State of America
Website: www.ami-events.com/event/3605e8c6-3e644ed6-9a13-2c11444ca907/summary?RefId=website_ AMI&rt=ZJWqCFC1sUuPSrZfsYSo5A
38th Australasian Polymer Symposium
Date: February 18-21, 2024
Location: Auckland, New Zealand
Website: www.auspolymersymposium.org.au/
March
9th International Conference on Fracture of Polymers, Composites and Adhesives
Date: March 24-27, 2024
Location: Eurotel Victoria, Les Diablerets, Switzerland
Website: www.elsevier.com/events/conferences/esistc4conference
May
Polymer Sourcing and Distribution
Date: May 14-16, 2024
Location: Brussels, Belgium
Website: www.ami-events.com/event/a555bb4d-c26b-4729-80fe05c535294593/summary?RefId=Website_AMI
39th International Conference of the Polymer Processing Society - PPS-39
Date: May 19-23, 2024
Location: Cartagena de Indias, Colombia
Website: pps39.uniandes.edu.co/
POLY-CHAR 2024 — Polymers for our future
Date: May 27-31, 2024
Location: Madrid, Spain
Website: congresosalcala.fgua.es/poly-char2024/ June
Polymers for sustainable future 2024
Date: June 24-28, 2024
Location: Prague, Czech Republic Website: imc.cas.cz/sympo/85pmm/
MACRO2024 — 50th World Polymer Congress
Date: June 30- July 4, 2024
Location: Coventry, United Kingdom Website: iupac.org/event/50th-world-polymer-congressmacro2024/
A G E N D A Polímeros, 33(2), 2023 E7
Sponsoring Partners
Polímeros, 33(2), 2023 ABPol Associates
E9


16/08/2023, 09:20 DBM revista polimeros - final.png https://drive.google.com/file/d/1hQt4WdgMAbvo5QlkIzpWl72jbq3DiTbU/view 1/1 Venha você também fazer parte do MAIOR evento técnicocientífico da América Latina sobre Polímeros. Atualmente estamos com 853 inscritos, 850 trabalhos submetidos e 18 empresas patrocinadoras. Para mais informações acesse: www.cbpol.com.br INSCREVA-SE e PARTICIPE! 17cbpol@abpol.org.br cbpol.com.br @cbpol 2023 16 3374 3949 17° Congresso Brasileiro de Polímeros 29 de Out a 02 de Nov de 2023 No Centro de Convenções Expoville em Joinville - SC 16 3374 3949
Bibliometric survey of the PVC production – Part I: the continuous polymerization challenge
Rafael Lima1 , Jonildo Silva2 , Mateus Vasconcelos2 , Carlos Alberto Castor Junior2,3 and José Carlos Pinto1,2*
1 Programa de Engenharia de Processos Químicos e Bioquímicos, Escola de Química, Universidade Federal do Rio de Janeiro – UFRJ, Rio de Janeiro, RJ, Brasil
2 Programa de Engenharia Química, Instituto Alberto Luiz Coimbra de Pós-graduação e Pesquisa de Engenharia – COPPE, Universidade Federal do Rio de Janeiro – UFRJ, Rio de Janeiro, RJ, Brasil
3 POLYMAT, Kimika Aplikatua Saila, Universidad del País Vasco/Euskal Herriko Unibertsitatea - UPV/EHU, Donostia, San Sebastián, España *pinto@peq.coppe.ufrj.br
Rbstract
Poly(vinyl chloride) (PVC) resins constitute the third most important plastic materials available commercially, in terms of worldwide volume production, and can be manufactured through several polymerization mechanisms, including free radical, ionic and redox polymerization processes. Approximately 80% of the worldwide commercial PVC production is performed through suspension polymerization processes in batch mode, due to intrinsic problems of continuous suspension polymerization processes, such as polymer incrustation in reaction vessels, transport equipment and pipes. For this reason, the present review provides an extensive bibliometric survey, including papers and patents, on attempts to develop continuous polymerization process technologies for PVC manufacture. Particularly, the present survey characterizes the degree of maturity and the main bottlenecks of continuous PVC processes that have been frequently overlooked in the technical literature.
Keywords: PVC, continuous polymerization, suspension polymerization, bibliometry.
How to cite: Lima, R., Silva, J., Vasconcelos, M., Castor Junior, C. A., & Pinto, J. C. (2023). Bibliometric survey of the PVC production – Part I: the continuous polymerization challenge. Polímeros: Ciência e Tecnologia, 33(2), e20230013. https://doi.org/10.1590/0104-1428.20220062
1. Introduction
Poly(vinyl chloride) (PVC) belongs to the group of the most important commercial plastic materials, being surpassed only by polyethylene (PE) and polypropylene (PP) in terms of worldwide volume production[1]. For example, in 2016 the global PVC production capacity reached 61 million metric tons[2]. Besides, the global PVC market was expected to grow from 24.39 billion dollars in 2020 to 29.56 billion dollars in 2021, representing an annual growth rate (CAGR) of 21.2%[2]. As a matter of fact, PVC has been widely used in many distinct areas, including building[3], construction[4], transportation[5], packaging[6], electrical[7], and healthcare applications[8], although commercialized with different commercial names, such as rigid PVC, flexible PVC and PVC film. In the construction industry, PVC is regarded as one of the most significant materials, consuming almost 50% of the commercially available PVC resins[9]. For instance, one can find PVC pipes and tubing in several civil engineering applications that include water supply, drainage, and electrical conduits.
PVC is manufactured through polymerization of vinyl chloride monomer (VCM) and Figure 1 schematically represents the usual PVC production chain from raw materials.
R R R R R R R R R R R R R
The purification steps were omitted from Figure 1 for the sake of conciseness. Based on the proposed scheme, one can observe that the PVC business depends on the petrochemical industry for the supply of ethylene, but also on the chloralkali industry for supply of chlorine (from brine), another primary feedstock for the PVC production process.
PVC was originally discovered, accidentally, by the chemist and physicist H.V. Regnault, in 1838, who was also responsible for the first synthesis of vinyl chloride in collaboration with von Liebig, in 1835. Then, chemist E. Baumann also synthesized PVC years later in 1872, explaining why both investigators are normally considered responsible for the discovery of PVC[10]
The commercial production of PVC started in Germany in the 1930’s and the onset of the war (1939-1945) fueled its demand[11]. Nowadays, it is well-known that PVC can be synthesized through several polymerization mechanisms, including free-radical (most common commercially)[12], anionic[13], cationic[14] and redox polymerization mechanisms[15]
For example, Table 1 illustrates the main mechanistic steps when the free-radical technique is used for manufacture of PVC.
https://doi.org/10.1590/0104-1428.20220062
Polímeros, 33(2), e20230013, 2023 ISSN 1678-5169 (Online) 1/18
Regarding the production processes, PVC can be produced through mass or bulk, suspension, emulsion and solution polymerizations, mostly in batch or semi-batch modes. However, almost 81% of the PVC produced commercially worldwide are based on suspension polymerization processes[16]. Nevertheless, to this date, no feasible commercial suspension processes can be operated in continuous mode, mainly due to intrinsic problems of the suspension polymerization process, such as polymer incrustation (fouling) in transport equipment and pipes.
Based on the previous paragraphs, the main objective of the present work is to present an extensive bibliometric survey, including papers and patents, on PVC process technology. Particularly, it is intended to report the maturity and the main bottlenecks of continuous suspension PVC polymerization processes that have been frequently overlooked in the technical literature. Before diving into the bibliometric survey, a brief description of reaction mechanisms and processes are provided.

2. PVC Polymerization
2.1 Free-radical mechanism
At the industrial level, PVC is produced mostly through free-radical polymerizations (FRP)[17]. A typical FRP mechanism includes many fundamental reaction steps, as shown in Table 1. As a matter of fact, several investigators studied the kinetic aspects of vinyl chloride polymerization and proposed detailed mechanisms that consider many other additional fundamental steps, needed to describe the final properties of the PVC resin[18-20]. Particularly, among the many monomers that can polymerize through FRP, vinyl chloride stands out for showing characteristically high kinetic rate constants for transfer to monomer[21]. In fact, this characteristic explains why the average chain length of the polymer material (the number-average molar mass of commercial PVC grades usually ranges from 50 kDa to 100 kDa) is controlled by the reaction temperature. Moreover, the termination reactions occur mostly by disproportionation[22]
2.2 Bulk process
The bulk or mass polymerization process can be regarded as the most elementary polymerization technique, as the pure monomer (or mixture of comonomers) and one or more suitable initiators are mixed and used as reactants, leading to a final product that contains a mixture of residual unreacted monomer and the produced polymer[21]. As a matter of fact, the necessity of fewer purification steps constitutes one of the greatest advantages of the bulk process[23]
Two industrial processes have been commonly used to perform the bulk polymerization of vinyl chloride: the single-stage and the two-stage polymerization processes[11]. In both cases, a mixture of VCM and initiator is fed into the reaction vessel and heated to the desired reaction temperature in order for the polymerization reaction to take place. However, in the two-stage process the reactor content is transferred to a second vessel when conversion reaches approximately 10%, leading to conversions around 85-90% in the second vessel[23]. As PVC is not soluble in its monomer, a third phase (besides the liquid and gas phases) appears after about 2% of conversion[20,24]. Therefore, in the two-stage process the first reactor is used to produce
Lima, R., Silva, J., Vasconcelos, M., Castor Junior, C. A., & Pinto, J. C. Polímeros, 33(2), e20230013, 2023 2/18
Figure 1. Schematic representation of the PVC production chain.
Mechanism Step Reaction Initiation * 2 d k II → * 1 ki IMR +→ Propagation 1 p k nn RMR + +→ Transfer to monomer 1 ktm nn RMPR +→+ Transfer to polymer ktp nmnm RPPR +→+ Termination by combination ktc RRPnmnm + +→ Termination by disproportionation ktd nmnm RRPP +→+ I: initiator; I*: initiator fragment; M: monomer; R I : free-radical growing chain of size i; PI: dead polymer chain of size i; kD, kI, kP, kTM, kTP, kTC, kTD: kinetic rate constants.
Table 1. Typical free-radical vinyl chloride polymerization mechanism.
the PVC polymer seeds for better control of the particle morphology. An important aspect of the bulk polymerization technology is related to the removal of the heat released by reaction. Inefficient mixing combined with poor heat removal can lead to development of hot spots, posing important control and safety issues to the operation[21]. At the end of the reaction, the PVC resin is obtained in the form of spherical polymer particles with diameters ranging from 50 to 150 μm and with high porosity[23]. The difficulty to manipulate the morphological features of the final polymer powder constitutes a major drawback of this process and can explain why the suspension polymerization process became so popular in the industrial field.
2.3 Solution process
The solution polymerization of VCM is not employed industrially very frequently[25], as an organic solvent must be removed to recover the PVC resin. As a matter of fact, the use of solvent imposes the implementation of multiple purification steps, to recover the resin and the residual monomer and to recycle the solvent, leading to additional equipment and operational costs[23,26]. Despite that, the solution process can present some competitive advantages when compared to the bulk process. Firstly, the solvent can make the removal of heat easier; secondly, the solution (or dispersion, if the polymer is not fully soluble in the solvent) viscosity can be lower during the reaction, demanding less energy for mixing[21]. From the chemical standpoint, chain transfer to solvent may also take place, reducing even further the average molar mass of the polymer product[27]. Finally, the PVC particles are obtained in the form of spherical polymer particles with diameters ranging from 50 to 150 μm and with high porosity[23], although the morphological features of the product are difficult to manipulate, reinforcing the competitive advantages of the suspension polymerization processes.
2.4 Emulsion process
Emulsion and suspension VCM polymerizations share some subtle similarities, in the sense that both are performed in the presence of a dispersed monomer phase. However, as thoroughly discussed in the literature, there are some important differences related to the particle size, type of initiator, particle nucleation mechanism and dependence of reaction rates on reaction parameters[21]. First, polymer particles obtained through emulsion polymerizations are much smaller, with typical sizes lying on the nanometric scale (typically 100 to 500 nm) and forming a stable latex. Polymer particles are formed after nucleation of monomer swollen surfactant micelles by free radical fragments produced by aqueous soluble initiators, such as potassium persulfate, and under continuous strong agitation[23]. The monomer feed usually lies in the range 30–46 wt%, so that the presence of water makes thermal and viscous effects much less relevant than in the bulk process, which also makes the process control easier[21]. However, the energy demanded to separate the very fine PVC particles can be extremely high, justifying the commercialization of the latex as the final polymer product[11]. Indeed, PVC latexes have been widely used for manufacture of films, adhesives and covering of hard and soft surfaces, representing 15% of the PVC commercial market.
2.5 Suspension process
It is estimated that 80% of the PVC produced worldwide is obtained through batch suspension polymerizations, making this the most important PVC polymerization process[16] Figure 2 shows a general schematic representation of a typical suspension polymerization process, which makes use of large batch stirred tank reactors, so that the heat removal capacity is of paramount importance to guarantee the safety of the industrial plant operation[28]
In standard suspension polymerizations, the initial reacting mixture (a mixture of monomer and oil soluble initiators) is suspended in water (through suitable combination of agitation speed and addition of suspending agents) and heated until the desired reaction temperature, where the polymerization reaction occurs. Contrary to the emulsion process, the polymer chains are then formed inside the previously dispersed monomer droplets. From a microscopic point of view, one can assume that each dispersed monomer droplet acts as a small bulk reactor. For this reason, the bulk and suspension processes present very similar kinetic features[27,29]
Particularly, the presence of the suspending aqueous phase improves the heat removal from the reacting mixture and reduces the effective viscosity of the dispersion[30], also allowing production of spherical polymer particles with characteristic diameters ranging from 10 to 500 μm[29]. It is important to notice that manipulation of both agitation and surfactants (type and amounts) can allow the control of the particle morphology, which is very important for commercial purposes and partially explains the success of this technology. Indeed, the particle porosity plays an important role in the final application of the resin, since it controls the rates of plasticizer adsorption and the interaction of the resin with the plasticizers, affecting the performances of processing stages and the final properties of PVC pieces[31]
For the previously discussed reasons, many efforts have been made to develop commercially feasible continuous PVC suspension polymerization processes, although inherent process characteristics have prevented the successful

Bibliometric survey of the PVC production – Part I: the
challenge Polímeros, 33(2), e20230013, 2023 3/18
continuous polymerization
Figure 2. General schematic representation of a suspension polymerization reactor.
industrial operation of continuous processes so far. In this context, technological attempts, existing bottlenecks, and some future perspectives for development of continuous PVC suspension polymerization processes are discussed in the following sections.
3. Data Source and Methodology
3.1
Initial searches
Initially, a top-down searching approach was employed, where the initial searches were used to provide general overviews of the investigated technologies and the subsequent searches were performed to narrow down the scopes of the analyzed fields. The performed surveys were focused mainly on the continuous production of PVC, on continuous suspension polymerization processes and on the main commercial processes used worldwide by the PVC industry. The investigations were performed with the help of electronic search tools including Web of Science (for papers) and EspaceNet (for patents). The following keywords were used to perform the initial searches:
• Search 1 – “suspension AND polymeri?ation AND (PVC OR polyvinyl chloride OR poly(vinyl chloride) OR poly vinyl chloride)”;
• Search 2 – “continuous AND suspension AND polymeri?ation”;
• Search 3 – “continuous polymeri?ation AND (PVC OR polyvinyl chloride OR poly(vinyl chloride) OR poly vinyl chloride)”
For patents, a filter was used for the Cooperative Patent Classification (CPC) and the International Patent Classification (IPC) fields (C08) in order to refer to “organic macromolecular compounds, its preparation or chemical processing and compositions based on them”. Additionally, the search filter for keywords in the title or in the summary of documents was used. Considering the search of papers, the query was applied to the topic filter, which is a special filter from Web of Science that can be applied to title, abstract, author keywords, and Keyword Plus®. The data analysis of papers for clustering visualization was made using the software VOSViewer (version 1.6.18).
Thus, the main objective of the proposed procedure was to prioritize works that, in fact, were related to the production methods and respective processes, discarding research on either product processing or new applications. More specifically, Search 1 aimed to identify technical innovations related to the PVC suspension production process. In addition, Search 2 was conducted to investigate innovations related to the continuous suspension polymerization process, regardless the produced polymer. Search 2 assumed that methodologies used successfully to produce other polymers through suspension polymerizations might be eventually extended for PVC, after necessary improvements/adaptations. Finally, Search 3 intended to characterize innovative activities related to the continuous suspension polymerizations of VCM. The obtained results are reported in the following sections, including the general statistical analyses of the obtained data.
3.2 Types of processes (bulk, solution, emulsion, suspension)
For better assessment of the current technological status of PVC manufacture, searches were targeted at the different types of industrial PVC production processes. This subdivision can be justified by the fact that different processes demand the use of different technologies due to the intrinsic features of each process. Additionally, clustering the data in accordance with the production processes favors the interpretation and analysis of available data. For this reason, after finishing the initial searches, additional filters were applied to group the obtained references in the form: (i) bulk – “bulk polymeriz* OR bulk polymeris* OR mass polymeriz* OR mass polymeris*”; (ii) solution – “solution polymeriz* OR solution polymeris*”; (iii) emulsion – “emulsion polymeriz* OR emulsion polymeris”; and (iv) suspension – “suspension polymeriz* OR suspension polymeris*”
4. Results and Discussion
4.1 Initial search from patents
After Search 1, 365 documents were found. Figure 3 depicts the distribution of patents from 1932 to 2021. Between the 1960s and 1980s there was significant increase of patent application activity in the field, most likely due to the development of PVC stabilization technologies and the growing PVC use in civil construction applications[32] From the 1980s, it is possible to observe a clear trend to reduce the number of documents published per year, a fact that can be explained by the technological maturity of the PVC production technologies and publication of studies that indicated the VCM toxicity to human health[32]. These studies reported that VCM might be associated with angiosarcoma (a type of cancer in the liver) and that PVC dust inhalations might cause cancer of the lung and other organs[33]. However, the number of patents has substantially increased again since 2015, due to the fast development of PVC plasticizer technology and increasing demand for PVC in China (51 Chinese patents out of 59 deposited documents in the period). This Chinese interest in PVC has been strongly correlated with the growing internal demand associated with the construction activity in China[34]
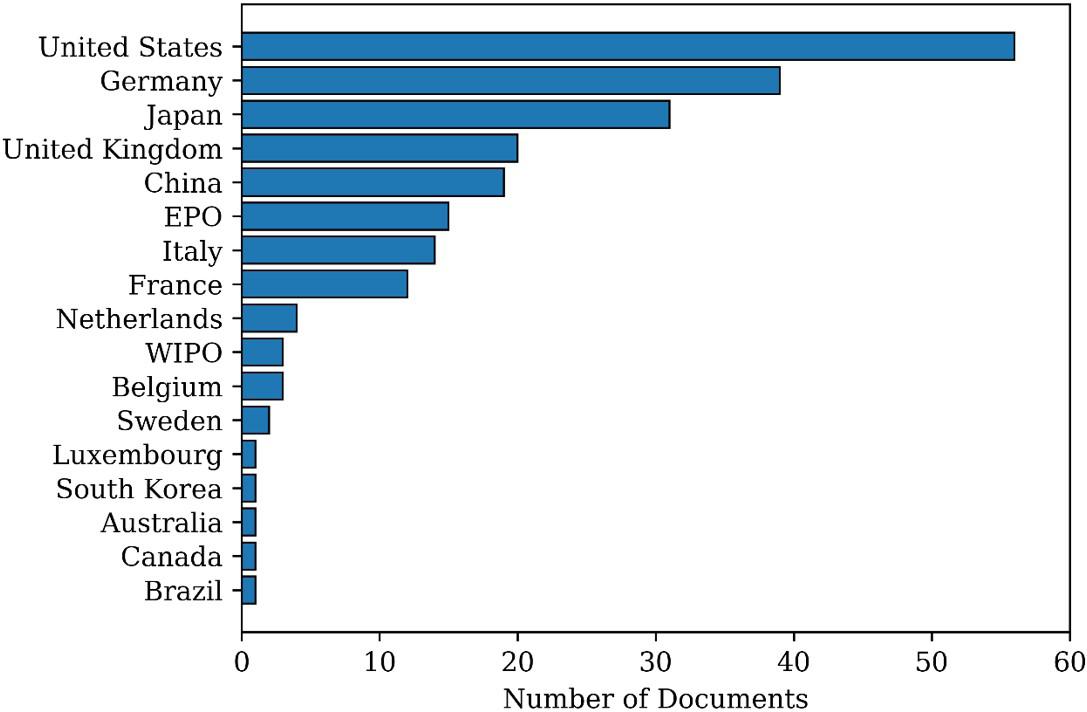
Figure 4 reports the number of patents filed in each priority country. A concentration of documents can be perceived in China, United States, Germany, and Japan,

Lima, R.,
J.,
Polímeros, 33(2), e20230013, 2023 4/18
Silva,
Vasconcelos, M., Castor Junior, C. A., & Pinto, J. C.
Figure 3. Annual production of patents as found in Search 1.
Bibliometric survey of the PVC production – Part I: the continuous polymerization challenge
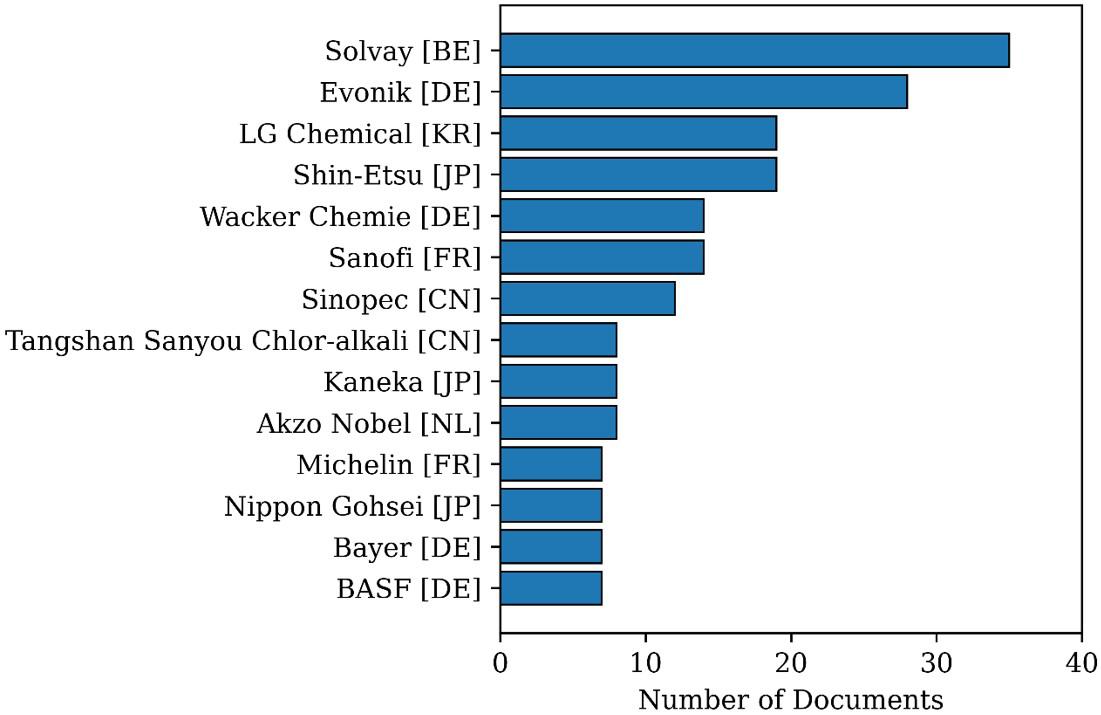
which are the countries of origin of the main market players and where the PVC production volumes are the largest in the world. Figure 5 reports depositors identified in the first search. Only companies that deposited 8 or more patents are described for the sake of conciseness. It can be observed that Solvay (Belgium) stands out with 35 deposited patents, many of them coming from companies acquired by Solvay, such as Satuffer Chemicals (USA) and Rhone Poulenc (France). Evonik Industries AG (Germany) also acquired some important companies, including Werke Hüls (Germany) and Degussa (Germany), being the second largest depositor. Shin-Etsu (Japan) and LG Corporation (South Korea) are also important Asian players, a region that has shown considerable growth since the 1990s. Particularly, LG deposited its first document in 2003, being the largest depositor in recent years.
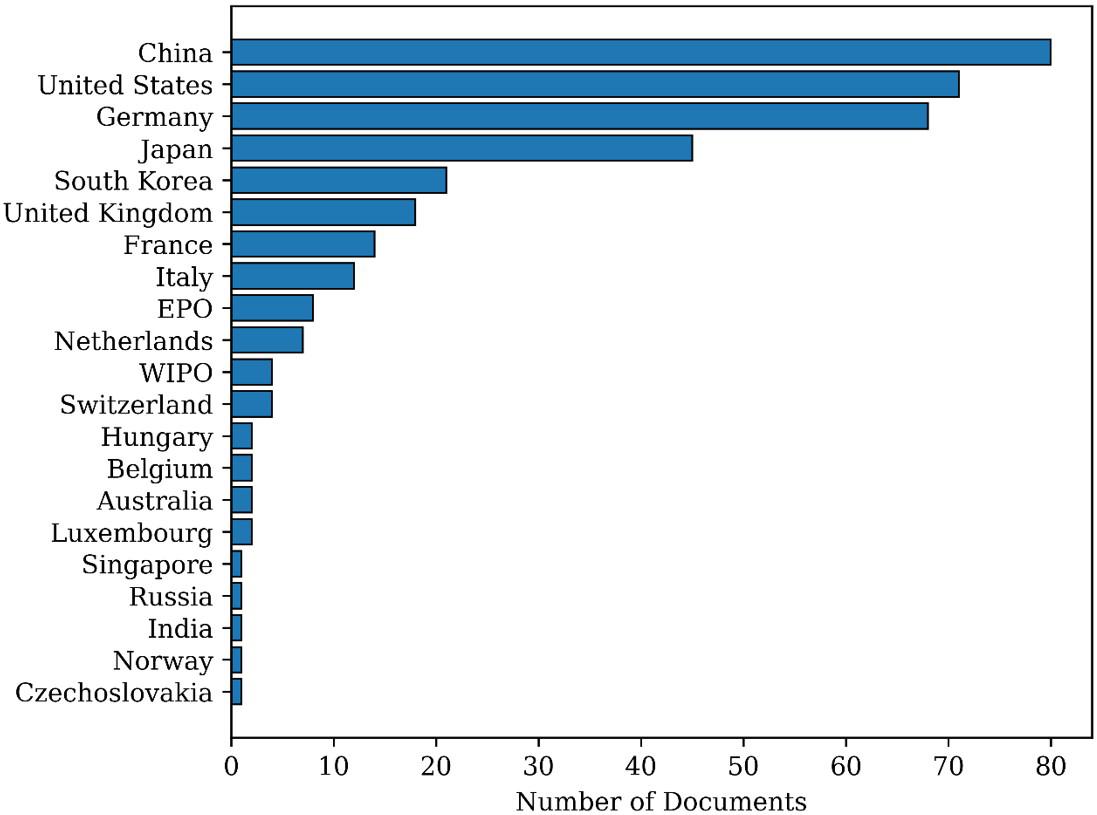
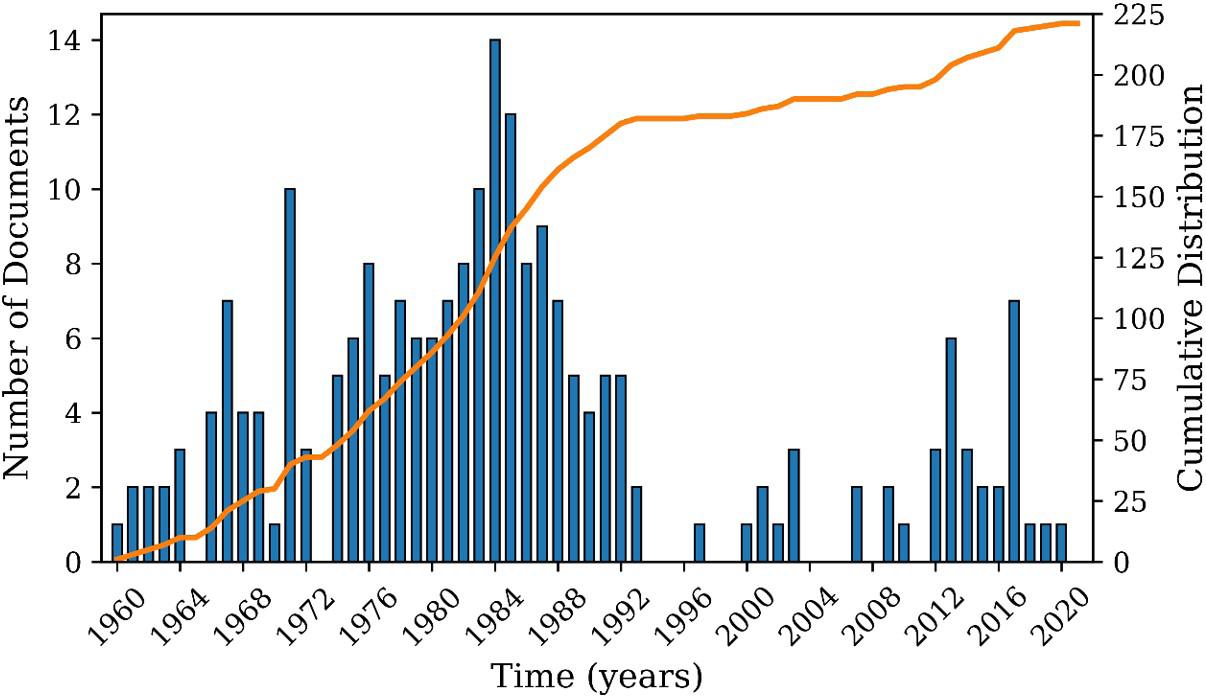
In Search 2, 225 documents were found. Figure 6 reports the number of patents deposited between 1946 and 2021 about the development of continuous suspension polymerization processes. It can be observed that the interest in the analyzed subject has remained practically constant over the years and that the patents were filed mostly in the United States, Germany, Japan, and the United Kingdom, as shown in Figure 7. It must be observed that the patent leaders listed in Figures 4 and 7 are essentially the same, which suggest a close relationship between the two analyzed subjects:
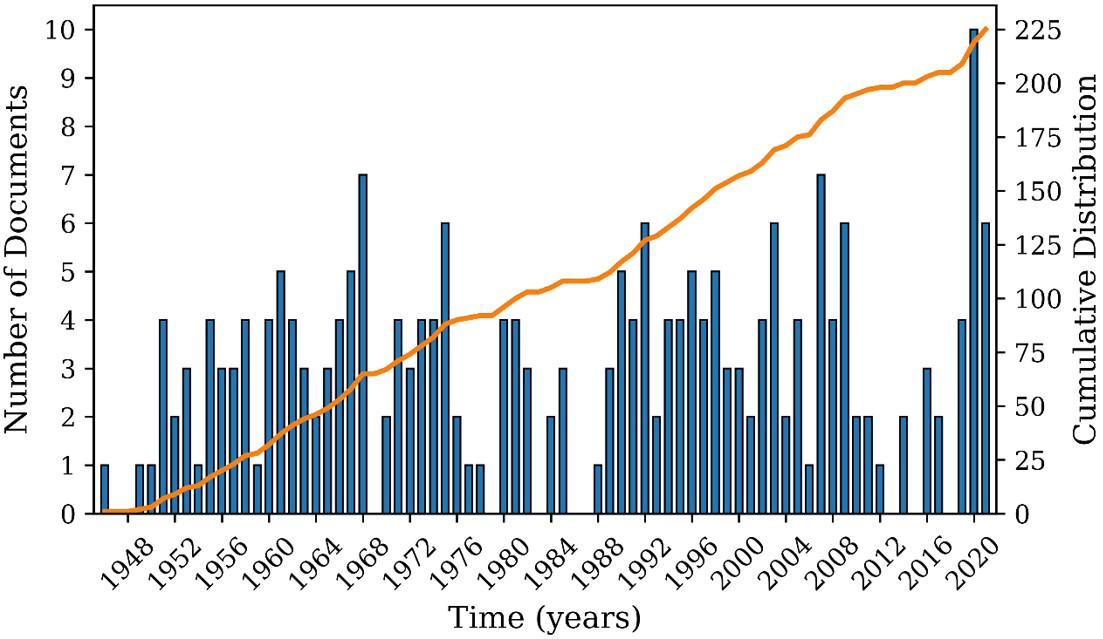
interest in developing PVC technologies and continuous suspension polymerization processes.
Figure 8 reports the most active depositor companies in the field of continuous suspension polymerizations. It can be observed that the scenarios presented in Figures 5 and 8 are quite different, clearly indicating that innovative activity in the field of continuous suspension polymerizations is not driven by the PVC market, as suggested in the previous paragraph. It is also interesting to observe that traditional

33(2), e20230013, 2023 5/18
Polímeros,
Figure 4. Distribution of patent documents per country as found in Search 1.
Figure 5. Distribution of patents in the most productive institutions as found in Search 1.
Figure 6. Annual production of patents as found in Search 2.
Figure 7. Distribution of patent documents per country as found in Search 2.
Figure 8. Distribution of patents in the most productive institutions as found in Search 2.
chemical companies, such as Dow Chemical Co. (USA), Bayer (Germany) and LyondellBasell (Netherlands), have developed many technologies for production of suspension polymer powders that are not related to PVC.
In Search 3, 15 documents were found. However, after analyzing the patents, it was found that only five of them were related in fact to developments of continuous PVC suspension polymerization processes. Bubsy[35] (patent by Imperial Chemical Industries, GB, now Akzo Nobel, NL) developed a process for producing porous PVC particles in continuous, batch or semi-batch systems. According to the author, when the process is operated continuously, it is preferred to feed VCM to the reactor in gaseous form to avoid polymer accumulation on the reactor walls. The author also reports that the obtained particles may present a wide size distribution with many fine particles. The most important claim of the patent was the design of the reaction vessel, which comprised two concentric chambers separated by a solid wall, so that the organic dispersion was forced to flow through two effective reactors connected in series, to narrow the residence time distribution and, consequently, also the particle size distribution. Following a similar line of thought, Dirix et al.[36] (patent from Akzo Nobel, NL) claimed a VCM suspension polymerization or copolymerization process that can be conducted continuously in a series of continuous stirred tank reactors (CSTRs). The authors reported that 2 to 5 CSTRs should be used in the series, although the last reactor of the series should be operated in batch mode to complete the reaction.
Kircher Jr. et al.[37] (patent from Detrex, US) developed a continuous VCM suspension polymerization process based on two jacketed CSTRs connected in series, characterized using a mixing device to prepare the suspension that was fed into the first vessel of the series and by the partial recirculation of the organic dispersion produced in the vessels. The authors reported that such proposed reaction scheme allowed the enhanced control of the particle size distributions and reduction of polymer fouling on the reactor walls and accessories. Klippert et al.[38] (patent from Hoechst, DE) also proposed the use of a set of multiple reactors in series (in this case, 3 tubular reactors) to perform the continuous polymerization of VCM. The authors claimed that the proposed design of the internal walls and accessories and a particular positioning and geometrical features of the reaction vessels allowed the narrowing of the particle size distributions and reduction of polymer fouling.
Weibin et al.[39] (patent from Huayang New Material Tech Group Co., CN) proposed a scheme comprising a prepolymerization tank and a series of larger polymerization tanks. The proposed scheme allows the continuous operation of the process even when the reactors are operated in batch mode. Particularly, when the reacting slurry is transferred to the next vessel, the cleaning and coating steps can be performed in the previous vessel, diminishing the overall shut down time of the plant. Additionally, hydrocyclones are used to separate the components of the slurry that flow from the main polymerization tanks. Particularly, the authors reported significant reduction of water consumption (from 3-4 to 1.5-2.5 tons of water per ton of PVC) and increase of productivity (from 43 to 65 tons of PVC per day) in the proposed process.
Hong et al.[40] (from Yibin Tianyuan Group Co, CN) disclosed a method to perform the continuous production of PVC resins using microreactors. The proposed system comprises three reacting zones, which are designed to guarantee the achievement of a specified monomer conversion level. In order to maintain the reaction temperature at the desired value in each individual zone, the reaction temperature control should be performed independently for each reacting zone.
Based on the previous paragraphs, it becomes very clear that few processes have been claimed for the continuous manufacture of PVC powders produced in aqueous suspensions and that this does not reflect the much higher interest in developing continuous polymerization processes and suspension polymerization technologies. The few patents available in the field reveal that the authors acknowledge difficulties to control the residual monomer contents, the particle size distributions, and the incrustation of polymer on the internals and reactor walls. This can be related to the intrinsic characteristics of the VCM polymerization reactions (such as the heterogeneous nature of suspended droplets)[41] and the very polar nature of the PVC molecular structure, which facilitate the interaction with other materials and compounds (also facilitating sticking to metal surfaces and particle agglomeration)[42], as discussed in the following sections. Besides, patents normally proposed processes that comprise a number of different reactors arranged in series in order to narrow the residence tie distribution and allow the better control of the final particle size distributions, implicitly acknowledging that this is indeed a fundamental problem in the analyzed field. Unfortunately, this can also lead to additional internal contact areas and incrustation problems.
4.2 Initial search from scientific papers
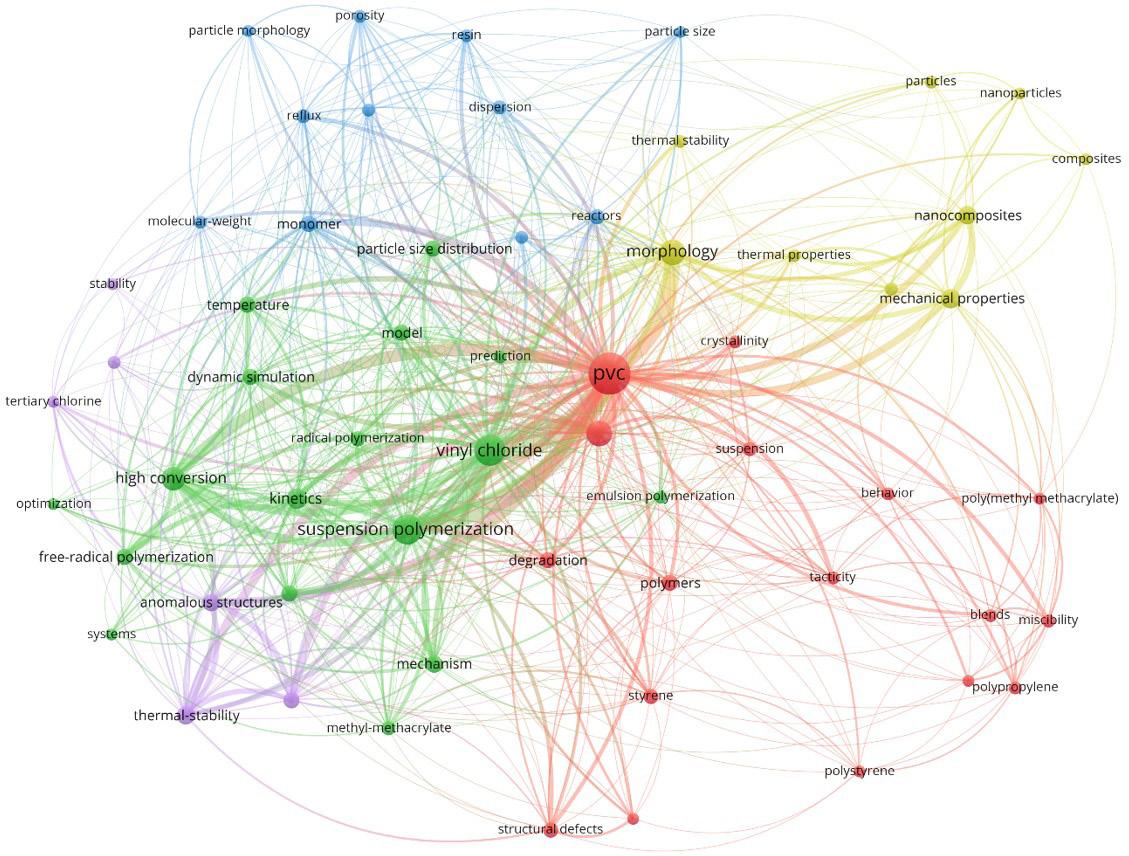
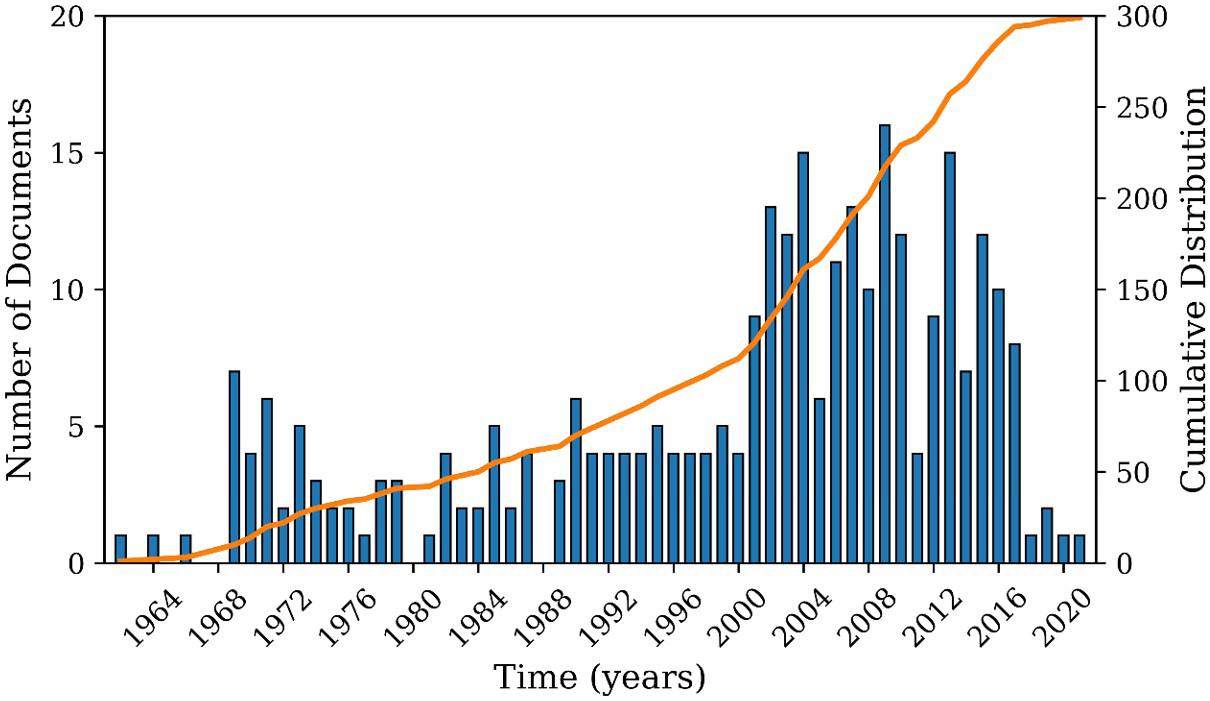
After Search 1, 249 documents were found after removing non-relevant works. It can be seen in Figure 9 that publications on the subject became more frequently in 1976. The largest number of publications (20 papers) occurred in 2009, even though no trend or concentration of publications by a specific research group was identified. It is interesting to observe that these numbers are similar to the ones observed for patents, which is rare and probably due to regulatory constraints regarding handling of the VCM monomer in academic research environments[43,44] Figure 10 shows the network visualization map for keywords used in papers for Search 1 and its respective references. As expected, “PVC” was

Lima, R.,
J.,
Polímeros, 33(2), e20230013, 2023 6/18
Silva,
Vasconcelos, M., Castor Junior, C. A., & Pinto, J. C.
Figure 9. Annual production of scientific papers as found in Search 1.
the most frequent keyword with 119 occurrences, followed by “vinyl chloride” with 57 occurrences. Other frequently used keywords were “suspension polymerization” (51), “morphology” (35), “high conversion” (28), “kinetics” (19), and “mechanical properties” (18). As suspension polymerization is the process used most often to perform vinyl chloride polymerizations, this was one of the most used keywords, usually involving studies about particle morphology and reaction kinetics.
Figure 11 shows the network co-citations map of the 25 most cited articles from Search 1. It can be observed that there are two big clusters of co-citations led by Xie et al.[20] and Smallwood[45], which can possibly be regarded as the most import references among the articles found in Search
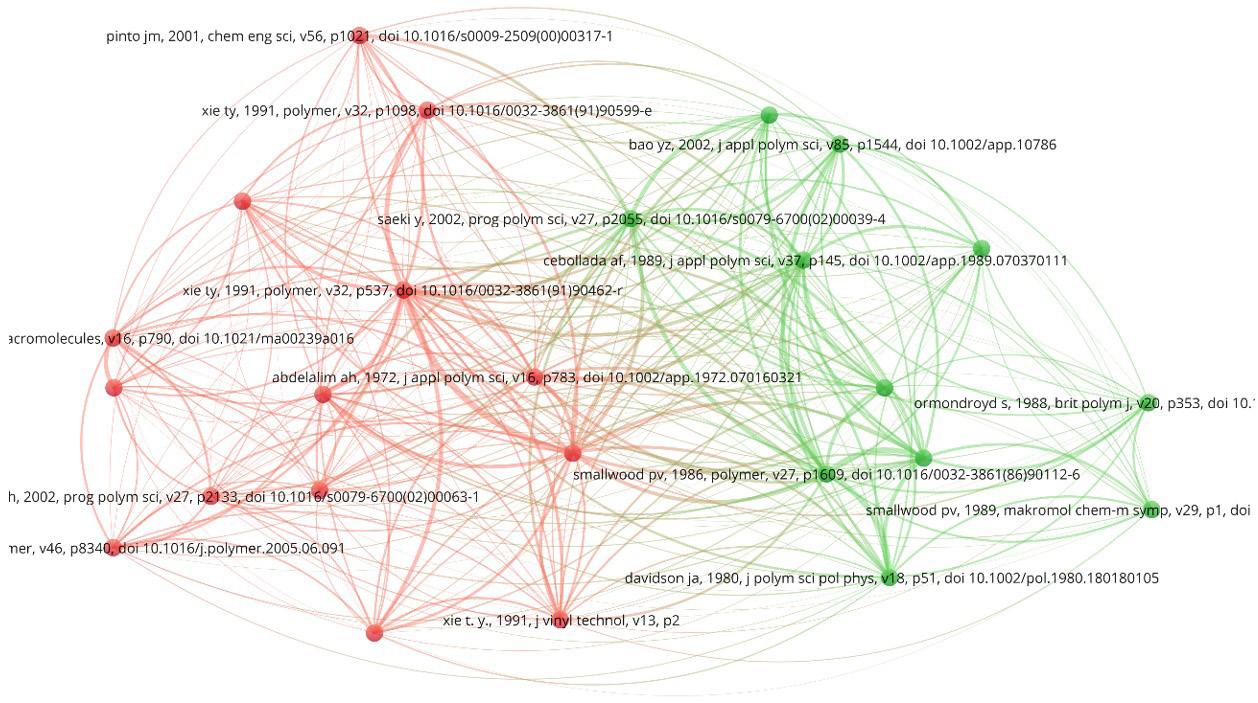
1. Xie et al.[20] developed an experimental study about vinyl chloride polymerizations in bulk and suspension processes focusing on the mechanism, kinetics, and modeling at high conversions, becoming the third article from a vinyl-chloride polymerization series[20,46-52]. Smallwood[45] developed a study about the effects of the operation conditions on the performances of vinyl chloride suspension polymerizations, focusing on the product porosity and molar masses. (Curiously, Smallwood’s work was not found by Search 1 because its abstract is not available in the Web of Science database and its title does not contain the word “polymeri?ation”.)
Table 2 reports the ranking of the most cited works based on Search 1 for articles. As mentioned earlier for the Smallwood[45] case, the works by Cebollada et al.[53],
Polímeros, 33(2), e20230013, 2023 7/18
Bibliometric survey of the PVC production – Part I: the continuous polymerization challenge
Figure 10. Network visualization map of keywords used for papers in Search 1.
Figure 11. Network co-citations map of the 25 most cited articles in Search 1.
Allsopp[54], Hjertberg and Sörvik[58], and Xie et al.[59] were not included in Search 1. Starnes[60] reported a review about thermal degradation of PVC. Particularly, no significant trend or concentration of publications could be detected in a particular research group. It is also worth noting that most analyzed publications evaluated modifications of the reaction formulation and process conditions for improvement of the process operation[61-63] and investigated the effects of different comonomers on the final properties of the obtained products[64,65]. Therefore, the scopes of the academic investigations were very different from the scopes of the patent literature, concentrated on the development of new processes, reactors, and products and particularly on the narrowing of particle size distributions and reduction of polymer fouling on internal reactor surfaces.
Table 3 shows the ranking of institutions according to the number of publications in the field. According to Table 3, the Zhejiang University (China) is the institution that publishes papers more frequently in the field, following the trend already observed for China in patents. Isfahan University of Technology (Iran) also appears as an important center of research in quantity of papers.
Usually, the number of papers for a given topic in the field of polymerization processes is much higher than the number of patents. However, this is not what is observed for PVC, given the difficulties imposed for use of VCM in universities due to its carcinogenic and explosive character[33] Particularly, 318 papers were found after Search 2. However, when these papers were analyzed, it was observed that few in fact regarded continuous suspension polymerization processes. This occurred because of the constant use of the term “continuous” in other contexts within the publications, “deceiving” the search engine. When analyzing the titles of all downloaded papers, only 17 of the publications were indeed related to continuous suspension polymerization processes. Among these papers, only 9 of them described experimental studies[66-74]
Liu et al.[70], Zourob et al.[74], Sen et al.[72], Wang et al.[73], and Bally et al.[67] investigated the use of microreactors to perform suspension polymerizations, whereas Lobry et al.[71] investigated the use of continuous oscillatory baffled reactors (COBR)[75,76] to produce suspension polymer powders. Even though Lobry et al.[71] mentioned the production of poly(vinyl chloride) in their work, the study was performed on vinyl acetate polymerization instead. Other works published by Pinto[77,78], Hatate et al.[79], Galkin et al.[80], Galkin et al.[81], and Kim et al.[82] were based on numerical investigation, simulation or CFD studies. The few academic works related to continuous suspension polymerization processes can be justified by the high operational costs of these reactions, since reagents must be used continuously, by the long periods of reaction needed to perform meaningful experimental analyses and attain steady-state operation conditions, and by the technological difficulties related to development of fouling on reactor internals, which still constitutes a significant unsolved technological problem in this field.
After Search 2, it becomes possible to conclude that the number of publications in the field of continuous suspension VCM polymerizations is very small. This is reinforced by results obtained after Search 3, which detected 22 papers
that were not related to continuous polymerization processes at all. Apparently, only 2 papers dedicated to numerical investigations analyzed the nature of continuous suspension VCM polymerization processes[77,78], emphasizing that these systems may present complex dynamics and multiple steady states. Although the published papers by Bodoc et al.[83] and Castor[64,84] were not listed in both Search 2 and Search 3, they are listed in Search 1 and investigated VCM polymerization in microreactors. Additionally, the authors were not listed because did not use “continuous” and “suspension” together either in title, abstract or keywords. However, it is important to highlight those works because of their scientific relevance in the polymerization field when dealing with VCM in microreactors.
Based on the obtained results, it can be said that research institutes and universities have contributed mainly with the development of kinetic mechanisms and process models for VCM suspension polymerizations, providing very limited support for development of continuous processes. Although this gap can be understood by the reasons already presented, this disconnection between the research carried out in industrial and academic environments can possibly
Lima, R., Silva, J., Vasconcelos, M., Castor Junior, C. A., & Pinto, J. C. Polímeros, 33(2), e20230013, 2023 8/18
Ranking Reference Citations 1 Xie et al.[20] 39 2 Smallwood[45] 38 3 Saeki and Emura[26] 36 4 Kiparissides et al.[18] 31 5 Cebollada et al.[53] 29 6 Allsopp[54] 28 7 Davidson and Witenhafer[55] 27 8 Starnes et al.[56] 25 8 Abdelalim and Hamielec[57] 25 9 Hjertberg and Sörvik[58] 21 10 Xie et al.[59] 20 10 Starnes[60] 20
Table 2. Ranking of the most cited works of Search 1 for articles with 20 or more citations.
Ranking Institutions Documents 1 Zhejiang University - CN 19 2 Isfahan University of Technology - IR 14 3 Aristotle University of Thessaloniki - GR 10 3 Loughborough University - GB 10 3 Israel Institute of Technology - IL 10 4 Ghent University - BE 9 4 University of Coimbra - PT 9 5 Federal University of Rio de Janeiro - BR 7 5 CIRES - PT 7 6 Braskem - BR 6 7 MacMaster University - CA 5 7 Slovak University of Technology in Bratislava - SK 5
Table 3. Distribution of scientific papers by institutions as detected in Search 1.
explain why significant breakthroughs have been relatively scarce in this field.
4.3 Types of processes from patents
The search carried out for solution polymerizations resulted in 48 documents, although only 28 of them were indeed related to VCM solution polymerization processes. Due to the small number of documents, it is not possible to observe trends related to the use of this polymerization procedure. Among the main subjects of these documents, modification of PVC formulations and prevention of fouling stand out. Modifications of PVC formulations are certainly powered by market demands, while prevention of fouling constitutes a still unsolved industrial problem that prevents the development of continuous operations and encourages innovative applications.
As shown in Figure 12, Japan is the country where most patents were filed as priority, mainly because Japanese companies also lead the number of deposits. As the solution VCM polymerization process is not commercially important and there is little demand for solution PVC materials, the number of patents on the subject is also small. As pointed out previously, the small interest in solution polymerization processes is due mainly to the high downstream costs of solvent removal and purification.

The search carried out for bulk polymerizations resulted in 221 documents. It can be seen in Figure 13 that the same production profile observed after Search 1, as illustrated in Figure 3, could be observed for patents related to VCM bulk polymerization systems. The reduction of patent production after 1984 can be justified by the maturity of the technology, but also to investigations related to VCM toxicity and consequent enforced regulations[44]. Particularly, VCM bulk polymerizations can generate very fine polymer powders, which can lead to processing problems and be harmful to health by inhalation during handling[33]. It must also be emphasized that it is difficult to manipulate the morphological features of bulk PVC powders, which can also explain why Figure 13 clearly shows the significant reduction of interest in this technology. Nevertheless, Table 4 shows a list of the most active patent depositors in the last 20 years in this field. Although LG Chemical (South Korea) has led the number of deposits in recent years, most of the patents have been filed by Chinese companies, following the demands of the Chinese construction market.
Regarding the technologies covered by the patents deposited in the field, strategies to reduce the production of fines, modifications of the resin formulations and manipulation of process variables (agitation speed, for example) to optimize the process performance stand out[85,86]. The reduction of
fines constitutes a recurring concern in patents related to VCM bulk polymerization processes because the final polymer particles, if measures are not taken, can be very small, causing processing operation problems and health risks to those who handle the powder[23]. For this reason, the use of dispersants, such as Mg4Al2(OH)12CO3·3H2O, has been reported to increase the average particle size of the resin[85]. Nevertheless, in the last 20 years only one patent reported the existence of problems related to fouling in bulk polymerization processes of VCM. In this case, Hong et al.[87] (patent from Yibin Tianyuan Group Co., CN) recommended the use of nitric acid to reduce the pH of the reaction medium and avoid the formation of polymer aggregates and fouling. According to the authors, nitric acid acts as a passivator on the internal surfaces of stainless steel reactors, reducing the adhesion of polymer material onto the metal surfaces. Apparently, this patent exerted little influence on other alternative PVC technologies.
Bibliometric survey of the PVC production – Part I: the continuous polymerization challenge Polímeros, 33(2), e20230013, 2023 9/18
Figure 12. Distribution per country of patents related to solution polymerizations of VCM.
Figure 13. Annual production of patents related to bulk polymerizations of VCM.
Ranking Institutions Documents Percentages 1 LG Chemical (South Korea) 6 16.2% 2 Yibin Tianyuan Group (China) 5 13.5% 3 Chengdu Sino-Metal Tools (China) 2 5.4% 4 Starna Group (Italy) 1 6.3% 5 Wenzhou University (China) 1 6.3% 6 Sabic (Saudi Arabia) 1 6.3%
Table 4. Distribution of patents in the 6 most productive institutions in the field of bulk polymerization of VCM in the period 2001-2021.
502 documents were found for emulsion VCM polymerizations. It can be seen in Figure 14 that the interest in PVC emulsion technologies grew fast in the 1970s on, remained approximately constant until the mid-2000s and apparently diminished after that. This seems to be connected to the technological maturity achieved by emulsion PVC processes, as the main trends of the PVC field discussed previously and shown in Figure 3 cannot be observed in this case. It is important to highlight that PVC emulsions are used widely to manufacture plastisol and pastes for coating and paints[88]. As a matter of fact, in the past 20 years, 75 patents have been filed on this particular subject.

Table 5 reports the most productive patent depositor companies in the last 20 years in the field of VCM emulsion polymerization. As one can see, LG Chemical leads the list with large advantage over its competitors due to the special corporate attention to PVC plastisol and pastes markets. Besides, Asian companies have been dominating the innovative activity in this field, being responsible for about 75% of patent deposits in the last 20 years, which is aligned with the growing demand for PVC in Asia.
Regarding the main technological trends of deposited patents, there is significant concentration on development of new products, either through copolymerization with other monomers or modification of the reaction formulation to obtain differentiated products. In many cases, although patents are not focused on the process itself, claims also include innovative aspects of the reaction process associated specifically with the proposed formulation changes. However, relatively few novelties regard the reaction process or the reaction vessels exactly. For instance, Kazuhiro and Tadashi[89] (from Shin-Etsu Chemical, JP) developed a procedure to
prevent the adhesion of polymer material to the internal surfaces of the reaction vessel, based on the application of methanolic solutions of aromatic compounds to reactor walls before the polymerization step. Toshiaki et al.[90] (from Kanegafushi Chemical, nowadays Kaneka Corporation, JP) reported the development of a continuous process for manufacture of copolymers of acrylic monomers and VCM. In most of these patents, reactions are performed in agitated tank reactors (including tubular reactors equipped with multiple effect mixers) or tubular reactors (including pulsed sieve tubular reactors).
The use of anti-adherent agents is not new in polymerization processes, since it has been known for a long time that polymers encrust on equipment and reactor walls. Therefore, many efforts have already been made in the past to overcome this problem, since this may allow the significant reduction of reactor shutdowns for cleaning. As a result, it should be expected that many companies would introduce new anti-adherent products (and file the respective patents) that promise to allow the maximization of process productivity through minimization of reactor shutdowns for cleaning and maintenance at the industrial plant.
1180 patents were found regarding VCM suspension polymerization processes. As shown in Figure 15, the number of patent deposits related to VCM suspension polymerizations is much higher than those related to the other VCM polymerization processes, since this is the most important commercial process used for manufacture of PVC. Particularly, the same trends presented in Figure 3 can be identified in Figure 15, as suspension processes determine the main trends of the PVC commercial markets. Moreover, 224 patents have been identified in the field over the past

Lima, R.,
J.,
Polímeros, 33(2), e20230013, 2023 10/18
Silva,
Vasconcelos, M., Castor Junior, C. A., & Pinto, J. C.
Ranking Institutions Documents Percentages 1 LG Chemical (KR) 19 10.9% 2 Kaneka (JP) 6 3.4% 3 Tosoh (JP) 5 2.9% 4 Sekisui Chemical (JP) 3 2.9% 5 Mitsubishi Chemical (JP) 3 2.9% 6 BASF (DE) 3 2.9% 7 Arkema (FR) 3 2.9%
Table 5. Distribution of patents in the 7 most productive institutions in the field of emulsion polymerization of VCM in the period 2001-2021.
Figure 14. Annual production of patents related to emulsion polymerizations of VCM.
Figure 15. Annual production of patents related to suspension polymerizations of VCM.
20 years, showing the continuous interest in development of technologies in the field, although the reduction of patent deposits in the last decade is obvious (Figure 15) and probably reflects the technological maturity of the area. As observed in the vinyl chloride emulsion polymerization search, Table 6 shows that the LG Chemical (South Korea) is also the leader of patent deposits related to suspension polymerizations of VCM, being responsible for 25% (57 patents) of the deposits in the past 20 years, well ahead of the second largest patent depositor, the Kaneka Corporation (Japan), which filed 22 patents in the same period. As a matter of fact, Asian companies were responsible for 83% of the patent deposits in this field in the last 20 years, so that all the first 11 most productive patent producers in the analyzed area are Asian. This number confirms the enormous interest and demand of the Asian market for PVC, reflecting the demand generated by the growing Chinese construction business, but also reflecting the fact that Asia has become a major worldwide provider of PVC for economic and regulatory reasons.
Regarding the technological trends, prevention of fouling constitutes the most explored subject for technological development (22 patents) in the last 20 years for VCM suspension polymerization processes (for example, BeyongGuk et al.[91], from Denki Kagaku, JP; Takahiro et al.[92], from JNC, JP), followed by modification of the suspending agent (21 patents) (for example, Jun et al.[93], from LG Chemical, KR; Paul et al.[94], from Hanwha Chemical, KR), which clearly indicates that control of particle agglomeration and of particle morphological features constitute the main process bottleneck and the main concern for innovative activity. As the suspension polymerization process is the most important commercially, the most flexible for control of particle morphology and leads to still unsolved fouling problems, it is easy to understand the large number of patents that are related to these subjects in the field. It is also important to highlight that most technologies proposed to prevent fouling describe addition of new anti-adherent agents and development of the respective application procedures, so that these patents do not propose revolutionary technologies to combat the fouling problem. Moreover, the search for new PVC-based commercial grades and materials is reflected by the relatively high number of patents related to new copolymer materials and copolymerization processes (18 patents).
4.4 Types of processes from scientific papers
Firstly, searches performed for all types of VCM polymerization processes did not detect any investigation associated with fouling prevention technologies. This clearly
shows from the very beginning that the scopes of investigations performed in academic and industrial environments about VCM polymerizations can be quite different. Particularly, the apparent lack of interest of the academic environment on studying the fouling problem, the fouling mechanism and respective modeling possibly explains why advances take place so slowly in the field.
When the search was constrained to articles on solution VCM polymerizations, 249 articles could be found. However, only 4 of these documents really investigated aspects of the VCM polymerization process performed in solution in the last 20 years[95-98], as the large majority of the available manuscripts make use of the solution technology to manufacture materials with distinct properties, through modification of feed formulation, copolymerization with other comonomers or appropriate control of the molar mass distributions of the final product. This probably reflects the fact that it is much easier and comfortable to produce polymer materials in small lab scale reactors in solution. In these cases, the process should be regarded as a tool that is used to produce the polymer material, which constitutes the actual target of the investigation. Besides, the large fraction of papers that make use of solution processes for manufacture of PVC does not reflect the commercial interest in this field, as shown in the previous section.
The search for articles regarding VCM bulk polymerization processes resulted in 49 hits, although only 4 of these articles were indeed focused on the investigation of aspects of VCM bulk polymerization processes[99-102]. As in the previous case, these studies focus on minor improvements on the process operation rather than on breakthrough technologies. Besides, the bulk technology has normally been used mostly as benchmark for modeling and simulation studies[103], due to safety and regulatory constraints regarding the use of VCM in universities and research institutes, which inhibit the development of experimental studies in these institutions.
The search for articles related to VCM emulsion polymerization processes resulted in 299 hits. As Figure 16 illustrates, there was a continuous and slow increase of interest in the subject over the years, although apparently the number of papers related to VCM emulsion polymerizations diminished dramatically in the last decade, reflecting somehow the same behavior observed in Figure 14 for patents. The slow increase of interest can be explained by the easier handling of dispersed reaction media in the laboratory, due to combination of reduced amounts of monomer and safer operation conditions and to the fast development of nanotechnology, given the characteristic
Bibliometric
I:
Polímeros, 33(2), e20230013, 2023 11/18
survey of the PVC production – Part
the continuous polymerization challenge
Ranking Institutions Documents Percentages 1 LG Chemical (South Korea) 57 30.8% 2 Kaneka (Japan) 11 5.9% 3 Shanghai Chlor-Alkali Chemical (China) 7 3.8% 4 Shin-Etsu (Japan) 7 3.8% 5 Hanwha Chemical (Japan) 6 3.2% 6 Tianchen Chemical (China) 6 3.2%
Table 6. Distribution of patents in the 6 most productive institutions in the field of suspension polymerization of VCM in the period 2001-2021.
nanosizes of emulsified polymer particles. As a matter of fact, most of the scientific papers related to PVC emulsions regard the manufacture of blends and processing of PVC pastes[104-107], not polymerization processes. Table 7 shows the most productive institutions of scientific articles regarding VCM emulsion polymerization processes in the last 20 years. Works from Hebei University of Technology are the leading in this list, with 22 papers in the analyzed period. It must also be observed that the main trends in the field, as observed from scientific papers, involve the preparation of new composites[108,109] and copolymers[110,111]
As also observed previously, many investigations regard theoretical and simulation studies[112-115], again, due to the difficulty of using VCM in the universities.
347 papers were found during the search for papers on VCM suspension polymerization processes, as shown in Figure 17. As in the previous cases, the number of publications in this field has decreased over the last decade, which can reflect the lower innovative activity of companies, as also described in Figure 15. Moreover, as observed previously, many papers were targeted on the product properties, not exactly on the polymerization process. However, after proper filtering of downloaded manuscripts, 121 papers were found to investigate VCM suspension polymerization processes in the analyzed period, a much larger number of articles than observed before and reflecting the commercial importance of VCM suspension polymerization systems. Table 8 shows the most productive institutions of scientific articles regarding VCM suspension polymerization processes in the last 20 years. Works from Zhejiang University of Technology are the leading in this list, with 19 papers in the analyzed period. Observing the subjects of the downloaded papers, the main scientific trends in the area regard the modification of PVC and production of new materials with distinct characteristics, as also discussed previously, particularly through production of composites and nanocomposites [116-118] and copolymers [104,119,120] Besides, as also observed before, there is a relatively large number of papers dedicated to development of process models[28,104,119-123], with more recent concentration on CFD (computational fluid dynamics) simulations performed to understand the effects of reactor design and reactor internals on mixing patterns and evolution of particle size distributions[124-127]

4.5 Additional remarks
According to the previous analyses, the field of VCM polymerization processes is currently characterized by declining innovative activity, as determined for both the technological (through patents) and academic (through scientific publications) literature. This can be the result of the technological maturity of the area, as the current processes have remained essentially the same since the 1980s and innovative activities have been of incremental nature, although can also be due to increasing regulatory constraints related to the potential health risks posed by VCM handling and using. This also explains why the patent literature is more abundant than the academic literature in the field, which is indeed rare, as handling of VCM is limited in most universities and research institutes of the world. Besides, the academic literature is largely concentrated on development of new PVC products and simulation studies, and not on development of VCM
Lima, R., Silva, J., Vasconcelos, M., Castor Junior, C. A., & Pinto, J. C. Polímeros, 33(2), e20230013, 2023 12/18
polymerization processes supported by experiments. Therefore, PVC manufacturers face the important challenge of providing the breakthroughs
Figure 16. Annual production of articles related to emulsion polymerizations of VCM.
Figure 17. Annual production of articles related to suspension polymerizations of VCM.
Ranking Institutions Articles 1 Hebei University of Technology - CN 22 2 Changchun University of Technology - CN 21 3 Chinese Academy of Sciences - CN 11
Table 7. Publication frequencies of the most productive authors in the field of emulsion polymerization of VCM in the period 2001-2021.
Ranking Institutions Articles 1 Zhejiang University of Technology - CN 19 2 Isfahan University of Technology - IR 15 3 Ghent University – BE 10 4 Federal University of Rio de Janeiro - BR 9 5 Loughborough University - GB 8 5 University of Pannonia - HU 8
Table 8. Publication frequencies of the most productive authors in the field of suspension polymerization of VCM in the period 1998-2021.
that the field demands, although receiving limited support from universities and research institutes, which can also explain the recent decline of innovative activities in the field. Therefore, it seems correct to say that the academic interest in PVC polymerization technologies should be stimulated by companies that operate in this field. However, in order to overcome the increasing regulatory constraints, companies should find opportunities for joint development of academic research inside the industrial facilities, somehow inverting the usual human flow direction and opening space for academic researchers to remain in the industrial labs for at least part of their working time.
Among the most expected breakthroughs, two subjects must receive particular attention: development of continuous VCM suspension polymerization processes and prevention of polymer fouling during suspension polymerization operations (which are indeed interconnected, as fouling prevents the continuous process operation). Not surprisingly, these two subjects have not constituted research topics in academic environments, as both depend strongly on the support of experimental data. Besides, innovative activities in these areas have been quite conservative, in the sense that they have been concentrated on the analysis of anti-fouling agents. Despite that, recently deposited patents indicate that PVC manufacturers are still searching for more advanced solutions that can be combined with new reactor designs. For instance, the continuous oscillatory baffled reactors (COBR)[71] and recent microreactor technologies[40] can provide the future breakthroughs that may eventually allow the continuous manufacture of PVC, as they can simultaneously prevent fouling through the inherent self-cleaning characteristics of the turbulent oscillatory flow in COBR’s and by avoiding the impact of sticky polymer droplets against reactor internals in microreactors.
5 Conclusions
Bibliographic searches focused on VCM (vinyl chloride monomer) polymerizations indicated that innovative activity is declining in the field of VCM polymerization processes. Possible explanations involve the regulatory constraints related to VCM handling and utilization, the maturity of the technology and existence of significant unsolved technological problems, such as the fouling caused by polymer sticking to internal reactor surfaces and, consequently, the possibility to operate the VCM suspension polymerization reactors continuously. Due to the regulatory constraints, the number of patents available in the technological literature is higher than the number of scientific papers published in scientific journals, which is rare.
Because of the commercial importance of PVC emulsions, pastes and powders, particularly for the construction business, VCM emulsion and suspension polymerization processes are the most studied ones, especially the last ones. However, most studies have been concentrated on the development of new PVC-based formulations, blends, composites and copolymers, not on development of manufacture processes. Therefore, additional research is needed to provide solutions to prevent polymer fouling during suspension polymerization operations and allow the continuous operation of VCM suspension polymerization processes.
As observed in the bibliographic search, these two subjects have not constituted research topics in academic environments, as both depend strongly on the support of experimental data and regulatory constraints inhibit experimental academic activities in this field. This creates a disconnection between the research projects conducted in industrial and academic environments that can possibly explain the slow pace of innovative activities in the field and should stimulate companies to develop cooperative projects with research institutes and universities in the industrial environments.
Finally, future technological breakthroughs should provide support for migration from batch to continuous PVC suspension polymerization processes[40,71]. Although this trajectory remains limited by unsolved fouling problems, innovative reactor designs can simultaneously provide means to minimize fouling onto reactor internals and to allow the operation in continuous mode. Some innovative reactor designs include the continuous oscillatory baffled reactors (COBR) and some microreactor technologies, which can prevent fouling through the inherent self-cleaning characteristics of the turbulent oscillatory flow in COBR’s and by avoiding the impact of sticky polymer droplets against reactor internals in microreactors.
6. Author’s Contribution
• Conceptualization – Rafael Lima; Jonildo Silva; Mateus Vasconcelos; Carlos Alberto Castor Junior; José Carlos Pinto.
• Data curation – Rafael Lima; Jonildo Silva; Mateus Vasconcelos; Carlos Alberto Castor Junior; José Carlos Pinto.
• Formal analysis – Rafael Lima; Jonildo Silva; Mateus Vasconcelos; Carlos Alberto Castor Junior; José Carlos Pinto.
• Funding acquisition – José Carlos Pinto.
• Investigation – Rafael Lima; Jonildo Silva; Mateus Vasconcelos; Carlos Alberto Castor Junior; José Carlos Pinto.
• Methodology – Rafael Lima; Jonildo Silva; Mateus Vasconcelos; Carlos Alberto Castor Junior; José Carlos Pinto.
• Project administration – José Carlos Pinto.
• Resources – Rafael Lima; Jonildo Silva; Mateus Vasconcelos; Carlos Alberto Castor Junior; José Carlos Pinto.
• Software – NA.
• Supervision – José Carlos Pinto.
• Validation – NA.
• Visualization – NA.
• Writing – original draft – Rafael Lima; Jonildo Silva; Mateus Vasconcelos; Carlos Alberto Castor Junior; José Carlos Pinto.
• Writing – review & editing – Rafael Lima; Jonildo Silva; Mateus Vasconcelos; Carlos Alberto Castor Junior; José Carlos Pinto.
Bibliometric
Polímeros, 33(2), e20230013, 2023 13/18
survey of the PVC production – Part I: the continuous polymerization challenge
Lima, R., Silva, J., Vasconcelos, M., Castor Junior, C. A., & Pinto, J. C.
7. Acknowledgements
The authors thank CNPq (Conselho Nacional de Pesquisa e Desenvolvimento Científico e Tecnológico), CAPES (Coordenação de Aperfeiçoamento Pessoal de Nível Superior), FAPERJ (Fundação Carlos Chagas Filho de Apoio à Pesquisa do Estado do Rio de Janeiro) and BRASKEM for providing financial support and scholarships.
8. References
1 Basmage, O. M., & Hashmi, M. S. J. (2020). Plastic products in hospitals and healthcare systems. In S. Hashmi & I. A. Choudhury (Eds.), Encyclopedia of renewable and sustainable materials (pp. 648-657). UK: Elsevier http:// dx.doi.org/10.1016/B978-0-12-803581-8.11303-7
2 GlobeNewswire. (2021). Poly-vinyl chloride global market Report 2021: COVID-19 impact and recovery to 2030 Retrieved in 2022, July 17, from https://www.globenewswire. com/news-release/2021/08/30/2288176/28124/en/PolyVinyl-Chloride-Global-Market-Report-2021-COVID-19Impact-and-Recovery-to-2030.html
3 Qi, M., Shen, L. P., Wang, Y. M., & Zhou, X. R. (2013). Development of self-cleaning luminous PVC Flexible composite building materials. Applied Mechanics and Materials, 405-408, 2839-2842 http://dx.doi.org/10.4028/ www.scientific.net/AMM.405-408.2839
4 Senhadji, Y., Escadeillas, G., Benosman, A. S., Mouli, M., Khelafi, H., & Kaci, S. O. (2015). Effect of incorporating PVC waste as aggregate on the physical, mechanical, and chloride ion penetration behavior of concrete. Journal of Adhesion Science and Technology, 29(7), 625-640 http:// dx.doi.org/10.1080/01694243.2014.1000773
5 Jia, Z.-G., Ren, L., Li, H.-N., Ho, S.-C., & Song, G.-B. (2015). Experimental study of pipeline leak detection based on hoop strain measurement. Structural Control and Health Monitoring, 22(5), 799-812 http://dx.doi.org/10.1002/ stc.1718
6. Wang, L., Hong, K., Xu, R., Zhao, Z., & Cao, J. (2021). The alleviation of cold-stimulated flesh reddening in ‘Friar’ plum fruit by the elevated CO2 with polyvinyl chloride (PVC) packaging. Scientia Horticulturae, 281, 109997 http://dx.doi.org/10.1016/j.scienta.2021.109997
7 Islam, I., Sultana, S., Ray, S. K., Nur, H. P., Hossain, M. T., & Ajmotgir, W. M. (2018). Electrical and Tensile properties of carbon black reinforced polyvinyl chloride conductive composites. C Journal of Carbon Research, 4(1), 15 http:// dx.doi.org/10.3390/c4010015
8. Assis, M., Simoes, L. G. P., Tremiliosi, G. C., Ribeiro, L. K., Coelho, D., Minozzi, D. T., Santos, R. I., Vilela, D. C. B., Mascaro, L. H., Andrés, J., & Longo, E. (2021). PVC-SiO2Ag composite as a powerful biocide and anti-SARS-CoV-2 material. Journal of Polymer Research, 28(9), 361 http:// dx.doi.org/10.1007/s10965-021-02729-1
9 Makris, K. F., Langeveld, J., & Clemens, F. H. L. R. (2020). A review on the durability of pvc sewer pipes: research vs. practice. Structure and Infrastructure Engineering, 16(6), 880-897 http:// dx.doi.org/10.1080/15732479.2019.1673442
10. Titow, W. V. (1984). Introduction. In W. V. Titow. PVC technology (pp. 1-35). Netherlands: Springer Netherlands http://dx.doi.org/10.1007/978-94-009-5614-8_1
11 Burgess, R. H. (1982). Introduction. In R. H. Burgess (Ed.), Manufacture and processing of PVC (pp. xv-xviii). UK: CRC Press
12 Purmová, J., Pauwels, K. F. D., Agostini, M., Bruinsma, M., Vorenkamp, E. J., Schouten, A. J., & Coote, M. L. (2008). Experimental and theoretical evaluation of the reactions leading to formation of internal double bonds in suspension PVC. Macromolecules, 41(15), 5527-5539 http://dx.doi. org/10.1021/ma800583k.
13 Wesslén, B., & Wirsén, A. (1975). Anionic polymerization of vinyl chloride. Journal of Polymer Science: Polymer Chemistry Edition , 13 (11), 2571-2580 http://dx.doi. org/10.1002/pol.1975.170131114
14 Guyot, A., & Mordini, J. (1971). Radical and ionic polymerization of vinyl chloride with tert-butylmagnesium chloride. Journal of Polymer Science Part C: Polymer Symposia, 33(1), 65-73 http://dx.doi.org/10.1002/polc.5070330107
15. Savaş, B., & Öztürk, T. (2020). Synthesis and characterization of poly(vinyl chloride-g-methyl methacrylate) graft copolymer by redox polymerization and Cu catalyzed azide-alkyne cycloaddition reaction. Journal of Macromolecular Science, Part A: Pure and Applied Chemistry, 57(12), 819-825 http:// dx.doi.org/10.1080/10601325.2020.1788393
16 Fischer, I., Schmitt, W. F., Porth, H.-C., Allsopp, M. W., & Vianello, G. (2014). Poly(Vinyl Chloride). In Wiley-VCH Ullmann’s Encyclopedia of Industrial Chemistry (pp. 1-30). Weinheim: Wiley-VCH. http://dx.doi.org/10.1002/14356007. a21_717.pub2.
17 Abreu, C. M. R., Fonseca, A. C., Rocha, N. M. P., Guthrie, J. T., Serra, A. C., & Coelho, J. F. J. (2018). Poly(vinyl chloride): current status and future perspectives via reversible deactivation radical polymerization methods. Progress in Polymer Science, 87, 34-69 http://dx.doi.org/10.1016/j. progpolymsci.2018.06.007
18 Kiparissides , C. , Daskalakis , G. , Achilias , D. S. , & Sidiropoulou, E. (1997). Dynamic simulation of industrial Poly(vinyl chloride) batch suspension polymerization reactors. Industrial & Engineering Chemistry Research, 36(4), 1253-1267 http://dx.doi.org/10.1021/ie9604839
19 Sidiropoulou, E., & Kiparissides, C. (1990). Mathematical modeling of PVC suspension polymerization: a unifying approach and some new results. Journal of Macromolecular Science. Chemistry , 27 ( 3 ), 257 - 288 http://dx.doi. org/10.1080/00222339009349551
20. Xie, T. Y., Hamielec, A. E., Wood, P. E., & Woods, D. R. (1991). Experimental investigation of vinyl chloride polymerization at high conversion: mechanism, kinetics and modelling. Polymer, 32(3), 537-557 http://dx.doi. org/10.1016/0032-3861(91)90462-R
21 Odian, G. (2004). Principles of polymerization USA: John Wiley & Sons, Inc. http://dx.doi.org/10.1002/047147875X
22 Park, G. S., & Smith, D. G. (1970). Vinyl chloride studies. II. Initiation and termination in the homogeneous polymerization of vinyl chloride. Die Makromolekulare Chemie, 131(1), 1-6. http://dx.doi.org/10.1002/macp.1970.021310101.
23 Wheeler, R. N., Jr. (1981). Poly(vinyl chloride) processes and products. Environmental Health Perspectives, 41, 123-128 http://dx.doi.org/10.1289/ehp.8141123 PMid:7333230.
24 Ugelstad, J., Fløgstad, H., Hertzberg, T., & Sund, E. (1973). On the bulk polymerization of vinyl chloride. Die Makromolekulare Chemie, 164(1), 171-181 http://dx.doi. org/10.1002/macp.1973.021640117
25. Endo, K. (2002). Synthesis and structure of poly(vinyl chloride). Progress in Polymer Science, 27(10), 2021-2054 http://dx.doi.org/10.1016/S0079-6700(02)00066-7
26 Saeki, Y., & Emura, T. (2002). Technical progresses for PVC production. Progress in Polymer Science, 27(10), 2055-2131 http://dx.doi.org/10.1016/S0079-6700(02)00039-4
Polímeros, 33(2), e20230013, 2023 14/18
Bibliometric survey of the PVC production – Part I: the continuous polymerization challenge
27 Sandler, S. R. & Karo, W. (1993). Poly(vinyl chloride). In S. R. Sandler & W. Karo (Eds.), Polymer syntheses (pp. 351-420). USA: Academic Press
28 Kiparissides, C. (2018). Modeling of suspension vinyl chloride polymerization: from kinetics to particle size distribution and PVC grain morphology. In W. Pauer (Ed.), Polymer reaction engineering of dispersed systems (Vol. 1, pp. 121193). Switzerland: Springer International Publishing http:// dx.doi.org/10.1007/12_2017_16
29 Kotoulas, C., & Kiparissides, C. (2006). A generalized population balance model for the prediction of particle size distribution in suspension polymerization reactors. Chemical Engineering Science, 61(2), 332-346 http:// dx.doi.org/10.1016/j.ces.2005.07.013
30. Machado, F., Lima, E. L., & Pinto, J. C. (2007). A review on suspension polymerization processes. Polímeros: Ciência e Tecnologia, 17(2), 166-179 http://dx.doi.org/10.1590/ S0104-14282007000200016
31 Alexopoulos, A. H., & Kiparissides, C. (2007). On the prediction of internal particle morphology in suspension polymerization of vinyl chloride. Part I: the effect of primary particle size distribution. Chemical Engineering Science, 62(15), 3970-3983 http://dx.doi.org/10.1016/j. ces.2007.04.009.
32 Doworkin, R. D. (1989). PVC Stabilizers of the Past, Present, and Future. Journal of Vinyl Technology, 11(1), 15-22 http:// dx.doi.org/10.1002/vnl.730110106
33 Wagoner, J. K. (1983). Toxicity of Vinyl Chloride and Poly(vinyl chloride): A Critical Review. Environmental Health Perspectives, 52, 61-66 http://dx.doi.org/10.1289/ ehp.835261 PMid:6360677.
34. Liu, Y., Zhou, C., Li, F., Liu, H., & Yang, J. (2020). Stocks and Flows of Polyvinyl Chloride (PVC) in China: 1980-2050. Resources, Conservation and Recycling, 154, 104584 http:// dx.doi.org/10.1016/j.resconrec.2019.104584
35 Bubsy, B. J. (1975). UK Patent No. GB1408320A UK Retrieved in 2022, July 17, from https://worldwide. espacenet.com/patent/search/family/003764867/publication/ GB1408320A?q=AUPA750071
36 Dirix, C. A. M. C., De Jong, J. J. T., Meulenbrugge, L., & Vanduffel, K. A. K. (2007). WO Patent No. WO2007110350A1. Switzerland. Retrieved in 2022, July 17, from https:// worldwide.espacenet.com/patent/search/family/038181064/ publication/WO2007110350A1?q=EP06111682
37 Kircher, C. E., Jr., Jones, R. J., & Kirz, R. F. (1961). US Patent No. US3004013A USA. Retrieved in 2022, July 17, from https://worldwide.espacenet.com/patent/search/ family/023689453/publication/US3004013A?q=US3004013
38 Klippert, H. D., Tzschoppe, E., Paschalis, S. D., Weinlich, J. D., & Engelmann, M. D. (1980). EP Patent No. EP0045931A2. Germany. Retrieved in 2022, July 17, from https://worldwide. espacenet.com/patent/search/family/006109089/publication/ EP0045931A2?q=EP0045931A2
39 Weibin, L., Wenlin, G., Genyou, Y., Dengfeng, P., Jun, Z., Hao, Z., Yueting, Y., Jin, Y., & Lin, G. (2021). CN Patent No. CN112812206A China. Retrieved in 2022, July 17, from https:// worldwide.espacenet.com/patent/search/family/075865598/ publication/CN112812206A?q=CN112812206
40. Hong , C. , Shimin , W. , Guohua , S. , & Huiyuan , X. ( 2019 ). CN Patent No. CN209501640U . China . Retrieved in 2022, July 17, from https://worldwide. espacenet.com/patent/search/family/068190633/publication/ CN209501640U?q=CN209501640U
41 Yuan, H. G., Kalfas, G., & Ray, W. H. (1991). Suspension polymerization. Journal of Macromolecular Science, Part
C: Polymer Reviews , 31 (2-3), 215-299 http://dx.doi. org/10.1080/15321799108021924
42 Bilgiç, T., & Savaşçi, Ö. T. (1994). Encrustation prevention in PVC reactors. Polymer-Plastics Technology and Engineering, 33(3), 381-390 http://dx.doi.org/10.1080/03602559408013099
43 Levine, S. P., Hebel, K. G., Bolton, J., Jr., & Kugel, R. E. (1975). Industrial analytical chemists and OSHA [Occupational Safety and Health Administration] regulations for vinyl chloride. Analytical Chemistry, 47(12), 1075A-1080a. http:// dx.doi.org/10.1021/ac60362a024
44 Sass, J. B., Castleman, B., & Wallinga, D. (2005). Vinyl chloride: a case study of data suppression and misrepresentation. Environmental Health Perspectives, 113(7), 809-812 http:// dx.doi.org/10.1289/ehp.7716 PMid:16002366.
45. Smallwood, P. V. (1986). The formation of grains of suspension poly(vinyl chloride). Polymer, 27(10), 1609-1618 http:// dx.doi.org/10.1016/0032-3861(86)90112-6
46 Xie, T. Y., Hamielec, A. E., Rogestedt, M., & Hjertberg, T. (1994). Experimental investigation of vinyl-chloride polymerization at high conversion - polymer microstructure and thermal-stability and their relationship to polymerization conditions. Polymer , 35 (7), 1526-1534. http://dx.doi. org/10.1016/0032-3861(94)90354-9
47 Xie, T. Y., Hamielec, A. E., Wood, P. E., & Woods, D. R. (1991). Experimental investigation of vinyl-chloride polymerization at high conversion - reactor dynamics. Journal of Applied Polymer Science, 43(7), 1259-1269 http://dx.doi.org/10.1002/app.1991.070430707
48 Xie, T. Y., Hamielec, A. E., Wood, P. E., & Woods, D. R. (1991). Experimental investigation of vinyl-chloride polymerization at high conversion - molecular-weight development. Polymer, 32(6), 1098-1111 http://dx.doi. org/10.1016/0032-3861(91)90599-E
49 Xie, T. Y., Hamielec, A. E., Wood, P. E., & Woods, D. R. (1991). Experimental investigation of vinyl-chloride polymerization at high conversion - semibatch reactor modeling. Polymer , 32 (11), 2087-2095 http://dx.doi. org/10.1016/0032-3861(91)90177-K.
50 Xie, T. Y., Hamielec, A. E., Wood, P. E., & Woods, D. R. (1987). Experimental investigation of vinyl-chloride polymerization at high conversion - temperature/pressure/ conversion and monomer phase distribution relationships. Journal of Applied Polymer Science, 34(4), 1749-1766 http://dx.doi.org/10.1002/app.1987.070340432
51 Xie, T. Y., Hamielec, A. E., Wood, P. E., Woods, D. R., & Chiantore, O. (1991). Experimental investigation of vinyl-chloride polymerization at high conversion - effect of polymerization conditions on polymer properties. Polymer, 32(9), 1696-1702 http://dx.doi.org/10.1016/00323861(91)90408-B
52. Xie, T. Y., Hamielec, A. E., Wood, P. E., Woods, D. R., & Westmijze, H. (1990). Experimental investigation of vinylchloride polymerization at high conversion - conversion and tracer response relationships. Journal of Applied Polymer Science, 41(9-10), 2327-2347 http://dx.doi.org/10.1002/ app.1990.070410934
53 Cebollada, A. F., Schmidt, M. J., Farber, J. N., Capiati, N. J., & Vallés, E. M. (1989). Suspension polymerization of vinyl chloride. I. Influence of viscosity of suspension medium on resin properties. Journal of Applied Polymer Science, 37(1), 145-166 http://dx.doi.org/10.1002/app.1989.070370111
54 Allsopp, M. W. (1981). The development and importance of suspension PVC morphology. Pure and Applied Chemistry, 53(2), 449-465 http://dx.doi.org/10.1351/pac198153020449
55 Davidson, J. A., & Witenhafer, D. E. (1980). Particle structure of suspension polyvinyl-chloride and its origin in
Polímeros, 33(2), e20230013, 2023 15/18
Lima, R., Silva, J., Vasconcelos, M., Castor Junior, C. A., & Pinto, J. C.
the polymerization process. Journal of Polymer Science. Polymer Physics Edition , 18 (1), 51-69 http://dx.doi. org/10.1002/pol.1980.180180105
56 Starnes, W. H., Jr., Schilling, F. C., Plitz, I. M., Cais, R. E., Freed, D. J., Hartless, R. L., & Bovey, F. A. (1983). Branch structures in polyvinyl-chloride and the mechanism of chain transfer to monomer during vinyl-chloride polymerization. Macromolecules, 16(5), 790-807 http://dx.doi.org/10.1021/ ma00239a016
57. Abdel-Alim , A. H. , & Hamielec, A. E. ( 1972 ). Bulk polymerization of vinyl-chloride. Journal of Applied Polymer Science, 16(3), 783-799. http://dx.doi.org/10.1002/ app.1972.070160321
58 Hjertberg, T., & Sörvik, E. M. (1983). Formation of anomalous structures in pvc and their influence on the thermal-stability.
2. Branch structures and tertiary chlorine. Polymer, 24(6), 673-684 http://dx.doi.org/10.1016/0032-3861(83)90003-4
59 Xie, T. Y., Hamielec, A. E., Wood, P. E., & Woods, D. R. (1991). Suspension, bulk, and emulsion polymerization of vinyl chloride: mechanism, kinetics, and reactor modelling. Journal of Vinyl Technology, 13(1), 2-25 http://dx.doi. org/10.1002/vnl.730130103
60 Starnes, W. H., Jr. (2002). Structural and mechanistic aspects of the thermal degradation of poly(vinyl chloride). Progress in Polymer Science, 27(10), 2133-2170 http:// dx.doi.org/10.1016/S0079-6700(02)00063-1
61 Bijhanmanesh, M. J., Etesami, N., & Esfahany, M. N. (2016). Continuous dosing of a fast initiator during suspension polymerization of vinyl chloride for enhanced productivity: mathematical modeling and experimental study. Chemical Engineering Communications, 203(11), 1473-1483. http:// dx.doi.org/10.1080/00986445.2016.1205981.
62 Faria , J. M. , Jr. , Machado , F. , Lima , E. L. , & Pinto , J. C. (2009). Monitoring of vinyl chloride suspension polymerization using NIRS. 2. Proposition of a scheme to control morphological properties of PVC. In R. M. B. Alves, C. A. O. Nascimento & E. C. Biscaia Jr. (Eds.), Computer aided chemical engineering (pp. 1329-1334). UK: Elsevier doi:http://dx.doi.org/10.1016/S1570-7946(09)70612-1
63 Tacidelli, A. R., Alves, J. J. N., Vasconcelos, L. G. S., & Brito, R. P. (2009). Increasing PVC Suspension polymerization productivity: an industrial application. Chemical Engineering and Processing, 48(1), 485-492 http://dx.doi.org/10.1016/j. cep.2008.06.007
64 Castor, C. A., Jr., Pontier, A., Durand, J., Pinto, J. C., & Prat, L. (2017). Real time monitoring of the quiescent suspension copolymerization of vinyl chloride with methyl methacrylate in microreactors – Part 3. A kinetic study by raman spectroscopy and evolution of droplet size. Chemical Engineering Science, 173, 493-506 http://dx.doi.org/10.1016/j. ces.2017.08.018
65. Hammer, S., Tzur, A., Cohen, Y., & Narkis, M. (2009). Modification of porous PVC particles with polyacrylate elastomers using a surfactant-free aqueous dispersion polymerization technique. e-Polymers, 9(1), 066. http:// dx.doi.org/10.1515/epoly.2009.9.1.813
66 Baade, W., Moritz, H. U., & Reichert, K. H. (1982). Kinetics of high conversion polymerization of vinyl acetate. effects of mixing and reactor type on polymer properties. Journal of Applied Polymer Science, 27(6), 2249-2267 http://dx.doi. org/10.1002/app.1982.070270634
67 Bally, F., Serra, C. A., Brochon, C., Anton, N., Vandamme, T., & Hadziioannou, G. (2011). A continuous-flow polymerization microprocess with online GPC and inline polymer recovery by micromixer-assisted nanoprecipitation. Macromolecular
Reaction Engineering, 5(11-12), 542-547 http://dx.doi. org/10.1002/mren.201100047
68 Hatate, Y., Ikari, A., Nakashio, F., & Kondo, K. (1981). Effect of coalescence and redispersion on suspension polymerization of styrene in a continuous stirred tank reactor. Journal of Chemical Engineering of Japan, 14(6), 493-495 http:// dx.doi.org/10.1252/jcej.14.493
69 Hatate, Y., Ikeura, T., Shinonome, M., Kondo, K., & Nakashio, F. (1981). Suspension polymerization of styrene under ultrasonic irradiation. Journal of Chemical Engineering of Japan, 14(1), 38-43 http://dx.doi.org/10.1252/jcej.14.38
70 Liu, Z., Lu, Y., Yang, B., & Luo, G. (2011). Controllable preparation of poly(butyl acrylate) by suspension polymerization in a coaxial capillary microreactor. Industrial & Engineering Chemistry Research, 50(21), 11853-11862. http://dx.doi. org/10.1021/ie201497b
71 Lobry, E., Lasuye, T., Gourdon, C., & Xuereb, C. (2015). Liquid–liquid dispersion in a continuous oscillatory baffled reactor – application to suspension polymerization. Chemical Engineering Journal, 259, 505-518 http://dx.doi.org/10.1016/j. cej.2014.08.014
72 Sen, N., Shaikh, T., Singh, K. K., Sirsam, R., & Shenoy, K. T. (2020). Synthesis of Polyacrylamide (PAM) beads in microreactors. Chemical Engineering and Processing, 157, 108105 http://dx.doi.org/10.1016/j.cep.2020.108105
73 Wang, X., Zhu, J., Shao, T., Chen, S. F., Luo, X., & Zhang, L. (2018). Microfluidic-assisted controllable formation of millimeter-scale poly(divinylbenzene) foam shells. Polymer Engineering and Science, 58(7), 1184-1192 http://dx.doi. org/10.1002/pen.24680
74 Zourob, M., Mohr, S., Mayes, A. G., Macaskill, A., PérezMoral, N., Fielden, P. R., & Goddard, N. J. (2006). A micro-reactor for preparing uniform molecularly imprinted polymer beads. Lab on a Chip, 6(2), 296-301 http://dx.doi. org/10.1039/b513195b PMid:16450041.
75 Ni, X., Mignard, D., Saye, B., Johnstone, J. C., & Pereira, N. (2002). On the evaluation of droplet breakage and coalescence rates in an oscillatory baffled reactor. Chemical Engineering Science, 57(11), 2101-2114 http://dx.doi. org/10.1016/S0009-2509(02)00100-8
76. Ni, X., Murray, K. R., Zhang, Y., Bennett, D., & Howes, T. (2002). Polymer product engineering utilising oscillatory baffled reactors. Powder Technology, 124(3), 281-286 http://dx.doi.org/10.1016/S0032-5910(02)00022-0
77 Pinto, J. C. (1990). Dynamic behavior of continuous vinyl chloride bulk and suspension polymerization reactors. a simple model analysis. Polymer Engineering and Science, 30(5), 291-302 http://dx.doi.org/10.1002/pen.760300506
78 Pinto, J. C. (1990). Dynamic behavior of continuous vinyl chloride suspension polymerization reactors: effects of segregation. Polymer Engineering and Science, 30(15), 925-930 http://dx.doi.org/10.1002/pen.760301507
79 Hatate, Y., Ikari, A., Nakashio, F., & Kondo, K. (1984). A simulation of continuous suspension polymerization of styrene by the Monte Carlo method. Journal of Chemical Engineering of Japan , 17 ( 3 ), 339 - 342 http://dx.doi. org/10.1252/jcej.17.339
80 Galkin, P. A., Selivanov, Y. T., & Lazarev, S. I. (2020). Hardware design of continuous polymerization of methyl methacrylate in suspension using pulsating mixing. Chemical and Petroleum Engineering, 56(7), 616-625 http://dx.doi. org/10.1007/s10556-020-00818-4
81 Galkin, P. A., Selivanov, Y. T., Lazarev, S. I., & Selivanov, A. Y. (2021). Optimization of process conditions and implementation of continuous methyl methacrylate polymerization process
Polímeros,
2023 16/18
33(2), e20230013,
Bibliometric survey of the PVC production – Part I: the continuous polymerization challenge
in suspension. Chemical and Petroleum Engineering, 57(5), 447-456 http://dx.doi.org/10.1007/s10556-021-00958-1
82 Kim, S. H., Lee, J. H., & Braatz, R. D. (2021). Multi-scale fluid dynamics simulation based on mp-pic-pbe method for PMMA suspension polymerization. Computers & Chemical Engineering, 152, 107391 http://dx.doi.org/10.1016/j. compchemeng.2021.107391
83 Dorobantu Bodoc, M., Prat, L., Xuereb, C., Gourdon, C., & Lasuye, T. (2012). Online monitoring of vinyl chloride polymerization in a microreactor using raman spectroscopy. Chemical Engineering & Technology, 35(4), 705-712 http:// dx.doi.org/10.1002/ceat.201100564
84. Castor, C. A., Jr., Pontier, A., Durand, J., Pinto, J. C., & Prat, L. (2016). Real time monitoring of the quiescent suspension polymerization of vinyl chloride in microreactors – Part 2. A kinetic study by raman spectroscopy and evolution of Droplet Size. Chemical Engineering Science, 145, 279-293. http://dx.doi.org/10.1016/j.ces.2016.02.025
85 Jin , K. Y. , & Kyung-Hyun , K. ( 2012 ). WO Patent No. WO2012008654A1 Switzerland . Retrieved in 2022, July 17, from https://worldwide.espacenet. com/patent/search/family/045469631/publication/ WO2012008654A1?q=WO2012008654
86. Kwon, L. D., Hyon, K. K., Hee, P. B., Woong, L. S., & Hyuck, J. J. (2015). WO Patent No. WO2015047021A1 Switzerland. Retrieved in 2022, July 17, from https:// worldwide.espacenet.com/patent/search/family/053033521/ publication/WO2015047021A1?q=WO2015047021A1
87 Hong, C., Yun, L., Min, D., & Zerong, L. (2017). CN Patent No. CN106986957A China. Retrieved in 2022, July 17, from https://worldwide.espacenet.com/patent/search/ family/059417989/publication/CN106986957A?q=pn%3 DCN106986957A
88 Barroso, E. G., Duarte, F. M., Couto, M., & Maia, J. M. (2008). A rheological study of the ageing of emulsion and microsuspension-based PVC plastisols. Journal of Applied Polymer Science, 109(1), 664-673 http://dx.doi.org/10.1002/ app.28173
89 Kazuhiro , K. , & Tadashi , A. ( 2000 ). JP Patent No. JP2000063403A Japan. Retrieved in 2022, July 17, from https:// worldwide.espacenet.com/patent/search/family/017230511/ publication/JP2000063403A?q=JP2000063403A
90 Toshiaki, E., Satoru, Y., & Takaharu, M. (2001). JP Patent No. JP2001146502A Japan: Retrieved in 2022, July 17, from https:// worldwide.espacenet.com/patent/search/family/026540407/ publication/JP2001146502A?q=JP2001146502A
91 Beyong-Guk, A., Seong-Yong, A., Soo-Hwan, H., & Kyung-Hyun, K. (2015). KR Patent No. KR20150037050A Republic of Korea. Retrieved in 2022, July 17, from https:// worldwide.espacenet.com/patent/search/family/053033101/ publication/KR20150037050A?q=KR20150037050A
92 Takahiro, C., Hiromasa, M., & Norihisa, S. (2018). WO Patent No. WO2018123233A1. Switzerland. Retrieved in 2022, July 17, from https://worldwide.espacenet. com/patent/search/family/062707969/publication/ WO2018123233A1?q=WO2018123233A1
93 Jun, J. Y., Kyou, H. H., Chul, L. J., Hyuck, J. J., & Jeong, K. M. (2017). WO Patent No. WO2017191899A1 Switzerlandt Retrieved in 2022, July 17, from https://worldwide. espacenet.com/patent/search/family/060202939/publication/ WO2017191899A1?q=WO2017191899A1
94 Paul, K., Hwan, K. J., & Chil, K. H. (2018). KR Patent No. KR101887638B1 Republic of Korea. Retrieved in 2022, July 17, from https://worldwide.espacenet. com/patent/search/family/063229527/publication/ KR101887638B1?q=KR101887638B1
95 Huang, Z., Pan, P., & Bao, Y. (2016). Solution and aqueous miniemulsion polymerization of vinyl chloride mediated by a fluorinated xanthate. Journal of Polymer Science. Part A, Polymer Chemistry, 54(14), 2092-2101 http://dx.doi. org/10.1002/pola.28074
96 Kronman, A. G., Groshev, G. L., Leshina, L. V., Sitnikova, E. F., & Sulina, T. V. (2001). Polymerization of vinyl chloride in the presence of alcohols. Russian Journal of Applied Chemistry, 74(6), 1007-1009 http://dx.doi. org/10.1023/A:1013007810113
97. Lin, C. Y., Coote, M. L., Gennaro, A., & Matyjaszewski, K. (2008). Ab initio evaluation of the thermodynamic and electrochemical properties of alkyl halides and radicals and their mechanistic implications for atom transfer radical polymerization. Journal of the American Chemical Society, 130(38), 12762-12774 http://dx.doi.org/10.1021/ja8038823 PMid:18761460.
98 Liu, K., Pan, P., & Bao, Y. (2015). Synthesis, micellization, and thermally-induced macroscopic micelle aggregation of poly(vinyl chloride)-g-Poly(N-isopropylacrylamide) amphiphilic copolymer. RSC Advances, 5(115), 9458294590 http://dx.doi.org/10.1039/C5RA16726D
99. Endo, K., Kaneda, N., Waku, H., Saitoh, M., & Emori, N. (2001). Polymerization of vinyl chloride with butyllithiums and metallocene catalysts. Journal of Vinyl and Additive Technology , 7 (4), 177-183 http://dx.doi.org/10.1002/ vnl.10289
100 Guarrotxena, N., Schue, F., Collet, A., & Millán, J. L. (2003). On the stereochemical composition of poly(vinyl chloride) (PVC) and Polypropylene (PP): a phenomenological study. Polymer International, 52(3), 420-428 http://dx.doi. org/10.1002/pi.1102
101 Piette, Y., Debuigne, A., Jérôme, C., Bodart, V., Poli, R., & Detrembleur, C. (2012). Cobalt-mediated radical (co) polymerization of vinyl chloride and vinyl acetate. Polymer Chemistry, 3(10), 2880-2891 http://dx.doi.org/10.1039/ c2py20413d
102 Tsuchiya, Y., Nomaguchi, T., & Endo, K. (2008). Bulk polymerization of vinyl chloride with half-titanocene/ MAO catalyst. Polymer, 49(5), 1180-1184 http://dx.doi. org/10.1016/j.polymer.2008.01.032
103 Santos, J. C., Lopes, C. N., Reis, M. M., Giudici, R., Sayer, C., Machado, R. A. F., & Araújo, P. H. H. (2008). Comparison of techniques for the determination of conversion during suspension polymerization reactions. Brazilian Journal of Chemical Engineering, 25(2), 399-407 http://dx.doi. org/10.1590/S0104-66322008000200017
104 Aasberg-Petersen, K., Christensen, T. S., Dybkjaer, I., Sehested, J., Østberg, M., Coertzen, R. M., Keyser, M. J., & Steynberg, A. P. (2004). Synthesis gas production for FT synthesis. In A. Steynberg & M. Dry (Eds.), Studies in surface science and catalysis (pp. 258-405). Netherlands: Elsevier. doi:http://dx.doi.org/10.1016/S0167-2991(04)80461-0
105 Liu, B., Wang, Y., Gao, Y., Zhong, R., Zhang, F., Zhang, M., & Zhang, H. (2017). Effect of the matrix plasticization behavior on mechanical properties of PVC/ABS blends. Journal of Polymer Engineering, 37(3), 239-245 http:// dx.doi.org/10.1515/polyeng-2015-0533
106 Ren, L., Li, Y., Zhang, M., Han, Y., & Zhang, H. (2016). Toughness, dynamic mechanical property, and morphology of polyvinylchloride/acrylonitrile-styrene-butyl acrylate blends. Journal of Vinyl and Additive Technology, 22(1), 43-50 http://dx.doi.org/10.1002/vnl.21435
107 Zhou, C., Wu, S., Liu, H., & Wu, G. (2016). Effects of core‐shell particle growth manners on morphologies and properties of poly(vinyl chloride)/(methyl methacrylate–
Polímeros, 33(2), e20230013, 2023 17/18
Lima, R., Silva, J., Vasconcelos, M., Castor Junior, C. A., & Pinto, J. C.
butadiene–styrene) blends. Journal of Vinyl and Additive Technology, 22(1), 37-42 http://dx.doi.org/10.1002/vnl.21438
108 Pan, M., Shi, X., Li, X., Hu, H., & Zhang, L. (2004). Morphology and properties of pvc/clay nanocomposites via in situ emulsion polymerization. Journal of Applied Polymer Science, 94(1), 277-286 http://dx.doi.org/10.1002/ app.20896
109 Yang, W., Wu, Q., Zhou, L., & Wang, S. (1997). Styrene-coacrylonitrile resin modifications of PVC/CPE blends. Journal of Applied Polymer Science, 66(8), 1455-1460 http://dx.doi. org/10.1002/(SICI)1097-4628(19971121)66:8<1455::AIDAPP5>3.0.CO;2-D
110 Ren, T., Wang, J., Yuan, J., Pan, M., Liu, G., Zhang, G., Zhong, G.-J., & Li, Z.-M. (2015). Raspberry-like morphology of polyvinyl chloride/zinc oxide nanoparticles induced by surface interaction and formation of nanoporous foam. RSC Advances, 5(46), 36845-36857 http://dx.doi.org/10.1039/
C5RA02694F
111. Salehi-Mobarakeh , H., & Hassannia Roudboneh , M. (2006). Study of vinyl acetate partitioning in emulsion copolymerization of vinyl chloride-vinyl acetate by FTIR and HNMR spectroscopy. Journal of Polymer Research, 13(5), 421-426 http://dx.doi.org/10.1007/s10965-006-9062-x
112 Chen, F., Ye, F., Chu, G., Guo, J., & Huo, L. (2010). Synthesis of acrylate modified vinyl chloride and vinyl isobutyl ether copolymers and their properties. Progress in Organic Coatings, 67(1), 60-65 http://dx.doi.org/10.1016/j. porgcoat.2009.09.014
113 Forcolin, S., Marconi, A. M., Ghielmi, A., Butté, A., Storti, G., & Morbidelli, M. (1999). Coagulation phenomena in emulsion polymerisation of vinyl chloride. Plastics, Rubber and Composites, 28(3), 109-115 http://dx.doi. org/10.1179/146580199101540196.
114 Kiparissides, C., Achilias, D. S., & Frantzikinakis, C. E. (2002). The effect of oxygen on the kinetics and particle size distribution in vinyl chloride emulsion polymerization. Industrial & Engineering Chemistry Research , 41(13), 3097-3109 http://dx.doi.org/10.1021/ie010928f
115 Vale, H. M., & McKenna, T. F. (2009). Particle formation in vinyl chloride emulsion polymerization: reaction modeling. Industrial & Engineering Chemistry Research, 48(11), 5193-5210 http://dx.doi.org/10.1021/ie801406n
116 Pakdel, A. S., Saeb, M. R., Abedini, H., Khonakdar, H. A., & Boldt, R. (2014). A combinatorial approach to evaluation of monomer conversion and particle size distribution in vinyl chloride emulsion polymerization. Polymer Bulletin, 71(10), 2487-2506. http://dx.doi.org/10.1007/s00289-014-1203-5.
117 Wang, H., Li, Y., Wei, Z., Song, Y., Liu, Q., Wu, C., Wang, H., & Jiang, H. (2020). Morphology, mechanical property, and processing thermal stability of PVC/LaOMMTs nanocomposites prepared via in situ intercalative polymerization. Journal of Vinyl and Additive Technology, 26(1), 97-108 http://dx.doi.org/10.1002/vnl.21719
118 Wang, H., Xie, G., Fang, M., Ying, Z., Tong, Y., & Zeng, Y. (2017). Mechanical reinforcement of Graphene/poly(vinyl
chloride) composites prepared by combining the in-situ suspension polymerization and melt-mixing methods. Composites. Part B, Engineering , 113, 278-284 http:// dx.doi.org/10.1016/j.compositesb.2017.01.053
119. Obloj-Muzaj, M., Abramowicz, A., Kumosinski, M., Zielecka, M., Kozakiewicz, J., & Gorska, A. (2016). Properties of blends for profiles and semi-rigid films made of PVC nanocomposites produced in pilot scale. AIP Conference Proceedings, 1736(1), 020065 http://dx.doi.org/10.1063/1.4949640
120. Rocha, N., Coelho, J. F. J., Cardoso, P. M. L., Barros, B., Gonçalves, P. M., Gil, M. H., & Guthrie, J. T. (2013). Synthesis of amphiphilic PVC-b-poly(hydroxypropyl acrylate) (PHPA)-b-PVC block copolymers with low PHPA contents and different molecular weights by (Single Electron Transfer): (Degenerative Chain Transfer) living radical polymerization. Journal of Vinyl and Additive Technology, 19(3), 157-167 http://dx.doi.org/10.1002/vnl.21309
121 Darvishi, R., Esfahany, M. N., & Bagheri, R. (2016). Nonisothermal Suspension polymerization of vinyl chloride for enhanced productivity. Journal of Vinyl and Additive Technology, 22(4), 470-478. http://dx.doi.org/10.1002/ vnl.21466
122 Hao, H. D., Cheng, T. Q., Zhang, Y. F., Zhu, N., Lei, J. Y., & Zhai, T. (2014). Flow field analysis of PVC polymerizer. Advanced Materials Research, 884-885, 68-72 http://dx.doi. org/10.4028/www.scientific.net/AMR.884-885.68
123 Shulaeva, E. A., Kovalenko, Y. F., & Shulaev, N. S. (2014). Simulation and modeling software in chemical technology: polymerization of vinyl chloride. Advanced Materials Research, 1040, 581-584 http://dx.doi.org/10.4028/www. scientific.net/AMR.1040.581
124 Kiparissides, C., & Pladis, P. (2022). On the prediction of suspension viscosity, grain morphology, and agitation power in SPVC reactors. Canadian Journal of Chemical Engineering, 100(4), 714-730 http://dx.doi.org/10.1002/ cjce.24262
125. Maggioris, D., Goulas, A., Alexopoulos, A. H., Chatzi, E. G., & Kiparissides, C. (2000). Prediction of particle size distribution in suspension polymerization reactors: effect of turbulence nonhomogeneity. Chemical Engineering Science, 55(20), 4611-4627 http://dx.doi.org/10.1016/ S0009-2509(00)00100-7
126 Oki, Y., & Okamoto, Y. (2002). Synthesis of AB and ABA type block copolymers of vinyl chloride using iniferter technique. Polymer Journal, 34(10), 736-741. http://dx.doi. org/10.1295/polymj.34.736
127 Zhang, S., & Wang, J. (2020). Numerical simulation of reaction efficiency of vinyl chloride suspension polymerization reactor. IOP Conference Series. Earth and Environmental Science, 546(4), 042059 http://dx.doi.org/10.1088/17551315/546/4/042059
Received: Aug. 26, 2022
Revised: Feb. 14, 2023
Accepted: May 05, 2023
Polímeros, 33(2), e20230013, 2023 18/18
Tuning the structure and properties of cell-embedded gelatin hydrogels for tumor organoids
Sarah Oliveira Lamas de Souza1* , Sérgio Mendes de Oliveira1
,
Catarina Paschoalini Lehman1
, Mercês Coelho da Silva2 , Luciana Maria Silva3 and Rodrigo Lambert Oréfice1
1Departamento de Engenharia Metalúrgica e de Materiais, Universidade Federal de Minas Gerais –UFMG, Belo Horizonte, MG, Brasil
2Universidade Federal de Itajubá – UNIFEI, Itabira, MG, Brasil
3Fundação Ezequiel Dias, Belo Horizonte, MG, Brasil *sarahlamas@gmail.com
Obstract
Tumor organoids have great potential as a 3D in vitro system to model cancer. In this work, we studied how the structure of hydrogels based on gelatin with methacryloyl groups (GeIMA) can affect their usage in tumor organoids. To this end, gelatin hydrogels with different levels of methacrylation and with cellulose nanocrystals (NCC) or reduced graphene oxide (rGO) were prepared and used to encapsulate human colon carcinoma cells (RKO). Mechanical properties of the hydrogels were measured in dynamic conditions at 37°C and water. Results showed that NCC was able to provide higher mechanical stability to the hydrogels. RKO cells embedded in GelMA were able to proliferate within the hydrogels, leading to the formation of groups of cells after 48 h. GelMA with higher crosslink densities and NCC tended to show higher cell population as possibly due to the higher level of stability and rigidity displayed by these hydrogels.
Keywords: gelatin methacryloyl, GeIMA, hydrogels, organoid, three-dimensional cell culture.
How to cite: Souza, S. O. L., Oliveira, S. M., Lehman, C. P., Silva, M. C., Silva, L. M., & Oréfice, R. L. (2023). Tuning the structure and properties of cell-embedded gelatin hydrogels for tumor organoids. Polímeros: Ciência e Tecnologia, 33(2), e20230014. https://doi.org/10.1590/0104-1428.20220024
1. Introduction
In recent years, an in vitro 3D model alternative for human tissues, called organoids, has been increasingly studied. An organoid is a group of cells that has an organization similar to an organ or tissue, usually grown in a special 3D substrate[1,2]. Organoids can be used to model a disease, introducing mutations of the disease or using pluripotent cells derived from the patient to allow drug testing and tissue replacement therapies[3]
Cancerous organoids can be developed from patients with varying degrees and subtypes of cancer. Patient-derived organoids may have genetic backgrounds, while normal organoids can be used to model cancer evolution after the insertion of oncogenic mutations[3]. The behavior of cancer strains in tumor organoids can be monitored in real time by using microscopic images, as well as cell lines, which can be expanded and preserved to establish a live biobank[4]
Significant advances in biomaterials, especially hydrogels, have offered opportunities to facilitate the development of 3D systems that can be used in promising mini tumor organoids[5]. Biomacromolecule based-hydrogels can be designed to favor cell adhesion, proliferation, migration and differentiation, and provide cells with a highly hydrated 3D environment that mimics natural soft tissues[6]. Thus, the three-dimensional structure of hydrogels together with the encapsulation of cells has great potential as an alternative to
tumor organoids as an effective cancer model to study the mechanisms of action and inhibition of tumor invasion[7]
Despite the remarkable achievements and technological progress of the last decade, developing a three-dimensional structure with efficient cellular application is still a difficult task[8]. Numerous approaches have been developed and tested in which they often presented non-scalable strategies and sometimes 3D conditions more similar to 2D cell culture.
Thus, in this work, the objective was to pursue the development of tumor organoids based on a three-dimensional matrix of gelatin methacryloyl (GeIMA). The structure and properties of GelMA were tuned by varying the crosslinking density, and by the incorporation of nanocomponents, such as cellulose nanocrystal (NCC) and reduced graphene oxide (rGO) to check the ability of this artificial extracellular matrix to support the growth of embedded human colon carcinoma cell lines (RKO AS45-1).
2. Materials and Methods
2.1 Materials
Gelatin from Porcine Skin Type A 300 Bloom (Sigma-Aldrich, G1890), Methacrylic Anhydride (MAA, Sigma-Aldrich, 276685), Dialysis Membrane Spectro /
https://doi.org/10.1590/0104-1428.20220024 O O O O O O O O O O O O O O O Polímeros, 33(2), e20230014, 2023 ISSN 1678-5169 (Online) 1/8
MWCO 12-14 kDa (Fisher Scientific), 2-Hydroxy-4′-(2hydroxyethoxy)-2-methylpropiophenone (Sigma-Aldrich, 410896-10G), Dulbecco’s Modified Eagles Medium (DMEM), High Glucose (Life Technologies, 11320033), Bovine Fetal Serum (BFS, Gibco), Trypsin 0.25% (Gibco by Lite Technologies), Antibiotic Penicilin Streptomycin (PENSTREP, Gibco by Life Technologies), LIVE / DEAD ™ Viability / Cytotoxicity Kit (Molecular Probes, 13224), Reduced Graphene Oxide (rGO) was donated by CTNANO, UFMG, Brazil.
2.2 Preparation Pre-GeIMA
The synthesis of gelatin methacryloyl was performed by solubilizing 10 g of gelatin in 100 ml of PBS (pH 7.4) at 50°C. Then, 4 g of MAA or 7 g of MAA were added to the gelatin solution to produce two different levels of methacrylation: low (LL) and high (HL), respectively. The solutions were stirred for 2 hours at 50°C, and dialyzed for 5 days against DI water, under agitation. The ungelled so-called pre-GeIMA was frozen and then lyophilized.
2.3 Preparation GeIMA
To produce GelMA, a solution of 10 mg of 2-hydroxy-4’(2-hydroxyethoxy) -2-methylpropiophenone (photoinitiator) in 1 ml of DI water and 100 mg of lyophilized pre-GelMA was submitted to UV light (wavelength in the range 360480 nm, 6.9 mW / cm2) for 10 minutes for light curing. The same amount of pre-GeIMA was used for the different levels of methacrylation to prepare GeIMA LL and GeIMA HL (low levels (LL) and high level (HL)).
2.4 Preparation GeIMA NCC and GeMA rGO
The cellulose nanocrystals (NCC) were extracted from the bleached eucalyptus pulp, donated by the company Suzano Papel e Celulose. For CNC extraction, 30 mL of sulfuric acid (H2SO4, 65% by weight) was used for each 1 g of pulp. Acid hydrolysis was carried out at 40°C for 10 minutes under mechanical stirring at 300 rpm. The obtained suspension was diluted in water and ice cubes to stop the reaction, filtered, centrifuged at 4000 rpm for 20 minutes and transferred to cellulose membranes. Dialysis was performed in distilled water until it reached neutral pH.
To prepare GelMA NCC, 10 mg of the photoinitiator and 100 mg of lyophilized pre-GelMA were added in a 1 ml of DI water. Then, 5 or 10 wt. % of NCC in relation to pre-GelMA were incorporated into the solutions to produce GeIMA LL 5% NCC, GeIMA LL 10% NCC, GeIMA HL 5% NCC and GeIMA HL 10% NCC. Similarly, 20 wt. % of rGO was dispersed in the pre-GelMA solution to yield GeIMA LL rGO, and GeIMA HL rGO after photopolymerization.
After polymerization, hydrogels were washed with DI water and were freeze-dried for the characterization procedures.
2.5 Characterization and measurements of properties
2.5.1 Fourier transform Infrared spectroscopy (FTIR)
FTIR spectra were collected using the ATR Multi-Bounce apparatus in a Nicolet 6700 spectrophotometer. Spectra were collected after 64 scans with a resolution of 4 cm-1
2.5.2 Dynamic mechanical behavior
Dynamic mechanical analysis (DMA) was performed using a DMS 6100 SII Exstar equipment in compression. The hydrogels were cut into discs with 6.5 mm in height and 8 mm in diameter and were swollen in DI water prior to the test. The tests were performed with samples submerged in DI water at 37°C and frequencies ranging from 0.05Hz to 200Hz.
2.5.3 Cell culture
RKO AS45-1 tumor cell lines (Human Colon Carcinoma) acquired from the American Type Culture Collection (ATCC # CRL-2579) were cultured in DMEM High Glucose medium in 10% Bovine Fetal Serum (SFB) and in 1% streptomycin penicillin (PEN STREP). Cell lines were incubated in humidified enriched atmosphere containing 5% CO2 at 37°C.
2.6 RKO encapsulation in hydrogels
To encapsulate cells in GelMA hydrogels, three solutions were prepared:
1- Solution FI: 1 ml of sterile Mili-Q water was heated in a 2 mL Eppendorf at 60°C with 10 mg of the photoinitiator;
2- Pre-GeIMA stock solution: 1 mL of DMEM High Glucose, 10 wt. % BFS and 1 wt. % PENSTREP were heated in a 2 ml Eppendorf at 60°C and 100 mg of lyophilized pre-GeIMA was added. The solution was mixed in Vortex and kept at 37°C;
3- Cell suspension: cells were counted in a Neubauer chamber and a cell suspension of 6.5 105 cells/mL was prepared.
The solutions were then combined for polymerization and cell encapsulation as described below:
500 µl of the pre-GeIMA stock solution, 50 µl of the FI solution and 450 µl of the cell suspension were combined to produce 1 mL of the cell dispersion in pre-GelMA aqueous solution. 450µl of this resulting solution was then used in each well of a 12-well plate, with a concentration of 3 105 cells/ml.
The plate was exposed to the incidence of ultraviolet light consisting of three 9W UVC lamps for 8 minutes and left in an oven at 37°C for 24 hours.
RKO cells were encapsulated in each type of hydrogels and the resulting hydrogels with cells were named as GeIMA LL_RKO, GeIMA LL 5% NCC_RKO, GeIMA LL 10% NCC_RKO, GeIMA LLrGO_RKO, GeIMA HL_RKO, GeIMA HL 5% NCC_RKO, GeIMA HL 10% NCC_RKO and GeIMA HL rGO_RKO.
All the labware used for the polymerization of the hydrogels was exposed to UV light from the flow hood for 20 minutes for sterilization purposes.
2.7 Cytotoxicity assays
2.7.1 Analysis of cell viability by MTT
To evaluate the cytotoxicity of the hydrogels, the MTT colorimetric assay was used.
Polímeros, 33(2), e20230014, 2023 2/8
Souza, S. O. L., Oliveira, S. M., Lehman, C. P., Silva, M. C., Silva, L. M., & Oréfice, R. L.
Tuning the structure and properties of cell-embedded gelatin hydrogels for tumor organoids
Hydrogels without encapsulated cells were cut to approximately 4x4mm, sterilized for 1 hour in 70% alcohol, and after that time, they were washed 3x in MILI-Q water. For each wash, the hydrogels were submerged for 20 minutes in MILI-Q water.
The hydrogels were placed in direct contact with the cell strain (RKO AS45-1) for 24 hours and 48 hours. As a negative control (life control): cells were cultured in DMEM High Glucose, 10 wt. % BFS and 1 wt %. PENSTREP; as a positive control (death control): Hydrogen peroxide (H2O2) was added to the cell culture. Biological and experimental triplicates were performed. The reading was performed on a SpectraMax M5E microplate reader (Molecular Devices) at 550 nm.
2.7.2 Viability by LIVE/DEAD
For the live dead tests over 24 and 48 hours, hydrogels with embedded RKO cells were polymerized in 12-well plates, in triplicates. 300µl of the live / dead solution (2.0 μM EthD-1 (Ethidium Homodimer-1) and 1.0μM Calcein AM diluted in PBS) was added and the plate was viewed under an inverted fluorescence microscope (Calcein AM filter 09; EthD-1 filter 15).
The cell viability (%) was used to count cell viability: viable cells / total cell (viable and non-viable cells) x100.
2.8 Characterization of cells
2.8.1 Scanning electron microscopy (SEM)
Hydrogels containing embedded RKO were fixed with 2.5% glutaraldehyde for 1 hour. Then, the samples were washed twice with ice cold PBS (6 ± 2) °C. Then, they were dried by immersion in solutions of increasing concentration of ethanol/water (20%, 50%, 90%, 100% v / v) and finally vacuum dried in a desiccator for 24 hours. The samples were covered with gold.
2.8.2 Histological section
After 24 hours and 48 hours in an oven at 37 °C, GeIMA LL_RKO and GeIMA HL_RKO hydrogels were fixed with 4% formaldehyde and subsequently dehydrated, mounted, submitted to microtomy, stained with hematoxylin-eosin and assembled on glass slides.
3. Results and Discussion
3.1 Fourier-Transform Infrared Spectroscopy (FTIR)
In FTIR spectra of Figure 1A, the presence of gelatin in the hydrogels was verified by the existence of the absorption bands at 3316 cm-1 and 3079 cm-1 related to the NH group[9]
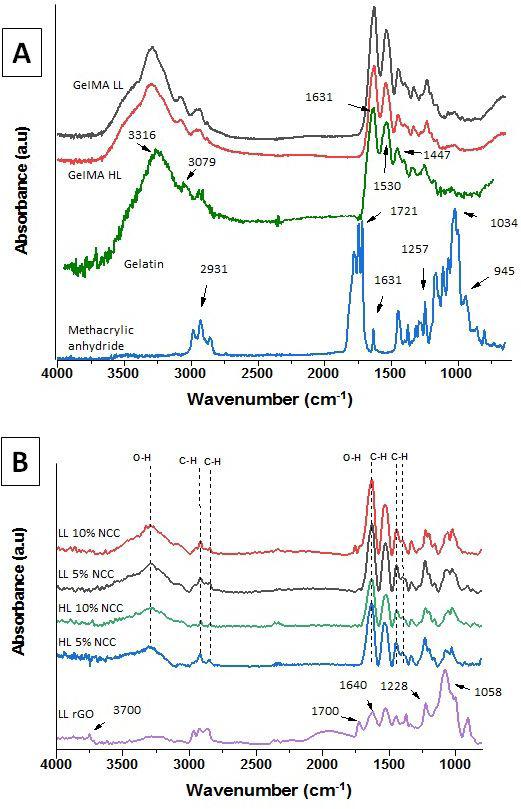
It is also possible to observe, at 1631 cm-1, typical band of the C = O bond, characteristic of amide I, and absorbance bands at 1542 cm-1 and 1237 cm-1 related to amides II and III, respectively. The band related to the CH group was also observed at 1447 cm-1
Absorption bands associated with methacrylic anhydride can be seen in the spectra of hydrogels (Figure 1A) at 1034 cm-1 due to C-O bonds[10]. The methacrylic anhydride reacts with the primary amine groups in gelatin to lead to the addition of methacryloyl groups in the gelatin
macromers[11]. GeIMA crosslinking occurs when GeIMA, in the presence of a photoinitiator, is exposed to UV light radiation. The absorption of UV light leads to the production of free radicals, and GeIMA is then polymerized through C=C chain polymerization[12]
Absorption bands around 1100 cm-1 associated with C-O bonds in NCC can be observed in the spectra of LL 5% NCC, LL 10% NCC, HL 5% NCC and HL10% NCC in Figure 1B[13,14] and can be used to prove the presence of this nanocomponent in the hydrogels. In relation to the reduced graphene oxide presence in hydrogels, it is possible to note in the spectrum of the LL rGO sample an intense and wide band that goes from approximately 3700 to 2290 cm-1 referring to the OH axial deformation of carboxylic acids. An absorption band at 1700 cm-1 due to -C=O, commonly found in carboxylic acids, can also be associated with ketone carbonyl and aldehydes[15]. Absorption bands at 1228 cm-1, attributed to C-OH stretch and at 1058 cm-1 referring to epoxides (-C-OC-) can also be identified in the spectrum of the hydrogel with rGO[16]. These absorption bands indicate that the produced rGO has several oxygen-containing groups such as epoxides, hydroxyls, carbonyls and carboxyls, related to the reaction with hydrazine hydrate[16]
3.2 Mechanical properties
Since tissues and organs in the body are most of the time subjected to dynamic mechanical loadings in a wet
Polímeros, 33(2), e20230014, 2023 3/8
Figure 1. FTIR spectra of GeIMA LL, GeIMA HL, gelatin and methacrylic Anidride (A), and FTIR spectra of GeIMA LL and GeIMA HL containing cellulose nanocrystals and rGO (B).
environment (such as from the circulation of body fluids, shear forces between moving parts of the body, etc.), it is relevant to study the behavior of biomaterials in these conditions. Moreover, it also known that dynamic loads have a great impact on the performance of tissues and organs, by promoting cell migration, differentiation, growth and biomolecule expression[17,18]. In some applications involving organoids, the ability to tune the stiffness of the hydrogels to better match the properties of the pursued tissue (to reach, for example, high values of modulus, such as 30 kPa) is desirable[19]. Elastic modulus of normal soft tissues was shown to range between 0.5 kPa (brain), 10 kPa (dermis) and 12 kPa (muscle), while the modulus of diseased fibrotic tissues is higher (15–100 kPa)[20]. For example, normal breast tissue shows moduli between 6-10 kPa. This same tissue with intermediate grade of mammary tumor has an elastic modulus in the 15-20 kPa range, while an advanced grade of tumor can reach 40 kPa[20]
Several approaches have been proposed and tested to improve the mechanical properties of hydrogels, such as the preparation of hybrid hydrogels and hydrogels with double networks[19]. However, most of the mechanical properties reported for the prepared hydrogels were measured in static conditions, such as by using conventional stress-strain tests.
Thus, GelMA hydrogels were tested in a dynamic mechanical (DMA) environment (Figure 2A), in which mechanical loads were applied in frequencies ranging from 0.05 to 200 Hz while immersed in water at 37 °C.
In Figure 2B, only dynamic mechanical data regarding GeIMA LL hydrogels are revealed to check the effect of the incorporation of nanocomponents (either NCC or rGO) on the dynamic mechanical behavior of the hydrogels. Results show that the presence of NCC in the hydrogels led to higher values of elastic storage modulus (E´) when compared to pure GeIMA LL hydrogels, demonstrating the powerful capacity of NCC to increase the stiffness of GelMA hydrogels. Moreover, a traditional behavior of E´ for viscoelastic materials was observed in frequencies ranging from 0.05 to 20Hz for all the tested hydrogels: a gradual increase of the storage modulus with frequency, meaning
that shorter times of load application can favor less ability of the polymer chains to respond to the mechanical stimulus. For higher frequencies (≥ 100 Hz), both GelMA LL hydrogels and GelMA LL rGO seemed to collapse with an abrupt decay in the E´ measurements. Otherwise, GelMA LL hydrogels with 10% NCC were able to withstand higher frequencies, demonstrating the ability of NCC to mechanically reinforce and stabilize the hydrogels. Results in Figure 2B also show that it is possible to tune the stiffness of the GelMA LL hydrogels from kPa to MPa by the incorporation of NCC.
Lower values of E´ of GelMA rGO in respect to pure GelMA were noted in Figure 2B. This is due to the fact that hydrogels with rGO were observed to have a lower degree of crosslinking than other GelMA hydrogels due to the reduced penetration of UV light during polymerization in the samples with rGO. The low degrees of crosslink for the GelMA LL rGO could also be detected by measuring the swelling degree (SD) of the hydrogel after 24 hours in DI water. ( ) 0 0 % 100 f MM SD M =× , where Mf and M0 are the weight of the sample after and before swelling, respectively. The value of SD was approximately 500% for GelMA LL and 1600% for the GelMA LL rGO. Therefore, the swelling capacity of the hydrogels with rGO was more than three times the swelling ability of pure hydrogels (with no rGO), indicating again a lower degree of crosslink. The fact that GelMA LL rGO has a lower degree of crosslinking (due to low levels of photopolymerization conversion) is the reason why this hydrogel displayed low values of elastic modulus (even lower than GelMA LL) and low stability at higher frequencies.
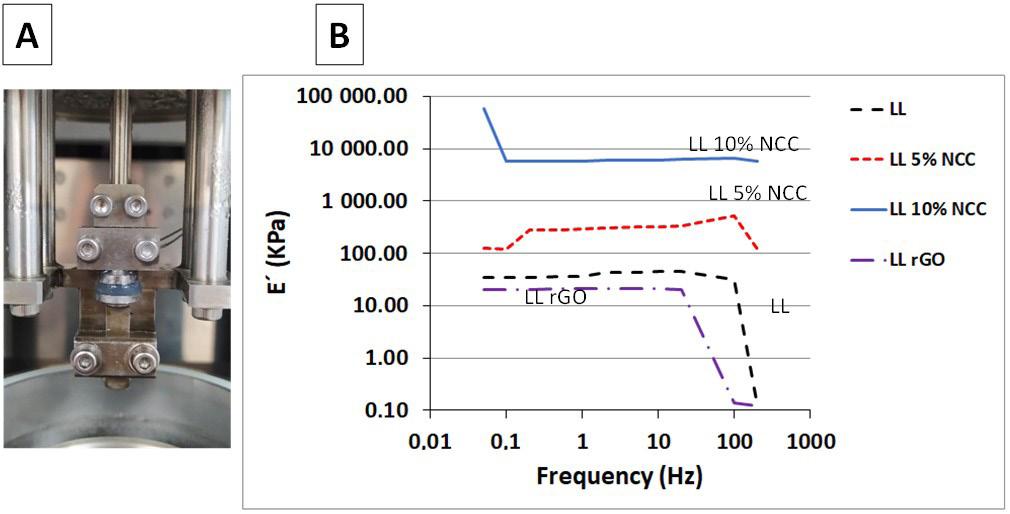
3.3 Cell viability
The results of cell viability by MTT are presented in Figure 3. These MTT tests were performed in hydrogels with no encapsulated cell to study the eventual toxicity of GelMA hydrogels and hydrogels containing nanocomponents. Thus, hydrogels were put in contact with RKO cell for 24 and 48 hours to check cell viability by the MTT protocol. Results in Figure 3 reveal that there was no statistical difference in
Polímeros, 33(2), e20230014, 2023 4/8
Souza, S. O. L., Oliveira, S. M., Lehman, C. P., Silva, M. C., Silva, L. M., & Oréfice, R. L.
Figure 2. (A) Photo of a swollen hydrogel between compression plates just prior of being dipped in DI water bath to be tested under dynamic mechanical conditions (DMA); (B) Storage elastic modulus as a function of frequency for GelMA LL hydrogels with NCC or rGO.
the viability of RKO cells, when this behavior is compared between 24 and 48 hours for each type of sample.
Viability values remained above 85%, for GeIMA LL and GeIMA HL, and in their derivatives containing 5% and 10% NCC (values above which the materials are considered non-cytotoxic). There was no significant difference in cell viability when compared to the negative control group (CV) of the MTT assay.
However, GeIMA LL rGO and HL rGO hydrogels (i.e. hydrogels with rGO) showed lower viability values (approximately 70%) that were significantly different from the negative control. These lower values of cell viability may be associated with the lower levels of stability of these hydrogels due to their lower degrees of crosslink. It was observed that the photopolymerization of pre-GelMA with rGO was less effective, leading to hydrogels with lower levels of crosslink and higher abilities to swell in water. Thus, it can be proposed that eventual unreacted specie can leach out of the Gel rGO hydrogels during the in vitro tests to lead to higher levels of cell toxicity.
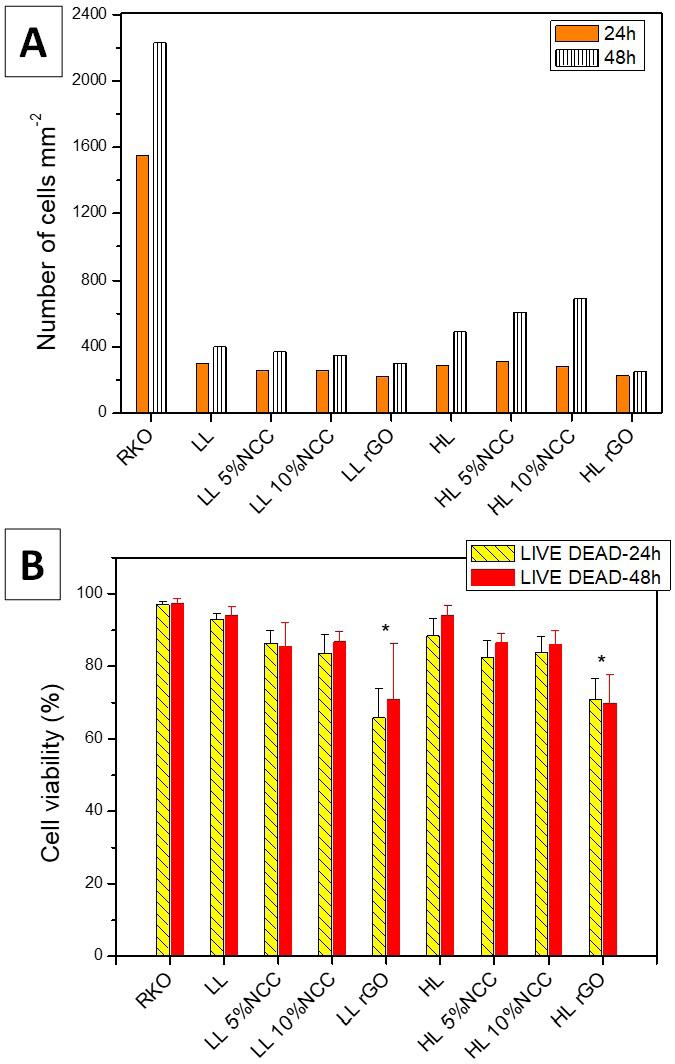
Cell viability measured by LIVE DEAD assays is presented in Figure 4. In this case, GelMA hydrogels with encapsulated RKO cells were tested to check the possibility of keeping cells alive while encapsulated within the hydrogels. Figure 4A shows the number of cells found in all hydrogels and in the RKO control group measured by Image J from the images recorded by the fluorescence microscope. The number of cells counted in hydrogels at 48 hours in an oven at 37 °C was significantly greater than the hydrogels at 24 hours. An increase in cell density after 48 hours of culturing, when compared to 24 hours of culturing, indicates that embedded cells were able to proliferate within the hydrogels due to a highly porous and chemically adequate environment that resembles the extracellular matrix provided by GeIMA[16]
The number of cells in the control group (RKO) was much higher than the cells counted in the hydrogels, but it is worth mentioning that the RKO cells were cultured in 2D culture, with the reading being linear, while the cells
were counted in the hydrogels in only one plane of their three-dimensional structure. For hydrogels with higher levels of methacryloyl substitution (GelMA HL), results in Figure 4A showed that the incorporation of NCC tended to lead to higher number of cell per area after 48 hours when compared to pure GelMA HL hydrogels. This result may be related to a more favorable ambient for cell growth, as possibly due to a higher network stability (Figure 2B) combined with higher values of stiffness (Figure 2B) for hydrogels with NCC, since tumor cells seem to be more well accommodate in stiffer extracellular matrices[20]
LIVE DEAD cell viability results (Figure 4B) agree with cell viability results reported by MTT assays (Figure 3), by showing that cell viability values above 85% were observed for all hydrogels with encapsulated RKO cells (with no statistical difference regarding the RKO control), except for hydrogels with rGO that had lower viability values (around 70%). This result also proves that the polymerization procedure did not affect the viability of the encapsulated cells.
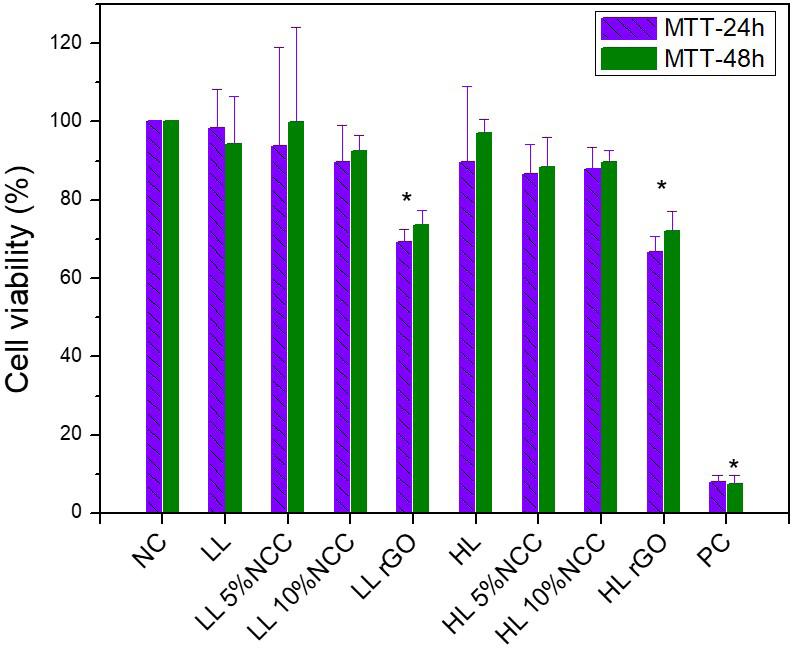
Figures 5 and 6 show optical microscopy (OM) and electron microscopy (SEM) images from LIVE DEAD tests. The reported images indicated the presence of viable cells in GelMA hydrogels. It was possible to observe an increase in cell density after 48 hours of culturing, when compared to 24 hours.
The images in Figure 5 of the histological section (HE) of the GeIMA LL RKO and HL RKO hydrogels also
Polímeros, 33(2), e20230014, 2023 5/8
Tuning the structure and properties of cell-embedded gelatin hydrogels for tumor organoids
Figure 3. Cell viability results of RKO cells in contact with hydrogels with no encapsulated cells by MTT. Cell viability after (A) 24 hours and (B) after 48 hours. NC = negative control (life control); PC = positive control (death control). *indicates significant difference.
Figure 4. (A) Number of RKO cells encapsulated in the hydrogels after 24 and 48 hours of culture; (B) cell viability results by LIVE DEAD of hydrogels containing RKO in the period of 24 hours and 48 hours. *indicates significant difference.
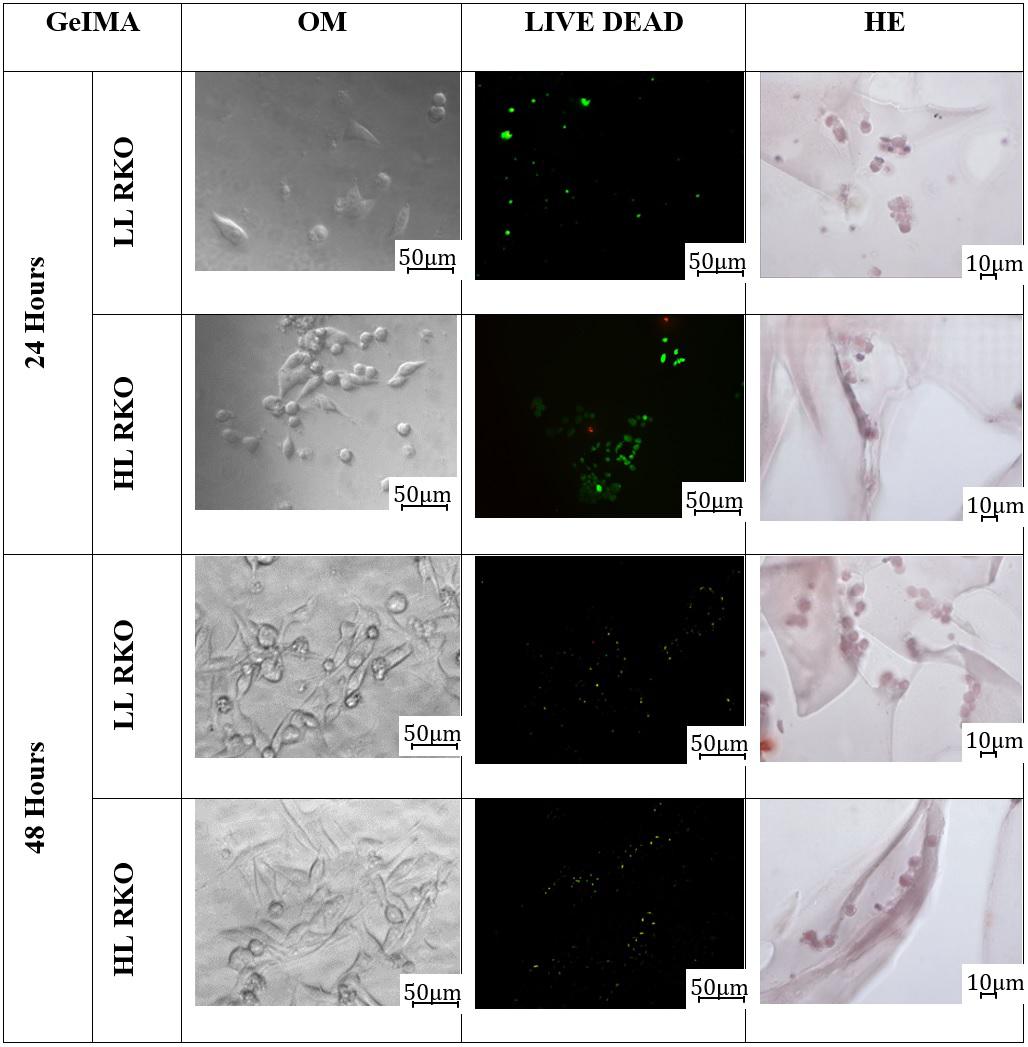
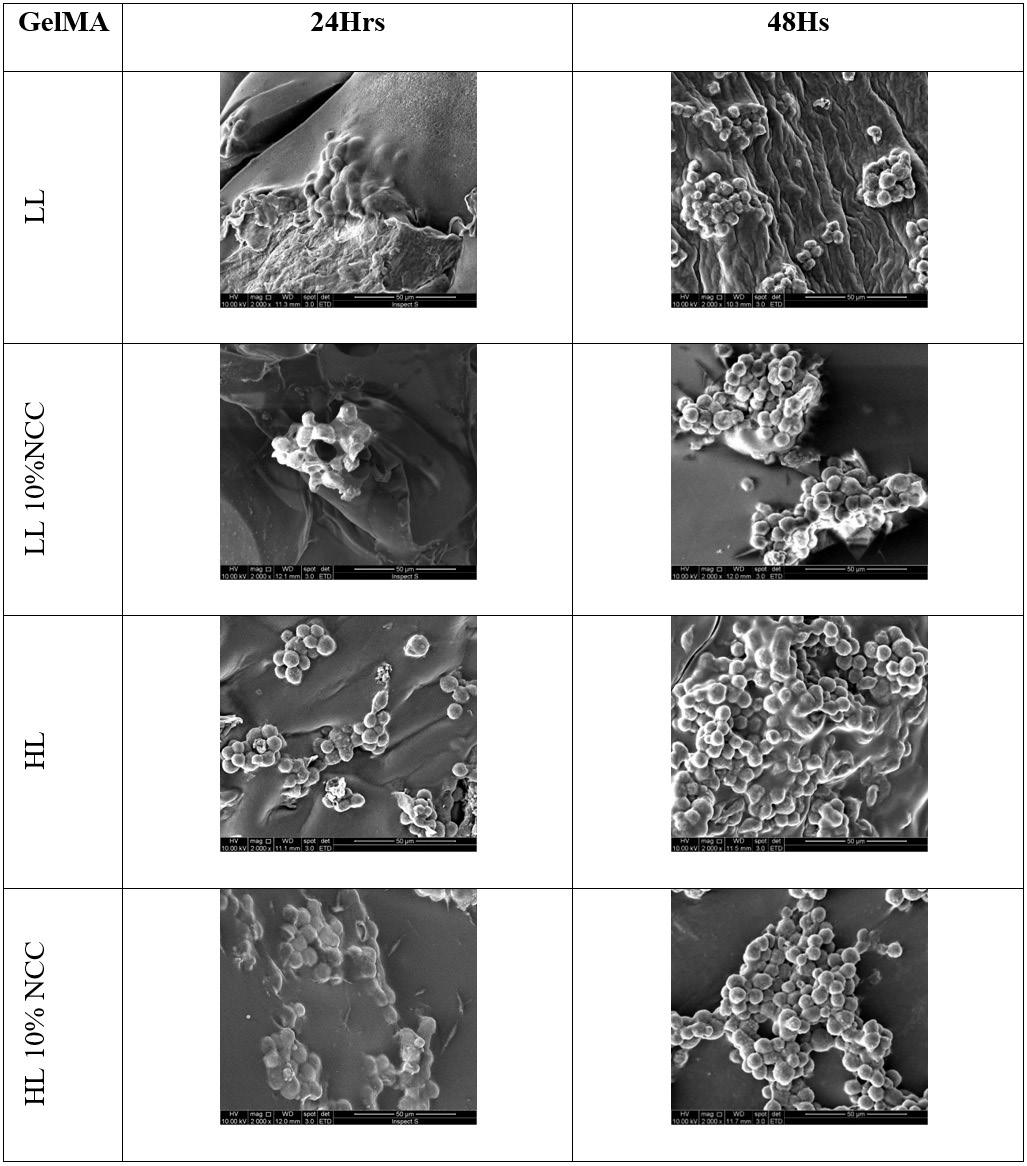
Souza, S. O. L., Oliveira, S. M., Lehman, C. P.,
M. C.,
L. M.,
Oréfice,
L. Polímeros, 33(2), e20230014, 2023 6/8
Silva,
Silva,
&
R.
Figure 5. Images of the encapsulated RKO cell in the GeIMA LL and GeIMA HL RKO hydrogels at 24 and 48 hours, obtained by optical microscopy (OM), stained by the LIVE DEAD assay and by hematoxylin eosin (HE) staining.
Figure 6. SEM images (2000X) of embedded RKO cells in the cross sections of the hydrogels.
Tuning the structure and properties of cell-embedded gelatin hydrogels for tumor organoids
demonstrate that the embedded cells with elliptical and central nuclei were able to proliferate. Elongated cells can also be seen in images of Figure 5
SEM images of the cross-section of hydrogels (Figure 6) also reveal the ability of the embedded cells to proliferate. Moreover, cells were also able to start to form organized larger groups after 48h that can yield full integrated tumor tissues as the main idea of manufacturing tumor organoids.
4. Conclusion
Tumor organoids can provide tools for studying the proliferation of cancer cells as well as the efficacy of different anti-cancer treatments. Hydrogels emerge as a potential host for cancer cells to form tumor organoids since they have high porosity and high levels of hydration that can be tuned to yield similarities to natural extracellular matrices. Gelatin-based photopolymerizable hydrogels (GelMA) can be considered a promising hydrogel for this type of application, since they possess bioactive sequences of amino acids as well as high processability and capacity for encapsulating cells. In this work, we have explored to possibility of modifying the structure of GelMA to verify its effect on properties and cancer cell encapsulation and proliferation. To this end, the degree of methacryloyl substitution in gelatin (closely related to the crosslink density) and the incorporation of nanocomponents in the hydrogels, such as cellulose nanocrystals (NCC) and reduced graphene oxide (rGO) were tested. Since natural tissues are submitted to dynamic forces during their lifetimes, hydrogels were submitted experimentally to similar conditions, in which they were submerged in water at 37°C and subjected to cyclic compression loads that varied from 0.05 to 200 Hz. Results demonstrated that hydrogels with NCC were able to withstand high frequencies (up to 200 Hz), while hydrogels with no NCC mechanically failed at lower frequencies. Moreover, GelMA with rGO were not fully crosslinked due to restriction of photopolymerization conversion. This fact led to hydrogels with lower storage modulus and lower levels of mechanically stability. Viability tests demonstrated that RKO cells were able to be encapsulated within hydrogels. These cells were also able to proliferate within the hydrogel. Hydrogels with high levels of methacryloyl substitution and containing NCC show higher proliferation rates as a possible consequence of higher levels of network stability and stiffness that may reflect more common tumor environment. SEM images of the cross-section of the hydrogels showed that RKO embedded cells can form large colonies of cells in 48 hours of culturing that indicated the possibility of using gelatin derived hydrogels as a matrix to support the proliferation of cancer cells and formation of tumor organoids.
5. Author’s Contribution
• Conceptualization – Sarah Oliveira Lamas de Souza; Luciana Maria Silva; Rodrigo Lambert Oréfice.
• Data curation – Sarah Oliveira Lamas de Souza; Sérgio Mendes de Oliveira; Catarina Paschoalini Lehman; Mercês Coelho da Silva.
• Formal analysis – Sarah Oliveira Lamas de Souza; Luciana Maria Silva; Rodrigo Lambert Oréfice.
• Funding acquisition – Rodrigo Lambert Oréfice.
• Investigation – Sarah Oliveira Lamas de Souza; Sérgio Mendes de Oliveira; Catarina Paschoalini Lehman; Mercês Coelho da Silva; Luciana Maria Silva; Rodrigo Lambert Oréfice.
• Methodology – Sarah Oliveira Lamas de Souza; Sérgio Mendes de Oliveira; Catarina Paschoalini Lehman; Mercês Coelho da Silva.
• Project administration – Rodrigo Lambert Oréfice.
• Resources – Rodrigo Lambert Oréfice.
• Software – NA.
• Supervision – Rodrigo Lambert Oréfice.
• Validation – Luciana Maria Silva; Rodrigo Lambert Oréfice.
• Visualization – Luciana Maria Silva; Rodrigo Lambert Oréfice.
• Writing – original draft – Sarah Oliveira Lamas de Souza; Rodrigo Lambert Oréfice.
• Writing – review & editing – Sarah Oliveira Lamas de Souza; Rodrigo Lambert Oréfice.
6. Acknowledgements
The authors thank CAPES, CNPq and FAPEMIG for their financial support.
7. References
1. Aamodt, J. M., & Grainger, D. W. (2016). Extracellular matrixbased biomaterial scaffolds and the host response. Biomaterials, 86, 68-82 http://dx.doi.org/10.1016/j.biomaterials.2016.02.003 PMid:26890039.
2 Nuciforo, S., Fofana, I., Matter, M. S., Blumer, T., Calabrese, D., Boldanova, T., Piscuoglio, S., Wieland, S., Ringnalda, F., Schwank, G., Terracciano, L. M., Ng, C. K. Y., & Heim, M. H. (2018). Organoid models of human liver cancers derived from tumor needle biopsies. Cell Reports, 24(5), 1363-1376 http:// dx.doi.org/10.1016/j.celrep.2018.07.001 PMid:30067989.
3 Lancaster, M. A., & Knoblich, J. A. (2014). Generation of cerebral organoids from human pluripotent stem cells. Nature Protocols , 9(10), 2329-2340 http://dx.doi.org/10.1038/ nprot.2014.158 PMid:25188634.
4 Maenhoudt, N., Defraye, C., Boretto, M., Jan, Z., Heremans, R., Boeckx, B., Hermans, F., Arijs, I., Cox, B., Van Nieuwenhuysen, E., Vergote, I., Van Rompuy, A.-S., Lambrechts, D., Timmerman, D., & Vankelecom, H. (2020). Developing organoids from ovarian cancer as experimental and preclinical models. Stem Cell Reports, 14(4), 717-729 http://dx.doi.org/10.1016/j. stemcr.2020.03.004 PMid:32243841.
5 Thakuri, P. S., Liu, C., Luker, G. D., & Tavana, H. (2018). Biomaterials-based approaches to tumor spheroid and organoid modeling. Advanced Healthcare Materials, 7(6), e1700980. http://dx.doi.org/10.1002/adhm.201700980 PMid:29205942.
6 Lima, F., Melo, W. G., Braga, M. F., Vieira, E., Câmara, J. V., Pierote, J. J., Argôlo, N., No., Silva, E., Fo., & Fialho, A. C. (2021). Chitosan-based hydrogel for treatment of temporomandibular joint arthritis. Polímeros: Ciência e Tecnologia, 31(2), e2021019 http://dx.doi.org/10.1590/01041428.20210026
Polímeros, 33(2), e20230014, 2023 7/8
7 Huang, J., Jiang, Y., Ren, Y., Liu, Y., Wu, X., Li, Z., & Ren, J. (2020). Biomaterials and biosensors in intestinal organoid culture, a progress review. Journal of Biomedical Materials Research. Part A, 108(7), 1501-1508 http://dx.doi.org/10.1002/ jbm.a.36921 PMid:32170907.
8. Dong, Z., Yuan, Q., Huang, K., Xu, W., Liu, G., & Gu, Z. (2019). Gelatin methacryloyl (Gelma)-based biomaterials for bone regeneration. RSC Advances, 9(31), 17737-17744 http:// dx.doi.org/10.1039/C9RA02695A PMid:35520570.
9 Soares, G. O. N., Lima, F. A., Goulart, G. A. C., & Oréfice, R. L. (2021). Physicochemical characterization of the gelatin/ polycaprolactone nanofibers loaded with diclofenac potassium for topical use aiming potential anti-inflammatory action. International Journal of Polymeric Materials, 71(17), 13031318 http://dx.doi.org/10.1080/00914037.2021.1962875
10. Sun, M., Sun, X., Wang, Z., Guo, S., Yu, G., & Yang, H. (2018). Synthesis and properties of gelatin methacryloyl (Gelma) hydrogels and their recent applications in load-bearing tissue. Polymers, 10(11), 1290 http://dx.doi.org/10.3390/ polym10111290 PMid:30961215.
11 Zhu, M., Wang, Y., Ferracci, G., Zheng, J., Cho, N.-J., & Lee, B. H. (2019). Gelatin methacryloyl and its hydrogels with an exceptional degree of controllability and batch-to-batch consistency. Scientific Reports, 9(1), 6863 http://dx.doi. org/10.1038/s41598-019-42186-x PMid:31053756.
12. Krishnamoorthy, S., Noorani, B., & Xu, C. (2019). Effects of encapsulated cells on the physical–mechanical properties and microstructure of gelatin methacrylate hydrogels. International Journal of Molecular Sciences, 20(20), 5061 http://dx.doi. org/10.3390/ijms20205061. PMid:31614713.
13 Kong , J. , & Yu , S. (2007 ). Fourier transform infrared spectroscopic analysis of protein secondary structures. Acta Biochimica et Biophysica Sinica, 39(8), 549-559. http://dx.doi. org/10.1111/j.1745-7270.2007.00320.x PMid:17687489.
14 Mertz, G., Fouquet, T., Becker, C., Ziarelli, F., & Ruch, D. (2014). A methacrylic anhydride difunctional precursor to produce a hydrolysis-sensitive coating by aerosol-assisted
atmospheric plasma process: hydrolysis-sensitive coating deposited by aerosol assisted atmospheric plasma. Plasma Processes and Polymers, 11 (8), 728-733 http://dx.doi. org/10.1002/ppap.201400050
15. Edmondson, R., Broglie, J. J., Adcock, A. F., & Yang, L. (2014). Three-dimensional cell culture systems and their applications in drug discovery and cell-based biosensors. Assay and Drug Development Technologies, 12(4), 207-218 http://dx.doi. org/10.1089/adt.2014.573 PMid:24831787.
16. Grenier, J., Duval, H., Barou, F., Lv, P., David, B., & Letourneur, D. (2019). Mechanisms of pore formation in hydrogel scaffolds textured by freeze-drying. Acta Biomaterialia, 94, 195-203 http://dx.doi.org/10.1016/j.actbio.2019.05.070. PMid:31154055.
17 Nichol, J. W., Koshy, S. T., Bae, H., Hwang, C. M., Yamanlar, S., & Khademhosseini, A. (2010). Cell-laden microengineered gelatin methacrylate hydrogels. Biomaterials, 31(21), 55365544 http://dx.doi.org/10.1016/j.biomaterials.2010.03.064 PMid:20417964.
18 Achterberg, V. F., Buscemi, L., Diekmann, H., Smith-Clerc, J., Schwengler, H., Meister, J.-J., Wenck, H., Gallinat, S., & Hinz, B. (2014). The nano-scale mechanical properties of the extracellular matrix regulate dermal fibroblast function. The Journal of Investigative Dermatology, 134(7), 1862-1872 http://dx.doi.org/10.1038/jid.2014.90 PMid:24670384.
19 Yue, K., Trujillo-de-Santiago, G., Alvarez, M. M., Tamayol, A., Annabi, N., & Khademhosseini, A. (2015). Synthesis, properties, and biomedical applications of gelatin methacryloyl (Gelma) hydrogels. Biomaterials, 73, 254-271 http://dx.doi. org/10.1016/j.biomaterials.2015.08.045. PMid:26414409.
20 Magno, V., Meinhardt, A., & Werner, C. (2020). Polymer hydrogels to guide organotypic and organoid cultures. Advanced Functional Materials , 30(48), 2000097 http:// dx.doi.org/10.1002/adfm.202000097
Received: Mar. 22, 2022
Revised: Feb. 14, 2023
Accepted: May 05, 2023
Polímeros, 33(2), e20230014, 2023 8/8
Souza, S. O. L., Oliveira, S. M., Lehman, C. P., Silva, M. C., Silva, L. M., & Oréfice, R. L.
Fabrication of fracturing fluid with cationic surfactants and carboxymethyl hydroxyethyl cellulose
Sanbao
1Shaanxi Province Key Laboratory of Environmental Pollution Control and Reservoir Protection Technology of Oilfields, Xi’an Shiyou University, Xi’an, China
2Shaanxi University Engineering Research Center of Oil and Gas Field Chemistry, Xi’an Shiyou University, Xi’an, China
*gangchen@xsyu.edu
Obstract
The surfactant-polymer-based (S/P) fracturing fluid combines the advantages of the surfactant-based and polymer-based fracturing fluids. In this study, the synergistic tackifying of cationic surfactants and carboxymethyl hydroxyethyl cellulose and the potential application in hydraulic fracturing fluid was investigated. Firstly, cetyltrimethylammonium chloride (CTAC) and salicylic acid (SA) with a weight ratio of 4:1 were optimized as the main agent of the small molecule surfactant gel, which was then mixed with carboxymethyl 2-hydroxyethyl ether cellulose (CMHEC) and salicylic acid (SA) to obtain the S/P gel. The proppant suspension performance, gel-breaking properties, salt-resistance and thermal stability of the optimized S/P were evaluated to confirm their potential application in the hydraulic fracturing fluid. These results showed that the performance of the S/P fracturing fluid system was much better than the performance of the surfactant fracturing fluid and also the performance of polymer fracturing fluid.
Keywords: clean fracturing fluid, polymer, salicylic acid, surfactant.
How to cite: Dong, S., Tian, W., Qiang, W., Jiao, L., Zhang, J., & Chen, G. (2023). Fabrication of fracturing fluid with cationic surfactants and carboxymethyl hydroxyethyl cellulose. Polímeros: Ciência e Tecnologia, 33(2), e20230015. https://doi.org/10.1590/0104-1428.20210010
1. Introduction
In recent years, with the depletion of the conventional oil and gas reservoirs, the exploration of unconventional reservoirs has attracted much attention from researchers[1]. However, the oil in the unconventional reservoirs can not be produced at an economic flow rate without the assistance from stimulation treatments[2], which includes steam injection for heavy oil extraction, acid stimulation and hydraulic fracturing for oil recovery from low-permeability reservoirs (e.g., shale reservoirs), etc. At present, hydraulic fracturing has been considered as a common and efficient stimulation treatment to promote the exploration of the tight reservoirs[3,4]. Fracturing fluid plays a critical role in hydraulic fracturing operations, since fracturing fluid could transfer pressure, create cracks and deliver the proppant particles into the fractures during the operation[5]. The fracturing fluid is designed to have the above abilities under harsh reservoir conditions (e.g., high temperature, high salinity, etc.)[6]. Fracturing fluid based on polymers (e.g., linear polymers[7,8], crosslinked polymers[9-12], synthetic polymers[13-15], etc.) have been extensively used as the working fluids during the fracturing process, since the polymer-based fracturing fluids exhibit high performances in proppant suspension, thermal stability and reducing the fluid leak-off during the fracturing stimulation[2,16]. However, the polymers in the fracturing fluids are hard to be completely broken and degraded by the breaker. The residuals with high content
in the broken polymer-based fracturing fluids would block the pore throats and herein lead to formation damage[17,18]
It is reasonable to expect that a fracturing fluid with low content of polymers would result in less insoluble residuals and serious formation damage could be effectively avoided.
In order to prevent serious damage to the formation during the fracturing process, other types of fracturing fluids have been developed and employed in the fields, including viscoelastic surfactant-based[19-24] and foambased[25-31] fracturing fluid, which are selected according to the reservoir conditions. The viscoelastic surfactants (VES) can assemble into wormlike micelles (WLMs), which lead to the formation of tight networks caused by the physical association and entanglement of the WLMs[32-34]. Due to the presence of the WLMs and their entanglement, the VES fracturing fluid exhibits viscoelastic properties and excellent proppant suspension properties[33,34]. Besides, due to the low molecule weight nature of the VES, no residues are produced by the VES fracturing fluids after gel-breaking in high-temperature reservoirs and heavy damage to the proppant pack and formation can be prevented[3]. The filter cake layer on the fracture faces can not be quickly developed due to the lack of enough water-insoluble impurities in the VES fracturing fluids[2,3]. Therefore, the VES fracturing fluid would produce a large fluid leak-off into the formation.
https://doi.org/10.1590/0104-1428.20210010 O O O O O O O O O O O O O O O Polímeros, 33(2), e20230015, 2023 ISSN 1678-5169 (Online) 1/10
Dong1,2 , Wen Tian1, Wenting Qiang1, Long Jiao1 , Jie Zhang1 and Gang Chen1,2*
The viscoelastic properties of the VES fracturing fluids will disappear when the fluids meet the hydrocarbons in the formation. Besides, some performances (e.g., thermal stability, proppant suspension, fluid loss, etc.) of the VES fracturing fluids can be greatly affected by the temperature and salinity conditions of the formation[35,36]. It should be noted that the high concentration of surfactants in the VES fracturing fluid increases its cost and affects its application[36]. Thus, methods need to be developed to enhance the performance of the VES fracturing fluids and enlarge their application.
Salts (e.g., KCl[37,38], NaSal[37-39], NaNO3[40], etc.), polymers (e.g., cellulose nanofiber[41], hydroxypropyl guar[42], etc.) and nanoparticles (e.g., SiO2 nanoparticle[43], ZnO nanoparticle[44], etc.) are often used to enhance the properties (e.g., rheological property, leak-off property, filter cake-building property, etc.) of VES fracturing fluids under harsh formation conditions (e.g., high temperature, high salinity, etc.). However, while the addition of those chemicals is effective, the costs of which need to be taken into consideration. Walker et al.[45]. confirmed that the NaSal could promote the formation of worm-like micelles (WLM) at much lower concentrations of CTAB, integrate into the micelles and alter the repulsive interactions that governing the micelles, which leads to a great increase in the viscosity of the CTAB micelles. Dai et al.[46] also used the CTAB and NaSal to prepare a WLM system, which could be served as VES fracturing fluid. Besides, the cellulose derivatives, such as carboxymethyl hydroxyethylcellulose (CMHEC), have been used to viscosify the fracturing fluids[3,47-49] because of the cellulose derivatives’ proper properties (easy availability, economic efficiency, low toxicity, etc.) The synergy between polymers (e.g., CMHEC) and viscoelastic surfactants has been found by many researchers in recent years[2,5,46-49]. Li et al.[47] found that the synergy appeared between CMHEC and CTAB in the construction of fracturing fluid with proper properties[46-50]
In this paper, cetyltrimethylammonium chloride (CTAC) [51,52] and salicylic acid (SA) were used in combination with carboxymethyl 2-hydroxyethyl ether cellulose (CMHEC) to develop a S/P fracturing fluid with proper properties. The ratio of these three components of the S/P fracturing fluid was optimized through the evaluation of thermal stability, proppant suspension, gel-breaking, salt tolerance and shear stability. We expect the synergy between the surfactant (CTAC), SA and CMHEC could effectively avoid the disadvantages of the surfactant-based and the polymer-based fracturing fluids.
2. Experimental 2.1 Materials
KCl and salicylic acid were purchased from Tianjin Shengao Chemical Reagent Co., Ltd. CaCl2 (96.0% purity) was supplied from Kelong Chemical Reagent Factory in Chengdu. Salicylic acid (SA) and cetyltrimethylammonium chloride (CTAC) were purchased from Epno Chemical Co., Ltd. PVA 2488 was purchased from Hebei Shenpeng Chemical Reagent Co., Ltd Division. Polyacrylamide (PAM) was purchased from Renqiu Shangkang Chemical Co., Ltd. Carboxymethyl 2-hydroxyethyl ether cellulose (CMHEC)
and carboxymethyl cellulose (CMC) were purchased from Tianjin Kemio Chemical Reagent Co., Ltd. Guar gum was purchased from Jinjia Chemical Products Co., Ltd. Gemini quaternary ammonium salt (Gemini QAS, 60% purity) was supplied from Jiangsu Jintenai Company.
2.2 Optimization of the ratio of CATC/SA
In this section, a series of clean fracturing fluids contain CATC and SA at weight ratios of 4:1, 5:1, 5:1, 6:1, 7:1, 8:1, 9:1 and 10:0 were prepared. In each clean fracturing fluid, the total content of CATC and SA was 2 wt%, while the content of KCl was 0.2 wt%. After the preparation of the clean fracturing fluid, the temperature resistance, the sand suspension performance and the gel-breaking properties of each fracturing fluid were investigated to find the proper ratio of CATC/SA.
2.3 Optimization of the ratio of CATC/SA
In this section, 0.1 wt% polymer was introduced into each clean fracturing fluid optimized in Section 2.2 to evaluate the polymer’s effect on the temperature resistance, proppant suspension performance and gel-breaking properties of each S/P fracturing fluid. After these evaluations, a polymer from the candidate polymers would be selected. The optimized polymer was then introduced into the clean fracturing fluid with CTAC and SA (at an optimized CTAC/SA ratio) to obtain a series of S/P fracturing fluid. The concentration of the optimized polymer in each S/P fracturing varied from 0.1 wt% to 0.5 wt%. The apparent viscosity of each S/P fracturing fluid was evaluated at 40°C, 50°C, 60°C, 70°C and 80°C to find the optimized dosage of the optimized polymer.
2.4 Thermal stability evaluation
During the fracturing operation, the viscosity of the fracturing fluid is significantly affected by the high temperature of the reservoirs. Fracturing fluid with low viscosity is not able to suspend proppants and hence no enough proppants could be placed in the fractures, leading to the formation of closed fractures after the fracturing treatment. In this section, the thermal resistance of the S/P fracturing fluid will be rated by measuring its viscosity in a temperature range of 40°C - 80°C.
2.5 Proppant suspension performance test
After the hydraulic fracturing treatment, enough proppants are required to hold the fractures open to achieve an efficient conduit for the recovery of oil from formation to the wellbore. Therefore, the proppant suspension performance of the fracturing is crucial to assure the distribution of the proppant in the fractures and the success of the hydraulic fracturing. In this section, the proppant suspension performance of each fracturing fluid will be evaluated.
In each experiment, a certain amount (ranges from 5 g to 40 g) of proppant will be mixed with 100 mL fracturing fluid in a beaker. After the mixing, the beaker with fracturing fluid and proppants was kept under static conditions and placed in a water bath. The temperature of the water bath was kept at 50 °C, 60 °C, 70°C and 80 °C. The length of the time that the proppants require to sink to the bottom of
Polímeros, 33(2), e20230015, 2023 2/10
Dong, S., Tian, W., Qiang, W., Jiao, L., Zhang, J., & Chen, G.
Fabrication of fracturing fluid with cationic surfactants and carboxymethyl hydroxyethyl cellulose
the beaker was recorded, by this way, the settling velocity of the proppants could be calculated.
2.6 Gel-breaking properties evaluation
During the hydraulic fracturing treatment, the invasion of fracturing fluids into the matrix would cause the mixing of the fracturing fluids with the residual crude oil in the pores of the matrix. The solubilization of crude oil in the surfactant micelles in the fracturing fluid would lead to the decomposition of the micelles and the gel-breaking of the fracturing fluids. Besides, the mixing of fracturing fluid and oil in the presence of surfactants may also lead to the formation of an emulsion. In order to enhance the recovery of the residual oil in the formation, the emulsions formed in the pores need to be removed and flowed back to the production wells. However, this process is affected by the viscosity of the formed emulsion.
In this section, the gel-breaking properties of the fracturing were evaluated with the method described in the standard of SY/T 5107-2016 (The evaluation measurement for properties of water-based fracturing fluid). In each experiment, 400 mL S/P fracturing fluid was mixed with 5 mL crude oil and then placed in a beaker. During the whole gel-breaking time, the temperature of the fracturing fluid was kept at 80 °C. The viscosity of the fracturing fluid was measured every 30 min to monitor the gel-breaking process.
2.7 Salinity resistance test
After the invasion of fracturing fluids into the formation, the fluids in the formation may dilute the fracturing fluid. The salts with divalent ions in the formation water may significantly affect the performance of the fracturing fluid. In this section, CaCl2 was used to evaluate the salinity resistance of the fracturing water. In each measurement, a certain amount of CaCl2 (0.05 wt%, 0.1 wt%, 0.2 wt%, 0.5 wt% and 1 wt%) was introduced into the fracturing fluid. The viscosity of each fracturing fluid system at 40 °C, 50 °C, 60 °C, 70 °C and 80 °C were measured.
2.8 Shear resistance performance
In this section, the viscosity of each fracturing fluid over the temperature range of 30 - 100 °C at a heating rate of 3 °C/min and a shear rate of 170 s-1 was measured using a rheometer (HAAKE-pv30).
3. Results and Discussions
3.1 Optimization of the CTAC/SA ratio
Figure 1 shows the viscosities of the fracturing fluids with different CTAC/SA ratios. As can be seen from Figure 1, the viscosity of each fracturing fluid decreases as the ratio moves from 1:1 to 9:1, indicating that the SA’s significant efficiency in increasing the viscosity of the CATC solution. It could be found that as the CTAC/ratio ranges from 1:1 to 4:1, the viscosity of the fracturing fluid at 80 °C ramps from 33 mPa∙s to 66 mPa∙s. However, as the CTAC/SA ratio further increases from 4:1 to 1:1, no significant increase in the viscosity value could be observed. Therefore the optimized formula of the clean fracturing fluid was measured
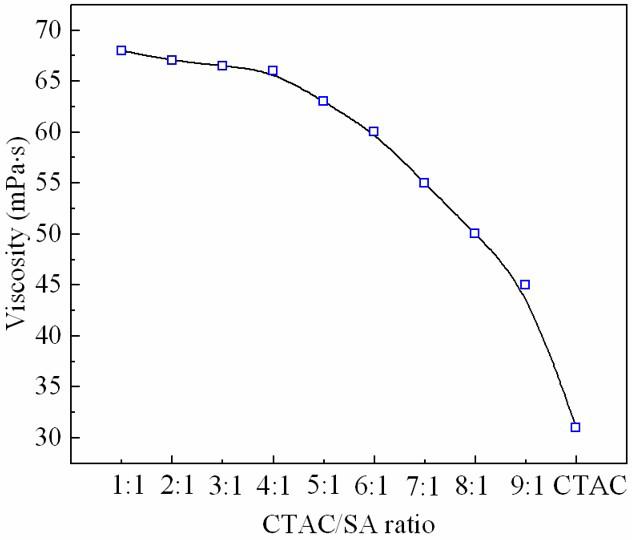
to be 1.6 wt% CTAC and 0.4 wt% SA (CTAC/SA = 4:1) and 0.2 wt% KCl.
A possible mechanism to explain the SA’s effect of viscosifing the CTAC solution (fracturing fluid) is shown in Figure 2. As presented in Figure 2, the diagram of surfactant gel formation of CTAC and SA, CTAC begins to form micelles above the critical micelle concentration, and the micelles will form a 3-D network in the presence of SA[39,45]. It should be noted that since the CTAC molecule contains the same polar group (quaternary ammonium group) with a positive charge, the electrostatic repulsions among CTAC molecules will be established if the surfactant molecules stay close. It is reasonable to expect that the repulsive force would increase the distance between two CTAC molecules, and reduce the CTAC’s packing density. When SA molecules are introduced into the CTAC solution, the SA molecule with a negative charge (under alkaline conditions) could be attracted and around the CTAC molecules because of the attraction force between opposite charges. Besides, the interaction between the quaternary ammonium group of CTAC and the aromatic nucleus of the SA also contribute to the intermolecular interactions[39]. As the SA can neutralize the headgroup repulsions as described above, the SA molecules could promote the formation and growth of CTAC wormlike micelles with high CTAC packing density, thereby enhancing the viscosity of the CTAC solution.
3.2 Settling velocity of the proppants in fracturing fluid
As shown in Figure 3, at each temperature, the settling velocity of the proppants increases as the proppants content increases from 5g/100mL to 40g/100mL, the settling velocity of the proppants increase as the ratio of CTAC/ SA varies from 4:1 to 9:1, indicating that the SA facilitates the proppant suspending performance of the fracturing fluid, which may be due to the ability of SA in increasing the viscosity of the CTAC solution as explained in Section 3.1. The clean fracturing fluid with a CTAC/SA ratio of 4:1 is the optimized fracturing fluid. At each temperature, the settling velocity of the proppants in the fracturing fluid with 2 wt% CTAC is the highest. It can also be seen from
Polímeros, 33(2), e20230015, 2023 3/10
Figure 1. Effect of CTAC/SA ratio on the viscosity of the fracturing fluid at 80 °C.
Figure 3 that the settling velocity of the proppants increases as the temperature increases from 50 °C to 80 °C, which may be caused by the decreased viscosity of the fracturing fluid.
As shown in Figure 4, after settling for three days under static condition, the proppants remained suspended and dispersed in the fracturing fluids with various CTAC/SA ratios, indicating the well proppant suspension performance of the fracturing fluids. In Figure 4, in the fracturing fluid with a CTAC/SA ratio of 4:1, no significant bedding of the proppants is observed. While in the fracturing fluid with 2 wt% CTAC, significant bedding of the proppants can be observed. Therefore, increasing the content of SA would facilitate the suspension performance of the fracturing fluid containing CTAC, which is also caused by the SA’s ability of neutralizing the positively charged ammonium group of CTAC and promoting the formation/growth of the CTAC micelles, which has been confirmed by Dai et al.[39]. and Walker et al.[45]
3.3 Settling velocity of the proppants in fracturing fluid
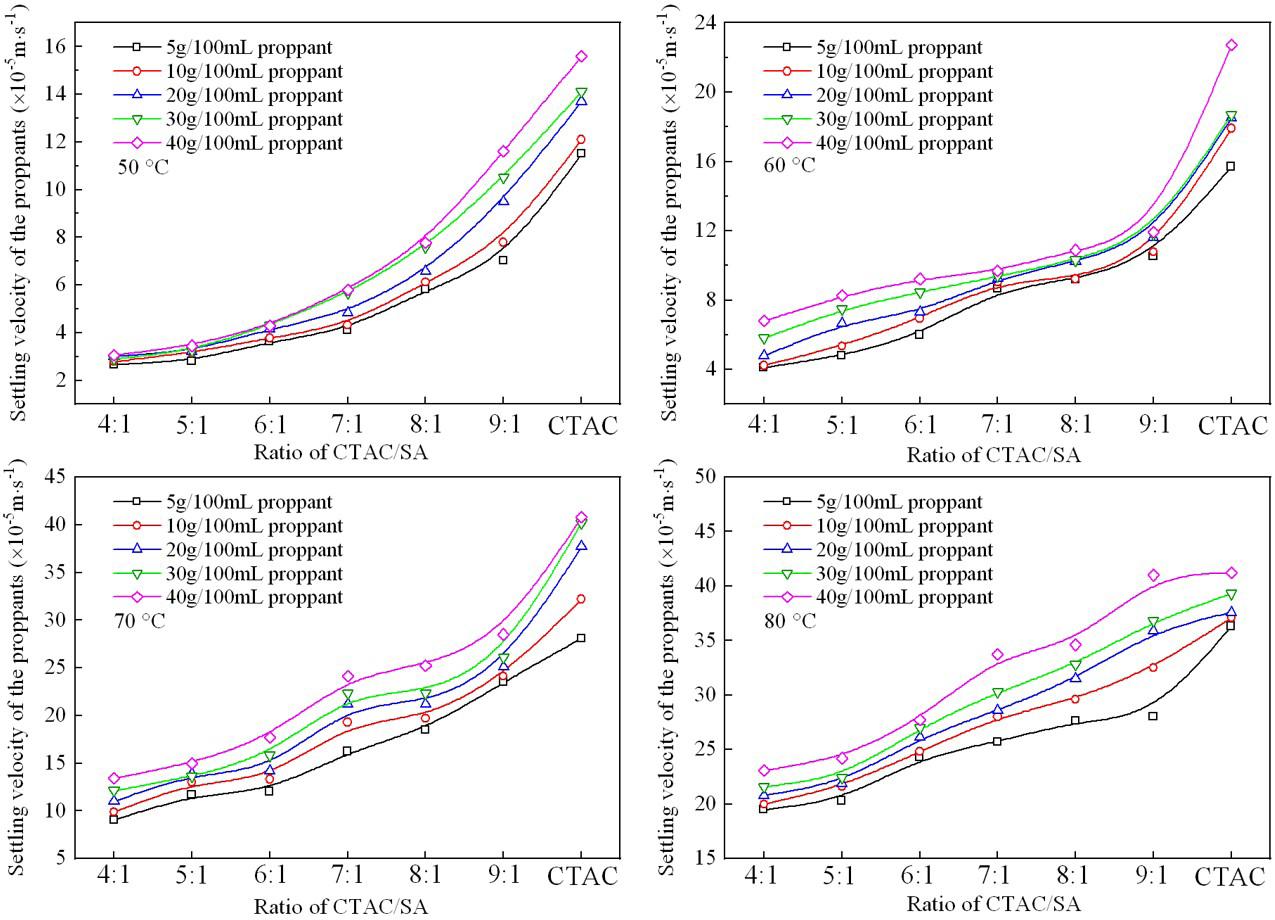
The gel-breaking properties are crucial for the success of the fracturing stimulation, as the fracturing fluid needs to be
broken in the wellbores and fractures. After the breaking of the fracturing fluids, the broken fracturing fluids need to be removed from the fractures and the pores of the formation to avoid the blockage of the fractures and the pores in the formation. Traditionally, the viscosity of the fracturing fluids after the breaking should be low enough to facilitate the flowing back of the broken fracturing fluids to the ground. In this section, a crude oil sample is employed as the breaker. In each experiment, a certain amount (v/v 1/80 based on the volume of the fracturing fluid) of crude oil is mixed with the fracturing fluids and then the mixtures are kept under static conditions at 80 °C. The viscosity of the mixtures is measured at 90 mins after the mixing.
Figure 5 shows the viscosities of each broken fracturing fluid at 90 mins after the mixing of fracturing fluid and crude oil. After breaking, the viscosity of fracturing fluid with CTAC and SA (with a CTAC/SA ratio of 4:1) is 1.25 mPa∙s, which is the lowest viscosity. With the increase of CTAC in the broken fracturing fluids, the viscosity of which gradually increases from 1.2 mPa∙s to 4.8 mPa∙s, which may be caused by the emulsification of the broken fracturing fluid and crude oil
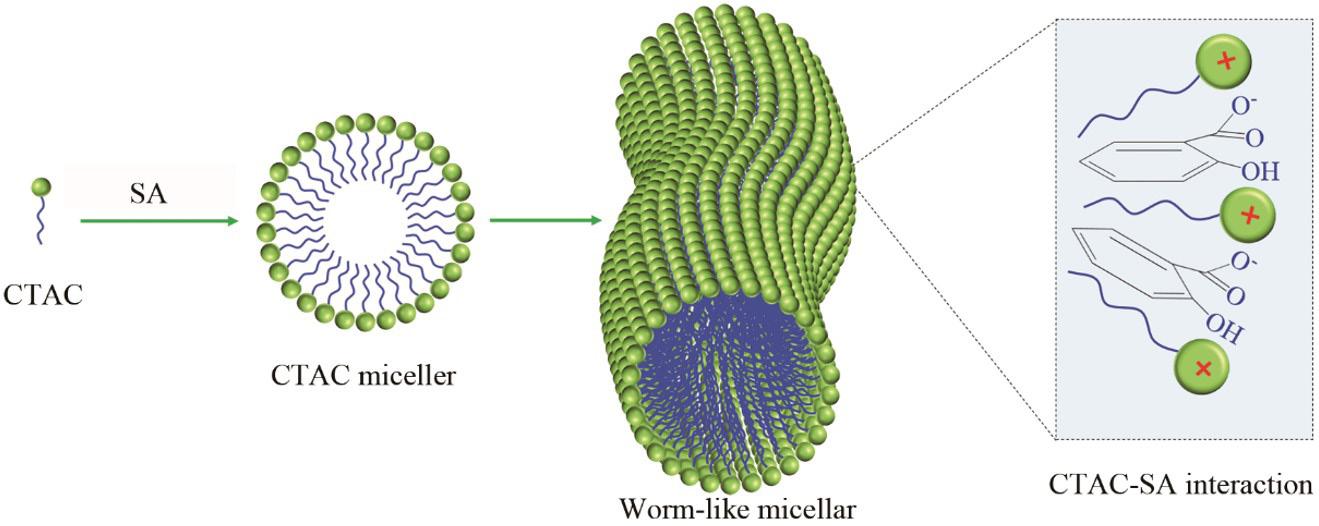
Dong, S., Tian, W., Qiang, W., Jiao, L., Zhang, J., & Chen, G. Polímeros, 33(2), e20230015, 2023 4/10
Figure 2. Schematic diagram of surfactant gel formation of CTAC and SA.
Figure 3. Settling velocity of proppants in different fracturing fluids.
Fabrication of fracturing fluid with cationic surfactants and carboxymethyl hydroxyethyl cellulose
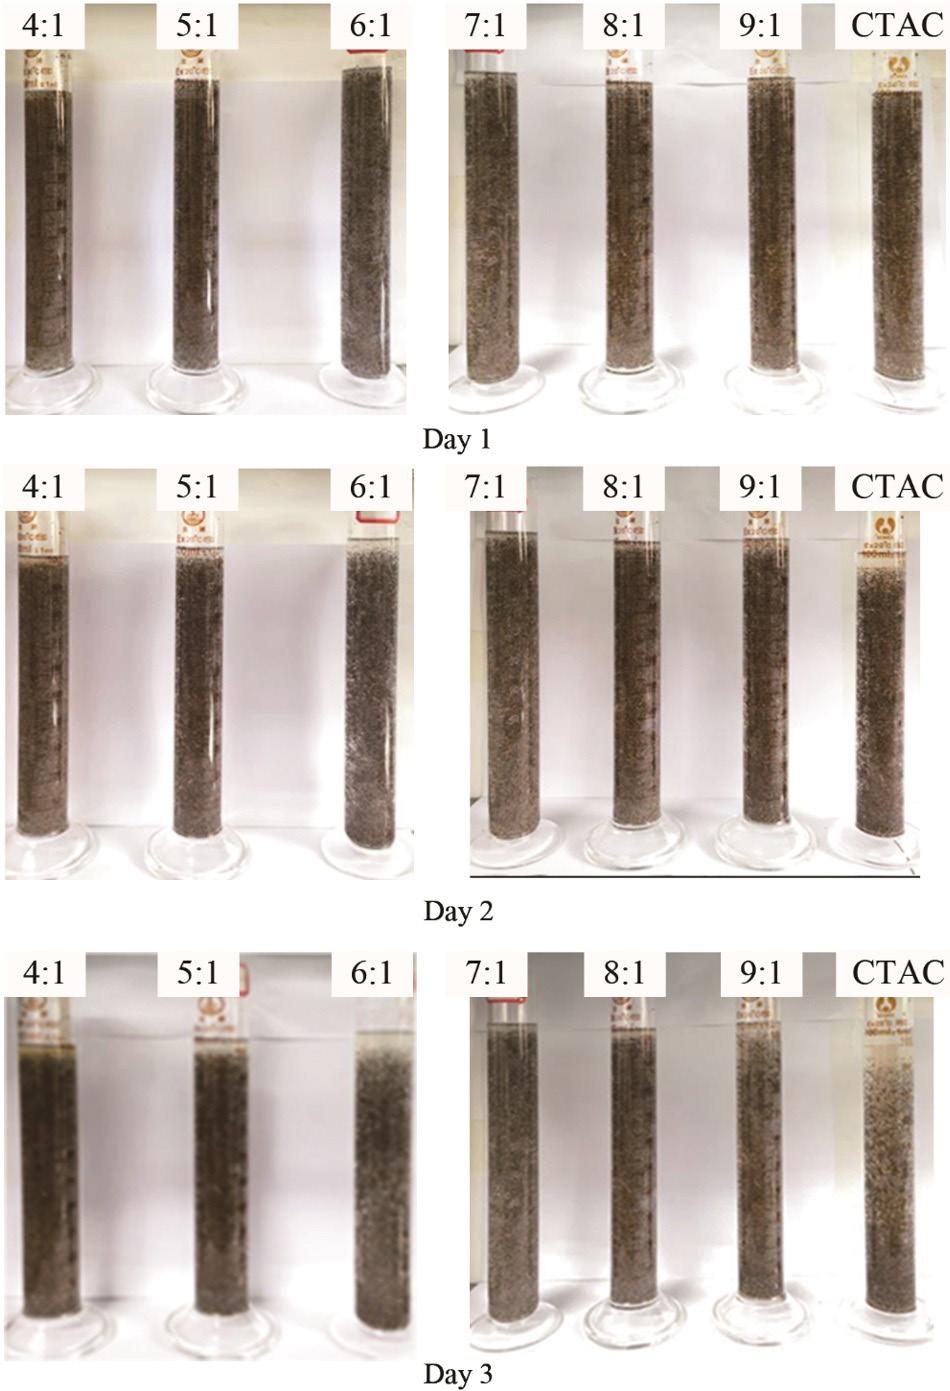
in the presence of CTAC during the measurement. Herein, the fracturing fluid containing CTAC and SA (with a CTAC/ SA ratio of 4:1) gives superior gel-breaking properties over the other fracturing fluids.
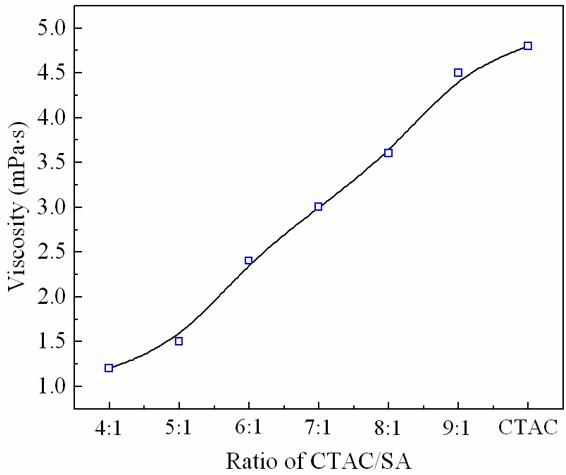
According to the conclusions obtained above, the fracturing fluid with the CTAC/SA ratio of 4:1 exhibits the best thermal resistance, proppant suspension performance and gel-breaking property. Therefore, the optimal ratio of CTAC/SA in the surfactant fracturing fluid is 4:1. In the next section, the selection of polymers will be conducted based on this optimized CTAC/SA fracturing fluid.
3.4 Impacts of polymer on the thermal stability of surfactant-based fracturing fluid
In this section, 0.3 wt% polymer is introduced into the clean fracturing fluid containing 1.6 wt% CTAC and 0.4 wt% SA to see if there is synergy between the polymer and surfactant. After the preparation of each fracturing fluid containing 0.3 wt% polymer and 1.6 wt% CTAC and 0.4 wt% SA, the effects of temperature on the viscosity of each fracturing fluid is evaluated and presented in Figure 6 As can be seen from Figure 6, in the whole temperature range of 40-80 °C, the fracturing fluid containing 0.3 wt%
CMHEC, 1.6 wt% CTAC and 0. 4 wt% SA exhibits higher thermal resistance than the fracturing fluid with 1.6 wt% CTAC and 0.4 wt% SA, indicating that there is synergy
Polímeros, 33(2), e20230015, 2023 5/10
Figure 4. The proppant suspension performance of the clean fracturing fluids at room temperature.
Figure 5. The viscosities of the broken fracturing fluids with various CTAC/SA ratios at 80 °C.
Dong, S., Tian, W., Qiang, W., Jiao, L., Zhang, J., & Chen, G.
between CMHEC and CTAC in enhancing the thermal stability of the fracturing fluid. As can be seen in Figure 7, an increase in the fraction of polymer (up to 0.5 wt%) would result in an increase in the viscosity of the fracturing fluid with 1.6 wt% CTAC and 0.4 wt% SA.
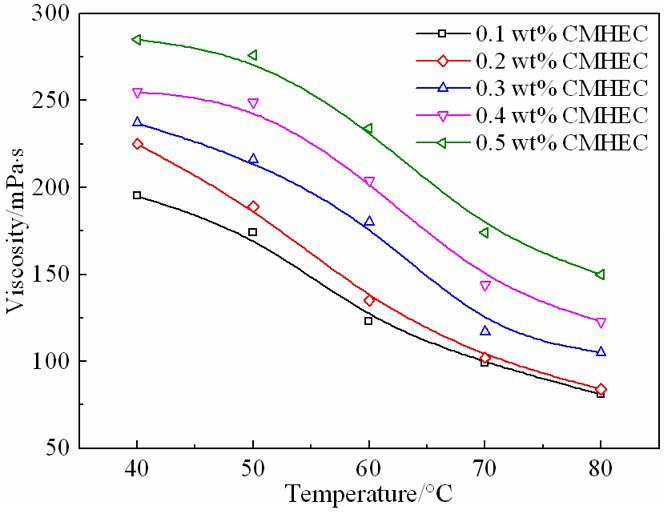
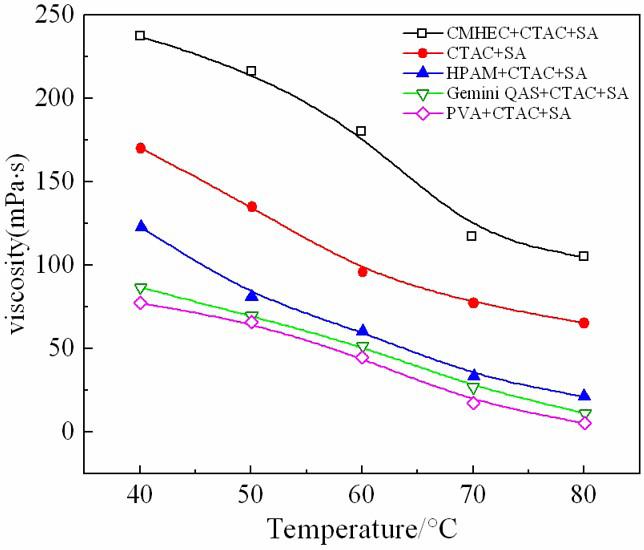
The possible interaction of cationic surfactants and CMHEC is shown in Figure 8. The cationic surfactants can absorb on the polymer and CMHEC molecules through
hydrogen bonds. Besides, each surfactant micellar can entangle with micelles to form three-dimensional network, the polymer chains can also integrate into the networks. The entanglements between surfactant micelles and polymers can further increase the stability of networks, which can enhance the viscosity of the fracturing fluid.
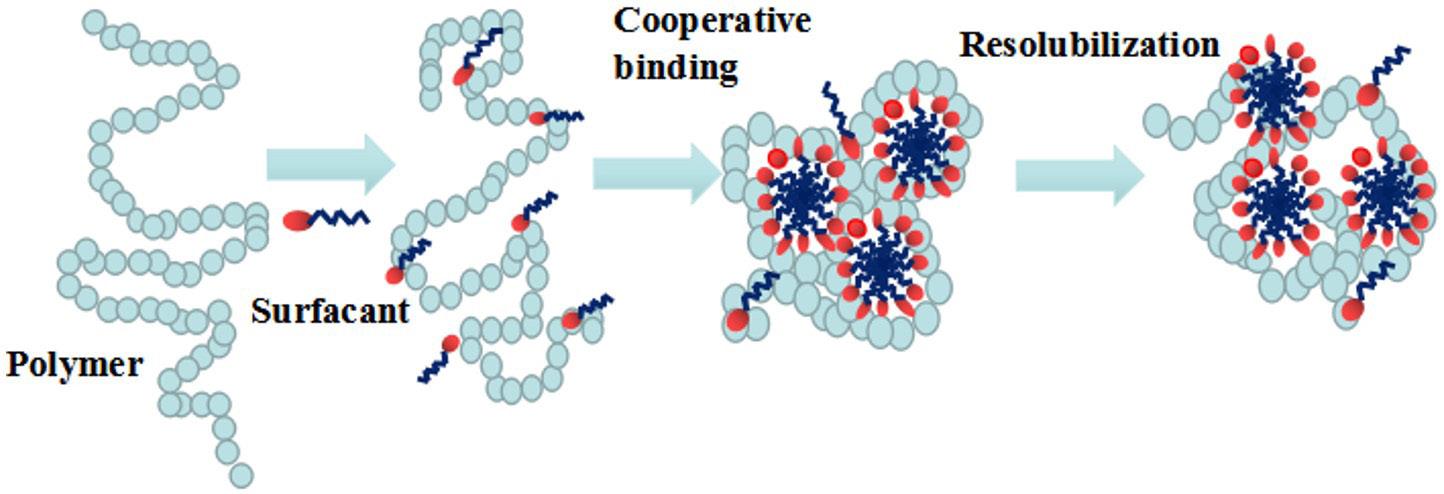
3.5 Proppant suspension performance of the S/P fracturing fluid
Based on the above evaluation method of proppant suspension performance, the settling velocity of proppant in S/P fracturing fluid system with 0.3 wt% CMHEC, 1.6 wt% CTAC and 0.4 wt% SA is tested at 80°C, and the test results are compared with the proppant suspension performance of the fracturing fluid with 1.6 wt% CTAC and 0.4 wt% SA. As shown in Figure 9, with the increases of proppants content (from 5 wt% to 40 wt%) in the surfactant fracturing fluid, the settling speed of the proppants increases from 1.95×10⁻⁴ m/s to 2.31×10⁻⁴ m/s. With the addition of 0.3 wt% CMHEC in the surfactant fracturing fluid, the settling speed of the proppants increases from 1.18×10⁻⁴ m/s to 1.66×10⁻⁴ m/s in the proppant content range of 5-40 wt%. These results indicate that the proppant suspension performance of the S/P fracturing fluid system is superior to that of the surfactant fracturing fluid, which may be due to the dense three-dimensional network structure formed by CMHEC chains and surfactant micelles, thereby increasing the viscosity of fracturing fluid.
3.6 Gel-breaking properties of the S/P fracturing fluid
In this section, a certain amount (v/v 1/80 based on the volume of the fracturing fluid) of crude oil is mixed with the S/P fracturing fluids (containing 0.3 wt% CMHEC, 1.6 wt% CTAC and 0.4 wt% SA) and then the mixtures were kept under static conditions at 80 °C. The viscosity of the mixtures is recorded every 30 minutes after the mixing. The gel-breaking properties of the surfactant fracturing fluid containing 1.6 wt% CTAC and 0.4 wt% SA are evaluated with the same method. As shown in Figure 10, because the S/P fracturing fluid has a low polymer concentration, there is less residue and easy gel-breaking. The viscosity of the S/P fracturing fluid before breaking is measured to be 105 mPa∙s, after being mixed with 0.125% crude oil and kept at 80 °C, the viscosity of the S/P fracturing fluid decreases quickly as the length of the breaking time increases. At 90 minutes after the addition of crude oil at 80 °C, the viscosity of the broken S/P fracturing fluid turns out to be 4.5 mPa∙s,
Polímeros, 33(2), e20230015, 2023 6/10
Figure 6. Effect of polymer on the viscosity of the surfactant-based fracturing fluid.
Figure 7. The effect of CMHEC content on the viscosity of the surfactant fracturing fluid.
Figure 8. The interaction of cationic surfactants and carboxymethyl hydroxyethyl cellulose.
Fabrication of fracturing fluid with cationic surfactants and carboxymethyl hydroxyethyl cellulose
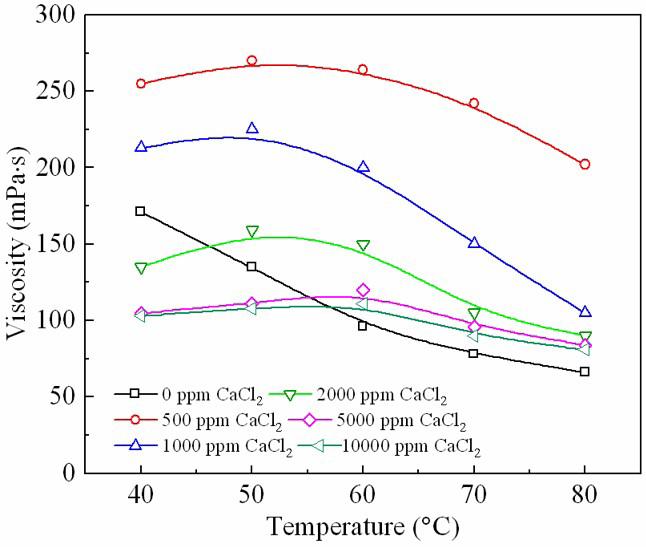
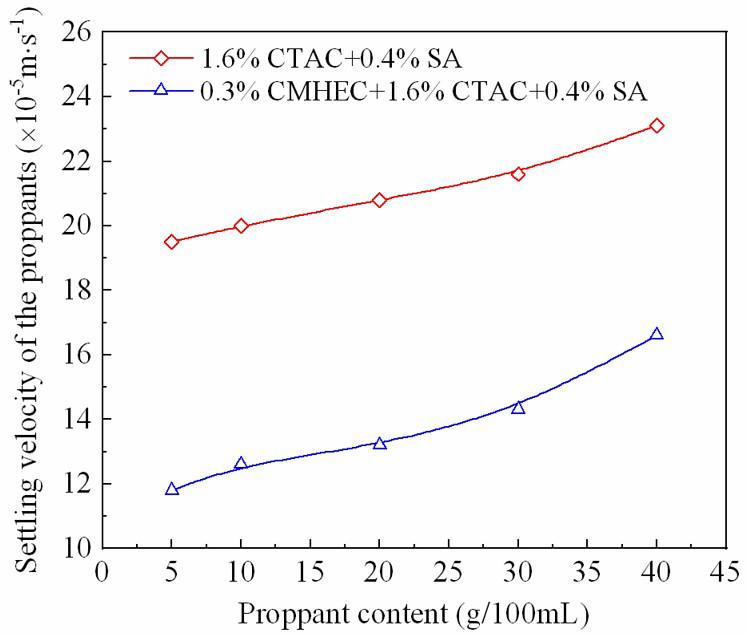
which indicates the low content of residuals (possibly from CMHEC) after breaking. Under the same conditions, the viscosity of the broken surfactant fracturing fluid can be decreased from 66 mPa∙s to 1.25 mPa∙s, which is lower than that of the broken S/P fracturing fluid. The low viscosity of the broken S/P fracturing fluid after breaking also indicates that the broken liquid could be easily cleared and brought back to the ground by the production liquids.
3.7 Evaluation of salinity resistance of the S/P fracturing fluid
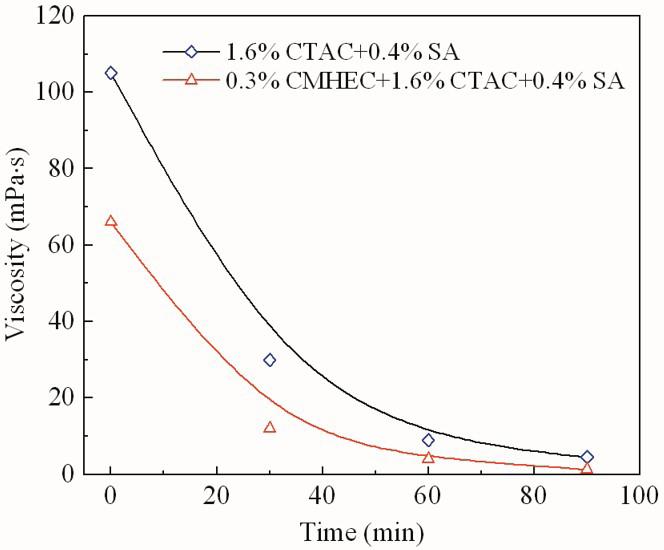
As shown in Figure 11, without CaCl2, the viscosity of the S/P fracturing fluid gradually decreases from 171 mPa∙s to 66 mPa∙s in the temperature range of 40 - 80 °C. It can also be found that a certain amount of CaCl2 could significantly affect the viscosity of the fracturing fluid. When 500 ppm CaCl2 is present in the fracturing fluid, the viscosity of the fracturing fluid can be increased up to 270 mPa∙s (at 50 °C). In the temperature range of 40 - 50 °C, the viscosity ramps from 255 mPa∙s to 270 mPa∙s. As the temperature further increases, the viscosity of the
fracturing fluid gradually decreases to 202 mPa∙s at 80 °C. With the presence of 1000 ppm CaCl2 in the fracturing fluid, the viscosity of the fracturing fluid is higher than that of the fracturing fluid without CaCl2 over the whole temperature range of 40 - 80 °C. However, it should be pointed out that, at 1000 ppm CaCl2, the viscosity of the fracturing fluid is lower than that of the fracturing fluid with 500 ppm CaCl2 in the temperature range of 40-80 °C. As the concentration of the CaCl2 further increases, the ability of CaCl2 in increasing the viscosity of the fracturing fluid decreases. At 1000 ppm, 2000 ppm, 5000 ppm and 10000 ppm CaCl2, the maximum viscosity of each fracturing fluid is measured to be 225 mPa∙s, 159 mPa∙s, 120 mPa∙s and 111 mPa∙s, respectively. It can be shown from Figure 10 that when CaCl2 is present in the fracturing fluid, the viscosity of the fracturing fluid increases and then decreases as the temperature ramps from 40 °C to 80 °C. Figure 10 implies the positive effect of CaCl2 on viscosifying the fracturing fluid, which may be attributed to the introduction of Cl- ions that could reduce repulsive forces between the quaternary ammonium groups of CTAC molecules, thereby increasing the formation and growth of the wormlike micelles as described in Section 3.1.
3.8 Shear resistance of the S/P fracturing fluid
Figure 12 presents the effect of shearing (with a shear rate of 170 s-1) on the viscosity of the S/P fracturing fluid as the temperature increases from 30 °C to 100 °C. As can be seen from Figure 12, at 30-50 °C, the viscosity of the S/P fracturing fluid system is relatively stable and remains above 200 mPa·s. However, as the temperature further increases, the viscosity of the S/P fracturing fluid begins to decreases. At 80 °C, the viscosity of the S/P fracturing fluid system remains higher than 100 mPa∙s, indicating that the S/P fracturing fluid system has excellent thermal and shear stability, which may be due to the entanglement between polymer CMHEC chains and the CTAC wormlike micelles as described in Figure 8. The hydrogen bonds between CMHEC and CTAC may also contribute to the temperature and shear resistance of the compounded fracturing fluid system.
Polímeros, 33(2), e20230015, 2023 7/10
Figure 9. Effect of CMHEC on the settling velocity of proppants.
Figure 10. Viscosity of the broken S/P fracturing fluid at 80 °C.
Figure 11. Effect of Ca2+ on the viscosity of the S/P fracturing system.
Dong, S., Tian, W., Qiang, W., Jiao, L., Zhang, J., & Chen, G.
Research Program Funded by Shaanxi Provincial Education Department (Program No. 21JP094) and Natural Science Basic Research Program of Shaanxi (2020JQ-775). And we thank the work of the Modern Analysis and Testing Center of Xi`an Shiyou University.
7. References
1 Wang, J., Feng, L., Steve, M., Tang, X., Gail, T. E., & Mikael, H. (2015). China’s unconventional oil: A review of its resources and outlook for long-term production. Energy, 82, 31-42. http:// dx.doi.org/10.1016/j.energy.2014.12.042
2 Das, A., Chauhan, G., Verma, A., Kalita, P., & Ojha, K. (2018). Rheological and breaking studies of a novel single-phase surfactant-polymeric gel system for hydraulic fracturing application. Journal of Petroleum Science Engineering, 167, 559-567 http://dx.doi.org/10.1016/j.petrol.2018.04.033
4. Conclusions
In this study, a small molecule surfactant gel of CTAC and SA was formed for the potential application in the hydraulic fracturing fluid. Based on the viscosity, proppant suspension and gel breaking properties of the surfactantbased fracturing fluid, the optimized ratio of CTAC/SA is found to be 4:1. The fracturing fluid containing 1.6 wt% CTAC, 0.4 wt% SA and 0.3 wt% CMHEC gives better viscosifying and proppant suspension properties than that of the fracturing fluid containing1.6 wt% CTAC, 0.4 wt% SA. The fracturing fluid containing 1.6 wt% CTAC, 0.4 wt% SA and 0.3 wt% CMHEC also exhibits excellent gel-breaking, Ca2+ resistance and shear stability. This work will benefit the related research in hydraulic fracturing fluid preparation and crude oil production.
5. Author’s Contribution
• Conceptualization – NA.
• Data curation – Wen Tian; Long Jiao.
• Formal analysis – Sanbao Dong; Wen Tian; Long Jiao; Jie Zhang.
• Funding acquisition – Gang Chen.
• Investigation – Wen Tian; Wenting Qiang; Long Jiao; Jie Zhang.
• Methodology – Gang Chen.
• Project administration – Gang Chen.
• Resources – NA.
• Software – NA.
• Supervision – Wenting Qiang; Jie Zhang.
• Validation – Sanbao Dong.
• Visualization – NA.
• Writing – original draft – Sanbao Dong;
• Writing – review & editing – Jie Zhang; Gang Chen.
6. Acknowledgments
This work was financially supported by the grants from the Youth Innovation Team of Shaanxi University, Scientific
3 Barati, R., & Liang, J.-T. (2014). A review of fracturing fluid systems used for hydraulic fracturing of oil and gas wells. Journal of Applied Polymer Science, 131(16), 40735 http:// dx.doi.org/10.1002/app.40735
4. Zhang, Y., Mao, J., Zhao, J., Yang, X., Zhang, Z., Yang, B., Zhang, W., & Zhang, H. (2018). Preparation of a novel ultrahigh temperature low-damage fracturing fluid system using dynamic crosslinking strategy. Chemical Engineering Journal, 354, 913-921 http://dx.doi.org/10.1016/j.cej.2018.08.021
5 Pu, W., Du, D.-J., & Liu, R. (2018). Preparation and evaluation of supramolecular fracturing fluid of hydrophobically associative polymer and viscoelastic surfactant. Journal of Petroleum Science Engineering, 167, 568-576 http://dx.doi.org/10.1016/j. petrol.2018.04.032.
6 Zhang, W., Mao, J., Yang, X., Zhang, H., Zhao, J., Tian, J., Lin, C., & Mao, J. (2019). Development of a sulfonic gemini zwitterionic viscoelastic surfactant with high salt tolerance for seawater-based clean fracturing fluid. Chemical Engineering Science, 207, 688-701 http://dx.doi.org/10.1016/j.ces.2019.06.061
7 An, M., Huang, H., Zhang, F., & Elsworth, D. (2020). Effect of slick-water fracturing fluid on the frictional properties of shale reservoir rock gouges. Geomechanics and Geophysics for Geo-Energy and Geo-Resources, 6(1), 28 http://dx.doi. org/10.1007/s40948-020-00153-1
8. Yang, W., Guan, B., Liang, L., Liu, X. W., & Liu, Y. (2018). Development and application of high salinity water-based fracturing fluid stabilizer. Oilfield Chemistry, 35(4), 622-626
9 Wang, Y., Zhang, C., Xu, N., Lan, J., Jiang, B., & Meng, L. (2021). Synthesis and properties of organoboron functionalized nanocellulose for crosslinking low polymer fracturing fluid system. RSC Advances, 11(22), 13466-13474 http://dx.doi. org/10.1039/D0RA10105B PMid:35423881.
10 Zhao, M., Li, Y., Xu, Z., Wang, K., Gao, M., Lv, W., & Dai, C. (2020). Dynamic cross-linking mechanism of acid gel fracturing fluid. Colloids and Surfaces. A, Physicochemical and Engineering Aspects, 607, 125471 http://dx.doi.org/10.1016/j. colsurfa.2020.125471
11 Huang, Q., Liu, S., Wang, G., Wu, B., Yang, Y., & Liu, Y. (2019). Gas sorption and diffusion damages by guar-based fracturing fluid for CBM reservoirs. Fuel, 251, 30-44 http:// dx.doi.org/10.1016/j.fuel.2019.04.031
12 Zhang, Y., Mao, J., Xu, T., Zhang, Z., Yang, B., Mao, J., & Yang, X. (2019). Preparation of a novel fracturing fluid with good heat and shear resistance. RSC Advances, 9(3), 1199-1207 http://dx.doi.org/10.1039/C8RA09483G PMid:35518047.
13 Shao, Y., Mao, J., Yang, B., Zhao, J., & Yang, X. J. (2020). High performance hydrophobic associated polymer for fracturing fluids with low-dosage. Petroleum Chemistry, 60(2), 219-225 http://dx.doi.org/10.1134/S0965544120020115
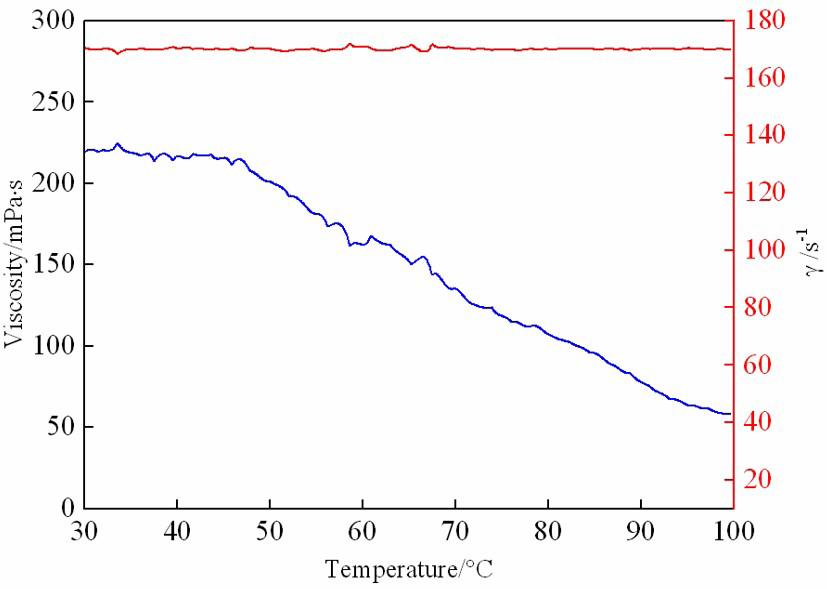
Polímeros, 33(2), e20230015, 2023 8/10
Figure 12. Viscosity and temperature performance of the composite fracturing fluid system after compounding.
Fabrication of fracturing fluid with cationic surfactants and carboxymethyl hydroxyethyl cellulose
14 Tran, T., Gonzalez Perdomo, M. E., Wilk, K., Kasza, P., & Amrouch, K. (2020). Performance evaluation of synthetic and natural polymers in nitrogen foam-based fracturing fluids in the cooper basin, South Australia. APPEA Journal, 60(1), 227-241 http://dx.doi.org/10.1071/AJ19062
15. Tang, J., Li, H., Yan, S., & Yan, S. (2020). In situ synthesis, structure, and properties of a dendritic branched nano-thickening agent for high temperature fracturing fluid. Journal of Applied Polymer Science, 137(10), 48446 http://dx.doi.org/10.1002/ app.48446.
16 Zhao, X., Guo, J., Peng, H., Pan, R., Aliu, A. O., Lu, Q. L., & Yang, J. (2017). Synthesis and evaluation of a novel clean hydraulic fracturing fluid based on star-dendritic polymer. Journal of Natural Gas Science and Engineering, 43, 179-189 http://dx.doi.org/10.1016/j.jngse.2017.03.015
17 Zhao, J., Yang, B., Mao, J., Zhang, Y., Yang, X., Zhang, Z., & Shao, Y. (2018). A novel hydrophobic associative polymer by RAFT-MADIX copolymerization for fracturing fluids with high thermal stability. Energy & Fuels, 32(3), 3039-3051 http://dx.doi.org/10.1021/acs.energyfuels.7b03635
18 Kang, W., Mushi, S. J., Yang, H., Wang, P., & Hou, X. (2020). Development of smart viscoelastic surfactants and its applications in fracturing fluid: A review. Journal of Petroleum Science Engineering, 190, 107107 http://dx.doi.org/10.1016/j. petrol.2020.107107
19 Yan, J., Li, Y., Xie, X., Slaný, M., Dong, S., Wu, Y., & Chen, G. (2023). Research of a novel fracturing-production fluid base on small molecule surfactant. Journal of Molecular Liquids, 369, 120858 http://dx.doi.org/10.1016/j.molliq.2022.120858
20 Zhang, W., Mao, J., Yang, X., Zhang, H., Zhang, Z., Yang, B., Zhang, Y., & Zhao, J. (2018). Study of a novel Gemini viscoelastic surfactant with high performance in clean fracturing fluid application. Polymers, 10(11), 1215 http:// dx.doi.org/10.3390/polym10111215 PMid:30961140.
21. Wu, Y., Zhang, J., Dong, S., Li, Y., Slaný, M., & Chen, G. (2022). Use of betaine-based gel and its potential application in enhanced oil recovery. Gels (Basel, Switzerland), 8(6), 351 http://dx.doi.org/10.3390/gels8060351 PMid:35735695.
22 Baruah, A., Shekhawat, D. S., Pathak, A. K., & Ojha, K. (2016). Experimental investigation of rheological properties in zwitterionic-anionic mixed-surfactant based fracturing fluids. Journal of Petroleum Science Engineering, 146, 340349 http://dx.doi.org/10.1016/j.petrol.2016.05.001
23 Baruah, A., Pathak, A. K., & Ojha, K. (2016). Study on rheology and thermal stability of mixed (nonionic-anionic) surfactant based fracturing fluids. AIChE Journal. American Institute of Chemical Engineers, 62(6), 2177-2187 http:// dx.doi.org/10.1002/aic.15175
24 Baruah, A., Pathak, A. K., & Ojha, K. (2015). Phase behavior and thermodynamic properties of lamellar liquid crystal developed for viscoelastic surfactant based fracturing fluid. Chemical Engineering Science, 131, 146-154 http://dx.doi. org/10.1016/j.ces.2015.03.067
25 Lv, Q., Li, Z., Li, B., Li, S., & Sun, Q. (2015). Study of nanoparticle-surfactant-stabilized foam as a fracturing fluid. Industrial & Engineering Chemistry Research, 54(38), 94689477. http://dx.doi.org/10.1021/acs.iecr.5b02197.
26 Li, C., Huang, Y., Sun, X., Gao, R., Zeng, F., Tontiwachwuthikul, P., & Liang, Z. (2017). Rheological properties study of foam fracturing fluid using CO2 and surfactant. Chemical Engineering Science, 170, 720-730 http://dx.doi.org/10.1016/j.ces.2017.03.022
27 Yekeen, N., Padmanabhan, E., & Idris, A. K. (2018). A review of recent advances in foam-based fracturing fluid application in unconventional reservoirs. Journal of Industrial and Engineering Chemistry, 66, 45-71 http://dx.doi.org/10.1016/j. jiec.2018.05.039
28 Ahmed, S., Elraies, K. A., Hashmet, M. R., & Hanamertani, A. S. (2017). Viscosity models for polymer free CO2 foam fracturing fluid with the effect of surfactant concentration, salinity and shear rate. Energies, 10(12), 1970 http://dx.doi. org/10.3390/en10121970
29 Jing, Z., Feng, C., Wang, S., & Xu, D. (2019). Effects of temperature and pressure on rheology and heat transfer among bubbles in waterless CO2-based foam fracturing fluid. Journal of Natural Gas Science and Engineering, 63, 18-26 http:// dx.doi.org/10.1016/j.jngse.2019.01.005
30. Verma, A., Chauhan, G., & Ojha, K. (2018). Characterization of α-olefin sulfonate foam in presence of cosurfactants: stability, foamability and drainage kinetic study. Journal of Molecular Liquids, 264, 458-469 http://dx.doi.org/10.1016/j. molliq.2018.05.061
31 Verma, A., Chauhan, G., Ojha, K., & Padmanabhan, E. (2019). Characterization of nano-Fe2O3-stabilized polymer-free foam fracturing fluids for unconventional gas reservoirs. Energy & Fuels, 33(11), 10570-10582 http://dx.doi.org/10.1021/acs. energyfuels.9b02195
32 Chen, G., Yan, J., Liu, Q., Zhang, J., Li, H., Li, J., Qu, C., & Zhang, Y. (2019). Preparation and surface activity study of amino acid surfactants. Comptes Rendus. Chimie, 22(4), 277-282 http://dx.doi.org/10.1016/j.crci.2018.11.009
33 Chen, F., Wu, Y., Wang, M., & Zha, R. (2015). Self-assembly networks of wormlike micelles and hydrophobically modified polyacrylamide with high performance in fracturing fluid application. Colloid & Polymer Science, 293(3), 687-697 http://dx.doi.org/10.1007/s00396-014-3454-y
34. Zhang, Y., Dai, C., Qian, Y., Fan, X., Jiang, J., Wu, Y., Wu, X., Huang, Y., & Zhao, M. (2018). Rheological properties and formation dynamic filtration damage evaluation of a novel nanoparticle-enhanced VES fracturing system constructed with wormlike micelles. Colloids and Surfaces. A, Physicochemical and Engineering Aspects, 553, 244-252 http://dx.doi.org/10.1016/j. colsurfa.2018.05.065
35 Qiu, L., Shen, Y., & Wang, C. (2018). pH- and KCl-induced formation of worm-like micelle viscoelastic fluids based on a simple tertiary amine surfactant. Journal of Petroleum Science Engineering, 162, 158-165 http://dx.doi.org/10.1016/j. petrol.2017.12.037
36 Yang, C., Hu, Z., Song, Z., Bai, J., Zhang, Y., Luo, J., Du, Y., & Jiang, Q. (2017). Self-assembly properties of ultra-long-chain Gemini surfactant with high performance in a fracturing fluid application. Journal of Applied Polymer Science, 134(11), 44602 http://dx.doi.org/10.1002/app.44602
37 Lu, Y., Yang, F., Ge, Z., Wang, S., & Wang, Q. (2015). The influence of viscoelastic surfactant fracturing fluids on gas desorption in soft seams. Journal of Natural Gas Science and Engineering, 27(Part 3), 1649-1656 http://dx.doi.org/10.1016/j. jngse.2015.10.031
38. Yang, M., Lu, Y., Ge, Z., Zhou, Z., Chai, C., & Zhang, L. (2020). Optimal selection of viscoelastic surfactant fracturing fluids based on influence on coal seam pores. Advanced Powder Technology, 31(6), 2179-2190. http://dx.doi.org/10.1016/j. apt.2020.03.005
39 Dai, C., Wu, X., Li, W., You, Q., Zhao, M., Du, M., Liu, Y., & Li, Y. (2015). The role of hydroxyethyl groups in the construction of wormlike micelles in the system of quaternary ammonium surfactant and sodium salicylate. Soft Matter, 11(39), 7817-7826 http://dx.doi.org/10.1039/C5SM01698C PMid:26314927.
40 Nettesheim, F., Liberatore, M. W., Hodgdon, T. K., Wagner, N. J., Kaler, E. W., & Vethamuthu, M. (2008). Influence of nanoparticle addition on the properties of wormlike micellar
Polímeros, 33(2), e20230015, 2023 9/10
Dong, S., Tian, W., Qiang, W., Jiao, L., Zhang, J., & Chen, G.
solutions. Langmuir , 24 (15 ), 7718-7726 http://dx.doi. org/10.1021/la800271m PMid:18620438.
41 Gao, Z., Dai, C., Sun, X., Huang, Y., Gao, M., & Zhao, M. W. (2019). Investigation of cellulose nanofiber enhanced viscoelastic fracturing fluid system: increasing viscoelasticity and reducing filtration. Colloids and Surfaces. A, Physicochemical and Engineering Aspects, 582, 123938 http://dx.doi.org/10.1016/j. colsurfa.2019.123938
42 Huang, F., Pu, C., Gu, X., Ye, Z., Khan, N., An, J., Wu, F., & Liu, J. (2021). Study of a low-damage efficient-imbibition fracturing fluid without flowback used for low-pressure tight reservoirs. Energy, 222, 119941 http://dx.doi.org/10.1016/j. energy.2021.119941
43 Wu, H., Zhou, Q., Xu, D., Sun, R., Zhang, P., Bai, B., & Kang, W. (2018). SiO2 nanoparticle-assisted low-concentration viscoelastic cationic surfactant fracturing fluid. Journal of Molecular Liquids, 266, 864-869. http://dx.doi.org/10.1016/j. molliq.2018.06.107
44 Huang, T., & Crews, J. B. (2008). Nanotechnology applications in viscoelastic-surfactant stimulation fluids. SPE Production & Operations, 23(4), 512-517 http://dx.doi.org/10.2118/107728PA
45 Walker, F., Isabettini, S., Kuster, S., Fischer, P., & Lutz-Bueno, V. (2019). Molecular interactions and the viscoelasticity of micellar aggregates. Physics of Fluids, 31(8), 083101 http:// dx.doi.org/10.1063/1.5102110
46 Dai, C., Zhang, Y., Gao, M., Li, Y., Lv, W., Wang, X., Wu, Y., & Zhao, M. (2017). The study of a novel nanoparticle-enhanced wormlike micellar system. Nanoscale Research Letters, 12(1), 431 http://dx.doi.org/10.1186/s11671-017-2198-2
PMid:28673050.
47 Li, G., Fang, B., Lu, Y., Li, K., Ma, M., Qiu, X., Wang, L., Liu, Y., Yang, M., & Huang, C. (2016). Intrinsic crosslingking and
gel-breaking rheo-kinetics of CMHEC/CTAB systems. Journal of Dispersion Science and Technology, 37(11), 1638-1644 http://dx.doi.org/10.1080/01932691.2015.1120220
48 Aliu, A. O., Guo, J., Wang, S., & Zhao, X. ¨. (2016). Hydraulic fracturing fluid for gas reservoirs in petroleum engineering applications using sodium carboxy methyl cellulose as gelling agent. Journal of Natural Gas Science and Engineering, 32, 491-500 http://dx.doi.org/10.1016/j.jngse.2016.03.064
49 Sun, R., Fang, B., Lu, Y., Qiu, X., Du, W., Han, X., Zhou, Q., & Qiu, Y. (2018). Rheological properties of hexadecyl dimethyl amine modified carboxymethyl hydroxyethyl cellulose solutions and its gelling process. Journal of Dispersion Science and Technology, 39(1), 138-142. http://dx.doi.org/10.1080/0193 2691.2017.1300911
50 Li, G., Fang, B., Lu, Y., Li, K., Ma, M., Yang, M., Qiu, X., Wang, L., & Liu, Y. (2016). Rheological properties and crosslinking rheo-kinetics of CMHEC/CTAB synergists systems. Journal of Dispersion Science and Technology, 37(12), 1826-1831 http://dx.doi.org/10.1080/01932691.2016.1142450
51 Liu, Q., Gao, M., Zhao, Y., Li, J., Qu, C., Zhang, J., & Chen, G. (2020). Synthesis and interface activity of a new quaternary ammonium surfactant as an oil/gas field chemical. Tenside, Surfactants, Detergents, 57(1), 90-96 http://dx.doi. org/10.3139/113.110665
52 Liu, Q., Gao, M., Zhang, J., Zhang, R., Li, J., Chen, S., & Chen, G. (2020). Synthesis and interface activity of cetyltrimethylammonium benzoate. Russian Journal of Physical Chemistry B, 14(1), 73-80 http://dx.doi.org/10.1134/ S1990793120010066.
Received: Mar. 05, 2021
Revised: July 25, 2021
Accepted: May 26, 2023
Polímeros, 33(2), e20230015, 2023 10/10
In-line rheo-optical characterization of PET hydrolysis and chain extension during extrusion
Luciana Assumpção Bicalho1 and Sebastião Vicente Canevarolo Junior2*
1Programa de Pós-graduação em Ciência e Engenharia de Materiais – PPG-CEM, Universidade Federal de São Carlos – UFSCar, São Carlos, SP, Brasil
2Departamento de Engenharia de Materiais – DEMa, Universidade Federal de São Carlos – UFSCar, São Carlos, SP, Brasil
*e-mail: caneva@ufscar.br
Obstract
The thermo-mechanical degradation of PET during extrusion was studied in the transient state. Active agents, water, causing hydrolysis by chain scission and pyromellitic dianhydride PMDA, causing chain extension, were added to the extrusion flow as pulses. They change the PET molecular weight, affecting its the melt flow elasticity, which was followed in-line by a rheo-optical detector set in an instrumented slit-die, measuring synchronously, pressure drop and flow birefringence ( 12 ∆ ). The effect of the extrusion shearing level, set by 90º kneading blocks with different lengths, was also quantified. The results, as of residence time distribution curves, show the degree of thermo-mechanical degradation as hydrolysis and chain extension for each pulse type and concentration. Thus, assuming collinearity and full birefringence orientation along the melt flow the first normal stress difference 1N can be monitored in-line.
Keywords: chain extension, hydrolysis, in-line rheo-optical characterization, polyethylene terephthalate, twin-screw extruder.
How to cite: Bicalho, L. A., & Canevarolo Junior, S. V. (2023). In-line rheo-optical characterization of PET hydrolysis and chain extension during extrusion. Polímeros: Ciência e Tecnologia, 33(2), e20230016. https://doi.org/10.1590/01041428.20220066
1. Introduction
PET during the extrusion process may undergo hydrolytic thermo-mechanical degradation (TMD), decreasing its molecular weight and, consequently, its melt viscosity and mechanical properties. To avoid hydrolysis reaction, the moisture content in PET should be lower than 0.02% w/w before processing takes place[1,2]. When PET hydrolytic degradation occurs, it induces chain scission reactions at ester linkages. Each water molecule breaks down one ester bond, creating a carboxyl and a hydroxyl chain end group, reducing the PET molecular weight[3,4]. Several test methods were proposed to quantify PET hydrolysis[5,6]. Pirzadeh et al.[5] showed that hydrolysis occurs by both moisture and heat rather than an individual effect. Degradation at temperatures lower than its Tg was less prominent but increased above it. Crystallinity degree plays a crucial role in preventing hydrolytic degradation extent. Hosseini et al.[6] exposed fiber PET chips to water at 85°C for different periods, during the first 5 days, degradation co-occurred with the penetration of water molecules. After saturation, degradation continues sustained by water molecules still present in the PET.
The use of chain extenders can partially compensate hydrolytic degradation. In this process, a di- or poly-functional low-molecular weight material is added to react with PET chain end groups, rejoining the broken chains resulting from the PET chain scission during the melting process.
Pyromellitic dianhydride PMDA has been reported as an efficient chain extender[1,7,8]. Being poly-functional, it can react with up to four PET end chains, tying them together. Awaja et al.[7] reported that PMDA was an effective chain extender for industrial-scale recycled PET, depending on its concentration. Incarnato et al.[8] used PMDA to increase the industrial PET molecular weight. By using higher concentrations, from 0.50 to 0.75%, PMDA promotes extensive chain extension reactions, making them suitable for film blowing and blow molding processes.
Obtaining real-time quantitative data on hydrolysis and chain extension would simplify quality control by providing fast quantification of the effects of processing conditions, screw geometry, and material formulations[9,10] Also, rheo-optical techniques have fast response times and do not disturb the analyzed environment.
Birefringence is an attractive optical property, which is present when the polymer shows optical anisotropy, creating difference between two orthogonal refractive indexes. Different types of birefringence may coexist in polymer parts: intrinsic, stress/strain, form, and flow. The flow birefringence, in the way is optically measured here, directly relates the birefringence across the flow ( 13n∆ ) and the third normal stress difference ( 31133 N =−σσ ) developed during the polymer extrusion. It follows the Stress-Optical Rule,
https://doi.org/10.1590/0104-1428.20220066 O O O O O O O O O O O O O O O Polímeros, 33(2), e20230016, 2023 ISSN 1678-5169 (Online) 1/11
SOR, in which C is the stress-optical coefficient, dependent of the chemical structure of the polymer and temperature[11] ( ) 13113331133 nnnCNC ∆=−==−σσ (1)
In turn the first normal stress difference ( 1N ), which indicates the material’s elasticity related to shear stress, can be written as:
intrinsic viscosity IV and thermal analysis DSC were applied to characterize the PETd.
2.3 Preparation and types of pulse compositions
being χ the orientation angle, the angle between the principal directions of the stress tensor and the principal directions of the refractive index tensor, the same as the extinction angle (θ) for the flow birefringence measurements. However, it’s difficult to check the validity as there is no direct way of determining σ11-σ22. Work in this respect was carried out in the case of 1-2 plane, polymer solutions and, for slit die[12] Nevertheless, it has been seen that for polymer melts, the 13NN ≅ [12], making 22233 0 N σσ =−≅ .
This work presents an experimental setup and a method to monitor the third normal stress difference 3 N by quantifying in-line the flow birefringence in the gradient 2-direction (1-3 plane), during melt extrusion. By assuming that the flow birefringence produced is fully oriented and colinear along with the extrusion melt flow one can say that 3 N is equal to the first normal stress difference 1N Thus, via the SOR, the first normal stress difference 1N can be assessed in real time during melt extrusion. This rheo-optical approach was applied to study the hydrolysis and chain extension reactions during reactive processing of PET, and knowing that the stress optical coefficient C is independent of molecular weight[12], one can follow the effects in the first normal stress difference due to changes in the polymer molecular weight.
2. Materials and Methods
2.1
Materials
Polyethylene terephthalate copolymer grade, Cleartuf® Turbo™, with no stabilizers nor additives, donated by M&G Chemicals (Poços de Caldas, MG, Brazil). Pyromellitic dianhydride PMDA, was purchased from Sigma-Aldrich with 97% w/w purity.
2.2 Preparation of water-saturated PET (PETw) and dried PET (PETd)
Pulses made of PETw pellets were used to add a known controlled water amount into the extruder and quantitatively perform the in-line PET hydrolysis measurements: virgin pellets (PETv) were water-saturated in hot water at 90°C; the pellets were air blown at room temperature to remove the externally adsorbed moisture and stored in a bag; the absorbed moisture content of the water-soaked samples was evaluated by gravimetry and DSC. PETd was dried in a Thermolift 100-2 ARBURG dryer (Lossburg, German), with the dry hot air module operating with silica gel at 150ºC. Tests were conducted to set drying time by packing samples in a wire grid and evaluated by gravimetry. In addition,
All in-line measurements were done in the extruder in transient form. A pulse is fed in a steady-state PETd flow: an inert (PETd) and two active pulses (PETw and PMDA) were used to monitor the in-line PET reactions (hydrolysis, chain extension, and both reactions simultaneously). Pulses of 6g and 10g were used in all screw profiles: one of PETd for baseline; second of PETw for in-line hydrolysis monitoring; third of PMDA for chain extension studies; fourth of PETw + PMDA for simultaneous reactions. PMDA was carried in PETd film capsules, with the film prepared by hot-pressing (in a Luxor LPB-35-15 press, LUXOR, São Paulo, Brazil) at 260°C, cut, and folded into 36mm2 squares envelopes of 0.0010g ± 0.0005g, which were filled with two amounts of PMDA powder (0.050g and 0.030g ± 0.001g) and hot sealed. Four pulses were set, with the number of capsules constant: 0.25g of PMDA (i.e., 5 capsules of 0.050g); 0.25g of PMDA + 10g of PETd; 0.15g of PMDA + 10g of PETd (5 capsules of 0.03g); and 10g of PETw + 0.25g or 0.15g of PMDA.
The pulses were introduced in the extruder feeding hopper by a tubular device, having a scaffold where pulse material is kept (Figure 1a). By sliding sideways the scaffold, the pulse falls into the extruder while the in-line data collection starts to run synchronously. The PETd flowing carries the pulse material downstream, melts, mixture, reactions may occur, and finally, the melt reaches the slit-die at the extruder exit for the in-line optical measurement.
2.4 Twin-screw extruder experimental set-up
The experiments were performed in a co-rotating intermeshing twin-screw extruder Werner & Pfleiderer (W&P) ZSK-30 (30.70mm screw diameter and L/D = 35) with a K-Tron gravimetric feeder. A unique design slit-die has been fitted at the end of the W&P (Figure 1a). It is modular, with two halves separated by two spacers forming a 1.5mm thickness and 15mm width slit. Along its length, it has three pressure transducers and temperature controls. The optical portion has two pairs of borosilicate glass transparent windows (Ø 10 mm; 1 mm thickness) on each side of the slit-die, where an in-line optical detector is docked.
The optical detector has a polarizer filter fixed at 45° relative to the polymer flow direction, polarizing the white light emitted by a LED (λ≈550 mm). The polarized light travels through the melt flowing, reaches another polarizer (set crossed to the first one), and then the photodetector (LDR). LDR quantifies the cross-polarized transmitted light intensity, which is converted in optical path difference (OPD) and finally in birefringence. The LDR and LED are independently adjustable, given a broad range of light intensities that are needed. An analogic-digital interface (USB data acquisition NI-DAQ 6812) collects and converts signals from the LDR into digital signals and transmits them to a PC running software developed in LabView 8.6 NI (National Instruments). It averages data, makes real-time calculations, displays information, and saves data (slit-die temperature, residence time, c N I , pressure drop, screw rotation speed and torque). The rheo-optical system was validated by ILT
Bicalho, L. A., & Canevarolo Junior, S. V. Polímeros, 33(2), e20230016, 2023 2/11
( ) 12 1 1122 cos2cos2 CC nN σσ χχ ∆==− (2)
1400 Radiometer/Photometer from Standard International Light Technologies, comparing the response of the two LDRs to a set of fixed luminous intensities emitted by the LED. More information on this slit-die and in-line setup can be found in previous publications[12-14]
Three screw profiles were assembled to evaluate the effect of 90º kneading blocks (KB90) with two different thicknesses. Figure 1b shows them: i) Profile 1, apart from the conveying elements, contains a set of four kneading disc blocks with 90° and 14mm thickness each (KB90-14mm), ii) Profile 2 contains two kneading disc blocks with 90° and 28mm thickness (KB90-28mm). Profile 1 has narrow kneading disks compared to profile 2, which provided a greater mixing capacity with a high level of distributive mixing. iii) Profile 3 is made only of conveying elements, acting as the reference screw profile.
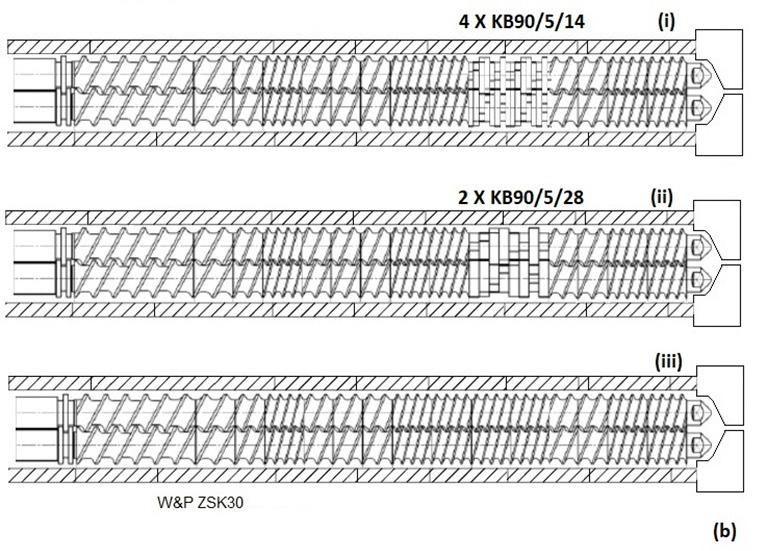
2.5 In-line flow birefringence measured by the rheooptical detector
During the extrusion in steady state, the melt flow orients in the flow stream, making it possible to measure the total birefringence, which in this study was assumed to
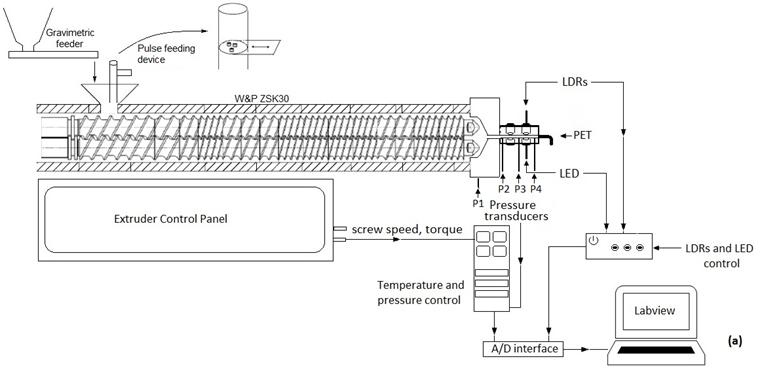
be only due to flow birefringence once the PET sample is the same for all experiments, the measurement is done in the melting state, and there is no second phase present. The inline monitoring evaluates the optical changes in the melt flow, which is oriented at θ = 45° in relation to the pair of crossed polarizers, causing hydrolysis and chain extension, which in turn changes the PET molecular weight. The crosspolarized transmitted light intensity is normalized ( c N I ) as a dimensionless value varying between zero and one as[12,13]:
being I the cross-polarized transmitted light intensity measured during the melt flow experiments, c I this intensity when the measurement is taken with the pair of polarizing filters set crossed and p I when the pair is set parallel. Setting the melt flowing at θ = 45° (i.e. the extinction angle) in relation to the pair of crossed polarizers, the Malu’s Law reduces to [14]:
In-line
Polímeros, 33(2), e20230016, 2023 3/11
rheo-optical characterization of PET hydrolysis and chain extension during extrusion
c c N pc II I II = (3)
222 0sen2sensen22 c N II=θ=δδ (4)
Figure 1. Extruder experimental setup. (a) Slit-die and in-line optical detector system fitted to the extruder, equipped with gravimetric feeders and the tubular scaffold; (b) The three screw profiles used: (i) four KB90-14mm; (ii) two KB90-28mm; (iii) only with conveying elements.
Then the normalized intensity c N I can be related directly to the optical path difference OPD, and knowing the sample thickness (the slit-die thickness 1500 tnm = ), and assuming the average wave length of white light of 550nm λ = one can get the birefringence
2.6 Off-line intrinsic viscosity (IV) measured by glass capillary viscometer
Diluted PET solution intrinsic viscosity, was taken following the ASTM D4603–03 (Standard Test Method for Determining Inherent Viscosity of Poly (Ethylene Terephthalate) (PET) by Glass Capillary Viscometer) procedure, using the Billmeyer equation[15]:
moisture absorption of 0.86 wt%. Figure 2a and b show these results.
DSC data show that the water absorbed present in PETw shifts both glass transition (Tg) and melting temperatures (Tm) to a lower value than PETd (Figure 3a). Water molecules set in the hydrogen bonds, formed among ester groups in the amorphous phase, reducing their bond energy. It eases the relative movement among adjacent molecules, acting as chain lubricant, thus reducing its Tg. At higher temperatures, the thermo-activated degradation process of hydrolysis takes over, creating chain scission, reducing chain length, and increasing chain mobility. The crystalline micelle size is reduced, and thus their Tm. This effect occurred due to scission in chain segments within crystalline/amorphous diffuse interface.
The PMDA DSC curve, Figure 3b, shows a narrow melting peak at 290 °C and another small melting peak at 240ºC, which may be due to impurities. Note that the heat flow full scale of the PMDA DSC curve is 5x greater than PETw and PETd DSC curves.
being rη the relative viscosity ( / tto), t average solution flow time, to average solvent flow time and C polymer solution concentration in g/dL. Knowing the IV, the polymer viscosity average molecular weight ( v M ) can be estimated using the Mark-Houwink-Sakurada equation[15]:
3.2 PET flow birefringence in-line characterization during steady-state extrusion
being [η] the IV, a and K constants which for PET in phenol/1,1,2,2-tetrachloroethane solution, 60/40 weight %, are a=0.68 and K=7.44x10⁻⁴dL/g[16]
2.7 PET thermal characterization by DSC
Thermal characterization was done in a Differential Scanning Calorimeter DSC (TA Instruments, Q2000) calibrated with indium standard (Tm=155.6°C, ∆H=6.8 cal/g, at 10°C min-1). Thermo-cycle protocol used was the heating rate at 10°C/min from room temperature to 320°C for PETw and PETd and to 370ºC for PMDA, with all samples weighing from 6 to 7mg.
3. Results and Discussions
3.1
PETv and PETd samples showed the same 0.7dl/g IV. The kinetics of the PET hydrolysis reaction is slow up to 180°C but increases fast at higher extrusion temperatures[3,17]
Thus, PET will undergo a quick and intense reaction with the absorbed water during extrusion, causing chain scission, which reduces its molecular weight and consequently drops its IV. PETv sample showed 0.35 wt% initial moisture content and was divided into two batches: one to be dried and the other to be water-saturated. Both methods were tested to get the best time for each process. The drying process at 150ºC needed 4h to remove 0.4 wt% of moisture, close to the value presented by PETv. The water saturation process took a soaking time of 72h at 90ºC to reach the equilibrium
PET processability was tested by running the extruder at four temperatures 245, 255, 265, and 275°C, maintaining a constant temperature profile along the barrel, feeding rate (3Kg/h), screw rotation speed (100 rpm), and screw profile 1 (KB90, 14mm). The average flow birefringence, as normalized cross-polarized transmitted light intensity, was measured in steady-state by the rheo-optical detector. Flow birefringence is highest at the lowest barrel temperature of 245°C ( n∆ = 0,033) decreasing as extrusion temperature increases (at 255ºC n∆ = 0,0293, at 265ºC n∆ = 0,0271, at 275ºC n∆ = 0,0277) implying a reduction in flow orientation, caused mainly by the reduction of their relaxation time. Other thermo-mechanical degradation processes may also reduce PET molecular weight but are not considered here.
3.3 PET flow birefringence in-line characterization during transient-state extrusion
Pulses containing a fixed amount of chain extender (e.g., 0.25g PMDA + 10g of PETd) were introduced into a steady-state flow of PETd using the same processing conditions described in the previous section. Figure 4a shows the RTD curves at 4 different extrusion temperatures, which run from ~100s up to ~400s. An RTD curve is obtained if the introduced pulse produces changes in the downstream melt flow, which can be detected by the in-line detector. Here, the PETd component of the pulse and the PMDA itself does not produce any detectable effect. Yet, the PMDA extrusion process with PET melt flow causes a chain extension reaction, increasing PET molecular weight and so the flow orientation, while passing by the slit-die. This change alters the PET melt flow birefringence, which is sensed by the in-line rheo-optical detector as normalized cross-polarized transmitted light intensity c N I . In Figure 4a, all curves were normalized by their baseline curves at each temperature. Direct comparison can only be made if the OPD induced by the oriented flow is lower than 275nm, i.e., still inside the first half of the first order in Michel
Bicalho, L. A., & Canevarolo Junior, S. V. Polímeros, 33(2), e20230016, 2023 4/11
n∆
222 1500 sen sensen 550 c N OPD nt nnm I nm πππ λλ ∆∆ = = = (5)
(
)
0.25(13ln) rr C ηη η −+ =
(6)
( ) a v KM η = (7)
Off-line characterization of PETv, PETd, PETw and PMDA
In-line rheo-optical characterization of PET hydrolysis and chain extension during extrusion
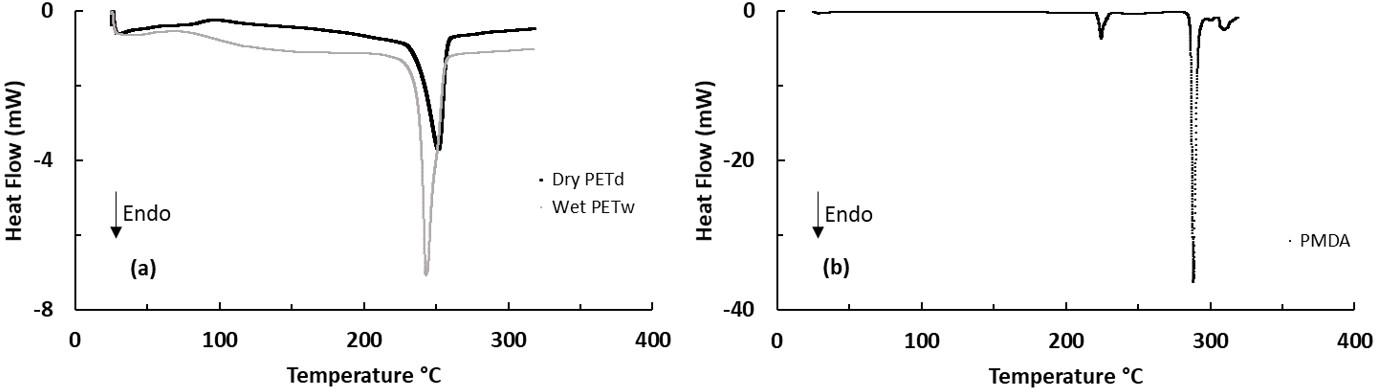
Levy’s chart. This optical condition can be experimentally set by properly adjusting the slit-die thickness – the reason why the die was designed having two halves, separated by a replaceable spacer, which sets the suitable slit thickness.
RTD curves can be visualized from 245°C to 275°C barrel temperatures, all below the PMDA melt temperature (290ºC from DSC), indicating that PMDA/PET chain extension reaction occurred, even at temperatures as low as 245ºC. One possible explanation is that PMDA melted in the screw kneading zone, due to PET chains Plastic Energy Dissipation[18], responsible for a melt PET flow temperature
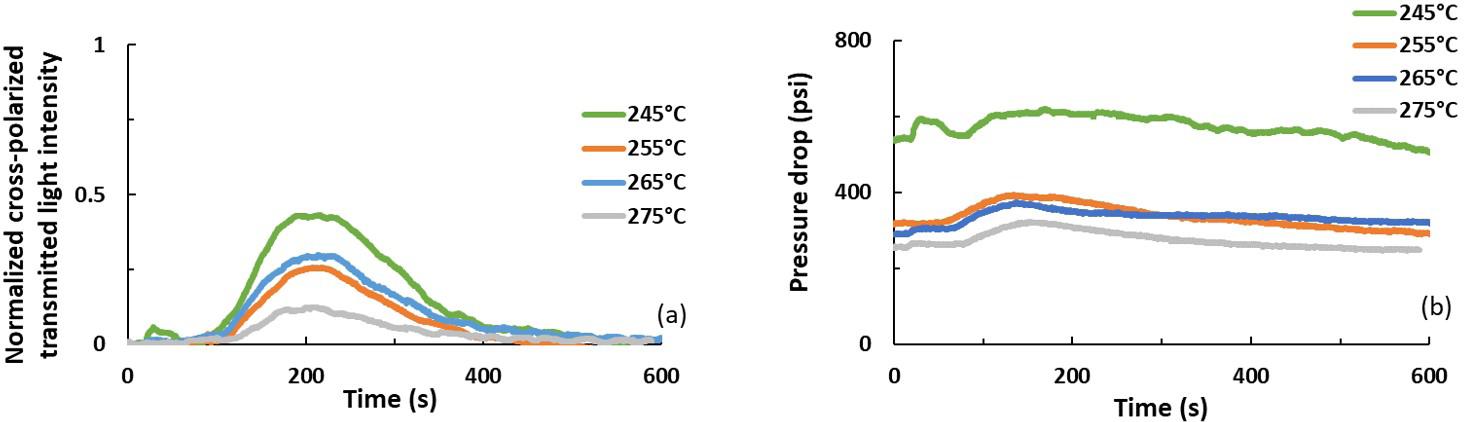
increase in short times. After passing by the high shear kneading zone the PET/PMDA melt temperature is brought back to the set barrel temperature. Another contribution is heat generation from the viscous heating occurring due to the large strain rates undergone in extrusion. Heat generation is proportional to PET viscosity, which, is overcome by its dependency squared on strain rate square. Thus, PET-flow carrying PMDA reaches temperatures higher than the set barrel temperature, melting PMDA. A detectable RTD curve indicates that these effects are contributing to the melting of the PMDA.
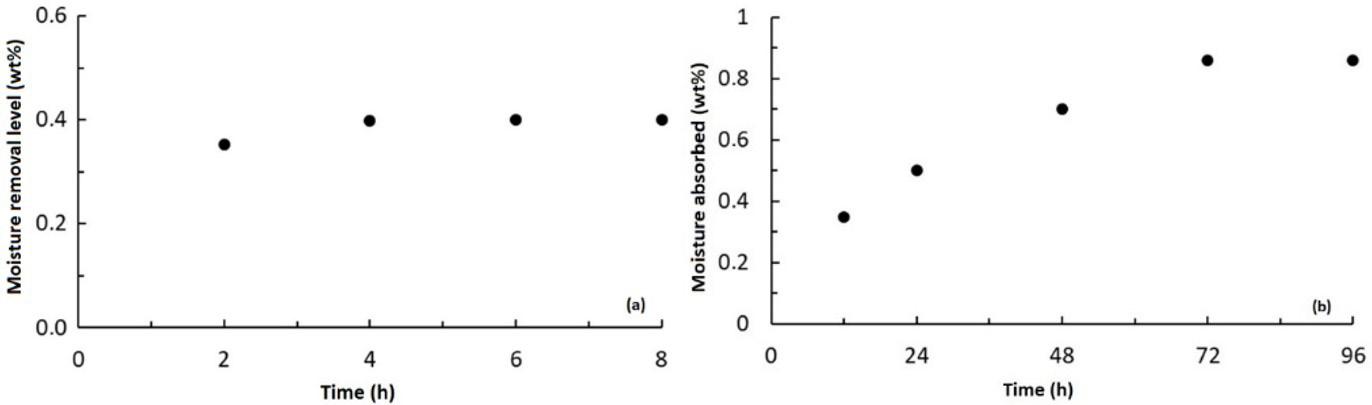
Polímeros, 33(2), e20230016, 2023 5/11
Figure 2. (a) Moisture removal from PETv during the drying process at 150ºC at different times to evaluate the best set-up to produce the dry PETd; (b) PETv moisture absorbed in the water saturation process, soaked at 90°C, to prepare the wet PETw.
Figure 3. DSC of (a) PETd and PETw and (b) PMDA at a heating rate of 10°C/min.
Figure 4. In-line optical monitoring of 10g PETd + 0.25g PMDA pulse during PET extrusion at different temperatures. (a) normalized cross-polarized transmitted light intensity ( c N I ); (b) slit pressure drop. Processing condition: screw profile 1 (KB90, 14mm); 3Kg/h; 100rpm.
Figure 4b shows the pressure drop, along the slit-die, in the RTD detection region. The pressure drop increases slightly, indicating a slight rise in the melt flow viscosity due to chain extension. The increase in the pressure drops, measured at RTD curves’ peak, is kept almost constant, regardless the extrusion temperature. The results suggest the reaction is occurring during extrusion, as expected, and nearly to the same extent in all temperatures tested.
3.4 PET hydrolysis in-line characterization during transient-state extrusion
In-line birefringence and pressure drop measurements were used to monitor the transient-state PET hydrolysis during extrusion in three different screw profiles (see Figure 1b). Figure 5a shows the in-line c N I (as in-line flow birefringence), and (b) the pressure drop in the slit-die, measured using the processing condition: 3 kg/h, 100 rpm, and 245 ºC for screw profile 1. The procedure started by introducing PETd pulses in PETd flow to set the baseline curve. The c N I curve remains close to zero, indicating no flow birefringence, and the pressure drop remains constant at 600 psi. In both cases, no sign of an RTD curve is shown, indicating that introducing a dry PET pulse into the flow it does not change the flowing orientation of the polymer and so the shear rate, thus the PET average molecular weight remains constant. On the other hand, when pulses of wet PET (PETw) are introduced, c N I curves (as flow birefringence) and pressure drop curves show an “upsidedown” RTD curve, producing data below their baseline, indicating a reduction of flow orientation and a decrease in viscosity. Hydrolysis causes the scission of ester bonds in the PET chains, decreasing the molecular weight and thus its melt viscosity. As expected, raising the weight content of PETw on the pulse intensifies the hydrolysis level (10g PETw pulse has 0.086g water compared to 6g PETw pulse holding 0.052g water).
Peaks at the beginning of the RTD curves, seen in Figures 4 and 5, were observed at about ~15 s. By monitoring the extruder torque, we could conclude that the sudden pellet mass increases while the pulse is fed creates a short and reversible mechanical disturbance, with no consequence to the RTD curve, which starts later at ~100s.
During the screw profile design, kneading elements were added to intensify shearing of the melt flow, improving the mixing performance during extrusion. Three screw profiles (Figure 1 b) were used to evaluate their effects in the PET
hydrolysis. Figure 6 shows the “upside-down” RTD curves when introducing wet PETw pulses. Comparing the three RTD curves produced by the three screw profiles, the presence and type of kneading disc blocks affect the hydrolysis level. Screw profile 1 with narrow KB90, produces the highest drop. Screw profile 2 shows an intermediate effect with wide KB90. Finally, screw profile 3, having only conveying elements, indicates the lowest effect. Also, screw profiles 1 and 2 have longer residence times, increasing the time for the reaction to occur inside the extruder. The set of KB90 had an equal total length of the kneading zone, differing in the thickness of the disks; narrow disks produce a more intense distributive mixture, causing a more effective hydrolysis.
Table 1 shows the lowest flow birefringence values calculated using equations presented in section 2.7, by using the lowest value of the c N I reached in each curve, compared to baseline. The lowest flow birefringence, 11.1x10⁻³, was achieved when introducing 10g of wet PETw pulse in profile 1, in contrast to 33.4x10⁻³ from adding dry PETd, a reduction of 22.3x10⁻³. A similar effect, but smaller, was observed for profiles 2 and 3. A longer residence time and greater shear mixing level provided by profile 1 were sufficient to induce the hydrolysis reaction decreasing the molecular weight and melting viscosity.
3.5 PET chain extension in-line characterization during transient-state extrusion
The PET chain extension using PMDA was monitored in-line by measuring flow birefringence (as c N I ) and pressure drop along the slit-die. Pulses made of PETd/PMDA were introduced in the melt flow of PETd (conditions in Figure 7). This reaction ties together two or more PET chains producing
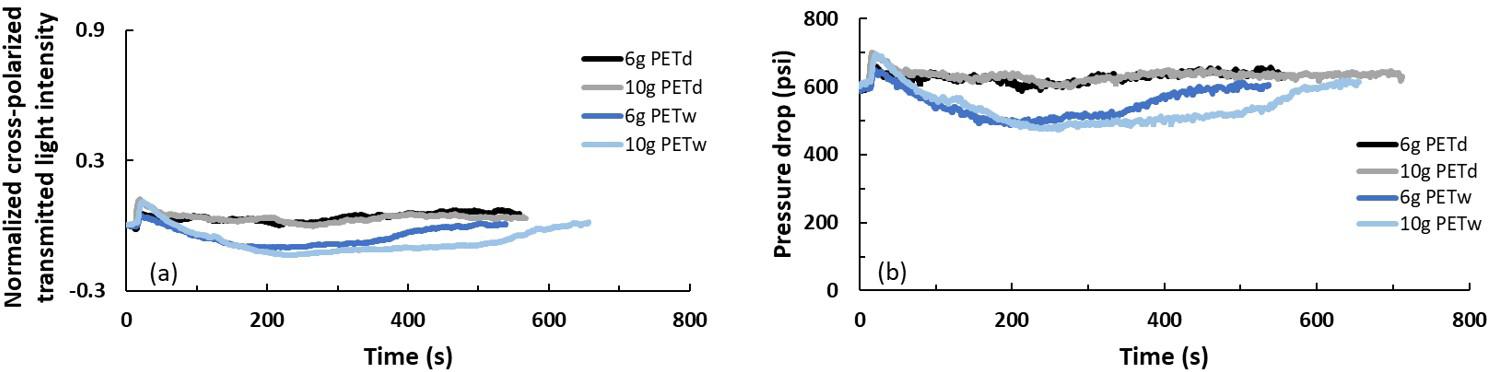
Bicalho, L. A., & Canevarolo Junior, S. V. Polímeros, 33(2), e20230016, 2023 6/11
Screw profile/Flow birefringence Pulse of 10g PETw Pulse of 6g PETw Profile 1 (KB90, 14mm) 11.1x10⁻³ 14.3x10⁻³ Profile 2 (KB90, 28mm) 14.1 x10⁻³ 14.6x10⁻³ Profile 3 (only conveying) 19.6x10⁻³ 18.5 x10⁻³ Flow birefringence of dry PETd = 33.4x10⁻³
3.2)
Table 1. Effect of the screw profiles in the hydrolysis of PET melt flow during extrusion, as flow birefringence, measured at the minimum of the RTD curve.
(from section
Figure 5. In-line optical monitored the effect of adding PETd and PETw pulses to a steady-state extrusion melt flow of PETd: (a) normalized cross-polarized transmitted light intensity and; (b) pressure drop curves. Screw profile 1 (KB90, 14mm), 3Kg/h, 100rpm and 245°C.
longer molecules and increasing PET average molecular weight; melt viscosity; chain relaxation time; flow orientation; and, as a result, an increase in flow birefringence (as c N I ), seen in the RTD curves. Turbidity was also measured while the experiments were running (not shown), but no RTD curve was detected, denoting that the PMDA was not dispersed as fine particles that would scatter light, but rather molten and well mixed in the PET melt.
Figure 7 shows RTD curves obtained with different amounts of PMDA. The c N I rises above the baseline, denoting an increase in the flow orientation, i.e., confirming the PET chain extension reaction. The curve made by the pulse having only 0.25g PMDA reaches the highest value, followed by a pulse made of 0.25g PMDA + 10g of PETd, and the third, formed by a pulse of 0.15g PMDA + 10g of PETd, shows the lower intensity. The two pulses having the same PMDA amount differ because the extra amount of dry PETd dilutes the PMDA, reducing the reacted chain content in the melt.
Figure 8 shows in-line birefringence, as c N I , and pressure drop RTD curves. The amount of PMDA in the pulses affects the size of the RTD curve, and likewise, the more shearing the screw profile is, the greater the RTD curve, indicating a higher chain extension reaction. This behavior is seen in the most shearing profiles 1 and 2, even though the data are somehow overlapped. A dispersive mixture imparted by the KB90 favored the chain extension reaction. The pressure drop measurements follow the same pattern but are much less sensitive, with data more scattered. As the reacted polymer flow passes by the slit-die, the pressure drop increases, showing that the molecular weight of the PET increases, which confirms the extension reaction.
Table 2 shows the highest value of PET flow birefringence calculated from the c N I value measured at the RTD curves
maximum. For comparison, using as a baseline the value of PETd as 33.4x10⁻³(see section 3.2). Profiles 1 and 2, with KB90, presented a higher increase in the flow birefringence, reaching 90x10-3 for the 0.25g PMDA pulse, 80x10-3 for the 0.25g PMDA + 10g PETd pulse and 59x10-3 for the 0.15g PMDA + 10g PETd pulse.
3.6 Simultaneous PET hydrolysis and chain extension in-line characterization
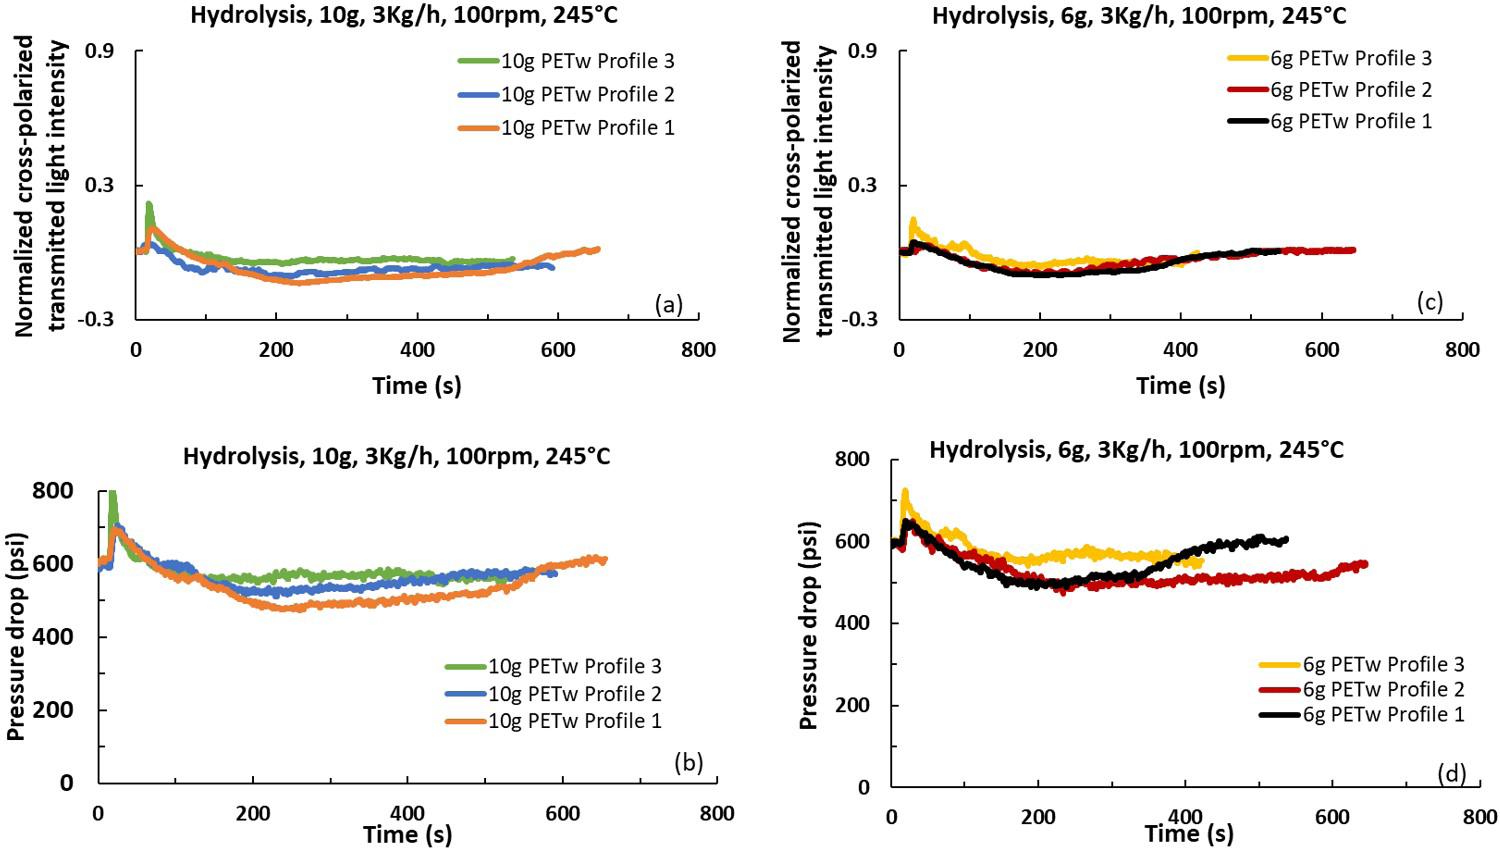
The simultaneous addition of wet PETw and PMDA during in-line monitoring allows analyzing the two opposite reactions, hydrolysis, and chain extension, shown in Figure 9
The in-line birefringence and pressure drop curves were obtained with pulses with 0.25g PMDA + 10g PETw and 0.15g PMDA + 10g PETw. The reagent molecule number in the first case is almost equal, taking each reaction
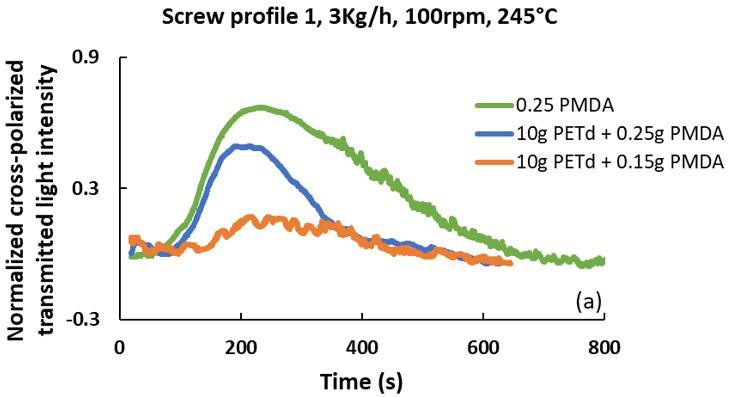
In-line
Polímeros, 33(2), e20230016, 2023 7/11
rheo-optical characterization of PET hydrolysis and chain extension during extrusion
Figure 6. In-line monitoring PET hydrolysis using three different screw profiles, screw profiles 1 (KB90, 14mm), profile 2 (KB90, 28mm), and profile 3 (only conveying): (a) and (c) normalized cross-polarized transmitted light intensity, (b) and (d) pressure drop curves.
Figure 7. RTD curves measured during chain extension analysis in transient-state by in-line normalized cross-polarized transmitted light intensity ( ) c N I in screw profile 1, [KB90, 14mm].
stoichiometry, 1:1 for the hydrolysis and 1:4 for the chain extension reactions (PMDA is tetra-functional). A pulse with 0.25g PMDA has 0.9 mmol of PMDA, and 10g PETw holds 4.8 mmol of water, 5 times higher, compensating for the difference in stoichiometry. Figure 9 shows two RTD curves superposition, shifted in time. The pulse release with the two components was simultaneous. Their reaction occurred downstream but shifted in time. The upside-down RTD curve, hydrolysis, occurs first. Later, the chain extension leads the reaction, creating a regular shape RTD curve. As the water is present in the PETw pulse it reacts in the polymer, hydrolysis can start after entering the extruder and continue as the polymer gets heated. Some water molecules may vaporize,
escaping from the melt and diffusing forward following the partially filled screw channels and reacting with other PET chains at the flow downstream. These hydrolyzed chains reach the extruder exit (and so are detected) first, making up the initial part of the RTD curve. The PMDA powder in the envelopes needs to be heated to melt and then start to react with the PET chains, retarding the reaction along the screw length. Also, the forward movement imposed by the screw to the PMDA envelopes, which are bigger than the PET pellets, is less efficient than the one transferred to the molten PET stream, retarding them. Thus, the extended chains take longer to reach the detector, forming the second part of the RTD curves. The same behavior is presented by
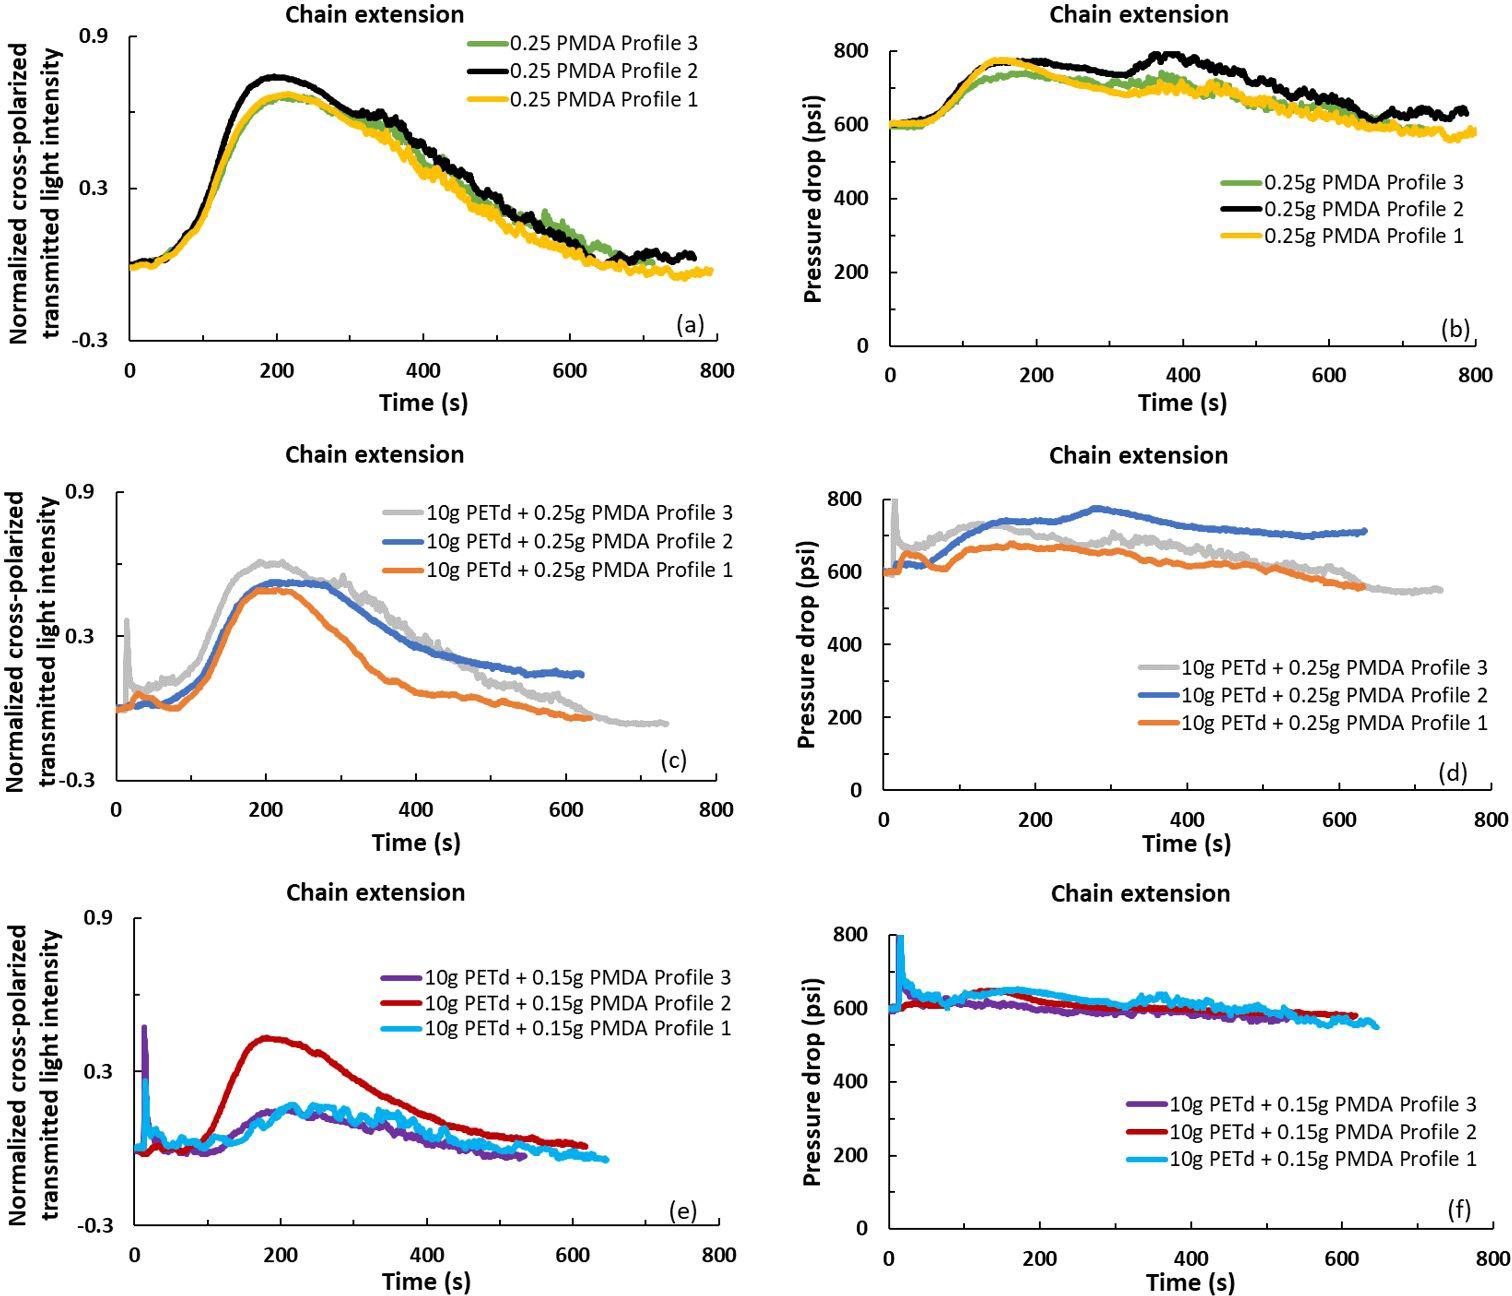
Bicalho, L. A., & Canevarolo Junior, S. V. Polímeros, 33(2), e20230016, 2023 8/11
Figure 8. Effect of KB90 elements in the PET chain extension reaction, measured in-line. In (a), (c) and (e) is plotted flow birefringence curves (as c N I ), and in (b), (d) and (f) pressure drop curves. Extrusion processing conditions: 245°C, 3Kg/h and 100rpm. Screw profile 1 (KB90, 14mm), profile 2 (KB90, 28mm), and profile 3 (only conveying).
Screw profile/Flow birefringence Pulse of (0.25g PMDA) Pulse of (0.25g PMDA + 10g PETd) Pulse of (0.15g PMDA + 10g PETd) Profile 1 (KB90, 14mm) 89.5x10⁻³ 78.9x10⁻³ 58.3x10⁻³ Profile 2 (KB90, 28mm) 94.0x10⁻³ 80.8x10⁻³ 75.3x10⁻³ Profile 3 (only conveying) 88.9x10⁻³ 85.8x10⁻³ 57.0x10⁻³ Flow birefringence of PETd = 33.4x10⁻³
Table 2. Effect of the screw profiles in the chain extension reaction with PMDA.
In-line rheo-optical characterization of PET hydrolysis and chain extension during extrusion
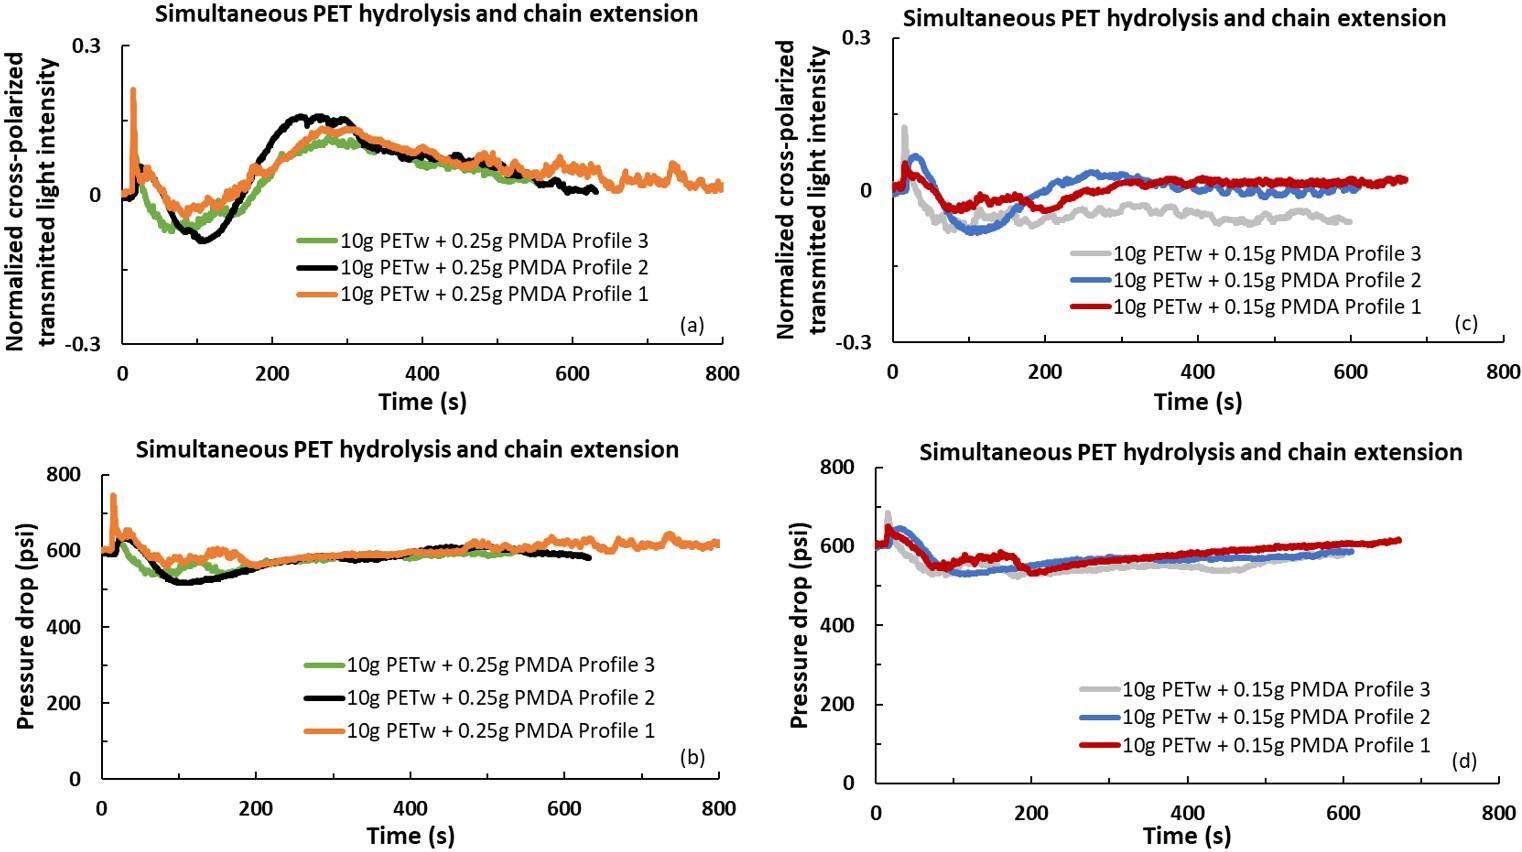
pressure drop graphs, seen in Figures 9c and d, showing the two shifted curves.
Table 3 presents the minimum and maximum values of PET flow birefringence attained by each pulse in the three screw profiles. The higher the PMDA content in the pulse, the higher the conversion of the chain extension reaction, the higher the flow birefringence.
During in-line monitoring, polymer melt samples were collected at the extrusion exit, at the maximum of the RTD curve. They were characterized off-line by measuring their IV, which provides v M by using Mark-Houwink-Sakurada equation[15], with results shown in Table 4. PETv has 0.7dl/g IV, indicating a 38,000 v M = . When PETd pulse was added, IV dropped to 0.6/dlg, indicating a 28,000 v M = . The addition of PETw pulses reduced the IV to 0.5dl/g ( 23,000) v M = , and PMDA pulses increases back to 0.64dl/g ( 33,000) v M = . The IV values are dependent on the screw profiles, indicating a higher chain extension reaction in profile 2 and hydrolysis reaction in profile 1. Profile 3, the mildest, induces lower conversion rates in both reactions. These off-line values corroborate the in-line flow birefringence measured in the previous sections, confirming the efficacy of the proposed in-line rheo-optical detection method.
To quantitatively evaluate how accurate in-line measurements are compared to off-line data, in-line flow birefringence was plotted as a function of intrinsic viscosity and Mv Figure 10 shows this correlation as a straight line with excellent fittings. The intrinsic viscosity relation comes as 0.160log0.81 IV n =×∆+ (R2
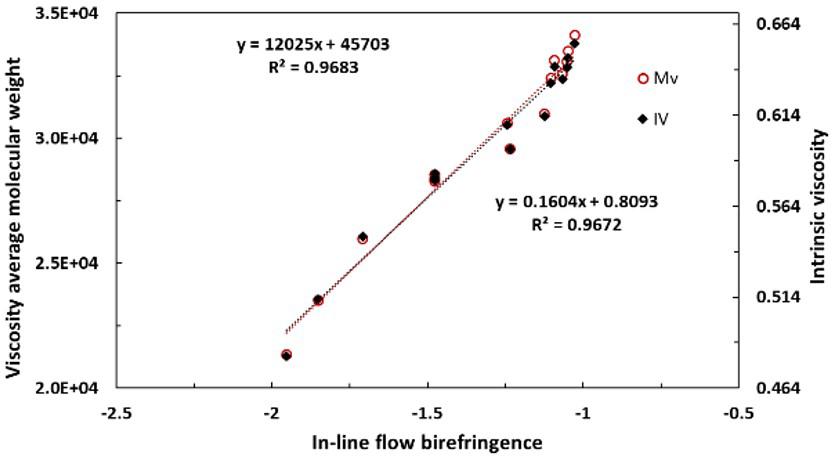
Polímeros, 33(2), e20230016, 2023 9/11
3.7 PET off-line characterization
= 0.97)
12025log45703 Mv n =×∆+ (R2 = 0.97). These relations are
and
Screw profile/Flow birefringence (PETd = 33.4x10⁻³) Pulse of (0.25g PMDA + 10g PETw) Pulse of (0.15g PMDA + 10g PETw) Min Max Min Max Profile 1 (KB90, 14mm) 21x10-3 55x10-3 21x10-3 43x10-3 Profile 2 (KB90, 28mm) 15x10-3 57x10-3 16x10-3 45x10-3 Profile 3 (only conveying) 17x10-3 54x10-3 16x10-3 24x10-3
Table 3. In-line flow birefringence during simultaneous hydrolysis and chain extension reactions. Effect of pulse content and screw profile.
Figure 9. In-line monitoring of simultaneous hydrolysis and chain extension during PET extrusion, using screw profiles 1 (KB90, 14mm), profile 2 (KB90, 28mm), and profile 3 (only conveying). Pulse contents as PETw and PMDA and screw profile type used are shown at each legend box of a) to d) plots. Extrusion processing conditions: 245°C, 3Kg/h and 100rpm.
Figure 10. PET v M and IV as a function of in-line flow birefringence, for all samples tested. The linear fitting equations and accuracies are indicated, showing good agreement between in-line flow birefringence (in log scale) and off-line Mv and IV (in linear scale) measurements.
Table 4. In-line flow birefringence ( n∆ ), off-line IV, and calculated v M , of PET samples collected during extrusion, at the maximum of the RTD curve.
valid for a twin-screw extruder with L/D = 35, processing PET at 245 °C, 3Kg/h and 100 rpm. This knowledge may be used in the development of quality control during industrial PET extrusion processes and real-time quantification during PET recycling.
4. Conclusions
During twin-screw extrusion of PET, reactions of hydrolysis and chain extension were induced by adding reactant pulses in the melt flow and quantified via in-line rheo-optical measurements. The melt elasticity was followed by measuring flow birefringence and pressure drop along a slit-die, done by a rheo-optical detector. The results come as residence time distribution RTD curves, with unique forms: with its maximum value pointing upwards when the melt elasticity increases, as is the case of chain extension, or an RTD curve upside down, pointing downwards, when the reaction is by chain scission. PET hydrolysis and chain extension depend on the type and content of the active agent. They also depend on the melt shearing type and level imposed by the extruder screw profile. Hydrolysis is more effective when screw profiles having narrow KB90 are used, inducing preferential distributive mixing, while chain extension is more sensitive to wide KB90, which has a preferential dispersive mixing character. Off-line measurements of intrinsic viscosity ( IV ) and its corresponding molecular weight ( v M ) corroborate the in-line measurements. By assuming collinearity and full birefringence orientation along the melt flow direction the flow birefringence, measured in the 2-direction ( 12n∆ ), can be used to monitored in-line the elasticity of the melt, taken as first normal stress difference ( 1N ), which in turn is affected by changes in the polymer melt molecular weight. The proposed real-time rheo-optical technique was successfully applied to follow chain extension and hydrolysis reactions occurring during PET melt extrusion.
5. Author’s Contribution
• Conceptualization – Luciana Assumpção Bicalho; Sebastião Vicente Canevarolo Junior.
• Data curation – Luciana Assumpção Bicalho; Sebastião Vicente Canevarolo Junior.
• Formal analysis – Luciana Assumpção Bicalho; Sebastião Vicente Canevarolo Junior.
• Funding acquisition – Sebastião Vicente Canevarolo Junior.
• Investigation – Luciana Assumpção Bicalho; Sebastião Vicente Canevarolo Junior.
• Methodology – Luciana Assumpção Bicalho; Sebastião Vicente Canevarolo Junior.
• Project administration –Sebastião Vicente Canevarolo Junior.
• Resources – Luciana Assumpção Bicalho; Sebastião Vicente Canevarolo Junior.
• Software – Luciana Assumpção Bicalho; Sebastião Vicente Canevarolo Junior.
• Supervision – Sebastião Vicente Canevarolo Junior.
• Validation – Luciana Assumpção Bicalho; Sebastião Vicente Canevarolo Junior.
• Visualization – Luciana Assumpção Bicalho; Sebastião Vicente Canevarolo Junior.
• Writing – original draft – Luciana Assumpção Bicalho; Sebastião Vicente Canevarolo Junior.
• Writing – review & editing – Luciana Assumpção Bicalho; Sebastião Vicente Canevarolo Junior.
6. Acknowledgments
This study was financed by the Coordenação de Aperfeiçoamento de Pessoal de Nível Superior - Brasil (CAPES) - Finance Code 001, PROEX 88882.332717/201901 scholarship to L.A. Bicalho, and Conselho Nacional de Desenvolvimento Científico e Tecnológico (CNPq) for a PQ scholarship 311790/2013-5 to S.V. Canevarolo, and the Programa de Pós-Graduação em Ciência e Engenharia de Materiais (PPG-CEM) of UFSCar.
7. References
1. Awaja, F., & Pavel, D. (2005). Recycling of PET. European Polymer Journal, 41(7), 1453-1477 http://dx.doi.org/10.1016/j. eurpolymj.2005.02.005
2 Scheirs, J. (2004). Additives for the modification of poly(ethylene terephthalate) to produce engineering-grade polymers. In J.
Bicalho, L. A., & Canevarolo Junior, S. V. Polímeros, 33(2), e20230016, 2023 10/11
PETv Pulse components and content IV = 0.7dl/g 10g PETd 10g PETw 0.25g PMDA 10g PETd + 0.25g PMDA 10g PETd + 0.15g PMDA 38,000 = v M Melt processed PET properties Δn (x10-3) Profile 1 33.4 11.1 89.5 78.9 58.3 Profile 2 33.4 14.1 94.0 80.8 75.3 Profile 3 33.4 19.6 88.9 85.8 57.0 IV (dl/g) Profile 1 0.579 0.482 0.645 0.632 0.595 Profile 2 0.578 0.513 0.653 0.641 0.613 Profile 3 0.582 0.547 0.640 0.634 0.609 v M Profile 1 28,400 21,300 33,500 32,400 29,600 Profile 2 28,300 23,500 34,100 33,100 31,000 Profile 3 28,500 26,000 33,100 32,600 31,000
In-line rheo-optical characterization of PET hydrolysis and chain extension during extrusion
Scheirs, & T. Long (Eds.), Modern polyesters: chemistry and technology of polyesters and copolyesters (pp. 495-540). England: John Wiley & Sons, Ltd. http://dx.doi.org/10.1002/0470090685. ch14
3 Campanelli, J. R., Kamal, M. R., & Cooper, D. G. (1993). A kinetic study of the hydrolytic degradation of polyethylene terephthalate at high temperatures. Journal of Applied Polymer Science, 48(3), 443-451 http://dx.doi.org/10.1002/ app.1993.070480309
4 Kao, C.-Y., Wan, B.-Z., & Cheng, W.-H. (1998). Kinetics of hydrolytic depolymerization of melt poly (ethylene terephthalate). Industrial & Engineering Chemistry Research, 37(4), 12281234. http://dx.doi.org/10.1021/ie970543q.
5 Pirzadeh, E., Zadhoush, A., & Haghighat, M. (2007). Hydrolytic and thermal degradation of PET fibers and PET granule: the effects of crystallization, temperature, and humidity. Journal of Applied Polymer Science, 106(3), 1544-1549 http://dx.doi. org/10.1002/app.26788
6. Hosseini, S. S., Taheri, S., Zadhoush, A., & Mehrabani‐Zeinabad, A. (2007). Hydrolytic degradation of poly (ethylene terephthalate). Journal of Applied Polymer Science, 103(4), 2304-2309 http://dx.doi.org/10.1002/app.24142
7 Awaja, F., Daver, F., & Kosior, E. (2004). Recycled poly (ethylene terephthalate) chain extension by a reactive extrusion process. Polymer Engineering and Science, 44(8), 1579-1587 http://dx.doi.org/10.1002/pen.20155.
8 Incarnato, L., Scarfato, P., Di Maio, L., & Acierno, D. (2000). Structure and rheology of recycled PET modified by reactive extrusion. Polymer, 41(18), 6825-6831 http://dx.doi.org/10.1016/ S0032-3861(00)00032-X
9 Covas, J. A., Nóbrega, J. M., & Maia, J. M. (2000). Rheological measurements along an extruder with an on-line capillary rheometer. Polymer Testing, 19(2), 165-176 http://dx.doi. org/10.1016/S0142-9418(98)00086-5
10 Silva, J., Santos, A. C., & Canevarolo, S. V. (2015). In-line monitoring flow in an extruder die by rheo-optics. Polymer Testing, 41, 63-72 http://dx.doi.org/10.1016/j.polymertesting.2014.10.007
11 Muller, R., & Vergnes, B. (1996). Validity of the stress optical law and application of birefringence to polymer complex flows. Rheology Series, 5, 257-284 http://dx.doi.org/10.1016/ S0169-3107(96)80010-4
12. Janeschitz-Kriegl, H. (1969). Flow birefringence of elasticoviscous polymer systems. In: F. der Hochpolymeren-Forschung Advances in polymer science (pp. 170-318). Germany: Springer Berlin Heidelberg http://dx.doi.org/10.1007/BFb0051073
13 Soares, K., Santos, A. M. C., & Canevarolo, S. V. (2011). In-line rheo-polarimetry: a method to measure in real time the flow birefringence during polymer extrusion. Polymer Testing, 30(8), 848-855 http://dx.doi.org/10.1016/j.polymertesting.2011.08.007
14 Wódkiewicz, K. (1995). Classical and quantum Malus laws. Physical Review. A, Atomic, Molecular, and Optical Physics, 51(4), 2785-2788 http://dx.doi.org/10.1103/PhysRevA.51.2785 PMid:9911909.
15 Billmeyer, F. W., Jr, & Stockmayer, W. H. (1950). Method of measuring molecular weight distribution. Journal of Polymer Science, 5(1), 121-137 http://dx.doi.org/10.1002/ pol.1950.120050106
16 Van Krevelen, D. W., & Te Nijenhuis, K. (2009). Properties of polymers: their correlation with chemical structure; their numerical estimation and prediction from additive group contributions Netherlands: Elsevier http://dx.doi.org/10.1016/ B978-0-08-054819-7.00001-7
17. Odian, G. (2004). Principles of polymerization. USA: John Wiley & Sons, Inc. http://dx.doi.org/10.1002/047147875X
18 Qian, B., & Gogos, C. G. (2000). The importance of plastic energy dissipation (PED) to the heating and melting of polymer particulates in intermeshing co‐rotating twin‐screw extruders. Advances in Polymer Technology, 19(4), 287-299. http://dx.doi.org/10.1002/1098-2329(200024)19:4<287::AIDADV5>3.0.CO;2-K
Received: Aug. 04, 2022
Revised: Apr. 23, 2023
Accepted: May 19, 2023
Polímeros, 33(2), e20230016, 2023 11/11
Active antimicrobial extruded films for mozzarella cheese from poly (butylene adipate co-terephthalate) (PBAT) and orange oil
Michelle Félix de Andrade1* , Ivo Diego de Lima Silva1 , Viviane Fonseca Caetano1 , Gisely Alves da Silva2 , Luiz Emílio Pessoa Timeni de Moraes Filho3 , Yêda Medeiros Bastos de Almeida1 and Glória Maria Vinhas1
1Laboratório de Petroquímica, Departamento de Engenharia Química, Universidade Federal de Pernambuco, Recife, PE, Brasil
2Laboratório de Microbiologia, Departamento de Engenharia Química, Universidade Federal de Pernambuco, Recife, PE, Brasil
3Chemical Engineering Department, University of Utah, Salt Lake City, Utah, United States of America
*mifelixsilva@hotmail.com
Obstract
The use of natural antimicrobial additives, such as orange essential oil (OO), can be a promising possibility to increase food shelf life with the aid of active packaging. This study aimed to develop an active packaging using orange oil and PBAT – poly (butylene adipate co- terephthalate) to store mozzarella cheese produced by a fine film extruder with 5, 10, and 15% OO (w/w). In the results, D-limonene was oil’s main constituent with antimicrobial activity against E. aerogenes, E. coli, and S. aureus. The addition of the oil did not alter the thermal stability of the film. The water vapor permeability increased with increasing oil concentration. All films presented high strength. However, films with higher OO concentrations favored the degradation process, as observed in the activation energy. The active packaging added with 15% OO (PBAT15) was efficient, reducing microbial growth up to 6 days of storage of mozzarella cheese.
Keywords: antimicrobial, orange oil, PBAT, active packaging.
How to cite: Andrade, M. F., Silva, I. D. L., Caetano, V. F., Silva, G. A., Moraes Filho, L. E. P. T., Almeida, Y. M. B., & Vinhas, G. M. (2023). Active antimicrobial extruded films for mozzarella cheese from PBAT and orange oil. Polímeros: Ciência e Tecnologia, 33(2), e20230017. https://doi.org/10.1590/0104-1428.20220112
1. Introduction
Food packaging has essential functions: protection, communication, convenience, and containment. In addition to these, they preserve food from external contamination, maintain freshness and quality, and when possible, extend the shelf life of food[1]. Active packaging has, in addition to the characteristics of conventional packaging, the ability to preserve or control the quality of packaged foods[2]. The development of active packaging that provides longer shelf lives and improves food quality and safety is one of the most challenging research activities[3]
Furthermore, the antimicrobial additives inserted in the packaging increase the interaction between packaging and food by decreasing deterioration by microorganisms and reducing the growth of pathogens[3]. Promising additives for the use of antimicrobial agents are essential oils extracted from plants. Numerous essential oils are classified by the Food and Drug Administration (FDA) as Generally Recognized as Safe (GRAS) and present antimicrobial, medicinal, biocide, and other activities[4]
Orange essential oil (OO) can be extracted mainly from the peel and the leaves. Its composition is extensive, but terpenoids (monoterpenes) are the main constituents with about 85-99% of the composition. Generally,
the main compound is limonene, and its concentration can reach over 90%[5]
For the production of antimicrobial packaging, poly (butylene adipate co-terephthalate) (PBAT) was used with the possibility of producing active and biodegradable packages. PBAT (Ecoflex) is an aliphatic-aromatic copolyester, biodegradable and has properties similar to low-density polyethylene (LDPE) due to its high molecular weight and branched molecular structure[6], it has high flexibility, impact resistance, easy processability and melting point around 120 ºC[7]
Hence, the main objective of this study was to evaluate the properties of PBAT films and orange essential oil obtained by the extrusion of thin films and their application for the protection of mozzarella cheese.
2. Materials and Methods
2.1 Materials
For the development of the research, PBAT Polymer –Acquired by BASF (Germany), with the trade name ECOFLEX® F BLEND C1200, and the orange essential oil (OO) of Agroterenas (São Paulo, Brazil) were used.
https://doi.org/ 10.1590/0104-1428.20220112 O O O O O O O O O O O O O O O Polímeros, 33(2), e20230017, 2023 ISSN 1678-5169 (Online) 1/8
2.2 Production of the PBAT/OO films
The films were prepared by Lab-16 Chill roll from AX PLÁSTICOS (São Paulo, Brazil). It is a single-screw extruder equipped with a flat die. Initially, 200 g of PBAT was used and the three concentrations of OO (5, 10, and 15% (w/w)) were formulated. The samples were named PBAT5, PBAT10, and PBAT15, according to the concentration of the samples.
2.3 Gas chromatography-mass spectrometry (GC-MS) of OO
GC-MS analysis was used to identify and quantify the components present in OO and was performed using a Trace 1300, Thermo Xcalibur Instrument Chromatograph (Massachusetts, USA), with a capillary column TGMS-5 (5% phenyl/95% dimethylpolysiloxane). The analysis lasted approx. 18.00 min, the temperature programming was 60 °C/min, heating rate of 6 °C/min until 100 °C, then of 14 °C/min until 260 °C.
2.4 Disc-diffusion analysis on agar of OO
To confirm antimicrobial activity, OO was submitted to a disk-diffusion test in agar to obtain the diameter of the inhibition halo. The test followed the methodology proposed by[8] with adaptations. The bacteria used for the test were Escherichia coli, Enterobacter aerogenes, and Staphylococcus aureus and the test was performed in duplicate. The oil was analyzed without dilution and measurements of the halo diameter were performed at 24 and 48 hours.
2.5 Colorimetric assay and transparency
The resulting color of the films was determined by a Color View BYK colorimeter (Germany). The samples were placed on white support and the values obtained were compared with standard data, according to Arrieta et al.[9] with adaptations. The values are expressed as the average triplicates of each formulation. The results are expressed as L (Metric luminosity), a (Red axis (+) to green (-)), b (Yellow axis (+) to blue (-)), and ΔE (Color difference).
The Transparency (T) of the films was obtained in an Edutec Spectrometer (São Paulo, Brazil) from the measurement of the transmittance of the films at the wavelength of 600 nm[10]
2.6 Fourier-transform infrared spectroscopy (FTIR) and Principal component analysis (PCA)
The absorption spectra in the infrared region of the oil, PBAT, and films were performed in Spectrum 400 PerkinElmer equipment (United States) and were obtained in the region of 4000- 650 cm-1 in absorbance mode, with 16 scans and a resolution of 4 cm-1 at a temperature of approximately 22 ºC and HATR accessory[11]. The spectra obtained by FT-IR were analyzed by Principal Component Analysis (PCA), using The Unscrambler 9.7. The spectrum analysis region was in the range of 3200 to 650 cm-1, with Standard Normal Variate as a pre-processing technique[12]
2.7 Thermal analysis – DSC and TGA
Exploratory differential calorimetry (DSC) was performed in a 1STAR e System, Mettler Toledo equipment (Sao Paulo, Brazil) under a nitrogen atmosphere (50 mL/min).
The samples were cut and weighed with approximately 6 mg, and then sealed in aluminum crucibles. All samples were submitted to three ramps: 0 to 200 °C with 30 °C/min. The second ramp ranged from 200 to 0 °C and the third stage from 0 to 200 °C, with a temperature change ratio of 10 °C/min[13]
Thermogravimetric analysis (TGA) was performed in Shimadzu DTG 60H equipment (Kyoto, Japan), under heating from 35 to 550 ºC and a heating rate of 20 ºC/min, and the flow of 20 mL/min of nitrogen and sample mass of approximately 20 mg.
2.8 Water vapor permeability (WVP)
In a desiccator, a saturated solution of sodium chloride (75% RH) was prepared. In a Becker with a 4.4 cm diameter, dry calcium chloride (dried at 100 ºC for 72 hours) was added up to a certain height so that there was 1.5 cm between the salt and the Becker opening. The film was sealed with adhesive tape on the surface of the beaker. Weight changes in the system were measured for 10 days every 24 hours.
Water vapor transmission rate (WVTR) and water vapor permeability (WVP) were calculated from Equations 1 and 2:
Where Δ�� is the weight difference, Δ�� is the time interval in which Δ�� was observed, �� is the area, X is the mean film thickness (mm) and ΔP is the difference in water vapor pressure between both sides of the film (Pa).
2.9 Thickness and mechanical tensile test
The thicknesses of the samples were obtained from the average of 3 points per film in 7 films per formulation, totaling 21 points. A Mitutoyo micrometer with a precision of 0.01 mm was used.
The mechanical tensile test followed the ASTM D882-10 standard for films[14]. Tests were performed at room temperature, using universal testing equipment EMIC DL500, at a speed of 50 mm/min, with a load cell of 20 N. The dimensions of the specimens were 10 cm long by 1 cm wide. Seven samples per formulation were used.
2.10 Statistical analysis
Statistical data were analyzed through analysis of variance (ANOVA) using STATISTICA software, version 10.0.228.8. The Duncan test was used to determine the difference in significance level of 5% (p ≤ 0.05)
2.11 Antimicrobial activity of active packaging for mozzarella cheese
Antimicrobial activity tests followed the methodology described by Dannenberg et al.[15]. The test was performed in triplicate, with the samples stored in a refrigerator at a temperature of ± 4º C. The test was performed over the course of 13 days.
Andrade,
E. P. T.,
M. B., &
G. M. Polímeros, 33(2), e20230017, 2023 2/8
M. F., Silva, I. D. L., Caetano, V. F., Silva, G. A., Moraes Filho, L.
Almeida, Y.
Vinhas,
WVTR tA ∆ = ∆× (1) mX ü ü ∆ =× ℵ (2)
Active antimicrobial extruded films for mozzarella cheese from poly (butylene adipate co-terephthalate) (PBAT) and orange oil
3. Results and Discussions
3.1 Gas chromatography mass spectrometry (GC-MS)
In the OO chromatogram, it was possible to identify 6 components from the intensity of the peaks. In the results, the principal component was the d-limonene (99.5%) is observed with the highest concentration present in OO. The other components of lower concentration are α-Pinene, Linalool, α -Phellandrene, Octanal, and Decanal. D-limonene is a monoterpene, volatile and aromatic obtained from the extraction of oil from the orange peel. It presents high antimicrobial, antioxidant, and therapeutic activity[16]. It is widely used in various industrial sectors. Its greatest applicability is in the conservation of food. It can be administered orally by humans, presenting rapid absorption in the intestine, easy metabolization, and low toxicity. For these reasons, it is considered a safe compound for consumption[17]
3.2 Disc-diffusion analysis on agar
From the diameter of the halo, it was observed that the OO presented antimicrobial activity for the three microorganisms. For OO, there was a larger inhibition zone for the gram-negative microorganism, E. coli, with a diameter of 20.2 mm, while E. aerogenes presented a diameter close to that found for gram-positive S. aureus: 10.3 and 10.6 mm, respectively.
According to the National Committee for Clinical Laboratory Standards[18] the diameters of the halos found in the disc-diffusion test can be classified, as to their activity, as being resistant, to a diameter equal to or less than 14 mm, intermediate, when the diameter is between 15 and 19 mm, and sensitive when the diameters are greater than 20 mm. Thus, OO can be considered sensitive to the Microorganism E. coli and resistant to E. aerogenes and S. aureus
Essential oils act by compromising the integrity and function of the cell membrane of microorganisms. That is, these oils can alter the functioning of the membrane through a change in potential, leakage of intracellular components, and inhibition of cellular respiration[19]. These characteristics are responsible for cell death or growth inhibition.
3.3 Colorimetric assay and transparency
The color of the films is an important parameter for the appearance and acceptance of packaging by the consumer. The values obtained for L, a, b, ΔE, and transparency can be observed in Table 1
For the additivated films, the increase in OO concentration caused significant changes in a* and b* and an increase in total color difference (ΔE), thus confirming the incorporation
of oil into the polymer matrix. The color difference was significant as the OO content in the samples increased.
Table 1 presents the transparency of films at wavelength 600 nm (T600 for UV light) indicating a decrease in the transparency of films with the addition of OO. Studies indicate that lower values in transparency are related to greater difficulty in light transmission[20].
The films became orange with the increase of oil, which caused a barrier against the light. The incorporation of essential oils causes a decrease in the transparency of films, mainly due to a reduction in light transmission caused by the scattering of light by the oil droplets in the polymer matrix[21]. In general, the reduction in transparency will depend on the type of essential oil used.
The use of films of lower transparency for packaging can be useful to reduce food exposure to UV and visible rays, which initiate the degrading process of food[22]
3.4 Fourier Transform Infrared Spectroscopy (FTIR) and Principal Component Analysis (PCA)
The spectra of OO, PBAT, and films with the addition of OO are presented in Figure 1
The spectrum for OO presents peaks around 1643 cm-1 which can be divided into two absorption frequencies: the first at 1650 cm-1, which is related to the hydroxyl groups, and the second at 1633 cm-1 to the C=C vibration mode. Furthermore, the following characteristic peaks: 3074 and 3011 cm-1 (stretch vibrations =C-H), 2964 and 2921 cm-1 (Stretch vibrations of the C-H), and those in 1643 and 1676 cm-1 (c=c stretch vibrations), which are related to the ring and the vinyl group, respectively, are present[23].
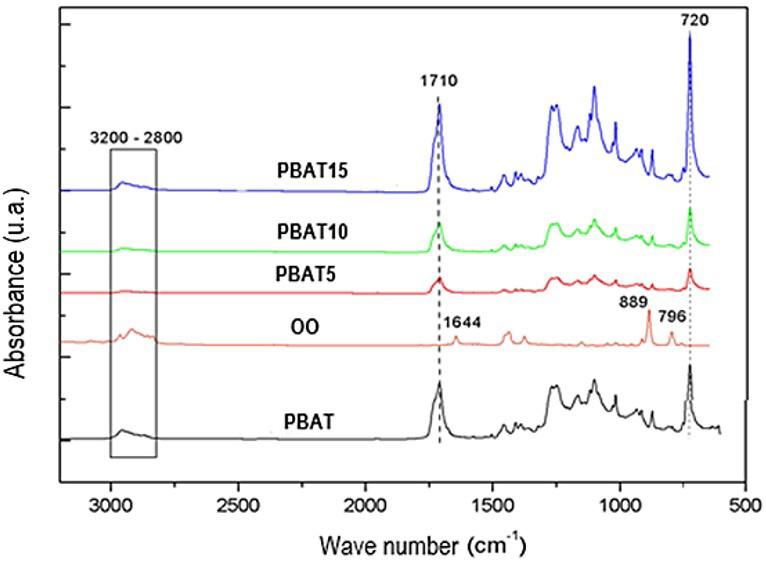
Polímeros, 33(2), e20230017, 2023 3/8
Samples L a b ΔE Transparency (%) PBAT 97.50a ± 0.14 -0.65a ± 0.02 0.73d ± 0.01 1.61d 6. 14a ± 0. 19 PBAT5 96.43b ± 0.05 -5.62b ± 0.05 15.09c ± 0.08 16.76c 1. 94c ± 0. 38 PBAT10 95.55d ± 0.06 -7.98c ± 0.11 24.48b ± 0.42 25.71b 2. 27b ± 0. 17 PBAT15 96.16c ± 0.08 -8.99d ± 0.01 28.25a ± 0.06 29.52a 0. 22d ± 0. 50
Table 1. Color and transparency of PBAT, PBAT5, PBAT10, and PBAT15 films.
*Equal
letters
in
the same column
indicate that they are not significantly different by the Duncan Test (p≤0.05).
Figure 1. FTIR spectrum of PBAT, PBAT5, PBAT10, and PBAT15 films.
All films presented the vibration region of the CH groups (3200 – 2800) and a more intense vibration in the band at 2954 cm-1 and 2920 cm-1 (stretch vibration CH3, CH2, CH). In addition, it is possible to observe a sharper peak at 1710 cm-1 (C=O of the ester bond) and another at 720 cm-1 (vibration of the methylene group (CH2) characteristic region of PBAT[24]
Analyzing the infrared spectra, it was not possible to observe the appearance of any band characteristic of the presence of OO. This behavior may have occurred because both OO and PBAT have regions with similar characteristic vibrations.
Thus, the PCA technique was performed to verify whether the OO interacted with the vibrational regions of the PBAT. PCA is a multivariate analysis using data collection and thus relates trends from the signal analysis. The results are expressed by the linear combination of vectors, called principal components (PCs), so the PCA converts the data into groups of uncorrelated variables (PCs)[12]
Therefore, principal component analysis was used to verify whether the application of orange oil caused any change in the chemical structure of PBAT, according to Figure 2
From the graph of Scores PC1xPC2 (Figure 2), it can be observed that the first component (PC1 - horizontal axis) explained 88% of the variability in the spectral information and the second component (PC2 - vertical axis) presented 11% of the variability in the spectral information.
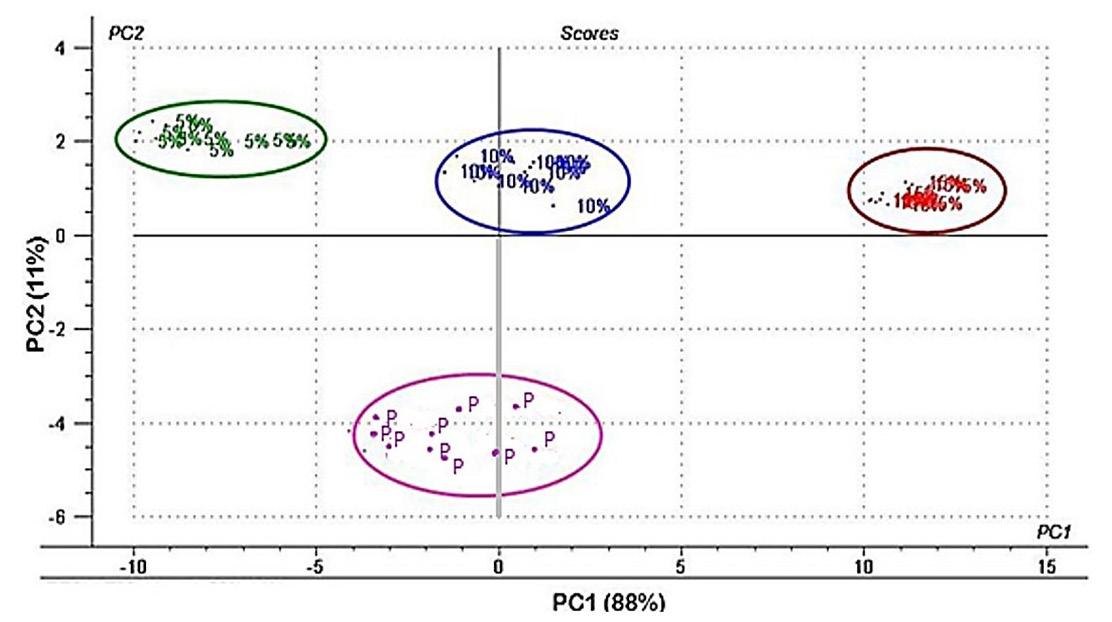
It is possible to observe that the PBAT film, in the PC1 axis (horizontal), lies within the same region as PBAT10. PC1 then was able to identify differences between PBAT15 and PBAT5. PC2, however, was able to identify the differences between PBAT and PBAT10. Hence, the two PCs when plotted together show the formation of 4 groups: one group for the pure PBAT film (P) and three other groups for PBAT films with 5%, 10%, and 15% of OO.
Thus, it can be indicated that, with PC1, it is possible to distinguish between PBAT films with 5 and 15% from the others, while with PC2, it is possible to identify the differences between pure PBAT and PBAT with 10%.
Given the results observed by the PCA, it is possible to suggest that this separation is probably indicative of the presence of orange oil (OO) in the matrix of PBAT films, thus presenting a possible interaction between PBAT and OO.
3.5 Thermal analysis: DSC and TGA
The respective values for crystallization and melting temperatures, as well as melting and crystallization enthalpies and crystallinity degree, are displayed in Table 2
From Table 2 data, it is possible to observe that there was no variation in the crystallization temperature (Tc) of the samples, with a reduction of only 1 °C for films with 10% OO, as well as there was no change in the values of melting temperature (Tf). The peak of PBAT fusion can vary in the range of 85 ºC to 145 ºC[25] this wide fusion range of PBAT is due to being a copolymer in blocks formed by repeat units of butylene adipate (BA) and butylene terephthalate (BT), being called flexible segment and rigid segment, respectively[6].
Crystallization enthalpy, crystallinity degrees, and melting enthalpy increased with the addition of the oil, indicating that it probably modified the structure of PBAT, which now required less energy to crystallize and more energy to fuse the polymer.
The increase in fusion enthalpy (ΔHm) may be related to the presence of more perfect or larger crystals in the PBAT structure, for this to happen, the OO could act to facilitate the mobility and the packaging of polymeric chains, thus increasing the degree of crystallinity and ΔH m [26]
The degradation temperatures of all samples occurred in a single step with marked mass loss and that can be observed in Figure 3. The presence of OO did not alter PBAT degradation temperatures.
The values for the initial degradation temperatures (Tonset), final degradation temperature (Tendset), maximum degradation temperature (Tdeg.max.), and residue are displayed in Table 3
The degradation temperature of PBAT is in the range of 355-440 ºC[6], can be observed that temperatures (Tonset, Tendset, and Tdeg.max) there was no noticeable variation in thermal stability, regardless of the concentration of oil added to the samples.
Andrade,
Polímeros, 33(2), e20230017, 2023 4/8
M. F., Silva, I. D. L., Caetano, V. F., Silva, G. A., Moraes Filho, L. E. P. T., Almeida, Y. M. B., & Vinhas, G. M.
Figure 2. PC1 x PC2 Score Charts for pure PBAT (P) films and PBAT films additivated with 5%, 10%, and 15% OO.
Sample Cooling 2nd Heating T c ΔH c X c Tf ΔH m X c (°C) (J/g) (%) (°C) (J/g) (%) PBAT 80.03 10.11 8.87 122.82 7.77 6.82 PBAT5 79.51 10.97 9.62 122.73 9.15 8.03 PBAT10 78.99 12.31 10.80 122.85 9.43 8.27 PBAT15 80.53 12.15 10.66 122.99 8.72 7.65
Table 2. Thermal properties by DSC of PBAT, PBAT5, PBAT10, and PBAT15 films.
Active antimicrobial extruded films for mozzarella cheese from poly (butylene adipate co-terephthalate) (PBAT) and orange oil
In addition, PBAT does not change its structure at processing temperatures below 200 °C[27]. Therefore, the production of the film in an extruder at 180 °C as the processing temperature did not alter the thermal properties of the polymer.
Activation energy is related to the necessary energy to start a reaction. In this case, the degradation reaction. As can be observed, the samples PBAT5 and PBAT10 presented higher Ea when compared to PBAT, hence, it is necessary for more energy for the degradation process to begin. On the other hand, the sample PBAT15 presented lower activation energy when compared to PBAT, indicating that higher OO concentrations favor the degradation process of PBAT.
3.6 Water Vapor Permeability (WVP)
The WVP measures the transport of moisture across the film. This is a crucial parameter for the lifespan of a product. Films that present high permeability may have their application on fresh vegetables, while films with low permeability may be used for dehydrated products. WVP and WVTR may be observed in Table 4
It is possible to observe that films with the addition of OO presented a slower WVTR when compared to PBAT. Films with 10 and 15% OO presented a significant (p ≤ 0.05) reduction in WVTR. It is important mentioning that WVTR does not take into account film thickness, but only moisture absorption as a function of time.
For the WVP, there was a significant increase in film permeability. This behavior may be related to the increase in free volume within the polymeric matrix due to the interaction between the additive molecule and the polymeric chain[28].
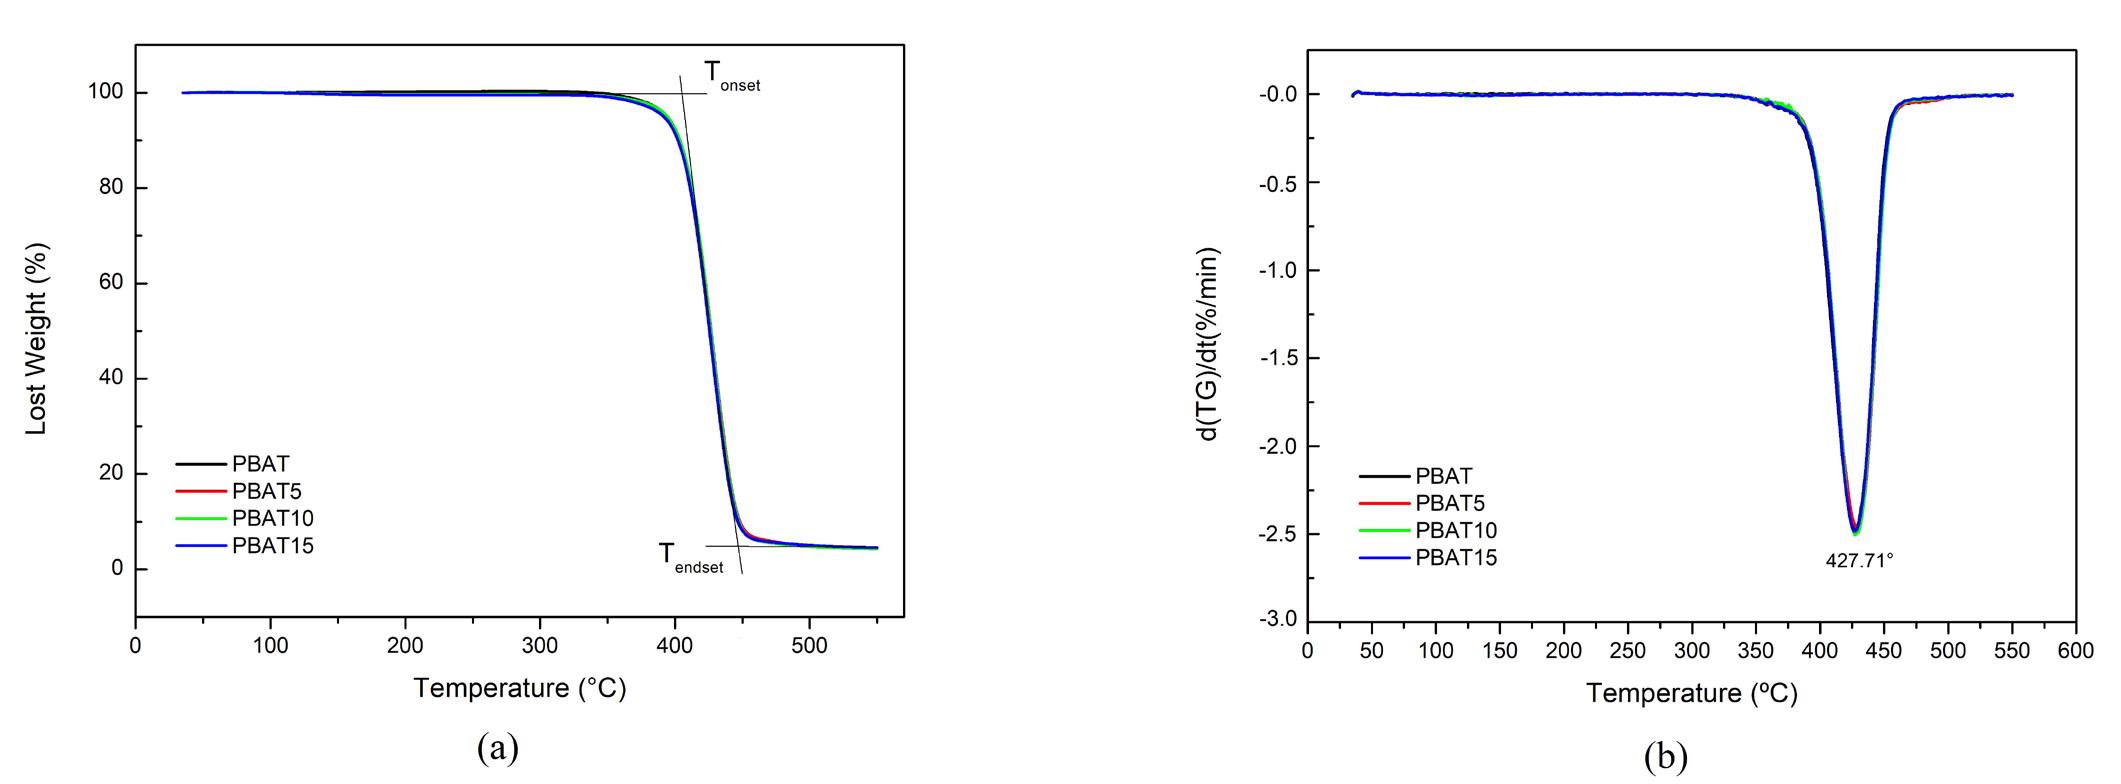
Therefore, it appears that although films with OO present a lower rate of water absorption over time (WVTR), more water is absorbed by the polymeric chain throughout the test due to the greater thickness of the film, providing an increase in the permeability (WVP) of the films containing OO in relation to the PBAT film.
Overall, it is possible to observe that because of the absence of cracks or visible tears on the surface, water crosses the films through diffusion, moving within the empty spaces present in the polymeric structure.
Polímeros, 33(2), e20230017, 2023 5/8
Figure 3. (a) TGA and (b) DTG curves from PBAT, PBAT5, PBAT10, and PBAT15.
Sample T onset Tendset Tdeg.max Residue E a (°C) (°C) (°C) (%) (kJ/mol) PBAT 401 446 427 4.48 576.31 PBAT5 399 449 428 4.45 593.61 PBAT10 398 449 427 4.31 597.39 PBAT15 399 446 428 4.56 569.08
Table 3. Degradation temperatures for PBAT, PBAT5, PBAT10 and PBAT15 samples.
Sample Thickness WVTR WVP (mm) (g/h.m2) (g/h.m.Pa) x 107 PBAT 0.185c ± 0.002 7.43a ± 1.72 5.79c ± 0.47 PBAT5 0.217c,b ± 0.078 7.05a ± 2.07 7.20a ± 0.50 PBAT10 0.231b ± 0.004 6.58b ± 1.65 6.49b ± 0.48 PBAT15 0.280a ± 0.002 5.91c ± 1.74 7.00a ± 0.32
Table 4. WVTR and WVP for PBAT films additivated with OO.
*Equal letters in the same column indicate that they are not significantly different by the Duncan Test (p≤0.05).
3.7 Thickness and mechanical tensile test
The results of the thicknesses obtained for the extruded films can be observed in Table 5
It is possible to see that the addition of the oil caused an increase in the thickness of the films as the oil concentration was increased.
This behavior observed for the thickness may be related to the increase in free volume caused by the interaction of oil in the polymer matrix, which will favor a greater spacing between the chains and, consequently, an increase in thickness.
As Kurt and Kahyaoglu[29] affirm, changes in film thicknesses can modify important characteristics such as permeability, transparency, and mechanical properties
From the results shown in Table 5, there was a significant increase in the tension at rupture for films with 10% and 15% OO and a reduction for films with 5% OO. The elongation increased with the addition of the oil This increase is more significant with the concentration of 10% and 15%. The module did not show linear behavior, as its values decreased in films with 5% and 15% OO and increased significantly in films with 10%.
The increase in tensile strength of films with 10% and 15%OO may be related to the possibility of a structural rearrangement in the polymer matrix caused by the addition of oil, promoting an increase in traction properties[30]
This increase in elongation may be related to the reduction in the aggregation of polymer chains due to the presence of oil, which facilitates the sliding of chains during stretching[31]. The values observed for elongation had greater variations than the results obtained from the stress. According to other studies, the elongation of the material suffers greater interferences when compared with tension[32]
An increase in the value of the module for the concentration of 10% is in accordance with the results observed for the degree of crystallinity, in which it was found that 10% presented an Xc higher than the other concentrations, making the film more rigid. Therefore, it can be emphasized that the concentration of 10% OO was the one that caused the greatest changes in the final physical characteristics of PBAT.
All samples have higher mechanical strength than low-density polyethylene (6.9-16 MPa)[28]. The results presented for the films were superior for all samples analyzed, allowing their use as packages that support high stresses.
3.8 Application of PBAT15 film as packaging for mozzarella cheese
The microbiological growth of the film/cheese system using the dilution of 10-4 CFU (colony forming units) for E. coli. and film with 15% OO can be observed in Figure 4
Analyzing the data from Figure 4, it was verified that the PBAT15 film caused a reduction in microbial growth in the first 6 days of freezer storage. In the first 6 days, there was a reduction of about 65% of the microbial growth of E. coli on the surface of mozzarella cheese, although, in the following days, 9 and 13, microorganisms would grow again, but more slowly and with a reduction of about 28% compared to the beginning of the test. These results confirm its antimicrobial potential for application in active packaging for use in mozzarella cheese.

For the PBAT film, it is observed that there was mitigation in microbial growth, which was approximately 20% on days 6 and 9. The contact of PBAT with the surface of the cheese may have chemically modified this surface, such as reducing moisture, making microbial proliferation slower.
According to Sung et al.[33] the vast majority of the extracts and/or oils extracted from plants have a high sensitivity to film processing conditions. This is because, when subjected to certain temperature and pressure conditions, antimicrobials can evaporate in an accelerated manner.
In addition, the interactions that can occur both between the polymer matrix and the additive and between the additive and the composition of the food can alter the efficiency of the active packaging[34]. Among these factors are: pH, presence of moisture, fat, protein content, additives, solutions, storage temperature, and composition of the atmosphere[35].
*Equal letters in the same column indicate that they are not significantly different by the Duncan Test (p≤0.05).
Andrade, M.
I. D.
M. Polímeros, 33(2), e20230017, 2023 6/8
F., Silva,
L., Caetano, V. F., Silva, G. A., Moraes Filho, L. E. P. T., Almeida, Y. M. B., & Vinhas, G.
Samples Thickness Tension at break Elongation at break Elastic module (mm) (MPa) (%) (MPa) PBAT 0.185c± 0.002 32.16c ± 0.72 950.90c ± 21.46 68.11b ± 2.07 PBAT5 0.217b,c± 0.078 27.83d ± 1.05 955.78c ± 17.81 66.01b,c ± 1.24 PBAT10 0.231b ± 0.004 33.99b ± 1.38 1073.40b ± 24.87 74.75a ± 1.96 PBAT15 0.280a ± 0.002 35.68a ± 0.80 1177.6a ± 18.91 63.42c ± 2.39
Table 5. Thickness and Mechanical Properties of PBAT, PBAT5, PBAT10, and PBAT15.
Figure 4. Percentage of microbial growth reduction as a function of storage days for PBAT and PBAT15 films.
Active antimicrobial extruded films for mozzarella cheese from poly (butylene adipate co-terephthalate) (PBAT) and orange oil
4. Conclusions
It was possible to produce films from PBAT and orange essential oil by extrusion and confirmed the incorporation of the oil in the polymeric matrix. The films remained resistant enabling their use as packaging. Thus, it can be concluded that there was incorporation and migration of orange oil from the polymer matrix, confirming its potential as an active packaging for food.
5. Author’s Contribution
• Conceptualization – Michelle Félix de Andrade; Gloria Maria Vinhas.
• Data curation – Michelle Félix de Andrade; Ivo Diego de Lima Silva; Viviane Fonseca Caetano.
• Formal analysis – Michelle Félix de Andrade.
• Funding acquisition - Yêda Medeiros Bastos de Almeida; Glória Maria Vinhas.
• Investigation – Michelle Félix de Andrade; Ivo Diego de Lima Silva.
• Methodology – Michelle Félix de Andrade; Gisely Alves da Silva; Viviane Fonseca Caetano.
• Project administration – Michelle Félix de Andrade; Yêda Medeiros Bastos de Almeida; Glória Maria Vinhas.
• Resources – Yêda Medeiros Bastos de Almeida; Glória Maria Vinhas.
• Software – Luíz Emílio Pessoa Timeni de Moraes Filho.
• Supervision – Yêda Medeiros Bastos de Almeida; Glória Maria Vinhas.
• Validation – NA.
• Visualization – NA.
• Writing – original draft – Michelle Félix de Andrade.
• Writing – review & editing – Michelle Félix de Andrade; Luiz Emílio Pessoa Timeni de Moraes Filho.
6. Acknowledgements
This work was supported by the CNPq - National Council for Scientific and Technological Development (158667/2018-2) and FACEPE - Foundation for Support of Science and Technology of the State of Pernambuco (BFP-0151-3.06/20).
7. References
1. Siracusa, V., & Lotti, N. (2019). Intelligent packaging to improve shelf life. In C. M. Galanakis (Ed.), Food quality and shelf life (pp. 261-279). UK: Academic Press http://dx.doi. org/10.1016/B978-0-12-817190-5.00008-2
2 Khumkomgool, A., Saneluksana, T., & Harnkarnsujarit, N. (2020). Active meat packaging from thermoplastic cassava starch containing sappan and cinnamon herbal extracts via LLDPE blown-film extrusion. Food Packaging and Shelf Life, 26, 100557 http://dx.doi.org/10.1016/j.fpsl.2020.100557
3 Gaglio, R., Botta, L., Garofalo, G., Miceli, A., Settanni, L., & Lopresti, F. (2021). Carvacrol activated biopolymeric foam: an effective packaging system to control the development of spoilage and pathogenic bacteria on sliced pumpkin and melon.
Food Packaging and Shelf Life, 28, 100633 http://dx.doi. org/10.1016/j.fpsl.2021.100633
4 Costa, R. C., Daitx, T. S., Mauler, R. S. , Silva, N. M. , Miotto , M. , Crespo , J. S. , & Carli , L. N. (2020 ). Poly (hydroxybutyrate-co-hydroxyvalerate)-based nanocomposites for antimicrobial active food packaging containing oregano essential oil. Food Packaging and Shelf Life, 26, 100602 http://dx.doi.org/10.1016/j.fpsl.2020.100602
5 Razola-Díaz, M. D., Guerra-Hernández, E. J., García-Villanova, B., & Verardo, V. (2021). Recent developments in extraction and encapsulation techniques of orange essential oil. Food Chemistry, 354, 129575 http://dx.doi.org/10.1016/j. foodchem.2021.129575. PMid:33761335.
6 Campos, S. S., Oliveira, A., Moreira, T. F. M., Silva, T. B. V., Silva, M. V., Pinto, A. J., Bilck, A. P., Gonçalves, O. H., Fernandes, I. P., Barreiro, M.-F., Yamashita, F., Valderrama, P., Shirai, M. Y., & Leimann, F. B. (2019). TPCS/PBAT blown extruded films added with curcumin as a technological approach for active packaging materials. Food Packaging and Shelf Life, 22, 100424 http://dx.doi.org/10.1016/j.fpsl.2019.100424
7 . Shankar, S., & Rhim, J.-W. (2016). Tocopherol-mediated synthesis of silver nanoparticles and preparation of antimicrobial PBAT/ silver nanoparticles composite films. Lebensmittel-Wissenschaft + Technologie, 72, 149-156 http://dx.doi.org/10.1016/j. lwt.2016.04.054
8. Nibir, Y. M., Sumit, A. F., Akhand, A. A., Ahsan, N., & Hossain, M. S. (2017). Comparative assessment of total polyphenols, antioxidant and antimicrobial activity of different tea varieties of Bangladesh. Asian Pacific Journal of Tropical Biomedicine, 7(4), 352-357 http://dx.doi.org/10.1016/j.apjtb.2017.01.005
9 Arrieta, M. P., López, J., Ferrándiz, S., & Peltzer, M. A. (2013). Characterization of PLA-limonene blends for food packaging applications. Polymer Testing, 32(4), 760-768 http://dx.doi. org/10.1016/j.polymertesting.2013.03.016
10 Han, J. H., & Floros, J. D. (1997). Casting antimicrobial packaging films and measuring their physical properties and antimicrobial activity. Journal of Plastic Film & Sheeting, 13(4), 287-298 http://dx.doi.org/10.1177/875608799701300405
11 Dias, M. V., Medeiros, H. S., Soares, N. F. F., Melo, N. R., Borges, S. V., Carneiro, J. D. S., & Pereira, J. M. T. A. K. (2013). Development of low-density polyethylene films with lemon aroma. Lebensmittel-Wissenschaft + Technologie, 50(1), 167-171 http://dx.doi.org/10.1016/j.lwt.2012.06.005
12 Petrov, O. V., Lang, J., & Vogel, M. (2021). Exploring the potential of PCA-based quantitation of NMR signals in T1 relaxometry. Journal of Magnetic Resonance (San Diego, Calif.), 326, 106965 http://dx.doi.org/10.1016/j.jmr.2021.106965 PMid:33774383.
13 Chivrac, F., Kadlecová, Z., Pollet, E., & Avérous, L. (2006). Aromatic copolyester-based nano-biocomposites: elaboration, structural characterization and properties. Journal of Polymers and the Environment, 14(4), 393-401 http://dx.doi.org/10.1007/ s10924-006-0033-4.
14 American Society for Testing and Materials – ASTM. (2010). ASTM D882-10: standard test method for tensile properties of thin plastic sheeting West Conshohocken: ASTM
15 Dannenberg, G. S., Funck, G. D., Cruxen, C. E. S., Marques, J. L., Silva, W. P., & Fiorentini, A. M. (2017). Essential oil from pink pepper as an antimicrobial component in cellulose acetate film: potential for application as active packaging for sliced cheese. Lebensmittel-Wissenschaft + Technologie, 81, 314-318 http://dx.doi.org/10.1016/j.lwt.2017.04.002
16 Alehosseini, E., Jafari, S. M., & Tabarestani, H. S. (2021). Production of D-limonene-loaded Pickering emulsions stabilized by chitosan nanoparticles. Food Chemistry, 354, 129591. http://dx.doi.org/10.1016/j.foodchem.2021.129591. PMid:33756315.
Polímeros, 33(2), e20230017, 2023 7/8
17 Vieira, A. J., Beserra, F. P., Souza, M. C., Totti, B. M., & Rozza, A. L. (2018). Limonene: aroma of innovation in health and disease. Chemico-Biological Interactions, 283, 97-106 http://dx.doi.org/10.1016/j.cbi.2018.02.007 PMid:29427589.
18 Clinical and Laboratory Standards Institute – CLSI. (2018). M02 - Performance Standards for Antimicrobial Disk Susceptibility Tests USA: CLSI
19 Greay, S. J., & Hammer, K. A. (2015). Recent developments in the bioactivity of mono- and diterpenes: anticancer and antimicrobial activity. Phytochemistry Reviews, 14(1), 1-6 http://dx.doi.org/10.1007/s11101-011-9212-6
20 Limpan, N., Prodpran, T., Benjakul, S., & Prasarpran, S. (2010). Properties of biodegradable blend films based on fish myofibrillar protein and polyvinyl alcohol as influenced by blend composition and pH level. Journal of Food Engineering, 100(1), 85-92 http://dx.doi.org/10.1016/j.jfoodeng.2010.03.031
21 Atarés, L., Pérez-Masiá, R., & Chiralt, A. (2011). The role of some antioxidants in the HPMC film properties and lipid protection in coated toasted almonds. Journal of Food Engineering, 104(4), 649-656 http://dx.doi.org/10.1016/j. jfoodeng.2011.02.005
22 Adilah, A. N., Jamilah, B., Noranizan, M. A., & Hanani, Z. A. N. (2018). Utilization of mango peel extracts on the biodegradable films for active packaging. Food Packaging and Shelf Life, 16, 1-7 http://dx.doi.org/10.1016/j.fpsl.2018.01.006
23 Mallardo, S., De Vito, V., Malinconico, M., Volpe, M. G., Santagata, G., & Di Lorenzo, M. L. (2016). Poly (butylene succinate)-based composites containing b -cyclodextrin / D -limonene inclusion complex. European Polymer Journal, 79, 82-96 http://dx.doi.org/10.1016/j.eurpolymj.2016.04.024
24 Kijchavengkul, T., Auras, R., Rubino, M., Alvarado, E., Montero, J. R. C., & Rosales, J. M. (2010). Atmospheric and soil degradation of aliphatic-aromatic polyester films. Polymer Degradation & Stability, 95(2), 99-107. http://dx.doi. org/10.1016/j.polymdegradstab.2009.11.048
25 Shahlari, M., & Lee, S. (2012). Mechanical and morphological properties of poly (butylene adipate-co-terephthalate) and Poly (lactic acid) blended with organically modified silicate layers. Polymer Engineering and Science, 52(7), 1420-1428 http://dx.doi.org/10.1002/pen.23082
26 Göksen, G., Fabra, M. J., Pérez-Cataluña, A., Ekiz, H. I., Sanchez, G., & López-Rubio, A. (2021). Biodegradable active food packaging structures based on hybrid cross-linked electrospun polyvinyl alcohol fibers containing essential oils and their application in the preservation of chicken breast fillets. Food Packaging and Shelf Life, 27, 100613 http://dx.doi.org/10.1016/j.fpsl.2020.100613.
27 Al-Itry, R., Lamnawar, K., & Maazouz, A. (2012). Improvement of thermal stability, rheological and mechanical properties of PLA, PBAT and their blends by reactive extrusion with functionalized epoxy. Polymer Degradation & Stability, 97(10), 1898-1914 http://dx.doi.org/10.1016/j.polymdegradstab.2012.06.028.
28 Gao, S., Zhai, X., Wang, W., Zhang, R., Hou, H., & Lim, L. (2022). Material properties and antimicrobial activities of starch/PBAT composite films incorporated with ε-polylysine hydrochloride prepared by extrusion blowing. Food Packaging and Shelf Life, 32, 100831 http://dx.doi.org/10.1016/j.fpsl.2022.100831
29 Kurt, A., & Kahyaoglu, T. (2014). Characterization of a new biodegradable ediblefilm made from salep glucomannan. Carbohydrate Polymers, 104, 50-58. http://dx.doi.org/10.1016/j. carbpol.2014.01.003 PMid:24607159.
30 Atarés, L., & Chiralt, A. (2016). Essential oils as additives in biodegradable films and coatings for active food packaging. Trends in Food Science & Technology, 48, 51-62 http://dx.doi. org/10.1016/j.tifs.2015.12.001
31 Bonilla, J., Atarés, L., Vargas, M., & Chiralt, A. (2012). Effect of essential oils and homogenization conditions on properties of chitosan-based films. Food Hydrocolloids, 26(1), 9-16. http://dx.doi.org/10.1016/j.foodhyd.2011.03.015
32 Oliveira, V. M., Ortiz, A. V., Del Mastro, N. L., & Moura, E. A. B. (2009). The influence of electron-beam irradiation on some mechanical properties of commercial multilayer flexible packaging materials. Radiation Physics and Chemistry, 78(7-8), 553-555 http://dx.doi.org/10.1016/j.radphyschem.2009.03.041
33 Sung, S., Sin, L. T., Tee, T., Bee, S., & Rahmat, A. R. (2014). Effects of Allium sativum essence oil as antimicrobial agent for food packaging plastic film. Innovative Food Science & Emerging Technologies, 26, 406-414 http://dx.doi.org/10.1016/j. ifset.2014.05.009
34 Gómez-Estaca, J., López de Lacey, A., López-Caballero, M. E., Gómez-Guillén, M. C., & Montero, P. (2010). Biodegradable gelatin-chitosan films incorporated with essential oils as antimicrobial agents for fish preservation. Food Microbiology, 27(7), 889-896 http://dx.doi.org/10.1016/j.fm.2010.05.012. PMid:20688230.
35 Otero, V., Becerril, R., Santos, J. A., Rodríguez-Calleja, J. M., Nerín, C., & García-López, M.-L. (2014). Evaluation of two antimicrobial packaging fi lms against Escherichia coli O157: H7 strains in vitro and during storage of a Spanish ripened sheep cheese (Zamorano). Food Control, 42, 296-302. http://dx.doi.org/10.1016/j.foodcont.2014.02.022
Received: Dec. 05, 2022
Revised: May 04, 2023
Accepted: June 06, 2023
Polímeros, 33(2), e20230017, 2023 8/8
Andrade, M. F., Silva, I. D. L., Caetano, V. F., Silva, G. A., Moraes Filho, L. E. P. T., Almeida, Y. M. B., & Vinhas, G. M.
Thermal and flammability behavior of walnut shell reinforced epoxy composites
Menderes Koyunucu1 and Göksel Ulay2*
1Department of Textile, Van Vocational School, Van Yuzuncu Yil University, Van, Türkiye
2Department of Material and Material Processing Technology, Van Yuzuncu Yil University, Van, Türkiye *gokselulay@gmail.com
Obstract
In this study, walnut shell particles obtained through the grinding of walnut shells were used as a reinforcing material and pumice powder as a filler for developing epoxy-based composites characterized by reduced flammability. Thermogravimetric analysis (TGA), Differential scanning calorimetry (DSC), and Underwriters Laboratories (UL)-94 vertical tests were carried out for evaluating the effectiveness of these pumice powder treatments. Under the UL-94 vertical test, composites (S1, S2, S3, S4, S5 and S6) with 20% pumice powder (i.e., by mass content of walnut particles were not self-extinguished, and could not be classified. S7 and S8 composites (40wt% and 50%) assigned a V-2 rating, which was the least flammable composite However, the mechanical tensile tests showed that the pumice powder treated composites increased their tensile strength. The morphological analysis showed an enhancement of the interfacial adhesion of the composites achieved by pumice powder.
Keywords: thermal properties, walnut particles, pumice, tensile strength, flammability.
How to cite: Koyunucu, M., & Ulay, G. (2023). Thermal and flammability behavior of walnut shell reinforced epoxy composites. Polímeros: Ciência e Tecnologia, 33(2), e20230018. https://doi.org/10.1590/0104-1428.20230018
1. Introduction
With growing environmental awareness, ecological concerns and new legislation, bio-particle reinforced plastic composites have received increasing attention. The important aspect that has impacted favorably on the development of green composite materials is the possibility of incorporating waste agro-waste such as stalks, cereal crops, rice husks, coconut fibers, bagasse, maize cobs, peanut shells, and other wastes product and recycled plastics with the advantage of a positive eco-environmental impact. Due to a worldwide shortage of trees and environmental awareness, research on the development of composite materials using various waste materials is being actively[1]
Walnut (Juglans regia L.) is an important crop that is cultivated throughout the world’s temperate regions for its edible nuts. Because walnut shell comprises 67% of the total weight of the walnut kernel, 1.5 million tons of walnut shell is left behind each year all over the world. The stone cell of high lignification is the main characteristic of the microstructure of the walnut shell[2]. Several investigators studied different properties of polymer composites using these reinforcements[3]. By Singh[1] studied physicomechanical characterization and thermal property evaluation of filled with polyester composites walnut shell powder. They prepared the walnut shell based particles reinforced composite materials and also investigated the mechanical behavior of the composite.
Because reinforcement alone does not fulfill the required properties for the applications of composites, a
suitable filler is sometimes required to achieve the desired properties. Artificial and natural fillers are used with polymeric matrix composites. Pumice is one of the important natural fillers. Among them, pumice is one of the volcanic based alumina silica, which is composed of 60% of SiO2 The porous structure of pumice is formed by dissolved gases precipitated during the cooling of lava[4]. Due to its porous structure, it has low density, high thermal insulation, and chemical resistance, which makes it a preferential material for industrial applications. Moreover, pumice powder has a high-temperature resistance and chemical resistance[5]. Pumice powder is cheaper than most traditional particle fillers. The use of pumice powders as a reinforcing material in composites has not been studied in detail in the literature, but there is an increasing trend in using pumice powder as a filler material in composite applications[6].
Sever et al.[5] investigated the effect of pumice powder on the mechanical and thermal properties of PP. Ramesan et al.[7] stated the role of pumice particles in the thermal, electrical, and mechanical properties of poly(vinyl alcohol)/poly(vinyl pyrrolidone) composites. Sahin et al.[6] demonstrated that pumice powder-filled PPS composites can successfully attain mechanical and thermal properties[8]. Montava-Jordá et al.[9] investigated the enhanced interfacial adhesion of polylactide/ Poly(ε-caprolactone)/walnut shell flour composites by reactive extrusion with maleinized linseed oil. From an extensive literature survey, many researchers used the walnut shell as a reinforcement, and pumice powder as a filler for
https://doi.org/10.1590/0104-1428.20230018 O O O O O O O O O O O O O O O Polímeros, 33(2), e20230018, 2023 ISSN 1678-5169 (Online) 1/6
manufacturing composite. It was observed that the filled with pumice powder of natural reinforcement in the composites improves the adhesion between the epoxy/walnut shell and pumice surfaces, resulting in the mechanical anchoring of the blend on the porous structure of the pumice powder. The present developed composite materials containing different walnut particle sizes as the reinforced materials and investigate the tensile strength, thermal, and flammability behavior of composites.
2. Materials and Methods
Purpox® epoxy resin EFLR-0190 (Polikor Inc., Bursa, Turkey) was used as matrix material, which is a solvent free resin with a transparent coating. The density of this resin was 1.00 to 1.10 g/cm3, the while the viscosity was 300,500 mPa.s. The epoxy resin and hardener were mixed at a weight ratio of 100:50 to produce the composite materials. Composites with 20 wt.%, of pumice powder component were made of all 3 fractions, and %40 -50% wt of pumice powder was made of the 630 μm (Table 1). The preparatory work included separating 400 g of walnut husk particles on a sieve shaker (The Mortar Grinder RM-200 Microtrac Retsch GMBH, (Haan, Germany) for 10 min. The sieve stack was composed of 3 sieves, and their mesh sizes were 1000, 630, and 250 μm from the top to the bottom, respectively.
2.1 Manufacturing of composites
The composite samples were made using 100 wt.% of 1000 μm walnut shell, 100 wt.% of 630 μm walnut shell, and 250 μm walnut shell as well as 80 wt.% walnut particles and 20 wt%40 wt and 50wt% pumice powder proportions and the matrix employing the hand lay-up technique. A metal mold (per ASTM D3039[10] and UL 94[11] was used for composite fabrication.The inner surface of the metal mold was treated with a stripping agent (Polivaks SV-6, İzmir, Turkey) to facilitate easy removal of the samples after fabrication. The slurry was poured into the metal mold; care was taken so that no gaps or air bubbles were formed. A small roller was used during the fabrication process to spread the resin and reinforcement uniformly so that the mold was devoid of voids and agglomeration. The contents of the mold were cured at room temperature for 48 h and then removed from mold for the tests paragraph within a first subsection.
2.2 Tensile test
Composites were subjected to tensile strength tests using a universal testing machine (model BMT 100E, Besmak, Ankara, Turkey). Ten samples of each material were evaluated according to the ASTM D3039[10] standard. The tests were conducted at a crosshead speed of 2mm/min with a 100 kN load cell.
2.3 Flammability (vertical burning) test
The flammability test based on UL- 94[11] was applied to evaluate the fire performance of the materials. The UL- 94 test results are classified by burning rating V-0, V1, or V2; the V-0 rating represents the best flame retardant of polymeric materials. Vertical tests are more rigorous than horizontal burning tests because the vertical specimens are burnt by their lower ends[12-14]. The ignition resistance was investigated at conditioning parameters of 23 ± 2°C, 50 ± 5% relative humidity (RH), for greater than 48 h. The dimensions of the sample were 125 mm x 13 mm x 13 mm for the length, width, and thickness, respectively, according to the UL-94 (2001) standard. Based on the outcome, the samples were categorized as V-0/V-1/V-2 or No Rating (NR)/NC (No Classification). Five samples were tested for each combination and reported.
2.4 Scanning Electron Microscopy (SEM)
A HITACHI TM3030 EDX-BSE (Tokyo, Japan) SEM instrument was employed to examine the topography of the broken surfaces of the composites after tensile testing.
2.5 Thermogravimetry Analysis (TGA)
The thermal stability of walnut shell/epoxy composites and walnut-pumice/epoxy composites was characterized using a thermogravimetric analyzer (SDTQ600, TA, New Castle, USA) at a heating rate of 20 °C/min under Nitrogen (N2) atmosphere from 20 to 900 °C, with, samples with of 10 to 11 mg.
2.6 Differential Scanning Calorimetry (DSC)
A DSC Q2000 (TA, New Castle, USA) instrument with aluminum sample pan was used with an nitrogen (N2) atmosphere with a heating rate of 100°C/min. The pumice powder filled walnut shell/ epoxy composites walnut
Koyunucu,
Polímeros, 33(2), e20230018, 2023 2/6
M., & Ulay, G.
Samples Codes Sieve mesh size of walnut shell (μm) Walnut shell particles content (wt%) Filler content (wt%) Type of filler Sieve mesh size of pumice powder (μm) S1 250 100 - -S2 630 100 - -S3 1000 100 S4 250 80 20 Pumice powder < 250 S5 630 80 20 Pumice powder < 250 S6 1000 80 20 Pumice powder < 250 S7 630 60 40 Pumice powder < 250 S8 630 50 50 Pumice powder < 250
Table 1. Composition of walnut husk particles with pumice powder.
Thermal and flammability behavior of walnut shell reinforced epoxy composites
shell/epoxy composites specimens of 5 to 7 mg were scanned over a temperature ranging from 10 to 300°C.
3. Results and Discussions
3.1 Flammability test results
Samples ignition resistance was investigated under a UL-94 vertical burning test. UL 94 vertical is a ranking measurement of the self-extinguishing time of a polymer or reinforced polymer composite The test results are presented in Table 2. The pumice powder is the as it is not sufficient till 20 wt% to reach any V-class. The effect of increasing the wt % pumice powder ratio on UL94 results is promising and the V-2 rating is satisfied except for the sample of 20wt%. During the burning test, after-glowing was observed for all 20wt % samples, and samples were flammable. Thus, all 20wt % pumice powder added specimens failed the vertical burning test. Even though no UL rating was observed for Pumice powder 20wt% the presence of pumice powder of 40wt % and 50% significantly decreased the combustion rate of the specimen. Similarly, studies were also observed[15-17].
3.2 Tensile strength results
Comparisons of tensile strengths of
the composites
samples are given in Figure 1. The addition of pumice powder as a filler material to the S4, S5, S6, S7 and S8 composite increased tensile strength compared with the control (S1, S2, and S3) samples. The maximum tensile strength was reached in the S8 sample. This may be attributed to the presence of pores of the walnut shell (630 μm particle size) that provide good adsorption capacity for resin,and due to the excellent dispersion of 630 μm particle size larger surface area, and intermolecular interactions between the filler/matrix, which results in stronger bonding between walnut shell particles size and epoxy matrix to improve composite mechanical properties. The low tensile strengths were obtained for the S1 composites according to the other samples. This result can be explained by the walnut shell containing a lower amount of hygroscopic material like cellulose/hemicellulose and a higher amount of hydrophilic material such as lignin. As WSP contains a high amount of lignin this may be the reason behind the decrease in tensile strength of the composites[3], or from the proportion between

the particle size and the surface area, which allows obtaining bad dispersion of the filler as well as unproper saturation by the epoxy resin increase in the matrix cross-linking[18] As shown in Figure 1, the tensile strength was found to be low for the composite (S3). This may be attributed to the formation of a fragile surface between the epoxy and pumice powder/ walnut shell size, or poor interface between the epoxy and the pumice powder. As a result, the deterioration of tensile strength properties can be expected, as noted by others[19-22].
3.3 Scanning electron microscopy
The SEM micrographs of the tensile fracture surface of the composites (Figure 2). The micrographs (Figure 2a) show that the walnut particles were not completely covered with the resin. Voids were found on the surface, and their surface was rough to various degrees. Surface roughness impedes its proper wetting by the walnut sheel matrix in the course of processing, thereby contributing to the formation of voids at the interface. This result indicates poor interfacial interactions between the walnut shell and epoxy matrix. SEM images of samples added with 20, 40, and 50 wt.% of pumice powder are given in Figure (b–d). Figure 2c and 2d show a few matrix voids and walnut shell particle pullouts at the tensile fractured surface. At 20, 40, and 50 wt.% pumice powder was uniformly distributed in the matrix and placed between walnut shell and matrix to stop the micro-crack propagation during experiments. Also, in all these SEM images (Figure 2), one can observe that
Polímeros, 33(2), e20230018, 2023 3/6
Samples Code Combustion up to
(specimens completely burned) Cotton ignited Rating S1 Yes Yes NR S2 Yes Yes NR S3 Yes Yes NR S4 Yes Yes NR S5 Yes Yes NR S6 Yes Yes NR S7 No No V-2 S8 No No V-2 NR (No Rating).
Table 2. Burning Criteria for UL-94[11]. Vertical Rating.
holding clamp
Figure 1. The tensile strengths of the composites.
the walnut shell particles were relatively well distributed in the pumice and epoxy, which in turn could support an increase in tensile strength properties at an appreciable level.
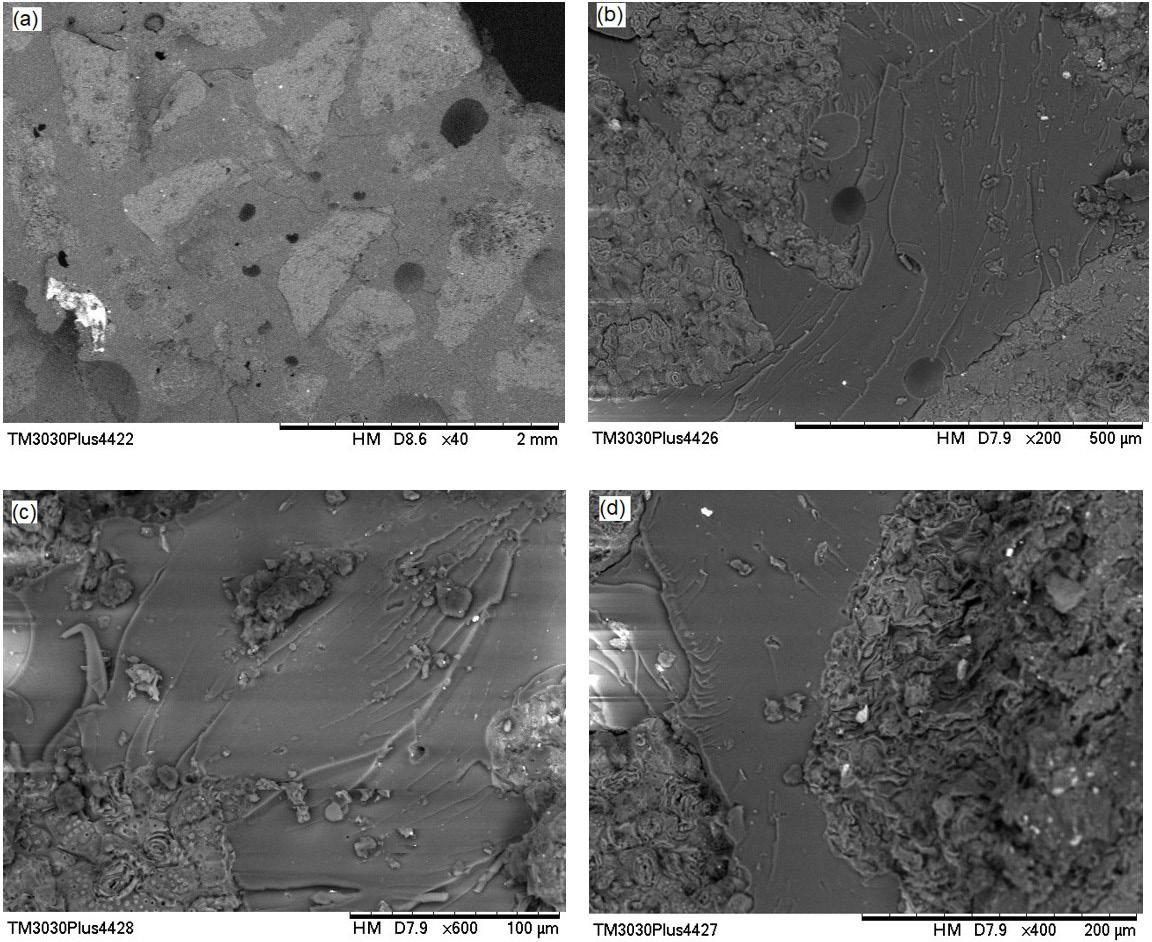
3.4 Differential scanning calorimetry
The DSC curve of unfilled and filled composites are presented in Figure 3. the unfilled samples (S2) are two endothermic peaks were observed at 52 °C, to 92 °C respectively. The first endothermic peak at 52°C illustrates the glass trasition temperature (Tg) of composite. The second endothermic peak, at 92°C shows the crystallization peak of the composite. The filled sample (S8) three endothermic peaks were observed at approximately 100°C, and 155°C, and 262 °C respectively. The first endothermic peak was observed at a peak of 103 °C, the peak corresponds to the crystallization peak of the composites. Successively, the other two endothermic peaks, one at 155°C and the other at 262°C, correspond to the decomposition. content. The pumice powder-filled composite was found to have higher crystallization peak temperatures than the unfilled composite. This result shows that the walnut shell particles and pumice powder act as nucleating agents, which increases the crystallization temperature of the composite. A similar study was also observed[2]. According to results obtained from DSC analyses to that the thermal stability of the composite was increased with increased filler.
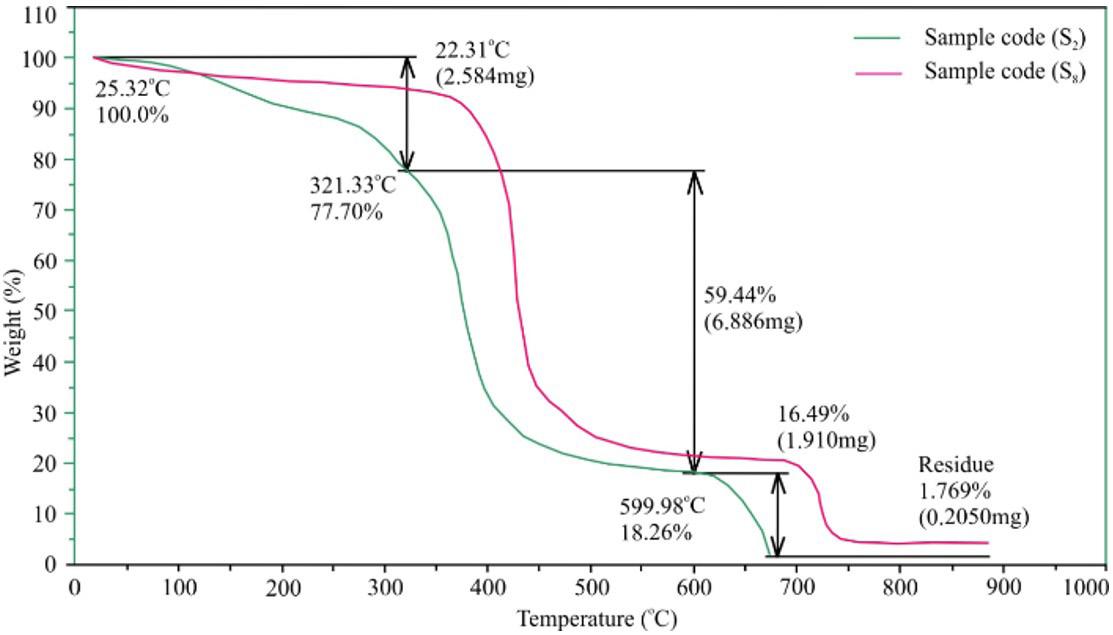
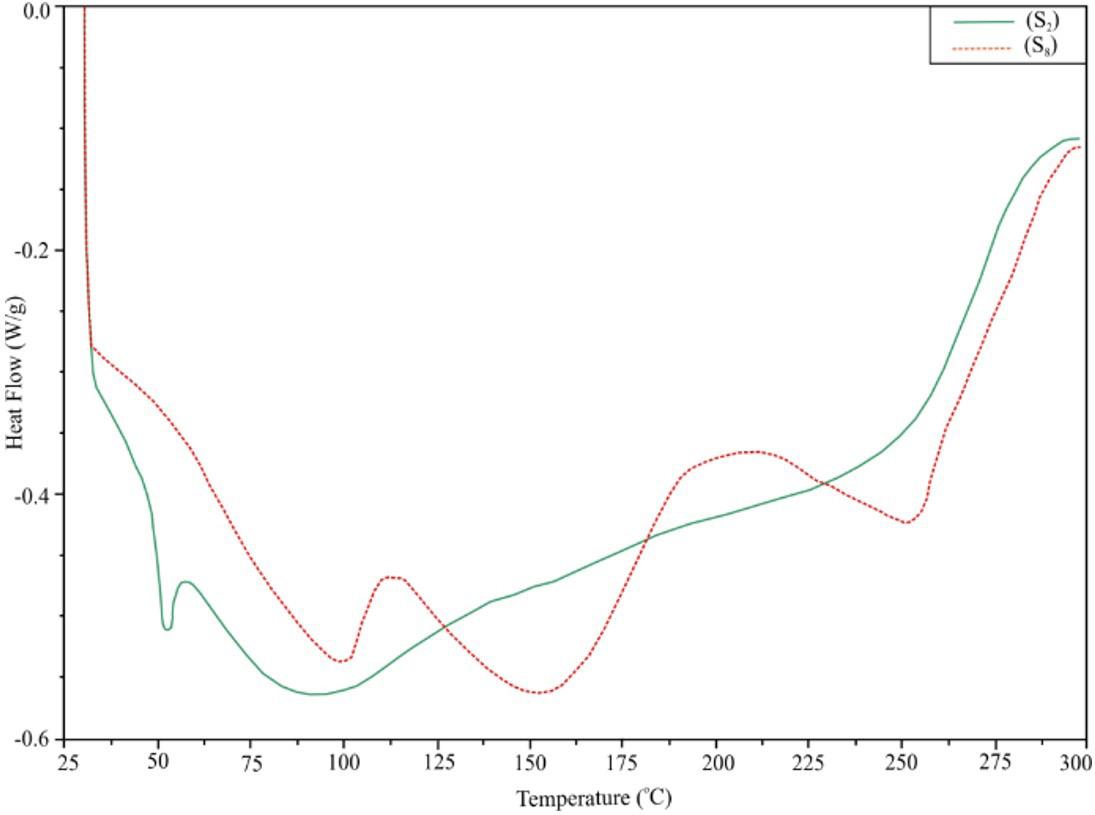
3.5 Thermogravimetry analysis
The thermal stability and degradation of the selected composites were studied using TGA in air and nitrogen atmosphere. Figure 4 shows the TGA graph of an unfilled and filled composite respectively. Thermal degradation
Koyunucu, M., & Ulay, G. Polímeros, 33(2), e20230018, 2023 4/6
Figure 2. SEM micrograph of tensile fractured surfaces; (a) 100% walnut shell 630μm particle size; (b) 20% pumice powder incorporated composite; (c) 40% pumice powder incorporated composite; (d) 50% pumice powder incorporated composite.
Figure 3. Heating curves of DSC for control composite and composite of filled pumice powder.
Figure 4. TGA curves of unfilled composite (S2) and (S8) pumice powder-filled composite.
Thermal and flammability behavior of walnut shell reinforced epoxy composites
(weight loss) of the composites happened in three consecutive phases (unfilled and filled composites). The primary stage of weight loss of filled with temperature is in range of 25200, the second in 250-321°C, and the third in 321–599°C. The primary stage of weight loss of filled with temperature is in range of 30-350, the second in 450-600°C, and the third in 600-700°C. TGA graph shows an initial weight loss of 25-200 and 30-350°C for (unfilled and filled composites) is due to the evaporation of moisture content surrounding the composite surface, moisture absorbed inside the sample. Maximum weight loss of composites occurs in the second stage of degradation. In the second stage, weight loss occurs because of the elimination of lignin as well as the hemicellulose of a walnut shell. The weight loss occurs in the last stage because of the removal of α cellulose as well as other non-cellulosic materials. Therefore, very minor weight loss could be observed at this final stage[23]. Main components of walnut shell: The TGA curve in the present study is similar of the WS thermogravimetric curves are similar to those presented in the literature and correspond to the decomposition of the three hemicelluloses (210–325°C), a-cellulose (310–400°C), and lignin (160–500°C)[14,24,25].
4. Conclusions
Flame resistance as well as the resulting mechanical properties were considered. samples code S7 and S8 show the best result and reach the V2. But other all samples were not characterized by flammability. The pumice powder filling has improved the tensile strength properties of walnut shell particles reinforced epoxy composites. The pumice powder (50%) filled walnut particles size (630 μm) composites showed maximum improvement in tensile strengths. SEM micrographs of the fracture surface indicated that the walnut shell particles after the pumice powder treatment became better suitability due to the mix of the pumice powder, which resulted in better walnut shell particles-matrix adhesion. Overall, the 50% pumice powder filler loading walnut shell particles the reinforced epoxy composites showed considerably higher and better thermal stability.
5. Author’s Contribution
• Conceptualization – Göksel Ulay; Menderes Koyuncu.
• Data curation – Menderes Koyuncu.
• Formal analysis – Göksel Ulay; Menderes Koyuncu.
• Funding acquisition – Göksel Ulay; Menderes Koyuncu.
• Investigation – Göksel Ulay.
• Methodology – Göksel Ulay; Menderes Koyuncu.
• Project administration – Menderes Koyuncu.
• Resources – Göksel Ulay; Menderes Koyuncu.
• Software – NA.
• Supervision – Göksel Ulay; Menderes Koyuncu.
• Validation – Göksel Ulay.
• Visualization – Göksel Ulay; Menderes Koyuncu.
• Writing – original draft – Menderes Koyuncu.
• Writing – review & editing – Göksel Ulay; Menderes Koyuncu.
6. References
1 Singh, V. (2014). Mechanical behavior of walnut (Juglans L.) shell particles reinforced bio-composite. Science and Engineering of Composite Materials, 22(4), 383-390
2 Ayrilmis, N., Kaymakci, A., & Ozdemir, F. (2013). Physical, mechanical, and thermal properties of polypropylene composites filled with walnut shell flour. Journal of Industrial and Engineering Chemistry, 19(13), 908-914 http://dx.doi. org/10.1016/j.jiec.2012.11.006
3 Pradhan, P., & Satapathy, A. (2022). Physico-mechanical characterization and thermal property evaluation of polyester composites filled with walnut shell powder. Polymers & Polymer Composites, 30, 09673911221077808 http://dx.doi. org/10.1177/09673911221077808
4. Ramesan, M.-T., Chippy, J., Jayakrishnan, P., & Anilkumar, T. (2018). Multifunctional ternary composites of poly (vinyl alcohol)/cashew tree gum/pumice particles. Polymer Composites, 39(1), 38-45. http://dx.doi.org/10.1002/pc.23899.
5 Sever, K., Atagür, M., Tunçalp, M., Altay, L., Seki, Y., & Sarıkanat, M. (2018). The effect of pumice powder on mechanical and thermal properties of polypropylene. Journal of Thermoplastic Composite Materials, 32(8), 1092-1106 http://dx.doi.org/10.1177/0892705718785692
6 Sahin, A. E., Yildiran, Y., Avcu, E., Fidan, S., & Sinmazcelik, T. (2014). Mechanical and thermal properties of pumice powder filled PPS composites. Acta Physica Polonica A, 125(2), 518520 http://dx.doi.org/10.12693/APhysPolA.125.518
7 Ramesan, M. T., George, A., Jayakrishnan, P., & Kalaprasad, G. (2016). Role of pumice particles in the thermal, electrical and mechanical properties of poly (vinyl alcohol) /poly(vinyl pyrrolidone) composites. Journal of Thermal Analysis and Calorimetry, 126(2), 551-519. http://dx.doi.org/10.1007/ s10973-016-5507-6
8 Fleischer, C. A., & Zupan, M. (2010). Mechanical performance of pumice-reinforced epoxy composites. Journal of Composite Materials , 44 (23), 2679-2696 http://dx.doi. org/10.1177/0021998310369575
9 Montava-Jordá, S., Quiles-Carrillo, L., Richart, N., TorresGiner, S., & Montanes, N. (2019). Enhanced interfacial adhesion of polylactide/poly(ε-caprolactone)/walnut shell flour composites by reactive extrusion with maleinized linseed oil. Polymers, 11(5), 758 http://dx.doi.org/10.3390/polym11050758 PMid:31052255.
10 American Society for Testing and Materials – ASTM. (2017). ASTM D3039/D3039M-17: standard test method for tensile properties of polymer matrix composite materials West Conshohocken: ASTM
11 Underwriters Laboratories Inc – UL. (2001). UL-94: standard for safety for test for flammability of plastic materials for parts in devices and appliances USA: Underwriters Laboratories Inc
12. Umemura, T., Arao, Y., Nakamura, S., Tomita, Y., & Tanaka, T. (2014). Synergy effect of wood flour and fire retardants in flammability of wood-plastic composite. Energy Procedia, 56, 48-56. http://dx.doi.org/10.1016/j.egypro.2014.07.130.
13 Koyuncu, M. (2018). The influence of pumice dust on tensıle, stiffness properties and flame retardant of epoxy/ wood flour composites. Journal of Tropical Forest Science, 30(1), 89-94 http://dx.doi.org/10.26525/jtfs2018.30.1.8994
14 Salasinska, K., Barczewski, M., Borucka, M., Gorny, R. L., Kozikowski, P., Celiński, M., & Gajek, A. (2019). Thermal stability, fire and smoke behaviour of epoxy composites
Polímeros, 33(2), e20230018, 2023 5/6
Koyunucu, M., & Ulay, G.
modified with plant waste fillers. Polymers, 11(8), 1234 http:// dx.doi.org/10.3390/polym11081234 PMid:31349642.
15 Loganathan, T. M., Sultan, M. T. H., Ahsan, Q., Shah, A. U. M., Jawaid, M., Talib, A. R. A., & Basri, A. A. (2021). Physico‐mechanical and flammability properties of cyrtostachys renda fibers reinforced phenolic resin bio composites. Journal of Polymers and the Environment, 29(11), 3703-3720 http:// dx.doi.org/10.1007/s10924-021-02135-0
16 Bachtiar, E. V., Kurkowiak, K., Yan, L., Kasal, B., & Kolb, T. (2019). Thermal stability, fire performance, and mechanical properties of natural fibre fabric-reinforced polymer composites with different fire retardants. Polymers, 11(4), 699 http:// dx.doi.org/10.3390/polym11040699 PMid:30995829.
17 Pratheesh, K., Narayanasamy, P., Prithivirajan, R., Ramkumar, T., Balasundar, P., Indran, S., Sanjay, M. R., & Siengchin, S. (in press). Cenosphere filled epoxy composites: structural, mechanical, and dynamic mechanical studies. Biomass Conversion and Biorefinery http://dx.doi.org/10.1007/s13399023-04154-4
18. Zare, Y. , Rhee, K. Y., & Hui , D. (2017). Influences of nanoparticles aggregation/agglomeration on the interfacial/ interphase and tensile properties of nanocomposites. Composites. Part B, Engineering, 122, 41-46 http://dx.doi.org/10.1016/j. compositesb.2017.04.008.
19 Altuntas, E., Narlioglu, N., & Alma, M. (2017). Investigation of the fire thermal, and mechanical properties of zinc borate and syhergic fire retardants on composites produced with PPMDF wastes. BioResources, 12(4), 6977-6983 http://dx.doi. org/10.15376/biores.12.4.6971-6983
20 Prabhakaran, S., Zaynab, M. A., Chinnarasu, K., & Keerthana, J. (2021). Performance evolution of walnut shell particle filled glass fiber reinforced composite. National Volatiles &
Essential Oils, 8(5), 3458-3467. Retrieved in 2023, March 30, from https://www.nveo.org/index.php/journal/article/ view/922/847
21 Wang, J., Zhou, W., Wei, Z.-Y., Ding, Z.-J., Ma, L.-H., & Liu, J. (2022). Effects of various porosities on the damage evolution behavior of carbon fiber/epoxy composites using acoustic emission and micro-CT. Journal of Composite Materials , 56 ( 10 ), 1541 - 1558 http://dx.doi. org/10.1177/00219983211073727
22. Ali, J. B., Musa, A. B., Danladi, A., Bukhari, M. M., & Nyakuma, B. B. (2022). Physico-mechanical properties of unsaturated polyester resin reinforced maize cob and jute fiber composites. Journal of Natural Fibers, 19(9), 3195-3207. http://dx.doi.or g/10.1080/15440478.2020.1841062
23 Soni, P., & Sinha, S. (2022). Synergistic effect of alkali and silane treatment on mechanical, flammability, and thermal degradation of hemp fiber/epoxy composite. Polymer Composites, 43(9), 6204-6215 http://dx.doi.org/10.1002/pc.26924
24 Salasinska, K., Barczewski, M., Gorny, R., & Klozinski, A. (2018). Evaluation of highly filled epoxy composites modified with walnut shell waste filler. Polymer Bulletin, 75(6), 25112528 http://dx.doi.org/10.1007/s00289-017-2163-3
25 Barczewski, M., Sałasińska, K., & Szulc, J. (2019). Application of sunflower husk, hazelnut shell and walnut shell as waste agricultural fillers for epoxy-based composites: A study into mechanical behavior related to structural and rheological properties. Polymer Testing, 75, 1-11 http://dx.doi.org/10.1016/j. polymertesting.2019.01.017
Received: Mar. 30, 2023
Revised: June 06, 2023
Accepted: June 26, 2023
Polímeros, 33(2), e20230018, 2023 6/6
Study of mechanical properties of inner tubes exposed to gamma radiation§
Sandra Regina Scagliusi1* , Elizabeth Leite Carvalho Cardoso2 , Fabio José Esper1 , Ademar Benevólo Lugão2 and Helio Wiebeck1
1Departamento de Engenharia de Materiais, Universidade de São Paulo – USP, São Paulo, SP, Brasil 2Centro de Química e Meio Ambiente, Instituto de Pesquisas Energéticas e Nucleares – IPEN / CNEN, São Paulo, SP, Brasil *scagliusi@usp.br
§This paper has been partially presented at the 16th Brazilian Polymer Congress, held on-line, 24-28/Oct/2021.
Obstract
Due to the technical evolution of tires, currently most automotive tires do not have an inner tube. However, truck, motorcycle and bicycle tires still use tires with inner tubes, mostly made of synthetic elastomeric material, which guarantees good potential for air restriction or longer periods for tire pressure failure. This work aims to study changes in the mechanical properties of a truck inner tire, after its exposure to gamma rays, to promote the subsequent recycling of the material. The choice of ionizing radiation is due to its ability to modify the structure and properties of materials, in addition to its applicability in recycling/recovering rubber. For the characterization of the samples, doses of 5, 10, 15, 20, 25 and 30 kGy were applied, and after irradiation as a sample, they were tested using the following characterization methods: traction and elongation at break, hardness, thermal aging and elemental analysis. Observed that is a decrease in the values of the mechanical properties of the samples after irradiation, mainly at doses greater than 10 kGy.
Keywords: gamma rays, inner tubes, mechanical properties, rubber.
How to cite: Scagliusi, S. R., Cardoso, E. L. C., Esper, F. J., Lugão, A. B., & Wiebeck, H. (2023). Study of mechanical properties of inner tubes exposed to gamma radiation. Polímeros: Ciência e Tecnologia, 33(2), e20230019.
1. Introduction
Tires are currently constituted of various components, besides synthetic rubber. Being a product that aims at a long service life, considering that it is designed and manufactured to last under extreme physical, chemical and thermal conditions [1], it presents a complex structure to provide the required characteristics to its performance and safety, built to be indestructible [2]. Diagonal or conventional tires are used in buses and trucks which employ air chambers. Radial tires are used in cars, buses, trucks, off-road vehicles and no longer use air chambers. Conventional tires that still employ air chambers are easier to be crushed and, consequently, recycled. There are about 450 tire plants all over the world. Tire production start with bulk raw- materials, such as synthetic rubber (60% - 70%)[3] [4], carbon black and chemical products to produce different specialized components, which are assembled and cured. The different parts of a tire include lateral wall, rubber made; body canvas, produced from a rubber elastic mixture, polyester, nylon and polyamide; stabilizing canvas manufactured with small plaques of steel wires; undercarriage with three types of rubber of different compositions; stubs that are steel hoops wrapped by a rubber layer; and pond, composed of various rubber layers – all of them provided with an intrinsic function to impart firmness, safety, sealing, etc. Each tire part is manufactured separately and, to join all the parts, the companies use presses and mills [5] Figure 1 shows the components of a car tire.
In 2019, the USA manufactured about 170 million tires [7] More than 2.5 billion tires are fabricated yearly, making the tire industry a great natural rubber consumer. It is estimated that by the late 2019, 3 billion tires were sold worldwide each year [8] .
Top Tire Manufacturers Ranking 2017,Bridgestone Corp. maintained the No. 1 position for the ninth year in a row with sales of $22.1 billion, easily ahead of the Michelin Group’s $21.1 billion and Goodyear’s $13.5 billion, according to the Tire Business survey [9,10] .
1.1 The innerliner
A specific rubber compound is used as an air seal inside the tire. This inner liner layer has no cord reinforcement and is similar to an inner tube [11]
The air chamber inside the tires is composed of butyl rubber, a synthetic material having as major characteristics elasticity and the capacity to impede air leakage. It is a polymerized compound in isobutylene solution in a small isoprene percentage. A vulcanization process fixes the valve, which allows pressure control inside the air chamber. Depending on the additives used in chamber manufacturing, the rubber acquires more or less elasticity. A few manufacturers use this manufacturing technique to achieve a compound capable of reaching different tire sizes [12]
https://doi.org/10.1590/0104-1428.20220010 O O O O O O O O O O O O O O O Polímeros, 33(2), e20230019, 2023 ISSN 1678-5169 (Online) 1/6
The air chamber is located inside the tire that does not have any extra sealing on the wheel to stand compressed air. The valve that allows filling is connected directly to the chamber, increasing the risk of injuries caused by negligent maintenance. The chambers consist entirely of a synthetic material that ensures a good potential of air restriction or higher periods for tire pressure control.
The advantage in using chamber in radial tires is that when the tire suffers any type of attack, such as drilling or infiltration due to improper repairs, it can have its service life extended with the use of an air chamber [13]
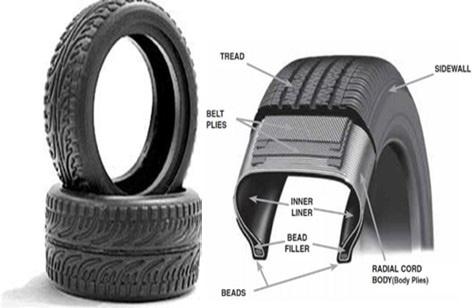
However, this recycling of solid residues has too high an energy cost and uses only car tires during the process. Some byproducts are disregarded, such as chambers still used in bicycle, motorcycle and truck tires. This work thus aims to study the changes in mechanical properties of tire chambers used in trucks after their exposure to gamma-rays for promoting further material recycling [14] .
2. Materials and Methods
2.1 Materials
For the purposes of this study, samples from the production of truck tire chambers were extracted. The material was provided by manufacturers that required anonimity. The tire chambers received were used without any previous treatment and were characterized regarding their physico-chemical and mechanical properties.
2.1.2 Irradiation
The samples were subjected to gamma radiation at 5 kGy, 10 kGy, 15 kGy, 20 kGy, 25 kGy and 30 kGy doses. These low doses were selected to promote a controlled degradation of the material.
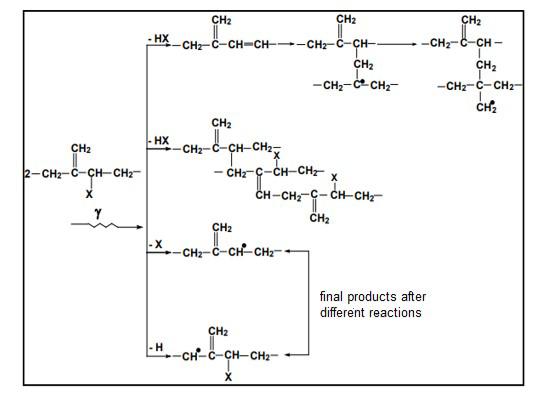
Charlesby (1953)[15] studied the processing of butyl rubbers by radiation and showed that the presence of a tertiary carbon in the polymer chain facilitates chain scission . Irradiation of polymers by ionizing radiation from industrial sources promotes the creation of very reactive intermediaries (ions and excited states), which can follow different paths resulting in: free radical reaction and hydrogen abstraction, arrangements and/or formation of new bonds.[16] acording Figure 2
Radiation, when interacting with polymeric materials, transfers energy to the atoms of the polymeric chain, causing changes in its molecular structure. Such modifications can result in the reticulation or degradation (scission) of the polymeric chains, simultaneous and concurrent processes, whose preponderance of one or the other depends mainly on the molecular structure of the polymer and the dose of radiation with which the material was treated. Crosslinking is intermolecular bond formation of polymer chains. The degree of cross linking is proportional to the radiation dose. Cross linking during irradiation does not require unsaturated or other more reactive groupings. The mechanism of cross linking generally varies with the polymers concerned. The hydrogen atom is followed by the abstraction of a second hydrogen atom from a neighboring chain to produce molecular hydrogen. Next, two adjacent polymeric radicals combine to form a crosslink. Fission is the opposite process of crosslinking in which the breakage of C-C bonds occurs.
The final changes in polymer during irradiation are rather complex. There have always been competing reactions of cross linking and main chain scission simultaneously. The net effects of radiation depend on these competing reactions. Responses of different elastomers to the ionizing radiation are summarized in Table 1[18]
Polímeros, 33(2), e20230019, 2023 2/6
Scagliusi, S. R., Cardoso, E. L. C., Esper, F. J., Lugão, A. B., & Wiebeck, H.
Figure 1. Typical passenger car tire and components of a run flat tire [6]
Figure 2. Isoprene irradiation unit reactions [17] .
Study of mechanical properties of inner tubes exposed to gamma radiationa
Samples were irradiated at IPEN (Instituto de Pesquisas Energéticas e Nucleares/ Nuclear and Energy Research Institute), in a Multipurpose Irradiator, installed in the CTR building, by ionizing radiation from 60Co sources, at O2 atmosphere, at a dose ratio of about 5 kGy.h-1
2.2. Methods
For characterizing the tire chambers, irradiated and non-irradiated samples underwent the following tests in triplicate.
• CHN Elementary Analysis – based on the Pregl-Dumas method
• Tensile and Elongation at Break - ASTM D 412
• Hardness - ASTM D 2240.
• Crosslink density by Flory Rhenner equation.
3. Results and Discussions
3.1 Elementary analyses
The results for the elementary analyses are shown in Table 2. The calculation for the minima formula indicates lower ratio in non-decimal numbers for element atoms that build a substance. For calculating the mass percentage of each element, it was divided by its corresponding molar mass.
The analyzes were performed at the Analytical Center at the USP Chemistry Institute.
For all the irradiated truck chamber samples, a slight or almost no modification was observed at the carbon, hydrogen and nitrogen levels; variations occur due to the formulation used in the elastomer acquisition process. Therefore, no change was observed in the amount of carbon in the samples after irradiation.
3.2 Tensile and elongation at break
Tensile strength and elongation at break values were determined according to ASTM D-412 by using a model C specimen, in a universal essay machine (EMIC), model DL 300, 300 kN maximum capacity and 500 mm/min grips speed, at room temperature.
The results for tensile and elongation at break analyses of irradiated and non-irradiated truck chamber samples are shown in Figure 3 for Tensile and in Figure 4 for Elongation.
Values for tensile at break are observed to show a sharper decrease in values for doses higher than 10 kGy, pointing to a raise in chain-scission caused by irradiation. For doses higher than 10 kGy, there is an equity in values, suggesting a competition between scission and crosslinking. Due to the high molecular weight of polymers, relatively low doses of radiation can lead to a significant change in their physical properties on account of progressing radiation-induced reactions.
Polymers predominantly crosslinking
Copolymer of styrene and butadiene (SBR) (IIR)
Polymers predominantly degrading
Isobutylene-isoprene rubber or butyl rubber
Chlorinated polyethilene (CM) Chorobutyl rubber (CIIR)
Chlorosulfolnated polyethylene (CSM) Bromobutyl rubber (BIIR)
Polybutadiene (BR ou PB)
Natural rubber (NR)
Polychloroprene (CR)
Copolymer of acrylonitrile and butadiene (NBR)
Hydrogenated NBR (HNBR)
Ethylene-propilene rubber (EPM)
Ethylene-propilene-diene rubber (EPDM)
Polyurethanes (PUR)
Polydimethyl silicone (MQ)
Polydimethylpenylsylicone (PMQ)
Fluorocarbon elastomers, based on vynilidene floride (FKM)
Isobutylene rubber (IR)
Polímeros, 33(2), e20230019, 2023 3/6
Table 1. Classification of elastomers according to their response to ionizing radiation[18]
Dose (kGy) Carbon (%) Hidrogen (%) Nitrogen (%) 0 86.415 8.370 0.305 5 86.310 8.450 0.330 10 85.450 8.355 0.345 15 85.900 8.420 0.395 20 86.205 8.505 0.305 25 86.210 8.490 0.545 30 86.235 8.300 0.200
Table 2. Elementary analysis results for irradiated and non-irradiated truck chambers.
If these reactions lead to break of the valence base, a decrease in the molecular weight and destruction of the polymer is observed. If additional molecular cross links are formed, the molecular weight of the polymer increases, which leads to radiation polymerization [19]
For the results of elongation at break, a rise is observed in values for doses up to 10 kGy, suggesting the occurrence of crosslinking; for doses higher than 15 kGy, there is a decrease in values, indicating a rise in chain-scission, because lower chains present lower elongation. These results are in agreement with the study carried out by Hong-Bing Chen and collaborators (2017) who showed the effects of gamma irradiation on butyl rubber (BRP)-based material and concluded that the absorbed dose seems to be extremely important for the properties of butyl rubber compounds. As the dose increases, the tensile strength decreases, inversely proportional to the results of elongation at break, which shows a slight increase in values [20]
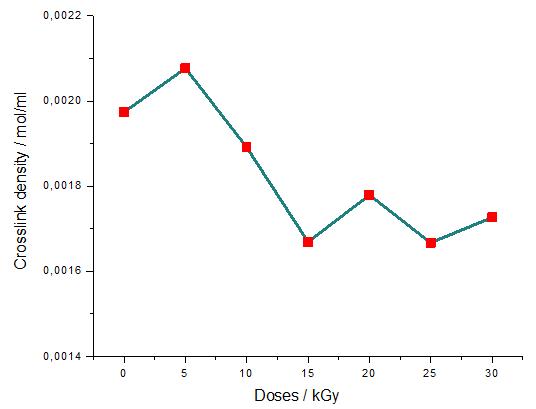
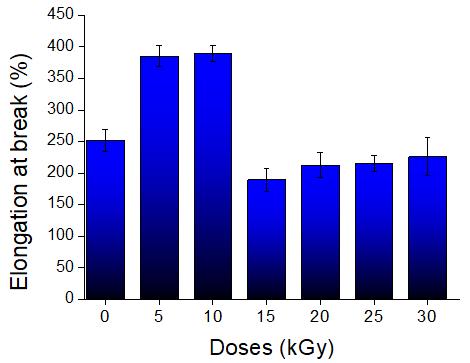
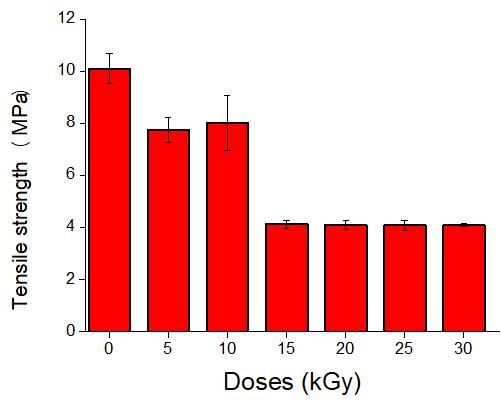
3.3 Hardness
Hardness numerical indexes represent the deepness of penetration or adequate arbitrary values derived from ASTM D 2240 . Hardness is one of the most evaluated properties in rubbers, being Shore A, Instrutemp, portable digital model Dp-100 the durometer used herein. This instrument is provided with a conical needle emerging from the apparatus, kept at zero level by means of a spring.
The results for hardness are characteristic of the rigidity presented by a rubber compound. Hardness results for irradiated and non-irradiated truck chamber samples are shown in Figure 5
After irradiation, samples showed a lower decrease in values; nevertheless, with a rise in dose, an equity of values was verified for all doses. As expected, hardness is reduced after mechanical shearing; this is explained by the degradation mechanism that leads to a de-polymerization, i.e., the weakening of the elastomer matrix imparted by chain-scission and/or a rise in cross links.
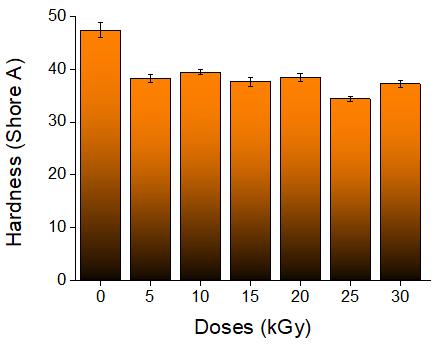
3.4 Cross linking density
The density of crosslinks was calculated by the equation developed by Flory – Rehner (Equation 1) , based on the equilibrium swelling in organic solvents[21]. The crosslink density was calculated by using from the equilibrium swelling.
Where, : η: cross-link density (mol/cm3), χ the interaction parameter polymer-solvent or Flory-Huggins parameter (0.5)[22], ρВ the rubber density, V0 the molar volume of the solvent (106.4 cm3 mol-1) and VB is the volume fraction of rubber from swollen form, determined from weight gain by swelling.
The samples were weighed daily until there was no further weight change, which took 24 hours. The samples were then dried in a vacuum oven at 60°C for 4 hours. The specimens used had dimensions of 2.0 x 2.0 x 0.2 cm , with the result of the arithmetic mean of three determinations. Figure 6 shows the crosslink density results of the irradiated and non-irradiated.
Polímeros, 33(2), e20230019, 2023 4/6
Scagliusi, S. R., Cardoso, E. L. C., Esper, F. J., Lugão, A. B., & Wiebeck, H.
( ) ( ) ( ) ( ) 2 1 3 0 (ln1 2 BBB B B B VVV V VV χ ν ρ −−++ = (1)
Figure 3. Tensile Strength for irradiated and non-irradiated truck chambers.
Figure 4. Elongation at break for irradiated and non-irradiated truck chamber.
Figure 5. Hardness of non-irradiated and irradiated truck chambers.
Figure 6. Crosslinking Density of non-irradiated and irradiated truck chambers.
The results shown in Figure 6, indicate that the cross-linking density for doses above 5 kGy decreases with increasing dose, denote that there is a decrease in cross-links, suggesting disruption of C-S bonds. Corroborating results of tensile strength of a polymer is a function of crosslink density and energy dissipation. The tensile strength increases with crosslinks and decreases with lower crosslink density. However, fission reactions at high radiation doses causing reduced tensile strength values cannot be ruled out. Decreased traction strength and elongation at break at higher radiation doses are reported for ethylenepropylene rubber[23]. The increase in irradiation can be attributed to changes in the the crosslink density.
4. Conclusions
Elementary analyses did not reveal significant changes in Carbon (C) and Hydrogen (H) levels, present in all irradiated and non-irradiated samples, and results were not conclusive.
Tensile and elongation at break mechanical tests showed that irradiated sample values decreased in function of a rise in dose, suggesting the occurrence of chain-scission, because smaller chains present smaller elongation and suffer rupture more easily.
The hardness result, which indicates material rigidity, presented lower values after irradiation; this is probably caused by the degradation mechanism that leads to a de-polymerization, i.e., weakening of the elastomeric matrix caused by chain-scission and / or a rise in crosslinking.
The decrease of cross-links with the increase of the dose proved that the decrease of values for the tensile strength with the increase of the dose is due to the increase of the chain scission.
The analyses showed that it is possible to accomplish controlled degradation of truck tire chambers, considering that doses higher than 10 kGy cause chain-scission. In a future work, the intention is to consider a mixture of recovered rubber via irradiation with virgin rubber and then conduct the material recycling.
5. Author’s Contribution
• Conceptualization – Sandra Regina Scagliusi; Ademar Benevólo Lugão; Helio Wiebeck.
• Data curation – Sandra Regina Scagliusi.
• Formal analysis – Sandra Regina Scagliusi.
• Funding acquisition – Sandra Regina Scagliusi; Elizabeth Leite Carvalho Cardoso.
• Investigation – Sandra Regina Scagliusi.
• Methodology – Sandra Regina Scagliusi; Ademar Benevólo Lugão.
• Project administration - Sandra Regina Scagliusi.
• Resources - Sandra Regina Scagliusi; Elizabeth Leite Carvalho Cardoso; Fabio José Esper.
• Software – Sandra Regina Scagliusi; Elizabeth Leite Carvalho Cardoso.
• Supervision – Ademar Lugão.
• Validation – Helio Wiebeck.
• Visualization – Sandra Regina Scagliusi.
• Writing – original draft – Sandra Regina Scagliusi.
• Writing – review & editing – Sandra Regina Scagliusi; Elizabeth Leite Carvalho Cardoso; Helio Wiebeck.
6. References
1 Arima, S., & Battaglia, A. (2003). Logística reversa – da terra para a terra, uma visão do ciclo total. Revista Tecnologística, 91, 134-141
2. Ramos, L. S. N. (2005). A Logística Reversa de Pneus Inservíveis: O problema da Localização dos Pontos de Coleta (Master’s thesis). Universidade Federal de Santa Catarina, Florianópolis
3 Kamimura, E. (2004). Potencial dos resíduos de borracha de pneus pela indústria da construção civil (Master’s thesis). Universidade Federal de Santa Catarina, Florianópolis
4 Michelin. (2021, June 22). Retrieved in 2022, Juy 04, from https://thetiredigest.michelin.com/an-unknown-object-thetire-materials.
5 Rippel, M. M., & Bragança, F. C. (2009). Natural rubber and nanocomposites with clay. Quimica Nova, 32(3), 818-826 http://dx.doi.org/10.1590/S0100-40422009000300024
6. Faustino, O. W. C., & Leite, E. F. (2014). Desenvolvimento sustentável e o fênomeno do empreendedorismo com pneus inservíveis: um estudo de caso na “Pneu Verde”. Holos, 5, 344-360 http://dx.doi.org/10.15628/holos.2014.1420
7 Green Car Congress. (2020). USTMA report finds that recycling of end-of-life tires dropped from 96% in 2013 to 76% in 2019. Retrieved in 2022, Juy 04, from https://www.greencarcongress. com/2020/10/20201015-ustma.html
8 Viotti, M. A. P., Araújo, J. A., & Oliveira, F. A. (2017). Avaliação do sistema Gerenciamento de Pneus para o município de Volta Redonda. Cadernos UniFOA, 12(33), 7-16 http://dx.doi. org/10.47385/cadunifoa.v12.n33.444
9 Tire Business . ( 2018 ). 2018 Global Tire Company RankingsTire Business . Retrieved in 2022, Juy 04, from https://www.tirebusiness.com/assets/PDF/TB117299928.PDF.
10 Saron, C. (2016). Reciclagem de pneus Revista FAPESP Retrieved in 2022, Juy 04, from https://revistapesquisa.fapesp. br/reciclagem-de-pneus/
11. Erman, B., Mark, J. E., & Roland, C. M., editors (2013). The science and technology of rubber Amsterdam: Elsevier
12 Rodgers, B., & Waddell, W. (2013). The science of rubber composition. In B. Erman, J. E. Mark, & C. M. Roland (Eds). The science and technology of rubber (pp. 417-471). Amsterdam: Elsevier http://dx.doi.org/10.1016/B978-0-12394584-6.00009-1
13 Beretta, E. M., Aguiar, J. P. O., Lauzer, M. B., Picoli, J. I., & Troncoso, S. M. T. (2014). Reaproveitamento da câmara do pneu de bicicletas: parâmetros para corte e gravação a laser. In 11º Congresso Brasileiro de Pesquisa e Desenvolvimento em Design (pp. 2056-2067). Gramado: Blucher Design Proceedings http://dx.doi.org/10.5151/designpro-ped-00911
14 Karaağaç , B., Şen, M., Deniz, V., & Güven , O. (2007 ). Recycling of gamma irradiated inner tubes in butyl based rubber compounds. Nuclear Instruments & Methods in Physics Research. Section B, Beam Interactions with Materials and Atoms , 265 (1), 290-293 http://dx.doi.org/10.1016/j. nimb.2007.08.061
15 Charlesby, A. (1953). Effect of High-energy Radiation on Long-chain Polymers. Nature, 171(4343), 167 http://dx.doi. org/10.1038/171167a0
Study of
of
Polímeros, 33(2), e20230019, 2023 5/6
mechanical properties
inner tubes exposed to gamma radiationa
Scagliusi, S. R., Cardoso, E. L. C., Esper, F. J., Lugão, A. B., & Wiebeck, H.
16 Bhattacharya, A. (2000). Radiation and industrial polymers. Progress in Polymer Science, 25(3), 371-401 http://dx.doi. org/10.1016/S0079-6700(00)00009-5
17 Zaharescu , T. , Postolache , C. , & Giurginca , M. ( 1996 ). The structural changes in butyl and halogenated butyl elastomers during gamma irradiation. Journal of Applied Polymer Science , 59 ( 6 ), 969 - 974 http://dx.doi. org/10.1002/(SICI)1097-4628(19960207)59:6<969::AIDAPP9>3.0.CO;2-N
18 Kamachi, M. (1987). ESR studies on radical polymerization. In Polymer physics. Advances in polymer science (pp. 207-275). Germany : Springer,Berlin, Heidelberg http://dx.doi. org/10.1007/BFb0024045
19 Karmanova, O. V., Tikhomirov, S. G., Kayushnikov, S. N., Shashok, Z. S., & Polevoy, P. S. (2019). Obtaining and using of reclaimed butyl rubber with the use of ionizing radiation. Radiation Physics and Chemistry, 159, 154-158 http://dx.doi. org/10.1016/j.radphyschem.2019.02.038
20 Chen, H.-B., Wang, P.-C., Liu, B., Zhang, F.-S., & Ao, Y.-Y. (2018). Gamma irradiation induced effects of butyl rubber based damping material. Radiation Physics and Chemistry, 145, 202-206 http://dx.doi.org/10.1016/j.radphyschem.2017.11.001
21. Flory, P. J., & Rehner, J., Jr. (1943). Statistical mechanics of Cross‐Linked Polymer Networks II. Swelling. The Journal of Chemical Physics, 11(11), 521-526 http://dx.doi. org/10.1063/1.1723792
22 Brandrup, J., Immergut, E. H., & Grulke, E. A., editors (2003). Polymer handbook. New York: Wiley.
23 Seguchi, T., Arakawa, K., Ito, M., Hayakawa, N., & Machi, S. (1983). Radiation induced oxidative degradation of polymers—III. Effect of radiation on mechanical properties Radiation Physics and Chemistry, 21(6), 495-501
Received: Jul. 04, 2022
Revised: Jun. 16, 2023
Accepted: Jul. 04, 2023
Polímeros, 33(2), e20230019, 2023 6/6
Some mechanical properties of WPCs with wood flour and walnut shell flour
Bekir Cihad Bal1*
1Vocational School of Technical Sciences, Kahramanmaraş Sütçü İmam University, Kahramanmaraş, Türkiye *bcbal@hotmail.com
Obstract
This study used a high-density polyethylene (HDPE) polymer matrix, pine-wood flour (PWF) and walnut-shell flour (WSF) to produce wood–plastic composite (WPC) boards. The PWF and WSF filler amounts were adjusted to 20%, 30%, and 40% by weight. Some of the mechanical properties of the produced composite boards were comparatively investigated, such as the flexural strength, flexural modulus, deformation at break, tensile strength, tensile modulus, and elongation at break. Flexural tests and tensile tests were performed according to ASTM D790 and ASTM D638, respectively. According to the data obtained, the flexural strength, deformation at break, tensile strength, and elongation at break decreased as the filler content increased. In addition, the flexural modulus values of all the test groups increased with the filler content. However, the tensile modulus values of the test groups that used the WSF filler were smaller than those of the groups without filler.
Keywords: HDPE, pine wood flour, walnut shell flour, WPC.
How to cite: Bal, B. C. (2023). Some mechanical properties of WPCs with wood flour and walnut shell flour. Polímeros: Ciência e Tecnologia, 33(2), e20230020. https://doi.org/10.1590/0104-1428.20230005
1 Introduction
Wood plastic composites (WPCs) are used in different areas for outdoor applications such as decking, cladding, fencing, and pergolas. The application areas for WPCs are increasing day by day. In parallel with this increase, scientific studies on WPCs have increased. Recycled or virgin polymers such as polyethylene (low density or high density), polypropylene, polyvinyl chloride, and polylactic acid are used for WPC production as a polymer matrix. Some lignocellulosic materials are used as fillers in the form of flour or fibre to optimize the properties of these composites[1] In previous studies, the effects of lignocellulosic fibres on the mechanical properties of WPC boards were investigated by many researchers. For example, Wambua et al.[2] studied the mechanical properties of WPCs produced from polypropylene and natural fibres such as sisal, kenaf, hemp, jute, and coir, and they compared the results with the corresponding properties of glass mat-reinforced polypropylene composites. Leao et al.[3] produced WPCs using sugar cane bagasse and elephant grass, and determined some of their mechanical properties. Jordá–Vilaplana et al.[4] manufactured WPC boards with bio-based polyethylene and short fibres from Cortaderia selloana. Sobczak et al.[5] produced and tested the mechanical properties of WPCs with natural fibres (like jute, hemp, kenaf, sisal, flax). Dolza et al.[6] produced and tested WPC boards using bio-based high-density polyethylene (BioHDPE) and natural fibres such as hemp, flax, and jute short fibres. Hyvärinen and Kärki[7] produced WPC boards using barley straw fibre and picea wood flour, and compared the mechanical properties of the WPC boards. They reported that the substitution of picea wood flour with barley straw
flour was found to weaken the mechanical properties of the WPC boards except impact strength. The density of picea wood flour is higher than that of natural fibres. In addition, some flours made of fruit seed shells are used as filler materials in WPC production in laboratory experiments. In previous studies, some researchers investigated the effects of shell flours such as almond, apricot, sunflower hazelnut, and walnut flours on the mechanical properties of WPC boards. For example, Essabir et al.[8] prepared WPC boards using polypropylene and almond-shell particles, and investigated some of their technological properties. Essabir et al.[9] produced WPC boards using HDPE, talc, and apricot-shell flour, and investigated some of their mechanical and thermal properties. Barczewski et al.[10] produced WPC boards with polypropylene and sunflower-husk flour, and investigated some of their mechanical properties, as well as the microstructure and surface quality of the WPC boards. Taşdemir[11], Akbaş et al.[12], and Sutivisedsak et al. [13] produced WPC boards using polymers such as HDPE, LDPE, and PP, with hazelnut-shell flour as a filler material.
In addition, walnut-shell flour (WSF) was used in some previous studies. For example, Włodarczyk–Fligier et al.[14] investigated some of the mechanical properties of WPCs produced with a polypropylene matrix and with 30, 40, and 50% WSF contents. They reported that the applied WSF increased the hardness and stiffness modulus of the WPC, and decreased the tensile strength. Dobrzyńska et al.[15] used differential scanning calorimetry, thermogravimetry, dynamic mechanical thermal analysis, and scanning
https://doi.org/10.1590/0104-1428.20230005 O O O O O O O O O O O O O O O Polímeros, 33(2), e20230020, 2023 ISSN 1678-5169 (Online) 1/8
electron microscopy to investigate a WPC produced with polypropylene and WSF. Tabar et al.[16] produced WPC using HDPE, silicon dioxide, wood flour, and WSF. They reported that with the addition of up to 50 wt% WSF, the tensile and flexural properties of the composites were chanced compared to the addition of poplar wood flour. They determined that the addition of WSF to HDPE exhibited lower mechanical properties than the composite containing the same ratio of poplar wood flour (50%). In addition, the mechanical properties of a WPC produced with wood flour (40 wt%) was greater than that of a WPC produced with WSF (40 wt%). Salasinska and Ryszkowska[17] produced a WPC using polyethylene waste and WSF, and reported some positive effects of the WSF on the physical and mechanical properties. Zahedi et al.[18] investigated some of the physical and mechanical properties of a WPC produced with WSF and polypropylene compared with those of a WPC produced with wood flour and polypropylene. They reported that the mechanical properties of the WPC produced from wood flour were greater than those of the WPC produced from WSF. Zhang et al.[19] investigated some of the mechanical properties of WPCs produced from peanut husk, rice husk, and WSF, along with HDPE. The results showed that the mechanical properties of the WPC produced from walnut shell were greater than those of the WPC produced from peanut husk, but lower than those of the WPC produced from rice husk.
In previous studies, there has not been sufficient study of the effect of the WSF on the mechanical properties of WPC boards. In addition, some of the mechanical test results obtained by researchers were different from each other. For this reason, the aim of this study was to determine the effect of the WSF amount and wood flour amount on some of the mechanical properties of a WPC.
2 Materials and Methods
2.1 Materials
For this study, pine (Pinus nigra) wood sawdust was obtained from a saw mill in Kahramanmaraş–Türkiye.
The sawdust was sieved, and 40 mesh (in the range of 455 µm and 900 µm) wood flour was separated for experiments (Figure 1A). Walnut shells were obtained from domestic usage, where the species was the Maraş-18 walnut tree species. The walnut shells were cleaned of rot and imperfections before being ground using a grinder (Brader 1500). Then, the shell flour was sieved, and 40 mesh (in the range of 455 µm and 900 µm) shell flour was separated for experiments (Figure 1B). The pine-wood flour (PWF) and WSF were dried in an oven at 103±2 oC for 24 hours. The HDPE matrix was obtained from Petkim Petrochemical Company in Turkey (Figure 1C). The melt flow index of the HDPE is 190 °C/2.16 kg.
The compositions of the composites are given in Table 1 The WSF and PWF were mixed with HDPE as described in Table 1, and the mixtures were transferred to a single-screw extruder machine to compound. The temperatures of the three sections of the barrel of the extruder were 170, 180, and 190 °C. The extruder speed was 40 rpm. The extruded blend was taken in a filament form from the barrel exit with a nozzle diameter of 3 mm (Figure 2A). The extruded blend in filament form was cooled in the air (Figure 2B). The cooled blend was cut into pellets (Figure 2C), and these pellets were ground (Figure 2D). The ground blend was placed in a metal mould and transferred to electrically heated plates at a temperature of 185 ± 5 °C. Non-stick baking paper was used to prevent sticking. The blend was heated and melted over a period of 15 min. No pressure was applied during this procedure. At the end of this duration, the mixture was removed from the heater with the metal mould and immediately placed in a cold press. A total of 12 kg/cm2 of pressure was applied in the cold press. The board was taken from the metal mould, and a composite board was thus obtained with the dimensions of 4 × 180 × 220 mm3 (thickness × width × length). Four composite boards were produced for each group. A total of 28 boards were produced for the present study. Test samples were prepared from these boards. Four test samples were cut from each board for each test. Thus, sixteen test specimens were prepared for each test. The test samples were cut using a
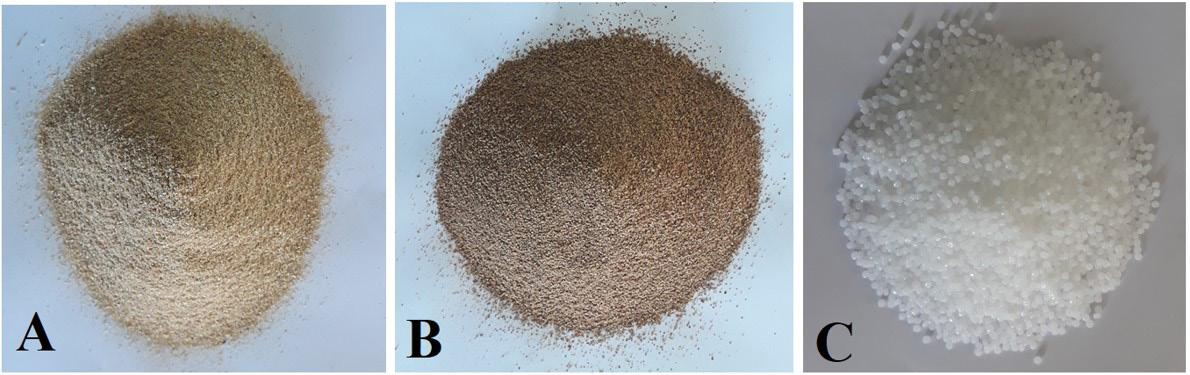
Bal, B. C. Polímeros, 33(2), e20230020, 2023 2/8
Figure 1. (A) PWF, (B) WSF, and (C) HDPE.
Content Groups Group 1 Group 2 Group 3 Group 4 Group 5 Group 6 Group 7 HDPE 100 80 70 60 80 70 60 PWF 0 20 30 40 0 0 0 WSF 0 0 0 0 20 30 40
Table 1. Compositions of the composites (by wt%).
Some mechanical properties of WPCs with wood flour and walnut shell flour
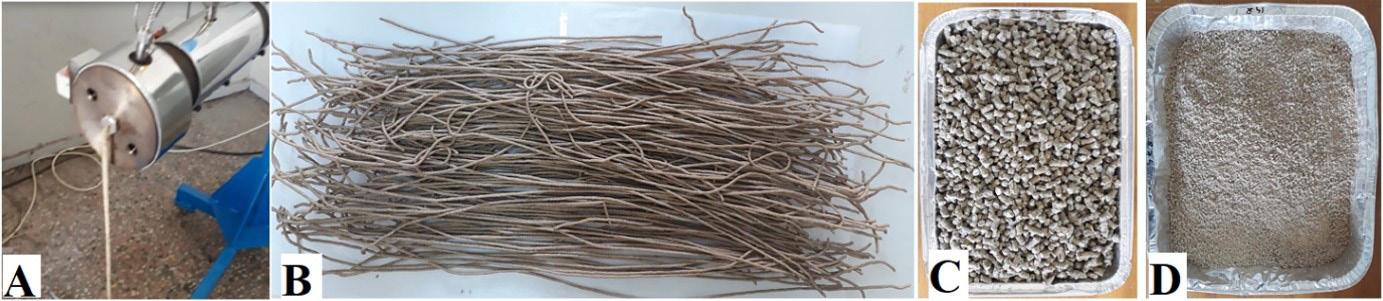
laboratory band saw. The edges of each test sample prepared for the tensile test were shaped with a CNC router.
2.2 Methods
Flexural tests and tensile tests were performed according to ASTM D790-15[20] and ASTM D638-22[21], respectively. Flexural tests were conducted using a three-point bending test procedure on a universal testing machine (UTM). The span length was 60 mm. The support span-to-depth ratio was 15/1. The preload was 3 N, and the test speed was 2 mm/min. The test was ended when the load decreased to 80% of the maximum load. At the end of the test, the deformation was noted as the deformation at break.
Tensile tests were conducted on dog-bone-shaped test samples (Type I) as described in ASTM D638-22[21] The distance between grips was 115 mm, the preload was 5 N, and the test speed was 5 mm/min. The test was ended when the test sample broke or the load decreased to 80% of the maximum load. At the end of the test, the elongation was noted as the elongation at break.
3 Results and Discussion
The density values, one-way ANOVA P values, and Duncan test results are given in Table 2. The lowest density values were found for the test samples of group 1. The highest density values were found for the test samples of group 7. The density values of groups 2, 3, and 4, which used PWF as a filler, were lower than those of groups 5, 6, and 7, which used WSF as a filler. It can be said that the reason for these differences was the press pressure and the different densities of PWF and WSF. After pressing, the thickness of the boards with PWF was slightly higher than those with WSF. As a result, the density of the PWF boards was measured to be somewhat low. In addition, the densities of all the test samples (groups 2, 3, 4, 5, 6, and 7) were measured to be higher than those of the unfilled control samples (group 1). The difference was statistically significant (P < 0.001). As the
amount of filler in the composite board increased, the density of the board increased accordingly. Similar results related to WPCs were reported by other researchers[22-27]. This situation complied with the general composite rule, which applies especially to WPCs. According to Stark and Berger[28], and Çavuş and Mengeloğlu[29], the density increase was due to the higher cell wall density of the lignocellulosic materials used as the filler. In addition, Ayrılmış et al.[30] studied some properties of polypropylene composites filled with WSF. They determined that the density of the composites significantly increased with the WSF content compared to control samples. Similar results were reported by Salasinska and Ryszkowska[17]. Włodarczyk–Fligier et al.[14] studied some of the properties of WPCs prepared with a polypropylene matrix with filler from WSF, and they reported that a higher filler content led to a higher density. Related to the filler type, Zimmermann et al.[31] reported that a lower wood fibre‐share and larger sieve‐size increased the compound´s density. As a result, as can be seen in previous studies and the present study, the filler type and filler content can change the density of the composite material.
The flexural test data, one-way ANOVA P values, and Duncan test results are given in Table 3. The data analyses showed that the test samples in the control group had the highest flexural strength (39.4 N/mm2), and the test samples of group 7 had the lowest (20 N/mm2). The flexural strengths of all the test groups were lower than that of the control group. The differences between the control group and test groups were statistically significant (P < 0.001). The flexural strength decreased as the filler content increased for both PWF and WSF. Similar results related to the flexural strength of WPCs produced with wood flour were reported by some researchers[22-24,26,27,32-37]. In addition, similar results related to the flexural strength of WPCs produced with WSF were reported by Ayrılmış et al.[30]. They reported that the flexural strengths of WPCs decreased noticeably with the addition of WSF. Matuana and Stark[22], and Ayrılmış et al.[30] , suggested that the reduction in the flexural strength was due to the poor compatibility between the polar WSF and nonpolar polymer, which formed weak interfacial regions.
Polímeros, 33(2), e20230020, 2023 3/8
Figure 2. Extruder die (A), extruded blend (B), pellets (C), and ground blend (D).
Groups 1 2 3 4 5 6 7 P value x 950D 995C 1019B 1039A 997C 1020B 1044A* P<0.001 ss 3.64 7.06 9.11 11.87 19.67 13.34 20.29
Table 2. Density test data, ANOVA P values, and Duncan test results.
Means followed by the same letter are not significantly different with each other using Duncan multiple comparison test at α = 0.05; x: arithmetic mean; ss: standard deviation. *Highest value.
Zahedi et al.[18] and Tabar et al.[16] studied the effects of WSF and poplar-wood flour on the properties of WPCs, and they determined that the flexural strength of the WPC produced using poplar-wood flour with a content of 50% was greater than that of WPC produced using WSF with a content of 50%. The results of this study are compatible with those of the present study.
The highest flexural modulus was found for test group 7. The lowest flexural modulus was found for the control group. Flexural modulus values of all the test groups were greater than that of the control group. In addition, the flexural modulus values of the test groups that used WSF were greater than those of the test groups that used PWF. The flexural modulus increased with the filler content. The differences between the control group and test groups were statistically significant (P < 0.001), as can be seen in Table 3. Similar results related to the flexural modulus values of WPCs produced with wood flour were reported in different studies[23,24,33,34,36]. In addition, similar results related to the flexural modulus values of WPCs produced with WSF were also reported by Ayrılmış et al.[30] and Zahedi et al.[18]. They reported that the flexural modulus values of WPCs that used poplar-wood flour were greater than those with WSF.
The deformation-at-break values at the end of the flexural tests are also given in Table 3. In addition, the load–deformation curves from the flexural tests of group 1, group 4, and group 7 are shown in Figure 3. The highest deformation at break was found for the control group, and the lowest was found for group 7. The deformation at break decreased as the filler content increased. The differences between groups were statistically significant (P < 0.001), as can be seen in Table 3.
In addition, it can easily be seen that the load–deformation curves for groups 1, 4, and 7 were different (Figure 3). The load–deformation curves for the test samples of the control group were very similar to each other. However, the curves for the test samples of groups 4 and 7 were not similar, and some test samples broke at the end of the small deformation. Deformation-at-break test data related to WPCs have been given by several researchers. Fiore et al.[38] provided the deformation-at-break test data from their study, which showed that the deformation at break decreased as the filler content increased. Similar results for the deformation at break were reported by Bal[26]
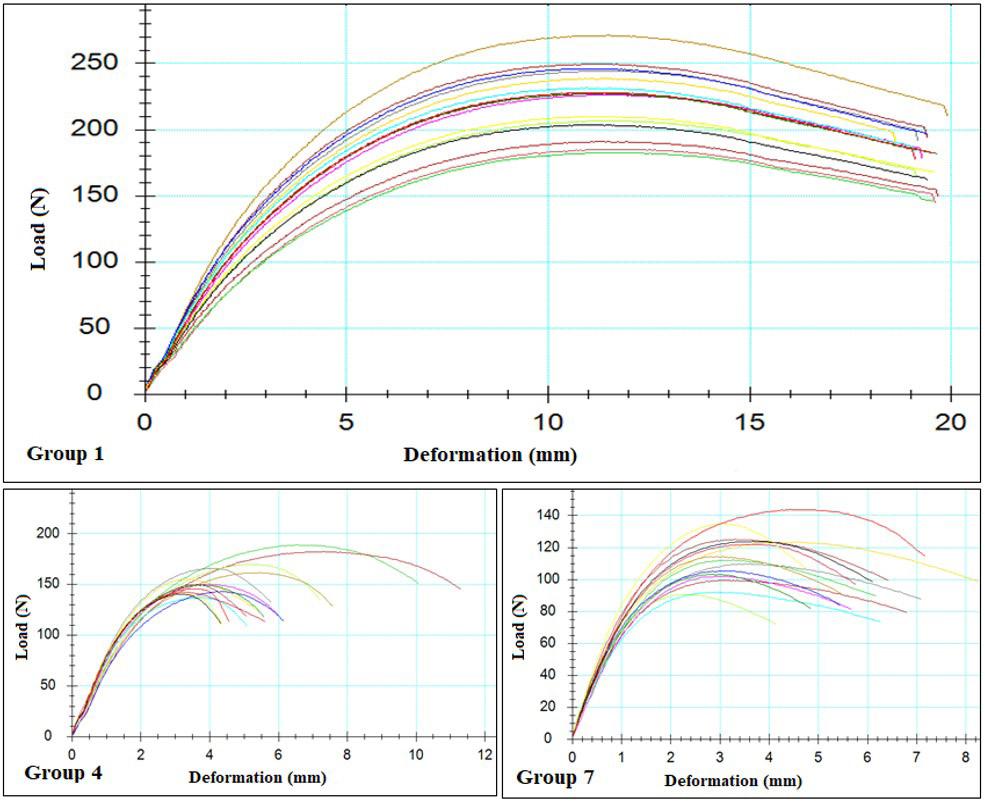
The tensile test data, one-way ANOVA P values, and Duncan test results are given in Table 4. Based on the
*Means followed by the same letter are not significantly different with each other using Duncan multiple comparison test at
= 0.05. **Standard deviation in italic form. ***Highest value.
Bal, B. C. Polímeros, 33(2), e20230020, 2023 4/8
Tests Groups P values 1 2 3 4 5 6 7 Flexural strength (N/mm2) 39.4A* 29.8C 26.1D 25.9D 32.2B 25.1D 20.0E P<0.001 0.83** 2.70 2.71 3.96 3.34 4.86 3.98 Flexural modulus (N/mm2) 1077F 1099EF 1175DE 1323B 1208CD 1271BC 1412A* P<0.001 100.1 41.0 88.2 187.9 85.5 120.2 87.2 Deformation at break (mm) 19.4A*** 13.9B 9.6C 6.9D 14.9B 9.4C 6.2D P<0.001 0.31 2.54 2.57 3.20 3.28 3.80 1.39
Table 3. Flexural test data, ANOVA P values, and Duncan test results.
α
Figure 3. Load–deformation curves from flexural tests (group 1, group 4, and group 7).
Some mechanical properties of WPCs with wood flour and walnut shell flour
data related to the tensile strength and elongation-at-break analyses, it can be said that the highest tensile strength and elongation at break were found for the test samples of group 1 (control group), and the lowest were found for the test samples of group 7. The differences between the groups were statistically significant (P < 0.001).
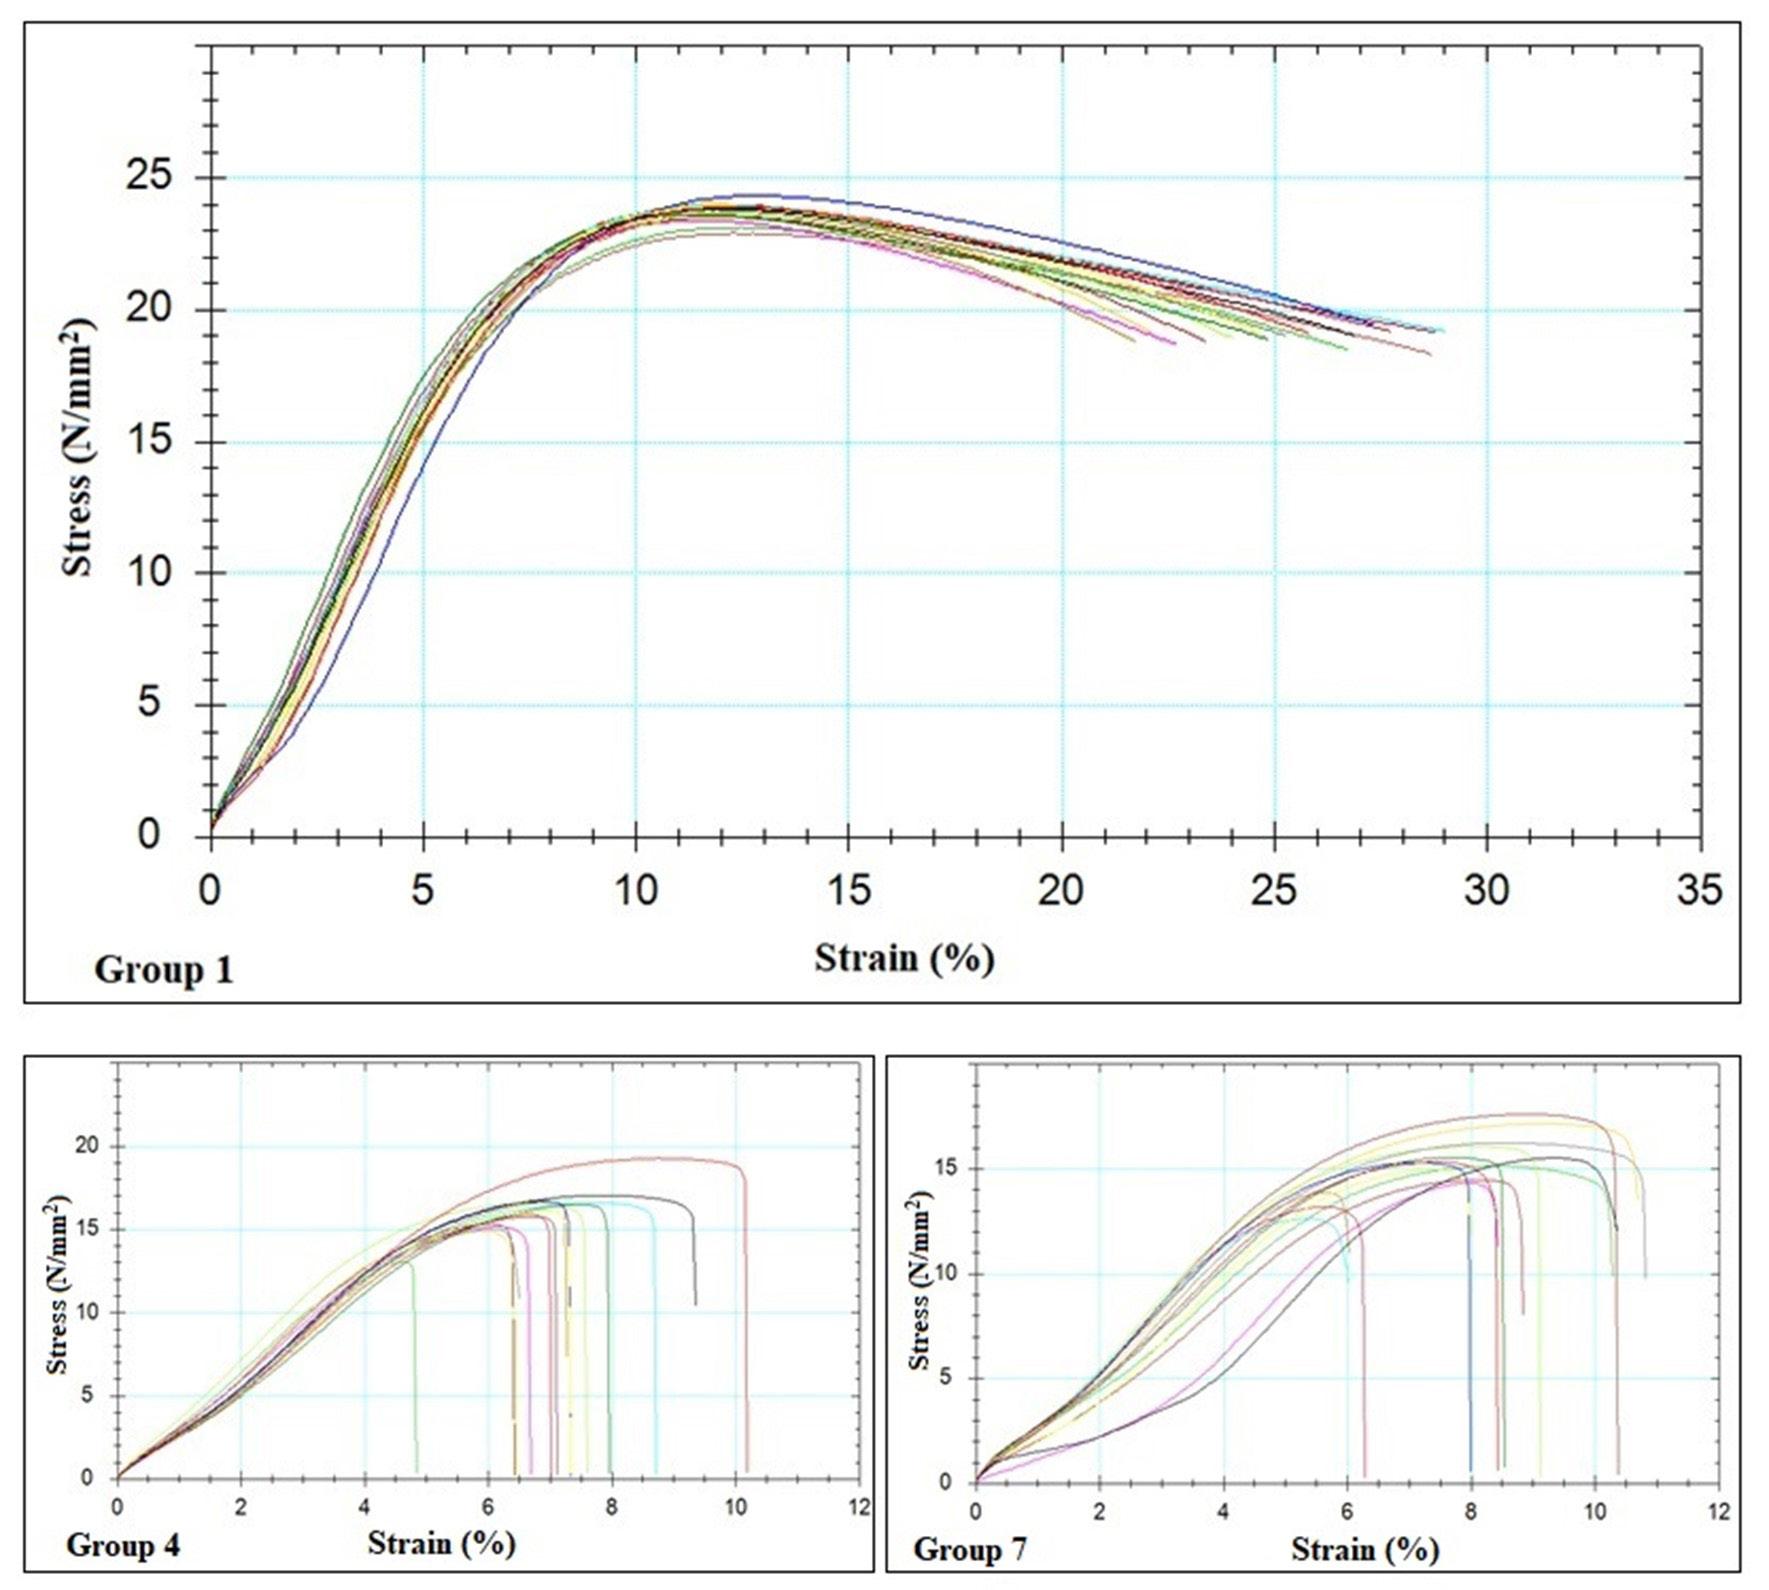
The tensile strengths and elongation-at-break values of the test samples produced from PWF were greater than those of the test samples produced from WSF. In contrast to the tensile strength and elongation at break, the tensile modulus increased with the amount of filler, as can be seen in Table 4. In previous studies, similar results related to the effect of wood flour on WPCs were reported[22-24,26,27,33-37,39].
According to Matuana and Stark[22], the addition of wood flour filler to polymeric matrices decreased the ductile behaviour of the matrix by making the WPC material more brittle than that of the polymeric material. Thus, the tensile strength and elongation at break decreased compared to the unfilled polymeric matrix.
The amount of increase in the tensile modulus was greater in test samples using PWF than in those using WSF. It can
be said that the most important reason for this difference was the fibrous structure of PWF compared to WSF. Similar results were reported by Zahedi et al.[18] and Tabar et al.[16] According to Tabar et al.[16], the reason for this difference between the effects of wood flour and WSF could be the fibrous nature and different chemical composition of wood. In addition, the long fibres of the PWF compared to WSF provided more significant reinforcing effects in the WPCs produced because of their higher aspect ratio. The differences in the fibre morphologies, chemical contents, densities, cellulose–lignin contents, and aspect ratios across different filler types accounted for the varying reinforcement in lignocellulosic–plastic composites[40].
Stress–strain curves based on the tensile tests of groups 1, 4, and 7 are given in Figure 4. An analysis of the curves shows that the curves for the test samples of group 1 (unfilled group) are very similar to each other. The elongation at break of group 1 is 25.6%, as can be seen in Table 4. In contrast, the elongation-at-break values of groups 4 and 7 are 4.7% and 4.5%, respectively. The area under the curve of group 1 is larger than those for groups 4 and 7. This area is also
0.05. **Standard deviation in italic form. ***Highest value.
*Means followed by the same letter are not significantly different with each other using Duncan multiple comparison test at
33(2), e20230020, 2023 5/8
Polímeros,
Test Groups P values 1 2 3 4 5 6 7 Tensile strength (N/mm2) 23.6A* 15.8B 13.3C 12.1D 15.0B 10.9E 9.7F P<0.001 0.4** 1.5 1.7 1.7 1.3 1.0 1.7 Tensile modulus (N/mm2) 335BC 344AB 356AB 367A* 305C 311C 329BC P<0.001 38.3 12.0 24.4 22.7 18.2 27.5 85.5 Elongation at break (%) 25.6A*** 7.3B 5.9C 4.7C 8.4B 5.4C 4.5C P<0.001 2.4 1.3 2.5 0.8 1.4 2.7 1.2
Table 4. Tensile test data, ANOVA P values, and Duncan test results.
α
=
Figure 4. Stress–strain curves based on tensile tests (group 1, group 4, and group 7).
an indicator of the toughness value. A larger area indicates greater ductility. The toughness of the composite material changed when the PWF or WSF filler was added to the compound. Group 1 (HDPE) exhibited necking before fracture, but this phenomenon is not observed for the filled composites (groups 4 and 7). It is known that necking is a mode of ductile flow of material under tension. It can be said that the more necking the material has, the more ductile it is.
The brittleness of the composite material increased with the amount of filler, as can be seen in Table 4 and Figure 4 According to Matuana and Stark[22], the mechanical properties of a WPC comply with the rule of mixtures. Increasing the amount of lignocellulosic filler in the polymeric matrix decreased the ductile behaviour of the WPC by making the material more brittle. Therefore, it can be said that the PWF or WSF filler material increased the brittleness of the composite material.
In this study, differences were determined between the mechanical properties of the groups filled with WSF and those filled with PWF. There are many reasons for this difference. The particle and fiber-based composites’ mechanical properties depend on the particle size, fiber length or aspect ratio, degree of dispersion, interfacial adhesion, and particle loading[41-45]. In addition, according to Tabar et al.[16], the reason for this difference between the effects of wood flour and WSF could be the fibrous nature and different chemical composition of wood. Table 5 shows the data obtained as a result of chemical analyses made by different researchers. According to these data; it is clearly seen that the chemical composition of WSF and PWF are different. Walnut shell has more lignin and less cellulose than pine wood. Lignin and cellulose are quite different compounds from each other. Lignin has a brittle structure and cellulose has a ductile structure. Therefore, composites with high lignin-containing filler material have a more brittle structure[18,30,41,47]. When the values given in Table 5 are examined, it can be said that the high lignin content of the walnut shell increases the brittleness of the composite material. In addition, it can be said that another reason why the bending strength and tensile strength of composites filled with PWF are higher than those filled with WSF, is the fibrous structure of PWF.
4 Conclusions
In this study, the effects of PWF and WSF on the mechanical properties of wood–high-density polyethylene composite boards produced with different filler contents were investigated. According to the data obtained, the following
conclusions can be drawn for the filled composites compared to unfilled composites.
1. WPC boards were successfully produced with PWF and WSF. The density of the WPC boards increased with the filler content;
2. The flexural and tensile strengths of test samples from the filled groups decreased as the filler content increased. The reduction effect of the WSF on these strengths was greater than that of the pine-wood flour;
3. The flexural modulus values of test samples from the filled groups increased with the filler content. The increasing effect of the WSF on this property was greater than that of the pine-wood flour. In contrast, the tensile modulus values of the groups filled with WSF were lower;
4. Contrary to previous studies, the use of WSF as a filler material in a polymer composite is not recommended considering all the test results obtained.
5. References
1 Rodrigues, A., Carvalho, B. M., Pinheiro, L. A., Bretãs, R. E., Canevarolo, S. V., & Marini, J. (2013). Effect of compatibilization and reprocessing on the isothermal crystallization kinetics of polypropylene/wood flour composites. Polímeros: Ciência e Tecnologia, 23(3), 312-319 http://dx.doi.org/10.4322/ polimeros.2013.032
2 Wambua, P., Ivens, J., & Verpoest, I. (2003). Natural fibres: can they replace glass in fibre reinforced plastics? Composites Science and Technology, 63(9), 1259-1264 http://dx.doi. org/10.1016/S0266-3538(03)00096-4
3 Leao, A. L., Teixeira, R. M. F., & Ferrao, P. C. (2008). Production of reinforced composites with natural fibers for industrial applications–extrusion and injection WPC. Molecular Crystals and Liquid Crystals, 484(1), 157/[523]-166/[532] http://dx.doi.org/10.1080/15421400801904393
4 Jordá-Vilaplana, A., Carbonell-Verdú, A., Samper, M. D., Pop, A., & Garcia-Sanoguera, D. (2017). Development and characterization of a new natural fiber reinforced thermoplastic (NFRP) with Cortaderia selloana (Pampa grass) short fibers. Composites Science and Technology, 145, 1-9 http://dx.doi. org/10.1016/j.compscitech.2017.03.036
5. Sobczak, L., Lang, R. W., & Haider, A. (2012). Polypropylene composites with natural fibers and wood–General mechanical property profiles. Composites Science and Technology, 72(5), 550-557 http://dx.doi.org/10.1016/j.compscitech.2011.12.013
6. Dolza, C., Fages, E., Gonga, E., Gomez-Caturla, J., Balart, R., & Quiles-Carrillo, L. (2021). Development and characterization of environmentally friendly wood plastic composites from biobased polyethylene and short natural fibers processed by
Bal, B. C. Polímeros, 33(2), e20230020, 2023 6/8
Cellulose Hemicellulose lignin ash Walnut shell 25.6 22.1 52.3 2.8 Demirbaş[46] 25.4 21.2 49.1 3.6 Rao[41] 26.51 21.27 49.18 2.13 Ayrılmış et al.[30] Holocellulose α Cellulose lignin ash Black pine wood 73.5 50.2 25.4 - Pekgözlü et al.[42] 72.3 - 26.4 0.18 Kırcı and Ateş[43] 71.5 50.4 26.7 0.2 Kılıç et al.[44]
Table 5. The composition (%) of the walnut shell and black pine wood.
Some mechanical properties of WPCs with wood flour and walnut shell flour
injection moulding. Polymers, 13(11), 1692 http://dx.doi. org/10.3390/polym13111692 PMid:34067283.
7 Hyvärinen, M., & Kärki, T. (2015). The effects of the substitution of wood fiberwith agro-based fiber (Barley Straw) on the properties of natural fiber/polypropylene composites. In 2015 the 4th International Conference on Material Science and Engineering Technology (ICMSET 2015) (No. 01014). Singapore: EDP Sciences. http://dx.doi.org/10.1051/matecconf/20153001014.
8 Essabir, H., Nekhlaoui, S., Malha, M., Bensalah, M. O., Arrakhiz, F. Z., Qaiss, A., & Bouhfid, R. (2013). Bio-composites based on polypropylene reinforced with Almond Shells particles: mechanical and thermal properties. Materials & Design, 51, 225-230 http://dx.doi.org/10.1016/j.matdes.2013.04.031
9 Essabir, H., Bensalah, M. O., Bouhfid, R., & Qaiss, A. (2014). Fabrication and characterization of apricot shells particles reinforced high density polyethylene based bio-composites: mechanical and thermal properties. Journal of Biobased Materials and Bioenergy, 8(3), 344-351 http://dx.doi.org/10.1166/ jbmb.2014.1447
10. Barczewski, M., Andrzejewski, J., Majchrowski, R., Dobrzycki, K., & Formela, K. (2021). Mechanical properties, microstructure and surface quality of polypropylene green composites as a function of sunflower husk waste filler particle size and content. Journal of Renewable Materials, 9(5), 841-853 http://dx.doi. org/10.32604/jrm.2021.014490
11 Taşdemir, M. (2022). Effect of thermal aging on the mechanical properties of high density polyethylene/nut shell polymer composite. International Periodical of Recent Technologies in Applied Engineering, 3(1), 1-9. Retrieved in 2023, Jan 30, from https://dergipark.org.tr/en/pub/porta/issue/69017/1092080
12 Akbaş, S., Tufan, M., Güleç, T., Taşçioğlu, C., & Peker, H. (2013). The usage of nutshell in the production of polypropylene based on polymer composite panels. Artvin Coruh University Journal of Forestry Faculty, 14(1), 50-56. Retrieved in 2023, Jan 30, from http://ofd.artvin.edu.tr/en/pub/issue/2266/29867
13 Sutivisedsak, N., Cheng, H. N., Burks, C. S., Johnson, J. A., Siegel, J. P., Civerolo, E. L., & Biswas, A. (2012). Use of nutshells as fillers in polymer composites. Journal of Polymers and the Environment, 20(2), 305-314 http://dx.doi.org/10.1007/ s10924-012-0420-y
14 Włodarczyk-Fligier, A., Polok-Rubiniec, M., & Chmielnicki, B. (2021). Polypropylene-matrix polymer composites with natural filler. Archives of Metallurgy and Materials, 66(1), 313-319 http://dx.doi.org/10.24425/amm.2021.134789
15. Dobrzyńska-Mizera, M., Knitter, M., & Barczewski, M. (2019). Walnut shells as a filler for polymeric materials. Drewno, 203, 153-168 http://dx.doi.org/10.12841/wood.1644-3985.D12.02
16 Tabar, M. M., Tabarsa, T., Mashkour, M., & Khazaeian, A. (2015). Using silicon dioxide (SiO2) nano-powder as reinforcement for walnut shell flour/HDPE composite materials. Journal of the Indian Academy of Wood Science, 12(1), 15-21 http:// dx.doi.org/10.1007/s13196-015-0139-1
17 Salasinska, K., & Ryszkowska, J. (2017). Physico-mechanical properties and dimensional stability of natural fibre composites fabricated from polyethylene waste and walnut shells. In ECCM15 - 15th European Conference On Composite Materials Italy: University of Padova
18. Zahedi, M., Pirayesh, H., Khanjanzadeh, H., & Tabar, M. M. (2013). Organo-modified montmorillonite reinforced walnut shell/polypropylene composites. Materials & Design, 51, 803-809 http://dx.doi.org/10.1016/j.matdes.2013.05.007
19 Zhang, Q., Li, Y., Cai, H., Lin, X., Yi, W., & Zhang, J. (2019). Properties comparison of high density polyethylene composites filled with three kinds of shell fibers. Results in Physics, 12, 1542-1546 http://dx.doi.org/10.1016/j.rinp.2018.09.054
20 American Society for Testing and Materials – ASTM. (2015). ASTM D790-15 - Flexural properties of unreinforced and reinforced plastics and electrical insulating materials West Conshohocken: ASTM
21 American Society for Testing and Materials – ASTM. (2022). ASTM D638-22 - Standard test method for tensile properties of plastics West Conshohocken: ASTM
22 Matuana, L. M., & Stark, N. M. (2015). The use of wood fibers as reinforcements in composites. In O. Faruk, & M. Sain (Eds.), Biofiber reinforcements in composite materials (pp. 648-688) UK: Woodhead Publishing http://dx.doi.org/10.1533/97817 82421276.5.648
23 Mengeloglu, F., Basboga, İ. H., & Aslan, T. (2015). Selected properties of furniture plant waste filled thermoplastic composites. Pro Ligno, 11(4), 199-206. Retrieved in 2023, Jan 30, from http://www.proligno.ro/en/articles/2015/4/ Mengeloglu_selected_final.pdf
24 Avci, E., Acar, M., Gonultas, O., & Candan, Z. (2018). Manufacturing biocomposites using black pine bark and oak bark. BioResources, 13(1), 15-26 http://dx.doi.org/10.15376/ biores.13.1.15-26
25. Çavuş, V. (2020). Selected properties of mahogany wood flour filled polypropylene composites: the effect of maleic anhydride-grafted polypropylene (MAPP). BioResources, 15(2), 2227-2236 http://dx.doi.org/10.15376/biores.15.2.2227-2236
26 Bal, B. C. (2022). A research on some mechanical properties of composite material produced with linear low density polyethylene (LLDPE) and wood flour. Furniture and Wooden Material Research Journal, 5(1), 40-49 http://dx.doi.org/10.33725/ mamad.1126534
27 Bal, B. C. (2022). Mechanical properties of wood-plastic composites produced with recycled polyethylene, used Tetra Pak® boxes, and wood flour. BioResources, 17(4), 6569-6577 http://dx.doi.org/10.15376/biores.17.4.6569-6577
28 Stark, N. M., & Berger, M. J. (1997). Effect of particle size on properties of wood-flour reinforced polypropylene composites. In Fourth International Conference on Woodfiber-Plastic Composites (pp. 134-143). USA: Forest Products Society.
29 Çavuş, V., & Mengeloğlu, F. (2017). The effect of lignocellulosic filler types and concentrations on the mechanical properties of wood plastic composites produced with polypropylene having various melt flowing index (MFI). Pamukkale University Journal of Engineering Sciences, 23(8), 994-999 http://dx.doi. org/10.5505/pajes.2017.80000
30 Ayrilmis, N., Kaymakci, A., & Ozdemir, F. (2013). Physical, mechanical, and thermal properties of polypropylene composites filled with walnut shell flour. Journal of Industrial and Engineering Chemistry, 19(3), 908-914. http://dx.doi. org/10.1016/j.jiec.2012.11.006
31 Zimmermann, M. V., Turella, T. C., Santana, R. M. C., & Zattera, A. J. (2014). The influence of wood flour particle size and content on the rheological, physical, mechanical and morphological properties of EVA/wood cellular composites. Materials & Design, 57, 660-666 http://dx.doi.org/10.1016/j. matdes.2014.01.010
32 Bal, B. C. (2023). Comparative study of some properties of wood plastic composite materials produced with polyethylene, wood flour and glass flour. Furniture and Wooden Material Research Journal, 6(1), 70-79 http://dx.doi.org/10.33725/ mamad.1301384
33. Berger, M. J., & Stark, N. M. (1997). Investigations of species effects in an injection-molding-grade, wood-filled polypropylene. In Fourth International Conference on Woodfiber-Plastic Composites (pp. 19-25). USA: Forest Products Society
34 Mengeloğlu, F., & Karakuş, K. (2008). Some properties of eucalyptus wood flour filled recycled high density polyethylene
Polímeros, 33(2), e20230020, 2023 7/8
polymer-composites. Turkish Journal of Agriculture and Forestry, 32(6), 537-546
35 Özmen, N., Çetin, N. S., Narlıoğlu, N., Çavuş, V., & Altuntaş, E. (2014). Utilisation of MDF waste for wood plastic composites production. SDU Faculty of Forestry Journal, 15, 65-71 http:// dx.doi.org/10.18182/tjf.64025.
36 Altuntaş, E., Yılmaz, E., & Salan, T. (2017). Investigation of the effect of high-fibrous filling material on the mechanical properties of wood plastic composites. Turkish Journal of Forestry, 18(3), 258-263 http://dx.doi.org/10.18182/tjf.308969
37 Narlıoğlu, N., Salan, T., Çetin, N. S., & Alma, M. H. (2018). Evaluation of furniture industry wastes in polymer composite production. Furniture and Wooden Material Research Journal, 1(2), 78-85 http://dx.doi.org/10.33725/mamad.492418
38 Fiore, V., Botta, L., Scaffaro, R., Valenza, A., & Pirrotta, A. (2014). PLA based biocomposites reinforced with Arundo donax fillers. Composites Science and Technology, 105, 110117 http://dx.doi.org/10.1016/j.compscitech.2014.10.005
39 Tobón, A. E. D., Chaparro, W. A. A., & Rivera, W. G. (2014). Improvement of properties of tension in WPC of LDPE: HIPS/natural fiber through crosslinking with DCP. Polímeros: Ciência e Tecnolofia, 24(3), 291-299 http://dx.doi.org/10.4322/ polimeros.2014.026
40 Bouafif, H., Koubaa, A., Perré, P., & Cloutier, A. (2009). Effects of fiber characteristics on the physical and mechanical properties of wood plastic composites. Composites. Part A, Applied Science and Manufacturing, 40(12), 1975-1981. http:// dx.doi.org/10.1016/j.compositesa.2009.06.003
41 Rao, D. K. (2015). Tensile, compressive and flexural behaviour with characterization of hybrid bio-composite reinforced with walnut shell particles and coconut fibres. In International Conference On Advanced And Agile Manufacturing Systems
- ICAM-2015 (pp. 310-314). India: Kamla Nehru Institute of Technology
42 Pekgözlü, A. K., Gülsoy, S. K., & Ayçiçek, Y. (2017). Effect of stem height on the fiber morphology and chemical composition of European Black Pine (Pinus nigra Arnold.). Journal of Bartin Faculty of Forestry, 19(2), 74-81 http://dx.doi.org/10.24011/ barofd.342069
43 Kırcı, H., & Ateş, S. (2002). Anadolu karaçamı (Pinus nigra subsp. pallasiana) odunlarının asli hücre çeperi bileşenlerinin belirlenmesi ve kağıt hamuru üretimine uygunluğunun incelenmesi. In II Ulusal Karadeniz Ormancılık Kongresi (pp. 67-71). Türkiye: Karadeniz Technical University
44 Kılıç, A., Sarıusta, S. E., & Hafızoğlu, H. (2010). Chemical structure of compression wood of Pinus sylvestris, P. nigra and P. brutia. Journal of Bartin Faculty of Forestry, 12(18), 33-39. Retrieved in 2023, Jan 30, from https://dergipark.org. tr/en/download/article-file/300014
45. Ali, E. S., & Ahmad, S. (2012). Bionanocomposite hybrid polyurethane foam reinforced with empty fruit bunch and nanoclay. Composites. Part B, Engineering, 43(7), 2813-2816 http://dx.doi.org/10.1016/j.compositesb.2012.04.043.
46 Demirbas, A. (2006). Effect of temperature on pyrolysis products from four nut shells. Journal of Analytical and Applied Pyrolysis, 76(1-2), 285-289 http://dx.doi.org/10.1016/j.jaap.2005.12.012
47 Pirayesh, H., Khazaeian, A., & Tabarsa, T. (2012). (Juglans regia L.) shell as a raw material for wood-based particleboard manufacturing. Composites. Part B, Engineering, 43(8), 32763280 http://dx.doi.org/10.1016/j.compositesb.2012.02.016
Received: Jan. 30, 2023
Revised: Jul. 10, 2023
Accepted: Jul. 10, 2023
Polímeros, 33(2),
2023 8/8
Bal, B. C.
e20230020,
Development and characterization of sodium polyacrylate/ bentonite hydrogel with epoxy resin coating
Marcia Murakoshi Takematsu1* , Amanda Faria Baruel1 , Silvana Navarro Cassu1,2 , Milton Faria Diniz2
David Alexandro Graves1 and Rita de Cássia Lazzarini Dutra1
1Departamento de Química, Instituto Tecnológico da Aeronáutica – ITA, São José dos Campos, SP, Brasil 2Divisão de Propulsão, Instituto de Aeronáutica e Espaço – IAE, São José dos Campos, SP, Brasil
*marciatakematsu@gmail.com
Obstract
Composites are relevant to high-performance materials in the aerospace sector and have attracted the attention of the scientific and technological communities. Bentonites present very fine granulometry which enables their use in composites. This study showed the development of water absorbent composite based on sodium polyacrylate, bentonite coated by epoxy resin. Since there are gaps in the quantification of composite materials by near-infrared spectroscopy, especially by reflectance analysis (NIRA), this paper shows a quantification methodology (A7200/A5202) of sodium polyacrylate and bentonite. The methodology error found was 1.45% (95% of coefficient of determination). The effectiveness of the developed infrared methodology was verified showing that values are close to the nominal, especially for lower bentonite content. Besides, scanning electron microscopy (SEM) and universal attenuated total reflection (UATR) analysis evidenced the coating with the epoxy resin. Such development ensures rapid and precise methodologies that can be applied to the quality control of composite materials.
Keywords: bentonite, near-infrared spectroscopy, sodium polyacrylate.
How to cite: Takematsu, M. M., Baruel, A. F., Cassu, S. N., Diniz, M. F., Graves, D. A., & Dutra, R. C. L. (2023). Development and characterization of sodium polyacrylate/bentonite hydrogel with epoxy resin coating. Polímeros: Ciência e Tecnologia, 33(2), e20230021. https://doi.org/10.1590/0104-1428.20230029
1. Introduction
Basically, hydrogels are made up of the chemical or physical cross-linking of molecules and are a special class of polymers that absorb a considerable amount of water while maintaining their overall shape. Hydrogels are considered one of the most promising materials due to their unique properties and wide range of applications[1]. According to Agrawal et al.[2], resistant hydrogels have shown strong potential as structural biomaterials, including laponite clay-reinforced nanocomposite hydrogels. However, these materials alone have limited mechanical properties because synthetic hydrogel is weak and brittle.
Therefore, hydrogels consist of hydrophilic materials, more precisely, polymers formed by cross-linking, that can absorb a large mass amount of water or aqueous solution (more than 100 times their mass value). Superabsorbent polymers are polymers that are basically made up of the cross-links of monomers such as acrylamide and acrylate. Technological advances include the addition of materials to form superabsorbent composites. Clays, such as kaolinite, diatomite, vermiculite, alumina, and mica are added to the matrix polymer. The presence of minerals improves mechanical properties, water absorption capacity, and biodegradability. Bentonite is an abundant mineral, found in Brazil, is constituted of expandable clay, and can be used in these compositions[3]
In 2021, Wang et al.[4] reported a study about the preparation and characterization of GO (graphene oxide) / UHMWPE (ultra-high molar mass polyethylene) and a hydrogel based on polyacrylamide (PAAm) and GO composites for lubricant reinforcement of the UHMWPE polymeric material. It was observed that the UHMWPE polymer modified with the PAAm/GO hydrogel layer showed an improved ability to provide reinforcing effects. All abbreviations in this article are listed in Appendix A.
Additionally, new developments are pursued by Chen et al.[5], based on a binder of sodium polyacrylate and sodium silicate, used as an oxidation-resistant coating on titanium alloy, a material widely used in aerospace field, due to the attractive combination of properties such as high strength, low density, and good corrosion resistance.
In the last century, organic and inorganic compounds combining the advantages of both parts have attracted considerable attention of the scientific community and are widely applied in the fields of multi-functional and high-performance materials design in biomedicine, new batteries and sensors, automotive and aerospace design, and drug delivery[6]
It is known that the absorptive capacity of superabsorbent polymers is further increased when the acrylic acid is neutralized with a base such as sodium hydroxide (NaOH).
https://doi.org/10.1590/0104-1428.20230029 O O O O O O O O O O O O O O O Polímeros, 33(2), e20230021, 2023 ISSN 1678-5169 (Online) 1/11
,
The sodium ions neutralize the carboxylate groups. Thus, a large amount of moisture can be absorbed through osmosis. As the sodium ions are also hydrated, the distance between the carboxylate groups increases. The free carboxylate groups will repel each other once again in the crosslinking process, providing more space for water absorption[7]
Superabsorbent polymers such as sodium polyacrylate have the ability to absorb and retain large amounts of water and release it in a controlled manner under drought circumstances. These materials have been widely applied in many sector, such as, hygiene, agriculture, personal care, engineering, and aerospace[8]. Also popularly known as absorbent gels or floc gel, sodium polyacrylate revolutionized the market, especially for diapers, by reducing the average mass of diapers by 50% and also by its great capacity to absorb aqueous liquids[9]
According to Santos[10], potassium persulfate or ammonium persulfate is used as an initiator for the polymerization of superabsorbent polymers in aqueous media (Figure 1).
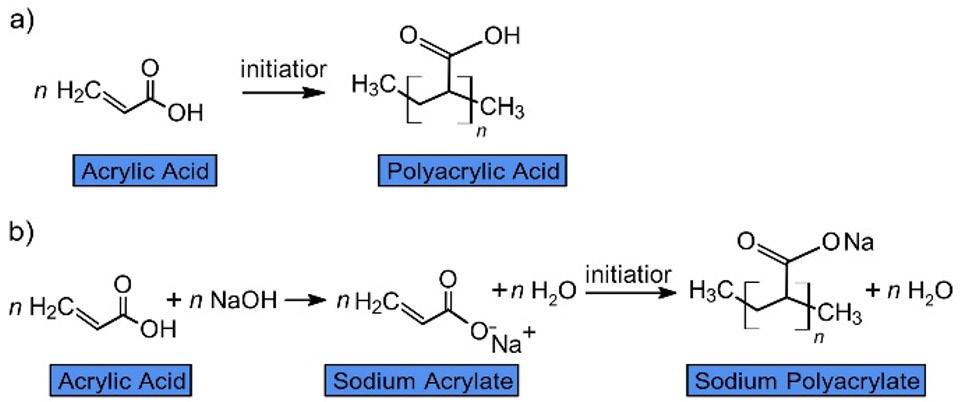
Moini & Kabiri[12] developed a superabsorbent polymer based on polyacrylates and crosslinking agents, such as diglycidyl ether of bisphenol A (DGEBA) and CAE (cycloaliphatic diepoxide), and used concentrations of 0.25% to 2.5% of two types of epoxy resins in a mixture of acetone and water (90:10) to surface cross-linking acrylicbased water absorbent particles. The resins used in Moini & Kabiri[12]’s research were diethylene glycol diglycidyl ether and 3,4-epoxycyclohexylmethyl-3,4-epoxycyclohexane carboxylate.
In 2017, Huang et al.[13] published research on a new class of composite called FRSC (Fiber-reinforced soft composites) using hydrogel in applications that require higher material strength and mechanical properties. This new material design has revolutionized the hydrogel field due to the synergistic effect provided by the flexibility of the hydrogel and the tensile strength of the synthetic fibers, resulting in a hydrogel component with extraordinary fracture toughness capability.
It is known that the manufacturing process of composites composed of fibers or inorganic materials constitutes the state of art regarding the application of highly resistant composites with hydrogels, which may have applicability in the aerospace sector since both constituent materials are already widely used in this sector’s technology. During the development of these composites that can be applied as water absorbers to prevent corrosion on the metal
structures of rocket engines and airplanes, variations in the composition of hydrogel polymers and minerals can be studied, as applications of reinforcements with epoxy resin, besides the appropriate characterization/quantification of these components in the manufactured material. In this context, the development of instrumental, fast, and precise methodologies addresses this objective.
Regarding instrumental techniques, there are studies in literature[3] which describe the use of Fourier transform infrared spectroscopy (FT-IR), among others for the characterization/quantification of superabsorbent hydrogels based on acrylamide and acrylate composite with bentonite or dolomite. However, only in the midinfrared region (MIR) and with the samples analyzed by transmission mode and prepared by potassium bromide pellet, that means through a conventional methodology, demanding a longer analysis time. Nevertheless, there are reflection and reflectance/transflectance techniques that can be used for this purpose, and the application of these techniques is one of the objectives of this study. Wen et al.[14] studied the development of a smart coating for corrosion protection of steel based on a hydrogel pre-loaded with the corrosion inhibitor benzotriazole (BTA). The morphology and composition of BTA and hydrogel were characterized by SEM (scanning electron microscopy), FT-IR, thermogravimetric analysis and differential exploratory calorimetry. The skeleton of this hybrid hydrogel contains organic and inorganic parts, in which the latter stabilizes the hybrid system, while the organic segments respond to external pH changes.
Concerning the research in composite materials, there are opportunities regarding the development, characterization, and quantification through instrumental techniques, among them, the FT-IR spectroscopy by reflection in the MIR and reflectance, which presents gaps in studies, especially in the near-infrared region (NIR). Therefore, this paper describes the development of different samples of hydrogels based on sodium polyacrylate and bentonite, forming a composite material with physicochemical properties for industrial and aerospace use, characterizing and/or quantifying its main components through methodology, involving less conventional techniques. Additionally, this study aimed to develop an epoxy resin coating in the sodium polyacrylate and bentonite water absorbent particles by virtue of ensuring appropriate coating material for aerospace application.
Polímeros, 33(2), e20230021, 2023 2/11
Takematsu, M. M., Baruel, A. F., Cassu, S. N., Diniz, M. F., Graves, D. A., & Dutra, R. C. L.
Figure 1. Synthesis reactions of (a) polyacrylic acid and (b) sodium polyacrylate[11]
Development and characterization of sodium polyacrylate/bentonite hydrogel with epoxy resin coating
2. Materials and Methods
2.1 Materials
Preparation of sodium polyacrylate with different bentonite contents with potassium persulfate (thermal initiator) for quantitative assay by FT-IR/NIRA (near-infrared reflectance analysis) was carried out with the following reagents: acrylic acid, supplied by Sigma Aldrich; NaOH solution 50% (w/w), prepared with NaOH PA supplied by Merck; potassium persulfate, supplied by Synth, and commercial bentonite - Bentone® 38 V CG, supplied by Elementis. Aradite GY260 with 182-196 g/Eq epoxide equivalent and amine curing agent (Ancamine DETA - diethylenetriamine) supplied by Weg, and acetone supplied by J T Baker were used to coat the sodium polyacrylate and bentonite composite. Deionized water was obtained from an 18 Ω Milli-Q Integral ultrapure water system.
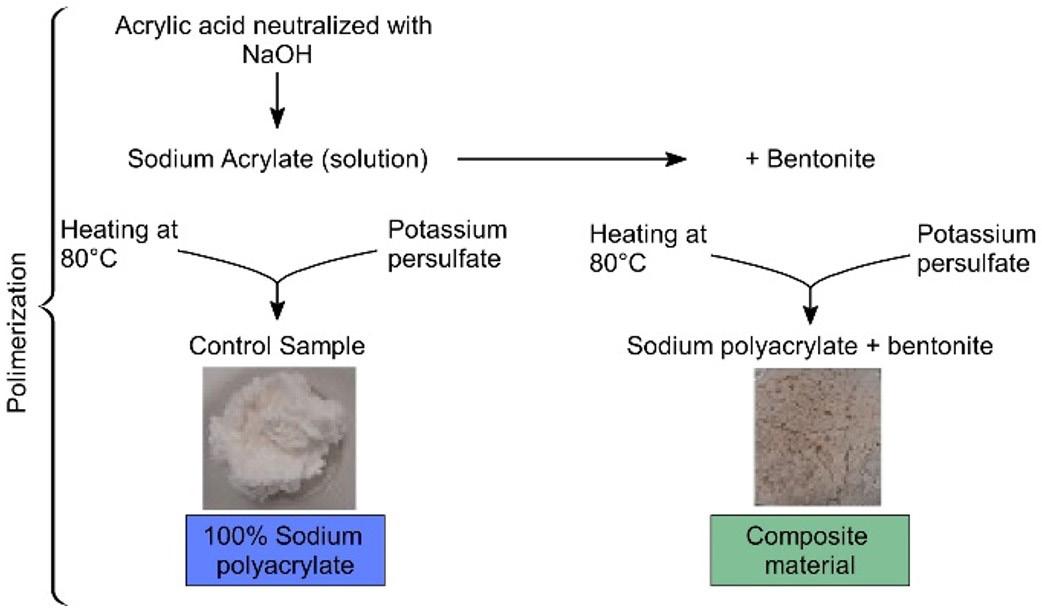
2.2 Preparation and qualitative characterization of composite
Composite samples were prepared by reacting the 50% NaOH solution with an aqueous solution of acrylic acid under stirring at 450 rpm. After complete homogenization of the solution, an aqueous solution of potassium persulfate was incorporated into the sodium polyacrylate solution. Each mixture was placed in an oven at 80°C to carry out the polymerization process. The composition of samples was based on literature that indicates the use of bentonite in the range about 5 to 25% in a sodium polyacrylate solution[15]. The samples prepared for the quantification studies by FT-IR comprehended the composition from 100% to 85% of sodium polyacrylate and 0% to 15% of bentonite. Also, “Test 1” sample (95% of sodium polyacrylate and 5% bentonite) and “Test 2” (88% of sodium polyacrylate and 12% bentonite) were prepared to verify the FT-IR methodology. Figure 2 shows the sequence of the preparation of samples of composites reinforced with and without bentonite.
After the polymerization step, the superabsorbent material with and without bentonite were submitted to the coating process with the epoxy resin, using the epoxy resin Aradite
GY260 (Hunstman) with 182-196 g/Eq epoxy equivalent and an amine curing agent (Ancamine DETA), kindly provided by the company Weg, which are solubilized in a medium of acetone: water (90:10), v/v, at concentrations of 0.5% and 2.5%. This second step of the prototype development procedure follows as shown in Figure 3
The specimens with the epoxy resin modified surface prepared as described above were analyzed by FT-IR spectroscopy using a PerkinElmer Spectrum One spectrometer with the Universal Attenuated Total Reflection (UATR) accessory, in the MIR region comprising 4000-400 cm-1, resolution 4cm-1, gain 1 and 20 scans. The samples were ground in an agate mortar and pestle.
Sodium polyacrylate without bentonite and with 10% bentonite, both coated with 0.5% and 2.5% epoxy resin, were analyzed by SEM microscopy as received. No thin coating of conductive material (carbon/gold) was required. The samples with and without epoxy resin coating were mounted on carbon tape and examined by secondary electrons imaging, respectively, with a scanning electron microscope model LEO 435 VPi - ZEISS and model MIRA 3 - TESCAN. The use of different SEM microscopes did not impact in the results of images, once the same parameters were established for the images acquisition.
2.3 FT-IR analysis conditions and quantification methodology
The samples were analyzed by FT-IR equipment (PerkinElmer Frontier FT-IR spectrometer) with the NIRA reflectance accessory between 12000 and 4000 cm-1, 4 cm-1 resolution, gain 1 and 120 scans. The sample was homogenized in an agate mortar with a pestle and then placed in a glass sample holder of NIRA accessory and a metal support that performs the reflectance on the detector was positioned on the sample. Each sample of composite and control (100% sodium polyacrylate) was analyzed 5 times following the procedure above. Each spectrum was obtained with the registration of transflectance measurement by FT-IR NIRA bands indicated by the wavenumber, thus comprising a total of 25 spectra measured by Frontier’s Spectrum software.
Polímeros, 33(2), e20230021, 2023 3/11
Figure 2. Solution polymerization with and without bentonite.
According to Lambert-Beer’s law, Equation 1 which rules quantitative infrared analysis was used to determine the calibration or analytical curves, relating the absorbance bands of composite obtained by FT-IR analysis[16]:
= Abc ε (1)
Where: A= absorbance; ε = molar absorptivity (characteristic of absorption); b = thickness; c = concentration. For relative bands, the thickness (b) of the analyzed sample will be the same in the sample spectrum, and when dividing one band absorbance by the other, b cancels out.
2.4 FT-IR methodologies verification
To verify the effectiveness of the developed FT-IR methodologies, the samples “Test 1” and “Test 2” were analyzed by the same conditions of samples used to calibrate the system. So, the median value was applied to the equation of plotted calibration curve[17].
3. Results and Discussions
3.1 FT-IR NIRA – quantification of sodium polyacrylate and bentonite
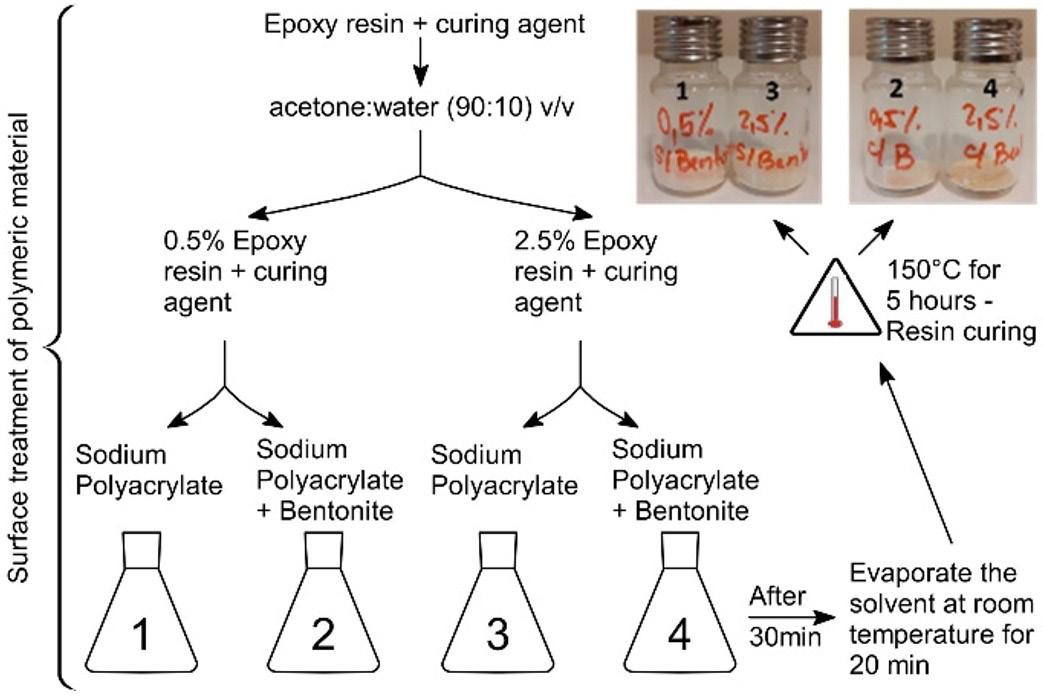
111
222 = Abc Abc ε ε (2)
According to Hórak & Vítek[17], for a small set of data, the median ( ˆ µ) is used instead of the average to calculate the relative deviation or relative error of a sample measurement.
R KR σ =× (3)
Where ˆ σ is the standard deviation, R represents the difference between the highest and the lowest absorbance values and R K equals 0.430 for 5 measures[17].
ˆ ó ˆ σµ = (4) ( ) % R0 ˆ D10 σµ µ =× (5)
Where σµ is the mean standard deviation, n represents the total number of measures, RD is the relative deviation and µ is the median absorbance value. The methodology errors (%) are calculated considering the median of RD, as described by Dutra & Soares[18]
Quality control of composite materials must be carried out to ensure the content uniformity to perform their purposed use. For this reason, this study approaches an effective and accurate analytical methods such as infrared spectroscopy as a qualitative and quantitative analysis, besides of the fact of this methodology by NIRA analysis is nondestructive, fast and could bring timesaving and costeffective.
First of all, the analytical bands of the components presented in the samples are represented in Figure 4. Since the intensity of these analytical bands increases or decreases according to the component content, the following are assigned below[19]:
• Sodium polyacrylate (P): 7015 cm-1 (third overtone of 1730 cm-1 band - stretching region of carbonyl group) and 5202 cm-1 (second overtone of the same carbonyl-stretching region);
• Bentonite (B): 7200 cm-1 (first overtone of the 3600 cm-1 band - stretching region of the hydroxyl group) and 4360 cm-1 (combination of fundamental MIR bands of bentonite around 3600 cm-1 and 1000 cm-1).
Although four bands have been assigned as shown in Figure 4 to determine P and B, in this present methodology applied for quantitative analysis it was assigned the band at 7200 cm-1 and at 5202 cm-1, for sodium polyacrylate and bentonite, respectively. Since these bands increase in
Takematsu, M. M.,
A.
C. L. Polímeros, 33(2), e20230021, 2023 4/11
Baruel,
F., Cassu, S. N., Diniz, M. F., Graves, D. A., & Dutra, R.
Figure 3. Coating of composite material with epoxy resin.
Development and characterization of sodium polyacrylate/bentonite hydrogel with epoxy resin coating
intensity value (measured by the height in the spectrum) as long as there is more concentration of the analyte, by estimating low standard error might occur in these regions used as reference for the quantification purpose.
The probable assignment of NIR absorptions is based on the information that the combination bands (sum of fundamental MIR bands) lie between 4000 and 5000 cm-1, while the overtones (multiples of fundamental MIR bands) are from 5000 to 12000 cm-1 [19] .
Therefore, samples were analyzed by FT-IR NIRA using these two assigned bands, and the relative intensity of absorption bands was evaluated by means of identification of analytical or relative bands for the quantification of sodium polyacrylate and bentonite, as detailed in the NIRA methodology 1 and 2.
calibration curve observed by this methodology and the methodology error is estimated at around 3.03%.
Since in the material composite samples, there are only sodium polyacrylate and bentonite, the concentration of sodium polyacrylate in test samples should be calculated by the difference of 100%.
3.1.1
NIRA Methodology 1: Calibration curve - intensity of absorbance at 7200 cm-1 analytical band versus bentonite content (%)
This methodology has been applied for quantitative analysis of bentonite compound in the composite material supported by intensity of analytical band absorbance measured by a suitable software. Table 1 shows the NIRA data obtained for the band at 7200 cm-1, measured with the baseline 7268 cm-1 at 6474 cm-1, and Figure 5 presents the
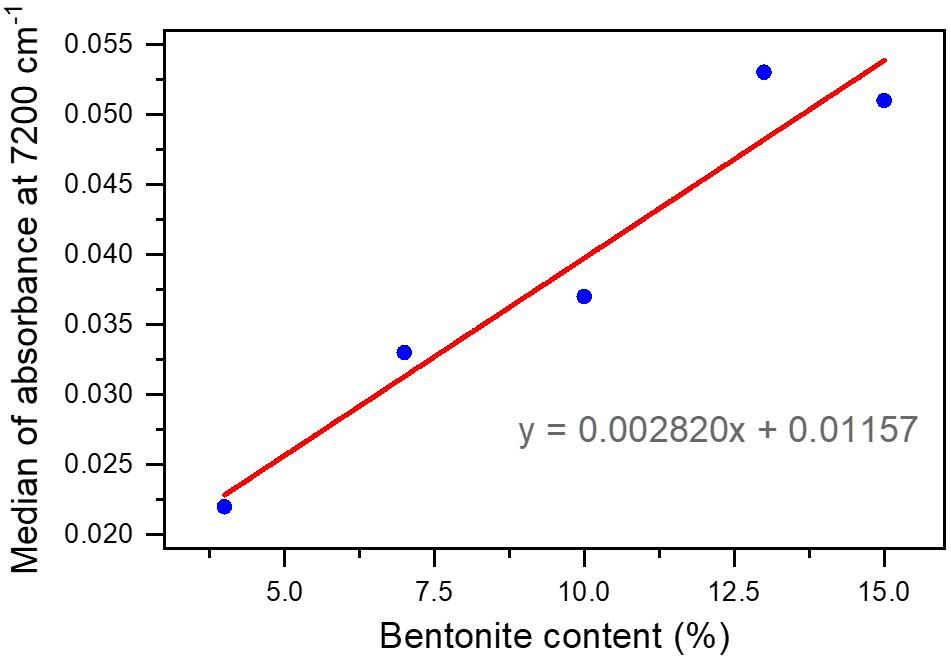
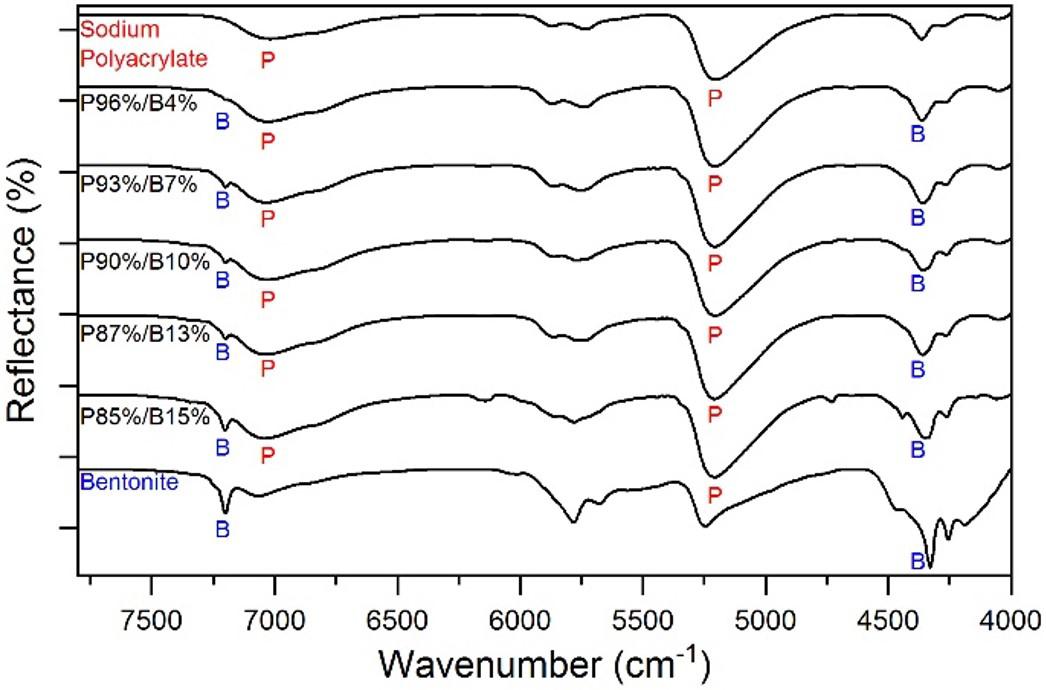
It was observed that there is a Lambert Beer’s law deviation of sample with 15% of bentonite, since in this concentration there was no increase of the absorbance value. This deviation may be associated with the lower intensities of NIR absorption bands. According to Smith[16], in order to avoid this type of deviation the analytical band should have an intensity equivalent to 20-80% of transmittance. Nevertheless, when this intensity is not attainable due to the concentration range of the analytes, the relative bands could be applied to minimizes the intensity measurement variation[20,21]. In order to evaluate the values using the relative bands, a new NIRA methodology was carried out and discussed in the next item.
3.1.2 NIRA Methodology 2: Calibration curve - intensity of A7200/A5202 relative band versus sodium polyacrylate/bentonite content (%)
Table 2 shows the data obtained for the bands at 7200 cm-1 and 5202 cm-1, measured to constitute the relative band
Polímeros, 33(2), e20230021, 2023 5/11
Sample A7200 (B) ˆ µ σ RD (%) 96% P/4%B 0.018; 0.019; 0.023; 0.022; 0.022 0.022 0.001 4.54 93% P/7% B 0.033; 0.033; 0.034; 0.033; 0.034 0.033 0.001 3.03 90% P/10% B 0.043; 0.039; 0.037; 0.036; 0.034 0.037 0.002 5.40 87% P/13% B 0.054; 0.057; 0.053; 0.052; 0.051 0.053 0.001 1.89 85% P/15% B 0.051; 0.051; 0.053; 0.049; 0.050 0.051 0.001 1.51
Table 1. NIRA Methodology 1 (A7200) for samples with different contents of P and B.
Figure 4. Comparison of FT-IR/NIRA spectra of sodium polyacrylate, bentonite and their composite combination.
Figure 5. NIRA methodology 1 using A7200 - calibration curve for the samples with different bentonite contents.
Sample A7200 (B)/A5202 (P) ˆ µ ˆ σ RD (%) 96% P/4%B 0.085; 0.082; 0.103; 0.100; 0.100 0.100 0.004 4.00 93% P/7% B 0.191; 0.178; 0.188; 0.179; 0.186 0.186 0.002 1.08 90% P/10% B 0.212; 0.194; 0.196; 0.191; 0.185 0.194 0.005 2.58 87% P/13% B 0.276; 0.266; 0.276; 0.283; 0.264 0.276 0.004 1.45 85% P/15% B 0.313; 0.293; 0.312; 0.290; 0.301 0.301 0.004 1.33
Table 2. NIRA 2 methodology (A7200/A5202) for samples of different levels of sodium polyacrylate and bentonite.
A7200/A5202 that includes the characteristic bands of bentonite and sodium polyacrylate, respectively. Figure 6 shows the curve plotted for this methodology. The baseline used for the 5202 cm-1 band was 5412 cm-1 to 4888 cm-1; for 7200 cm-1 absorption was in the same range as already mentioned for the calibration curve plotted only with this band. The methodology error is around 1.45%.
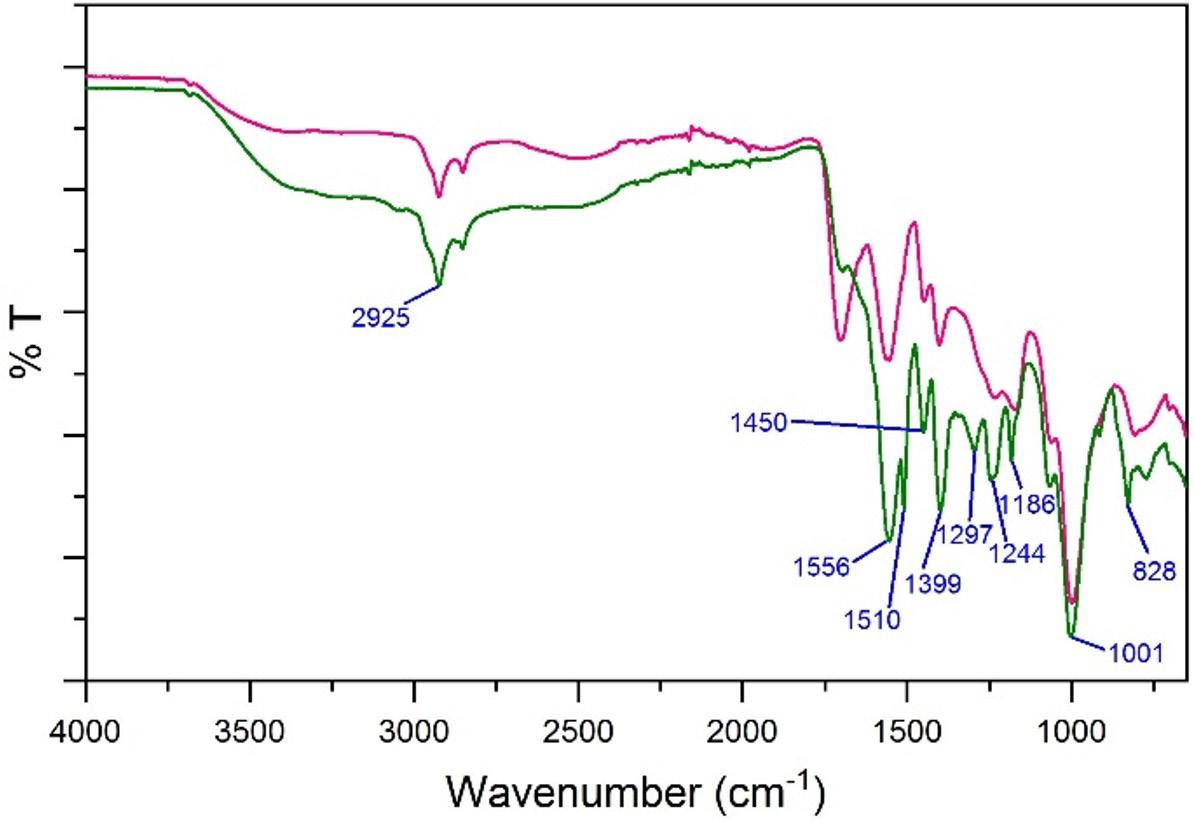
Table 3 shows a comparison of data obtained in the two methodologies, aiming at the evaluation of the results and the choice of the most appropriate one to determine the levels of sodium polyacrylate and bentonite contents.
The best methodology for determination of sodium polyacrylate and bentonite content is NIRA methodology 2. The calibration curve equation of methodology NIRA 2 showed a good linearity (R=0.976), without deviations of Lambert-Beer law and the result of R2=0.95 means that 95% of the data can be explained by the methodology. Therefore, it is an indication that this methodology met the goal since the methodology error was calculated as 1.45% attending the acceptance criteria of ≤ 2%[17]
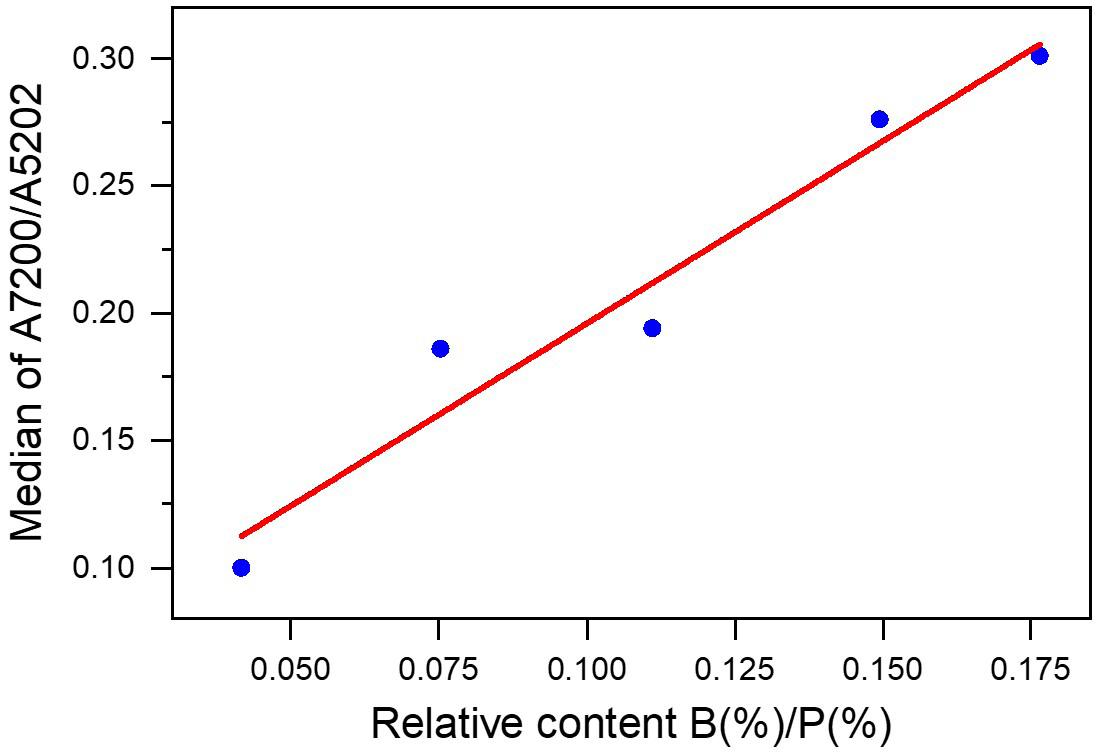
Test samples were also analyzed to verify the effectiveness of the developed NIRA methodologies. NIRA methodology 1 was tested and the content results including the RD (%) for the proposed test samples are shown in Table 4.
Through the data in Table 4, it is possible to observe that NIRA methodology 1 adjusts better to intermediate values of the studied bentonite range, while for lower values there are greater errors (Table 1), in accordance with the deviation found of the Lambert-Beer law[16]. For this reason, the results of “Test 2” were more according to the expected results and the RD% was also minor than the sample “Test 1”.
One parameter that suggests that NIRA methodology 2 can meet the goal is the error of 1.45%, because it is
within the reference value of ≤ 2%[17]. In addition, this value is also much lower than the expected error (8-10%) in the quantitative analysis of powders by FT-IR conventional methodology using transmission mode and pellet to incorporate the samples[16]
So, NIRA methodology 2 was tested by means of the relative band A7200/A5202 which includes the characteristic bands of bentonite/sodium polyacrylate. The results and the RD (%) of the proposed test samples are displayed in Table 5. Through the equation of methodology 2 described in Table 3, where x = relative concentration of B/P and given that [B] + [P] = 100%, the values of each component in the sample were determined. According to the data in Table 5, it is possible to observe that NIRA methodology 2 shows that values are close to the nominal, especially for lower bentonite content, with a relative error between 1.71-3.74%.
3.2 Qualitative analysis by FT-IR/MIR/UATR and SEM analysis of the new prototypes with epoxy resin-based
The samples were developed with 0.5% and 2.5% epoxy resin with the purpose of coating and were analyzed by UATR . The spectra obtained related to sodium polyacrylate and bentonite composite coated with 0.5% and 2.5% epoxy resin are shown in Figure 7. The analysis of the epoxy resin used as a coating in this work was performed by UATR, and the characteristic bands of epoxy resins are found at ~1295 cm-1 (ν C-O ether) and ~914 cm-1 (epoxide group vibration). For the cure agents, it is found that the absorption regions of the N-H (ν) stretching vibration at ~3400 –3200 cm-1, and also in the region ~1590 cm-1, assigned to the NH2 angular bending (δ)[16]. These results contributed to the characterization of the coating of the polymer developed based on sodium polyacrylate and bentonite.
Polímeros, 33(2), e20230021, 2023 6/11
Takematsu, M. M., Baruel, A. F., Cassu, S. N., Diniz, M. F., Graves, D. A., & Dutra, R. C. L.
Methodology Error (%) Equation R R2 1 3.03 y = 0.0028x+0.0116 0.968 0.94 2 1.45 y = 1.4333x+0.0525 0.976 0.95
Table 3. FT-IR data obtained for the two NIRA methodologies for sodium polyacrylate and bentonite system.
Figure 7. FT-IR/UATR spectra of composite samples treated with 0.5% (pink spectrum) and 2.5% epoxy resin (green spectrum).
Figure 6. NIRA methodology 2 using relative bands (A7200/A5202)calibration curve for the samples with relative contents of bentonite and sodium polyacrylate.
Since the absorption in these regions increases, the content of the resin in the particles also increases. These spectral results by FT-IR of surface analysis demonstrated that the treatment with the epoxy resin is effective.
According to Andrade et al.[22], epoxy adhesives are materials used in the interfaces to adhere metal/metal, carbon-carbon/aluminum and graphite/aluminum. Because of this interface could be exposed to high mechanical stress, the authors emphasize the importance of avoiding cracks in the materials used in aerospace applications, and the need to accommodate the tensions generated in the adhesion region. Therefore, different materials and instrumental techniques including FT-IR have been used for the characterization study of these epoxy systems, contributing with data to the state of the art of this line of research[23]
Formulation of clay - polymer hydrogel based is cited in a recent study but the FT-IR analyses were conducted in MIR region by conventional transmission mode to identify the presence of functional groups existing in starting materials[24]. Then, this actual paper about the development and characterization of sodium polyacrylate/bentonite hydrogel with epoxy resin coating, considering reflection (UATR) and reflectance (NIRA) modes that contribute with data to the state of the art of this line of research.
SEM analyses are crucial to evidence the coating of epoxy resin in sodium polyacrylate with and without bentonite. First off, to give a comprehensive overview of the structures captured without epoxy resin coating, images by SEM shown in Figure 8a (sodium polycrylate without bentonite) and Figure 8b (sodium polyacrylate with 10% of bentonite) display particles which do not present different contrast formation mechanism in SEM images that evidences the absence of epoxy resin coating. The regions marked in blue are showing the presence of bentonite particles.
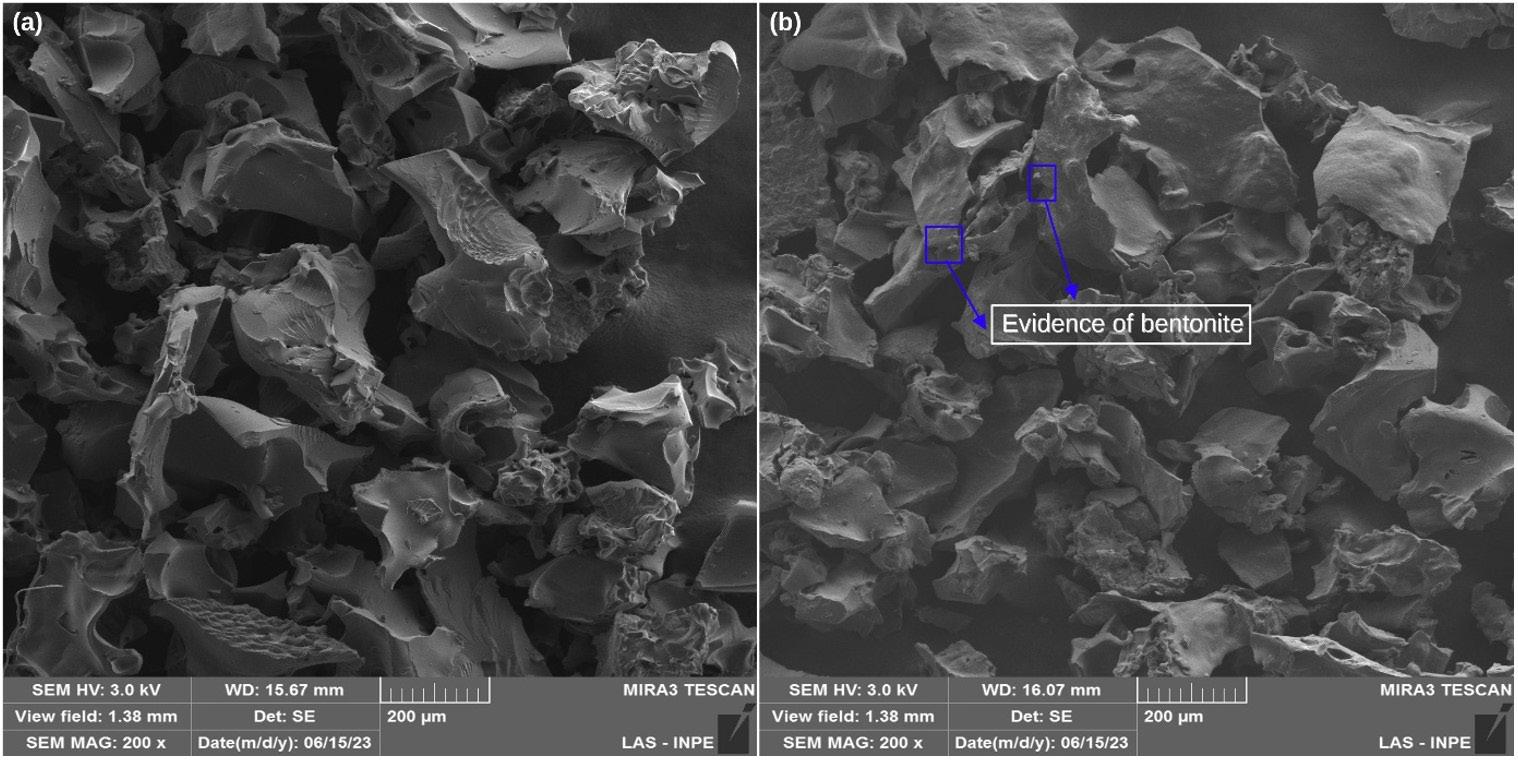
On the other hand, it is observed from SEM images, in Figure 9b and Figure 9c, that the particles with and without bentonite can be easily differentiated by the appearance of their surfaces. The composites have the superficial appearance of a cluster of bentonite particles and it can be observed that these particles are completely aggregated to the sodium polyacrylate polymer. On the other hand, sodium polyacrylate particles without bentonite have a smooth surface and more pronounced concave parts.
Figure 9 shows clearly that the coating by epoxy resin in the 2.5% sample (Figure 9a and Figure 9b) was superior to the 0.5% samples (Figure 9c and Figure 9d), suggesting that the process used to adhere the resin to the particles is
Development
Polímeros, 33(2), e20230021, 2023 7/11
and characterization of sodium polyacrylate/bentonite hydrogel with epoxy resin coating
Sample A7200 ˆ µ RD (%) Result Test 1 0.033; 0.030; 0.033; 0.034; 0.034 0.033 3.03 92.36% (P) 7.64% (B) Test 2 0.051; 0.043; 0.047; 0.045; 0.045 0.045 2.22 88.07 (P) 11.93 (B)
Table 4. Results of the test samples according to the calibration curve of Methodology 1.
Sample A7200/A5202 µ RD (%) Result Test 1 0.107; 0.095; 0.105; 0.111; 0.114 0.107 3.74 96.34% (P) 3.66% (B) Test 2 0.185; 0.169; 0.175; 0.173; 0.175 0.175 1.71 92.17% (P) 7.83% (B)
Table 5. Results of the test samples according to the calibration curve of NIRA methodology 2.
Figure 8. SEM of samples without epoxy resin coating: (a) Sodium polyacrylate and (b) Sodium polyacrylate with bentonite.
successfully performed and that the curing procedure is also consolidated on the surface of them.
The red arrows in Figure 9 are indicating the evidence of the epoxy resin coating in the particle, forming a film of a very thin aspect on the surface. Furthermore, the blue ones in the same figure are evidencing the presence of bentonite particles in the sodium polyacrylate.
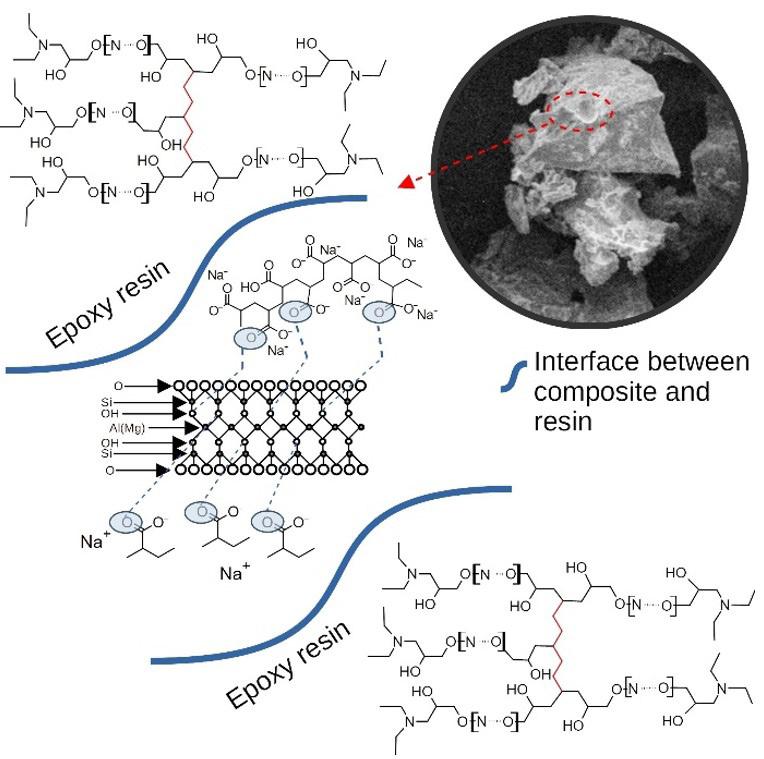
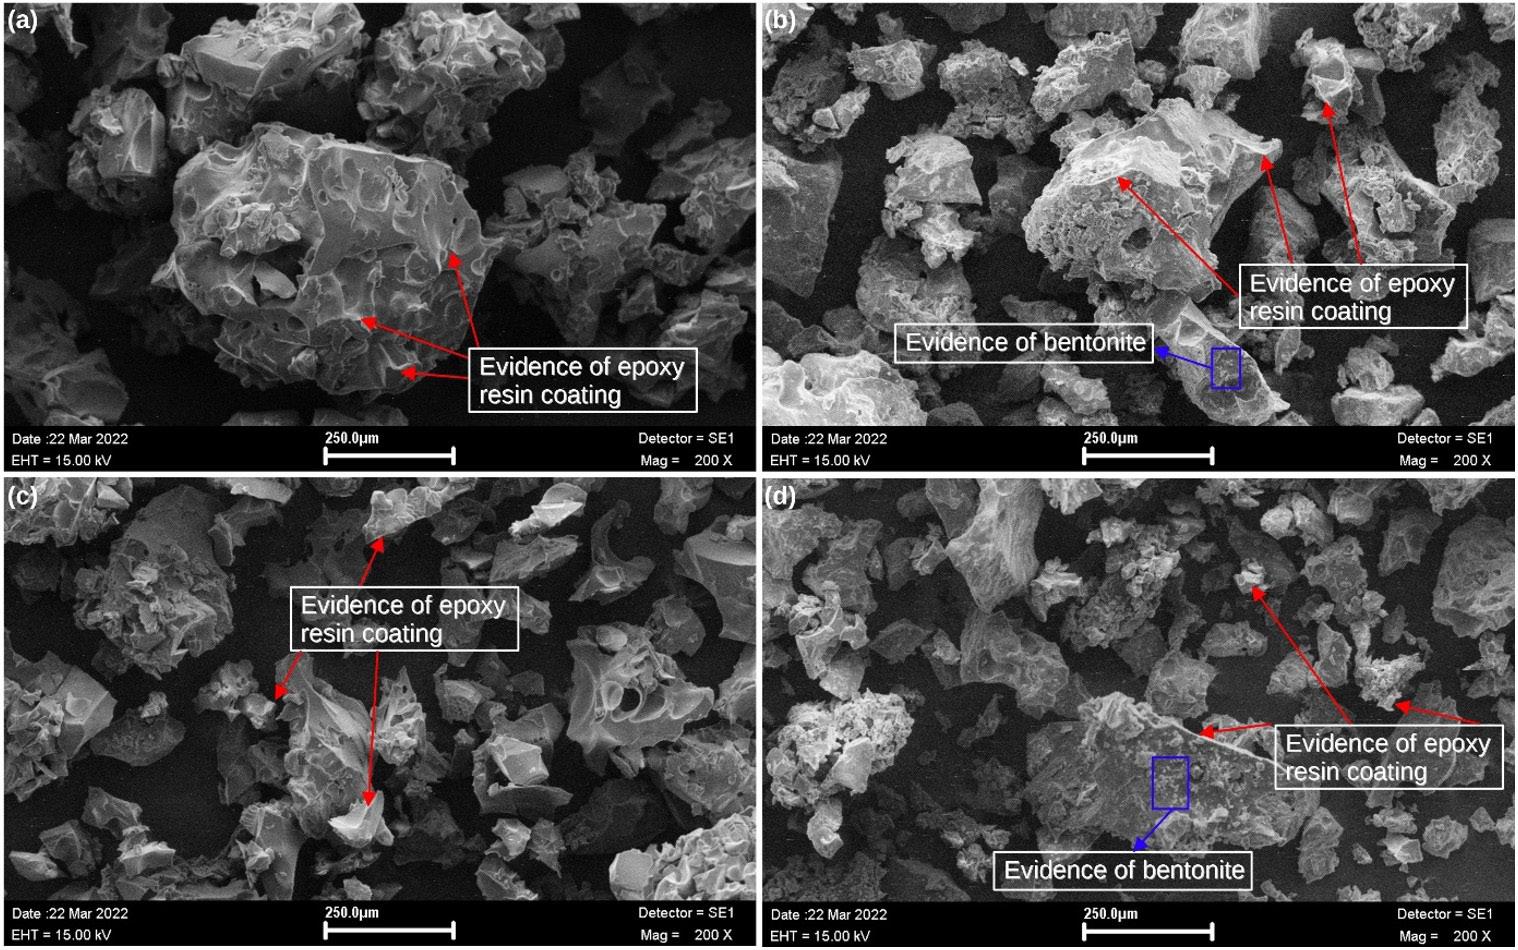
Polímeros, 33(2), e20230021, 2023 8/11
Takematsu, M. M., Baruel, A. F., Cassu, S. N., Diniz, M. F., Graves, D. A., & Dutra, R. C. L.
Figure 10 presents the schematic of the physicochemical interaction between the sodium polyacrylate and bentonite composite with the epoxy resin coating. By the images observed by SEM, it is noted that there is an interface between the composite or sodium polyacrylate and the coating material, since there is the presence of two distinct phases (particle and coating). As the coating layer with epoxy
Figure 9. SEM of samples coated with 2.5% epoxy resin: (a) Sodium polyacrylate and (b) Sodium polyacrylate with bentonite. Samples coated with 0.5% epoxy resin: (c) Sodium polyacrylate and (d) Sodium polyacrylate with bentonite.
Figure 10. Schematic model of the physicochemical interaction between the sodium polyacrylate and bentonite and epoxy resin coating.
Development and characterization of sodium polyacrylate/bentonite hydrogel with epoxy resin coating
resin is very thin, it is possible to observe a perfect layer of interface stated by the red arrows. Also, a good adhesion of the resin material in the particles was observed as well, in the sodium polyacrylate polymer and composite material.
4. Conclusions
Since this paper aimed to develop epoxy resin coated hydrogel composite based on sodium polyacrylate/bentonite and the quantify the two last components by a rapid and precise FT-IR spectroscopy methodology, it is possible to conclude that with the use of a thermal initiator and heating, it was possible to develop a superabsorbent composite using acrylic acid, sodium hydroxide, bentonite and potassium persulfate, as starting materials.
Two methodologies were proposed in this paper with analytical or relative bands to quantify bentonite and sodium polyacrylate in the composite material. According to the study, the most robust methodology for the quantification was using the relative band A7200/A5202, referring respectively to bentonite and sodium polyacrylate, because the resulting calibration curve A7200/A5202 versus the relative content of bentonite and sodium polyacrylate showed data of R, R2, and methodology error very consistent and expected for this analytical technique. Thus, through the NIR reflectance technique, it is possible to suggest a quantification study of this hydrogel composite.
Regarding the practical applications of this study, it is possible to suggest the use of the developed hydrogel composite in the aerospace sector, especially in anti-corrosive applications due to the water absorption, with a fast and precise quantification methodology. This methodology can contribute to the state of the art of research as a model for quantification by NIRA of sodium polyacrylate and bentonite in different levels, once this FT-IR mode for this composite was not found in the literature.
The epoxy resin widely used in aerospace can be applied as a material coating of this composite. It is possible to conclude that the adhesion process of the epoxy resin material is consolidated on sodium polyacrylate particles with and without 10% bentonite.
5. Author’s Contribution
• Conceptualization – Marcia Murakoshi Takematsu; Rita de Cássia Lazzarini Dutra.
• Data curation – NA.
• Formal analysis – NA.
• Funding acquisition – Rita de Cássia Lazzarini Dutra.
• Investigation – Marcia Murakoshi Takematsu; Amanda Faria Baruel.
• Methodology – Marcia Murakoshi Takematsu; Milton Faria Diniz; Rita de Cássia Lazzarini Dutra.
• Project administration – NA.
• Resources – Marcia Murakoshi Takematsu; Milton Faria Diniz; David Alexandro Graves.
• Software – NA.
• Supervision – Marcia Murakoshi Takematsu; Silvana Navarro Cassu; Amanda Faria Baruel; Rita de Cássia Lazzarini Dutra
• Validation – NA.
• Visualization – David Alexandro Graves, Marcia Murakoshi Takematsu.
• Writing – original draft – Marcia Murakoshi Takematsu; Rita de Cássia Lazzarini Dutra.
• Writing – review & editing – Marcia Murakoshi Takematsu; Silvana Navarro Cassu; Rita de Cássia Lazzarini Dutra.
6. Acknowledgements
The authors disclosed receipt of the following financial support for the research, authorship, and/or publication of this article. This work was supported, in part, by the Coordenação de Aperfeiçoamento de Pessoal de Nível Superior - Brasil (CAPES) - Finance Code 001 and by the Conselho Nacional de Desenvolvimento Científico e Tecnológico (CNPQ). Finance Code 301626/2022-7. The authors would like to thank Thiago Sidooski and Joyce Baracho Azevedo for their technical support. The authors declare that they have no known competing financial interests or personal relationships that could have appeared to influence the work reported in this paper.
7. References
1 Wang, W., Narain, R., & Zeng, H. (2020). Hydrogels. In R. Narain (Ed.), Polymer Science and Nanotechnology (pp. 203-244). UK: Elsevier http://dx.doi.org/10.1016/B978-012-816806-6.00010-8
2 Agrawal, A., Rahbar, N., & Calvert, P. D. (2013). Strong fiberreinforced hydrogel. Acta Biomaterialia, 9(2), 5313-5318 http:// dx.doi.org/10.1016/j.actbio.2012.10.011 PMid:23107796.
3. Magalhães, A. S. G., Almeida Neto, M. P., Bezerra, M. N., & Feitosa, J. P. A. (2013). Superabsorbent hydrogel composite with minerals aimed at water sustainability. Journal of the Brazilian Chemical Society, 24(2), 304-313 http://dx.doi. org/10.5935/0103-5053.20130039.
4 Wang, C., Bai, X., Guo, Z., Dong, C., & Yuan, C. (2021). A strategy that combines a hydrogel and graphene oxide to improve the water-lubricated performance of ultrahigh molecular weight polyethylene. Composites. Part A, Applied Science and Manufacturing, 141, 106207 http://dx.doi.org/10.1016/j. compositesa.2020.106207
5 Chen, G. Q., Li, N. N., Fu, X. S., & Zhou, W. L. (2012). Preparation and characterization of a sodium polyacrylate/ sodium silicate binder used in oxidation resistant coating for titanium alloy at high temperature. Powder Technology, 230, 134-138 http://dx.doi.org/10.1016/j.powtec.2012.07.020
6. Chen, Y.-G., Liao, R.-P., Yu, C., & Yu, X. (2020). Sorption of Pb(II) on sodium polyacrylate modified bentonite. Advanced Powder Technology, 31(8), 3274-3286 http://dx.doi.org/10.1016/j. apt.2020.06.011
7. Kleijn, P., & Reezigt, H. (2005). FR Patent No. EP 1 522 545 A1 France. Retrieved in 2023, April 15, from https://worldwide. espacenet.com/patent/search/family/034309618/publication/ EP1522545A1?q=pn%3DEP1522545A1
8 Zhong, K., Lin, Z.-T., Zheng, X.-L., Jiang, G.-B., Fang, Y.-S., Mao, X.-Y., & Liao, Z.-W. (2013). Starch derivativebased superabsorbent with integration of water-retaining and
Polímeros, 33(2), e20230021, 2023 9/11
controlled-release fertilizers. Carbohydrate Polymers, 92(2), 1367-1376 http://dx.doi.org/10.1016/j.carbpol.2012.10.030 PMid:23399166.
9 Marconato, J. C., & Franchetti, S. M. (2002). Polímeros superabsorventes e as fraldas descartáveis. Química Nova na Escola, 15, 42-44. Retrieved in 2023, April 15, from http:// qnesc.sbq.org.br/online/qnesc15/v15a09.pdf
10 Santos, R. V. A. (2015). Polímeros superabsorventes: processos de produção, aplicações e mercado (Master’s dissertation). Universidade Federal da Bahia, Salvador.
11 Khanlari, S., & Dubé, M. A. (2015). Effect of pH on poly(acrylic acid) solution polymerization. Journal of Macromolecular Science, Part A: Pure and Applied Chemistry, 52(8), 587-592 http://dx.doi.org/10.1080/10601325.2015.1050628
12. Moini, N., & Kabiri, K. (2015). Effective parameters in surface cross-linking of acrylic-based water absorbent polymer particles using bisphenol A diethylene glycidyl ether and cycloaliphatic diepoxide. Iranian Polymer Journal, 24(11), 977-987. http:// dx.doi.org/10.1007/s13726-015-0386-4
13 Huang, Y., King, D. R., Sun, T. L., Nonoyama, T., Kurokawa, T., Nakajima, T., & Gong, J. P. (2017). Energy-dissipative matrices enable synergistic toughening in fiber reinforced soft composites. Advanced Functional Materials, 27(9), 1605350 http://dx.doi.org/10.1002/adfm.201605350
14 Wen, J., Lei, J., Chen, J., Gou, J., Li, Y., & Li, L. (2020). An intelligent coating based on pH-sensitive hybrid hydrogel for corrosion protection of mild steel. Chemical Engineering Journal, 392, 123742 http://dx.doi.org/10.1016/j.cej.2019.123742
15 Cukrowicz, S., Sitarz, M., Kornaus, K., Kaczmarska, K., Bobrowski, A. , Gubernat , A. , & Grabowska , B. ( 2021 ). Organobentonites modified with poly(acrylic acid) and its sodium salt for foundry applications. Materials (Basel) , 14 ( 8 ), 1947 http://dx.doi.org/10.3390/ma14081947 PMid:33924570.
16 Smith A. L. (1979). Applied infrared spectroscopy: fundamentals techniques and analytical problem-solving USA: WileyInterscience Publication
17 Hórak, M., & Vítek, A. (1978). Interpretation and processing of vibrational spectra. USA: Wiley-Interscience Publication.
18 Dutra, R. C. L., & Soares, B. G. (1998). Determination of the vinyl mercaptoacetate content in poly(ethylene-co-vinyl acetate-co-vinyl mercaptoacetate) (EVASH) by TGA analysis and FTIR spectroscopy. Polymer Bulletin, 41(1), 61-67 http:// dx.doi.org/10.1007/s002890050333
19 Goddu, R. F. (1960). Near-infrared spectrophotometry. In C. N. Reilly (Ed.), Advances in analytical chemistry and instrumentation (pp. 347-425). USA: Interscience.
20 Magalhães, R. F., Barros, A. H., Takematsu, M. M., Passero, A., Diniz, M. F., Sciamareli, J., & Dutra, R. C. L. (2022). Infrared reflectance techniques applied to silica particles diameter determination - theoretical and experimental data. Anais da Academia Brasileira de Ciências, 94(3), e20210545 http:// dx.doi.org/10.1590/0001-3765202220210545. PMid:36259823.
21 Barros, A. H., Murakami, L. M. S., Magalhães, R. F., Takematsu, M. M., Diniz, M. F., Sanches, N. B., Dutra, J. C. N., & Dutra, R. C. L. (2023). Infrared quantification of binary rubber blends with overlapping bands. Anais da Academia Brasileira de Ciências, 95(1), e20220289 http://dx.doi.org/10.1590/0001-3765202320220289
22 Andrade, H. P. C., Diniz, M. F., Azevedo, M. F. P., Cassu, S. N., Lourenço, V. L., & Dutra, R. C. L. (2008). Cure behavior of epoxy adhesive containig mercaptan group evaluated by infrared spectroscopy (MIR/NIR) and differential scanning calorimetry (DSC). Polímeros: Ciência e Tecnologia, 18(4), 359-365 http://dx.doi.org/10.1590/S0104-14282008000400017
23 Janzen, D. A., Diniz, M. F., Azevedo, J. B., Pinto, J. R. A., Sanches, N. B., & Dutra, R. C. L. (2021). Qualitative and quantitative evaluation of epoxy systems by fourier transform infrared spectroscopy and the flexibilizing effect of mercaptans. Anais da Academia Brasileira de Ciências, 93(2), e20200799 http:// dx.doi.org/10.1590/0001-3765202120200799. PMid:33950143.
24 Tsiklauri, L., & Getia, M. (2023). Formulation and assessment of clay - polymer hydrogel based on Georgian bentonite. Georgian Scientists, 5(1), 72-80. http://dx.doi.org/10.52340/ gs.2023.05.01.05
Received: Apr. 16, 2023
Revised: Jul. 01, 2023
Accepted: Jul. 11, 2023
Polímeros, 33(2), e20230021, 2023 10/11
Takematsu, M. M., Baruel, A. F., Cassu, S. N., Diniz, M. F., Graves, D. A., & Dutra, R. C. L.
Development and characterization of sodium polyacrylate/bentonite hydrogel with epoxy resin coating
Appendix A. Abbreviations.
A: Absorbance
B: Bentonite
BTA: Benzotriazole
CAE: Cycloaliphatic diepoxide
DETA: Diethylenetriamine
DGEBA: Diglycidyl ether of bisphenol A
FRSC: Fiber-reinforced soft composites
FT-IR: Fourier transform infrared spectroscopy
GO: Graphene oxide
MIR: Mid-infrared region
NaOH: Sodium hydroxide
NIR: Near-infrared region
NIRA: Near-infrared reflectance analysis
P: Sodium polyacrylate
PAAm: Polyacrylamide
RD: Relative deviation
SEM: Scanning electron microscopy
UATR: Universal attenuated total reflection
UHMWPE: Ultra-high molar mass polyethylene
Polímeros, 33(2), e20230021, 2023 11/11
Superabsorbent biodegradable CMC membranes loaded with propolis: Peppas-Sahlin kinetics release
Juliana Paes Leme de Mello Sousa1 , Renata Nunes Oliveira1* , Antonia Monica Neres Santos1 , Ormindo Domingues Gamallo2 , Leonardo Sales Araújo3 , Antonieta Middea4 , Yara Peluso Cid1 and Rosane Nora Castro1
1Programa de Pós-Graduação em Química, Instituto de Química, Universidade Federal Rural do Rio de Janeiro, Seropédica, RJ, Brasil
2Programa de Pós-Graduação em Engenharia de Alimentos, Departamento de Engenharia de Alimentos, Universidade Federal Rural do Rio de Janeiro, Seropédica, RJ, Brasil
3Programa de Pós-graduação em Engenharia metalúrgica e de Materiais, Departamento de Engenharia metalúrgica e de Materiais, Universidade Federal do Rio de Janeiro, RJ, Brasil
4Centro de Tecnologia Mineral, Setor de Caracterização Tecnológica, Centro de Tecnologia Mineral, Universidade Federal do Rio de Janeiro, RJ, Brasil
*renatanunes.ufrrj@gmail.com
Obstract
Propolis is a resinous product collected by honeybees with a complex chemical composition. Sodium carboxymethylcellulose is a polymer commonly used in wound care. The goal of the present work was to produce and characterize NaCMC membranes loaded with extract of Brazilian brown propolis (CMC-P). Flavonoids and phenolic acids were identified in the propolis extracts, where the main identified substance was kaempferide. The brown propolis extracted was active against S. aureus. The low swelling capacity and high gel fraction of CMC-P would be the consequence of propolis (responsible for a hydrophobic barrier) filling the pores of the membrane. Propolis could be anchoring the NaCMC chains (as observed by FTIR) due to interaction between components, which is corroborated by the CMC-P sample degrading less than the CMC sample (>400ºC). There was non-linear diffusion release kinetics for most phenolic substances of the propolis extract. The CMC-P sample presents potential as a dressing material.
Keywords: wound care, NaCMC hydrogel, propolis release.
How to cite: Sousa, J. P. L. M., Oliveira, R. N., Santos, A. M. N., Gamalho, O. D., Araújo, L. S., Middea, A., Cid, Y. P., & Castro, R. N. (2023). Superabsorbent biodegradable CMC membranes loaded with propolis: Peppas-Sahlin kinetics release. Polímeros: Ciência e Tecnologia, 33(2), e20230022. https://doi.org/10.1590/0104-1428.20230010
1. Introduction
Wound healing is a complex process contemplating the following steps: hemostasis (vascular constriction, thrombus formation), inflammation (neutrophil, monocyte, and lymphocyte infiltration), proliferation (angiogenesis, collagen synthesis, and extracellular matrix formation), and remodeling (collagen remodeling).[1][2] Wound proper care should reach the previous steps without delay. However, the World Health Organization highlights the importance of wound proper care to avoid infection, since up to 30% of patients in intensive care develop an infection.[3][4] Wound infection can be considered a major cause of healing delay and high costs related to it.[5] Regarding skin wound infection microorganisms, P. aeruginosa (gram-negative) and S. aureus (gram-positive) are common bacteria that colonize wounds.[1] Infection control might be difficult since to avoid bacterial resistance, the rational usage of systemic antibiotics is advised.[6] Infection kinetics is also a variable process, but usually, Gram-positive bacteria are the first ones to colonize the wound site (1st week of
infection), followed by gram-negative bacterial colonization. Regarding P. aeruginosa and S. aureus resistance, they usually are resistant to several antibiotics, e.g., methicillin,[7] carbapenems,[8] cephalosporins (3rd generation antibiotics)[9] Bee products like honey are known to inhibit both, grampositive and gram-negative resistant mechanisms, due to their broad spectrum of activity.[10] In addition, propolis, at proper amounts, can be bacteriostatic and even bactericide on wound infections without inducing bacterial resistance.[11] Propolis is a beehive product containing mainly beeswax and resins obtained from plants. Apis Mellifera bees produce propolis to seal the hive, protecting it from insects and pathogenic microorganisms. More than 300 substances have been identified in different propolis and their composition varies according to the region of collection, the season of the year, species of bees, and local flora.[12][13] Propolis presents antibacterial, antioxidant, antifungal, anti-inflammatory, and wound-healing properties.[14] Different classes of compounds, including hydrocarbons, fatty acids, fatty esters, flavonoids,
https://doi.org/10.1590/0104-1428.20230010 O O O O O O O O O O O O O O O Polímeros, 33(2), e20230010, 2023 ISSN 1678-5169 (Online) 1/12
phenolic acids, and phenolic esters have been reported in propolis around the world.[15][16] The color of propolis varies from dark green to reddish, and its composition depends on the plant source of the resin. The most studied Brazilian propolis is the green type originating from Baccharis dracunculifolia and produced mainly in the southeast of Brazil.[12] Other types of Brazilian propolis are known, such as brown and yellow ones, but with undetermined plant origin. Although its geographical origin is unknown, Brazilian brown propolis is rich in terpenes,[17] while Brazilian yellow propolis can be considered rich in triterpenoids.[18]
Propolis’ effects on wound healing are according to its composition. Nonetheless, flavonoids’ bactericide mechanism includes damage to bacteria’s cytoplasmic membrane and inhibition of nucleic acid synthesis.[19] Regarding propolis application in wound care, green and red propolis have been successfully applied in Wistar rats’ wounds. Although red propolis presented high amounts of flavonoids, green propolis led to high reepithelization,[20] also controlling inflammatory response.[21] Red propolis was tested in male Wistar rats’ wounds. It increased the wounds’ contraction rate, as well as stimulated healing factors, and increased collagenase activity. [22] Brown propolis was compared to green propolis regarding their action on oxidative stress and inflammation. Brown propolis and green propolis present different metabolite profiles and mechanisms of action, but brown propolis was more active than a green one.[23] Brown propolis was tested against the biofilm formation of S. aureus. Propolis’ prenylated phenylpropanoic acids were antibiofilm (S. aureus’ colonies spread) probably due to artepillin C, drupanin, and baccharin metabolites.[24] Brown propolis was incorporated in alginate membranes to be used as a food covering when the membrane was active against gram-positive bacteria.[25]
Sodium carboxymethylcellulose (CMC) is one of the main polymers derived from cellulose. It is soluble in water, and its viscosity and adsorption capacity can be modulated by varying pH, concentration, and temperature. It is a hydrocolloid, forming a gel or a viscous dispersion in water.[26][27] Sodium carboxymethylcellulose has recently been used in dressings for the treatment of wounds and burns. Its membranes improve the healing process, and they can be used pure or in combination with other polymers. Due to its hygroscopic characteristic, carboxymethylcellulose promotes an autolytic debridement of wounds; facilitates cellular rehydration; and has bacteriostatic action. It is, therefore, applicable to wounds with scabs, fibrinous, devitalized, and necrotic tissues.[28][29][30] CMC hydrocolloids allow the incorporation and controlled release of different drugs or natural products. CMC-tamarind gum hydrocolloids were loaded with moxifloxacin hydrochloride, where the equimolar gel delivered moxifloxacin hydrochloride properly[31]. Red propolis extract from Alagoas/Brazil was added to CMC hydrogels, and they were effective against microbes’ penetration towards the wound site, being considered promising materials for dressings.[32] The goal of the present work is to develop and characterize CMC membranes loaded with Brazilian southeast brown propolis for wound care.
2. Materials and Methods
2.1 Propolis analysis
Propolis extraction was performed by four methods: dynamic maceration at room temperature (DM) – 50ml of ethanol PA was used as solvent for 48h to extract 2g of propolis; dynamic maceration at 50ºC (DMT) - 50ml of ethanol PA was used, at 50ºC for 48h, to extract 2g of propolis; by ultrasound bath (US) – 50ml of ethanol PA in ultrasound bath for 2h at room temperature; and by immersion of ultrasound probe (USI) - 50ml of ethanol PA under ultrasound probe for 30min at room temperature. The samples were then characterized following their active compound amounts.
2.1.1 Propolis’ phenols quantification
To a 50μL aliquot of methanolic solution (1.0 mg/mL) of propolis extract (triplicates), methanol from VETEC/ Brazil, was added to 2.5 mL of the Folin-Ciocalteau reagent (1:10) (Sigma-Aldrich) and 2.0 mL of 4% sodium carbonate (Sigma-Aldrich) aqueous solution. After 5 minutes at 50°C, the color of the solution changed from greenish to blue, and the absorbance was recorded at 760 nm, equipment NOVA 2000UV.[33] In addition, a gallic acid (25, 50, 100, 200, 300, 400, 500 e 600 µg/mL) (Sigma-Aldrich) standard curve was plotted (Absorbance = 0.12497+ 0.12951 concentration of gallic acid (R2 = 0.999)).
2.1.2 Propolis’ flavonoids quantification
Aliquots of 400 μL of propolis extract (triplicates) and 200 μL of 2% aluminum chloride (Sigma-Aldrich) methanolic solution were mixed. The final volume was adjusted to 10 mL by adding methanol. After 30 minutes, the absorbance at 425 nm was measured. A standard curve of quercetin (Sigma-Aldrich) (50, 40, 30, 20, 10, 15, 5 e 1 µg/ml) was plotted (Absorbance = 0.04078 + 0.06553 concentration of quercetin (R2 = 0.999)).
2.1.3 Propolis antioxidant activity (DPPH, FRAP, and ABTS)
The percentage of antiradical activity was calculated through the decolorization of the DPPH• radical (SigmaAldrich), according to Equation 1.[34] To determine the antioxidant activity (%AA) of each propolis sample, the absorbance of the solution of methanol + DPPH (Abscontrol) was considered the negative control, and methanol was used as a reference (AbsREF). This analysis was performed in triplicate. To calculate the amount of antioxidant (hydrogen donator) necessary to diminish the initial concentration of DPPH by 50% (CE50), a stock methanolic solution of propolis was prepared (concentration of 1000 μg/mL). Then, 0.29μL of the DPPH solution was added to ELISA plate wells as well as the prepared solutions. After 30 minutes of incubation in the dark, the absorbance was measured at 520nm. Analysis was performed in triplicate.
The antioxidant capacity can be evaluated by the reduction of the ferric complex 2,4,6-tripyridyl-s-triazine (Fe3+TPTZ) to the ferrous complex 2,4,6-tripyridyl-s-triazine (Fe2+-TPTZ). A 0.5mL aliquot of each methanolic propolis
Polímeros, 33(2), e20230010, 2023 2/12
Sousa, J. P. L. M., Oliveira, R. N., Santos, A. M. N., Gamallo, O. D., Araújo, L. S., Middea, A., Cid, Y. P., & Castro, R. N.
( ) %100 sampleREF control AbsAbs AA Abs = (1)
Superabsorbent biodegradable CMC membranes loaded with propolis: Peppas-Sahlin kinetics release
extract solution was added to 4.5mL of FRAP Reagent. Each mixture was heated at 37°C for 10 minutes, and then their absorbance was registered at 593nm. A standard curve based on an aqueous solution of heptahydrate ferrous sulfate (FeSO4.7H2O (Sigma-Aldrich)), concentrations of 100, 200, 300, 400, 500, 600, 700, 800, 900, and 1000 µM was plotted (Absorbance = 0.00107 + 0.0018 concentration of FeSO4.7H2O (R2 = 0.999)).
For the cation radical ABTS scavenging activity, 5ml of ABTS+ solution (7mM ABTS+) (Sigma-Aldrich) was mixed with 88μL of 140 mM potassium persulfate solution in the dark for 16h at room temperature. For the stock solution, to a 50μL aliquot of propolis solution, 5.0mL of ABTS reagent was added. The absorbance of the dilutions was recorded at 734nm, after 6 minutes. The reference was ethanol. A Trolox standard curve (ethanolic solution, 0,0; 0;3; 0,6; 0,9; 1,2; 1,5; 1,8; 2,1 e 2,4 mmol/L) was plotted (Absorbance = -26.37778 concentration of Trolox + 0.65164, R2 = 0.999), and the results were expressed as mmol Trolox per 100 mg of extract.[35]
2.1.4 CLAE-DAD chromatography
Chromatographic analysis was performed on a C-18 reversed-phase analytical column (Betasil, Thermo, 5μm particles size), at 30 °C. The mobile phase used was water with 1% acetic acid (solvent A) and methanol (solvent B), a constant flow of 1.0 mL/min, and a volume of the injected sample of 20μL. The concentration gradient was performed from 35% of solvent B for 2min, followed by (35-80)% at 20min, (80-92)% at 25min, returning then to 35%B for 2min. The chromatograms were recorded at 280 and 340 nm since most of the phenolic acids and flavonoids in propolis are excited near these wavelengths. Data acquisition used the LCSolution (Shimadzu) software.
2.1.5 Antimicrobial analysis
The antimicrobial activity of propolis extracts against S. aureus was determined according to the agar diffusion method with modifications.[36] The S. aureus strain (ATCC 25923) was incubated at 36ºC for 24h. A suspension of cells was prepared in 3mL of peptone saline solution to reach 2x10⁸ cfu/mL (turbidity equivalent to Mc Farland scale number 5). This suspension was diluted 100 times and 0.1 mL was inoculated on Mueller Hinton agar plates. Wells (sterile drill, diameter of 0.75 cm) were drilled and, in each well, 50 µL of propolis extract (10 µg/mL) was inoculated. Ampicillin (10 µg/mL, positive control) was used, as well as a solution of 95% ethanol (negative control). The incubation occurred at 36°C for 20-24 hours, after which the inhibition diameter of each well was measured. All tests were performed in triplicates. The inhibition (I) was calculated according to Equation 2.
under mechanical stirring (Fisatom brand, model 710) for 90 min at room temperature. The solution was then divided into 25 mL portions and, under magnetic stirring (Fisatom brand, model 752), 0.8g of citric acid (VETEC) was added [38][39] The samples were dried in an oven (Nova instruments, model NI1512) for 24 h at 50 ºC. The CMC membranes obtained were immersed in deionized water for excess citric acid removal (10 mL of deionized water for 24 h in an oven at 50 ºC per sample). After this, the CMC membranes were subjected to the swelling process in propolis extracts (20 w/v%, resulting in 2.4 g of propolis per membrane) for 24 h.
2.2.1 Physical properties
The samples’ physic-chemical analysis was conducted by FTIR. The analysis was performed on Bruker equipment (Vertex 70), in the range of 400 cm-1-4000 cm-1, 16 scans per sample. The microstructural analysis of the samples was performed by X-ray diffraction (XRD) using the equipment Brucker-AXS D8 Advance Eco diffractometer (CETEM -UFRJ), with CuKα radiation at 40 kV and 25 mA, angular diffraction range of 2θ = 5°-70°, a step of 0.02°, and step time of 2 seconds. The XRD plotted curves were then smoothed (Method Savitzky-Golay, 400 points per window). The thermogravimetric analysis used the equipment TGA Q500 (TA Instruments Co.), Catalysis Lab-UFRRJ. The samples (~10 mg) were loaded in an open platinum crucible, where an empty crucible was used as a reference, continuous flow of N2 (30 mL.min-1), a heating rate of 10 °C / min, between 25° C and 400° C [40]. For the mechanical tests (modified ASTM D882 - 02 standard), rectangular samples of (40x20x1) mm3 in triplicate were evaluated (EMIC DL 10000 equipment, load cell Trd 21 / 50 kgf), strain rate of 3 mm/min until failure, at room temperature.
2.2.2 In-vitro properties
The swelling test was performed in triplicate, where the hydrogels were immersed in 25 mL of saline solution [41] . The sample weight was evaluated at predetermined time intervals (0.5h, 1h, 2h, 3h, 4h, 24h, and 48h of immersion). The samples’ swelling degree (SG) was calculated according to ( ) %100(/) tii SDWWW =− , where Wt is the weight of the samples at each time interval and Wi, is the dry samples’ initial weight. The samples’ gel fraction (GF) and weight loss (WL) were calculated according to ( ) ( ) %100/fi GFWW = and ( ) ( ) %100/ifi WLWWW =− , respectively, where Wf is the final dry weight of the samples (after 96h of swelling).
The in vitro release study of phenolic compounds was carried out according to the shake-flask methodology [42] . Carboxymethylcellulose membranes impregnated with propolis extract were immersed in 100mL of phosphate buffer pH 6 with 1% Sodium Sulfate Luaril (Sigma Aldrich). They were stirred under 50 rpm for 96 h, at 32ºC. The aliquots of the samples were collected at the following times: 0.5; 1,0;2,0; 3,0; 4,0; 5,0; 24; 48; 72; 96h for analysis of the release kinetic profile by HPLC-DAD. Before analysis, the aliquots were filtered (0.45 μm membrane) and analyzed by HPLC.
2.2 CMC gels
The hydrogels were prepared according to the casting method[37]. 3g of sodium carboxymethyl cellulose - CMC (Sigma Aldrich) was diluted in 100 mL of deionized water
The data acquisition was done through the LCSolution software (Shimadzu). The analyses were performed in a reverse phase analytical column C-18 (Betasil, Thermo), maintained at 40 ºC. The mobile phase used was ultrapure water with 1% acetic acid (solvent A) and methanol (100,
Polímeros, 33(2), e20230010, 2023 3/12
( ) ' %100 SamplesinhibitionhaloNegativecontrolshalo I Positivecontrolshalo = ′ ′ (2)
solvent B), with a constant flow of 1.0 mL min/4.6 mm, and the volume of the sample injected was 20μL. The propolis aliquots were solubilized in spectroscopic grade methanol, with a concentration of 1000 μg/mL, and the solution was filtered (0.45 μm, PVDF, Millipore). The substances identification was based on the comparison of retention times. The release kinetics of propolis substances was performed through non-linear regression analysis, applying two models: Korsmeyer-Peppas and Peppas-Sahlin models. The model with the highest R2 value was considered the best fit.
3. Results and Discussions
3.1 Propolis
Brown propolis from Southeast Brazil was evaluated and its flavonoids varied from 37 mg quercetin/g propolis extract (MDT) up to 58 mg quercetin/g propolis extract (US), Figure 1. The minimum concentration of flavonoids required by Brazilian regulation is 0.25% (w/w).[43] All propolis extracts presented higher amounts of flavonoids than the minimum required. Nonetheless, the current propolis presents low amounts of flavonoids, since brown propolis from northeast Brazil presented ~14% flavonoids.[25]
The samples also presented phenolic acids (from 45 mg gallic acid / g propolis extract (DM) up to 100 mg gallic acid / g propolis extract (DMT), 4.5-10% phenolic acids), but this amount can be considered low.[25][44] Maceration can be considered the best process, Figure 1, although the ultrasound energy usually results in high content of phenolic acids and flavonoids in the propolis extract.[45]
All samples presented antioxidant activity/scavenging activity. Regarding brown propolis,[46] low amounts of propolis extract were required to scavenge 50% of DPPH (from DMT (3.7 μg/mL) to USI (4.1 μg/mL)). The ABTS scavenging activity was in the expected range,[47] from 91 mmol trolox/100mg of propolis (DM) up to 103 mmol trolox/100mg of propolis (USI). DMT and USI techniques presented high FRAP results (264 mmol Fe(II)/100 mg propolis extract (DM) - 372 mmol Fe(II)/100 mg propolis extract (USI)), although these values can be considered low for propolis extracts.[46] The ultrasound extraction technique presented high values of antioxidant activity according to DPPH, FRAP, and ABTS methods.[48]
Regarding the identified phenolic compounds, there were chlorogenic, caffeic, ferulic, para-coumaric and rosmarinic acids, pinobanksin, kaempferol and kaempferide. The phenols amount in the propolis ethanolic extracts differ considerably,
e.g., propolis from Brazilian South’s region may present low amounts of artepilin C and coumaric acid.[18] Chromatographic analysis revealed the main active compounds in the propolis extract, Figure 1. Kaempferide was the main flavonoid in the propolis extracts, regardless of the type of extraction.[49] There were lower amounts of rosmarinic acid[50], p-coumaric acid[51][52], ferulic acid[53], and pinobanksin[54], mostly substances presenting antioxidant activity. Propolis extract also presented low amounts of chlorogenic acid, kaempferol, and caffeic acid.[55] Propolis extract obtained through various techniques did not present significant differences regarding the active compounds. Then, macerated propolis extract was the one evaluated by antimicrobial activity. Propolis was placed in agar discs’ wells, where S. aureus was incubated. The samples presented measurable halos, inhibiting approximately (40.97 ± 2.41) % of S. aureus microorganisms. The antimicrobial activity of propolis extracts is often related to their phenolic content.[56] Phenolic substances are capable of interfering with the structure and properties of bacterial membranes, increasing their susceptibility to proton permeation, and resulting in microorganisms’ death.[57] The propolis extract activity against S. aureus might be related to the high amount of kaempferide, an antimicrobial substance related to a skin infection.[58]
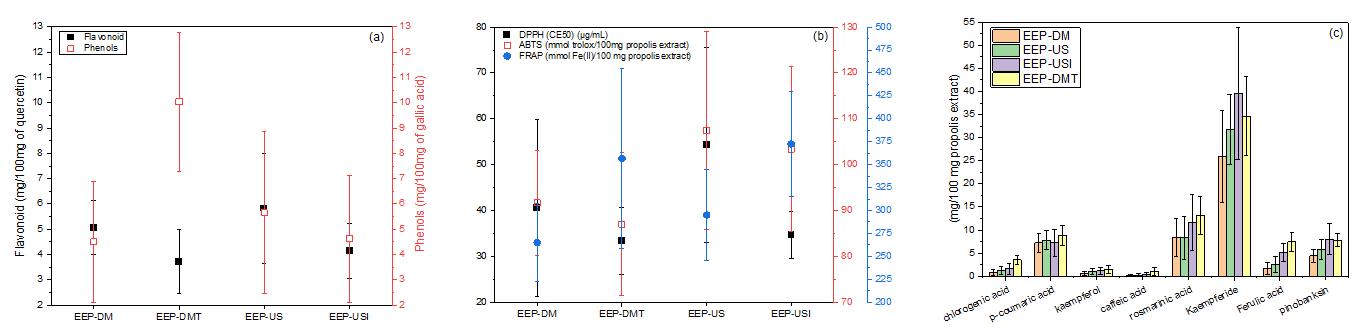
3.2 CMC gels
Since brown propolis obtained through different techniques were similar regarding the active compounds, the direct macerated (DM) extract was used to incorporate in CMC membranes. Swelling capacity is a fundamental characteristic of hydrogel dressings, since they can absorb wound exudate.[59] Hydration content and swelling are relevant properties of dressings. Healing is improved by a moisturized environment. Wound dressings with high swelling capacity would be the best ones, they would absorb exudates and diminish the occurrence of infection.[60] CMC membranes presented high water absorption capacity compared to CMC-propolis (CMC-P) samples, Figure 2. Both samples reached the equilibrium of swelling degree (ESD) in 24h, CMC samples reached an ESD of ~449% while CMC-P samples reached an ESD of ~168%.[61], where CMC gels could be considered superabsorbent.[62] The low swelling capacity of CMC-P would be the consequence of propolis filling the pores of the membrane. Since the ethanolic extract of propolis is quite resinous, it may be responsible for a hydrophobic barrier formation. This barrier difficult the absorption of moisture by the pores of the polymer, leading to a low swelling degree and low weight loss.[63] The CMC-P samples presented a high gel fraction, where the presence of propolis extracts difficult the polymer’s chains mobility, interfering with the
Polímeros, 33(2), e20230010, 2023 4/12
Sousa, J. P. L. M., Oliveira, R. N., Santos, A. M. N., Gamallo, O. D., Araújo, L. S., Middea, A., Cid, Y. P., & Castro, R. N.
Figure 1. Propolis (a) phenols and flavonoids; (b) antioxidant activity; (c) active substances.
Superabsorbent biodegradable CMC membranes loaded with propolis: Peppas-Sahlin kinetics release
entanglement of amorphous chains. Due to the hydrophobic barrier of propolis, fewer chains could be leached out by the water entrance, and the CMC-P samples’ weight loss was low, as well as its biodegradability rate in water.[64] Propolis extract, rich in phenolic substances, may be forming bonds with the polymer chains and thus contribute to the physical crosslinking
of the gels, hindering the expansion of CMC chains. A low swelling degree allows a slow release of the active agents.[65]
The CMC sample, as well as the CMC-P sample, presented these materials’ characteristic FTIR bands and vibration modes, in Table 1 and Figure 3. The CMC-P sample presented mainly bands related to both phases,
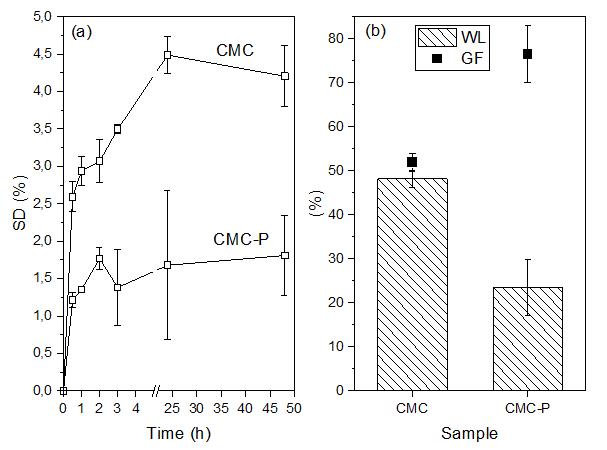
anhydride of citric acid and non-substituted OH groups of cellulose[70]
Vibrational modes: ν – stretching; νs – symmetric stretching; δ – bending/deformation, δas - asymmetric angular deformation/bending; δs - symmetric angular deformation/bending; τ – twisting; σ – scissoring.[81]
Polímeros, 33(2), e20230010, 2023 5/12
Sample CMC Propolis CMC-P Band (cm-1) Vibration mode Band (cm-1) Vibration mode Band (cm-1) 3351 ν(-OH)[68] 3336 –OH group in -inter and intramolecular hydrogen bonds[69] 3386 - - 2971 –OH groups[69]2922 Aliphatic ν(C–H) vibrations[62] 2926 2922 - - 2887 2855 1724 ester bond
- -- - 1686 ν(carbonyl group)[71] 1687 - - 1632 C=O of aldehydes, ketones, and carboxylic acids (isoflavones)[72] 1631 - - 1601 ν(C=C), ν(C=O) of aromatic rings of polyols, flavonoids, and amino acids[69] 1602 1590 COO− of non-hydrated C=O groups[70] - - 1557 - - 1515 polyphenolic ring vibration[73] 1511 - - 1448 δas(CH3)[74] 1440 1416 σ(–CH2)[70] - -1372 δ(C-H)[75] 1379 δs(CH3)[74] 1376 1319 δin plane(OH)[75] -
- - 1271 C−O−C bonds, related to phenolic acids and flavonoids[76]1241 ν(C-O) of ether linkage[75] - - 1256 - - 1183 ν(C-O), δ(C-OH) of lipids and alcohol groups[77] 1178 - - - - 1132 - - 1087 secondary alcohols; ν(C-O-) of ester group[77]1054 νs(C-O) of primary alcohol[75] 1046 C-O folding of acids, alcohols, and esters[72]1019 ν(carboxymethyl ether group)[70] - - 1026 - - 983 δout-of-plane(C-OH) and τ(-CH2-)[78] 984 893 β-Glucosidic linkages (sugar units)[75] - -- - 878 aromatic δout-of-plane(C–H)[79]- - - - 835 - - 802 aromatic ring δout-of-plane(C–H)[80]- - - - 700
Table 1. CMC and propolis bands and their vibrational modes; CMC-P samples bands.
between
-
Figure 2 .(a) CMC and CMC-P (CMC-propolis) samples’ swelling degree (SD) and (b) samples’ gel fraction (GF) and weight loss (WL).
indicating proper incorporation. However, some band shifts were observed, indicating an interaction between propolis and CMC/citric acid.[66] Nonetheless, two bands, non-identified in the original materials, could be identified in the CMC-P sample (indicated by arrows in Figure 3), at 835 cm-1 and 700 cm-1, probably related to new bonding between components’ groups.[67] Further analysis would be required to properly identify the groups’ interactions.
Regarding the XRD analysis, the CMC and CMC-P diffractograms were smoothed, then Gauss curves were fitted. Three crystalline peaks (2θ ~11º, ~21º, and ~35º) were identified, in Figure 3, related to CMC diffraction plans (110), (200), and (004) respectively.[82][83] The data (Half-width of the peak - FWHM, location of the peak, 2θ (rad)) related to the main peak (2θ ~21º) were the basis to calculate, by Scherrer equation, the crystallite size of CMC.[84] The CMC sample presented a crystallite size of 9.2 Å while the CMC-P sample crystallite size was 7.4 Å, which can be considered low-size crystallites.[85] Propolis seems to interfere with the bonds between CMC chains, leading to low crystallite size. Probably it breaks hydrogen bonds between CMC molecules; or the presence of propolis physically interferes with the CMC chains’ mobility, diminishing the possibility of contact between chains.[86]
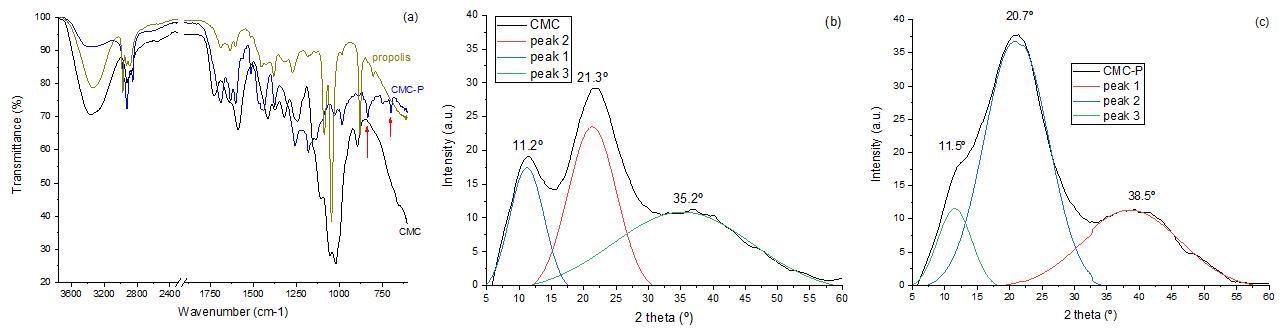
Regarding thermal properties, propolis increased the stability of the samples, Figure 4. The CMC hydrogel thermal degradation analysis began at 25º C, and the slight weight loss between 25 ºC-200 ºC would be related to volatile (H2O, etc.) substances. The major loss is at 277 ºC, due to the degradation of the CMC chains (bonds’ cleavage related to functional groups and loss of weak groups of the main chains).[87] The degradation profile of both samples, CMC e
CMC-P, are similar, but their behavior at high temperatures (above 400 ºC) differs. The CMC-P sample degraded less than the CMC sample, probably due to propolis interaction with the CMC chains (which could be compared to the citric acid effect on CMC), where connection by hydrogen bonds would increase this sample’s thermal stability.[88] The CMC sample’s final residue was 1% while the CMC-P sample was 23%. The CMC sample weight loss in the first step was ~18% and in the second step, 49%. The CMC-P samples presented 14% and 37% of weight loss in the mentioned steps, where these two first degradation steps would be responsible for the samples’ high degradation.[89][90] The increased stability of CMC-P was also shown by the high GF values and by the new FTIR bands, indicating an interaction between components of the CMC-P sample. The CMC sample presented many degradation steps above 400 ºC, which might be related to the products of the 2nd stage degradation step, where the last steps would lead to gases (CO, CO2, etc.) evolution and carbonaceous residue.[91]
The tensile tests of samples (triplicates for each composition) were performed until failure. CMC-P samples presented high strength compared to CMC samples, Figure 4 The samples’ Young Modulus (E), elongation at break (e), and Failure strength (σf) were evaluated by ANOVA-1 way analysis (factor: composition; levels: CMC and CMC-P), with a confidence level of 95%. It was observed that the CMC sample presented Young Modulus (E) significantly lower than CMC-P (p-value = 0.01732). In addition, according to the ANOVA analysis, CMC-P showed failure strength significantly higher than CMC, with p-value = 0.04781. These results are in agreement with the finds reported in the FTIR and TGA analysis, where the propolis connection to the CMC
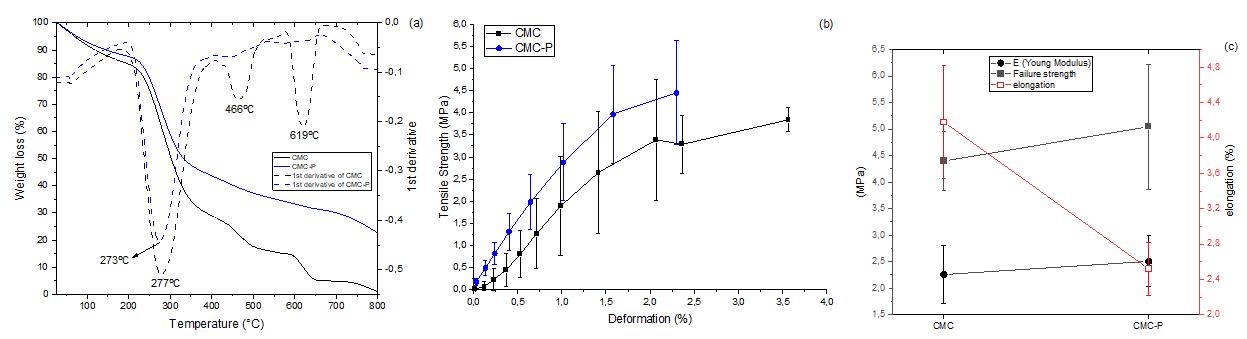
Sousa,
Polímeros, 33(2), e20230010, 2023 6/12
J. P. L. M., Oliveira, R. N., Santos, A. M. N., Gamallo, O. D., Araújo, L. S., Middea, A., Cid, Y. P., & Castro, R. N.
Figure 3. (a) FTIR spectra of CMC, propolis, and CMC-P samples, where new bands are indicated by arrows; XRD analysis of (b) CMC sample and (c) CMC-P sample, where fitted gauss curves (“peak”) indicating the CMC diffraction peaks can be observed.
Figure 4. (a) Thermal degradation (TGA) curves of CMC and CMC-P samples and these curves’ (1st) derivative curves; Samples (b) mechanical properties and (c) Young Modulus (E), elongation at break and failure strength.
Superabsorbent biodegradable CMC membranes loaded with propolis: Peppas-Sahlin kinetics release
chains could anchor the CMC molecules, diminishing the chains’ mobility (and elongation at break), and increasing E and σf. Nevertheless, the samples’ failure strength (CMC and CMC-P) can be considered low, as well as the young modulus.[92][93] The CMC-P samples presented elongation at break significantly lower than CMC samples (p = 0.02858). The elongation at the break would indirectly represent the samples’ crosslinking, indicating effective interaction.[94]
Wound dressings have been designed to carry and to release drugs / antimicrobial agents locally. This property would be adequate for chronic lesions treatment, for wounds presenting prolonged inflammation step, as well as for delayed wound closure.[95] Mapping the drug release of the matrix (toward a controlled profile) would guarantee that the drug dose is within the therapeutical level. There are sustainable drug release systems (commercially available), e.g., Insulin Pen e Synchromate B., none of them for wound healing, though.[96] To highlight the importance of kinetics release knowledge regarding wound dressings, drug delivery can be the sine qua non condition to achieve robust delivery’s steps and controlled amount of drug locally released. Local antibiotic sustainable release (within the dressing), compared to systemic antibiotic administration, led to efficient bactericide effect (against gram-positive and gram-negative bacteria) with low cytotoxicity to skin/eukaryotic cells.[97]
The delivered substances identified in the in vitro release studies were chlorogenic acid, caffeic acid, ferulic acid, p-coumaric acid, rosmarinic acid, and pinobanksin, Figure 5 The release profiles of all substances were similar (beginning of the release at 0.5 h and maximum release at 4h of testing, reaching a constant release/plateau from 4 h to 96 h).[98]
The burst release is adequate for wound dressings since the delivery of the drug / active principle would prevent infection evolution. In pills, for example, it is expected that 75% of
the active substance would be delivered within 45 minutes of administration.[99] Two release models were used to fit the results and the R2 values, Korsmeyer-Peppas (K-P) model (Equation 4)[100] and Peppas-Sahlin (P-S) model,[101] Figure 5. Peppas-Sahlin model is the best fit for the studied substances, but caffeic acid release was not properly adjusted by the studied models. All other substances were released according to the Peppas-Sahlin model, Equation 4.[101] This model consists of 2 terms on the right-hand side: the first term is the Fickian contribution, and the second term is the Case-II relaxational contribution.[102] A high k1 value represents the drug diffusion release mechanism, while a high k2 means polymer relaxation or heterogeneous erosion as the release mechanism.[103][104] Since negative k values should not be included in this analysis,[103] mainly non-linear Peppas-Sahlin propolis diffusion mechanism would be responsible for the release of the substances.
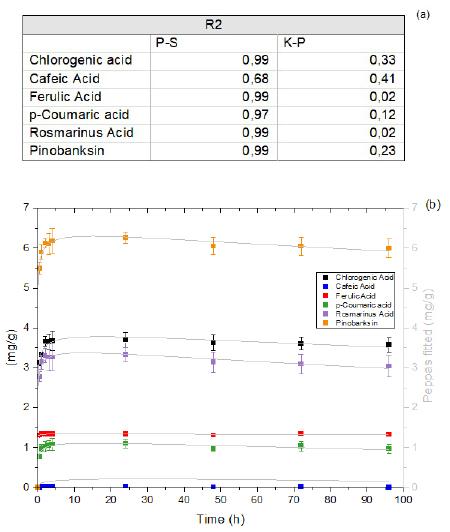
Mt = amount of substance released at time t; M∞ = amount of substance released at an ∞ period; m = release exponent; k = Korsmeyer–Peppas release constant; k1, k2 = rate constant and correlation coefficients.[105][106]
4. Conclusion
Flavonoids and phenolic acids were identified in the studied propolis extracts, where the main substance was kaempferide, an antimicrobial substance. There were also considerable amounts of rosmarinic acid, p-coumaric acid, ferulic acid, and pinobanksin. Propolis had antioxidant properties, identified through DPPH, FRAP, and ABTS and it was active against S. aureus, no matter the extraction method. Propolis was successfully incorporated into CMC gels. The swelling capacity of the gels might be dosedependent with the agent added, whereas CMC gels could be considered superabsorbent. The low swelling capacity and high gel fraction of CMC-P would be the consequence of propolis filling the pores of the membrane. Since the ethanolic extract of propolis is quite resinous, it may be responsible for the low absorption of moisture, leading to a low swelling degree and weight loss (biodegradability in water). Propolis could be anchoring the CMC chains, which was also observed by FTIR, where there was interaction and bonding between components. To corroborate the previous observation, propolis led to low CMC crystallite size formation (propolis could physically interfere with the CMC molecules, diminishing the possibility of contact between chains). The thermal degradation profile of CMC e CMC-P is similar, but the CMC-P sample degraded less than the CMC sample at temperatures above 400ºC. The CMC-P presented mainly a diffusion-controlled propolis release (Peppas-Sahlin model). The in vitro release studies showed a non-linear diffusion-based release kinetics for most phenolic substances of propolis extract (pinobankisin, rosmarinic acid, p-cumaric acid, ferulic acid, chlorogenic
Polímeros, 33(2), e20230010, 2023 7/12
m t M kt M ∞ = (3) 2 12 mm t M ktkt M ∞ =+ (4)
Figure 5. Kinetics of drug delivery: (a) R2 values of KorsmeyerPeppas (K-P) and Peppas-Sahlin (P-S) models; (b) substances released – Peppas-Sahlin (“Peppas”) fit.
acid), characterizing a diffusion-controlled release system. The CMC-P samples present potential as a dressing material.
5. Author’s Contribution
• Conceptualization – Juliana Paes Leme de Mello Sousa; Rosane Nora Castro.
• Data curation – Juliana Paes Leme de Mello Sousa; Ormindo Domingues Gamallo; Leonardo Sales Araújo; Antonieta Middea; Yara Peluso Cid.
• Formal analysis – Juliana Paes Leme de Mello Sousa; Renata Nunes Oliveira; Rosane Nora Castro.
• Funding acquisition - Rosane Nora Castro; Renata Nunes Oliveira.
• Investigation – Juliana Paes Leme de Mello Sousa; Antonia Monica Neres Santos; Rosane Nora Castro.
• Methodology – Juliana Paes Leme de Mello Sousa; Antonia Monica Neres Santos; Rosane Nora Castro.
• Project administration – Rosane Nora Castro.
• Resources – Rosane Nora Castro.
• Software – NA.
• Supervision – Rosane Nora Castro; Renata Nunes Oliveira.
• Validation – Rosane Nora Castro.
• Visualization – Rosane Nora Castro.
• Writing – original draft – Renata Nunes Oliveira.
• Writing – review & editing – Renata Nunes Oliveira; Rosane Nora Castro.
6. Acknowledgements
The authors thank Multi-User Analytical Lab of Chemical Institute / UFRRJ; CETEM / UFRJ; LSP/UFRRJ. Este estudo foi financiado pela FAPERJ – Fundação Carlos Chagas Filho de Amparo à Pesquisa do Estado do Rio de Janeiro, Processo SEI E-26/201.381/2021 (260532). This study was financed in part by the Coordenação de Aperfeiçoamento de Pessoal de Nível Superior - Brasil (CAPES) - Finance Code 001.
7. References
1 Guo, S., & DiPietro, L. A. (2010). Factors Affecting Wound Healing. Journal of Dental Research, 89(3), 219-229 http:// dx.doi.org/10.1177/0022034509359125 PMid:20139336.
2 Gonzalez, A. C. O., Costa, T. F., Andrade, Z. A., & Medrado, A. R. A. P. (2016). Wound healing - A literature review. Anais Brasileiros de Dermatologia, 91(5), 614-620 http://dx.doi. org/10.1590/abd1806-4841.20164741 PMid:27828635.
3 World Health Organization (2013). Prevention and management of wound infection Switzerland: Department of Violence and Injury Prevention and Disability - World Health Organization Retrieved in 2023, February 05, from https://www.who.int/ publications-detail-redirect/prevention-and-management-ofwound-infection
4 World Health Organization (2022). Global Report on infection prevention and control. Switzerland:World Health Organization
5 Cook, L., & Ousey, K. (2011). Demystifying wound infection: identification and management. Practice Nursing, 22(8), 424-428 http://dx.doi.org/10.12968/pnur.2011.22.8.424
6 Filius, P. M. G., & Gyssens, I. C. (2002). Impact of increasing antimicrobial resistance on wound management. American Journal of Clinical Dermatology, 3(1), 1-7 http://dx.doi. org/10.2165/00128071-200203010-00001 PMid:11817964.
7. Chambers, H. F., & DeLeo, F. R. (2009). Waves of resistance: staphylococcus aureus in the antibiotic era. Nature Reviews. Microbiology, 7(9), 629-641. http://dx.doi.org/10.1038/ nrmicro2200. PMid:19680247.
8 Centers for Disease Control and Prevention – CDC (2019). Multidrug-resistant pseudomonas aeruginosa Atlanta: CDC Retrieved in 2023, February 05, from https://www.cdc.gov/ drugresistance/pdf/threats-report/pseudomonas-aeruginosa-508. pdf
9 Puca, V., Marulli, R. Z., Grande, R., Vitale, I., Niro, A., Molinaro, G., Prezioso, S., Muraro, R., & Di Giovanni, P. (2021). Microbial species isolated from infected wounds and antimicrobial resistance analysis: data emerging from a threeyears retrospective study. Antibiotics (Basel, Switzerland), 10(10), 1162 http://dx.doi.org/10.3390/antibiotics10101162 PMid:34680743.
10 Mieles, J. Y., Vyas, C., Aslan, E., Humphreys, G., Diver, C., & Bartolo, P. (2022). Honey: an advanced antimicrobial and wound healing biomaterial for tissue engineering applications. Pharmaceutics , 14(8), 1663 http://dx.doi.org/10.3390/ pharmaceutics14081663 PMid:36015289.
11. Ghasemi, F. S., Eshraghi, S. S., Andalibi, F., Hooshyar, H., Kalantar- Neyestanaki, D., Samadi, A., & Fatahi-Bafghi, M. (2017). Anti-bacterial effect of propolis extract in oil against different bacteria. Zahedan Journal of Researches in Medical Sciences, 19(3), e7225. http://dx.doi.org/10.5812/zjrms.7225.
12 Quintino, R. L., Reis, A. C., Fernandes, C. C., Martins, C. H. G., Colli, A. C., Crotti, A. E. M., Squarisi, I. S., Ribeiro, A. B., Tavares, D. C., & Miranda, M. L. D. (2020). Brazilian green propolis: chemical composition of essential oil and their in vitro antioxidant, antibacterial and antiproliferative activities. Brazilian Archives of Biology and Technology, 63, e20190408 http://dx.doi.org/10.1590/1678-4324-2020190408
13 Pinto, L. M. A., Prado, N. R. T., & Carvalho, L. B. (2011). Propriedades, usos e aplicações da própolis. Revista Eletrônica de Farmácia, 8(3), 76-100
14 Martinotti, S., & Ranzato, E. (2015). Propolis: a new frontier for wound healing? Burns and Trauma, 3, 9 http://dx.doi. org/10.1186/s41038-015-0010-z PMid:27574655.
15 Araujo, M. A. R., Libério, S. A., Guerra, R. N. M., Ribeiro, M. N. S., & Nascimento, F. R. F. (2012). Mechanisms of action underlying the anti-inflammatory and immunomodulatory effects of propolis: a brief review. Revista Brasileira de Farmacognosia, 22(1), 208-219. http://dx.doi.org/10.1590/ S0102-695X2011005000167.
16 Woźniak, M., Mrówczyńska, L., Waśkiewicz, A., Rogoziński, T., & Ratajczak, I. (2019). The role of seasonality on the chemical composition, antioxidant activity and cytotoxicity of Polish propolis in human erythrocytes. Revista Brasileira de Farmacognosia, 29(3), 301-308 http://dx.doi.org/10.1016/j. bjp.2019.02.002
17 Olegário, L. S., Andrade, J. K. S., Andrade, G. R. S., Denadai, M., Cavalcanti, R. L., Silva, M. A. A. P., & Narain, N. (2019). Chemical characterization of four Brazilian brown propolis: an insight in tracking of its geographical location of production and quality control. Food Research International , 123, 481-502 http://dx.doi.org/10.1016/j.foodres.2019.04.004 PMid:31284998.
Sousa, J. P. L. M., Oliveira, R. N., Santos, A. M. N.,
O. D.,
L. S., Middea, A., Cid, Y. P., & Castro, R. N. Polímeros, 33(2), e20230010, 2023 8/12
Gamallo,
Araújo,
Superabsorbent biodegradable CMC membranes loaded with propolis: Peppas-Sahlin kinetics release
18 Machado, C. S., Mokochinski, J. B., Lira, T. O., Oliveira, F. C. E., Cardoso, M. V., Ferreira, R. G., Sawaya, A. C. H. F., Ferreira, A. G., Pessoa, C., Cuesta-Rubio, O., Monteiro, M. C., Campos, M. S., & Torres, Y. R. (2016). Comparative Study of Chemical Composition and Biological Activity of Yellow, Green, Brown, and Red Brazilian Propolis. Evidence-Based Complementary and Alternative Medicine, 2016, 6057650 http://dx.doi.org/10.1155/2016/6057650 PMid:27525023.
19 Pontes, M. L. C., Vasconcelos, I. R. A., Diniz, M. F. F. M., & Pessôa, H. D. L. F. (2018). Chemical characterization and pharmacological action of Brazilian red propolis. Acta Brasiliensis, 2(1), 34-39 http://dx.doi.org/10.22571/2526433868
20 Batista , L. L. V. , Campesatto , E. A. , Assis , M. L. B. , Barbosa, A. P. F., Grillo, L. A. M., & Dornelas, C. B. (2012). Comparative study of topical green and red propolis in the repair of wounds induced in rats. Revista do Colégio Brasileiro de Cirurgiões, 39(6), 515-520 http://dx.doi.org/10.1590/ S0100-69912012000600012 PMid:23348649.
21 Moura, S. A. L., Negri, G., Salatino, A., Lima, L. D. C., Dourado, L. P. A., Mendes, J. B., Andrade, S. P., Ferreira, M. A. N. D., & Cara, D. C. (2011). Aqueous extract of Brazilian Green Propolis: primary components, evaluation of inflammation and wound healing by using subcutaneous implanted sponges. Evidence-Based Complementary and Alternative Medicine, 2011, 748283. http://dx.doi.org/10.1093/ ecam/nep112. PMid:19690045.
22 Conceição, M., Gushiken, L. F. S., Aldana-Mejía, J. A., Tanimoto, M. H., Ferreira, M. V. S., Alves, A. C. M., Miyashita, M. N., Bastos, J. K., Beserra, F. P., & Pellizzon, C. H. (2022). Histological, immunohistochemical and antioxidant analysis of skin wound healing influenced by the topical application of Brazilian red propolis. Antioxidants, 11(11), 2188. http:// dx.doi.org/10.3390/antiox11112188 PMid:36358560.
23. Zaccaria, V., Curti, V., Di Lorenzo, A., Baldi, A., Maccario, C., Sommatis, S., Mocchi, R., & Daglia, M. (2017). Effect of green and brown propolis extracts on the expression levels of microRNAs, mRNAs and proteins, related to oxidative stress and inflammation. Nutrients, 9(10), 1090 http://dx.doi. org/10.3390/nu9101090 PMid:28974022.
24 Dembogurski, D. S. O., Trentin, D. S., Boaretto, A. G., Rigo, G. V., Silva, R. C., Tasca, T., Macedo, A. J., Carollo, C. A., & Silva, D. B. (2018). Brown propolis-metabolomic innovative approach to determine compounds capable of killing Staphylococcus aureus biofilm and Trichomonas vaginalis. Food Research International, 111, 661-673 http:// dx.doi.org/10.1016/j.foodres.2018.05.033 PMid:30007730.
25 Costa, M. C., Cruz, A. I. C., Ferreira, M. A., Bispo, A. S. R., Ribeiro, P. R., Costa, J. A., Araújo, F. M., & EvangelistaBarreto, N. S. (2023). Brown propolis bioactive compounds as a natural antimicrobial in alginate films applied to Piper nigrum L. Ciência Rural, 53(5), e20210805 http://dx.doi. org/10.1590/0103-8478cr20210805
26 Saha, D., & Bhattacharya, S. (2010). Hydrocolloids as thickening and gelling agents in food: a critical review. Journal of Food Science and Technology, 47(6), 587-597 http:// dx.doi.org/10.1007/s13197-010-0162-6 PMid:23572691.
27 Xu, H., Chen, G., Jin, R., Chen, D., Wang, Y., & Pei, J. (2014). Green synthesis of Bi2Se3 hierarchical nanostructure and its electrochemical properties. RSC Advances, 4(17), 8922-8929 http://dx.doi.org/10.1039/c3ra46473c
28 Waring, M. J., & Parsons, D. (2001). Physico-chemical characterisation of carboxymethylated spun cellulose fibres. Biomaterials, 22(9), 903-912 http://dx.doi.org/10.1016/ S0142-9612(00)00254-4 PMid:11311009.
29 Moseley, R., Walker, M., Waddington, R. J., & Chen, W. Y. J. (2003). Comparison of the antioxidant properties of wound dressing materials–carboxymethylcellulose, hyaluronan benzyl ester and hyaluronan, towards polymorphonuclear leukocytederived reactive oxygen species. Biomaterials, 24(9), 15491557 http://dx.doi.org/10.1016/S0142-9612(02)00540-9 PMid:12559815.
30 Dhivya, S., Padma, V. V., & Santhini, E. (2015). Wound dressings – a review. Biomedicine (Taipei), 5(4), 22 http:// dx.doi.org/10.7603/s40681-015-0022-9 PMid:26615539.
31. Mali, K. K., Dhawale, S. C., Dias, R. J., Dhane, N. S., & Ghorpade, V. S. (2018). Citric acid crosslinked carboxymethyl cellulose-based composite hydrogel films for drug delivery. Indian Journal of Pharmaceutical Sciences, 80(4), 657-667 http://dx.doi.org/10.4172/pharmaceutical-sciences.1000405.
32 Silva, V. C., Silva, A. M. G. S., Basílio, J. A. D., Xavier, J. A., Nascimento, T. G., Naal, R. M. Z. G., del Lama, M. P., Leonelo, L. A. D., Mergulhão, N. L. O. N., Maranhão, F. C. A., Silva, D. M. W., Owen, R., Duarte, I. F. B., Bulhões, L. C. G., Basílio, I. D. Jr, & Goulart, M. O. F. (2020). New insights for red propolis of alagoas: chemical constituents, topical membrane formulations and their physicochemical and biological properties. Molecules (Basel, Switzerland), 25(24), 5811. http://dx.doi.org/10.3390/molecules25245811. PMid:33317120.
33 Papotti, G., Bertelli, D., Plessi, M., & Rossi, M. C. (2010). Use of HR-NMR to classify propolis obtained using different harvesting methods. International Journal of Food Science & Technology, 45(8), 1610-1618 http://dx.doi.org/10.1111/j.13652621.2010.02310.x
34 Mensor, L. L., Menezes, F. S., Leitão, G. G., Reis, A. S., Santos, T. C., Coube, C. S., & Leitão, S. G. (2001). Screening of Brazilian plant extracts for antioxidant activity by the use of DPPH free radical method. Phytotherapy Research, 15(2), 127-130 http://dx.doi.org/10.1002/ptr.687 PMid:11268111.
35 Embrapa Agroindústria Tropical (2007). Comunicado técnico n. 128. Metodologia científica: determinação da atividade antioxidante total em frutas pela captura do radical livre ABTS°+ Fortaleza: Embrapa
36 Bauer, A. W., Kirby, W. M. M., Sherris, J. C., & Turck, M. (1966). Antibiotic susceptibility testing by a standardized single disk method. American Journal of Clinical Pathology, 45(4), 493-496 http://dx.doi.org/10.1093/ajcp/45.4_ts.493 PMid:5325707.
37 Taylor, R. F., & Schultz, J. S., editors (1996). Handbook of chemical and biological sensors USA: CRC Press http:// dx.doi.org/10.1887/0750303239
38 Kamel, S., Ali, N., Jahangir, K., Shah, S. M., & El-Gendy, A. A. (2008). Pharmaceutical significance of cellulose: a review. Express Polymer Letters, 2(11), 758-778 http:// dx.doi.org/10.3144/expresspolymlett.2008.90
39 Ghorpade, V. S., Yadav, A. V., & Dias, R. J. (2017). Citric acid crosslinked β -cyclodextrin/carboxymethylcellulose hydrogel films for controlled delivery of poorly soluble drugs. Carbohydrate Polymers, 164, 339-348 http://dx.doi. org/10.1016/j.carbpol.2017.02.005. PMid:28325334.
40 Capanema, N. S. V., Mansur, A. A. P., Jesus, A. C., Carvalho, S. M., Oliveira, L. C., & Mansur, H. S. (2018). Superabsorbent crosslinked carboxymethyl cellulose-PEG hydrogels for potential wound dressing applications. International Journal of Biological Macromolecules, 106, 1218-1234 http://dx.doi. org/10.1016/j.ijbiomac.2017.08.124 PMid:28851645.
41 Kokabi, M., Sirousazar, M., & Hassan, Z. M. (2007). PVA–clay nanocomposite hydrogels for wound dressing. European Polymer Journal, 43(3), 773-781 http://dx.doi.org/10.1016/j. eurpolymj.2006.11.030
Polímeros, 33(2), e20230010, 2023 9/12
Sousa, J. P. L. M., Oliveira, R. N., Santos, A. M. N., Gamallo, O. D., Araújo, L. S., Middea, A., Cid, Y. P., & Castro, R. N.
42 Brasil Ministério da Saúde Resolução-Re nº 90. (2003, May 29). Guia para ensaios de dissolução para Formas Farmacêuticas Sólidas Orais de Liberação Imediata (FFSOLI). Biblioteca Virtual em Saúde. Retrieved in 2023, February 05, from https://bvsms.saude.gov.br/bvs/saudelegis/anvisa/2003/ res0901_29_05_2003.html
43 Brasil Ministério da Agricultura e do Abastecimento Instrução Normativa nº3. (2001, January 19). Diario Oficial da União, Brasília. Retrieved in 2023, February 05, from https://pesquisa. in.gov.br/imprensa/jsp/visualiza/index.jsp?data=23/01/2001 &jornal=1&pagina=46&totalArquivos=56
44. Kurek-Górecka, A., Keskin, Ş., Bobis, O., Felitti, R., Górecki, M., Otręba, M., Stojko, J., Olczyk, P., Kolayli, S., & RzepeckaStojko, A. (2022). Comparison of the antioxidant activity of propolis samples from different geographical regions. Plants, 11 (9), 1203 http://dx.doi.org/10.3390/plants11091203 PMid:35567206.
45 González-Montiel, L., Figueira, A. C., Medina-Pérez, G., Fernández-Luqueño, F., Aguirre-Álvarez, G., Pérez-Soto, E., Pérez-Ríos, S., & Campos-Montiel, R. G. (2022). Bioactive compounds, antioxidant and antimicrobial activity of propolis extracts during in vitro digestion. Applied Sciences (Basel, Switzerland) , 12 (15), 7892 http://dx.doi.org/10.3390/ app12157892
46 Sousa, J. P. L. M., Pires, L. O., Prudêncio, E. R., Santos, R. F., Sant’Ana, L. D., Ferreira, D. A. S., & Castro, R. N. (2019). Chemical and antimicrobial potential study of Brazilian propolis produced by different species of bees. Revista Virtual de Química, 11(5), 1480-1497 http://dx.doi. org/10.21577/1984-6835.20190103
47. Muzzolon, A., Bicudo, Á. J. A., Oldoni, T. L. C., & Sado, R. Y. (2021). Dietary brown propolis extract modulated nonspecific immune system and intestinal morphology of Pacu Piaractus mesopotamicus. Brazilian Archives of Biology and Technology, 64, e21200787 http://dx.doi.org/10.1590/16784324-2021200787.
48 Castro, R. N., & Salgueiro, F. B. (2016). Comparação entre a composição química e capacidade antioxidante de diferentes extratos de própolis verde. Quimica Nova, 39(10), 1192-1199 http://dx.doi.org/10.21577/0100-4042.20160136
49 Funari, C. S., Ferro, V. O., & Mathor, M. B. (2007). Analysis of propolis from Baccharis dracunculifolia DC. (Compositae) and its effects on mouse fibroblasts. Journal of Ethnopharmacology, 111(2), 206-212 http://dx.doi.org/10.1016/j.jep.2006.11.032 PMid:17207952.
50 Ramanauskienė, K., Savickas, A., Inkėnienė, A., Vitkevičius, K., Kasparavičienė, G., Briedis, V., & Amšiejus, A. (2009). Analysis of content of phenolic acids in Lithuanian propolis using high-performance liquid chromatography technique. Medicina , 45 ( 9 ), 712 - 717 . http://dx.doi.org/10.3390/ medicina45090093 PMid:19834308.
51 Tomazzoli, M. M., Zeggio, A. R. S., Dal Pai Neto, R., Specht, L., Costa, C., Rocha, M., Yunes, R. A., & Maraschin, M. (2020). Botanical source investigation and evaluation of the effect of seasonality on Brazilian propolis from Apis mellifera L. Scientia Agrícola, 77(6), e20180258 http:// dx.doi.org/10.1590/1678-992x-2018-0258
52 Calegari, M. A., Prasniewski, A., Silva, C., Sado, R. Y., Maia, F. M. C., Tonial, L. M. S., & Oldoni, T. L. C. (2017). Propolis from Southwest of Parana produced by selected bees: influence of seasonality and food supplementation on antioxidant activity and phenolic profile. Anais da Academia Brasileira de Ciências, 89(1), 45-55 http://dx.doi. org/10.1590/0001-3765201620160499. PMid:28177054.
53 Chaa, S., Boufadi, M. Y., Keddari, S., Benchaib, A. H., Soubhye , J. , Van Antwerpen , P. , & Riazi , A. ( 2019 ).
Chemical composition of propolis extract and its effects on epirubicin-induced hepatotoxicity in rats. Revista Brasileira de Farmacognosia, 29(3), 294-300. http://dx.doi.org/10.1016/j. bjp.2019.01.005
54 Xu, W., Lu, H., Yuan, Y., Deng, Z., Zheng, L., & Li, H. (2022). The antioxidant and anti-inflammatory effects of flavonoids from propolis via Nrf2 and NF-κB pathways. Foods, 11(16), 2439 http://dx.doi.org/10.3390/foods11162439 PMid:36010439.
55 Lima, A. B. S., Santos, D. O., Almeida, V. V. S., Oliveira, A. C., & Santos, L. S. (2022). Quantificação de constituintes fenólicos de extratos de própolis vermelha de diferentes concentrações por HPLC. Research. Social Development, 11(8), e1111830536 http://dx.doi.org/10.33448/rsd-v11i8.30536
56. Torres, A. R., Sandjo, L. P., Friedemann, M. T., Tomazzoli, M. M., Maraschin, M., Mello, C. F., & Santos, A. R. S. (2018). Chemical characterization, antioxidant and antimicrobial activity of propolis obtained from Melipona quadrifasciata quadrifasciata and Tetragonisca angustula stingless bees. Brazilian Journal of Medical and Biological Research , 51(6), e7118 http://dx.doi.org/10.1590/1414-431x20187118 PMid:29791598.
57. Sousa, A. K. A. (2018). Atividade antibacteriana do extrato hidroalcoólico da própolis vermelha no semiárido paraibano sobre streptococcus pyogenes. (Master’’s Thesis). Campina Grande: Universidade Federal de Campina Grande
58. Dégi, J., Herman, V., Igna, V., Dégi, D. M., Hulea, A., Muselin, F., & Cristina, R. T. (2022). Antibacterial activity of romanian propolis against Staphylococcus aureus isolated from dogs with superficial pyoderma: in vitro test. Veterinary Sciences, 9(6), 299 http://dx.doi.org/10.3390/vetsci9060299 PMid:35737351.
59 Xiao, Y., Zhao, H., Ma, X., Gu, Z., Wu, X., Zhao, L., Ye, L., & Feng, Z. (2022). Hydrogel dressing containing basic fibroblast growth factor accelerating chronic wound healing in aged mouse model. Molecules (Basel, Switzerland) , 27(19), 6361 http://dx.doi.org/10.3390/molecules27196361 PMid:36234898.
60 Berglund, L., Squinca, P., Baş, Y., Zattarin, E., Aili, D., Rakar, J., Junker, J., Starkenberg, A., Diamanti, M., Sivlér, P., Skog, M., & Oksman, K. (2023). Self-assembly of nanocellulose hydrogels mimicking bacterial cellulose for wound dressing applications. Biomacromolecules, 24(5), 2264-2277 http:// dx.doi.org/10.1021/acs.biomac.3c00152. PMid:37097826.
61 Hezaveh, H., Muhamad, I. I., Noshadi, I., Shu Fen, L., & Ngadi, N. (2012). Swelling behaviour and controlled drug release from cross-linked κ-carrageenan/NaCMC hydrogel by diffusion mechanism. Journal of Microencapsulation, 29(4), 368-379 http://dx.doi.org/10.3109/02652048.2011. 651501 PMid:22309480.
62 Akalin , G. O. , & Pulat , M. ( 2018 ). Preparation and characterization of nanoporous sodium carboxymethyl cellulose hydrogel beads. Journal of Nanomaterials, 2018, 9676949 http://dx.doi.org/10.1155/2018/9676949
63 Oliveira, R. N., McGuinness, G. B., Rouze, R., Quilty, B., Cahill, P., Soares, G. D. A., & Thiré, R. M. S. M. (2015). PVA hydrogels loaded with a Brazilian propolis for burn wound healing applications. Journal of Applied Polymer Science, 132(25), 42129 http://dx.doi.org/10.1002/app.42129
64 Pereira, I. C. S., Santos, N. R. R., Middea, A., Prudencio, E. R., Luchese, R. H., Moreira, A. P. D., & Oliveira, R. N. (2019). In vitro evaluation of PVA gels loaded with Copaiba Oil and Duotrill®. Polímeros: Ciência e Tecnologia, 29(3), e2019039. http://dx.doi.org/10.1590/0104-1428.03719.
65 Oshiro, J. A. Junior, Shiota, L. M., & Chiavacci, L. A. (2014). Desenvolvimento de formadores de filmes poliméricos
Polímeros, 33(2), e20230010, 2023 10/12
Superabsorbent biodegradable CMC membranes loaded with propolis: Peppas-Sahlin kinetics release
orgânico-inorgânico para liberação controlada de fármacos e tratamento de feridas. Matéria (Rio de Janeiro), 19(1), 2432 http://dx.doi.org/10.1590/S1517-70762014000100005
66 Alhazmi , H. A. ( 2019 ). FT-IR spectroscopy for the identification of binding sites and measurements of the binding interactions of important metal ions with bovine serum albumin. Scientia Pharmaceutica, 87(1), 5 http:// dx.doi.org/10.3390/scipharm87010005
67 Yamakami, S. A., Ubaldini, A. L. M., Sato, F., Medina Neto, A., Pascotto, R. C., & Baesso, M. L. (2018). Study of the chemical interaction between a high-viscosity glass ionomer cement and dentin. Journal of Applied Oral Science, 26(0), e20170384 http://dx.doi.org/10.1590/1678-7757-2017-0384 PMid:30020351.
68 Prasad, C. V., Sudhakar, H., Swamy, B. Y., Reddy, G. V., Reddy, C. L. N., Suryanarayana, C., Prabhakar, M. N., Subha, M. C. S., & Rao, K. C. (2011). Miscibility studies of sodium carboxymethylcellulose/poly(vinyl alcohol) blend membranes for pervaporation dehydration of isopropyl alcohol. Journal of Applied Polymer Science, 120(4), 2271-2281 http://dx.doi. org/10.1002/app.33418
69 Rajczak, E., Tylkowski, B., Constantí, M., Haponska, M., Trusheva, B., Malucelli, G., & Giamberini, M. (2020). Preparation and characterization of UV-curable acrylic membranes embedding natural antioxidants. Polymers, 12 (2), 358 http://dx.doi.org/10.3390/polym12020358
PMid:32041291.
70 . Juncu, G., Stoica-Guzun, A., Stroescu, M., Isopencu, G., & Jinga, S. I. (2016). Drug release kinetics from carboxymethylcellulosebacterial cellulose composite films. International Journal of Pharmaceutics, 510(2), 485-492. http://dx.doi.org/10.1016/j. ijpharm.2015.11.053. PMid:26688041.
71 Silva, C., Prasniewski, A., Calegari, M. A., Lima, V. A., & Oldoni, T. L. C. (2018). Determination of total phenolic compounds and antioxidant activity of ethanolic extracts of propolis using ATR–FT-IR spectroscopy and chemometrics. Food Analytical Methods, 11(7), 2013-2021 http://dx.doi. org/10.1007/s12161-018-1161-x
72 Lapa, L. S. S., Silva, Y. R. O., & Sales, P. F. (2020). Aplicação das análises espectroscópicas e termogravimétricas em filmes biodegradáveis de amido de milho incorporados com extrato de própolis-verde. ForScience, 8(2), e00712 http://dx.doi. org/10.29069/forscience.2020v8n2.e712
73 Freitas, L. H., & Lima, L. S. C. 73. Freitas, L. H., & Lima, L. S. C. (2018). Encapsulação de extrato de própolis utilizando soro de leite Fortaleza: Instituto Federal de Educação, Ciência e Tecnologia do Ceará - IFC. Retrieved in 2023, February 05, from http://prpi.ifce.edu.br/nl/_lib/file/doc4831-Trabalho/ ENCAPSULACAOODEEXTRATODEPRO POLISUTILIZANDOSORODELEITE.pdf
74 Claudino, G. P. (2011). Estudo fitoquímico-biológico da madeira da espécie Dalbergia glaucescens (Mart. ex Benth.) Benth (Doctoral Dissertation). Campos dos Goytacazes: Universidade Estadual do Norte Fluminense Darcy Ribeiro
75 Yeasmin, M. S., & Mondal, M. I. H. (2015). Synthesis of highly substituted carboxymethyl cellulose depending on cellulose particle size. International Journal of Biological Macromolecules, 80, 725-731 http://dx.doi.org/10.1016/j. ijbiomac.2015.07.040 PMid:26210036.
76 Scatolini, A. M., Pugine, S. M. P., Vercik, L. C. O., Melo, M. P., & Rigo, E. C. S. (2018). Evaluation of the antimicrobial activity and cytotoxic effect of hydroxyapatite containing Brazilian propolis. Biomedical Materials (Bristol, England), 13(2), 025010 http://dx.doi.org/10.1088/1748-605X/aa9a84 PMid:29135460.
77 Oliveira, R. N., Mancini, M. C., de Oliveira, F. C. S., Passos, T. M., Quilty, B., Thiré, R. M. S. M., & McGuinness, G. B. (2016). FTIR analysis and quantification of phenols and flavonoids of five commercially available plants extracts used in wound healing. Matéria (Rio de Janeiro), 21(3), 767-779 http://dx.doi.org/10.1590/S1517-707620160003.0072
78 Tyliszczak, B., Walczyk, D., & Wilczyński, S. (2015). Acrylic hydrogels modified with bee pollen for biomedical applications. Journal of Applied Pharmaceutical Science, 5(11), 010-014. http://dx.doi.org/10.7324/JAPS.2015.501102.
79 Nascimento, T. G., Silva, P. F., Azevedo, L. F., Rocha, L. G., Porto, I. C. C. M., Moura, T. F. A. L., Basílio-Júnior, I. D., Grillo, L. A. M., Dornelas, C. B., Fonseca, E. J. S., Oliveira, E. J., Zhang, A. T., & Watson, D. G. (2016). Polymeric Nanoparticles of Brazilian Red Propolis Extract: Preparation, Characterization, Antioxidant and Leishmanicidal Activity. Nanoscale Research Letters , 11 (1), 301 http://dx.doi. org/10.1186/s11671-016-1517-3 PMid:27316742.
80 Salmazo, P. S. (2019). Biorremediação de solo e água contaminados por solventes aromáticos provenientes de combustíveis. (Master’s Thesis). Sorocaba: Universidade de Sorocaba
81 Nasdala, L., Smith, D. C., Kaindl, R., & Ziemann, M. A. (2004). Raman spectroscopy. In A. Beran, & E. Libowitzky (Eds.), Spectroscopic methods in mineralogy (pp. 281-343). McLean: Mineralogical Society of Great Britain and Ireland http://dx.doi.org/10.1180/EMU-notes.6.7
82. Trilokesh, C., & Uppuluri, K. B. (2019). Isolation and characterization of cellulose nanocrystals from jackfruit peel. Scientific Reports, 9(1), 16709 http://dx.doi.org/10.1038/ s41598-019-53412-x PMid:31723189.
83 Shetty, S. K., Ismayil, Hegde, S., Ravindrachary, V., Sanjeev, G., Bhajantri, R. F., & Masti, S. P. (2021). Dielectric relaxations and ion transport study of NaCMC:NaNO3 solid polymer electrolyte films. Ionics, 27(6), 2509-2525 http://dx.doi. org/10.1007/s11581-021-04023-y
84 Bokuniaeva, A. O., & Vorokh, A. S. (2019). Estimation of particle size using the Debye equation and the Scherrer formula for polyphasic TiO 2 powder. In J, 6th International School and Conference “Saint Petersburg OPEN 2019”: Optoelectronics, Photonics, Engineering and Nanostructures (012057) Moscow: Journal of Physics: Conference Series
85 Poletto, M., Zattera, A. J., Forte, M. M. C., & Santana, R. M. C. (2012). Thermal decomposition of wood: influence of wood components and cellulose crystallite size. Bioresource Technology , 109 , 148-153 http://dx.doi.org/10.1016/j. biortech.2011.11.122 PMid:22306076.
86 Mohkami, M., & Talaeipour, M. (2011). Investigation of the chemical structure of carboxylated and carboxymethylated fibers from waste paper via Xrd and Ftir analysis. BioResources, 6(2), 1988-2003 http://dx.doi.org/10.15376/biores.6.2.1988-2003
87 Ahmad, N., Wahab, R., & Al-Omar, S. Y. (2014). Thermal decomposition kinetics of sodium carboxymethyl cellulose: model‐free methods. European Journal of Chemistry, 5(2), 247-251 http://dx.doi.org/10.5155/eurjchem.5.2.247-251.971
88 Lee, J. Y., Im, J. N., Kim, T. H., Chung, D. J., & Doh, S. J. (2015). Structure and liquid handling properties of waterinsoluble carboxymethyl cellulose foam. Fibers and Polymers, 16(4), 726-734 http://dx.doi.org/10.1007/s12221-015-0726-1
89 El-Sayed, S., Mahmoud, K. H., Fatah, A. A., & Hassen, A. (2011). DSC, TGA and dielectric properties of carboxymethyl cellulose/polyvinyl alcohol blends. Physica B, Condensed Matter, 406(21), 4068-4076 http://dx.doi.org/10.1016/j. physb.2011.07.050.
90 Badry, R., Ezzat, H. A., El-Khodary, S., Morsy, M., Elhaes, H., Nada, N., & Ibrahim, M. (2021). Spectroscopic and thermal
Polímeros, 33(2), e20230010, 2023 11/12
analyses for the effect of acetic acid on the plasticized sodium carboxymethyl cellulose. Journal of Molecular Structure, 1224, 129013 http://dx.doi.org/10.1016/j.molstruc.2020.129013
91 Yaradoddi, J. S., Banapurmath, N. R., Ganachari, S. V., Soudagar, M. E. M., Mubarak, N. M., Hallad, S., Hugar, S., & Fayaz, H. (2020). Biodegradable carboxymethyl cellulose based material for sustainable packaging application. Scientific Reports, 10(1), 21960 http://dx.doi.org/10.1038/s41598-02078912-z PMid:33319818.
92. Seki, Y., Altinisik, A., Demircioğlu, B., & Tetik, C. (2014). Carboxymethylcellulose (CMC)–hydroxyethylcellulose (HEC) based hydrogels: synthesis and characterization. Cellulose (London, England), 21(3), 1689-1698. http://dx.doi. org/10.1007/s10570-014-0204-8
93 Tabari, M. (2017). Investigation of Carboxymethyl Cellulose (CMC) on mechanical properties of cold water fish gelatin biodegradable edible films. Foods, 6(6), 41 http://dx.doi. org/10.3390/foods6060041 PMid:28555025.
94 Lan, W., He, L., & Liu, Y. (2018). Preparation and properties of sodium carboxymethyl cellulose/sodium alginate/chitosan composite film. Coatings, 8(8), 291. http://dx.doi.org/10.3390/ coatings8080291
95 Laurano, R., Boffito, M., Ciardelli, G., & Chiono, V. (2022). Wound dressing products: a translational investigation from the bench to the market. Engineered Regeneration, 3(2), 182-200. http://dx.doi.org/10.1016/j.engreg.2022.04.002.
96 Hassan, S., Ali, M. N., Mir, M., Ahmed, A., & Arshad, M. (2021). Development and evaluation of drug delivery patch for topical wound healing application. SN Applied Sciences, 3(10), 825 http://dx.doi.org/10.1007/s42452-021-04809-9
97. Miranda-Calderon, L., Yus, C., Landa, G., Mendoza, G., Arruebo, M., & Irusta, S. (2022). Pharmacokinetic control on the release of antimicrobial drugs from pH-responsive electrospun wound dressings. International Journal of Pharmaceutics, 624, 122003 http://dx.doi.org/10.1016/j. ijpharm.2022.122003 PMid:35811042.
98 Basílio, J. A. D. (2018). Desenvolvimento e avaliação in vitro da atividade cicatrizante de membranas poliméricas incorporadas com própolis vermelha (Doctoral Dissertation).
Maceió: Universidade Federal de Alagoas
99 Brasil Ministério da Saúde Resolução-RDC nº 31. (2010, August 11 ). Dispõe sobre a realização dos Estudos de
Equivalência Farmacêutica e de Perfil de Dissolução Comparativo Biblioteca Virtual em Saúde. Retrieved in 2023, February 05, from http://bvsms.saude.gov.br/bvs/ saudelegis/anvisa/2010/res0031_11_08_2010.html
100 Rozo, G., Bohorques, L., & Santamaría, J. (2019). Controlled release fertilizer encapsulated by a κ-carrageenan hydrogel. Polímeros: Ciência e Tecnologia, 29(3), e2019033. http:// dx.doi.org/10.1590/0104-1428.02719.
101 Peppas, N. A., & Sahlin, J. J. (1989). A simple equation for the description of solute release. III. Coupling of diffusion and relaxation. International Journal of Pharmaceutics, 57(2), 169-172 http://dx.doi.org/10.1016/0378-5173(89)90306-2
102 Ritger, P. L., & Peppas, N. A. (1987). A simple equation for description of solute release I. Fickian and non-fickian release from non-swellable devices in the form of slabs, spheres, cylinders or discs. Journal of Controlled Release, 5(1), 2336 http://dx.doi.org/10.1016/0168-3659(87)90034-4
103 Chaiya, P., Rojviriya, C., Pichayakorn, W., & Phaechamud, T. (2022). New Insight into the Impact of Effervescence on Gel Layer Microstructure and Drug Release of Effervescent Matrices Using Combined Mechanical and Imaging Characterisation Techniques. Pharmaceutics, 14(11), 2299 http://dx.doi. org/10.3390/pharmaceutics14112299 PMid:36365118.
104 Trucillo, P. (2022). Drug Carriers: A Review on the Most Used Mathematical Models for Drug Release. Processes (Basel, Switzerland), 10(6), 1094 http://dx.doi.org/10.3390/ pr10061094
105 Altun, E., Yuca, E., Ekren, N., Kalaskar, D. M., Ficai, D., Dolete, G., Ficai, A., & Gunduz, O. (2021). Kinetic Release Studies of Antibiotic Patches for Local Transdermal Delivery. Pharmaceutics , 13 (5), 613 http://dx.doi.org/10.3390/ pharmaceutics13050613 PMid:33922739.
106. Liu, F., Wang, Z., Guo, H., Li, H., Chen, Y., & Guan, S. (2023). A Double-Layer Hydrogel Dressing with High Mechanical Strength and Water Resistance Used for Drug Delivery. Molecules (Basel, Switzerland), 28(2), 499 http:// dx.doi.org/10.3390/molecules28020499 PMid:36677557.
Received: Feb. 05, 2023
Revised: Jul. 01, 2023
Accepted: Jul. 12, 2023
Polímeros, 33(2), e20230010, 2023 12/12
Sousa, J. P. L. M., Oliveira, R. N., Santos, A. M. N., Gamallo, O. D., Araújo, L. S., Middea, A., Cid, Y. P., & Castro, R. N.
Cellulose fiber network as reinforcement of thermoplastic paraffin films
1Instituto de Química de São Carlos, Universidade de São Paulo – USP, São Carlos, SP, Brasil *aprigio@iqsc.usp.br
Obstract
The incorporation of natural fibers into polymer matrices poses challenges due to physicochemical incompatibility, which is typically addressed through precursor modification or the use of compatibilizers. Here, we introduce a novel type of composite that overcomes this challenge by utilizing a network of fine, porous cellulosic sheets inter-diffused with a commercial paraffin films. This approach physically adheres the fiber network to the matrix, preserving its structure. Microscopy images confirm the formation of the proposed microstructure, and mechanical testing reveals a gradual increase in modulus and strength with the incorporation of cellulose. The maximum incorporation achieved was 7.6% (w/w) of cellulosic fibers, resulting in a 167% increase (1.67 times improved) in composite stiffness. Moreover, these composites exhibit ductility, with an average deformation of 410 ± 38%, corresponding to 20% reduction in relation to pure matrix. Our findings demonstrate the potential of this approach for developing sustainable materials with improved mechanical properties.
Keywords: natural fibers, composites, network reinforcement, paper, polymer matrices.
How to cite: Flores, M. F., Cordeiro, L., & Curvelo, A. A. S. (2023). Cellulose fiber network as reinforcement of thermoplastic paraffin films. Polímeros: Ciência e Tecnologia, 33(2), e20230023. https://doi.org/10.1590/01041428.20230022
1. Introduction
Natural fibers have been used as reinforcement in composite materials for over 2000 years[1]. The development of these materials has attracted attention for applications in several segments, mainly in the automotive and packaging industries[2]. In this scenario, cellulose fibers as a reinforcement material have advantages such as lower cost, lower density, abundance, availability and less abrasiveness of the processing equipment when compared to glass fibers[3,4].
Despite the potential of these composites, nonpolar matrices and cellulose fibers (polar) do not have good physical-chemical compatibility[5,6]. Due to this high fibermatrix incompatibility, most of the works on these theme focuses on fiber modification, matrix functionalization or the addition of compatibilizing agents[7-9]. However, apart from these physical and chemical interactions, other adhesion mechanisms must be taken into account when designing new materials[10]. Thus, configurations that allow, for example, maintaining cellulose fibers in the form of a network mechanically connected to the matrix can be designed.
For reasons intrinsic to the method, the extrusion of polymeric matrices with cellulose (or lignocellulosic fibers) does not allow obtaining composites in which the reinforcement is presented as a fibrous network[11,12]. On a laboratory scale, one of the most used methods is solvent casting[11]. However, the method requires a high amount of solvent and is difficult to apply on an industrial scale[13]. In addition, for non-polar matrices it is necessary to use
solvents that are harmful to men and the environment, such as toluene[14]
Another common processing method is compression molding. This stands out for its relatively low cost, simplicity and speed, and it is also very attractive for obtaining composites in the form of films[15]. Furthermore, with this method it is also possible to obtain composites in which the reinforcement is in the form of a fibrous network in the finished part. However, studies that describe the preparation of composite materials using this method reveal that the matrix is adhered to the fibers only on the surface[16,17]. Thus, the matrix does not represent a continuous phase throughout the reinforcement, serving basically as a covering layer.
In sheets of paper, cellulose fibers are connected by hydrogen bonds and form a tangled network of fibers[18]. In general, the fiber network is composed of cellulose fibers randomly distributed containing a set of cavity pore channels with a variety of capillary dimensions[19]. For the proposed application, the sheet of paper formed by the network of cellulosic fibers must be sufficiently thin to allow diffusion of the matrix.
In this work, we proposed the preparation and characterization of polymeric composites reinforced with cellulosic fibers in the form of a network. In this configuration, the polymeric matrix and the cellulose sheets will be arranged in layers so that after processing the matrix will be diffused, entangled and, thus, mechanically adhered to the cellulose
https://doi.org/10.1590/0104-1428.20230022 O O O O O O O O O O O O O O O Polímeros, 33(2), e20230023, 2023 ISSN 1678-5169 (Online) 1/7
Matheus Fernandes Flores1 , Luciano Cordeiro1 and Antonio Aprigio da Silva Curvelo1*
fibers (Figure 1). The aim was to obtain films in which the fiber network will be ‘embedded’ in the polymeric matrix, without the need for derivatization of the matrix and/or reinforcement and without the addition of compatibilizers.
2. Materials and Methods
2.1
Materials
Commercial bleached eucalyptus Kraft pulp with 60% humidity (supplied by Suzano S.A.) and Parafilm® (commercial paraffin films approximately 120 μm thick) produced by Bemis Company
2.2 Production of cellulosic sheets
Since commercial sheets of paper do not have the desired cavity pore channels to allow the matrix diffusion through the cellulosic fibers (toilet paper has grammage of 15 g/m2, for instance), we produced our own following the method described by Cordeiro et al.[20]
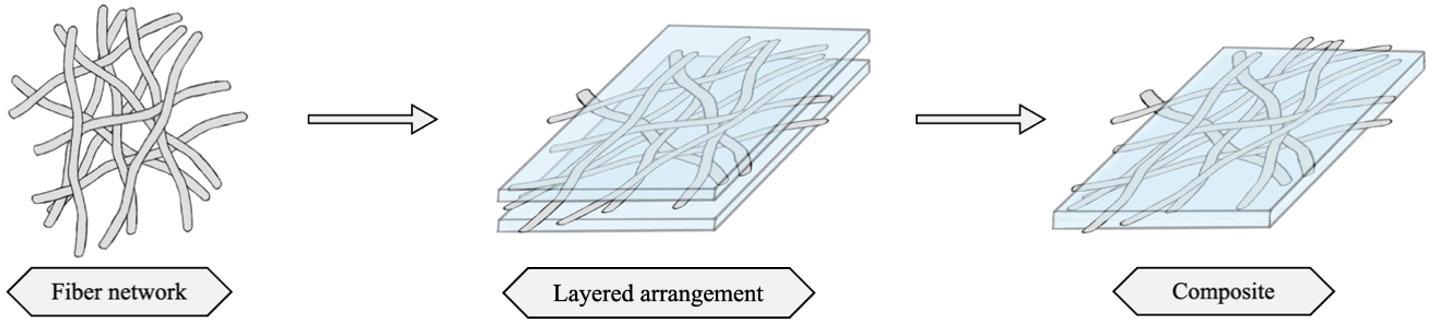
In brief, the pulp was dispersed in 800 mL of water for 8 minutes using a Turrax Mixer. The resulting dispersion was poured over a specially adapted system consisting of a PVC tube with a nylon fabric attached to one end, positioned on top of a metal sieve, both of which were submerged in water during the process. After the sieve system was suspended to drain the water, it was taken to an oven at 40 °C to dry. The resulting cellulosic sheet was manually removed from the nylon fabric. The process is illustrated in Figure 2
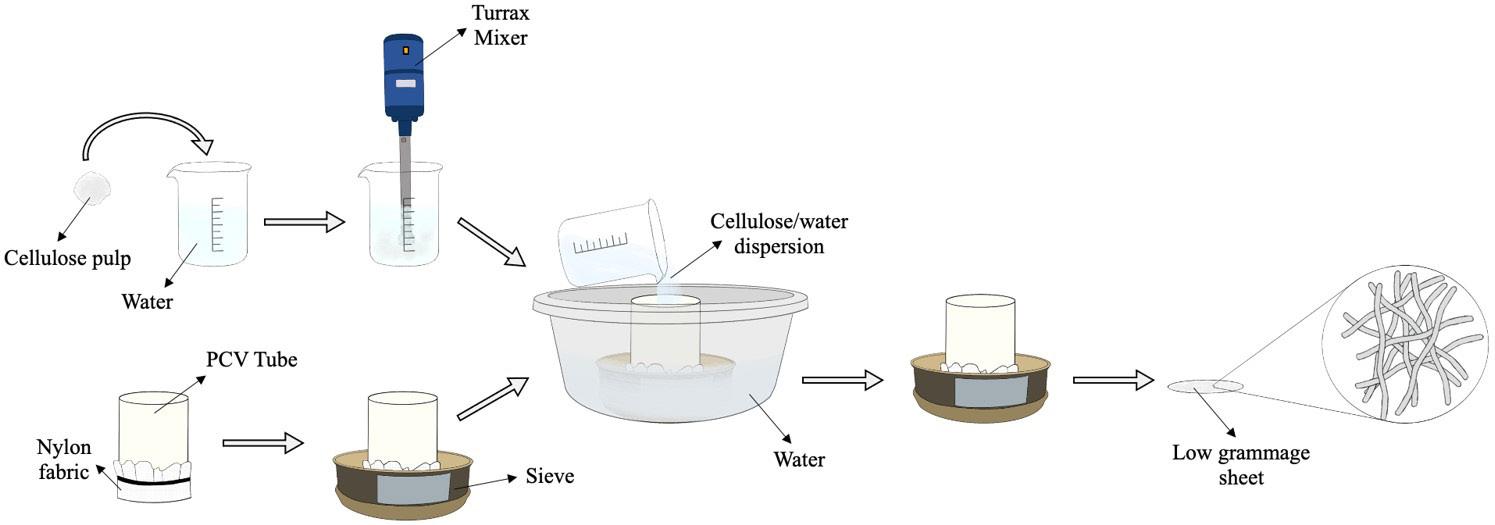
Different grammages of the cellulosic fibers sheets were produced, including 4 g/m2, 6 g/m2, and 8 g/m2, to test their effectiveness as reinforcement materials in the composites. The produced sheets were porous and lightweight, thus
suitable for our purpose of matrix diffusion through the cellulosic fibers.
2.3 Preparation of composites
Composites were prepared through a continous process using a commercial Lassane laminator model A3-330C. In this method, cellulosic sheets were arranged in an interspersed manner between commercial films of Parafilm®, following the specifications described in Table 1. To ensure smooth surfaces and prevent adhesion to the rollers, the arrangement was placed between two sheets of PET. This set was also placed between two aluminum sheets to facilitate the manipulation (Figure 3). The procedure was performed at a temperature of 160 °C. The sets of sheets and parafilm were passed through the laminator rolls twice (5 seconds each turn).
2.4 Microstructural analysis
Images obtained by optical microscopy with a digital camera attached were used to evaluate the morphology, compaction, distribution and orientation of the fibers in both sheets and composite films.
Micrographs obtained by Scanning Electron Microscopy were used to evaluate the formation of the proposed composite (checking the presence of matrix between the fibers). The samples were fractured in liquid N2. Then, they were placed in samples holder and submitted to a gold bath. Images of the fragile fracture of these materials were obtained in a ZEISS LEO 440 equipment.
2.5 Tensile properties
Tensile tests were performed in triplicate to obtain information about the limit of tensile strength σ, the stiffness
M. F.,
Polímeros, 33(2), e20230023, 2023 2/7
Flores,
Cordeiro, L., & Curvelo, A. A. S.
Figure 1. General steps to obtain the composites.
Figure 2. Scheme for obtaining low weight cellulosic fiber sheets.
Cellulose fiber network as reinforcement of thermoplastic paraffin films
Specimen
2P Parafilm® films with two layers
Description
2P-Cel.G4 Two Parafilm® layers with a 4 g/m2 grammage cellulosic sheet between them
2P-Cel.G6 Two Parafilm® layers with a 6 g/m2 grammage cellulosic sheet between them
2P-Cel.G8 Two Parafilm® layers with a 8 g/m2 grammage cellulosic sheet between them
2P-3Cel.G6 Two Parafilm® layers interspersing three 6 g/m2 grammage cellulosic sheet
2P-4Cel.G6 Two Parafilm® layers interspersing four (two in the middle) 6 g/m2 grammage cellulosic sheet
(through the elasticity module, E), and the ductility (through the percentage elongation, ε (%)). The specimens, in the form of films (thicknesses varying between 250 μm and 400 μm), had dimensions of 20 x 50 mm and were analyzed with a useful length of 30 mm. The tensile versus strain tests were performed on an Instron 5969 Universal Material Testing Machine, equipped with a 5kN load cell, at a strain rate of 30 mm min-1


3. Results and Discussions
Composites were obtained with different fibers percentages (w/w), varying between 1.1% and 9.9%. The low amount of reinforcement in the films obtained is due to the high mass and thickness of the matrix. The descriptions of the prepared materials and their cellulosic mass concentration and thickness data are shown in Table 1 and Table 2, respectively.
3.1 Optical transparency and homogeneity
Cellulose fibers are naturally opaque, while Parafilm® films are transparent (Figure 4a and 4b). However, by combining these materials in a composite, it is possible to create a transparent and homogeneous product (Figure 4c).
It can be explained by light refraction and scattering. When light passes through the composite, it travels through the transparent matrix before reaching the interface between the Parafilm® and cellulose layers. In this case, the material tends to have low reflection and high transmittance, as the refractive indices of the materials at the interface are similar (nCELLULOSE = 1.54; nPARAFILM ~ nPOLYETHYLENE = 1.51)
When the composite is stretched (Figure 4d), it becomes whitish due to light scattering caused by a Stress Whitening effect[21]. This occurs because the voids formed by detachament of the fibers from the matrix. This new interface (parafilm/ void/cellulose) generates significant light scattering and the whitening effect.
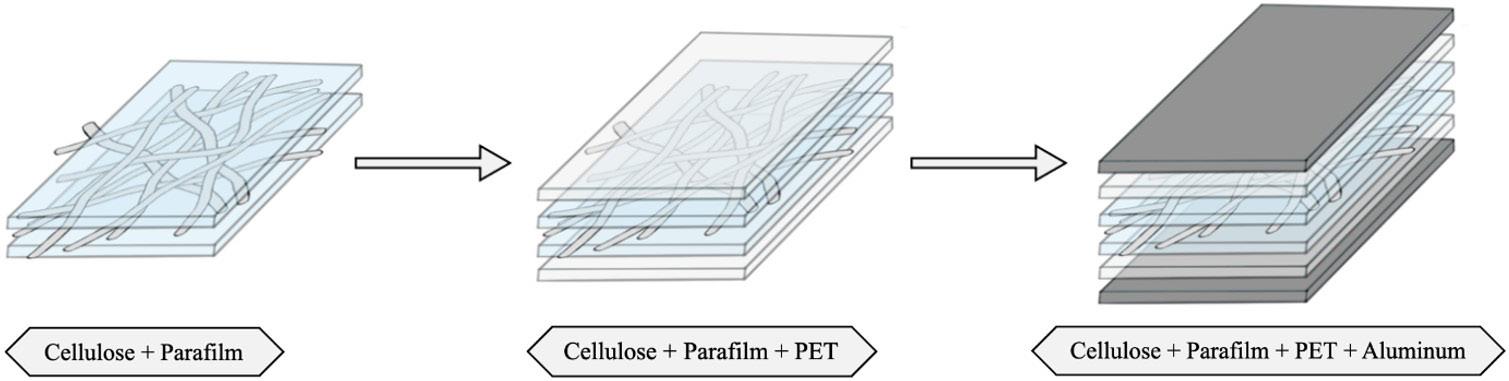
Polímeros, 33(2), e20230023, 2023 3/7
Table 1. Specimen notation for fabricated composites.
Figure 3. Arrangements in composite preparation.
Specimen % (w/w) Thickness (mm) 2P - 0.25 2P-Cel.G4 1.7 0.26 2P-Cel.G6 2.7 0.26 2P-Cel.G8 3.4 0.27 2P-3Cel.G6 7.6 0.27 2P-4Cel.G6 9.9 0.28
Table 2. Cellulosic mass concentration and material thickness.
3.2 The composite microstructure
The optical microscopy images of the cellulosic sheets reveal a good fiber distribution and random orientation with empty spaces between the fibers, which can facilitate the diffusion of the polymeric matrix (Figures 5a, 5b).
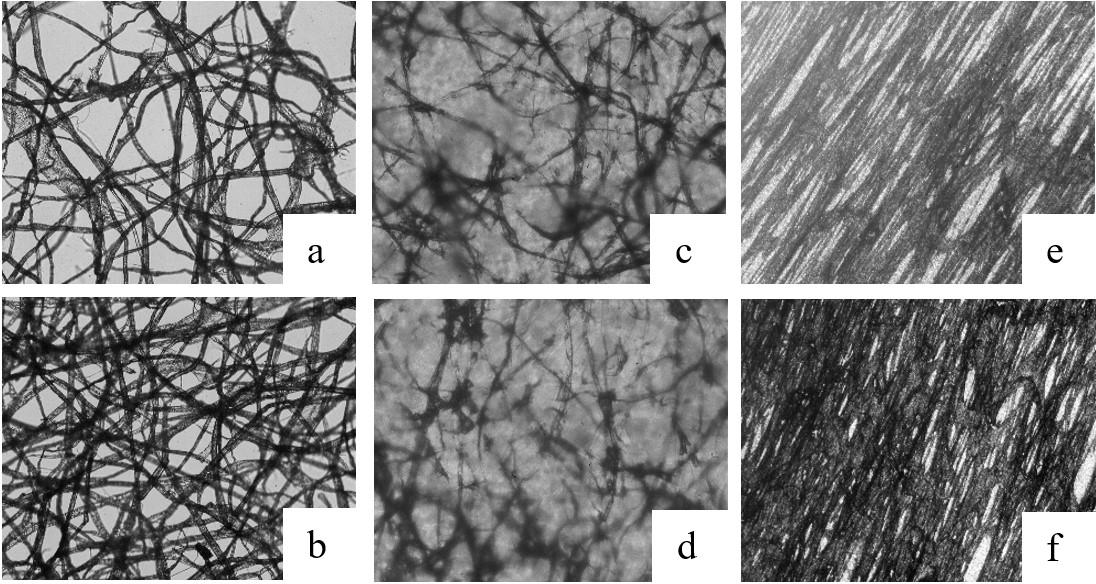
Similarly, the composites prepared using the continuous laminating process show a maintained good fiber distribution with a cellulose network that is not destroyed during the process (Figures 5c, 5d). The stretching of the composite films leads to the orientation of the cellulose fibers in the direction of the applied load (Figures 5e, 5f).
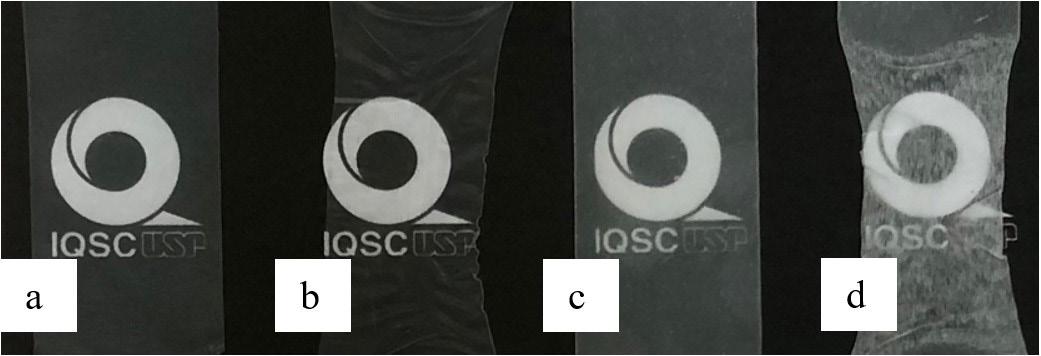
SEM images of the cryogenic fracture confirm the formation of the composite with the planned microstructure. The cellulosic fibers are surrounded by the Parafilm® matrix (Figures 6a, 6b). No large voids are observed amid the fibers, except for cases where fibers are pulled out. Although the fibers are surrounded by matrix, there is a detachment of the fiber from the matrix due to the low interaction between cellulose and Parafilm® (Figure 6b).
In composites where the cellulosic sheets were positioned as the outermost layer, the matrix completely passed through the sheet towards the outside of the composite
after processing (Figure 6c). However, there is a limit to the matrix diffusion between the fiber network. The increase in the fiber concentration obstructs the channels through which the matrix would pass, resulting in discontinuities between the fiber and matrix. The use of two cellulosic sheets with 6 g/m2 grammage between two Parafilm® layers resulted in composites in which the fibers are not completely enveloped by the polymeric matrix (Figure 6d). Such discontinuities can cause premature material failure.
In addition, the relatively high thickness of Parafilm® films compared to the cellulosic sheets is the reason for the low reinforcement/matrix ratio observed in the SEM images. The use of thinner thermoplastic films would allow for the production of composites with a greater amount of reinforcement.
3.3 Tensile tests
Table 3 summarizes the results for the Elastic Modulus, Tensile Strength, and Elongation at Break of the investigated compounds. Figure 7 shows the stress x strain curves for composites with the same amount of Parafilm® and variable numbers of cellulosic sheets. Compared to the double layer
Flores, M. F., Cordeiro, L., & Curvelo, A. A. S. Polímeros, 33(2), e20230023, 2023 4/7
Figure 4. Photos of the materials: (a) and (b) Parafilm® before and after tensile stress, respectively; (c) and (d) 2P-Cel.G6 composites before and after tensile stress, respectively.
Figure 5. Micrographs at 125x (a, b, c, d) and 32x (e, f) magnification. (a) and (b) 4 g/m 2 and 8 g/m2 grammage cellulosic sheets, respectively; (c) 2P-Cel.G4; (d) 2P-Cel.G8; (e) and (f) composite films with unidirectional applied load.
Cellulose fiber network as reinforcement of thermoplastic paraffin films
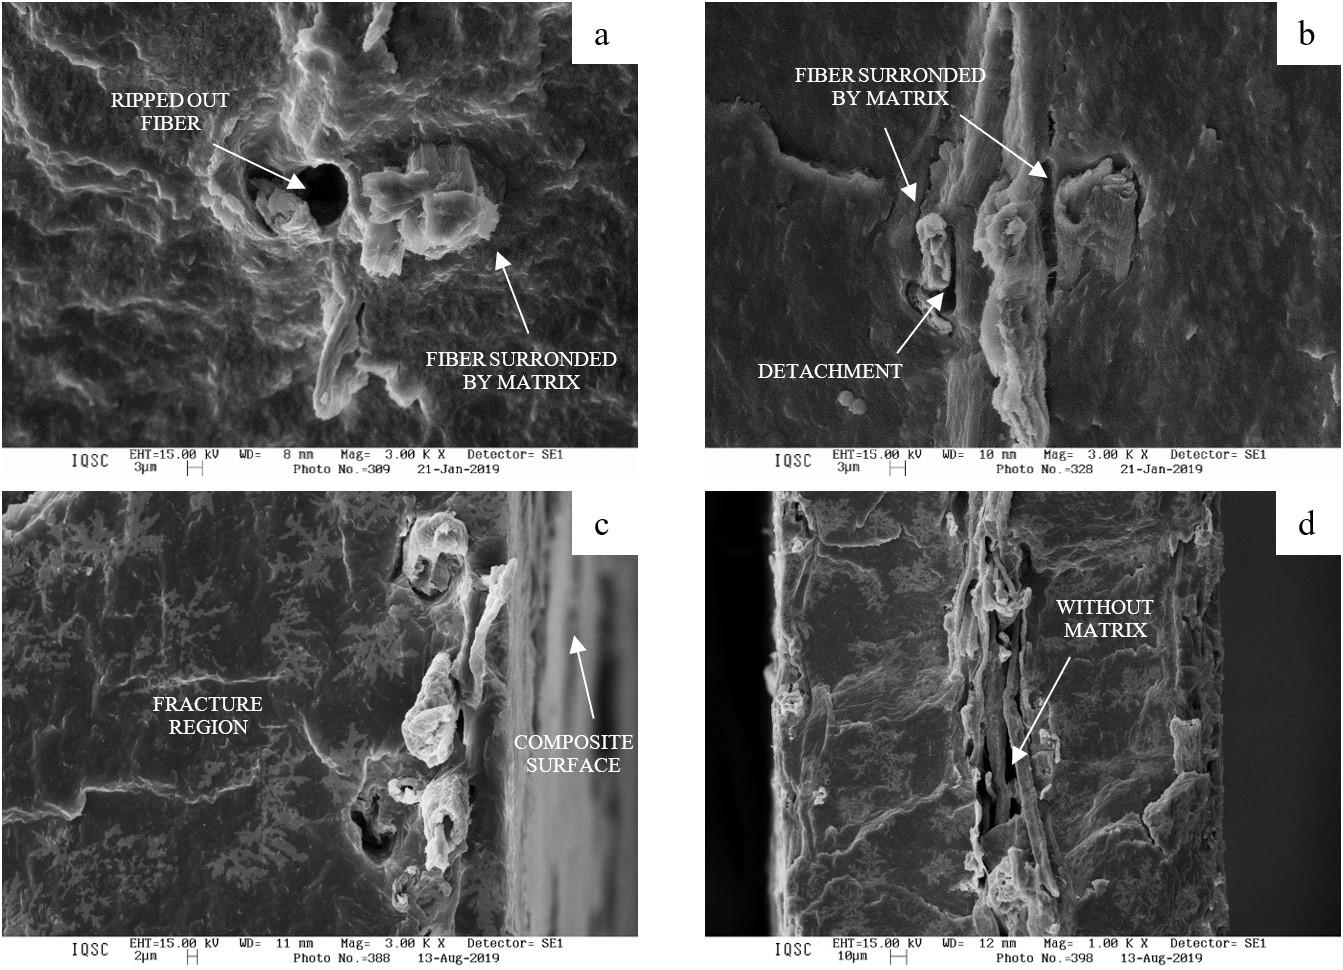
of Parafilm®, the incorporation of bleached cellulose fibers resulted in a significant increase in the modulus of elasticity, with a 118.7%, 166.8%, and 291.1% increase observed for 2.7% (w/w), 7.6% (w/w), and 9.9% (w/w) of fibers, respectively. However, the composite obtained with 9.9% (w/w) fibers did not have the desired configuration due to the inability of the plastic film to permeate the cellulosic fibers network.
The incorporation of fibers also resulted in increased mechanical strength at low deformations, with the largest tensile strength observed for the thermoplastic
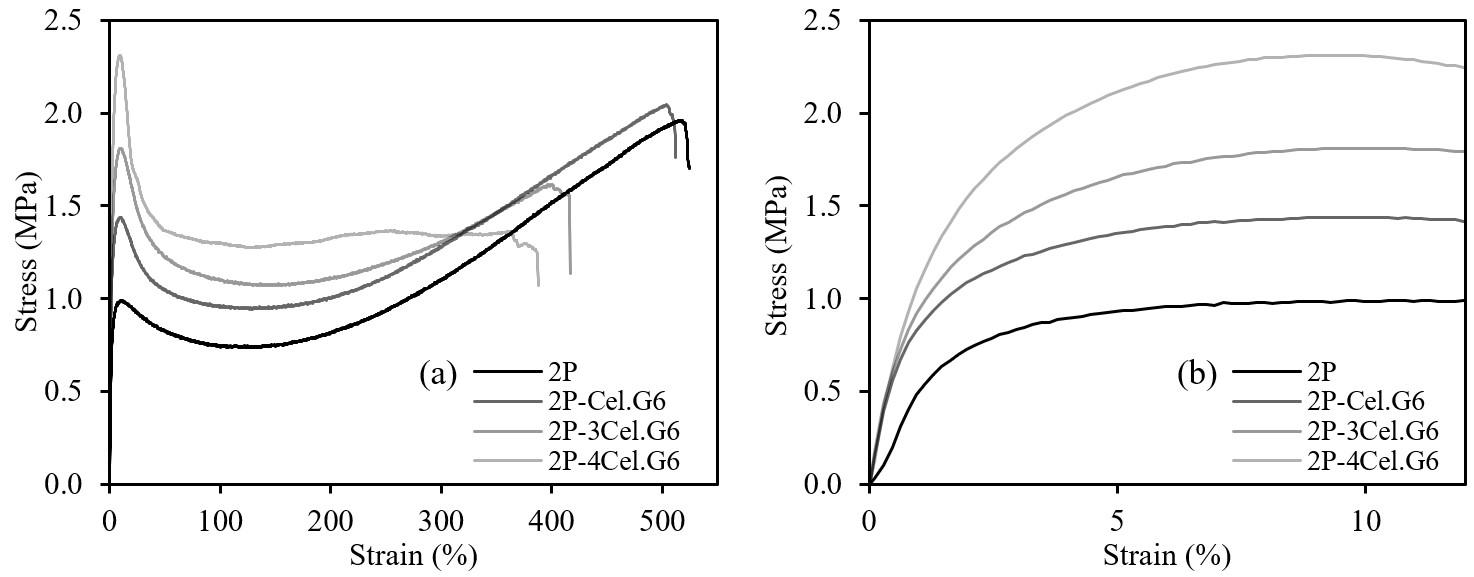
Polímeros, 33(2), e20230023, 2023 5/7
Figure 6. SEM images for: (a) fragile fracture of 2P-Cel.G4; (b) fragile fracture of 2P-Cel.G8; (c) fragile fracture of 2P-3Cel.G6 – limit region of the fracture surface; (d) fragile fracture of 2P-4Cel.G6.
Specimen E (MPa) σ (MPa) ε (%) 2P 24.7 ± 1.2 1.94 ± 0.05 513 ± 14 2P-Cel.G4 54.6 ± 7.8 1.89 ± 0.16 487 ± 61 2P-Cel.G6 56.5 ± 6.2 2.02 ± 0.02 502 ± 10 2P-Cel.G8 65.5 ± 11.7 1.44 ± 0.11 389 ± 46 2P-3Cel.G6 65.9 ± 4.8 1.83 ± 0.06 410 ± 38 2P-4Cel.G6 96.6 ± 9.2 2.27 ± 0.10 362 ± 68
Table 3. Mechanical properties – Elastic modulus (E); Ultimate tensile strength (σ); elongation at break, ε (%); and its respective standart desviation.
Figure 7. Stress x strain graph for (a) Parafilm® films and composite films containing one, three or four cellulosic sheets of 6 m/g2 (average curve); (b) enlargement of a.
matrix due to the alignment of polymer chains in greater deformations.
The elongation at break for the composites with 7.6% (w/w) of bleached cellulosic fibers was around 410%, with an approximately 20% reduction in strain compared to 2P. Some specimens showed deformations of up to 452%, indicating that necking of the specimen was propagated by the sample. However, the spread of necking was often halted due to the presence of regions with a high concentration of fibers, which acted as stress concentrators, causing the fracture of the material earlier than expected[22,23]
Figure 8 shows the stress x strain curves for composites with the same amount of Parafilm® (constant) and a single cellulosic sheet but with different variable weights. The insertion of reinforcement caused an increase in the material module. However, when associated the modulus growth with the increase of the sheet grammage, it is noticed that there is not such a significant improvement.
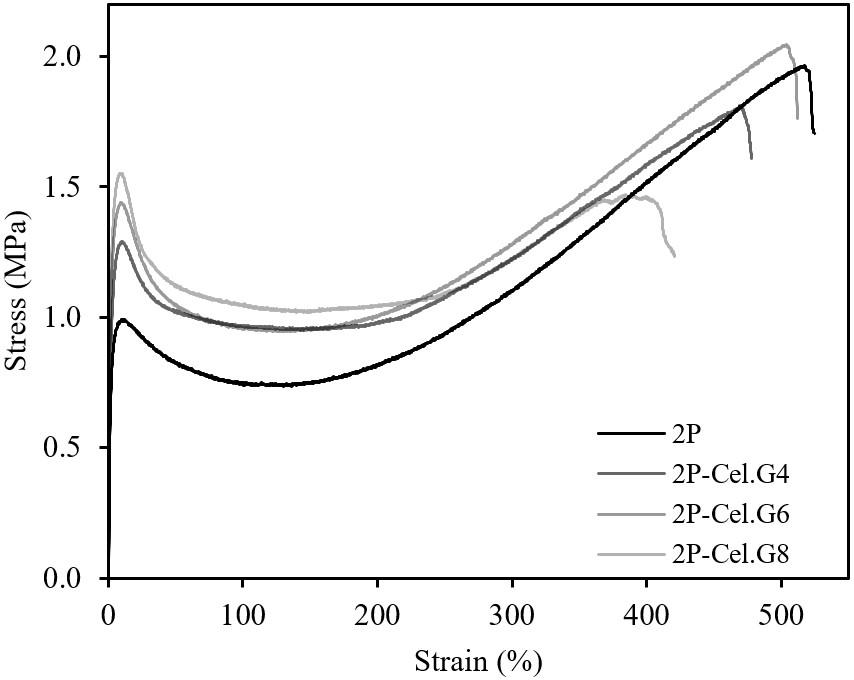
The incorporation of bleached cellulose fibers resulted in an increase in the modulus of elasticity and mechanical strength of the composite. However, higher amounts of fibers led to a reduction in ductility and a lower elongation at break due to the presence of regions with high concentrations of fibers that acted as stress concentrators. Furthermore, the increase in sheet grammage did not result in a significant improvement in the composite’s material properties.
4. Conclusions
Composites were obtained laminating thin cellulosic sheets with low grammage (4 g/m2, 6 g/m2 and 8 g/m2) and commercial Parafilm® films. In these composites, no chemical modification of the constituents was carried out and no additives were used. Characteristics of the composites microstructure include: (1) cellulosic fibers network with a set of cavity pore channels; (2) fill and permeation of the spaces amid the cellulosic fibers by the matrix; (3) good matrix distribution throughout the cellulosic sheet.
Regarding the amount of reinforcement, the increase in the number of cellulosic sheets layers leads to a gradual increase in module and mechanical resistance (at low and
medium deformations). However, the grammage of the sheets (between 4 g/m2 and 8 g/m2) did not have as much influence on the property of these composites. Properties of composites containing 7.6% (w/w) cellulosic fibers include greater tensile strength than Parafilm® in low and medium strain (less than 300%), greater rigidity than Parafilm® (increase in modulus up to 167%) and high deformations (average of 410%).
These results suggest that careful optimization of the amount and distribution of cellulosic fibers in the composite matrix is crucial for obtaining the desired mechanical properties.
5. Author’s Contribution
• Conceptualization – Matheus Fernandes Flores; Luciano Cordeiro; Antonio Aprigio da Silva Curvelo.
• Data curation – Matheus Fernandes Flores.
• Formal analysis – Matheus Fernandes Flores; Luciano Cordeiro.
• Funding acquisition – Antonio Aprigio da Silva Curvelo.
• Investigation – Matheus Fernandes Flores; Luciano Cordeiro.
• Methodology – Matheus Fernandes Flores; Luciano Cordeiro; Antonio Aprigio da Silva Curvelo.
• Project administration – Matheus Fernandes Flores; Luciano Cordeiro; Antonio Aprigio da Silva Curvelo.
• Resources – Matheus Fernandes Flores; Luciano Cordeiro; Antonio Aprigio da Silva Curvelo.
• Software – NA.
• Supervision – Antonio Aprigio da Silva Curvelo.
• Validation – Matheus Fernandes Flores.
• Visualization – Matheus Fernandes Flores.
• Writing – original draft – Matheus Fernandes Flores.
• Writing – review & editing –Antonio Aprigio da Silva Curvelo.
6. Acknowledgements
The authors would to acknowledge the financial support from the Coordenação de Aperfeiçoamento de Pessoal de Nível Superior – Capes (PhD fellowship for Luciano Cordeiro), from Conselho Nacional de Desenvolvimento Científico e Técnológico – CNPq (PIBIC fellowship for Matheus Fernandes. Professor Antonio Aprigio da Silva Curvelo is CNPq fellow (Number: 304511/2019-6).
7. References
1 Kumar, K. P., & Sekaran, A. S. J. (2014). Some natural fibers used in polymer composites and their extraction processes: a review. Journal of Reinforced Plastics and Composites, 33(20), 1879-1892. http://dx.doi.org/10.1177/0731684414548612.
2 Kalia, S., Kaith, B. S., & Kaur, I. (2009). Pretreatments of natural fibers and their application as reinforcing material in polymer composites - a review. Polymer Engineering and Science, 49(7), 1253-1272 http://dx.doi.org/10.1002/pen.21328
Flores, M. F., Cordeiro, L., & Curvelo, A. A. S. Polímeros, 33(2), e20230023, 2023 6/7
Figure 8. Stress x strain graph for Parafilm® films and composite films containing a cellulosic sheets with 4 m/g2, 6 m/g2 or 8 m/g2
Cellulose fiber network as reinforcement of thermoplastic paraffin films
3 Kalia, S., Kaith, B. S., & Kaur, I. (Eds.) (2011). Cellulose fibers: bio-and nano-polymer composites: green chemistry and technology Germany: Springer-Verlag Berlin Heidelberg http://dx.doi.org/10.1007/978-3-642-17370-7
4. Joshi, S. V., Drzal, L. T., Mohanty, A. K., & Arora, S. (2004). Are natural fiber composites environmentally superior to glass fiber reinforced composites? Composites. Part A, Applied Science and Manufacturing, 35(3), 371-376 http://dx.doi. org/10.1016/j.compositesa.2003.09.016
5. Arrakhiz, F. Z., Malha, M., Bouhfid, R., Benmoussa, K., & Qaiss, A. (2013). Tensile, flexural and torsional properties of chemically treated alfa, coir and bagasse reinforced polypropylene. Composites. Part B, Engineering, 47, 35-41. http://dx.doi.org/10.1016/j.compositesb.2012.10.046
6 Portella, E. H., Romanzini, D., Angrizani, C. C., Amico, S. C., & Zattera, A. J. (2016). Influence of stacking sequence on the mechanical and dynamic mechanical properties of cotton/glass fiber reinforced polyester composites. Materials Research, 19(3), 542-547 http://dx.doi.org/10.1590/19805373-MR-2016-0058
7 . Pracella, M., Haque, M.-U., & Alvarez, V. (2010). Functionalization, compatibilization and properties of polyolefin composites with natural fibers. Polymers, 2(4), 554-574 http://dx.doi. org/10.3390/polym2040554
8 Cipriano, J. P., Zanini, N. C., Dantas, I. R., & Mulinari, D. R. (2019). Mechanical properties of polypropylene composites reinforced with Macadamia Nutshell Fibers. Journal of Renewable Materials, 7(10), 1047-1053 http://dx.doi.org/10.32604/ jrm.2019.00001.
9 Lima, L. P. F. C., Santana, R. M. C., & Rodríguez, C. D. C. (2020). Influence of Coupling Agent in Mechanical, Physical and Thermal Properties of Polypropylene/Bamboo Fiber Composites: Under Natural Outdoor Aging. Polymers, 12(4), 929 http://dx.doi.org/10.3390/polym12040929 PMid:32316512.
10 Kinloch, A. J. (2012). Adhesion and adhesives: science and technology UK: Springer Science & Business Media
11 Oksman, K., Aitomäki, Y., Mathew, A. P., Siqueira, G., Zhou, Q., Butylina, S., Tanpichai, S., Zhou, X., & Hooshmand, S. (2016). Review of the recent developments in cellulose nanocomposite processing. Composites. Part A, Applied Science and Manufacturing, 83, 2-18 http://dx.doi.org/10.1016/j. compositesa.2015.10.041.
12 Oksman, K., Mathew, A. P., & Sain, M. (2009). Novel bionanocomposites: processing, properties and potential applications. Plastics, Rubber and Composites, 38(9-10), 396405 http://dx.doi.org/10.1179/146580109X12540995045723
13 Kong, I., Tshai, K. Y., & Hoque, M. E. (2015). Manufacturing of natural fibre-reinforced polymer composites by solvent casting method. In M. S. Salit, M. Jawaid, N. K., Yusoff, & M. E., Hoque (Eds.), Manufacturing of natural fibre reinforced polymer
composites (pp. 331-349). Switzerland: Springer International Publishing http://dx.doi.org/10.1007/978-3-319-07944-8_16
14 . Ljungberg, N., Cavaillé, J.-Y., & Heux, L. (2006). Nanocomposites of isotactic polypropylene reinforced with rod-like cellulose whiskers. Polymer, 47(18), 6285-6292 http://dx.doi.org/10.1016/j. polymer.2006.07.013
15 Shamsuri, A. A. (2015). Compression moulding technique for manufacturing biocomposite products. International Journal of Applied Science and Technology, 5(3), 23-26. Retrieved in 2023, April 17, from https://www.ijastnet.com/journals/ Vol_5_No_3_June_2015/3.pdf
16 Zampaloni, M., Pourboghrat, F., Yankovich, S. A., Rodgers, B. N., Moore, J., Drzal, L. T., Mohanty, A. K., & Misra, M. (2007). Kenaf natural fiber reinforced polypropylene composites: A discussion on manufacturing problems and solutions. Composites. Part A, Applied Science and Manufacturing, 38(6), 1569-1580 http://dx.doi.org/10.1016/j.compositesa.2007.01.001
17 Wu, Y., Xia, C., Cai, L., Shi, S. Q., & Cheng, J. (2018). Waterresistant hemp fiber-reinforced composites: in-situ surface protection by polyethylene film. Industrial Crops and Products, 112, 210-216 http://dx.doi.org/10.1016/j.indcrop.2017.12.014
18. Fengel, D., & Wegener, G. (Eds.) (2011). Wood: chemistry, ultrastructure, reactions Germany: Walter de Gruyter
19 Sahin, H. T., & Arslan, M. B. (2008). A study on physical and chemical properties of cellulose paper immersed in various solvent mixtures. International Journal of Molecular Sciences, 9(1), 78-88. http://dx.doi.org/10.3390/ijms9010078. PMid:19325721.
20 Cordeiro, L., Prado, A. P. G. A., & Curvelo, A. A. S. (2022). Ductile composite films of polyethylene and low grammage paper. Industrial Crops and Products, 184, 115039 http:// dx.doi.org/10.1016/j.indcrop.2022.115039.
21 Singleton, A. C. N., Baillie, C. A., Beaumont, P. W. R., & Peijs, T. (2003). On the mechanical properties, deformation and fracture of a natural fibre/recycled polyemer composites. Composites. Part B, Engineering, 34(6), 519-526 http://dx.doi. org/10.1016/S1359-8368(03)00042-8
22 Fotouh, A., Wolodko, J. D., & Lipsett, M. G. (2014). Fatigue of natural fiber thermoplastic composites. Composites. Part B, Engineering, 62, 175-182 http://dx.doi.org/10.1016/j. compositesb.2014.02.023.
23 Beaumont, P. W. R. (2003). Fatigue. In B. Harris (Ed.), Composites: science and technology of the fatigue response of fiber-reinforced plastics (pp. 365-412). UK: Woodhead Publishing
Received: Apr. 17, 2023
Revised: Jul. 06, 2023
Accepted: Jul. 15,2023
Polímeros, 33(2), e20230023, 2023 7/7
Airbrushing of carbon nanotubes on glass fibers for electromagnetic shielding epoxy composites
Willian Rodrigo Schuster1 , Sérgio Henrique Pezzin1* and Fernando Humel Lafratta1
1Centro de Ciências Tecnológicas, Universidade do Estado de Santa Catarina – UDESC, Joinville, SC, Brasil
*sergio.pezzin@udesc.br
Obstract
Tricomponent epoxy-matrix nanocomposites were prepared by airbrushing multiwalled carbon nanotubes (MWCNT) on glass fiber fabric (GF), aiming to establish a scalable route to produce electromagnetic interference (EMI) materials. The MWCNT deposition on GF by airbrushing was evaluated by scanning electron microscopy (SEM), showing a very reasonable dispersion even at high MWCNT concentrations. Electrical conductivity measurements have shown a maximum of 1.2x10⁻³ S/cm for GF with 3.4 wt% MWCNT. Electromagnetic shielding response for GF airbrushed with MWCNT and epoxy-matrix nanocomposites were analyzed considering reflection, absorption and transmission mechanisms and have shown an increasing trend as the MWCNT content increases, reaching the best result of 7.6 dB of shielding effectiveness (SE) in X-band spectra for the composite with 3.4 wt% MWCNT. The results showed that the airbrushing process can be a promising and easy route for manufacturing of MWCNT/GF/epoxy nanocomposites.
Keywords: nanocomposites, epoxy, airbrushing, carbon nanotubes, EMI materials.
How to cite: Schuster, W. R., Pezzin, S. H., & Lafratta, F. H. (2023). Airbrushing of carbon nanotubes on glass fibers for electromagnetic shielding epoxy composites. Polímeros: Ciência e Tecnologia, 33(2), e20230024. https://doi. org/10.1590/0104-1428.20230001.
1. Introduction
Electromagnetic waves have been intensively used along the years, due to innovations such as mobiles phones, antennas for data transmission and receiving, and security systems in aircraft and automobiles, amongst others. Therefore, there is a high level of microwave pollution causing interference in electronic equipment, leading to a rush for searching new materials with the capacity of attenuating the electromagnetic interference (EMI) caused by this pollution[1,2].
EMI shielding is evaluated in terms of reflectance (R), absorbance (A), and transmittance (T) of the material, which refer to the fractions of the incident wave reflected, absorbed, and transmitted, respectively. The shielding efficiency (SE) in terms of T, R and A, can be calculated by Equation 1[3]:
If the effect of multiple reflection between both interfaces of the material is negligible, the relative intensity of the effectively incident EM wave inside the materials after reflection is based on the quantity as 1-R. Therefore, the effective absorbance (Aeff) can be described as Aeff=(1-R-T)/ (1-R) with respect to the power of the effectively incident EM wave inside the shielding material[7]
In nanocomposites containing carbon nanotubes (CNT), the absorption mechanism involves the interactions between electrons in CNT and the incident wave, thus converting the wave energy into heat. The reflection process occurs when the incident wave returns from the surface of the material by the difference of impedance (Z) between the surface and the air[4,5]. Impedance is a barrier that electromagnetic waves find to penetrate the material, and it is related to the electrical conductivity (σ), frequency (w), and magnetic permeability (µ) as shown in Equation 2[6]
Comparing the effective absorbance (Aeff), i.e. the ratio between the absorbed (A) and the reflected fractions (1R), as shown in Equation 3, is possible to find the overall shielding mechanism: if Aeff fraction is higher than reflection fraction, it suggest an absorptive shielding mechanism, and if Aeff fraction is smaller than reflection fraction, it suggest an reflective shielding mechanism.
The major goal in EMI shielding is to increase the attenuation, finding the most adequate combination of some parameters such as thickness, concentration of CNT and manufacturing techniques. The effect of CNT conductive networks, including individual carbon nanotubes and clusters, have been recently reported[8-10]. These studies showed that
https://doi.org/10.1590/0104-1428.20230001 O O O O O O O O O O O O O O O Polímeros, 33(2), e20230001, 2023 ISSN 1678-5169 (Online) 1/9
1 RA R SE SElogSElog TRT = = = (1)
111 10log; 10; 10
( ) 1 2 Zj ωµ σ =+ (2)
1 eff A A R = (3)
CNT/CNT-cluster networks are highly efficient for improving electrical conductivity and microwave shielding[8], and that dense MWCNT percolated networks are required for SE enhancement[9]. Decreasing the size of CNT clusters, the EMI SE of silicon rubber/CNT composites enhanced, due to the increase of interfacial contact area[10]. The use of CNT in nanocomposites with epoxy, other resins and glass fibers (GF) for EMI shielding has been reported by several authors[5,11-21]. In one of the first works on this type of EMI material, Park et al.[5] reported that epoxy resin/GF composites containing up to 5 wt% CNT have reached 20 dB (99% of effectiveness) in 300 MHz – 1 GHz, with the highest value of electrical permittivity obtained for composites with 3% and 5 wt% CNT. Polystyrene composites were evaluated as well, showing 23.5 dB (99.5% of effectiveness) with 7.98x10⁻³ S/cm of electrical conductivity[11]. More recently, tire rubber nanocomposites with 5 wt% CNT achieved shielding effectiveness (SE) of 66.9 dB (>99.99% of attenuation), with 109.5 S/m of electrical conductivity[12], while oxidized multi-walled carbon nanotubes/waterborne polyurethane composites reached 23 dB at 5% CNT and 66.5 dB at 50% CNT[13], all in the X-band frequency range (8–12.5 GHz).
Other studies also proposed the surface modification of glass fiber fabrics with nanoparticles, such as CNT[14-19], Fe 3O 4 [18,19], and graphene[22], aiming to enhance the electromagnetic shielding effectiveness of epoxy-matrix composites. Some techniques to disperse CNT in epoxy resin/GF composites include sonication with solvent and then deposition by hand lay-up, immersion, conventional painting with paintbrush, or growth of CNT on GF surface[5,13-21], but there are some problems such as waste of raw materials, thickness control and industrial scalability. Da Silva et al.[15] showed that resin transfer molded (RTM) epoxy composites reinforced with plain weave GF fabric coated with 2 wt% CNT by roll painting reached 18.3 dB (98.54% of attenuation) in the X-band. Epoxy composites with CNT functionalized with nitric acid have been reported by Phan and coworkers[16], with 6.6 dB in X-band and electrical conductivity of 5.7x10⁻³ S/cm. Recently, epoxy composites reinforced with nanocarbon-coated glass fibers (NCGF), prepared by a pyrolysis deposition technology, have been proposed for as functional composite materials (FCM) with superior electrical/thermal conductivity and electromagnetic shielding performance[17]. The electrical conductivity of the FCM containing 20 wt.% NCGF reached 6.68 x 10⁻⁶ S/m, while the electromagnetic shielding properties exceeded 20 dB. Yesmin & Chalivendra[18] investigated the effect of CNT, micro-carbon fibers, and Fe3O4 nanoparticles, deposited by paintbrushing on GF fabric, on electromagnetic shielding effectiveness of epoxy-matrix composites in the X-band frequency range and found that the nanoparticles had a major influence on the total shielding effectiveness as well as on the absorption. Airbrushing could thus be an efficient method for CNT deposition on GF to achieve a thin layer with high CNT concentration, since it is an easily controllable process and requires few devices to perform the deposition.
In view of the CNT’s potential for EMI shielding, this work aims to evaluate a route for deposition of CNT on GF as thin layers using airbrushing method, looking for a route to impregnate a higher CNT content in polymer composites
and study the influence of this process in EMI shielding properties in the 8.2 – 12.4 GHz frequency range.
2. Materials and Methods
2.1 Materials
The nanocomposites were manufactured using Araldite® LY 1316 epoxy resin (epoxy value = 6.5 eq kg–1) based on diglycidyl ether of bisphenol A (DGEBA), Aradur® HY 951 hardener and Byk®-A 535 degassing agent, all supplied by Huntsman; acetone PA (Merck); Multiwalled carbon nanotubes (MWCNT) from Chengdu Organic Chemicals (outer diameter: 10-30 nm, length: 10-30 µm, purity: 90%) and GF plain weave fabric with an aerial weight of of 300 g/ m2 supplied by Abcol Brazil Composites Ltda.
2.2 Dispersion and deposition of the MWCNT on GF surface
For deposition of CNT on GF fabric, a formulation containing 50 g of acetone, 0.5% of MWCNT, 6% of epoxy resin and 0.8% hardener (weight percentages relative to acetone), was developed using a tip sonicator (Sonics VCX-750) for 30 minutes and 40% amplitude to disperse CNTs. The mixture was deposited on GF using a commercial airbrush (with a 5 mm nozzle) at a pressure of 4 bar, and then dried at 60 °C in an air-circulating oven for 2 hours. The amounts of MWCNT deposited on the GF surface were fixed in 0.05, 0.10, 0.15 and 0.20 g, meaning final concentrations of 1.3, 2.2, 2.7 and 3.4% of MWCNT, relative to the weight of the GF fabric. To achieve the correct weight of MWCNT, after the drying process the coated GF fabric was weighted, and the airbrushing process repeated until reaching the desired mass.
2.3 Preparation of tricomponent composites
MWCNT/GF/epoxy composites were manufactured by casting in silicone soft molds, using epoxy resin and the GF previously coated with MWCNT. Figure 1 shows a flowchart of the experimental procedure.
Hardener (13% wt) was added to epoxy resin (25 g for each batch) under mechanical stirring for 10 minutes, followed by the addition of the degassing agent under mechanical stirring and vacuum for 30 minutes to remove air bubbles. The resin was poured into soft molds (120 x 80 x 3mm) containing the coated GF and cured at room temperature. The final composition of the composites had (10.25 ± 0.56) wt% of GF, corresponding to ca. 5% v/v, and MWCNT content varying from 0.16 (for GF coated with 1.3%) to 0.64 wt% (for GF coated with 3.4%). Pictures of MWCNT-coated GF and MWCNT/GF/Epoxy composites are shown in Figure 2
2.4 Characterization
Scanning electron microscopy (SEM) analyses, to evaluate the dispersion of MWCNT after deposition onto GF, were performed in a JEOL JSM 6701F microscope at 15kV. The electrical conductivity of the systems was measured by 4-point probe method using a Keithley 6517A electrometer. EMI shielding measurements were carried out over the
Polímeros, 33(2), e20230001, 2023 2/9
Schuster, W.R., Pezzin, S.H., & Lafratta, F.H.
Airbrushing of carbon nanotubes on glass fibers for electromagnetic shielding epoxy composites
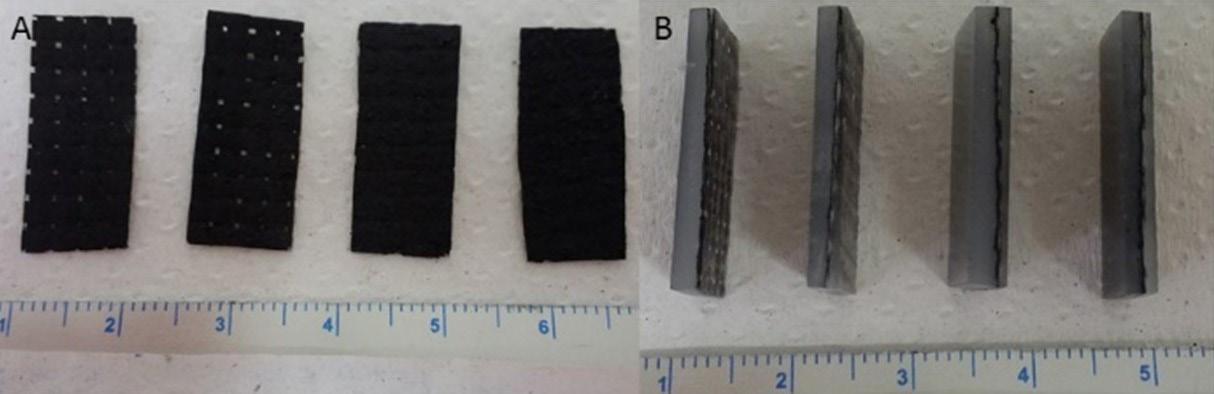
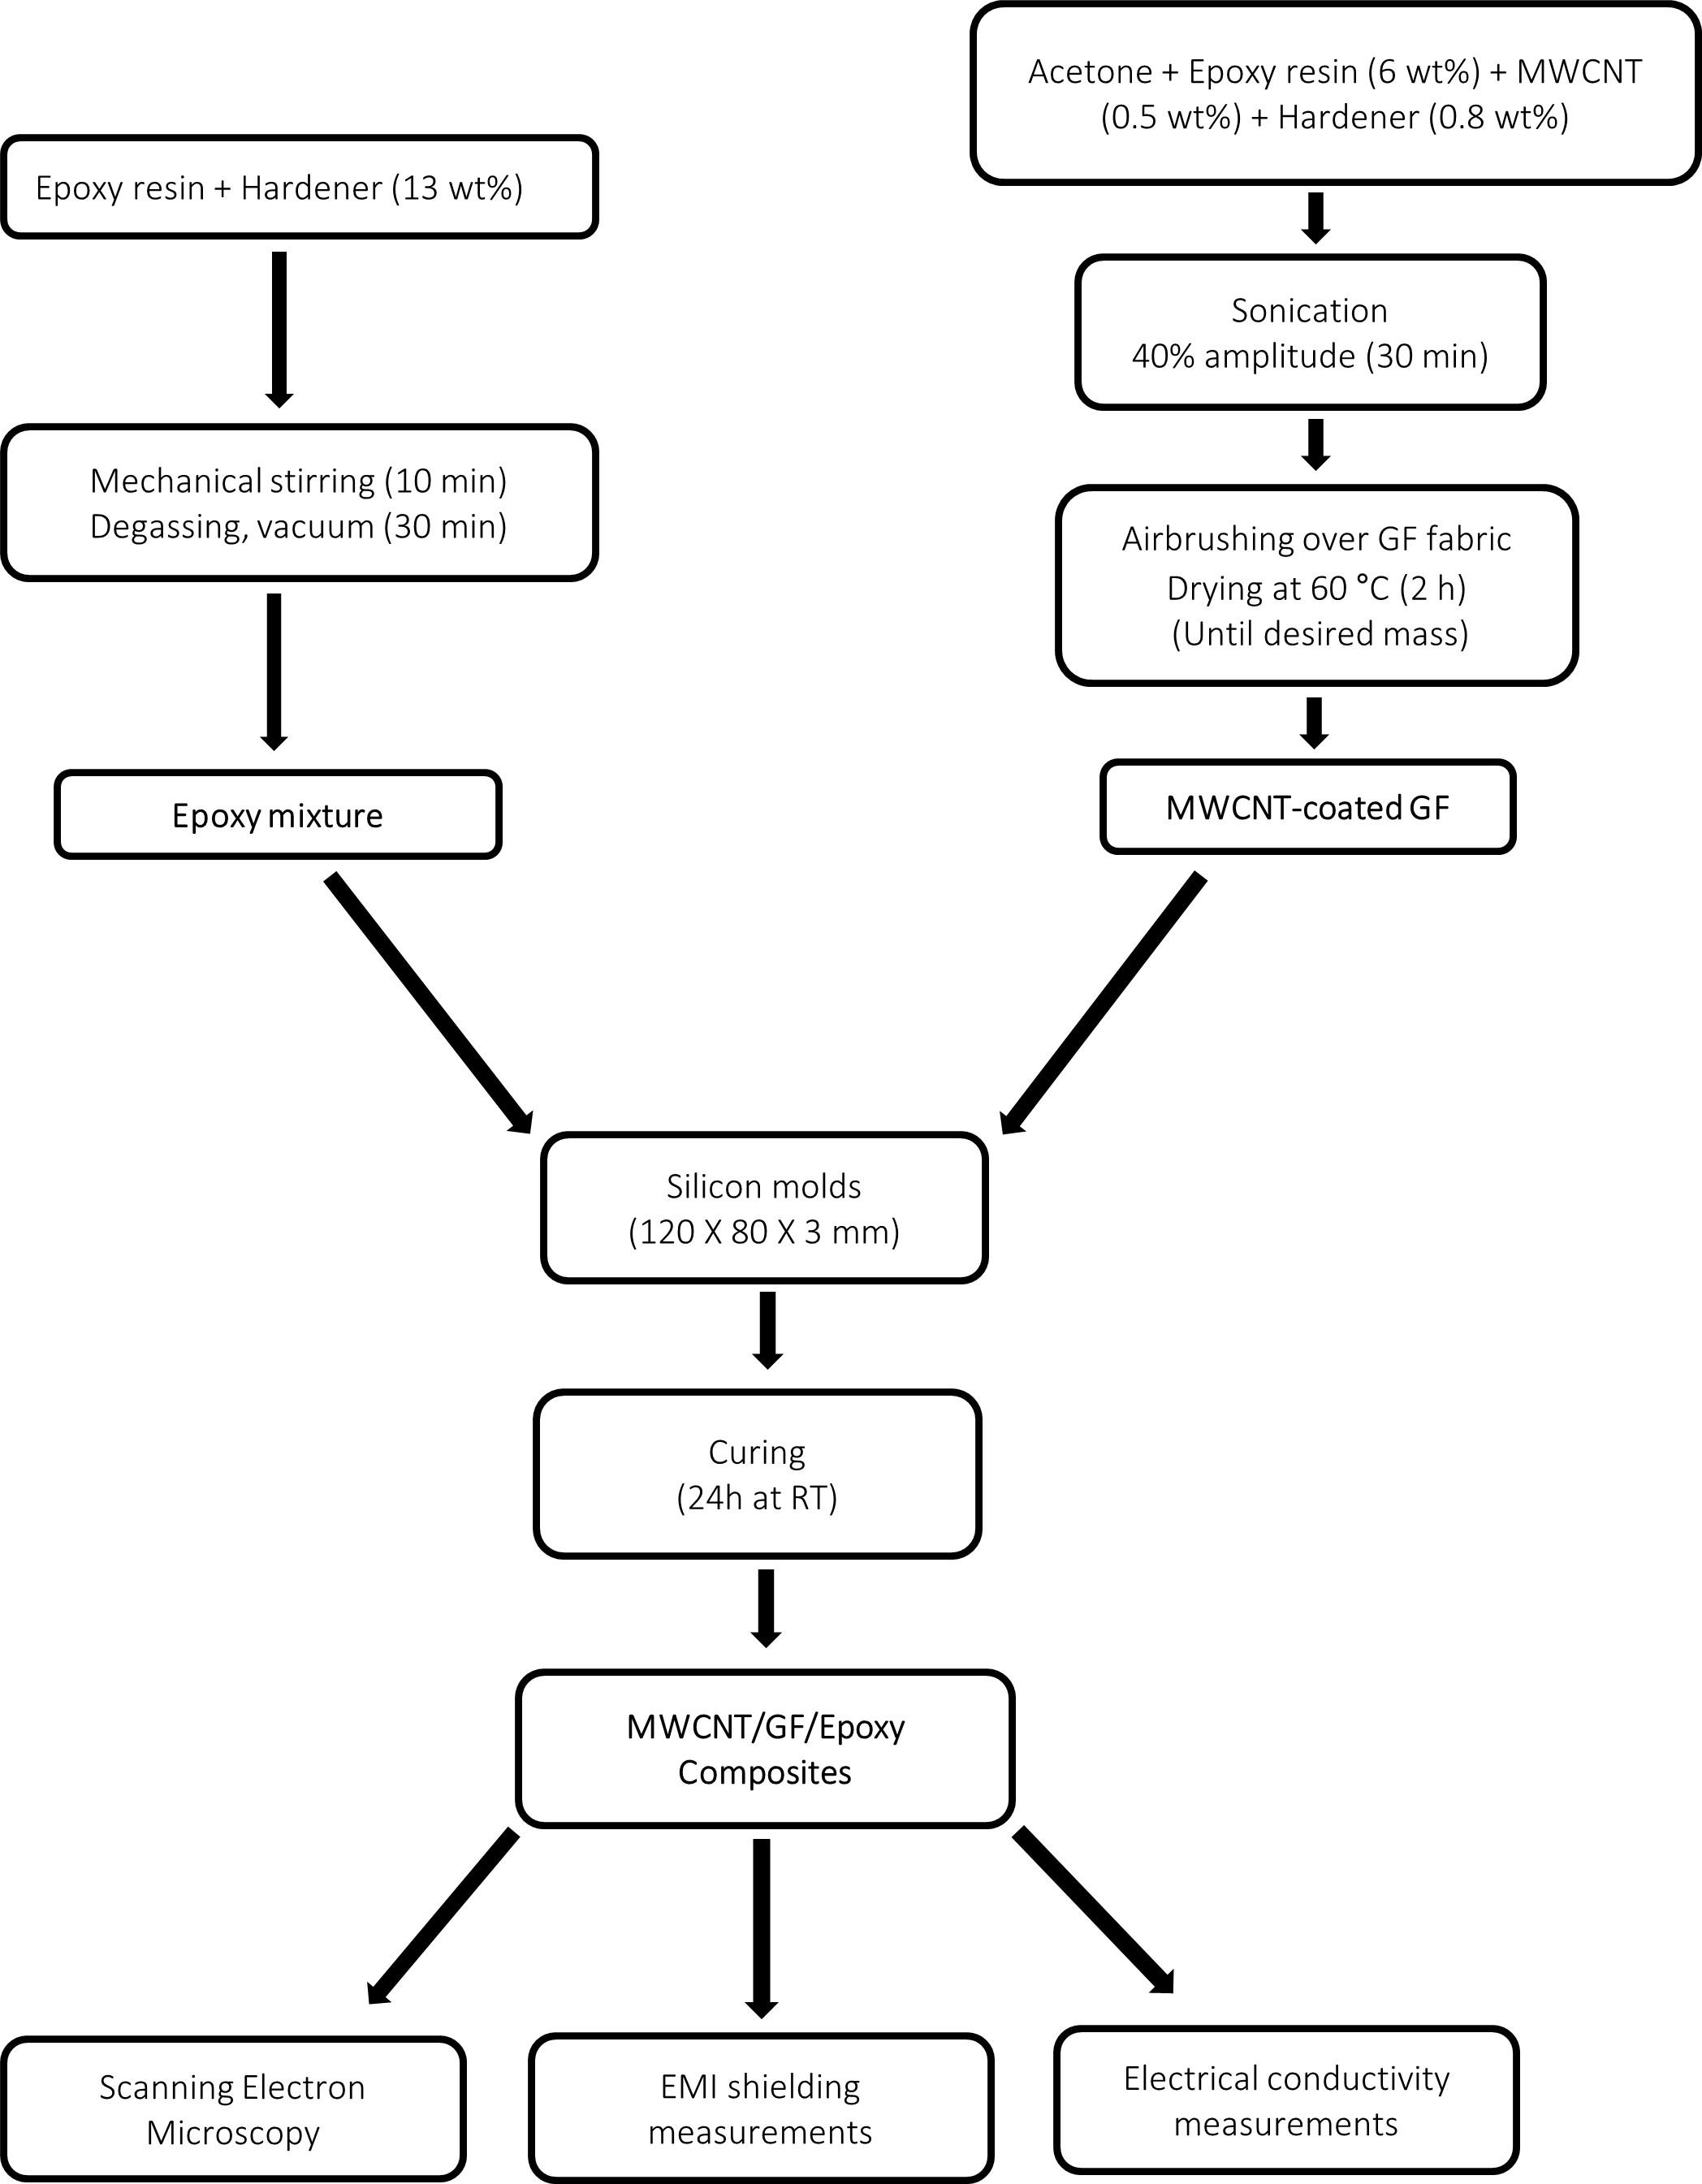
Polímeros, 33(2), e20230001, 2023 3/9
Figure 1. Flowchart of the experimental procedure for the preparation of MWCNT/GF/epoxy composites.
Figure 2. Photographic images of A) MWCNT-coated GF; B) MWCNT/GF/Epoxy composites.
X-band (8.2 – 12.4 GHz). The coated GF and tricomponent nanocomposite samples under test were sandwiched between two X-band waveguide sections which were connected to separate ports of an Agilent Vector Network Analyzer 11644A. S11 (reflection) and S21 (transmission) parameters were obtained from the measurements, where the numbers indicate the port from which the wave exits and the port were the wave enters, respectively. SE effectiveness were calculated using the Equation 1. Pictures of the equipment and sample holder are shown in Figure 3.
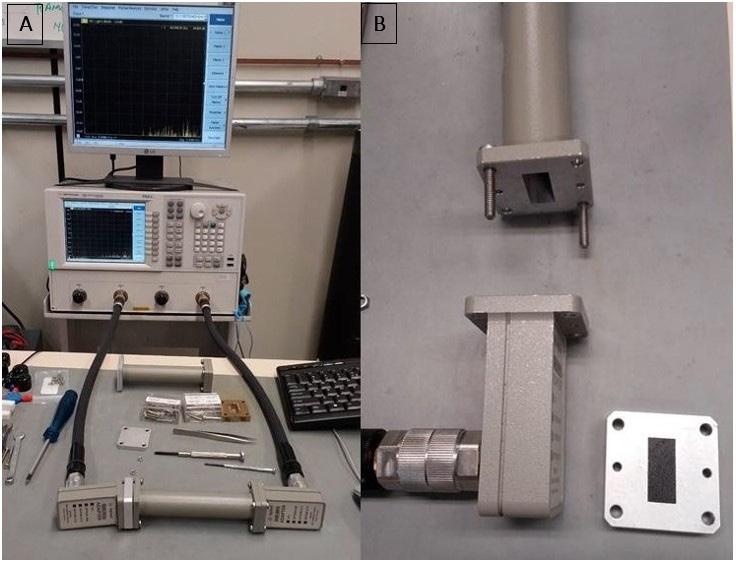
3. Results and Discussions
3.1 Morphological analysis
The surface and fracture surface morphologies were assessed by SEM observation of MWCNT-coated GF. The micrographs in Figure 4 shows a GF fabric surface coated with a thin layer of MWCNT. There are some uncovered
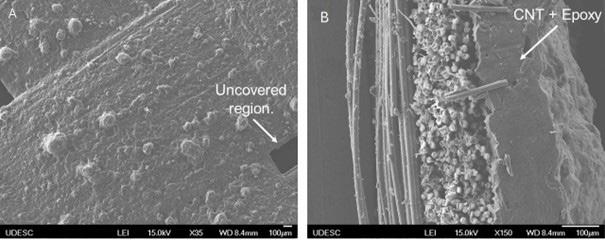
regions on GF, caused by the space between the GF yarns. These regions were covered as the amount of CNT increased. This MWCNT/epoxy layer, which remained onto GF after acetone evaporation, can be better visualized in Fig. 4(b), showing an elevated coverage that is crucial to improve EMI shielding. Zooming in the SEM images of airbrushed surfaces (Figure 5), it can be noted that there are some regions with agglomerated MWCNT, Fig. 2(a), and others where the MWCNT are fairly well dispersed, Fig. 5(b) All nanocomposites presented this behavior. This indicates that conditions used to disperse MWCNT in acetone were, in general, good enough to promote an adequate dispersion of the nanoparticles[23] over the GF fabric.
When in comparison with some other methods reported in the literature, as growth of CNT on GF surface[11] and impregnation by paint brush[24], the airbrushing method can be considered an easy way to impregnate CNT on GF in high concentration and could be a scalable alternative for fabric
Polímeros, 33(2), e20230001, 2023 4/9
Schuster, W.R., Pezzin, S.H., & Lafratta, F.H.
Figure 3. Pictures of A) Vector Network Analyzer for SE measurements; B) Sample holder.
Figure 4. SEM images of GF coated with MWCNT by airbrushing: (a) surface; (b) fracture surface.
Airbrushing of carbon nanotubes on glass fibers for electromagnetic shielding epoxy composites
nanocomposites, since there is no need of complex equipment usage for deposition, as in situ growth of CNT onto the fibers. In addition, the aspersion method can achieve deeper layers on the GF fabric due to the atomization of the formulation containing CNT, which is not possible using a paint brush.
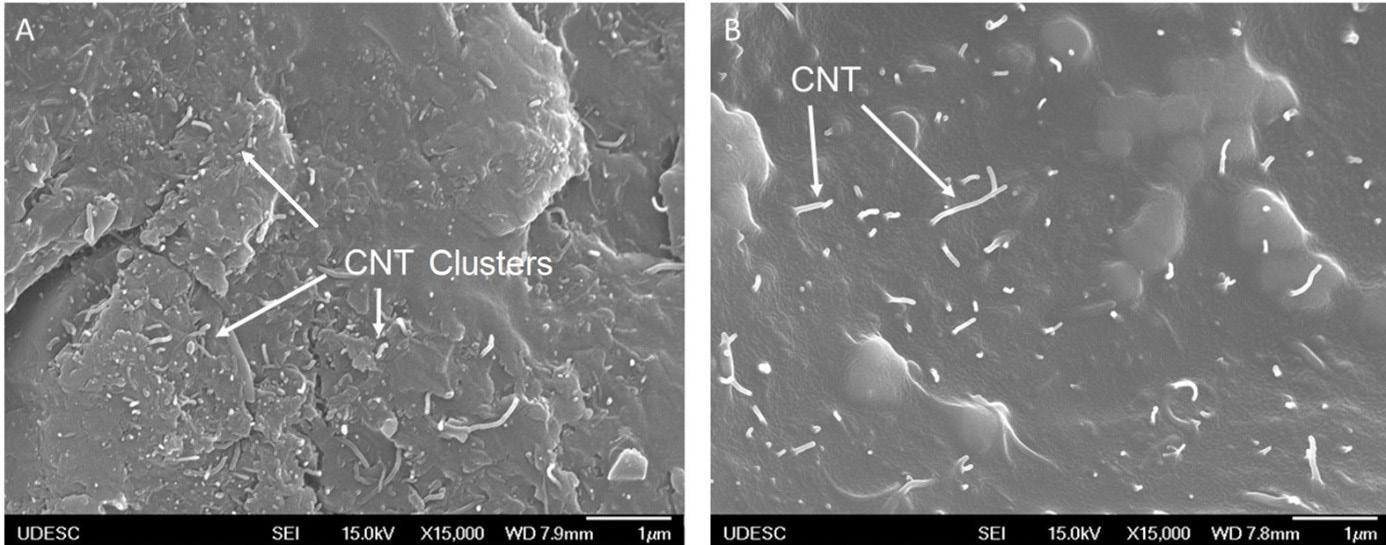
3.2 Electrical conductivity
Table 1 shows the electrical conductivities of MWCNT/ GF/epoxy nanocomposites measured by 4-point probe method. The conductivity values of 6.7x10⁻⁶ and 1.2x10⁻³ S/cm for the samples with 2.7% and 3.4% of deposited MWCNT, respectively, evidence the formation of a conductive path (percolation) network for higher MWCNT concentrations.
Electrical conduction is supposed to take place by electron hopping/tunnelling across the energy barrier gaps between conducting CNT in a epoxy matrix[26]. EMI shielding is improved when electrical conductivity is higher, as it increases the barrier between air and the material surface, raising the impedance difference and thus preventing the wave penetration across the material[11,12,16,27].
3.3 EMI shielding analysis of GF coated with MWCNT
EMI shielding values were measured in terms of reflectance, absorbance, and transmittance of electromagnetic waves (EW) through the nanocomposites. Table 2 summarizes the results obtained for GF coated with varied MWCNT content for an X-band range. The reflectance and absorbance increase with the MWCNT content, since the electromagnetic waves come into contact with more conductive particles and are reflected, and there are more active centers to interact with EW penetrating the material[28]. On the other hand, the transmittance decreases with the amount of MWCNT since the reflections and absorbance increase, remaining a smaller fraction of the electromagnetic wave to be transmitted.
The effective absorbance (Aeff) calculated using Equation 3, at 10.5 GHz, increases more markedly with the MWCNT content, which means that there are more active centers to absorb a lower amount of incident EW, when considering the reflectance values, as shown in Table 3. The same behavior is observed for the other frequencies. A comparison between %R and Aeff measurements suggests that the overall mechanism is absorptive for GF coated with 1.3% MWCNT, and reflective for the other compositions.
The shielding effectiveness (SE) can be written as a sum of attenuation by reflectance and absorbance of the EW, as shown in Figure 6. Shielding effectiveness is increased with the MWCNT concentration, and the best result was for 3.4% MWCNT, achieving an attenuation of 73.5% of the incident EW, which means a SE of 5.8 dB. The low SE of the nanocomposite with 1.3% MWCNT can be related to the low amount of nanotubes and voids in the GF surface coverage, which can be noted in Figure 4(a). This means that incident EW pass through the sample, since there are no barriers due to impedance differences between the air and these regions. As the amount of deposited MWCNT increases, the volume of void regions decreases, and the EMI shielding becomes more effective. Increasing the amount of MWCNT is equivalent to introduce more free electron charges that may arise from a percolated CNT-network, which ends up increasing the reflection.
3.4 EMI shielding analysis for tricomponent composites
Table 4 shows the EMI shielding characterization of the neat epoxy resin. The analysis showed that epoxy resin has a reflectance under 35%, due to the impedance mismatch with the air. The absorption is below 6% due to its insulating characteristic where there are no active centers to interact with EW, leading to the transmission of more than 60% of the incident EW.
EMI shielding analysis for tricomponent composites (Table 5) showed that the addition of epoxy resin around the GF considerably increases %R, since there is one more barrier against the penetration of EW into the material due to the impedance mismatch. As shown in Table 4, epoxy resin reflects more than 30% of the incident EW,
Polímeros, 33(2), e20230001, 2023 5/9
Figure 5. SEM images of GF coated with MWCNT by airbrushing: (a) CNT clusters and (b) dispersed CNT regions after deposition process.
% MWCNT Electrical conductivity (S/cm) 0 (neat epoxy)* ~10-7* 1.3 8.5x10⁻⁷ 2.2 3.2x10⁻⁶ 2.7 6.7x10⁻⁶ 3.4 1.2x10⁻³ * Ref. [25]
Table 1. Electrical conductivities of MWCNT/GF/epoxy nanocomposites.
consequently increasing %R on tricomponent nanocomposites. The attenuation by absorbance for the composites decreased due to the increase of %R in comparison with GF coated with MWCNT.
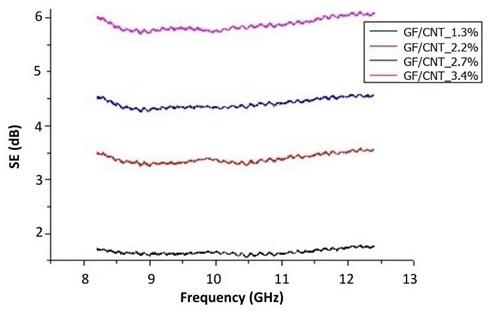
On the other hand, the effective absorbance (Table 6) was increased, since there is a smaller fraction of the incident EW that penetrates the composite, reaching 45% of effective absorbance at 10.5 GHz for the nanocomposite with 3.4% MWCNT. A comparison between %R and Aeff suggests that the overall shielding mechanism is reflective for all nanocomposites.
Shielding effectiveness was increased in MWCNT/ GF/epoxy nanocomposites due to addition of epoxy resin (Figure 7). The best results were obtained for nanocomposites containing 3.4% MWCNT, with the attenuation of 83% of incident EW, which means 7.6 dB of EMI shielding effectiveness.
The variations observed in SE with the frequency can be explained by two factors: wave-current interaction and microstructure defects. When an incident wave packet hits the surface of the material, some waves will be reflected by the interaction with conductive particles and impedance mismatch. These reflected waves can interfere with incident
waves at the same spot, causing fluctuations in EMI shielding effectiveness. Presence of defects in microstructure as microcracks and pores within epoxy nanocomposites may also affect the EMI shielding effectiveness, causing multiple reflections[29]. Other variations in absorption can be explained by differences in the local concentrations of MWCNT onto the surface of GF fabric, due to the manual process of deposition, causing different absorption levels.
Another relevant factor is the electrical conductivity values, as high conductivities magnify the differences between impedances and consequently increases the barrier against the penetration of electromagnetic waves. Only the highest value obtained in this work, 1.2x10⁻³ S/cm for the sample containing 3.4% MWCNT, is at the level considered reasonable for EMI shielding applications[11,12,17]. This indicates that it is necessary to improve MWCNT concentration and/or its dispersion in order to reach a higher electrical conductivity.
The contribution of multiple reflections for the SE (SEM) is also a factor to be considered since our SE values are below 10 dB. However, at GHz frequencies the skin depth (δ) for relatively good conductors (as is the case for the composites with 3.4% MWCNT, with conductivities in the order of 10-1 S/m) is considerably low and ������ approaches to zero, indicating multiple reflection loss can be ignored for 2-4 mm thickness samples [27,30]
An additional factor to be considered is the thickness of the MWCNT/epoxy layer deposited onto the GF fabric (ca. 100 μm). Arjmand et al.[27], for example, observed that the
Polímeros, 33(2), e20230001, 2023 6/9
Schuster, W.R., Pezzin, S.H., & Lafratta, F.H.
Frequency (GHz) 1.3% MWCNT 2.2% MWCNT 2.7% MWCNT 3.4% MWCNT % R % A % T % R % A % T % R % A % T % R % A % T 8.5 15.3 16.1 68.6 33.2 20.5 46.3 44.2 19.3 36.5 54.3 19.5 26.2 9.5 15.0 16.4 68.6 32.0 21.4 46.6 43.3 19.9 36.8 51.7 22.0 26.3 10.5 14.2 16.2 69.6 31.6 21.4 47.0 42.0 21.2 38.8 50.4 23.4 26.2 11.5 14.3 17.8 67.9 31.9 22.9 45.2 42.0 22.5 35.5 50.2 24.4 25.4
Table 2. Reflectance (%R), Absorbance (%A) and Transmittance (%T) percentage values from shielding measurements of GF coated with MWCNT.
MWCNT (%) %R %A Aeff (%) %T 1.3 14.2 16.2 18.9 69.6 2.2 31.6 21.4 31.3 47.0 2.7 42.0 21.2 36.5 38.8 3.4 50.4 23.4 47.2 26.2
Table 3. Reflectance (%R), absorbance (%A), effective absorbance (Aeff) and transmittance (%T) measured at 10.5 GHz for GF coated with MWCNT.
Frequency (GHz) %R %A %T 8.5 34.4 5.3 60.3 9.5 32.8 4.6 62.6 10.5 31.2 4.6 64.2 11.5 30.8 4.8 64.4
Table 4. Reflectance (%R), Absorbance (%A) and Transmittance (%T) percentage values from shielding measurements of neat epoxy resin.
Figure 6. Shielding effectiveness (SE) of GF coated with MWCNT.
Airbrushing of carbon nanotubes on glass fibers for electromagnetic shielding epoxy composites
Table 5. Reflectance (%R), Absorbance (%A) and Transmittance (%T) percentage values from shielding measurements of MWCNT/ GF/epoxy nanocomposites.
Table
Reflectance (%R), absorbance (%A), effective absorbance (Aeff) and transmittance (%T) measured at 10.5 GHz for MWCNT/
increase in thickness improves the SE since it is possible to have more interconnected CNT. Moreover, this leads to a possibility to have more active centers in the way of the incident wave, improving the SE[26-29]. Higher MWCNT coating thickness would thus be important to achieve better EMI performance.
Finally, factors such as nanocomposite manufacturing techniques, dispersion techniques and nanoparticle type can lead to different SE values, demanding studies to find the best combination of these factors to improve the effectiveness of EMI shielding.
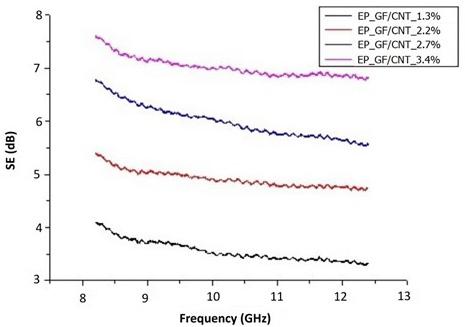
4. Conclusions
The results show that the airbrushing method has proved to be a promising option as a route to deposit carbon nanotubes on glass fiber fabrics, to obtain thin and light composites. Evaluations of reflectance, absorbance and effective absorbance showed a reflective value higher than effective absorbance, suggesting that the reflection mechanism was dominant in MWCNT/GF/epoxy composites. EMI shielding
measurements indicated that the thin tricomponent material can be potentially used as shielding for electromagnetic waves, achieving 83% of electromagnetic wave attenuation for composites with 3.4 wt% MWCNT.
5. Author’s Contribution
• Conceptualization – Willian Rodrigo Schuster; Sérgio Henrique Pezzin; Fernando Humel Lafratta.
• Data curation – NA.
• Formal analysis – Willian Rodrigo Schuster.
• Funding acquisition – Sérgio Henrique Pezzin; Fernando Humel Lafratta.
• Investigation – Willian Rodrigo Schuster; Fernando Humel Lafratta.
• Methodology – Willian Rodrigo Schuster; Fernando Humel Lafratta.
• Project administration – Fernando Humel Lafratta.
• Resources – Sérgio Henrique Pezzin; Fernando Humel Lafratta.
• Software – NA.
• Supervision – Sérgio Henrique Pezzin; Fernando Humel Lafratta.
• Validation – Willian Rodrigo Schuster; Fernando Humel Lafratta.
• Visualization – Willian Rodrigo Schuster; Fernando Humel Lafratta.
• Writing – original draft – Willian Rodrigo Schuster.
• Writing – review & editing – Sérgio Henrique Pezzin; Fernando Humel Lafratta.
6. Acknowledgements
The authors are grateful to Fundação de Amparo à Pesquisa do Estado de Santa Catarina (FAPESC) for financial support (2017TR867), Coordenacão de
Polímeros, 33(2), e20230001, 2023 7/9
Figure 7. Shielding effectiveness (SE) of MWCNT/GF/epoxy nanocomposites.
Frequency (GHz) 1.3% MWCNT 2.2% MWCNT 2.7% MWCNT 3.4% MWCNT %R %A %T %R %A %T %R %A %T %R %A %T 8.5 48.8 10.4 40.8 55.2 14.4 30.4 64.2 13.6 22.2 67.3 14.3 18.4 9.5 47.3 9.8 42.9 52.8 15.6 31.6 62.7 13.0 24.3 65.6 14.7 19.7 10.5 44.7 13.0 42.3 51.4 15.8 32.8 60.1 14.0 25.9 62.7 16.9 20.4 11.5 44.0 10.2 45.8 51.7 14.9 33.4 58.9 14.3 26.8 62.4 17.0 20.6
MWCNT (%) R % A % Aeff % T % 1.1 44.7 13.0 23.5 42.3 2.2 51.4 15.8 32.5 32.8 2.7 60.1 14.0 35.1 25.9 3.4 62.7 16.9 45.3 20.4
6.
GF/epoxy nanocomposites.
Schuster, W.R., Pezzin, S.H., & Lafratta, F.H.
Aperfeiçoamento de Pessoal de Ensino Superior – Demanda Social (CAPES-DS) for the scholarship to Willian Rodrigo Schuster, and Instituto Tecnológico da Aeronáutica (ITA) for EMI shielding analyses.
7. References
1. Zhao, B., Zhao, C., Li, R., Hamidinejad, S. M., & Park, C. B. (2017). Flexible, ultrathin and high efficiency electromagnetic shielding properties of poly(vinylidene fluoride)/carbon composites films. ACS Applied Materials & Interfaces, 9(24), 20873-20884 http://dx.doi.org/10.1021/acsami.7b04935 PMid:28558470.
2 Song, W.-L., Guan, X.-T., Fan, L.-Z., Cao, W.-Q., Wang, C.-Y., Zhao, Q.-L., & Cao, M.-S. (2015). Magnetic and conductive graphene papers toward thin layers of effective electromagnetic shielding. Journal of Materials Chemistry. A, Materials for Energy and Sustainability, 3(5), 2097-2107 http://dx.doi. org/10.1039/C4TA05939E.
3 Gonzáles, M., Mokry, G., Nicolás, M., Baselga, J., & Pozuelo, J. (2016). Chapter 11 - Carbon Nanotubes Composites as Electromagnetic Shielding Materials in GHz Range. In: M. R. Berber & I. H. Hafez (Eds.), Carbon Nanotubes – current progress of their polymer composites Croatia: Intech Open
4 Tong, X. C. (2009). Advanced materials and design for electromagnetic interference shielding Boca Raton: CRC Press
5 Park, K.-Y., Lee, S.-E., Kim, C.-G., & Han, J.-H. (2007). Application of MWCNT added glass fabric/epoxy composites to electromagnetic wave shielding enclosures. Composite Structures , 81 (3), 401-406 http://dx.doi.org/10.1016/j. compstruct.2006.08.029.
6 Lima, A. C. C. (2005). Fundamentos de telecomunicações: teoria eletromagnética e aplicações Salvador: P & A Editora e Gráfica LTDA
7 Hong, Y. K., Lee, C. Y., Jeong, C. K., Lee, D. E., Kim, K., & Joo, J. (2003). Method and apparatus to measure electromagnetic interference shielding efficiency and its shielding characteristics in broadband frequency ranges. The Review of Scientific Instruments, 74(2), 1098-1102 http:// dx.doi.org/10.1063/1.1532540
8 Tao, J.-R., Luo, C.-L., Huang, M.-L., Weng, Y.-X., & Wang, M. (2023). Construction of unique conductive networks in carbon nanotubes/polymer composites via poly(ε-caprolactone) inducing partial aggregation of carbon nanotubes for microwave shielding enhancement. Composites. Part A, Applied Science and Manufacturing, 164, 107304 http://dx.doi.org/10.1016/j. compositesa.2022.107304
9 Huang, M.-L., Shi, Y.-D., & Wang, M. (2023). A comparative study on nanoparticle network-dependent electrical conductivity, electromagnetic wave shielding effectiveness and rheological properties in multiwall carbon nanotubes filled polymer nanocomposites. Polymer Composites, 44(2), 1188-1200 http://dx.doi.org/10.1002/pc.27163
10. Yang, D., Tao, J.-R., Yang, Y., He, Q.-M., Weng, Y.-X., Fei, B., & Wang, M. (2022). Effect interfacial size and multiple interface on electromagnetic shielding of silicon rubber/ carbon nanotube composites with mixing segregated particles. Composite Structures, 292, 115668 http://dx.doi.org/10.1016/j. compstruct.2022.115668
11 Sachdev, V. K., Bhattacharya, S., Patel, K., Sharma, S. K., Mehra, N. C., & Tandon, R. P. (2014). Electrical and EMI shielding characterization of multiwalled carbon nanotube/ polystyrene composites. Journal of Applied Polymer Science, 131(24), 40201 http://dx.doi.org/10.1002/app.40201
12 Jia, L.-C., Li, Y.-K., & Yan, D.-X. (2017). Flexible and efficient electromagnetic interference shielding materials from ground
tire rubber. Carbon, 121, 267-273 http://dx.doi.org/10.1016/j. carbon.2017.05.100
13 Li, Y., Shang, Y., Li, M., Zhang, X., & He, J. (2022). High electromagnetic shielding effect of carbon nanotubes/ waterborne polyurethane composites prepared by “breakadsorption” method. Materials (Basel), 15(18), 6430. http:// dx.doi.org/10.3390/ma15186430 PMid:36143743.
14 Lee, O. H., Kim, S.-S., & Lim, Y.-S. (2011). Conduction noise absortion by fiberglass reinforced epoxy composites with carbon nanotubes. Journal of Magnetism and Magnetic Materials, 323(5), 587-591 http://dx.doi.org/10.1016/j.jmmm.2010.10.018
15. Silva, L. V., Pezzin, S. H., Rezende, M. C., & Amico, S. C. (2016). Glass fiber/carbon nanotubes/epoxy three-component composites as radar absorbing materials. Polymer Composites, 37(8), 2277-2284 http://dx.doi.org/10.1002/pc.23405
16 Phan, C. H., Jaafar, M., & Koh, Y. H. (2015). Mild functionalization of carbon nanotubes filled epoxy composites: effect on electromagnetic interference shielding effectiveness. Journal of Applied Polymer Science, 132(38), 42557 http://dx.doi. org/10.1002/app.42557
17 Gao, X., Yang, W., Cheng, L., Ding, Y., Zhan, J., & Tan, J. (2021). Epoxy resin composite containing nanocarbon-coated glass fiber and cloth for electromagnetic interference shielding. Journal of Materials Research and Technology, 13, 1759-1766 http://dx.doi.org/10.1016/j.jmrt.2021.05.062
18 Yesmin, N., & Chalivendra, V. (2021). Electromagnetic shielding effectiveness of glass fiber/epoxy laminated composites with multi-scale reinforcements. Journal of Composites Science, 5(8), 204 http://dx.doi.org/10.3390/jcs5080204
19 Gao, C., He, X., Ye, F., Wang, S., & Zhang, G. (2021). Electromagnetic wave absorption and mechanical properties of CNTs@GN@Fe3O4/PU multilayer composite foam. Materials (Basel), 14(23), 7244 http://dx.doi.org/10.3390/ma14237244 PMid:34885399.
20 Zhang, W., Deng, X., Sui, G., & Yang, X. (2019). Improving interfacial and mechanical properties of carbon nanotube-sized carbon fiber/epoxy composites. Carbon, 145, 629-639 http:// dx.doi.org/10.1016/j.carbon.2019.01.063.
21 Godara, A., Gorbatikh, L., Kalinka, G., Warrier, A., Rochez, O., Mezzo, L., Luizi, F., Van Vuure, A. W., Lomov, S. V., & Verpoest, I. (2010). Interfacial shear strength of a glass fiber/ epoxy bonding in composites modified with carbon nanotubes. Composites Science and Nanotechnology, 70(9), 1346-1352 http://dx.doi.org/10.1016/j.compscitech.2010.04.010
22 Kunrath, K., Kerche, E. F., Rezende, M. C., & Amico, S. C. (2019). Mechanical, electrical, and electromagnetic properties of hybrid graphene/glass fiber/epoxy composite. Polymers & Polymer Composites , 27 (5 ), 262 -267 . http://dx.doi. org/10.1177/0967391119828559
23 Hilding, J., Grulke, E. A., Zhang, Z. G., & Lockwood, L. (2003). Dispersion of carbon nanotubes in liquids. Journal of Dispersion Science and Technology, 24(1), 1-41 http://dx.doi. org/10.1081/DIS-120017941
24. Zhang, B., Asmatulu, R., Soltani, S. A., Le, L. N., & Kumar, S. S. A. (2014). Mechanical and thermal properties of hierarchical composites enhanced by pristine graphene and graphene oxide nanoinclusions. Journal of Applied Polymer Science, 131(19), 40826. http://dx.doi.org/10.1002/app.40826.
25 Hattenhauer, I., Tambosi, P. P., Duarte, C. A., Coelho, L. A. F., Ramos, A., & Pezzin, S. H. (2015). Impact of electric field application during curing on epoxy-carbon nanotube nanocomposite electrical conductivity. Journal of Inorganic and Organometallic Polymers and Materials, 25(4), 627-634 http://dx.doi.org/10.1007/s10904-014-0125-x
26 Ramos, A., Pezzin, S. H., Farias, H. D., Becker, D., Bello, R. H., & Coelho, L. A. F. (2016). Conductivity analysis of
Polímeros, 33(2), e20230001, 2023 8/9
Airbrushing of carbon nanotubes on glass fibers for electromagnetic shielding epoxy composites
epoxy/carbon nanotubes composites by dipole relaxation and hopping models. Physica B, Condensed Matter, 499, 57-63 http://dx.doi.org/10.1016/j.physb.2016.07.016
27. Arjmand, M., Mahmoodi, M., Gelves, G. A., Park, S., & Sundararaj, U. (2011). Electrical and electromagnetic interference shielding properties of flow induced oriented carbon nanotubes in polycarbonate. Carbon, 49(11), 3430-3440 http://dx.doi. org/10.1016/j.carbon.2011.04.039
28 Zhao, T., Hou, C., Zhang, H., Zhu, R., She, S., Wang, J., Li, T., Liu, Z., & Wei, B. (2014). Electromagnetic wave absorbing properties of amorphous carbon nanotubes. Scientific Reports, 4(1), 5619 http://dx.doi.org/10.1038/srep05619 PMid:25007783.
29 Xu, Z., & Hao, H. (2014). Electromagnetic interference shielding effectiveness of aluminum foams with different porosity. Journal of Alloys and Compounds, 617, 207-213 http://dx.doi.org/10.1016/j.jallcom.2014.07.188
30. Peng, M., & Qin, F. (2021). Clarification of basic concepts for electromagnetic interference shielding effectiveness. Journal of Applied Physics, 130(22), 225108 http://dx.doi. org/10.1063/5.0075019
Received: Jan. 19, 2023
Revised: Jun. 13, 2023
Accepted: Jul. 15, 2023
Polímeros, 33(2), e20230001, 2023 9/9
tainstruments.com Do DESENVOLVIMENTO ao PROCESSAMENTO ao PRODUTO FINAL DESCUBRA o conjunto de instrumentos que fornecem informações mais profundas sobre as PROPRIEDADES e ESTRUTURAS DO POLÍMERO a cada passo 2022 Polymer ad Port Fred 180x265.indd 1 7/20/23 11:44 AM
São Paulo 994 St. São Carlos, SP, Brazil, 13560-340 Phone: +55 16 3374-3949 Email: abpol@abpol.org.br 2021 2023