Volume XXXV - Issue II - July., 2025

Volume XXXV - Issue II - July., 2025

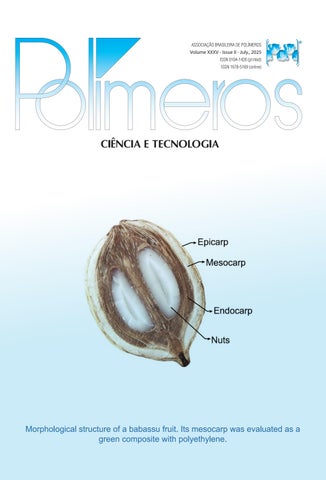
Morphological structure of a babassu fruit. Its mesocarp was evaluated as a green composite with polyethylene.
e d I tor I al C ou NCI l
Antonio Aprigio S. Curvelo (USP/IQSC) - President m ember S
Ailton S. Gomes (UFRJ/IMA), Rio de Janeiro, RJ (in memoriam)
Alain Dufresne (Grenoble INP/Pagora)
Artur José Monteiro Valente (UC/DQ)
Bluma G. Soares (UFRJ/IMA)
César Liberato Petzhold (UFRGS/IQ)
Cristina T. Andrade (UFRJ/IQ)
Edson R. Simielli (Simielli - Soluções em Polímeros)
Edvani Curti Muniz (UEM/DQI)
Elias Hage Jr. (UFSCar/DEMa)
José Alexandrino de Sousa (UFSCar/DEMa)
José António C. Gomes Covas (UMinho/IPC)
José Carlos C. S. Pinto (UFRJ/COPPE)
Júlio Harada (Harada Hajime Machado Consutoria Ltda)
Luiz Antonio Pessan (UFSCar/DEMa)
Luiz Henrique C. Mattoso (EMBRAPA)
Marcelo Silveira Rabello (UFCGU/AEMa)
Marco Aurelio De Paoli (UNICAMP/IQ)
Nikos Hadjikristidis (KAUST/ PSE)
Osvaldo N. Oliveira Jr. (USP/IFSC)
Paula Moldenaers (KU Leuven/CIT)
Raquel S. Mauler (UFRGS/IQ)
Regina Célia R. Nunes (UFRJ/IMA)
Richard G. Weiss Washington (GU/DeptChemistry) (in memoriam)
Roberto Pantani, (UNISA/DIIn)
Rodrigo Lambert Oréfice (UFMG/DEMET)
Sebastião V. Canevarolo Jr. (UFSCar/DEMa)
Silvio Manrich (UFSCar/DEMa)
Financial support:
Available online at: www.scielo.br

e d I tor I al C omm I ttee
Sebastião V. Canevarolo Jr. – Editor-in-Chief
a SS o CI ate e d I tor S
Alain Dufresne
Artur José Monteiro Valente
Bluma G. Soares
César Liberato Petzhold
José António C. Gomes Covas
José Carlos C. S. Pinto
Marcelo Silveira Rabello
Paula Moldenaers
Richard G. Weiss (in memoriam)
Roberto Pantani
Rodrigo Lambert Oréfice
d e S kto P P ubl IS h IN g www.editoracubo.com.br
“Polímeros” is a publication of the Associação Brasileira de Polímeros
São Paulo 994 St. São Carlos, SP, Brazil, 13560-340 Phone: +55 16 3374-3949
emails: abpol@abpol.org.br / revista@abpol.org.br http://www.abpol.org.br
Date of publication: September 2025
Polímeros / Associação Brasileira de Polímeros. vol. 1, nº 1 (1991) -.-
São Carlos: ABPol, 1991-
Quarterly
v. 35, nº 3 (September 2025)
ISSN 0104-1428
ISSN 1678-5169 (electronic version)
1. Polímeros. l. Associação Brasileira de Polímeros.

Website of the “Polímeros”: www.revistapolimeros.org.br
E E E E E E E E E E E E E E
o r I g IN al a rt IC le
Fabrication, characterization and mechanical behaviour of Tamarindus indica fruit fibre-reinforced polymer composites
Sreenivasaraja Nagarajan, Kathiresan Marimuthu, Prashanth Shanmugam and Moganapriya Chinnasamy e20250025
Quantification of elastomers in CR/NR/BR blends
Taynara Alves de Carvalho, Alexandra Helena de Barros, Rachel Farias Magalhães, Milton Faria Diniz, Lídia Mattos Silva Murakami, Jorge Carlos Narciso Dutra, Natália Beck Sanches and Rita de Cássia Lazzarini Dutra e20250026
Assessment of modified poly(ethylene terephthalate) films under anaerobic conditions
João Gabriel Machado de Avellar, Gisely Alves da Silva, Renan Rogério Oliveira de Souza, Mariana Alves Henrique, Jorge Vinicius Fernandes Lima Cavalcanti, Yeda Medeiros Bastos de Almeida, Maria de Los Angeles Perez Fernandez and Glória Maria Vinhas ....................................................................................................................................................................... e20250027
Gamma-irradiation effects on poly(ethylene-co-vinyl acetate) (EVA)
Maria Thalita Siqueira de Medeiros, Thaíses Lima, Patricia Araújo and Elmo Silvano de Araújo e20250028
Gold nanoparticles based on polysaccharide from Amburana cearensis for organic dyes degradation
Eziel Cardoso da Silva, Emanuel Airton de Oliveira Farias, Thais Danyelle Santos Araújo, Alyne Rodrigues Araújo, Geanderson Emilio de Almeida, Lívio César Cunha Nunes and Carla Eiras e20250029
Sustainable heterophasic ethylene-propylene copolymer composites with recycled aircraft graphite for antistatic packaging
Ágatha Missio da Silva, Erick Gabriel Ribeiro dos Anjos, Thaís Ferreira da Silva, Rieyssa Maria de Almeida Corrêa, Thiely Ferreira da Silva, Juliano Marini and Fabio Roberto Passador e20250030
Synthesis of well-defined polypeptide-based diblock copolymers
Thuy Thu Truong, Luan Thanh Nguyen, Tin Chanh Duc Doan, Le-Thu Thi Nguyen and Ha Tran Nguyen e20250031
Development of green composites based on bio-polyethylene and babassu mesocarp
Crisnam Kariny da Silva Veloso, Lucas Rafael Carneiro da Silva, Ruth Marlene Campomanes Santana, Tatianny Soares Alves and Renata Barbosa e20250032
Magnetic poly(glycidyl methacrylate-co-divinylbenzene) with amino groups for chromium VI removal
Washington José Fernandes Formiga, Henrique Almeida Cunha, Manoel Ribeiro da Silva, Ivana Lourenço de Mello Ferreira, Jacira Aparecida Castanharo and Marcos Antonio da Silva Costa e20250033
Crosslinking agent in the production of biodegradable whey-gelatin films
Carolina Antoniazzi, Jocelei Duarte, Wendel Paulo Silvestre and Camila Baldasso e20250034
Sustainable styrene-butadiene composites with sisal fiber and rubber waste from footwear Alexandre Oka Thomaz Cordeiro, Marcelo Eduardo da Silva and Cristiane Reis Martins
Sustainable recycling of butyl rubbers: an insight into the radiation processing
e20250035
Traian Zaharescu, Ademar Benévolo Lugao, Heloísa Augusto Zen, Radu Mirea and Dorel Buncianu e20250036
A new class of polymers has been used in patients for the first time. The compound is the first new drug solubilising agent in decades. Introduced in 2014 by chemist Matthias Barz from Leiden University, it offers a unique alternative to current options.
Getting your molecules into patients: that is the ultimate goal. Matthias Barz, chemist at LACDR, is extremely content with this milestone in his drug delivery journey. ‘When I started, people told me this would never work. Luckily, the company Lubrizol believes in these materials. And now, here we are. A phase 1 clinical trial has started.’
The polymers presented by Barz aren’t drugs themselves. They’re excipients: ‘helper substances’ that improve how a medicine works, for example by enhancing solubility or stability. While they don’t directly cause a therapeutic effect themselves, excipients can influence how well a patient tolerates a drug. The most commonly used ones are hardly or not at all biodegradable and remain in the body, leading to adverse effects over time.
The new class of polymers, called polypept(o)ids, are made from body-own building blocks, amino acids. Because the body recognises them as ‘self’, they are better tolerated and are broken down over time. This makes them less likely to trigger immune reactions even after multiple doses.
Polypept(o)ids combine two parts: polypeptides (similar to natural proteins) and polypeptoids (more stable and less likely to provoke the immune system). A key poylpeptoid is polysarcosine, a polymer that adds “stealth” and body suitability. The chemistry isn’t new, but Barz’s lab was the first to produce them in a pure and controlled way—making medical applications possible.
Barz found a way to turn short peptide chains into longer, functional polymers. These behave like polyethylene glycol (PEG), currently the most widely used polymer in biomedicine. ‘We wanted a polymer with PEG-like properties, but biodegradable into fragments, which are safe and familiar to our body,’ he explains.
Eventually, Kevin Sill and Bradford Sullivan patented a version of this polymer. They tested it across various drug types and found it worked well. The rights were later acquired by Lubrizol, a mid-sized pharmaceutical company. Lubrizol developed the product further, branded it as Apisolex®, and took the leap to bring the system to patients.
This is a rare achievement. Barz notes that no new excipient has been introduced in decades. ‘Pharmaceutical companies don’t like taking risks for very good reasons. The drug itself might already fail—so adding a new ingredient introduces more uncertainty. Most companies stick with what’s already used.’ But what’s already broadly used might have its downsides. It is known that PEG causes immune responses and can accumulate in liver and spleen.
But both Barz and Lubrizol believe polypept(o)ids are worth the risk. They are biodegradable and highly stable in water, which makes them ideal for liquid drug formulations or vaccines. ‘Many biodegradable materials degrade too quickly in aqueous solution,’ Barz says. ‘Ours stay stable.’
Besides Apisolex® from Lubrizol, other companies, like Curapath, make a broad range of polypept(o)ides commercially available for fundamental research and drug development, which enables now researchers around the world to explore the potential of the polymers introduced by the Barz lab.
‘People are hesitant, even when the science is solid’
Barz hopes the results of this first study in humans will be promising. In the long term, he believes regulatory agencies will demand that all injectable materials be either fully metabolised or fully excreted. That would give biodegradable excipients a big advantage.
Still, adoption will take time. ‘If you say we now have something better, you’re implying that older treatments, like the COVID vaccine, used something less ideal,’ Barz explains. ‘That makes pharmaceutical industry hesitant, even when the science is solid.’
He hopes this breakthrough will inspire young scientists. ‘Everyone said this wouldn’t work. But science should always strive for innovation. You need some luck and brave partners, but never stop trying remains a necessity.’
Source: Leiden University – universiteitleiden.nl
December
Fire Resistance in Plastics
Date: December 1-3, 2025
Location: Düsseldorf, Germany
Website: ami-events.com/event/5e2d20bb-0531-4947-9d805c827694a2cf/home?RefId=website
European Bioplastics Conference
Date: December 2-3, 2025
Location: Berlin, Germany (hybrid)
Website: european-bioplastics.org/events/ebc
Polymer Engineering for Energy
Date: December 2-3, 2025
Location: London, United Kingdom
Website: ami-events.com/event/d1969227-3d81-4adf-90332bdb782f9d71/summary?RefId=Website_AMI
Polyolefin Additives
Date: December 2-3, 2025
Location: Cologne, Germany
Website: ami-events.com/event/c4f01ff1-939e-4a06-aaac80dc63435792/summary?RefId=Website_AMI
2026
February
Polyethylene Films
Date: February 2-4, 2026
Location: Tampa, Florida, United States of America
Website: ami-events.com/event/c7892475-3923-495a-979580fd0384803a
Polymers in Hydrogen and CCUS Infrastructure
Date: February 10-11, 2026
Location: Vienna, Austria
Website: ami-events.com/event/024afd7e-7a6a-40b7-b4a893a6eb9b92f2
March
2nd Global Polymers and Materials Congress
Date: March 23-24, 2026
Location: Rome, Italy
Website: globalpolymersmaterialscongress.com
April
2nd International Conference on Advance Chemical and Material Science (ACMS-2026)
Date: April 12-14, 2026
Location: Kolkata, India (hybrid)
Website: ceie.org.in/acms2026
Inscitech Meet on Polymer Science and Composite Materials (IMPOLYMER2026)
Date: April 20-22, 2026
Location: Rome, Italy
Website: inscitechsummits.com/2026/polymer-science
May
Fire & Polymers 2026
Date: May 17-20, 2026
Location: San Diego, California, United States of America
Website: polyacs.org/2026fireandpolymers
Polymer Sourcing and Distribution
Date: May 19-21, 2026
Location: Hamburg, Germany
Website:ami-events.com/event/aa711e6d-2de5-4e11-82ba97fdd7d4e05b
41st International Conference of the Polymer Processing Society (PPS-41)
Date: May 31-June 4, 2026
Location: Salerno, Italy
Website: pps-41.org
June
Bordeaux Polymer Conference (BPC 2026)
Date: June 1-4, 2026
Location: Bordeaux, France
Website: bpc2026.u-bordeaux.fr/en
87th Prague Meeting on Macromolecules Smart Materials: Self-Organizing Polymers at the Interface of Technology and Nature (PMM 87 Smart Materials)
Date: June 21-25, 2026
Location: Prague, Czech Republic
Website: imc.cas.cz/sympo/87pmm
6th Global Conference on Polymers, Plastics & Composites (PPC-2026)
Date: June 24-25, 2026
Location: Barcelona, Spain (hybrid)
Website: polymers-plastics.org
Polymers 2026: Trends, Innovation and Future
Date: June 25-28, 2026
Location: Nanjing, China
Website: sciforum.net/event/polymers2026
Polymer Engineering and Sciences International (PESI 2026)
Date: June 28-July 2, 2026
Location: Kanazawa, Japan
Website: polymers-int.org
July
Polymers and Footwear Innovations
Date: July 22-23, 2026
Location: Portland, Oregon, United States of America Website: ami-events.com/event/749a47b2-12dd-4e1d-a1090febf35491e5
9th International Congress on Advanced Materials Sciences and Engineering 2026 (AMSE-2026)
Date: July 22-24, 2026
Location: Zagreb, Croatia
Website: istci.org/amse2026/index.asp
4th International Summit on Biopolymers and Polymer Science (ISBPS2026)
Date: July 23-25, 2026
Location: Prague, Czech Republic Website: polymerscience2026.spectrumconferences.com
51st IUPAC World Polymer Congress (MACRO 2026)
Date: July 28-31, 2026
Location: Sarawak, Malaysia
Website: macro2026.org
August
12th International Conference on Chemical and Polymer Engineering (ICCPE 2026)
Date: August 18-20, 2026
Location: London, United Kingdom Website: cpeconference.com
3rd Edition Global Summit on Polymer Science & Composite Materials
Date: August 24-25, 2026
Location: Paris, France
Website: globalpolysciencesummit.com
Global Summit on Sustainable Biopolymers and Polymer Applications (POLYMERS2026)
Date: August 26-27, 2026
Location: Venice, Italy Website: biopolymers.researchconnects.org
September
Bioplastics
Date: September 1-2, 2026
Location: Cleveland, Ohio, United States of America
Website: ami-events.com/event/a57ba0e7-de68-4cf6-b4c58c0955be8ef5
Annual Global Summit on Polymers and Composite Materials (AGSPOLYMERS2026)
Date: September 21-23, 2026
Location: Prague, Czech Republic
Website: vividglobalsummits.com/2026/composite-materials
October
5th International Conference on Polymer Science and Engineering
Date: October 7-9, 2026
Location: San Francisco, California, United States of America
Website: polymers.unitedscientificgroup.org
XIX Latin American Symposium on Polymers and XVII IberoAmerican Congress on Polymers - SLAP 2026
Date: October 19-23, 2026
Location: Salvador, Bahia, Brazil
Website: slap2026.com.br
Sreenivasaraja Nagarajan1* , Kathiresan Marimuthu2 , Prashanth Shanmugam1 and Moganapriya Chinnasamy3
1Department of Aeronautical Engineering, Excel Engineering College, Komarapalayam, Tamil Nadu, India
2Department of Mechanical Engineering, Excel Engineering College, Komarapalayam, Tamil Nadu, India
3School of Mechanical Engineering, Vellore Institute of Technology, Chennai, India
*sreeraja2010@gmail.com
Obstract
In this work, a study was undertaken to explore the possibility of using leftover tamarind fruit fibres as reinforcement in PLA and HDPE matrix. PLA and HDPE polymers form minimum 75% of the total polymers used in the composites. PLA and HDPE was mixed with natural fibres (5 wt.%, 10 wt.%, 15 wt.%, 20 wt.% and 25 wt.%,) individually and also as a hybrid filler to enhance its mechanical properties. Characterizations, mechanical behaviour and microscopic investigation were performed to understand the excellent mechanical properties and good chemical resistance of the prepared composites, which demonstrated potential suitability for semi-structural applications.
Keywords: polymer composites, Tamarindus indica fruit fibre, mechanical properties, sustainability, morphological analysis.
Data Availability: Research data is available upon request from the corresponding author.
How to cite: Nagarajan, S., Marimuthu, K., Shanmugam, P., & Chinnasamy, M. (2025). Fabrication, characterization and mechanical behaviour of Tamarindus indica fruit fibre-reinforced polymer composites. Polímeros: Ciência e Tecnologia, 35(3), e20250025. https://doi.org/10.1590/0104-1428.20240122
Growing global interest in the usage of environmentally friendly bio-waste materials-based polymer composites with the necessary mechanical properties that has been spurred by increased environmental consciousness[1]. Agro bio-waste fillers are a promising potential replacement for synthetic fibre polymer goods in environmental limits due to their wide availability and cost-effective processing[2] Natural fillers in a polymer matrix can offer substantial benefits over typical fillers used in composites, and their use is growing globally due to the influence of low cost, low density, renewable, biodegradable, desirable qualities, and environmental friendliness. Nagarjun et al.[3] showed the mechanical characteristics of PLA composites with tamarind and date seed Micro fillers. The composites were made using the compression moulding method. The seed filler reinforcement greatly enhanced the tensile strength of the PLA matrix, according to the tensile data. Both tamarind and palm particle reinforcements nearly increased the flexural and impact strength of PLA matrix. Stalin et al. [4] experimented the usage of tamarind seed filler (TSF) as reinforcement in vinyl ester composites. The composite plates have been fabricated by compression moulding machine with TSFs of varying wt% from 5 to 50 as reinforcement material, and their properties such as tensile, flexural, impact,
hardness, water absorption, heat deflection tests, and thermo gravimetric analysis are studied. On jute poly-lactic acid resin composite, Ramachandran et al.[5] performed different experiments such as Impact (IZOD and CHARPY tests), Differential Scanning Calorimeter test, Fourier Transform Infrared test, and Optical Imaging. The testing revealed that the results were comparable to synthetic composites such as polyester and epoxy. Mofokeng et al.[6] studied morphology, thermal and dynamic mechanical properties, and degradation patterns. SEM micrographs of the composites demonstrate more intimate contact and better interaction between the fibres and PLA than PP. The presence of hydrogen bonding interaction between PLA and the fibres was validated by Fourier-transform infrared (FTIR) spectroscopy data, which demonstrated the presence of enhanced interaction. The thermal stability of both polymers improved with increasing fibre content, with PP showing a more substantial improvement. Curcumin-loaded electro spun Poly (lactic acid) (PLA) composite membranes were created by Chen et al.[7] . Curcumin was loaded with varying concentrations of 1, 3, and 5 wt percent to investigate its anticoagulant properties as a drug-eluting stent. Fourier Transform Infrared (FTIR) spectroscopy was used to examine the structure of the composite membrane, and the results indicated that both
Nagarajan, S., Marimuthu, K., Shanmugam, P., & Chinnasamy, M.
PLA and curcumin were present in the composite membrane without any chemical reaction. In the recycling of polyethylene terephthalate, Aldas et al.[8] discovered certain biopolymers that were regarded as pollutants (PET). The results revealed that PET-PLA and PET-PHB miscibility is good. However, due to the high processing temperatures employed in PET recycling, PHB is damaged; in the meantime, PET and TPS are poorly miscible, which is reflected in the microstructure. Sachin et al.[9] developed a composite that can be utilised as a substitute for standard plywood in the automotive, airline, and railway industries for furniture, building infrastructure, and interior components. PLA and NWF were used to create a new bio composite, which was then tested for mechanical properties. Natural fibres can be employed as reinforcement in polymers made from renewable raw materials, according to Oksman et al.[10]. Flax fibres and polylactic acid were used as the materials (PLA). PLA is a lactic acid-based thermoplastic polymer that has primarily been utilised in biodegradable items such as plastic bags and planting cups, but it can also be used as a matrix material in composites in theory. Maheswari et al.[11] experimented with tamarind fibres recovered by the water retting technique from ripened fruits. The hand lay-up technique was used to construct composite samples using these fibres as reinforcement and unsaturated polyester as matrix. Jo et al.[12] investigated ABS-based automotive console boxes with better environmental friendliness using composites made of acrylonitrile-butadiene-styrene copolymer (ABS) and poly(lactic acid). Nuthong et al.[13] found that adding fillers or reinforcements to PLA improves its impact characteristics. The brittleness of PLA polymer necessitates the modification for more practical usage. Alternative reinforcements in PLA composites included bamboo fibre, vetiver grass fibre, and coconut fibre. Untreated and flexible epoxy-treated composites with varying reinforcing amounts were injection moulded. With increasing fibre content, the impact strength of natural fibre reinforced PLA composites dropped[13,14]. Natural fibre composites, as investigated by Siregar et al.[15] in the field of materials, have piqued many people’s interest due to their fundamental biodegradability property. As a result, unlike synthetic fibre, pineapple leaf fibre is not only biodegradable but also environmentally benign. Somashekhar et al.[16] investigated coconut shell powder, which has several advantages over other materials, including low cost, renewable, high specific strength to weight ratio, low density, low abrasion on machine, and environmental friendliness.
2.1 Matrix
The virgin PLA pellets and HDPE pellets were purchased from the local merchant Augment 3Di, Coimbatore District, Tamil Nadu State, India and Kings Polymer, Coimbatore District, Tamil Nadu State, India. As mentioned by the seller, PLA has the melt flow index of 10-30 g/10 min with density of 1.24 g/cm3 at 190 °C. 65, 120 and 180 °C are the glass transition, crystallization and melting point temperatures, respectively[3]. Both PLA and HDPE pellets were kept in a dry air oven before processing to remove the moisture. During injection moulding, both PLA and HDPE were melted at their melting point temperature. PLA is a
polyester manufactured from fermented corn, cassava, maize, sugarcane or sugar beet pulp. These renewable resources sugar is fermented and converted to lactic acid, which is subsequently converted to polylactic acid or PLA. HDPE is the most environmentally friendly of all plastics, emitting no toxic gases into the atmosphere.
The tamarind fruit fibre (TFF) of around 2.5 kg was collected from Salem District, Tamil Nadu State, India. The collected fibres were treated with water. After cleaning with water, the fibres were dried for 6 hrs in direct sunlight in order to remove the water content by means of evaporation. Moreover, the remaining moisture content is then removed by drying it in a hot air oven. The dry fibres were next processed into a powder form (25–60 m) in a local flour mill at 500 rpm for 1 hr. 450 gms of TFF powder were finally obtained after the grinding process.
Injection moulding is used to create various combinations of specimens (S1 to S18), as displayed in Table 1. The moulding process is carried out at Perumal Injection Moulding Company in Coimbatore District, Tamil Nadu State, India. The detailed process flow diagram of fabrication and testing of composites is shown in Figure 1. The machines hopper is filled with PLA pellets, HDPE pellets and TFF powder, as and when needed. Followed by material loading, the machine gets heated-up, melts and mixes the materials. The obtained paste is then injected into the die and specimen plates were created accordingly. A rectangular die with the dimensions of 147 cm × 98 cm × 4 cm is used in this study. A total of 18 plates were made, out of which pure PLA = 1, pure HDPE = 1, PLA + HDPE = 1, TFF powder + PLA = 5,
Fabrication, characterization and mechanical behaviour of Tamarindus indica fruit fibre-reinforced polymer composites

1. Overall process flowchart and obtained results.
Nagarajan, S., Marimuthu, K., Shanmugam, P., & Chinnasamy, M.
TFF + HDPE = 5, TFF + PLA + HDPE = 5. The different weight ratios for all the specimens are mentioned in Table 1
According to ASTM D 3039, tensile tests were performed on samples with dimensions 115 mm × 19 mm × 4 mm. The universal testing machine (UTM) with a load cell capacity of 100 kN was used for all the tests. During testing, the gauge length was set to 25 mm and the cross-head speed was kept at 5 mm/min. The displacement across the cross-head was measured using an external LVDT device. Five samples of each composition were examined and the average value was reported as the corresponding specimen’s tensile property.
The flexural characteristics of the test specimens were assessed using a three-point bending test. The test was carried out on samples with dimensions 115 mm × 12.7 mm × 4 mm, as specified by ASTM D 790. The support span was adjusted to 50 mm and the test was carried-out at a cross-head speed of 5 mm/min. Five samples were tested and the average flexural value was reported in all the cases.
The Charpy impact test was carried-out to determine the impact energy. The load is applied via an impact strike from a hefty pendulum hammer discharged from a fixed height location. The test material or specimen is placed at the bottom. The pendulum impacts the test piece and fractures it at the notch when it is released. The pendulum continues to swing lower than its original height. Simple calculations can be used to calculate the energy absorbed at the fracture. The technique can be used on both short and long fibre composites. The Charpy test is a defined method for determining how much energy a test material absorbs during a break. The test specimen is 4 mm thick as per ASTM D 4812. It is commonly used in industry since the results are inexpensive and rapid. The average value was calculated using five sample specimens for the Charpy test in all the conditions.
FESEM is a sophisticated microscope that provides higher magnification and the ability to view very tiny features at a lower voltage than conventional SEM. An instrument named CARL ZEISS (USA), model: sigma with Gemini column was used to observe the interaction between the TFF powder and the matrix (PLA and HDPE) with an accelerated voltage of 10 kV. The composite samples were coated with gold before the examination in order to avoid charging during the experiments. The sample portions were magnified as much as 3500 times during the examination.
FTIR testing is an analytical testing procedure that uses infrared radiation to identify organic and some inorganic chemicals (IR). It also identifies unfamiliar solid, liquid, or gaseous components. It mainly determines the presence of surface contamination on a material and, in some situations, quantify it. It is carried out in order to identify the chemical functional groups in the composite.
XRD analysis is used to detect the crystalline phases contained in a material and so reveal chemical composition information by studying the crystal structure. The phases are identified by comparing the obtained data to that in reference databases.
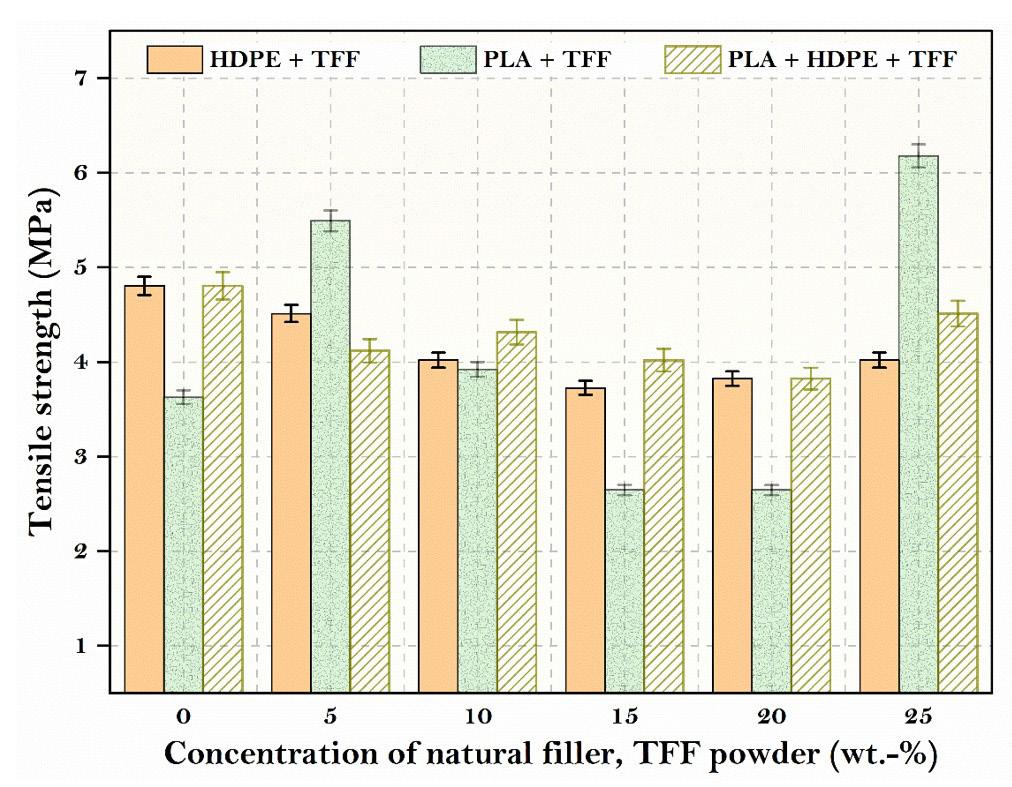
The addition of fillers (TFF powder) to the matrix has been demonstrated to improve the corresponding tensile characteristics (Figure 2). The tensile strength of the neat PLA matrix is improved by 2.55 MPa or 70.26 percent, when TFF powder was added. When the TFF powder concentration was 25 wt.-% with 75 wt.-% of PLA matrix polymer, the highest tensile property is achieved. Crack initiation and propagation at the inter-laminar area determines the strength of composites made with fillers in general. The addition of fillers reinforces the matrix material in this location, preventing crack start and allowing for excellent tensile strengths. The aggregation of fillers may have caused the tensile property to deteriorate. Overall, strong interfacial bonding has allowed stresses to flow from the matrix to the fibre, which increases the strength and stiffness.
PLA was discovered to have higher impact strength than composites containing TFF powder fillers (Figure 3). This could be explained by PLA’s brittle nature at room temperature. The reduced impact strength was owing to
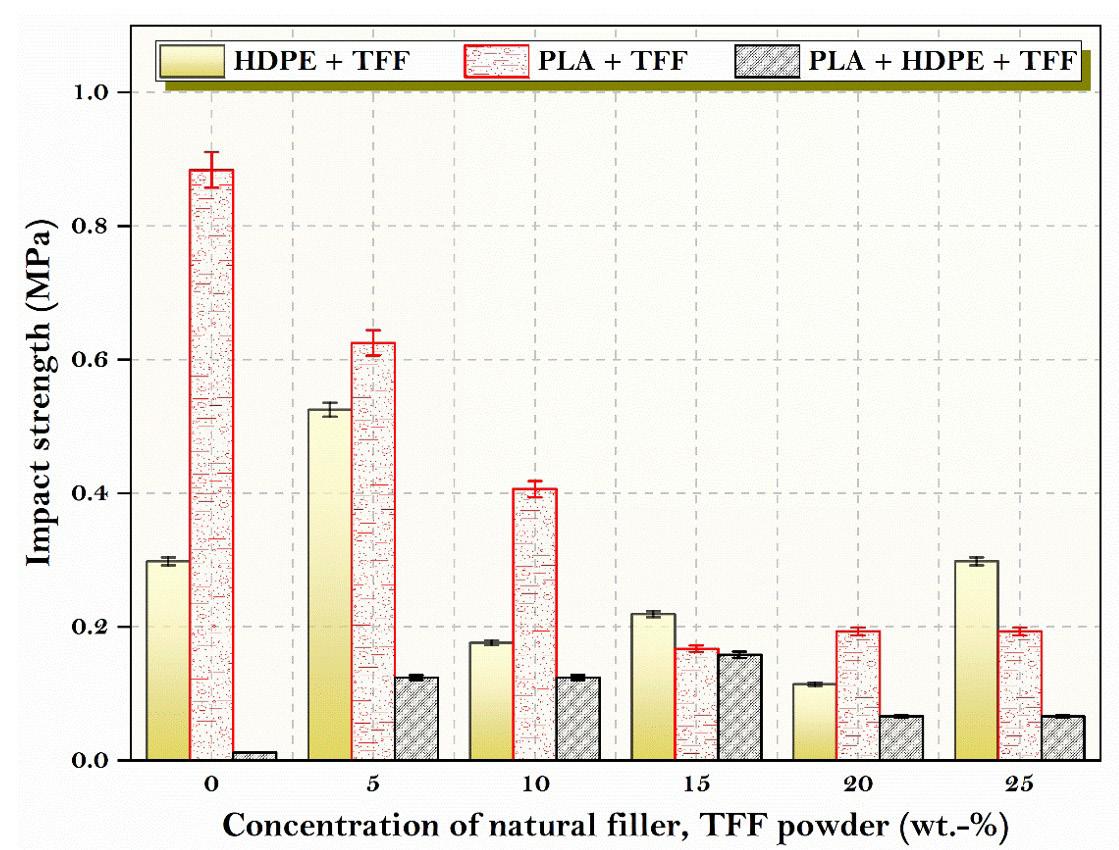
Fabrication, characterization and mechanical behaviour of Tamarindus indica fruit fibre-reinforced polymer composites
inadequate interfacial adhesion between the filler and the matrix, as well as the presence of larger voids, which caused specimens to break prematurely. The composites used in this investigation have 15 wt.-% TFF fillers and a PLA matrix. The impact strength of polymer was around 81 percent lower than that of plain PLA. The impact strength of HDPE + PLA composites was found to be lower than composites added with TFF, which could be due to HDPE + PLA’s ductile behaviour at room temperature. The composites with 15 wt.-% TFF fillers and an HDPE + PLA matrix polymer exhibit 31 percent better impact strength than the pure HDPE + PLA. Composites with 5 wt.-% TFF fillers and an HDPE matrix polymer displays 76 percent higher impact strength than pure HDPE.
3.3
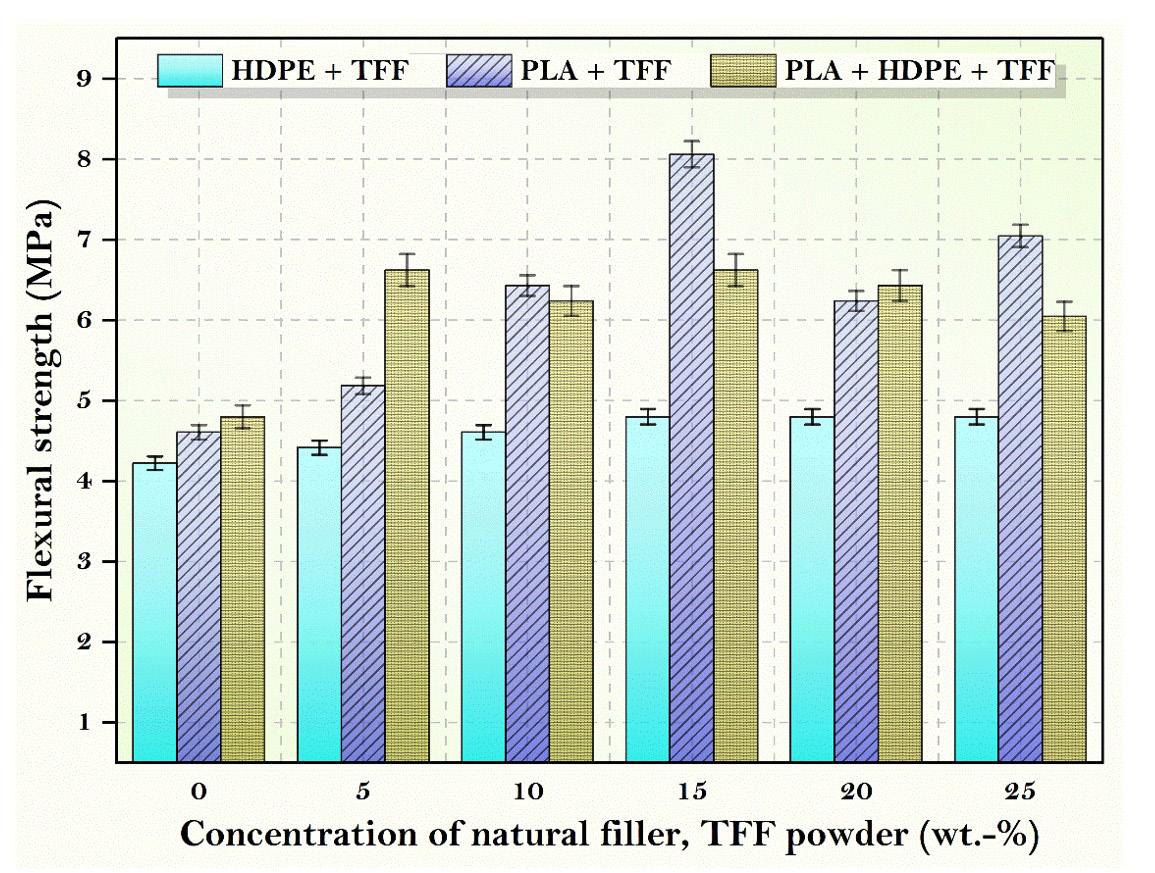
Figure 4 shows the influence on the addition of micro fillers to the clean matrix which results in improved flexural characteristics. Flexural strength of HDPE is 4.22 MPa, PLA is 4.61 MPa and PLA + HDPE is 4.8 MPa. TFF + PLA, TFF + HDPE and TFF + PLA + HDPE composites all about doubled the flexural strength of its corresponding neat matrix. The flexural strength of PLA with TFF filler is enhanced by 13.64 percent or 4.8 MPa. The PLA composite with TFF filler has a higher flexural property due to its good size, which fills the spaces in the composites and effectively resists force. With 15 wt.-% TFF filler concentration and 85 wt.-% PLA matrix polymer, the greatest flexural strength of 8.06 MPa is achieved, which is 75 percent higher than pure PLA. The increase in flexural strength illustrates the superior matrix-filler absorption property.
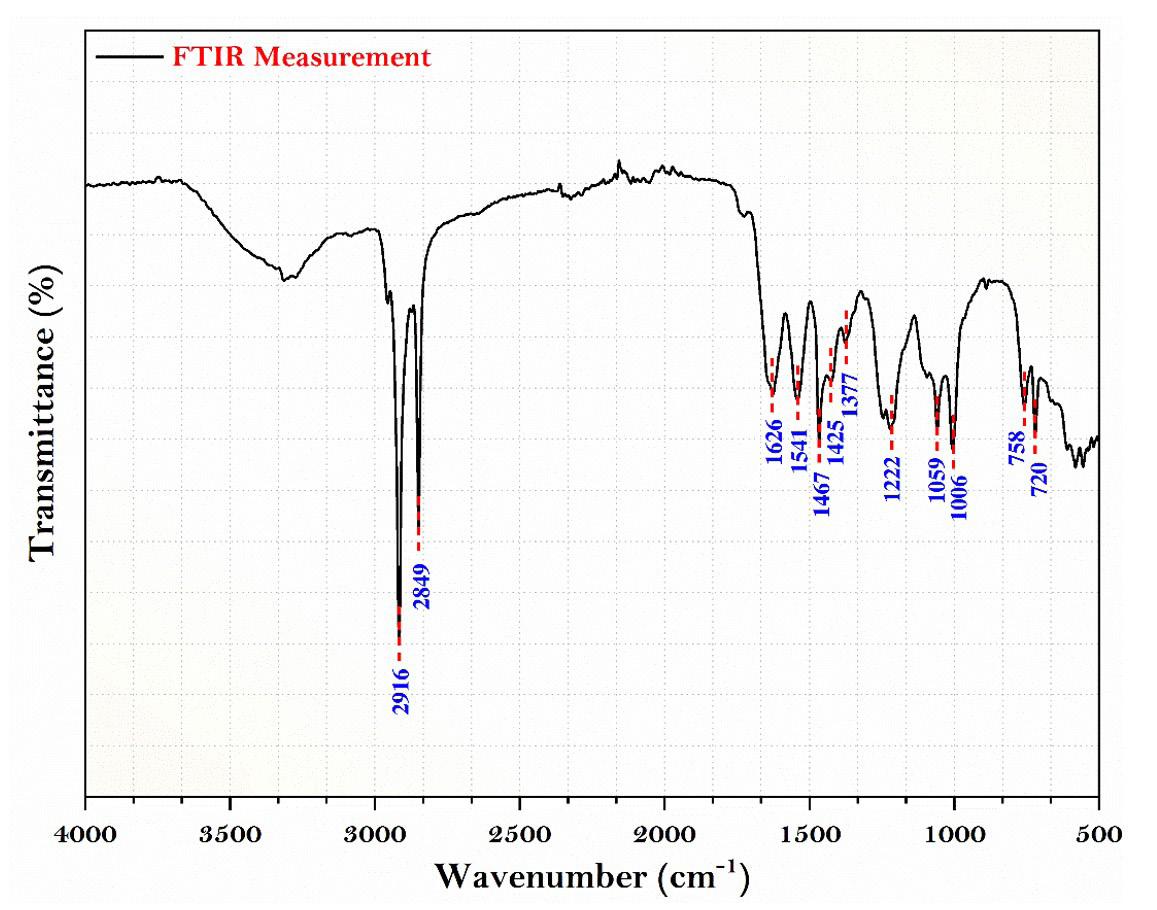
3.4 FTIR analysis
FTIR test is the straightforward method used to obtain an infrared spectrum of liquid, solid and gas absorption or emission. It can classify unidentified materials, determine sample quality and quantity the chemical component present in a mixture and so on. The stretches of different functional groups such as hydroxy isoxazole C4H3NO4 stretch, amide CO (Ninhydrin) stretch, polyetherimide (PEI) stretch are produced via the polycondensation reaction between bisphenol-A dianhydride such as tetracarboxylic dianhydride (produced from the reaction of bisphenol A and phthalic anhydride) and a diamine such as m-phenylene diamine and ethyl. The above composite result (Figure 5) is derived from the spectrum generated during an FTIR test and digitally cross-checked against established reference from libraries and databases to determine the type of substance.
3.5
Figure 6A-6F illustrates the surface of TFF + PLA with 15 wt.-% filler concentration, which has the best tensile strength. Increased wettability is due to strong adherence between the filler and the matrix. It is due to the reinforcement and matrix’s increased interfacial contact. In the TFF + PLA composite, the filler dispersion was consistent, which helped to improve the tensile properties. In contrast, increasing the filler content in HDPE + TFF causes the fillers to clump together and separate from the matrix. It generates a discontinuity between the matrix and the filler, which aids
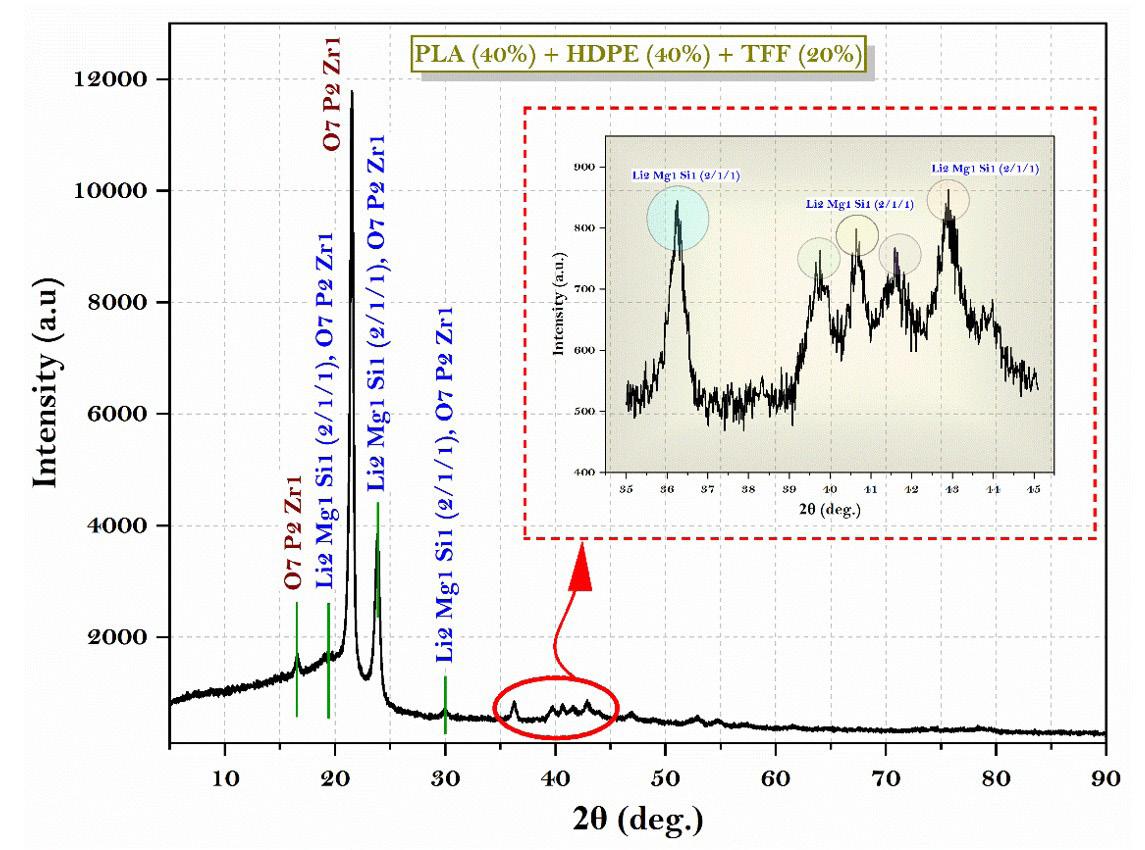
crack development and reduces the tensile performance. This is the main reason behind deteriorating the composite mechanical properties. Figure 7A and Figure 7B shows the chemical composition of TFF/PLA/HDPE. The elements spectrum of the TFF was obtained using a SEM with an EDAX instrument, Nano XFlash Detector model. The obtained peak demonstrates that carbon (85.82 percent) and oxygen (14.18 percent) make up the majority of the weight. The crystal structure of the PLA (40 wt.-%) + HDPE (40 wt.-%) + TFF (20 wt.-%) specimen was determined using XRD. The powdered particle is made up of several tiny and randomly oriented particles that are exposed to monochromatic X-ray radiation. Figure 8 depicts the appropriate XRD patterns of the specimen produced. The following peaks show the composites crystalline solid structure: 16.56°, 19.21°, 21.53°, 23.87°, 30.03°, 36.27°, 39.71°, 40.66°, 41.56°, 42.87°, 44.02°, 46.89°, 48.98°, 52.97°, 54.78, 57.31°, 61.64°, 74.36°, 78.46°, 36.27°, 39.71°, 40.66° and 41.00o. However, at 21.53°, the most intense peak of Li2 Mg1 Si1 can be seen, with a peak height of 10486.13 cts and a relative intensity of 100 percent. The discovered compounds Lithium Magnesium Silicide (2/1/1) (Li2 Mg1 Si1) with cubic crystal structure and Zirconium Diphosphate (O7 P2 Zr1) with orthorhombic crystal structure provide the crystal structure of PLA + HDPE + TFF composite.
Nagarajan, S., Marimuthu, K., Shanmugam, P., & Chinnasamy, M.
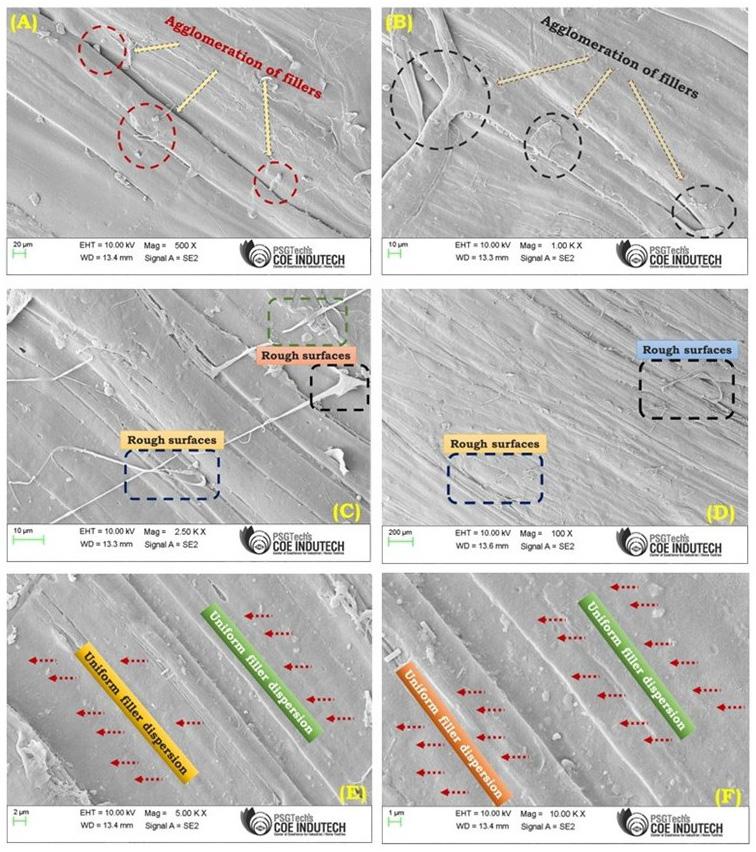
6. FESEM micrographs showing morphological features of the composite, highlighting agglomeration of fillers (A & B); rough surfaces (C & D); and uniform filler dispersion (E & F) at various magnifications.
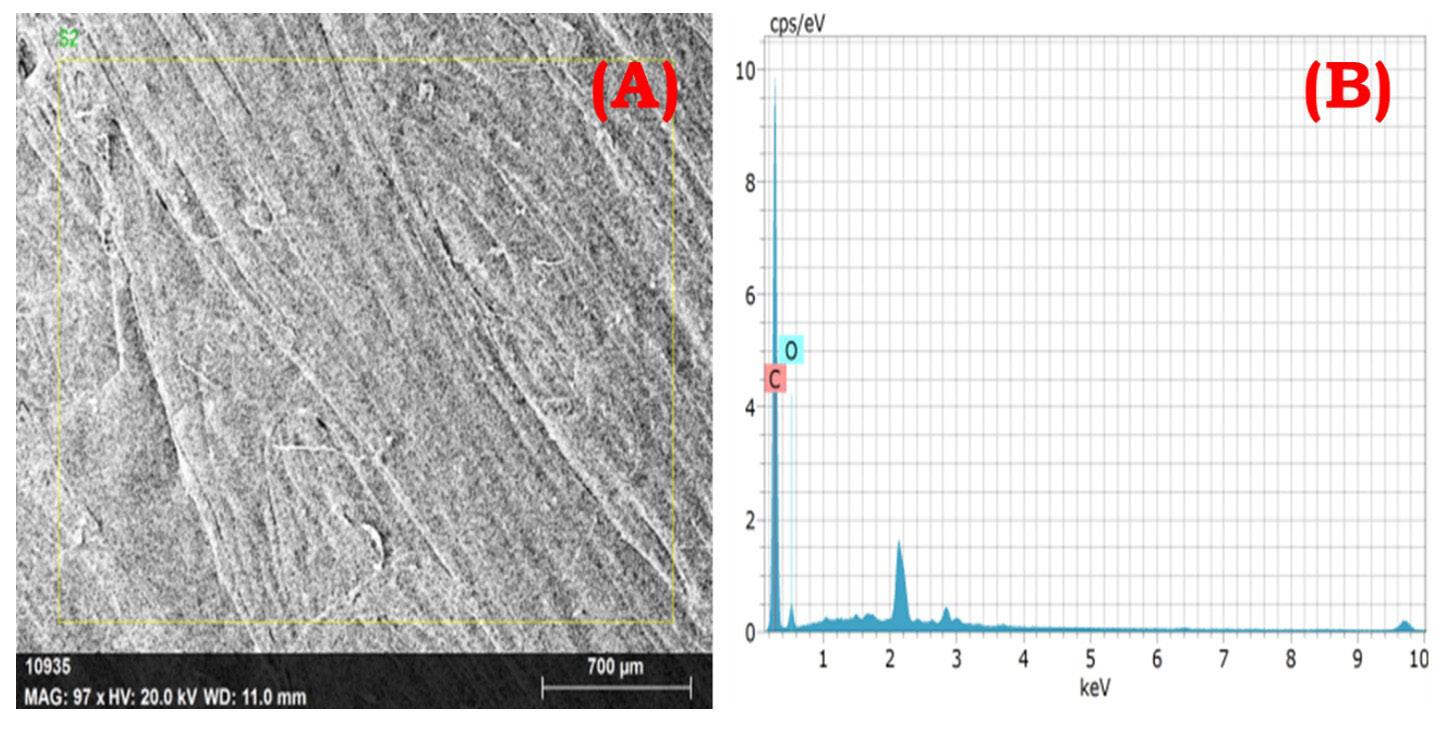
the surface morphology of the composite at low magnification; and (B) corresponding EDS spectrum
Fabrication, characterization and mechanical behaviour of Tamarindus indica fruit fibre-reinforced polymer composites
4. Conclusions
In this study, compression moulding was used to create the TFF/PLA, TFF/HDPE, and TFF/PLA/HDPE composites. The mechanical behaviour of the composites was studied as a function of the concentration of TFF filler. The experimental findings led to the following conclusions:
The tensile results revealed that the TFF filler reinforcement enhanced the tensile strength of the PLA matrix substantially. TFF/PLA attained a maximum tensile strength of 5.98 MPa. With a 15 wt.-% TFF filler concentration and 75 wt.-% PLA matrix polymer, the greatest flexural strength of 8.06 MPa was reached, which is 75 percent higher than pure PLA. The impact strength of composites showed an opposite trend to that of neat PLA which is mainly due to brittle nature of PLA at room temperature. Thus, the TFF/PLA composite with 15 wt.-% filler concentration exhibited the highest tensile strength among the studied samples. In the TFF+PLA composite, the filler dispersion was consistent, which helped to improve the tensile properties. The above composite result is derived from the spectrum generated during an FTIR test and digitally cross-checked against established reference from libraries and databases to determine the type of substance. The discovered compounds Lithium Magnesium Silicide (2/1/1) (Li2 Mg1 Si1) with cubic crystal structure and Zirconium Diphosphate (O7 P2 Zr1) with orthorhombic crystal structure provide the crystal structure of PLA + HDPE + TFF composite. As a result, composites have shown exceptional matrix absorption by the fillers, resulting in enhanced mechanical behaviour. The material is suitable for low to medium-duty applications.
5. Author’s Contribution
• Conceptualization – Sreenivasaraja Nagarajan; Kathiresan Marimuthu; Prashanth Shanmugam; Moganapriya Chinnasamy
• Data curation – Sreenivasaraja Nagarajan; Kathiresan Marimuthu; Prashanth Shanmugam; Moganapriya Chinnasamy
• Formal analysis – Sreenivasaraja Nagarajan; Kathiresan Marimuthu; Prashanth Shanmugam; Moganapriya Chinnasamy
• Funding acquisition – Sreenivasaraja Nagarajan; Kathiresan Marimuthu
• Investigation – Sreenivasaraja Nagarajan; Kathiresan Marimuthu; Prashanth Shanmugam; Moganapriya Chinnasamy
• Methodology – Sreenivasaraja Nagarajan; Kathiresan Marimuthu; Prashanth Shanmugam; Moganapriya Chinnasamy
• Project administration – Kathiresan Marimuthu
• Resources – Sreenivasaraja Nagarajan; Kathiresan Marimuthu
• Software – NA.
• Supervision – Kathiresan Marimuthu
• Validation – Sreenivasaraja Nagarajan; Kathiresan Marimuthu; Prashanth Shanmugam; Moganapriya Chinnasamy
• Visualization – Kathiresan Marimuthu
• Writing – original draft – Sreenivasaraja Nagarajan; Prashanth Shanmugam
• Writing – review & editing –Kathiresan Marimuthu; Moganapriya Chinnasamy
6. References
1 Adeola, A., & Aworh, O. (2010). Sugar and dietary fibre components of tamarind (Tamarindus indica L.) Fruits from Nigeria. Nigerian Food Journal, 28(2), 32-40 http://doi. org/10.4314/nifoj.v28i2.62633
2 Jia, W., Gong, R. H., Soutis, C., & Hogg, P. J. (2014). Biodegradable fibre reinforced composites composed of polylactic acid and polybutylene succinate. Plastics, Rubber and Composites, 43(3), 82-88 http://doi.org/10.1179/1743289813Y.0000000070
3 Nagarjun, J., Kanchana, J., RajeshKumar, G., Manimaran, S., & Krishnaprakash, M. (2022). Enhancement of mechanical behavior of PLA matrix using tamarind and date seed micro fillers. Journal of Natural Fibers, 19(12), 4662-4674 http:// doi.org/10.1080/15440478.2020.1870616
4 Stalin, B., Nagaprasad, N., Vignesh, V., & Ravichandran, M. (2019). Evaluation of mechanical and thermal properties of tamarind seed filler reinforced vinyl ester composites. Journal of Vinyl and Additive Technology, 25(s2), E114-E128. http:// doi.org/10.1002/vnl.21701
5 Ramachandran, M., Bansal, S., & Raichurkar, P. (2016). Scrutiny of jute fiber poly-lactic acid (PLA) resin reinforced polymeric composite. Journal of the Textile Association, 76(6), 372-375. Retrieved in 2024, December 7, from https://www. researchgate.net/publication/304246571
6 Mofokeng, J. P., Luyt, A. S., Tábi, T., & Kovács, J. (2012). Comparison of injection moulded, natural fibre-reinforced composites with PP and PLA as matrices. Journal of Thermoplastic Composite Materials, 25(8), 927-948 http:// doi.org/10.1177/0892705711423291
7 Chen, Y., Lin, J., Fei, Y., Wang, H., & Gao, W. (2010). Preparation and characterization of electrospinning PLA/ curcumin composite membranes. Fibers and Polymers, 11(8), 1128-1131 http://doi.org/10.1007/s12221-010-1128-z
8 Aldas, M., Pavon, C., De La Rosa-Ramirez, H., Ferri, J. M., Bertomeu, D., Samper, M. D., & Lopez-Martinez, J. (2021). The impact of biodegradable plastics in the properties of recycled polyethylene terephthalate. Journal of Polymers and the Environment, 29(8), 2686-2700 http://doi.org/10.1007/ s10924-021-02073-x
Nagarajan, S., Marimuthu, K., Shanmugam, P., & Chinnasamy, M.
9 Sachin, S. R., Kannan, T. K., & Rajasekar, R. (2020). Effect of wood particulate size on the mechanical properties of PLA biocomposite. Pigment & Resin Technology, 49(6), 465-472 http://doi.org/10.1108/PRT-12-2019-0117
10. Oksman, K., Skrifvars, M., & Selin, J.-F. (2003). Natural fibres as reinforcement in polylactic acid (PLA) composites. Composites Science and Technology, 63(9), 1317-1324 http:// doi.org/10.1016/S0266-3538(03)00103-9
11 Maheswari, C. U., Reddy, K. O., Muzenda, E., Shukla, M., & Rajulu, A. V. (2013). Mechanical properties and chemical resistance of short tamarind fiber/unsaturated polyester composites: influence of fiber modification and fiber content. International Journal of Polymer Analysis and Characterization, 18(7), 520-533 http://doi.org/10.1080/1023666X.2013.816073
12 Jo, M. Y., Ryu, Y. J., Ko, J. H., & Yoon, J.-S. (2012). Effects of compatibilizers on the mechanical properties of ABS/PLA composites. Journal of Applied Polymer Science, 125(S2), E231-E238 http://doi.org/10.1002/app.36732
13 Nuthong, W., Uawongsuwan, P., Pivsa-Art, W., & Hamada, H. (2013). Impact property of flexible epoxy treated natural fiber reinforced PLA composites. Energy Procedia, 34, 839-847. http://doi.org/10.1016/j.egypro.2013.06.820
14 Suryanegara, L., Nakagaito, A. N., & Yano, H. (2010). Thermomechanical properties of microfibrillated cellulose-reinforced partially crystallized PLA composites. Cellulose, 17(4), 771778 http://doi.org/10.1007/s10570-010-9419-5
15. Siregar, J. P., Jaafar, J., Cionita, T., Jie, C. C., Bachtiar, D., Rejab, M. R. M., & Asmara, Y. P. (2019). The effect of maleic anhydride polyethylene on mechanical properties of pineapple leaf fibre reinforced polylactic acid composites. International Journal of Precision Engineering and Manufacturing-Green Technology, 6(1), 101-112 http://doi.org/10.1007/s40684-019-00018-3
16 Somashekhar, T. M., Naik, P., & Nayak, V., Mallikappa, & Rahul, S. (2018). Study of mechanical properties of coconut shell powder and tamarind shell powder reinforced with epoxy composites. IOP Conference Series: Materials Science and Engineering, 376, 012105 http://doi.org/10.1088/1757899X/376/1/012105.
Received: Dec. 07, 2024
Revised: Feb. 28, 2025
Accepted: Apr. 26, 2025
Editor-in-Chief: Sebastião V. Canevarolo
Taynara Alves de Carvalho1 , Alexandra Helena de Barros1 , Rachel Farias Magalhães1 , Milton Faria Diniz2 , Lídia Mattos Silva Murakami1 , Jorge Carlos Narciso Dutra1 , Natália Beck Sanches3,4 and Rita de Cássia Lazzarini Dutra1*
1Divisão de Ciências Fundamentais, Departamento de Química, Instituto Tecnológico de Aeronáutica, São José dos Campos, SP, Brasil
2Divisão de Propulsão, Departamento de Ciência e Tecnologia Aeroespacial, Instituto de Aeronáutica e Espaço, São José dos Campos, SP, Brasil
3Centro Universitário Sant’Anna – UNISANT’ANNA, São Paulo, SP, Brasil
4Centro de Tecnologia da Informação – CTI Renato Archer, Campinas, SP, Brasil
*ritalazzarini@yahoo.com.br
Obstract
Using ternary blends is a technological solution to combine the best characteristics of different elastomers. Quantifying rubbers in a blend, in which each content influences the result, is a task complex and usually requires the coupling of techniques. Therefore, it is necessary to develop simple, fast and accurate methodologies for this purpose. This study presents the analysis of polychloroprene, poly-cis-isoprene and polybutadiene (CR/NR/BR) rubber, with the selection of bands A1116 (CR), A2960 (NR) and A738 (BR), by universal attenuated total reflection (UATR) infrared spectroscopy performed on the sample as received. The error found was 2%, with 98 to 99% of the data explained by the methodology. The methodology responds more adequately to CR and BR cis, but has the ability to detect up to 5% of NR and 10% of CR and BR. Acidresistance data are used quantitatively in the determination of BR rubber, satisfactorily confirming the spectral data found.
Keywords: acid-resistance, infrared spectroscopy, quantification, ternary rubber.
Data Ovailability: Research data is only available upon request.
How to cite: Carvalho, T. A., Barros, A. H., Magalhães, R. F., Diniz, M. F., Murakami, L. M. S., Dutra, J. C. N., Sanches, N. B., & Dutra, R. C. L. (2025). Quantification of elastomers in CR/NR/BR blends. Polímeros: Ciência e Tecnologia, 35(3), e20250026. https://doi.org/10.1590/0104-1428.20240130
In recent decades, polymeric materials have achieved a vital position in all branches of science and technology. Rubbers are widely used as vibration absorbers to dissipate vibrational energy[1] and are also of paramount importance for the space sector, in which are used as flexible thermal protections and flexible joints in rocket engines[2], as well as for the aeronautical sector, in which are employed in aircraft tires[3]. Furthermore, this material is also applied in the footwear industry[4], and mainly in the automotive industry, in tires and other artifacts[5]
One type of rubber alone does not have the ability to provide all the desired properties for an elastomer artifact. It is necessary to use the strategy of mixing or blending rubbers, which are formulated to achieve the final properties required according to each project, the process capacity and the desired cost[6]. Such properties can be controlled by changing the morphology of the processing conditions and the composition of the blend[7]
Regarding the morphological characterization of elastomeric blends, Kaliyathan et al.[8] provide a review on blends of various binary and ternary rubbers, with different contents, including, for example, natural poly-cis-isoprene
rubber and butadiene and styrene copolymer (NR/SBR) and ternary rubber containing NR, SBR and polybutadiene (NR/ SBR/ BR). In the case of elastomeric blends, microscopy is an essential tool to understand the morphology, that is, the size, shape and distribution of phases and filler particles in the elastomeric blend. In the review, the authors address studies that use optical microscopy (OM), scanning and transmission electron microscopy (SEM, TEM) and atomic force microscopy (AFM). The conclusion is that the most suitable microscopy (OM, SEM, TEM or AFM) must be selected depending on the length scale (macro, micro and nano) of the heterogeneity. However, conducting a microscopy study is complex, particularly through TEM analysis, as several factors related to the characteristics of rubbers and microscopes must be considered before conducting an imaging process. Prior knowledge about the sensitivity of rubbers to irradiation, contrast enhancements for analyzing rubbers, the preparation of their surfaces, etc., is very important. Furthermore, the analysis of the morphology of each rubber constituent of the blend is necessary for the adequate interpretation of the image with corresponding physical and mechanical properties.
Carvalho, T. A., Barros, A. H., Magalhães, R. F., Diniz, M. F., Murakami, L. M. S., Dutra, J. C. N., Sanches, N. B., & Dutra, R. C. L.
As future trend, Kaliyathan et al.[8] cite qualitative spectroscopy of the image obtained microscopically in conjunction with other spectroscopic techniques, such as Fourier transform infrared spectroscopy (FT-IR), Raman spectroscopy, photoacoustic spectroscopy, atomic emission spectroscopy, electron spectroscopy and ions, magnetic resonance spectroscopy, and mass spectroscopy.
Although there are fewer qualitative infrared (IR) studies than quantitative studies of polymer blends, some research on the latter has been published recently of binary[9-11] and ternary[12,13] elastomeric systems for different technological purposes. However, for ternary rubbers, most of the time, the use of coupling techniques is necessary[14] online or offline, due to the possibility of overlapping thermal events or spectroscopic bands. Therefore, there are gaps in polymer characterization research through techniques and laboratory tests with lower complexity and analysis time, such as in the evaluation of samples as received, which can give rise to the development of new methodologies.
The ternary blend of chloroprene, NR and BR rubbers (CR/NR/BR), for example, stands out in ternary elastomeric systems because it is used for engineering applications in which high performance, chemical resistance and excellent tribological properties are required, i.e., friction, wear and lubrication that take place during contact between solid surfaces in relative movement, however there are few studies in the literature available on this ternary system. However, the qualitative study by Castaño-Rivera et al.[15] can be highlighted.
The qualitative FT-IR analysis of CR/NR/BR is cited by Castaño-Rivera et al.[15], among other techniques, such as X-ray diffraction (XRD), thermogravimetric analysis (TGA) and rheometric analysis, to study the effect of the type of filler on the mechanical properties of nanocomposites prepared with the ternary rubber, and the correlation with its structure, compatibility and curing properties. Qualitative analysis by FT-IR reflection, specifically by attenuated total reflection (ATR), appears in the study as an important technique to investigate the reinforcement interaction of nanoclays in rubber nanocomposites.
Simpler laboratory tests on rubbers containing one or more elastomers, such as the assessment of resistance to oxidative degradation or the acid-resistance test, in which the sample is subjected to a mixture of concentrated sulfuric and nitric acids at temperatures of 70 and 40 °C, have also been cited in the literature. These tests can indicate the chemical nature of the rubbers used in a formulation[16,17], which is of great practical use in the industry, as this is one of the challenges that the company encounters when it needs to replace rubber parts.
The study by Dutra and Diniz[16] investigated the methodology developed by Mano and Dutra[17] for the case of binary elastomer blends in vulcanized artifacts, including those that show similar IR spectra. The acid-resistance test was useful for differentiating saturated and unsaturated rubbers, thus constituting an alternative methodology for the characterization of rubbers. In the samples analyzed by Dutra and Diniz[16], the test provided a clear indication of the degradability of the polymer chains, even when there is a great predominance of less unsaturated structures in the
mixture. The results indicate that it is possible to detect the component least resistant to the oxidizing mixture when its content is higher than 20% of the elastomeric total. The study can be considered as semi-quantitative for the binary rubbers analyzed.
Magalhães [13] evaluated the acid-resistance test quantitatively at 40 °C by subtraction, validating FT-IR data relating to the evaluation of BR content in the analysis of the ternary rubber NR/SBR/BR. Barros et al.[12] also evaluated quantitatively the BR content in mixture with the ethylene propylene diene monomer copolymer (EPDM/BR), by acid-resistance at 40 °C. The researchers recommend the methodology as an alternative to the FT-IR methodology developed for the binary blend.
The acid-resistance test was initially developed for the qualitative evaluation of saturated and unsaturated rubbers and was later applied in a semi-quantitative way to saturated and/or unsaturated binary blends that presented similar infrared spectra[16,17]. The method was then developed to the quantitative investigation[12,13] of ternary NR/SBR/BR rubbers. This study advances the aforementioned investigations, using the acid-resistance test to evaluate the influence of different BR contents on the degradation initiation time of another ternary rubber: the CR/NR/BR blend.
The development of fast, accurate, qualitative and quantitative methodologies to evaluate the composition of these systems becomes essential due to the commercial importance of elastomeric blends. These methodologies are important for industrial applications, in which the determination of a content range is sufficient for the evaluation of materials, and mainly in the aerospace sector, in which the costs of materials are extremely high and there is the critical factor of safety, which demands the detection of low elastomer content that would not be adequate to the project specifications.
Conventional determination of elastomer content in ternary systems are carried out using complex methodologies, which is time consuming and involve high costs, which often makes them impracticable for the industry. Therefore, there are opportunities for new developments in this area. Reinforcing the importance of the methodology developed in this study, no studies were found in the literature consulted that address the use of non-conventional FT-IR reflection techniques, not even in the most recent reviews[8,18], for determining the content of rubber components in ternary CR/NR/BR on samples as received, with data validation through test sample and acid-resistance tests. Therefore, it is clear that there is a gap in the scientific database on the characterization/quantification of this ternary elastomeric system. The importance of the contribution of this study lies in the development of accurate quantitative non-conventional FT-IR and fast, qualitative and quantitative acid-resistance methodologies for the analysis of CR/NR/BR.
2.1 Materials
CR/NR/BR vulcanized rubber samples, including test sample A1, were prepared and kindly provided by the companies Zanaflex Borrachas and Tenneco Automotive Brazil, with
Quantification of elastomers in CR/NR/BR blends
the following nominal content (wt. %): 10CR/40NR/50BR, 20CR/60NR/20BR, 30CR/5NR/65BR, 40CR/50NR/10BR and 50CR/10NR/40BR, according to the companies’ internal procedures. It should be noted that the BR base elastomer used by Zanaflex has a higher cis C-C content than the one from Tenneco. The CR used in both companies has a cis chemical structure. The contents of the cis structure are not provided by companies due to internal policy.
2.2.1 FT-IR reflection (UATR) and acid-resistance test of CR/NR/BR
The conditions for the FT-IR analyses were: PERKINELMER IR spectrometer Frontier, 4000 to 400 cm-1 (mid-infrared MIR), resolution 4 cm-1, gain 1, and 20 scans by universal attenuated total reflection (UATR). Samples were quantitatively analyzed as received. The samples were cut and the internal surface was analyzed, as the investigation of the surface could be interfered by the possible migration of additives from the formulation. The analytical bands used in this methodology were selected according to their variation in height (intensity) in relation to the content of each elastomer, in compliance with the Lambert-Beer law[19], at the following wavenumbers (cm-1), measured by the following baselines (BL): for CR - 1659 (1778 to 1502), 1431 (1502 to 1388) and 1116 (1146 to 927); for NR - 2960 (3110 to 2744), 1376 (1388 to 1341) and 833 (880-790); for BR - 3006 (3110 to 2744), 966 (1146 to 927) and 738 (790 a 624). The assignment[19,20] is: A1659 (cis C=C), A1431 (CH2), A1116 (C-C), A2960 (CH3), A1376 (CH3), A833 (vinylidene), A3006 (C-H), A966 (trans C=C) and A738 (cis C=C). Analyses were performed in quintuplicate. The calibration curves were constructed with the median[21] values of absorbance versus the elastomer content. The accuracy estimation is in accordance to the nonparametric statistical method used for spectroscopic data[21] (Equations 1 to 3) successfully used for IR spectroscopic data in different studies[9-11,22] The methodology error is estimated by the median of the relative error[22] .
Standard deviation:
σ = R K R
where: R = higher absorbance value - lower absorbance value; KR = 0.430 for 5 measurements[21].
Mean standard deviation:
where: n is the number of measurements.
(RD):
where: µ is the median value of absorbance.
The lowest methodology error and the highest linearity of the calibration curve (R2) were the set of results used for
selecting the best analytical band. The acid-resistance test was performed according to the methodology described in a previous study[16]. The test is performed as follows: small fragments of the sample are extracted in acetone and dried in an oven. 5 ml of a mixture 1:1 of concentrated sulfuric acid (density of 1.84 g/cm3) and concentrated nitric acid (density of 1.42 g/cm3) are placed in a test tube, which is then immersed in a water bath at 70 °C. After the contents of the test tube reach the bath temperature (around 5 min), the sample fragments are placed in the test tube and the time at which they begin to degrade is measured with a stopwatch. The degradation can be easily observed when small particles begin to appear on the surface of the sample, then dispersing in the mixture of concentrated acids. The authors[16,17] point out that if the attack is immediate and can’t be measured in minutes, it is necessary to repeat the test in a bath at 40 °C, which is a milder condition and should result in a longer time until deterioration. As immediate degradation of CR/NR/BR occurred at 70 °C, the test was repeated at 40 °C to reduce the aggressiveness of the test conditions and allow measurements. The time measured in the acidresistance test represents the onset time of degradation of the elastomeric material.
The tests were conducted in triplicate. The mean time was used for evaluating the relation between the onset time of degradation and the BR content. The CR/NR/BR sample coded “A1” was analyzed by the same analysis conditions to verify the effectiveness of the developed FT-IR and acidresistance methodologies.
3.1 FT-IR/UATR analysis of the CR/NR/BR blend
The content of each elastomer in the CR/NR/BR blend was determined separately, according to the methodology described in the experiment and discussed in the next topics.
3.1.1 FT-IR/UATR evaluation of analytical bands for determining CR, NR and BR content
Figure 1 presents the set of UATR spectra (sample as received) of the vulcanized ternary rubber CR/NR/BR, containing different levels, compared to the reference spectra of each elastomer. Spectra were organized in increasing order of BR content to facilitate the visualization of height/intensity variation of their analytical bands, which were chosen and evaluated in accordance with the Lambert-Beer law[19]. In this manner, the bands at 1659, 1431 and 1116 cm-1 were selected for the evaluation of CR determination. The first band evaluated at 1659 cm-1 is assigned to the C=C group[19], and was also considered in the study by Sathasivam et al. [20] on the FT-IR absorptions of cis-1,4-polychloroprene.
Table 1 shows the FT-IR/UATR data (sample as received) calculated for A1659, for the determination of the CR content in the CR/NR/BR blend using a calibration curve, as well as the errors involved. The samples were organized in increasing order of nominal CR content to facilitate visualization of the increasing in absorbance value. This procedure was also carried out for each band and its corresponding elastomer to construct the other tables in the study.
Carvalho, T. A., Barros, A. H., Magalhães, R. F., Diniz, M. F., Murakami, L. M. S., Dutra, J. C. N., Sanches, N. B., & Dutra, R. C. L.
Results from Table 1 were plotted in a calibration curve of the analytical band A1659 (median) (CR) versus the CR content (Figure 2). The methodology error was around 4%, in accordance with to Barros et al.[12] and lower than the reported in another study[14] (5%), for another ternary system containing NR and BR (NR/SBR/BR). This methodology error for CR/NR/BR (around 4%) could be considered satisfactory for the industry, because a specification range is routinely adopted for material acceptance. Even though the methodology showed some limitation for the 30% CR content, which can be attributed to this sample lower cis content informed by the suppliers, a tendency in linearity was observed in Figure 2, with 85% of the data explained by the developed methodology (R2).
Figures 3 to 5 show the calibration curves of the other bands also evaluated for the determination of elastomer content in the CR/NR/BR blend: A1431 and A1116 (CR content), A2960, A1376 and A833 (NR content), and A3006, A966 and A738 (BR content).
All curves showed adequate linearity, varying between 84 and 99% of data explained by the developed methodologies. It should be noted that the sample 30CR/5NR/65BR was manufactured with a BR rubber with lower cis content and
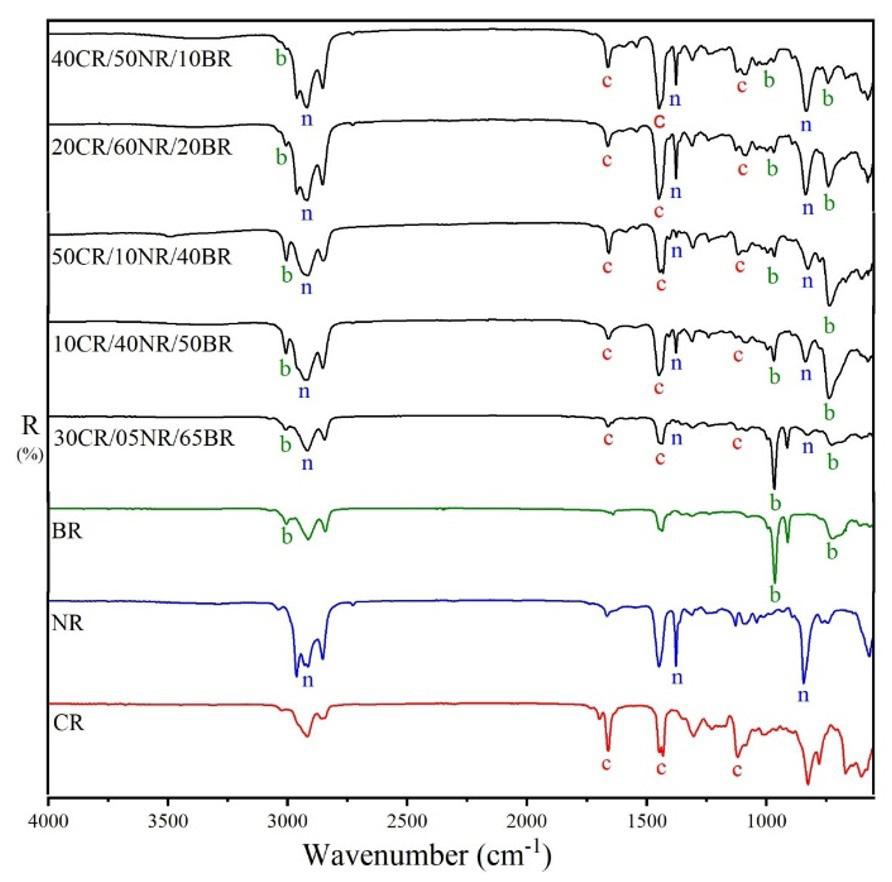
Figure 1. FT-MIR spectra/UATR reflection/ sample as received of the CR/NR/BR samples presented in increasing order of BR content, and of the neat rubbers. The bands evaluated for each elastomer are marked with the letters “c” for CR, “n” for NR, and “b” for BR.
thus was discarded, so only four samples were used to determine the BR content. The lower cis content is confirmed by the difference in the intensity of the band around 740 cm-1 (marked with an asterisk) in the spectra of the two neat BR types (rubber as received from the suppliers) shown in Figure 6. Therefore, the Tenneco sample presented the band around 740 cm-1 with lower intensity (see Figure 1) due to the lower content of C=C cis, despite having a higher content of BR (30CR/5NR/65BR). This occurrence caused a deviation in the measurement of the most characteristic band of cis bonds. On the other hand, it was possible to measure a 5% NR content in CR/NR/BR using all samples of the NR curves, which constitutes a contribution of this research, as it is the minimum acceptable content for a material to be considered as a blend[23]
Regarding the calculations, this study adopted the criterion of showing only one table (i.e. Table 1, already mentioned) of one of the bands chosen for each elastomer and grouping all the results obtained in Table 2 (Equations 4 to 12) for the bands studied for CR, NR and BR, as the calculation mechanism is the same. The results most suitable for determining the aforementioned elastomers in the blend were marked in bold.
Table 2 shows that, in general, the selected bands presented satisfactory results. However, to define the most appropriate analytical band, it is necessary to consider other parameters such as the linearity of the calibration curve, the error of the
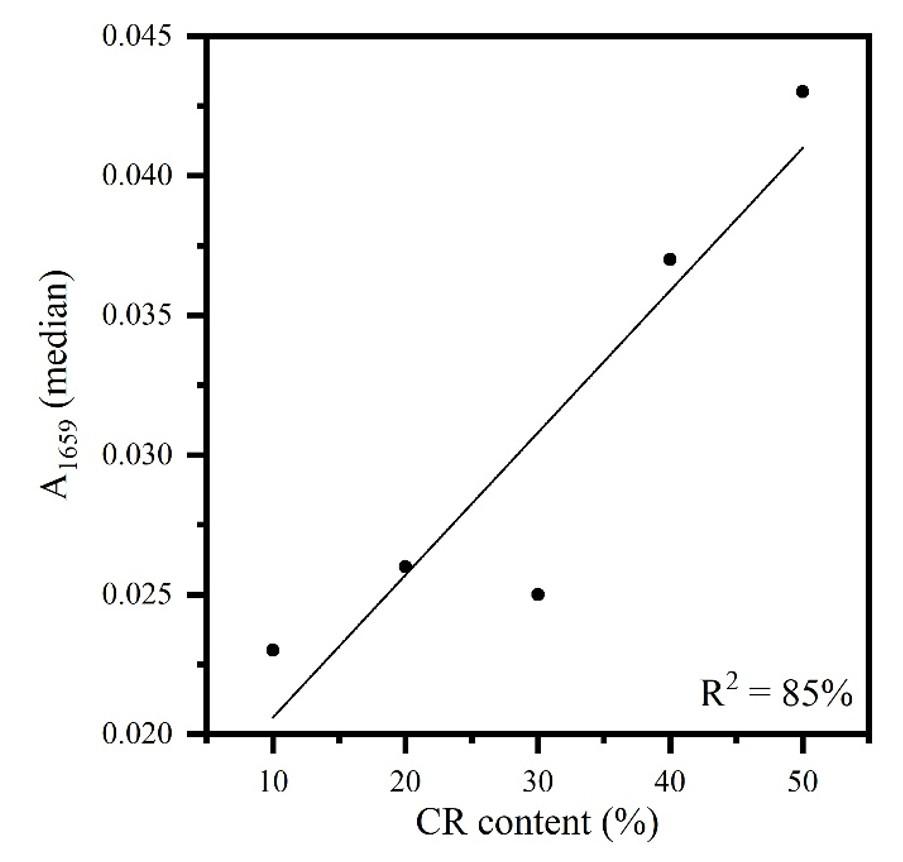
Figure 2. Calibration curve of FT-IR/UATR sample as received (A1659) versus CR content in CR/NR/BR.
Table 1. FT-IR/UATR/sample as received (A1659) results for the determination of CR in CR/NR/BR.
*For mean standard deviation values close to zero, a value of 0.001 was assumed, in accordance with the decimal places of the absorbance value.
Quantification of elastomers in CR/NR/BR blends
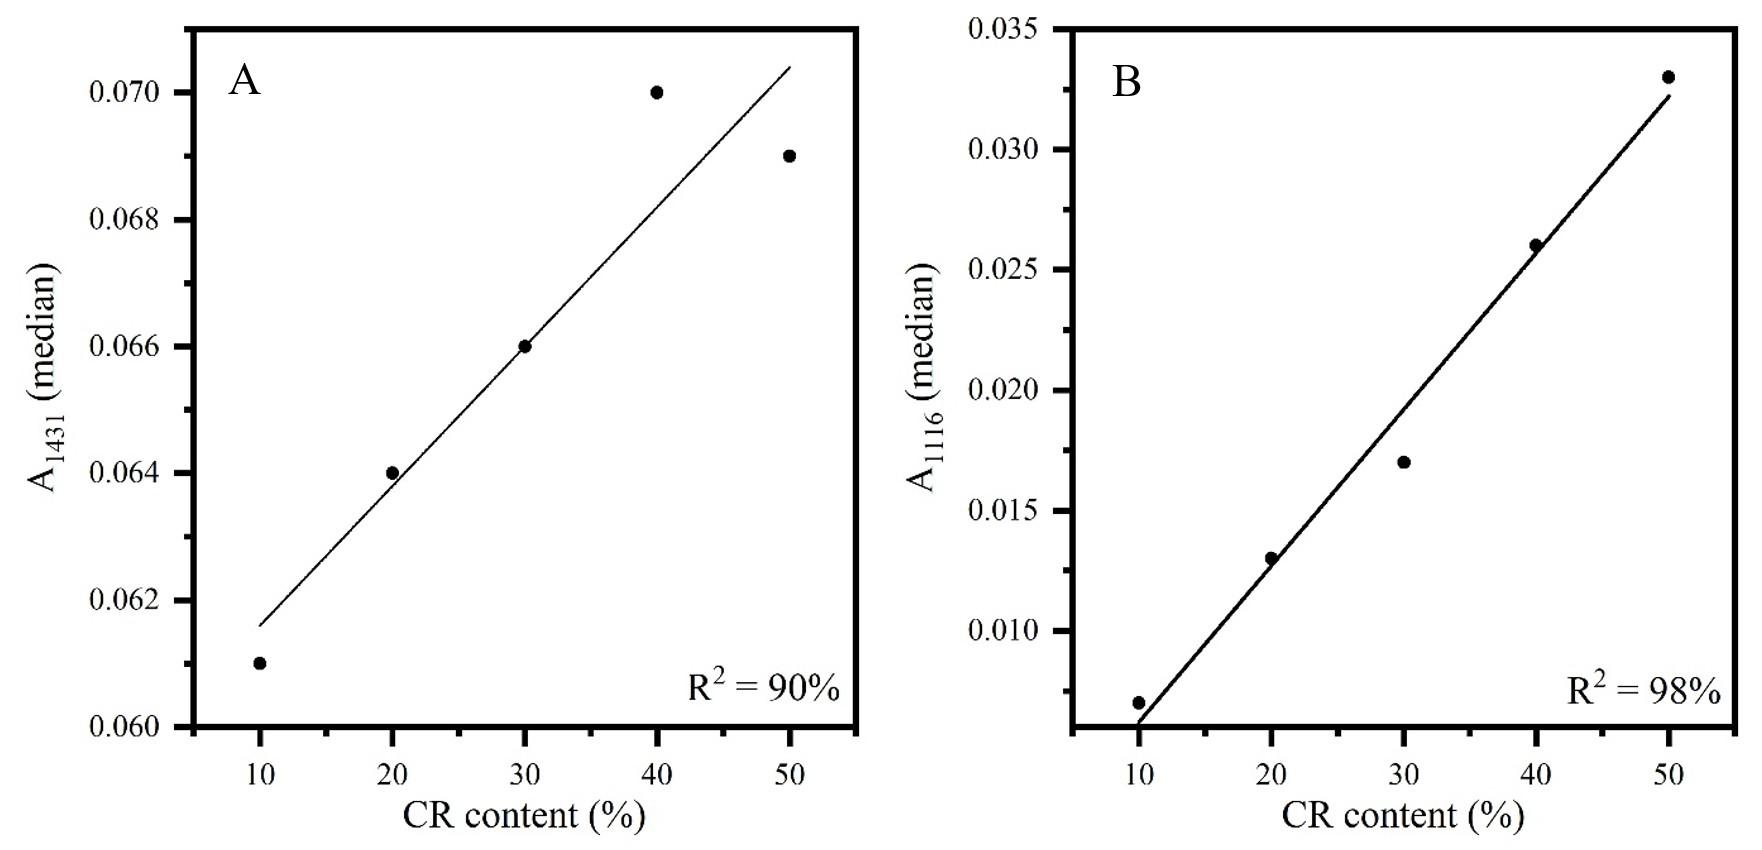
Figure 3. Calibration curves of FT-IR/UATR sample as received: (A) (A1431) versus CR content in CR/NR/BR; (B) (A1116) versus CR content in CR/NR/BR.
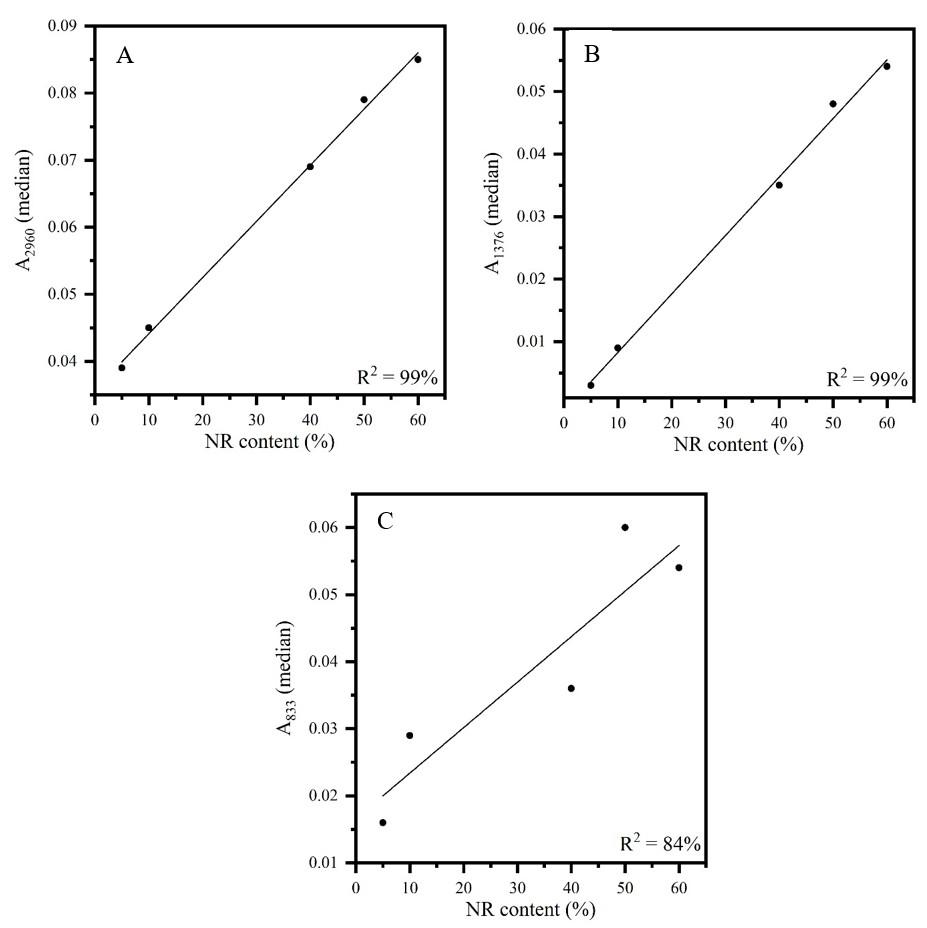
Figure 4. Calibration curves of FT-IR/UATR sample as received: (A) (A2960) versus NR content in CR/NR/BR; (B) (A1376) versus NR content in CR/NR/BR; (C) (A833) versus NR content in CR/NR/BR.
proposed methodology, the possibility of overlapping bands, and the characteristic intensity of the band that facilitates or makes the measurement of low contents difficult[19]
For the determination of CR content in the blend, the highest percentage of data explained by the methodology was mandatory for indicating the band at 1116 cm-1 as the
T. A., Barros, A. H., Magalhães, R. F., Diniz, M. F., Murakami, L. M. S., Dutra, J. C. N., Sanches, N. B., & Dutra, R. C. L.
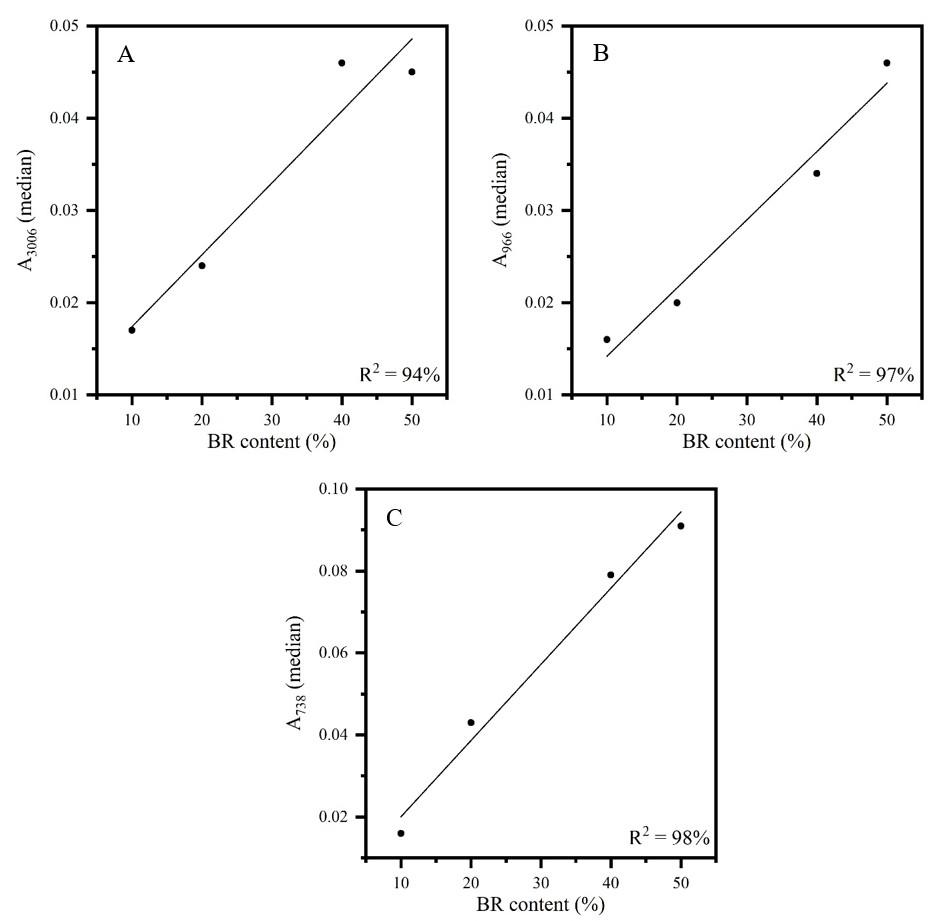
curves of FT-IR/UATR sample as received: (A) (A3006) versus BR content in CR/NR/BR; (B) (A966) versus BR content in CR/NR/BR; (C) (A738) versus BR content in CR/NR/BR.
most appropriate, even though the error was around 6%. Errors of this order of magnitude are typically found in quantitative methodologies by reflection[12] or even through coupling techniques[14] for ternary rubbers.
In the case of NR, both the error and the percentage of data explained by the methodology indicated the band at 2960 cm-1 as the best option. This band is characteristic of CH3 [19] and has an intensity suitable for measuring low contents, as evidenced by the NR determination of 5% in the ternary blend. The band at 1376 cm-1, also characteristic of CH3 [19], showed adequate results but with lower intensity, which can yield higher errors, as observed.
For the BR determination, the band that showed the most appropriate result in terms of methodology error and linearity was found at 738 cm-1, which is characteristic of C=C cis[19,20]
3.2 Acid-resistance evaluation of the BR content
In addition to the qualitative FT-IR/UATR analysis of the sample as received, which confirmed the characteristic
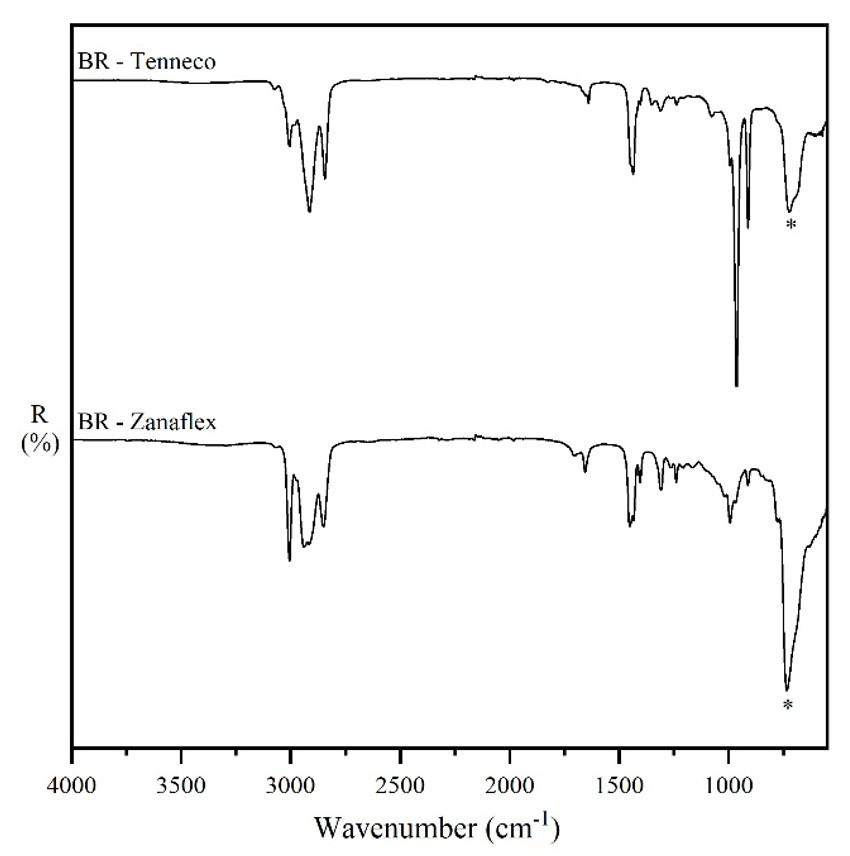
6. FT-IR/UATR spectra/sample as received of BR Tenneco and BR Zanaflex.
bands of CR/NR/BR (Figure 1 already shown), and the quantitative analysis that determined the levels of each elastomer, the acid-resistance test[16,17] was conducted to verify the quantitative relation between the increase in BR content and the degradation onset time of the CR/NR/BR blend. The test was carried out focusing on BR rubber because among the three elastomers, BR is the one with the longest degradation start time at a given temperature[16] .
According to Dutra and Diniz[16], unsaturated NR, CR, and BR rubbers degrade within ≤ 1 minute at 70 °C. Therefore, the CR/NR/BR blend is expected to have a quick degradation at 70 °C, making it impossible to establish any relation between the BR content and the degradation time. Because of this occurrence, the test was conducted at 40 °C (Table 3).
The longer time required at 40 °C to start the degradation of each rubber in the blend permits a better individual visualization. Furthermore, according to the literature[16,17], the elastomers combined in the blend have different degradation onset time at 40 °C. NR and CR degrade in less than 3 minutes, while BR degrades between 10 and 30 minutes. Therefore, the expected behavior for the increase in BR content in the CR/NR/BR blend is an increase in the degradation start time for the blend, which is observed in the linear trend of Figure 7. Some deviation can be attributed to the different characteristics of some elastomers used from different suppliers, such as BR provided with higher content of trans or cis C=C vinyl. However, the results show that the presence of BR in CR/NR/BR is more noticeable from 20% onwards, which confirms what was observed by Dutra and Diniz[16] for binary blends. Due to the longer degradation initiation time (6 minutes) for BR compared to that observed for NR and CR (around 3 minutes) at 40 °C, BR, despite also being unsaturated, is the most resistant rubber to the oxidizing mixture in this analyzed system.
It was observed a correlation (Equation 13) with an adequate linearity (R2 = 85%) between the data obtained through the acid-resistance tests and the BR content in the sample.
0.22420.3030 =+= yxy (13)
where: y is the degradation onset average time at 40 °C and x is the BR content in CR/NR/BR.
methodologies developed
To evaluate the effectiveness of the methodologies developed, the UATR and acid-resistance was performed on test sample A1 and results were presented in Tables 4 and 5. In the FT-IR analysis, the bands 1116 cm-1 for CR, 2960 cm-1 for NR and 738 cm-1 for BR were analyzed, which were, according to the methodology developed, the most suitable for determining the levels of these elastomers in the CR/NR/BR blend. The corresponding equations previously shown were used (Equations 6, 7 and 12). For the calculated values, whole numbers were considered for comparison with the nominal values.
The results of the FT-IR/UATR/sample methodology as received can be considered with adequate precision, as the methodology error is 1.80% (median of the 3 relative errors), considering the 3 bands selected (Table 2). Furthermore, considering the technological aspect[24] of rubber industries, which use specification ranges for the acceptance of their products, the calculated accuracy meets the requirements.
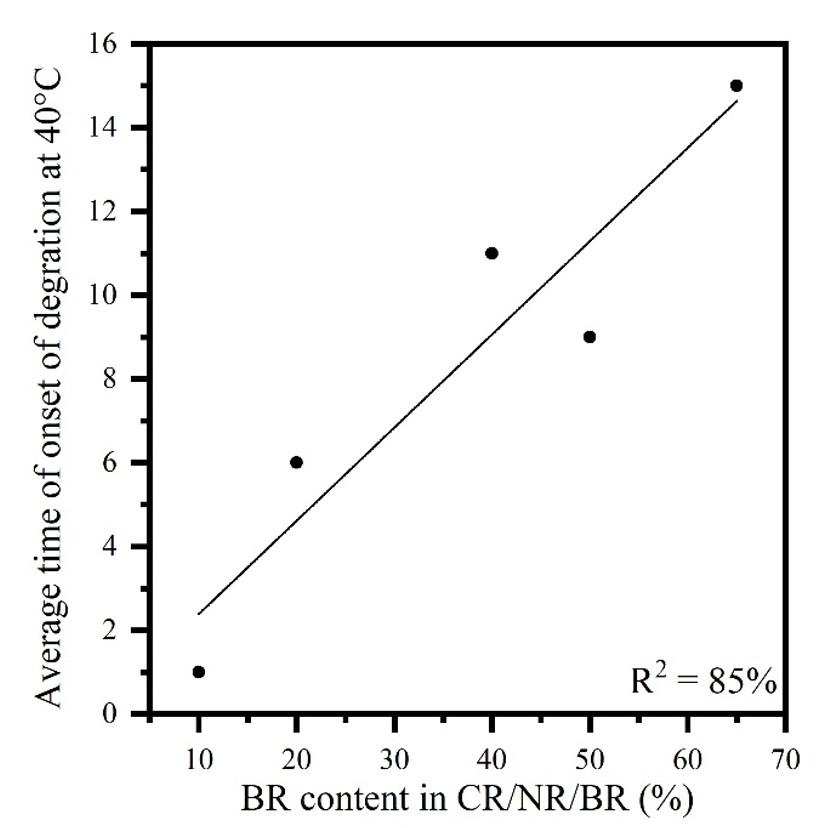
Table 2. Comparison of FT-IR UATR data (as received) for each CR/NR/BR band analyzed, including methodological errors and data from the respective calibration curves.
in CR/ NR/BR Band
median absorbance value of the analytical band and x= elastomer content.
Carvalho, T. A., Barros, A. H., Magalhães, R. F., Diniz, M. F., Murakami, L. M. S., Dutra, J. C. N., Sanches, N. B., & Dutra, R. C. L.
Table 3. Results of acid-resistance (40 °C) for the CR/NR/BR blend.
40CR/50NR/10BR
50CR/10NR/40BR
10CR/40NR/50BR 10/9/9 9
30CR/5/NR/65BR 14/15/16 15
Table 4. FT-IR/UATR data/sample as received for test sample A1 from CR/NR/BR.
Table 5. Acid-resistance data (40 °C) for test sample A1 of CR/NR/BR.
The BR content calculated for sample A1 with Equation 13 (16%) in the acid-resistance test can also be considered satisfactory from an industrial point of view, even considering its lower precision, as long as the nominal BR content is not higher than 20%. In this condition, results from the acid-resistance test validate the FT-IR data, and are able to distinguish the content in which the influence of this elastomer on the beginning of degradation in the blend start to be noted[16]
The objective of this study was to develop a simple, fast and accurate methodology for quantifying the elastomer content in the CR/NR/BR blend. The purpose was achieved, which contributes to the state of the art of research in the determination of elastomer contents in ternary elastomeric systems. It is noteworthy that the proposed methodology is the FT-IR/UATR analysis with the sample as received, that is, without sample preparation. Therefore, time spent is reduced and accurate values are found without major complexities, especially for samples containing CR and BR cis. The methodology can also be applied to different CR/ NR/BR blends, even detecting the lowest possible content in a blend (5%). Results were validated through a test sample, both for the FT-IR analysis and for the acid resistance test, which is a simple and quick laboratory examination. The applicability of the acid resistance test was expanded in this study for the determination of BR in the CR/NR/BR blend.
5. Author’s Contribution
• Conceptualization –Taynara Alves de Carvalho; Natália Beck Sanches; Rita de Cássia Lazzarini Dutra.
• Data curation – NA.
• Formal analysis – NA.
• Funding acquisition - Rita de Cássia Lazzarini Dutra.
• Investigation – Milton Faria Diniz; Taynara Alves de Carvalho; Alexandra Helena de Barros; Rachel Farias Magalhães.
• Methodology –Taynara Alves de Carvalho; Alexandra Helena de Barros; Rachel Farias Magalhães; Milton Faria Diniz; Rita de Cássia Lazzarini Dutra.
• Project administration – Rita de Cássia Lazzarini Dutra.
• Resources – Lídia Mattos Silva Murakami.
• Software – NA.
• Supervision – Natália Beck Sanches; Jorge Carlos Narciso Dutra; Rita de Cássia Lazzarini Dutra
• Validation –Taynara Alves de Carvalho; Alexandra Helena de Barros; Rachel Farias Magalhães; Milton Faria Diniz; Rita de Cássia Lazzarini Dutra.
• Visualization – Taynara Alves de Carvalho; Natália Beck Sanches; Rita de Cássia Lazzarini Dutra.
• Writing – original draft – Taynara Alves de Carvalho; Rita de Cássia Lazzarini Dutra.
• Writing – review & editing – Taynara Alves de Carvalho; Alexandra Helena de Barros; Rachel Farias Magalhães; Natália Beck Sanches; Rita de Cássia Lazzarini Dutra.
The authors disclosed receipt of the following financial support for the research, authorship, and/or publication of this article. This paper was supported by the Conselho Nacional de Desenvolvimento Científico e Tecnológico (CNPQ) - Finance Code 301626/2022-7.
1 Zeng, Z., Qahtan, A. A. S., Hu, G., Xu, R., & Shuaibu, A. A. (2023). Comparative experimental investigation of the vibration mitigation characteristics of ballasted track using the rubber composite sleeper and concrete sleeper under
various interaction forces. Engineering Structures, 275(Part A), 115243 http://doi.org/10.1016/j.engstruct.2022.115243
2. Wang, Y., Li, J., Wan, L., Wang, L., & Li, K. (2023). A lightweight rubber foaming insulation reinforced by carbon nanotubes and carbon fibers for solid rocket motors. Acta Astronautica, 208, 270-280 http://doi.org/10.1016/j.actaastro.2023.04.019
3 Jiang, B., & Wang, H. (2023). An integrated analytical model for friction characteristics of aircraft tire on wet runway pavement. Tribology International, 185, 108501 http://doi. org/10.1016/j.triboint.2023.108501
4 Anggoro, P. W., Bawono, B., Setyohadi, D. B., Ratnasari, L., Fergiawan, P. K., Tauviqirrahman, M., Jamari, J., & Bayuseno, A. P. (2023). Optimisation of the machining time required by insole orthotic shoes for patients with clubfoot using the Taguchi and response surface methodology approach. Heliyon, 9(6), e16860 http://doi.org/10.1016/j.heliyon.2023.e16860 PMid:37484398.
5 Utrera-Barrios, S., Verdejo, R., López-Manchado, M. A., & Hernández Santana, M. (2023). Self-Healing elastomers: a sustainable solution for automotive applications. European Polymer Journal, 190, 112023 http://doi.org/10.1016/j. eurpolymj.2023.112023
6 Yoon, B., Kim, J. Y., Hong, U., Oh, M. K., Kim, M., Han, S. B., Nam, J.-D., & Suhr, J. (2020). Dynamic viscoelasticity of silica-filled styrene-butadiene rubber/polybutadiene rubber (SBR/ BR) elastomer composites. Composites. Part B, Engineering, 187, 107865. http://doi.org/10.1016/j.compositesb.2020.107865.
7 Nawawi, M. A., Har, S. L., & Han, C. C. (2012). Miscibility of polymer blends comprising poly (ethylene oxide)-epoxidized natural rubber. International Journal of Chemical Engineering and Applications, 3(6), 410-412 http://doi.org/10.7763/ IJCEA.2012.V3.230.
8 Kaliyathan, A. V., Varghese, K. M., Nair, A. S., & Thomas, S. (2020). Rubber-rubber blends: a critical review. Progress in Rubber, Plastics and Recycling Technology, 36(3), 196-242 http://doi.org/10.1177/1477760619895002
9 Passero, A., Ferreira, K. M., Diniz, M. F., Sanches, N. B., Amado, J. C. Q., & Dutra, R. C. L. (2024). Quantification of natural rubber blends by reflection/reflectance infrared and confocal Raman spectroscopy: a comparison of statistical methods. Anais da Academia Brasileira de Ciências, 96(3), e20230387. http:// doi.org/10.1590/0001-3765202420230387 PMid:38865508.
10 Barros, A. H., Murakami, L. M. S., Magalhães, R. F., Takematsu, M. M., Diniz, M. F., Sanches, N. B., Dutra, J. C. N., & Dutra, R. C. L. (2023). Infrared quantification of binary rubber blends with overlapping bands. Anais da Academia Brasileira de Ciências, 95(1), e20220289 http://doi.org/10.1590/0001-3765202320220289
11 Rigoli, P. S., Barros, A. H., Magalhães, R. F., Murakami, L. M. S., Carrara, A. E., Dutra, J. C. N., Mattos, E. C., & Dutra, R. C. L. (2021). Determination of polychloroprene content in rubber blend containing ethylene propylene diene monomer by infrared techniques. Journal of Aerospace Technology and Management, 13, e0821 http://doi.org/10.1590/jatm.v13.1197
12 Barros, A. H., Magalhães, R. F., Murakami, L. M. S., Diniz, M. F., Sanches, N. B., Carvalho, T. A., Dutra, J. C. N., & Dutra, R. C. L. (2025). Determination of elastomer content in NR/SBR/BR blends. Polímeros: Ciência e Tecnologia, 35(2), e20250023
13 Magalhães, R. F. (2023). Avaliação de técnicas FT-IR de transmissão, reflexão e refletância para a caracterização/ quantificação de polímeros e carga de diferentes setores industriais (Tese de doutorado). Instituto Tecnológico Aeronáutica, São José dos Campos
14. Lee, Y. S., Lee, W.-K., Cho, S.-G., Kim, I., & Ha, C.-S. (2007). Quantitative analysis of unknown compositions in ternary polymer blends: a model study on NR/SBR/BR system. Journal of Analytical and Applied Pyrolysis, 78(1), 85-94 http://doi. org/10.1016/j.jaap.2006.05.001
15 Castaño-Rivera, P., Calle-Holguín, I., Castaño, J., CabreraBarjas, G., Galvez-Garrido, K., & Troncoso-Ortega, E. (2021). Enhancement of chloroprene/natural/butadiene rubber nanocomposite properties using organoclays and their combination with carbon black as fillers. Polymers, 13(7), 1085 http://doi.org/10.3390/polym13071085. PMid:33805582.
16 Dutra, R. C. L., & Diniz, M. F. (1993). Resistência à degradação oxidativa e comportamento aos solventes como indicadores da composição de sistemas elastoméricos vulcanizados mistos. Polímeros: Ciência e Tecnologia, 3(3), 25-28. Retrieved in 2024, December 23, from https://revistapolimeros.org.br/ar ticle/588371347f8c9d0a0c8b47a4/pdf/polimeros-3-3-25.pdf
17 Mano, E. B., & Dutra, R. C. L. (1988). Identificação de borrachas natural e sintéticas cruas ou vulcanizadas. Revista de Química Industrial, 56(663), 24-26. Retrieved in 2024, December 23, from https://www.abq.org.br/rqi/edicoes_1989/1988/RQI-663.pdf
18 Workman, J., Jr. (2024). A review of the latest research applications using FT-IR spectroscopy. Spectroscopy Supplements, 39(s8), 22-28 http://doi.org/10.56530/spectroscopy.ak9689m8
19 Smith, A. L. (1979). Applied infrared spectroscopy: fundamentals techniques and analytical problem-solving New York: John Wiley & Sons
20 Sathasivam, K., Haris, M. R. H. M., & Mohan, S. (2010). Vibration spectroscopic studies on cis-1,4-polychloroprene. International Journal of Chemtech Research, 2(3), 1780-1785.
21 Hórak, M., & Vítek, A. (1978). Interpretation and processing of vibrational spectra. New York: John Wiley & Sons
22 Dutra, R. C. L., & Soares, B. G. (1998). Determination of the vinyl mercaptoacetate content in poly (ethylene-co-vinyl acetate-co-vinyl mercaptoacetate)(EVASH) by TGA analysis and FTIR spectroscopy. Polymer Bulletin, 41(1), 61-67 http:// doi.org/10.1007/s002890050333
23. Simielli, E. R. (1993). Principais características das blendas poliméricas fabricadas no Brasil. Polímeros: Ciência e Tecnologia, 3(1), 45-49. Retrieved in 2024, December 23, from https://www.revistapolimeros.org.br/article/58837133 7f8c9d0a0c8b479e/pdf/polimeros-3-1-45.pdf
24 Mello, T. S. D., Diniz, M. F., & Dutra, R. C. L. (2018). UATR and NIRA evaluation in the quantification of ATBC in NC blends. Polímeros: Ciência e Tecnologia, 28(3), 239-245 http://doi.org/10.1590/0104-1428.16816
Received: Dec. 23, 2024
Revised: Apr. 23, 2025
Accepted: Apr. 27, 2025
Associate Editor: Artur J. M. Valente
João Gabriel Machado de Avellar1* , Gisely Alves da Silva2 ,
Renan Rogério Oliveira de Souza1 , Mariana Alves Henrique1 , Jorge Vinicius Fernandes Lima Cavalcanti2 , Yeda Medeiros Bastos de Almeida1,2 , Maria de Los Angeles Perez Fernandez2 and Glória Maria Vinhas1,2
1Programa de Pós-Graduação em Ciência de Materiais – PGMtr, Universidade Federal de Pernambuco – UFPE, Recife, PE, Brasil
2Departmento de Engenharia Química – DEQ, Universidade Federal de Pernambuco – UFPE, Recife, PE, Brasil
*joao.avellar@ufpe.br
Obstract
Single-use plastics represent almost a fifth of the global plastics market, leading to high residual accumulation. The study aimed to evaluate the biodegradability, under anaerobic conditions, of additivated polyethylene terephthalate (PET-ad), marketed by a company in Brazil. The polymeric films were submerged in digesters in sludge from sewage treatment plants. Films were characterized throughout time, as were the biogas and microorganisms in the medium. The results indicated weight and microscopic differences attributed to sludge components and microbial colonization on films’ surfaces. The thermal properties did not show changes. Moreover, at the end of the research, the microorganisms still had considerable concentration – 106 and 109 NMP/ml, anaerobic and aerobic, respectively. The production of methane (60% v/v) and carbon dioxide (30% v/v) gases peaked in the first month and decreased subsequently. At eighteen months, PET-ad has been proven to undergo the initial degradation process faster than negative control.
Keywords: anaerobic digestion, biodegradable polymers, PET-ad, sludge.
Data Ovailability: All data supporting the findings of this study are available at ATTENA -https://repositorio.ufpe. br/handle/123456789/62322.
How to cite: Avellar, J. G. M., Silva, G. A., Souza, R. R. O., Henrique, M. A., Cavalcanti, J. V. F. L., Almeida, Y. M. B., Fernandez, M. L. A. P., & Vinhas, G. M. (2025). Assessment of modified poly(ethylene terephthalate) films under anaerobic conditions. Polímeros: Ciência e Tecnologia, 35(3), e20250027. https://doi.org/10.1590/0104-1428.20240106
Poly(ethylene terephthalate) is one of the most widely used fossil-based thermoplastics worldwide, mainly due to its desirable properties, such as lightweight, impact resistance, high transparency, and impermeability[1 2]. Biodegradation of this thermoplastic is a desirable process, given the nontoxicity of the by-products[3,4]. Nevertheless, the rate of degradation of PET under natural conditions is too slow, and, combined with high levels of production, it causes negative impacts on terrestrial and aquatic environments[5-8] .
An alternative to mitigate these impacts comes from pro-degradant additives incorporated into polymers. These substances can facilitate microorganisms activities that can use the carbon present in the polymer chains as an energy source[9]. They act by reducing the molar mass of the chains, altering their polarity, providing a substrate to attract microorganisms, or acting as catalysts[2,10]. Considering the rapid increase in the production of additive PET, it is
necessary to evaluate the actual impact of additives on this material’s disposal to verify its biodegradation effectiveness[9]
This paper presents the progress of the biodegradation of a commercial polymer, called PET-ad, by the authors in sludge from a sewage treatment plant under an anaerobic regime for eighteen months. The evaluations were carried out considering the surface modifications, the chemical bonds in the material’s structure and thermal properties, as well as biogas production and microorganisms in biodigesters.
2.1 Biodigester preparation
PET and PET-ad films, with a thickness of 12 µm, were supplied by a company and sized at 5x2 cm2. The biodigesters were made up of penicillin-type flasks in
Avellar, J. G. M., Silva, G. A., Souza, R. R. O., Henrique, M. A., Cavalcanti, J. V. F. L., Almeida, Y. M. B., Fernandez, M. L. A. P., & Vinhas, G. M.
which 90 ml of sludge and three films were added. They were hermetically sealed with rubber lids and metal seals. To capture the produced gas, syringes (10 ml) were inserted through the rubber lids.
The mass variation of the films was quantified with an analytical balance (CELTAC, model FA-2104N), after being washed with distilled water and dried in a desiccator. The material’s surface was studied through Scanning Electron Microscopy (SEM) (model MIRA-3, Tescan Mira, with a high-brightness, high-vacuum FEG source).
Thermogravimetry analysis was carried out in the range of 30 to 600°C, with a heating rate of 10 °C/min (Mettler Toledo TGA 2 Star System). Differential Scanning Calorimetry was performed in the temperature range of 30 to 300 °C, with a heating rate of 10 °C/min, using the STARc software. The crystallinity index (Xc) was calculated based on the melting enthalpy (∆Hf), the mass fraction of PET in the film (f) and the theoretical enthalpy of 100% crystalline PET (∆Hf0), equivalent to 140 J/g[11], as shown in expression 1.
Where “C g” is the amount of carbon present in the gas produced, in grams, and “Ci” is the amount of carbon in the films.
3.1 Mass variation
Figure 1 shows the monthly mass variation of the films over a period of eighteen months.
Throughout the study, a constant loss of mass was not noticeable, but there was a slight tendency to increase mass, reaching up to around 2% of the film’s mass. The mass increase can be explained by the adherence of the material present in the sludge or by the formation of biofilms that became impregnated in the film. This adherence of microbial biomass to the film is the first stage of polymer biodegradation. At this point, enzymes are excreted and the process of biocatalysis begins in the polymer structure[12,13]
Zafiu et al.[14] and Selke et al.[15] also observed a small increase in mass when studying the degradation of PET and attributed this result mainly to the water absorption by the material and to surface impurities.
3.2
Fourier Transform Infrared Spectroscopy (FTIR) was carried out in the spectral range from 400 to 4000 cm-1, on the Perkin Elmer 400 FTIR equipment. The carbonyl, hydroxyl and ester indices were calculated by the ratio between the absorbances (Abs) of the respective peaks and the absorbance of the reference peak (C-H bond), as shown in expression 2.
Figure 2 shows the SEM images of the surface of the films before they were placed in the biodigesters, after 9 and 18 months of being immersed in the sludge.
PET film’s surface is smooth and relatively homogeneous (Figure 2a), while PET-ad film shows the presence of uniformly distributed particles (Figure 2d), which correspond to the prodegradant additive incorporated into the material. After nine months in contact with sludge, no significant changes were observed in the PET films (Figure 2b). It was not possible to identify the charges in the PET-ad films (Figure 2e), but the sludge slightly interacted with the surface, indicating a greater affinity with the sludge components.
2.3
Sludge samples were inoculated into appropriate culture media for each group of microorganisms (Heterotrophic Aerobic Bacteria, Acid-Producing Bacteria, Heterotrophic Anaerobic Bacteria and Sulfate-Reducing Bacteria) by successive dilutions. The culture media used were Nutrient Broth, Phenol Red Broth, Thioglycolate Fluid Medium, and Modified Postgate E, respectively. Identification and quantification were carried out using the color change and medium’s turbidity, and the Most Probable Number method.
2.4 Biogas production
The resulting gas was analyzed via gas chromatography (Hewlett Packard 5890) at a temperature of 90 ºC. Nitrogen gas was used as a mobile phase and Porapak-N column (solid phase thickness between 50 and 60 mesh), with thermal conductivity detectors. Biodegradation was assessed according to ASTM D5511, from expression 3, considering methane and carbon dioxide gases. The peaks were obtained using the N2000 software.
This suggests that the additive was consumed, facilitating contact between the film and the microorganisms present in the environment. At the end of eighteen months, there were few sludge components on the surface of the PET film’s (Figure 2c), while a large amount of matter covered
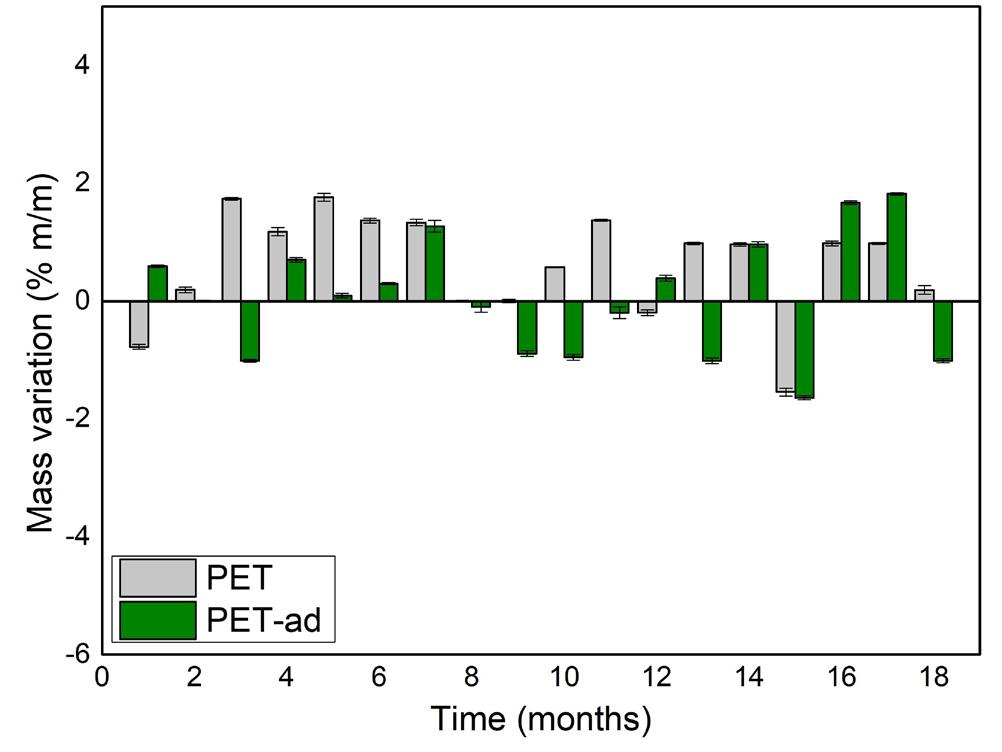
Assessment of modified poly(ethylene terephthalate) films under anaerobic conditions
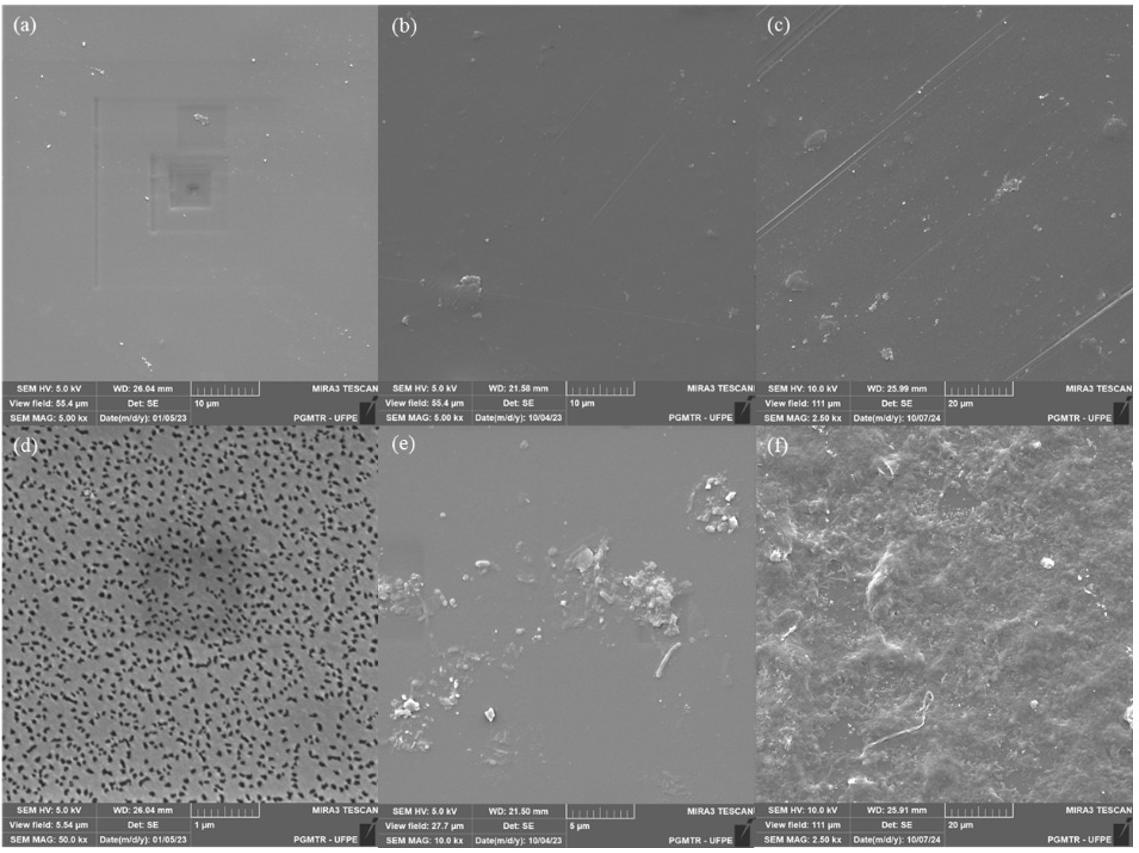
the surface of the PET-ad film’s (Figure 2f), which made it appearance rough and heterogeneous.
Maheswaran et al.[16] studied the interactions of some microorganisms of the Sarcina, Bacillus and Aspergillus genera with PET films. They observed more relevant signs of degradation, such as rough surfaces, holes, pores, surface erosion and cracks. Regarding microorganisms, the surface images in both cases are similar to those obtained in the present work, indicating a possible adhesion of microorganisms to the films[17]
Other authors have also evaluated microorganism colonization, especially bacteria, on polymer surfaces. The images were similar to the results obtained in this study[18-22] Therefore, it can be inferred that the additive facilitated the incorporation of substances from the sludge and, consequently, microorganisms onto the surface of the films, thus, accelerating the beginning of the biodegradation process[17-19,21]
The mass variation under heating is illustrated in Figure 3, which shows similar curves between the initial and final samples in both cases, indicating the slow degradation of the polymers. Comparing the curves for PET and PET-ad, the equipment detected an increase in mass - of around 9% - before the degradation peak, in the PET-ad films
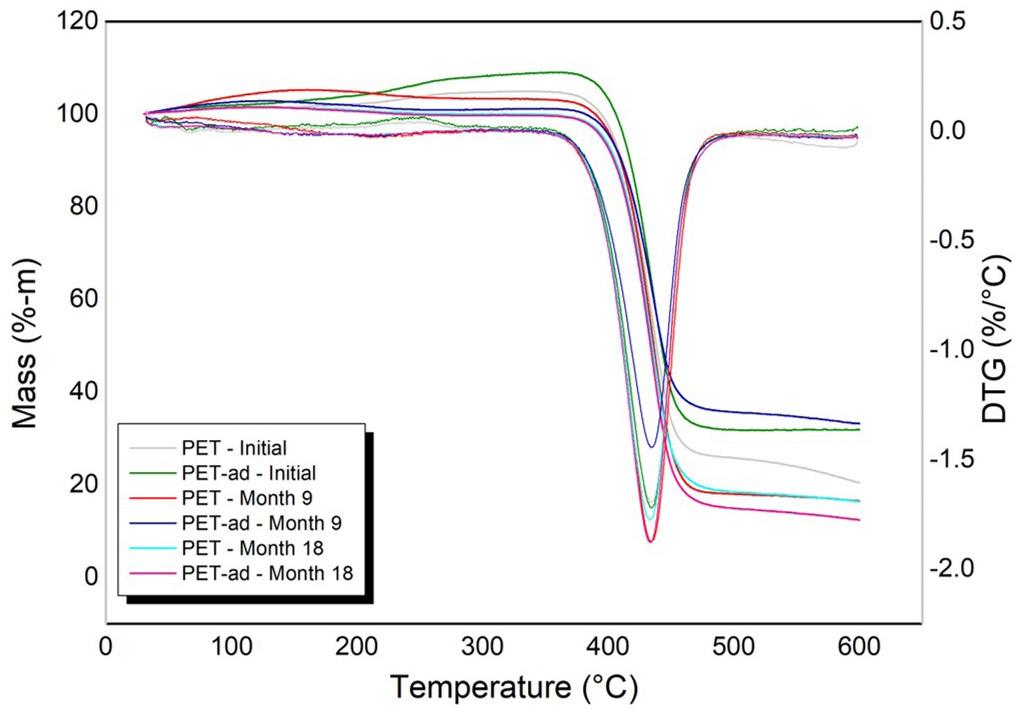
before being put into the biodigester; in nine months, a 5% increase in mass was detected; and finally, at eighteen months, there was a 1% mass increase. This phenomenon provides information on the action mechanism of the additive present in the PET-ad formulation. Among the compounds used to promote biodegradation, it is worth highlighting chemo-taxis pro-degradants, which are capable of attracting microorganisms to the inside of the films by providing substrate. Additionally, they can expand the structure of
J. G. M., Silva, G. A., Souza, R. R. O., Henrique, M. A., Cavalcanti, J. V. F. L., Almeida, Y. M. B., Fernandez, M. L.
the polymer to facilitate the penetration of microorganisms and other components, thus accelerating the consumption of carbon chains. The decrease in mass gain during the tests could indicate the consumption of these additives in the biodigesters, as observed in the SEM analysis[2]
The loss of mass begins near the temperature of 400 ºC and, after a single stage, ends at 450 ºC, resulting in a single peak in the DTG curve. Thermal degradation of PET is initiated by the scission of the alkyl-oxygen bond, followed by successive scissions[23]. This thermal behavior, except for the mass increase, is in accordance with literature data, according to Santos et al.[24], Lima et al.[25] and Bannach et al.[26] .
During the start of the biodegradation process, there are no significant changes in TGA curves. In addition, the difficulty of consuming the polymer chains - especially the aromatic fraction - means that the generation of these compounds occurs gradually, minimizing the influence on the parameters of this analysis, such as the initial, final and highest degradation rate temperatures[27]. Recent literature about thermal analysis of virgin and residual polymers corroborates these results, considering the exposure time of residues to environmental conditions from months to a few years[28-30]
The heat flow curves as a function of temperature obtained by differential scanning calorimetry make it possible to determine the melting temperature, melting enthalpy, crystallization enthalpy, crystallinity and glass transition temperature are shown in Tables 1 and 2
For data processing purposes, the first heating – referring to the thermal history – was disregarded. In the cooling stage, there are exothermic crystallization peaks, where the crystalline domain was formed; in the second heating, there are subtle changes in the baselines (relating to glass transitions) and melting peaks, both of which are endothermic.
The results show that the thermal properties of PET and PET-ad were similar throughout the study. Therefore, there were no significant changes in the mobility of the carbon chains or in the intermolecular bonds of the polymers –additive or not – over time[31]
A. P., & Vinhas, G. M.
As discussed by Mróz et al.[32], evidence of changes in thermal properties would be indicated by a reduction in glass transition and melting temperatures, resulting from the decrease in the molecular mass. These modifications in thermal properties would be detected in more advanced stages of the biodegradation process. In addition, an increase in crystallinity is expected, due to degradation being initiated by the amorphous domain – as it is a more accessible region[32,33] .
Figure 4 shows the films’ spectrums, indicating the samples’ main absorption bands.
Both samples’ spectrums are similar, due to the low concentration of the additive incorporated. The characteristic absorption bands of PET can be seen: around 1720 cm-1 corresponds to the stretching of the carboxylic group -C=O, at 1240 cm-1 is the ester group stretching O=C-O-, 1100 cm-1 indicates the torsion angle of the ester group and 720 cm-1 is related to the out-of-plane C-H bond (Figure 4)[34 35]
Regarding the intensities of the C-H band at a wavelength of 1470 cm-1, it was possible to evaluate the changes in the most relevant groups in the biodegradation process, according
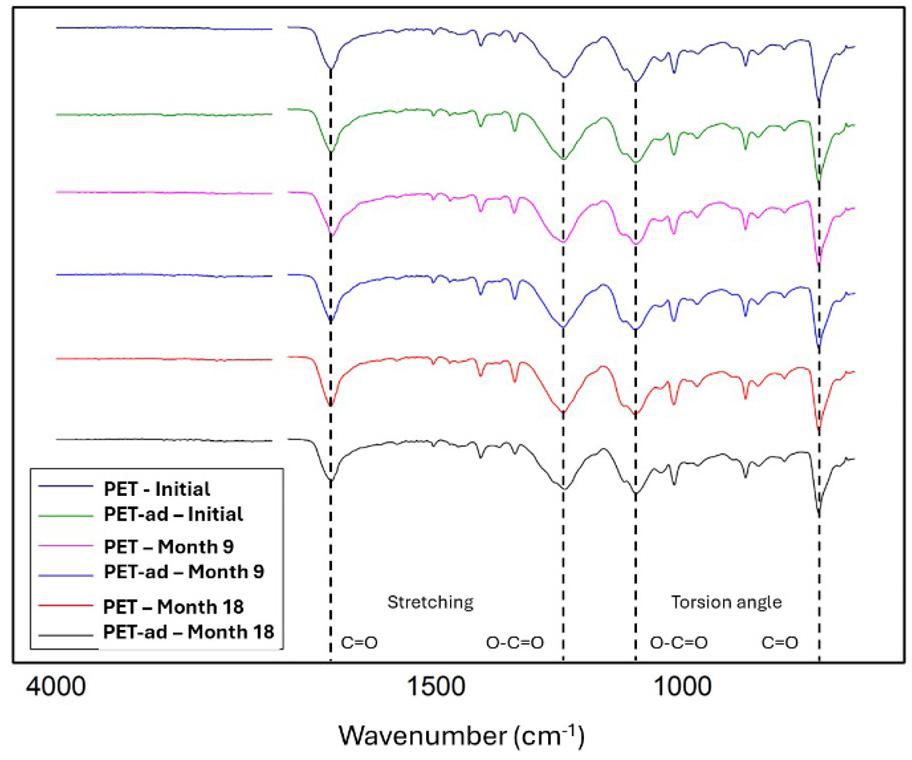
Tf: Melting temperature, ΔHf: melting enthalpy, ΔHc: crystallization enthalpy, Xc: crystallinity and Tg: glass transition temperature.
Assessment of modified poly(ethylene terephthalate) films under anaerobic conditions
to expression 2. In later stages of degradation, it is expected that there will be a reduction in the intensity of the ester group, given that the enzymes excreted by the microorganisms break this bond, forming carbonyl and hydroxyl groups[36] As can be seen in Figure 5 (a) and 5 (b), the carbonyl and ester functional groups occur in greater quantity, given their presence in the PET repetition structure, while the hydroxyl group comes from eventual terminal hydroxyls. Also, the relative intensities of these groups were similar between the PET and PET-ad films; there was a slight increase in the amount of ester and carbonyl groups and a maintenance of the few hydroxyl groups present in the films. However, there was a wider standard deviation between the calculated indices, which corresponds to the greater diversity of compounds from the sludge that are present on the films’ surface[16,36] .
Torena, Alvarez-Cuenca and Reza (2019) evaluated the PET biodegradation in sludge. In the FTIR spectrum, they found that there were small band shifts and intensity variations; the carbonyl index increased, which was caused both by the formation of terminal carbonyls after breaking ester bonds and by products from oxidation reactions[37-40]. Ioakeimidis et al.[41] concluded that the degradation rate slowed down after the disappearance of the ester functional group, given that this group is one of the primary targets of the action of enzymes excreted by
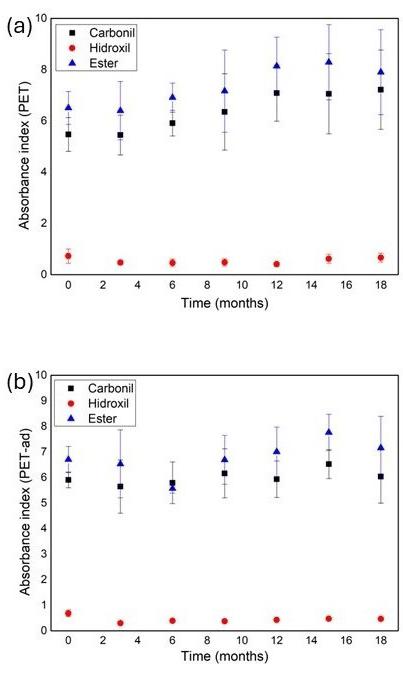
microorganisms. The remaining aromatic groups remained unchanged[41]. In addition, principal component analysis (PCA) was carried out as a statistical test, but it was not possible to see any significant group separation. This corroborates the reported non-distinction in the values of the above-mentioned indices.
Figures 6 and 7 illustrate the behavior of the microorganism groups that are present in the sludge and have an influence on the film’s biodegradation.
Comparing the three systems, similar behaviors can be seen in the evolution of the microbial groups analyzed. The groups that require oxygen for growth (Heterotrophic Aerobic Bacteria and Acid-producers) showed a decline shortly after the start of the study, while the Heterotrophic Anaerobic Bacteria reached the peak of the exponential growth phase in the second month, due to the predominance of the anaerobic regime and the decrease in the other groups, which reduced competition for the substrates.
The Heterotrophic Aerobic Bacteria reached a growth peak of around 1023 MPN/ml, while the anaerobic group reached 109 MPN/ml, reflecting the lower efficiency of substrate consumption in the absence of oxygen and, consequently,
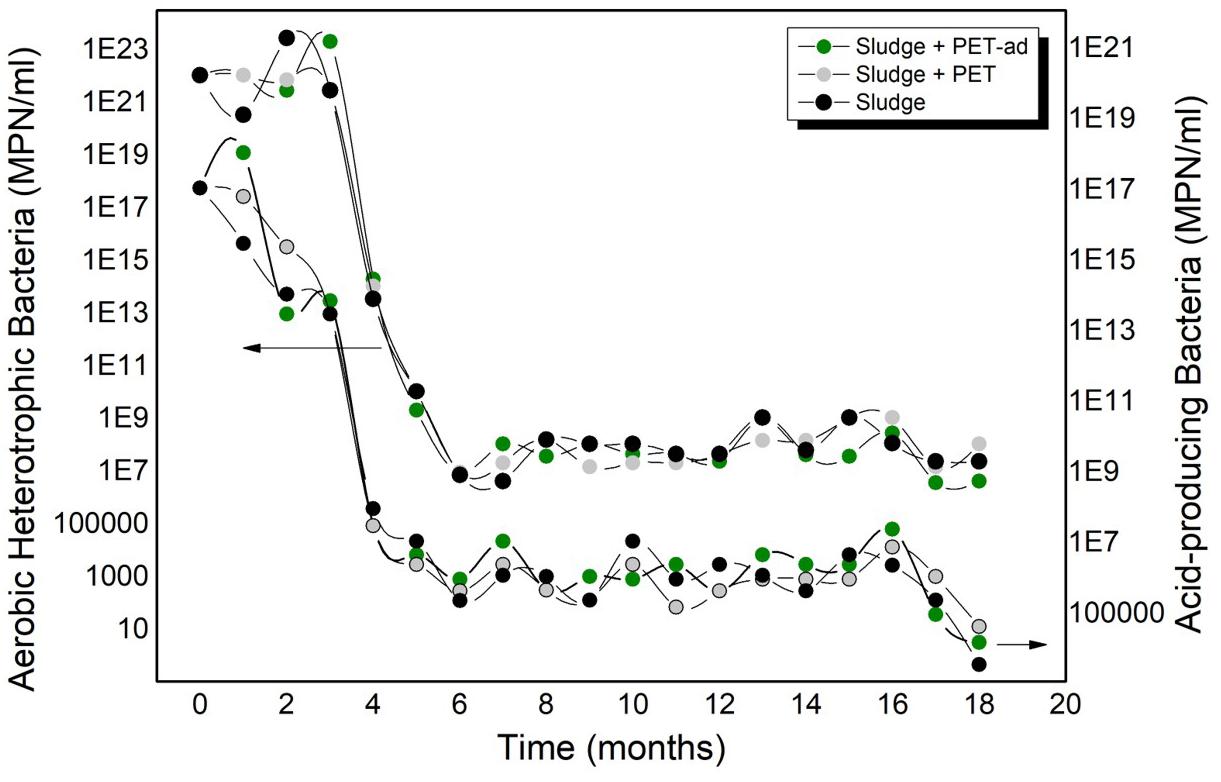
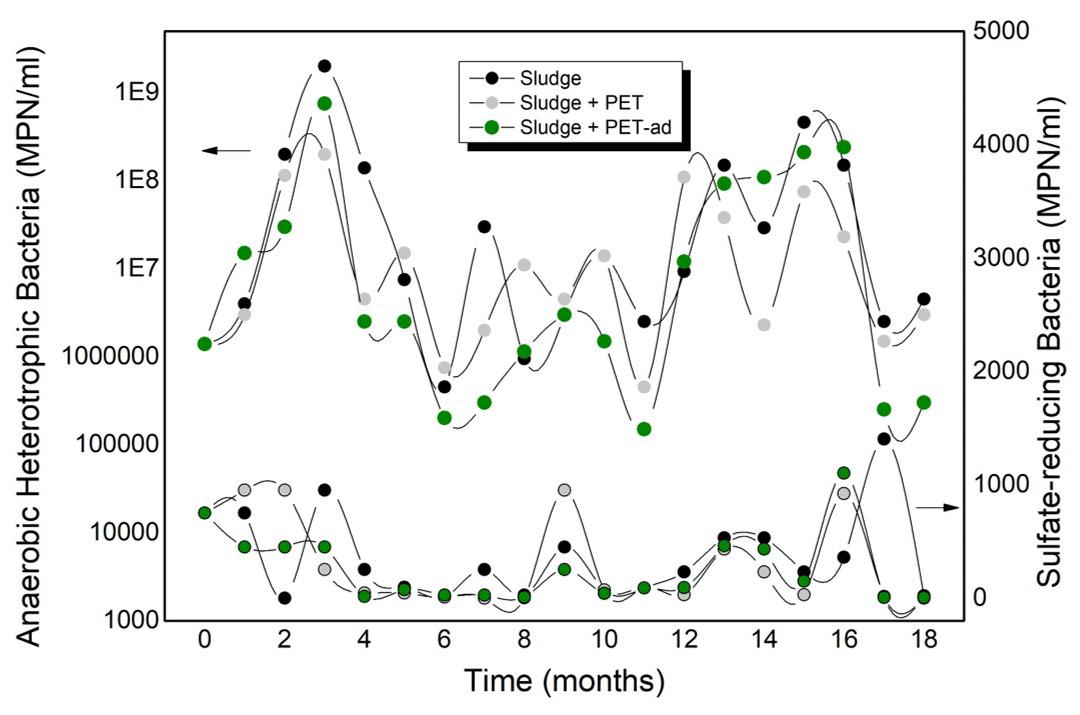
J. G. M., Silva, G. A., Souza, R. R. O., Henrique, M. A., Cavalcanti, J. V. F. L., Almeida, Y. M. B., Fernandez, M.
L. A. P., & Vinhas, G. M.
slower biodegradation. At the end of the 18 months, the aerobic group’s population reached 107 MPN/ml and the anaerobic groups remained stable between 107 and 106 MPN/ml.
The low order of magnitude for Sulphate Reducing Bacteria (103 MPN/ml to close to zero) is desirable, since sulphur compounds - hydrogen sulphide and volatile fatty acids - have a negative impact on microorganism growth, especially acetogenic and methanogenic microorganisms, which are fundamental for methane gas production. The logic for Acid-Producing Bacteria is equivalent, since a low pH will slow down the growth of microorganisms. The order of magnitude of this group ranged from 1017 to105 MPN/ml[42,43]
Torena et al.[37] evaluated PET biodegradation in activated sludge. They concluded that bacterias were able to consume the amorphous phase of the material[37]. Studies with ideal and controlled conditions to optimize microbial growth are important to quantify the biodegradation capacity of the microorganisms in question. However, materials are not usually disposed of under such conditions and there are other sources of nutrients that are more available than polymer chains, which further delays the consumption of PET and other thermoplastics[37,44,45]
Despite the eighteen months of anaerobic regime, aerobic microorganisms, when subjected to favorable conditions, were able to develop, reaching significant concentrations. Anaerobic groups remained at relevant concentrations. Therefore, potentially PET-degrading microorganisms can persist even when temporarily subjected to adverse situations[46]
The sludge initially has a significant number of microorganisms in it, which are responsible for biogas production. As the systems were not continuously fed, the number of microorganisms was reduced over time, as shown in Figures 8 and 9. Methane gas production peaked in the first month of the study, reaching an average of 45% (v/v) of the biogas, while carbon dioxide gas started to decline after the second month (at an average of 25% (v/v)).
In the end, the total amount of methane in the “Sludge”, “Sludge + PET” and “Sludge + PET-ad” systems were 128.86, 101.96 and 100.36 mmol, respectively, while the amount of carbon dioxide was 215.83, 184.30 and 156.36 mmol, respectively. This oscillation in biogas production between the systems is expected, considering the heterogeneity of the sludge[46]
According to the ASTM D5511 standard, it was possible to quantify biodegradation using the ratio of the carbon in the polymer chains and the carbon present in the biogas (methane or carbon dioxide), according to expression 3. Figure 10 shows the percentage of biodegradation over eighteen months. Theoretically, 100% biodegradation would be equivalent to 2.655 mmol of methane gas and carbon dioxide produced, which represents less than a fifth of the biogas generated in the first month analyzed. Therefore, considering the low rate of consumption of the polymer as well as the small mass of the films, it is difficult to accurately quantify their conversion into biogas in the
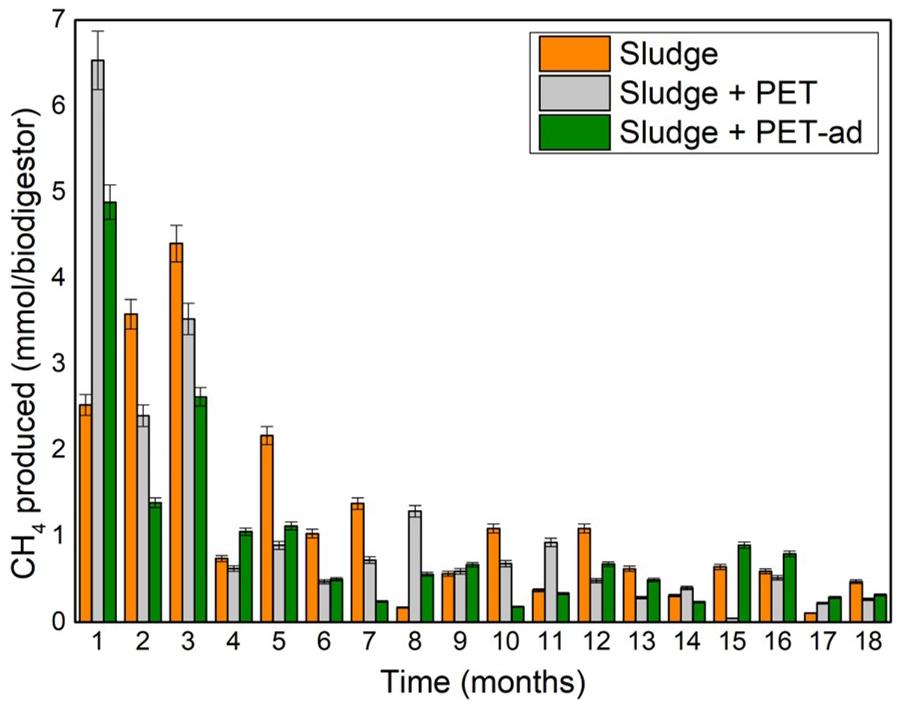
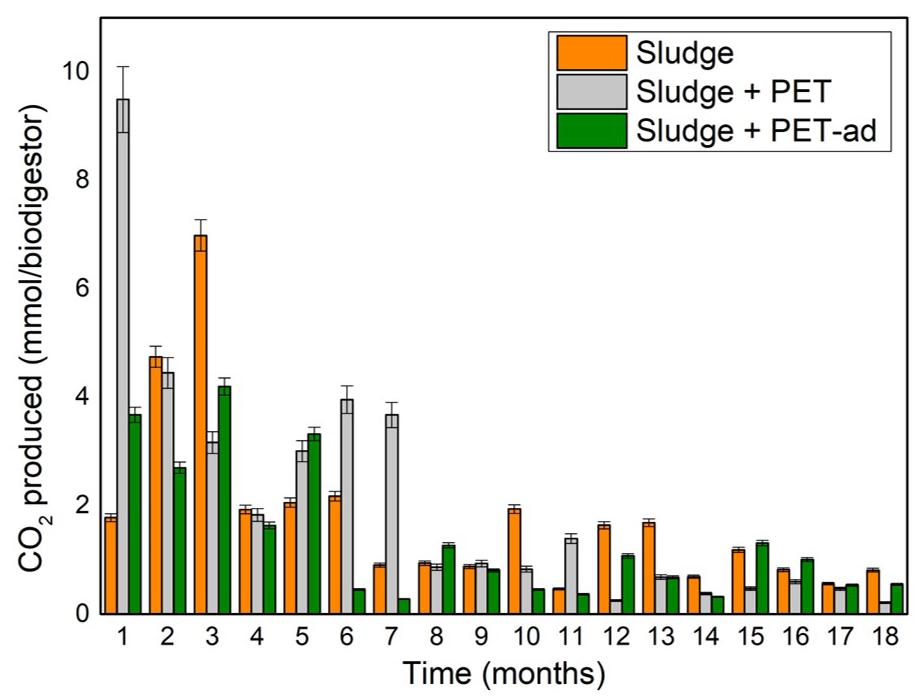
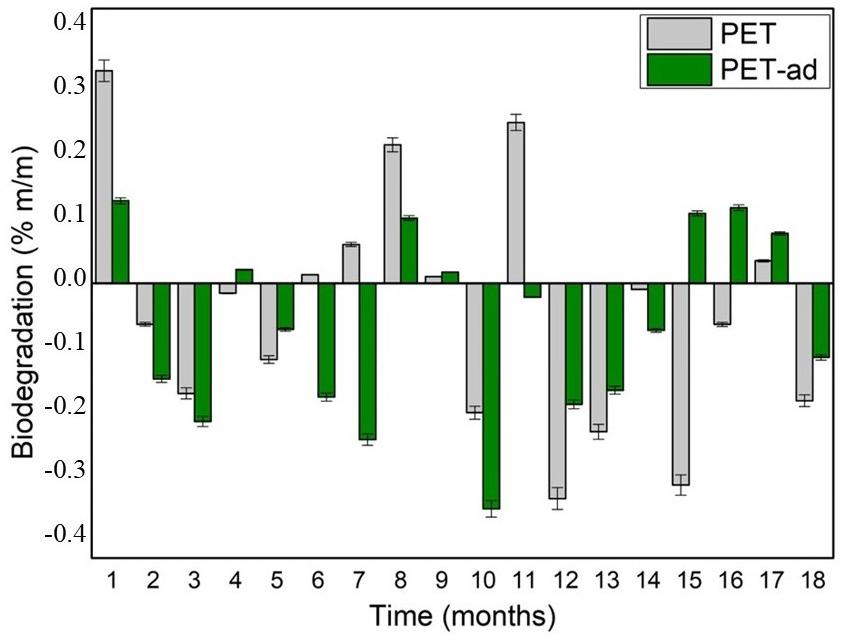
initial months, given the high production of these gases that are inherent to the sludge[46-48]
The results obtained are in accordance with what is expected in the literature. As an example, Cremonez et al.[46]
Assessment of modified poly(ethylene terephthalate) films under anaerobic conditions
studied methane gas production in systems containing sludge and found a peak in CH4 production after two weeks, reaching values close to 50% (v/v), during the 20-day analysis period. These results are associated only with the activity of the microorganisms present in the sludge, since no polymers were present in that research[46]
The incorporation of the pro-degradant additive into the PET films did not lead to carbon chains breaking over eighteen months under anaerobic conditions, but it was possible to observe the presence of microorganisms and sludge components on the surface, which is a possible start to the process. Since thermal properties have not changed, the biodegradation process still is in its early stages. The quantification of degradation from biogas is more relevant when the production of biogas from biodegradation is considerably higher than the production inherent in the sludge. Finally, considering that the half-life of PET reaches hundreds of years under certain conditions, it is possible that the additive may promote a noticeable reduction in decomposition time in the medium or long term, as it promotes a faster initiation of this process.
• Conceptualization – Glória Maria Vinhas; Maria de Los Angeles Perez Fernandez; João Gabriel Machado de Avellar; Yeda Medeiros Bastos de Almeida.
• Data curation – João Gabriel Machado de Avellar; Renan Rogério Oliveira de Souza.
• Formal analysis – João Gabriel Machado de Avellar; Gisely Alves da Silva; Renan Rogério Oliveira de Souza.
• Funding acquisition – Glória Maria Vinhas; Maria de Los Angeles Perez Fernandez.
• Investigation – João Gabriel Machado de Avellar; Renan Rogério Oliveira de Souza.
• Methodology – Glória Maria Vinhas; Maria de Los Angeles Perez Fernandez.
• Project administration – Glória Maria Vinhas; Maria de Los Angeles Perez Fernandez.
• Resources – Glória Maria Vinhas; Jorge Vinicius Fernandes Lima Cavalcanti; Mariana Alves Henrique.
• Software – NA.
• Supervision – Glória Maria Vinhas; Maria de Los Angeles Perez Fernandez; Gisely Alves da Silva.
• Validation – João Gabriel Machado de Avellar; Gisely Alves da Silva.
• Visualization – João Gabriel Machado de Avellar; Glória Maria Vinhas; Maria de Los Angeles Perez Fernandez.
• Writing – original draft – João Gabriel Machado de Avellar; Glória Maria Vinhas.
• Writing – review & editing – João Gabriel Machado de Avellar; Glória Maria Vinhas; Maria de Los Angeles Perez Fernandez; Yeda Medeiros Bastos de Almeida.
The authors would like to express their gratitude to the Postgraduate Program in Materials Science, the Petroleum and Energy Research Institute and the Chemical Engineering Department of the Federal University of Pernambuco for their support in carrying out the activities, to the company for providing the material and to Conselho Nacional de Desenvolvimento Científico e Tecnológico for its financial support.
1 Canevaloro, S. V., Jr. (2006). Ciência dos Polímeros São Paulo: Artliber
2 Kushwaha, A., Goswami, L., Singhvi, M., & Kim, B. S. (2023). Biodegradation of poly(ethylene terephthalate): mechanistic insights, advances, and future innovative strategies. Chemical Engineering Journal, 457, 141230 http://doi.org/10.1016/j. cej.2022.141230
3 Benyathiar, P., Kumar, P., Carpenter, G., Brace, J., & Mishra, D. K. (2022). Polyethylene Terephthalate (PET) bottle-to-bottle recycling for the beverage industry: a review. Polymers, 14(12), 2366. http://doi.org/10.3390/polym14122366. PMid:35745942.
4 Kim, N.-K., Lee, S.-H., & Park, H.-D. (2022). Current biotechnologies on depolymerization of polyethylene terephthalate (PET) and repolymerization of reclaimed monomers from PET for bio-upcycling: a critical review. Bioresource Technology, 363, 127931 http://doi.org/10.1016/j.biortech.2022.127931 PMid:36100185.
5 Janczak, K., Dąbrowska, G. B., Raszkowska-Kaczor, A., Kaczor, D., Hrynkiewicz, K., & Richert, A. (2020). Biodegradation of the plastics PLA and PET in cultivated soil with the participation of microorganisms and plants. International Biodeterioration & Biodegradation, 155, 105087. http://doi.org/10.1016/j. ibiod.2020.105087
6 Sang, T., Wallis, C. J., Hill, G., & Britovsek, G. J. P. (2020). Polyethylene terephthalate degradation under natural and accelerated weathering conditions. European Polymer Journal, 136, 109873 http://doi.org/10.1016/j.eurpolymj.2020.109873
7 Webb, H., Arnott, J., Crawford, R. J., & Ivanova, E. P. (2012). Plastic degradation and its environmental implications with special reference to poly(ethylene terephthalate). Polymers, 5(1), 1-18 http://doi.org/10.3390/polym5010001
8 Nisticò, R. (2020). Polyethylene terephthalate (PET) in the packaging industry. Polymer Testing, 90, 106707. http://doi. org/10.1016/j.polymertesting.2020.106707
9 Mohanan, N., Montazer, Z., Sharma, P. K., & Levin, D. B. (2020). Microbial and enzymatic degradation of synthetic plastics. Frontiers in Microbiology, 11, 580709 http://doi. org/10.3389/fmicb.2020.580709 PMid:33324366.
10 Rabello, M. (2000). Aditivação de Polímeros São Paulo: Artliber
11 Gaonkar, A. A., Murudkar, V. V., & Deshpande, V. D. (2020). Comparison of crystallization kinetics of polyethylene terephthalate (PET) and reorganized PET. Thermochimica Acta, 683, 178472 http://doi.org/10.1016/j.tca.2019.178472
12 Ruggero, F., Gori, R., & Lubello, C. (2019). Methodologies to assess biodegradation of bioplastics during aerobic composting and anaerobic digestion: a review. Waste Management & Research, 37(10), 959-975 http://doi.org/10.1177/0734242X19854127 PMid:31218932.
13 Djapovic, M., Milivojevic, D., Ilic-Tomic, T., Lješević, M., Nikolaivits, E., Topakas, E., Maslak, V., & Nikodinovic-Runic, J. (2021). Synthesis and characterization of polyethylene
Avellar, J. G. M., Silva, G. A., Souza, R. R. O., Henrique, M. A., Cavalcanti, J. V. F. L., Almeida, Y. M. B., Fernandez, M. L. A. P., & Vinhas, G. M.
terephthalate (PET) precursors and potential degradation products: toxicity study and application in discovery of novel PETases. Chemosphere, 275, 130005 http://doi.org/10.1016/j. chemosphere.2021.130005 PMid:33640747.
14 Zafiu, C., Binner, E., Höck, L., Świechowski, K., & HuberHumer, M. (2023). Study on the degradability of plastics with prodegradant additives during anaerobic and aerobic biological waste treatment processes. Journal of Material Cycles and Waste Management, 25(6), 3545-3556 http://doi.org/10.1007/ s10163-023-01777-7
15. Selke, S., Auras, R., Nguyen, T. A., Aguirre, E. C., Cheruvathur, R., & Liu, Y. (2015). Evaluation of biodegradation-promoting additives for plastics. Environmental Science & Technology, 49(6), 3769-3777 http://doi.org/10.1021/es504258u PMid:25723056.
16 Maheswaran, B., Al-Ansari, M., Al-Humaid, L., Raj, J. S., Kim, W., Karmegam, N., & Rafi, K. M. (2023). In vivo degradation of polyethylene terephthalate using microbial isolates from plastic polluted environment. Chemosphere, 310, 136757 http:// doi.org/10.1016/j.chemosphere.2022.136757 PMid:36228720.
17 Wolf, P., Reimer, M., Maier, M., & Zollfrank, C. (2023). Biodegradation of polysaccharides, polyesters and proteins in soil based on the determination of produced carbon dioxide. Polymer Degradation & Stability, 217, 11053 http://doi. org/10.1016/j.polymdegradstab.2023.110538
18 Bonhomme, S., Cuer, A., Delort, A.-M., Lemaire, J., Sancelme, M., & Scott, G. (2003). Environmental biodegradation of polyethylene. Polymer Degradation & Stability, 81(3), 441452 http://doi.org/10.1016/S0141-3910(03)00129-0
19. Hakkarainen, M., Karlsson, S., & Albertsson, A.-C. (2000). Rapid (bio)degradation of polylactide by mixed culture of compost microorganisms: low molecular weight products and matrix changes. Polymer, 41(7), 2331-2338. http://doi. org/10.1016/S0032-3861(99)00393-6.
20 Brdlík, P., Borůvka, M., Běhálek, L., & Lenfeld, P. (2021). Biodegradation of poly(Lactic Acid) biocomposites under controlled composting conditions and freshwater biotope. Polymers, 13(4), 594 http://doi.org/10.3390/polym13040594 PMid:33669420.
21 Nowak, B., Pająk, J., Drozd-Bratkowicz, M., & Rymarz, G. (2011). Microorganisms participating in the biodegradation of modified polyethylene films in different soils under laboratory conditions. International Biodeterioration & Biodegradation, 65(6), 757-767 http://doi.org/10.1016/j.ibiod.2011.04.007
22 Dong, H., Wang, X., Lu, S., Ma, Y., Song, C., Wang, S., & Liu, H. (2023). Microbial fuel cell-based biosensor for monitoring anaerobic biodegradation of poly(3-hydroxybutyrate-co-4hydroxybutyrate). Polymer Degradation & Stability, 214, 110409 http://doi.org/10.1016/j.polymdegradstab.2023.110409
23 Ray, S., & Cooney, R. P. (2018). Thermal degradation of polymer and polymer composites. In M. Kutz (Ed.), Handbook of environmental degradation of materials (pp. 185-206). Amsterdam: Elsevier Inc. doi:http://doi.org/10.1016/B9780-323-52472-8.00009-5.
24 Santos, R. M., Costa, A. R. M., Almeida, Y. M. B., Carvalho, L. H., Delgado, J. M. P. Q., Lima, E. S., Magalhães, H. L. F., Gomez, R. S., Leite, B. E., Rolim, F. D., Figueiredo, M. J., & Lima, A. G. B. (2022). Thermal and rheological characterization of recycled PET/Virgin HDPE blend compatibilized with PEg-MA and an epoxy chain extender. Polymers, 14(6), 1144 http://doi.org/10.3390/polym14061144 PMid:35335475.
25 Lima, J. C., Costa, A. R. M., Sousa, J. C., Arruda, S. A., & Almeida, Y. M. B. (2020). Thermal behavior of polyethylene terephthalate/organoclay nanocomposites: investigating copolymers as matrices. Polymer Composites, 42(2), 849-864 http://doi.org/10.1002/pc.25870
26 Bannach, G., Perpétuo, G. L., Cavalheiro, É. T. G., Cavalheiro, C. C. S., & Rocha, R. R. (2011). Efeitos da história térmica nas propriedades do polímero pet: um experimento para ensino de análise térmica. Quimica Nova, 34(10), 1825-1829 http:// doi.org/10.1590/S0100-40422011001000016
27 Tuffi, R., D’Abramo, S., Cafiero, L. M., Trinca, E., & Ciprioti, S. V. (2018). Thermal behavior and pyrolytic degradation kinetics of polymeric mixtures from waste packaging plastics. Express Polymer Letters, 12(1), 82-99 http://doi.org/10.3144/ expresspolymlett.2018.7
28. Singh, R. K., Ruj, B., Sadhukhan, A. K., & Gupta, P. (2019). A TG-FTIR investigation on the co-pyrolysis of the waste HDPE, PP, PS and PET under high heating conditions. Journal of the Energy Institute, 93(3), 1020-1035 http://doi.org/10.1016/j. joei.2019.09.003
29 Chowdhury, T., & Wang, Q. (2023). Study on thermal degradation processes of polyethylene terephthalate microplastics using the kinetics and artificial neural networks models. Processes, 11(2), 496 http://doi.org/10.3390/pr11020496
30 Belioka, M. P., Siddiqui, M. N., Redhwi, H. H., & Achilias, D. S. (2023). Thermal degradation kinetics of recycled biodegradable and non-biodegradable polymer blends either neat or in the presence of nanoparticles using the random chain-scission model. Thermochimica Acta, 726, 179542 http://doi.org/10.1016/j.tca.2023.179542
31 Karimpour-Motlagh, N., Khonakdar, H. A., Jafari, S. M. A., Mahjub, A., Panahi-Sarmad, M., Kasbi, S. F., Shojaei, S., Goodarzi, V., & Arjmand, M. (2020). Influence of polypropylene and nanoclay on thermal and thermo-oxidative degradation of poly(lactide acid): TG-FTIR, TG-DSC studies and kinetic analysis. Thermochimica Acta, 691, 178709 http://doi. org/10.1016/j.tca.2020.178709
32. Mróz, P., Białas, S., Mucha, M., & Kaczmarek, H. (2013). Thermogravimetric and DSC testing of poly(lactic acid) nanocomposites. Thermochimica Acta, 573, 186-192 http:// doi.org/10.1016/j.tca.2013.09.012
33 Bandini, F., Frache, A., Ferrarini, A., Taskin, E., Cocconcelli, P. S., & Puglisi, E. (2020). Fate of biodegradable polymers under industrial conditions for anaerobic digestion and aerobic composting of food waste. Journal of Polymers and the Environment, 28(9), 2539-2550 http://doi.org/10.1007/ s10924-020-01791-y
34 Mecozzi, M., & Nisini, L. (2019). The differentiation of biodegradable and non-biodegradable polyethylene terephthalate (PET) samples by FTIR spectroscopy: A potential support for the structural differentiation of PET in environmental analysis. Infrared Physics & Technology, 101, 119-126 http:// doi.org/10.1016/j.infrared.2019.06.008
35 Chen, Z., Hay, J. N., & Jenkins, M. J. (2012). FTIR spectroscopic analysis of poly(ethylene terephthalate) on crystallization. European Polymer Journal, 48(9), 1586-1610 http://doi. org/10.1016/j.eurpolymj.2012.06.006
36. Zhang, Y., Pedersen, J. N., Eser, B. E., & Guo, Z. (2022). Biodegradation of polyethylene and polystyrene: from microbial deterioration to enzyme discovery. Biotechnology Advances, 60, 107991 http://doi.org/10.1016/j.biotechadv.2022.107991 PMid:35654281.
37 Torena , P. , Alvarez‐Cuenca , M. , & Reza , M. ( 2021 ). Biodegradation of polyethylene terephthalate microplastics by bacterial communities from activated sludge. Canadian Journal of Chemical Engineering, 99(S1), S69-S82 http:// doi.org/10.1002/cjce.24015
38 Auta, H. S., Emenike, C. U., & Fauziah, S. H. (2017). Screening of Bacillus strains isolated from mangrove ecosystems in Peninsular Malaysia for microplastic degradation. Environmental
Assessment of modified poly(ethylene terephthalate) films under anaerobic conditions
Pollution, 231(Pt 2), 1552-1559 http://doi.org/10.1016/j. envpol.2017.09.043 PMid:28964604.
39 Skariyachan, S., Setlur, A. S., Naik, S. Y., Naik, A. A., Usharani, M., & Vasist, K. S. (2017). Enhanced biodegradation of low and high-density polyethylene by novel bacterial consortia formulated from plastic-contaminated cow dung under thermophilic conditions. Environmental Science and Pollution Research International, 24(9), 8443-8457 http:// doi.org/10.1007/s11356-017-8537-0 PMid:28188552.
40 Khatoon, N., Naz, I., Ali, M. I., Ali, N., Jamal, A., Hameed, A., & Ahmed, S. (2013). Bacterial succession and degradative changes by biofilm on plastic medium for wastewater treatment. Journal of Basic Microbiology, 54(7), 739-749 http://doi. org/10.1002/jobm.201300162 PMid:24115187.
41 Ioakeimidis, C., Fotopoulou, K. N., Karapanagioti, H. K., Geraga, M., Zeri, C., Papathanassiou, E., Galgani, F., & Papatheodorou, G. (2016). The degradation potential of PET bottles in the marine environment: an ATR-FTIR based approach. Scientific Reports, 6(1), 23501. http://doi.org/10.1038/srep23501. PMid:27000994.
42 Chinaglia, S., Esposito, E., Tosin, M., Pecchiari, M., & Innocenti, F. D. (2024). Biodegradation of plastics in soil: the effect of water content. Polymer Degradation & Stability, 222, 110691 http://doi.org/10.1016/j.polymdegradstab.2024.110691
43 Szymanski, M. S. E., Balbinot, R., & Schirmer, W. N. (2010). Biodigestão anaeróbia da vinhaça: aproveitamento energético do biogás e obtenção de créditos de carbono – estudo de caso. Semina: Ciências Agrárias, 31(4), 901-912 http://doi. org/10.5433/1679-0359.2010v31n4p901
44 Battista, F., Frison, N., & Bolzonella, D. (2021). Can bioplastics be treated in conventional anaerobic digesters for food waste
treatment? Environmental Technology & Innovation, 22, 101393 http://doi.org/10.1016/j.eti.2021.101393
45 Ahmed, T., Shahid, M., Azeem, F., Rasul, I., Shah, A. A., Noman , M. , Hameed, A. , Manzoor, N. , Manzoor, I. , & Muhammad, S. (2018). Biodegradation of plastics: current scenario and future prospects for environmental safety. Environmental Science and Pollution Research International, 25(8), 7287-7298 http://doi.org/10.1007/s11356-018-1234-9 PMid:29332271.
46. Cremonez, P. A., Sampaio, S. C., Teleken, J. G., Meier, T. W., Frigo, E. P., Rossi, E., Silva, E., & Rosa, D. M. (2020). Effect of substrate concentrations on methane and hydrogen biogas production by anaerobic digestion of a cassava starch-based polymer. Industrial Crops and Products, 151, 112471 http:// doi.org/10.1016/j.indcrop.2020.112471
47 Caporgno, M. P., Trobajo, R., Caiola, N., Ibáñez, C., Fabregat, A., & Bengoa, C. (2015). Biogas production from sewage sludge and microalgae co-digestion under mesophilic and thermophilic conditions. Renewable Energy, 75, 374-380 http://doi.org/10.1016/j.renene.2014.10.019
48. Benhami, V. M. L., Longatti, S. M. O., Moreira, F. M. S., & Sena, A. R., No. (2024). Biodegradation of poly(lactic acid) waste from 3D printing. Polímeros: Ciência e Tecnologia, 34(2), e20240013 http://doi.org/10.1590/0104-1428.20230058
Received: Nov. 25, 2024
Revised: Mar. 08, 2025
Accepted: Apr. 04, 2025
Associate Editor: Artur J. M. Valente
Maria
Thalita Siqueira de Medeiros1 , Thaíses Lima1 , Patricia Araújo2 and Elmo Silvano de Araújo1*
1Laboratório de Polímeros e Nanoestruturas, Departamento de Energia Nuclear, Universidade Federal de Pernambuco – UFPE, Recife, PE, Brasil
2Departamento de Engenharia Biomédica, Universidade Federal de Pernambuco – UFPE, Recife, PE, Brasil
*elmo.araujo@ufpe.br
Obstract
Polymer materials (plastics and elastomers) are widely used in applications involving ionizing radiation environmental exposure. Such rush in service conditions might promote significant material degradation. Here, we investigated gamma irradiation effects on poly(ethylene-co-vinyl acetate) (EVA) (25 and 40 wt% vinyl acetate - VA) in the dose range of 5 – 30 kGy. This range is suitable for applications in food preservation and matches expected absorbed doses for nuclear power plants electrical cables and wires. EVA copolymers with 40 or 25 wt% VA predominantly underwent crosslinking effects promoted by gamma irradiation at dose of 10 kGy. Additional irradiation of EVA (25% VA) up to 30 kGy did not promote further alterations. Refractive index or thermal degradation under nitrogen atmosphere remained practically unaltered after gamma irradiation. Our findings suggest that EVA is a suitable material for irradiated food packaging films, and in electrical cable jacketing materials exposed to gamma radiation.
Keywords: EVA, gamma radiation, thermal analysis, FTIR, refractive index.
Data Ovailability: Research data is available upon request from the corresponding author.
How to cite: Medeiros, M. T. S., Lima, T., Araújo, P., & Araújo, E. S. (2025). Gamma-irradiation effects on poly(ethyleneco-vinyl acetate) (EVA). Polímeros: Ciência e Tecnologia, 35(3), e20250028. https://doi.org/10.1590/0104-1428.20240118
Polymer materials (plastics and elastomers) are widely used in applications involving ionizing radiation environmental exposure (gamma, electron beam, etc.)[1] Polymer material irradiation might significantly promote changes in their physicochemical and mechanical properties[2] The interaction of the radiation with polymer structure is a complex and random process, which results in formation of ionizing and excited molecules. Free radicals produced by these processes might modify physical properties of the material. In high-energy radiation environments, polymer materials should withstand ionizing radiation for long time and yet, retaining important features, such as strength, extensibility, degradation stability, dimensional stability, electrical insulation, etc[3-5]
Poly(ethylene-co-vinyl acetate) (EVA) has a broad range of industrial applications[6]. EVA is a copolymer made up of polyethylene and poly(vinyl acetate) segments. The random incorporation of the vinyl acetate (VA) units in EVA progressively hinders the ability of the polymer to crystallize, thus, in a vinyl acetate level of 50 wt% EVA copolymers are amorphous materials[6]. In fact, all properties of EVA are strongly influenced by the percentage of VA. EVA has been widely used as a material of the high-barrier family due to its low permeability to gases and organic vapors[7]. EVA is used in
green-houses covering films[8], food packaging applications[9] , controlled drug release[10], electrical cable jacketing materials[11] , among other applications. Some EVA industrial applications can result in exposition to ionizing irradiation, such as in packages of food irradiated for preservation[9], or in electrical cable jacketing used in nuclear power plants (NPPs)[11]. In general, EVA is eligible for uses in ionizing radiation environments up to absorbed dose of 100 kGy without significant alterations in its physical properties[1,12]
In this work, we investigated radiolytic effects on EVA (25 and 40 wt% VA). The samples were gamma irradiated in dose range of 5 – 30 kGy. This range is suitable for applications in food preservation and matches expected absorbed doses for NNPs electrical cables and wires. Also, EVA was gamma irradiated in higher doses of 500 and 1000 kGy in order to investigate the influence of the irradiation on oxidative process at thermal properties.
2.1 Material
In this work were used poly(ethylene-co-vinyl acetate) (EVA) commercial (analytical grade, Sigma Aldrich, 40 wt% VA; average-number molar mass, Mn, of ~18 kg/
Medeiros, M. T. S., Lima, T., Araújo, P., & Araújo, E. S.
mol; average-weight molar mass, Mw, of ~ 62 kg/mol, and density of ~ 0.965 g/mL (EVA40), or 25 wt% VA; Mn ~ 17 kg/mol, and density of ~ 0.948 g/mL (EVA25). EVA films (~ 0.1 mm in thickness) were solvent cast in concentration of 0.1 g/mL using methyl ethyl ketone (MEK, analytical grade Merk) as solvent, by slow evaporation in air at room temperature.
The samples were gamma irradiated by using a non-attenuated Co-60 source (Gammacell GC220 Excel irradiator - MDS Nordion, Canada). Irradiation doses were of 5, 10, 15, 20, 30, 500 and 1000 kGy in air, dose rate of ~ 2.96 kGy/h (dose rate uncertainty = 0.018x10⁻⁶ kGy/h, with k = 1 coverage factor) at room temperature (~ 300 K).
2.3 Viscosity-average molecular mass (Mv) determination
Samples viscosity was calculated from the relative viscosity (ηrel = ν/ν0 ~ t/t0), where ν and ν0 are the cinematic viscosities of the polymer solution and the solvent, respectively, and t and t0 are the solution and solvent tetrahydrofuran (THF) flow times, respectively, which result in the cinematic viscosity measurement. These measurements were carried out with an Ostwald-type capillary (75 mm) viscometer immersed in a thermal bath at 20.0 ± 0.1 °C. After obtaining the relative viscosity, the specific viscosity (ηsp = ηrel - 1), and the reduced viscosity (ηred = ηsp /C) were calculated. C is the solutions concentration of the (0.2 g/dL). The intrinsic viscosity was determined by the Solomon-Ciuta Equation 1[13], which has validity to Huggins constant KH ≤ 0.5[13]
Total Reflection (ATR ProOne) accessory. Experiments were run in 32 scans, at 4 cm-1 resolution, in the 4000 - 400 cm-1 wavenumber range, under normal atmosphere.
2.7 Contact angle measurement
Sessile drop water contact angle measurements were carried out using a pocket goniometer (model PG-2, Fibro System AB), in quintuplicate, with 10 µL of distilled water at room temperature (~ 300 K).
3.1 Viscosity-average molecular mass (Mv)
The viscosity-average molecular mass (Mv) was determined through the Mark-Houwink relationship (Equation 2). Here, KH ~ 0.4 was determined for both copolymers EVA40 and EVA25, by using Huggins method[13], allowing to use the Solomon-Ciuta Equation 1 to calculate the intrinsic viscosity [η]. Figure 1 shows viscosity-average molecular mass (Mv) versus absorbed dose for EVA40 and EVA25. When EVA is gamma irradiated in 10 kGy dose, Mv increases significantly for both EVA40 and EVA25, indicating crosslinking effect in the molecular structure of EVA, according to mechanism shown in Figure 2. At
The viscosity-average molecular mass, Mv, was obtained by means of Mark-Houwink relation[13]:
where the constants K and a are 7.78x10⁻³ (dL/g) and 0.44, respectively for THF-EVA system at 20 °C[14]. All viscosity experiments were performed in quintuplicate.
2.4 Refractive index measurements (RI)
RI was evaluated by an Abbe Hedwig-Dransfeld Allce (40-d-80637, OPTECH) refractometer at ~ 22 °C with alpha-bromonaphthalene as contact liquid.
2.5 Thermogravimetry analysis (TGA)
Termogravimetry Analysis (TGA) (Simultaneous TGA/DSC2 STARe thermoanalyzer- Mettler ToledoSwitzerland) on samples was carried out in 70 microliter aluminum oxide crucibles, under N2 (~99.5%) atmosphere (20 mL.min-1 flux), heating rate of 10 °C.min-1 in the 30-600 °C temperature range.
2.6 Fourier transform infrared spectroscopy analysis (FTIR)
FTIR analyses were performed in a FTIR-4600 Jasco Spectrometer (Japan) equipped with an ZnSe crystal Attenuated
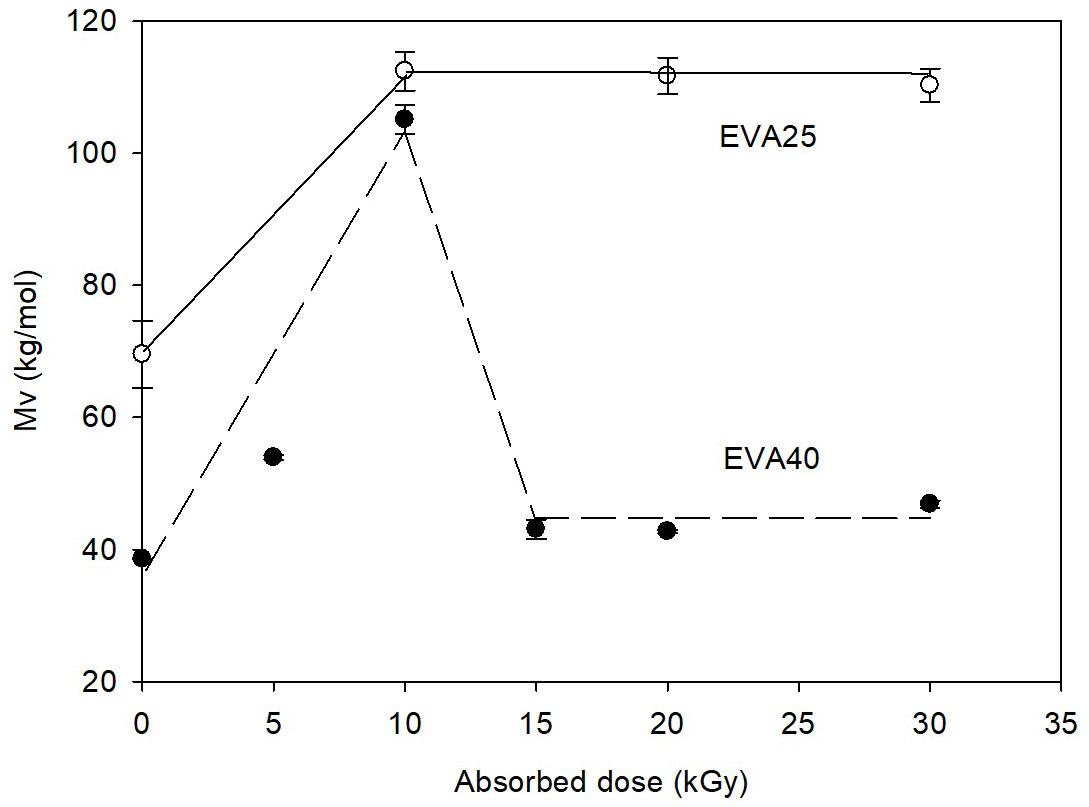
Figure 1. Relationship viscosity-average molecular mass (Mv) with absorbed dose on EVA40 and EVA25.
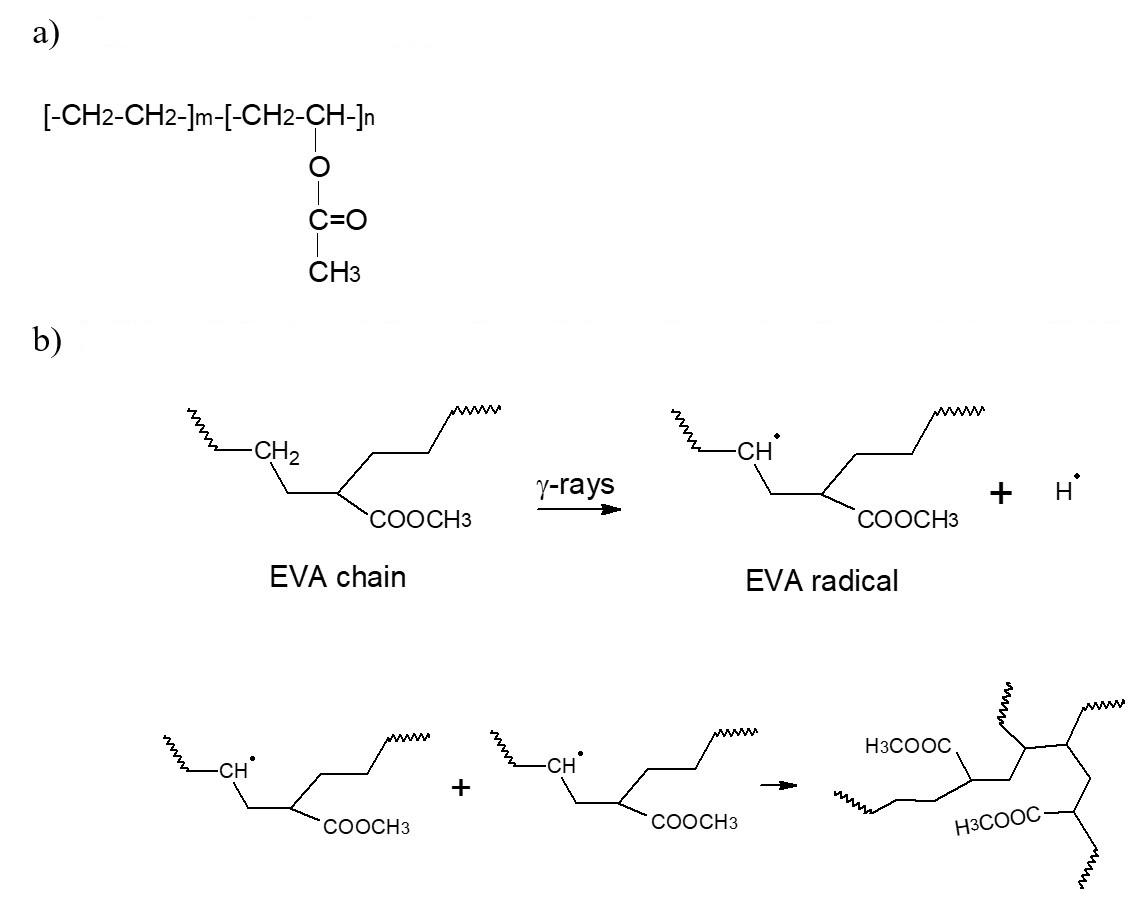
Figure 2. EVA: (a) chemical structure, (b) EVA radiolysis and formation of three-dimensional network (crosslinking).
Gamma-irradiation effects on poly(ethylene-co-vinyl acetate) (EVA)
first step hydrogen bond scissions take place, following by hydrogen abstraction of a very close segment of another PE molecule from EVA, finalized by combination of two very large molecules. However, above 15 kGy, EVA40 molar mass decreases to original value. Here, at 15 –30 kGy dose range, there is no evidence of predominance between main chain scission and crosslinking induced by ionizing radiation, since no significant modification occur on the molar mass. On the other hand, EVA25 maintain the molar mass 60% above the original molar mass. EVA25 presents higher ethylene content that contribute for predominance of crosslinking against main chain scissions effect, even at air atmosphere under gamma irradiation. It is worth mentioning that gamma-irradiated polyethylene (PE) undergoes predominantly crosslinking at inert atmosphere, however, oxygen degradation take place at air atmosphere[15].
Figure 3 shows the thermograms of EVA40 and EVA25 at different gamma irradiation doses and atmosphere conditions. Gamma irradiated (1000 kGy) and unirradiated (0 kGy) EVA40 and EVA25, under N2, thermally degradation in two steps: a) mass loss in the range of 300 – 370 °C is assigned to the degradation of vinyl acetate and formation of acetic acid, and b) mass loss in the range of 380 – 500 °C corresponds to the degradation of the polymer main chain , also observed by Mai and Yu[16]
Table 1 shows the thermal degradation parameters (Tonset, Tmax) for EVA40 and EVA 25 at different gamma irradiation doses and atmosphere conditions. The maximum-rate thermal degradation temperature (Tmax) was obtained by the inflexion point of TGA plot for each thermal degradation step. Tonset is the initial thermal degradation point of the copolymers. It can be noted that gamma irradiation did not influence these thermal parameters on both copolymers, EVA40 and EVA25, under N2, even at high gamma irradiation (1000 kGy). Çopuroğlu and Şen[17] also did not observe significantly chance on thermogravimetry properties in gamma-irradiated EVA (VA 13 wt%) at range doses of 25 – 400 kGy. On the other hand, oxygen exerts a strong influence on the behavior of the thermal degradation of the copolymers, promoting decrease in Tonset and Tmax parameters of EVA40 and EVA25. In addition, a combined effect of oxidative degradation and gamma irradiation was identified when gamma irradiated (500 kGy) EVA (40 and 25) was thermally degraded under O2 atmosphere, see Figure 2. Results indicate that radiolysis accelerate copolymers oxidative processes.
3.3 Fourier transform infrared (FTIR) spectroscopy analysis
FTIR spectrum of gamma-irradiated EVA40 (Figure 4) shows the absorption bands associated to ethylene and acetate groups existing into polymer structure. The bands 2918 cm-1 and 2850 cm-1 were assigned to C-H stretch
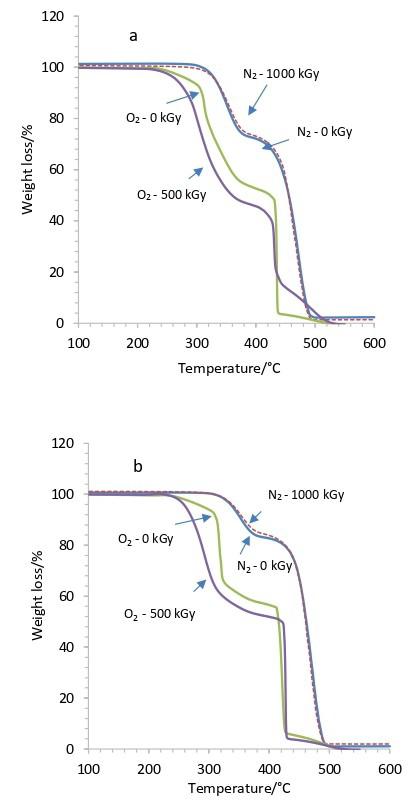
atmosphere conditions of N2 (0 and 1000 kGy) and O2 (0 and 500 kGy).
1. Thermal degradation parameters (Tonset, Tmax) for EVA40 and EVA25 at different gamma irradiation doses and atmosphere conditions.
Medeiros, M. T. S., Lima, T., Araújo, P., & Araújo, E. S.
in methylene, and methyl groups, respectively, while the carbonyl group C=O stretching was present in the 1733 cm-1 band The bands at 1233 cm-1 and 1020 cm-1 were assigned to acetate C-O groups stretching , and the 1463 cm-1 band was assigned to CH2 and CH3 stretching vibrations[18,19]
The radiolysis of EVA40 at doses of 5 and 10 kGy promotes observable changes in the CH2 stretching band at 1463 cm-1 (Figure 4), which is indicative of alterations in the CH2 group chemical environment. Additionally, molar mass changes (Figure 1) suggest radiation-induced crosslinking in the polymer.
Table 2 shows methylene index, which represents an indicative of alterations in the CH2 group induced by gammairradiation on EVA40. This parameter was calculated by the ratio between CH2 (1463 cm-1) and CO (1233 cm-1) bands maximum transmittance values. This last did not undergo any significant changes promoted by gamma irradiation.
EVA25 spectra showed alterations on transmittance bands only at absorbed dose of 30 kGy, as displayed on Figure 5. These results corroborate changes observed in viscosity experiments, in which the molar mass increased in dose range of 10 - 30 kGy (Figure 1) due to the crosslinking effects on molecular structure.
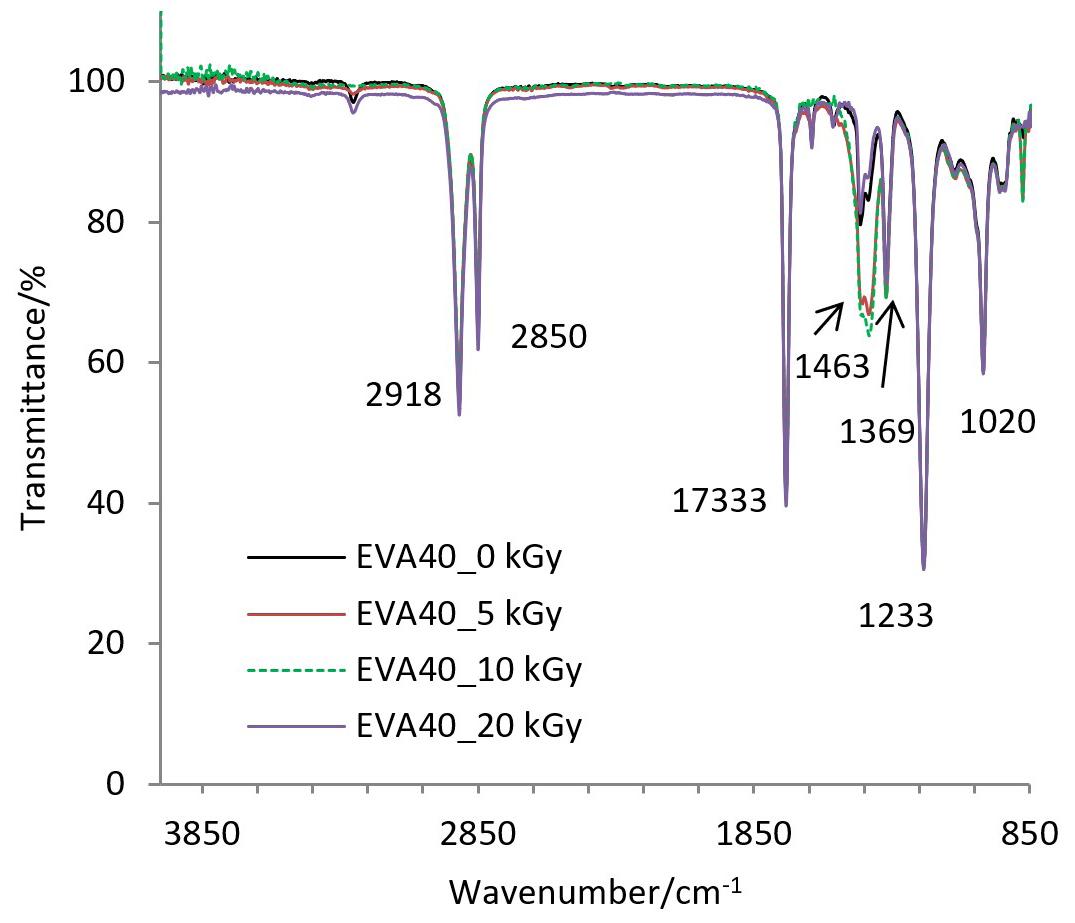
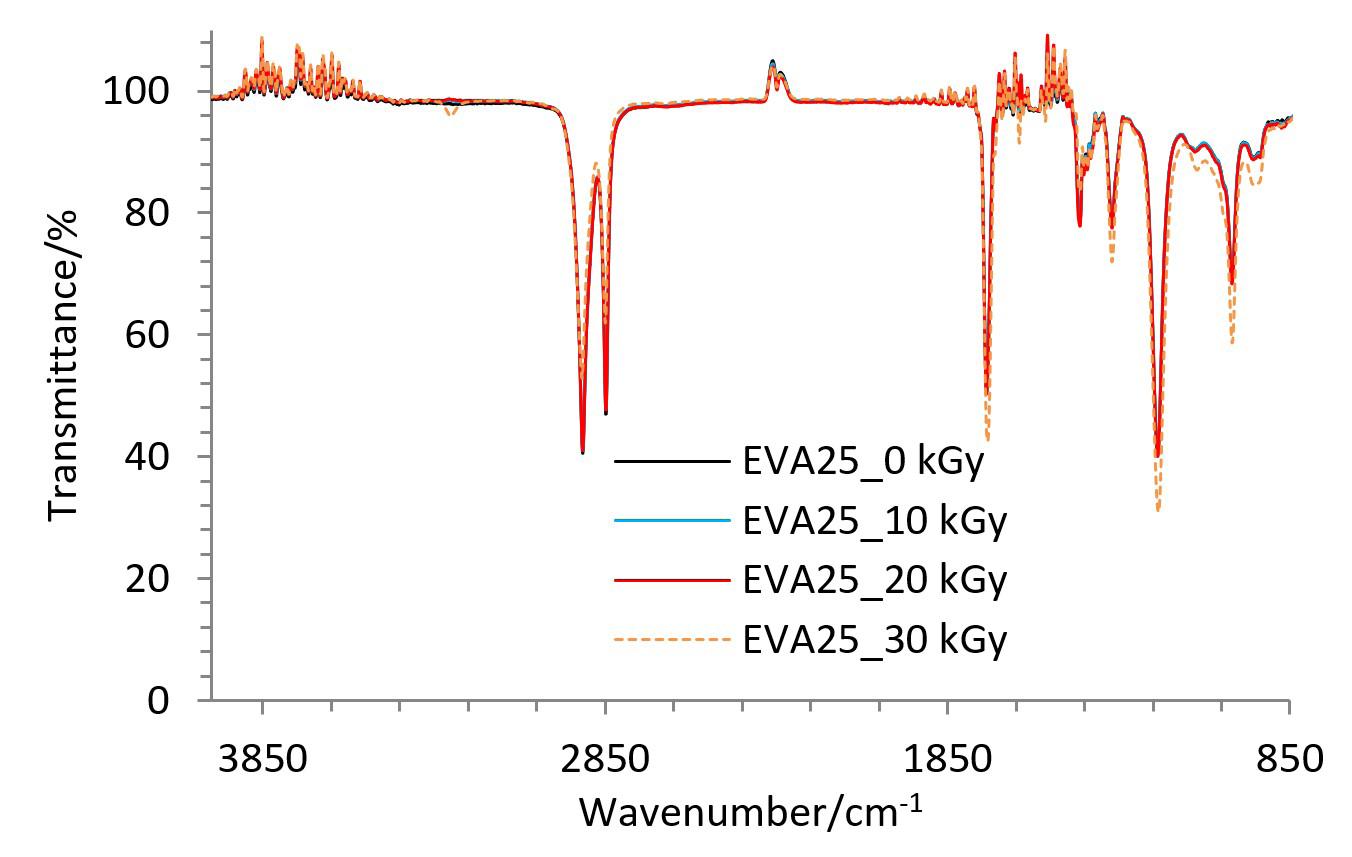
Table 3 shows contact angle results of gamma-irradiated EVA40 and EVA25. Gamma-irradiated EVA40 presented similar values of contact angles on range of 87° – 89° at dose of 0 – 30 kGy, featuring EVA40 as a hydrophobic material (contact angle < 90°). Gamma-irradiated EVA25 also showed hydrophobic features at all absorbed doses. However, it is also worth noting that contact angle increased at ~10° at 10 kGy and 30 kGy. Nevertheless, it can be observed that gamma irradiation did not significantly change the hydrophobic features of EVA. It is important to highlight that materials used in applications of food packaging and electrical-cable jackets, as EVA, need to have hydrophobic properties.
By analyzing the refractive index data from Table 4 can be observed that significant changes did not take place in both gamma-irradiated EVA40 and EVA25 copolymers. In contrast, Mandani and El-Sayed[20] observed crosslinking effects on EVA9 (vinyl acetate of 9 wt%) that promoted significant alterations on refractive index in dose range of 10 – 50 kGy. Likely, vinyl-acetate content above 25 wt% into EVA promotes stabilization on this optical property.
2. Methylene index for EVA40 in different doses.
Table 3. Contact angles for EVA25 and EVA40 in different doses.
Table 4. Refractive index for EVA25 and EVA40 in different doses.
Poly(ethylene-co-vinyl acetate) (EVA) copolymer with 40 or 25 wt% of vinyl acetate (EVA40, and EVA25, respectively) predominantly underwent crosslinking effects promoted by gamma irradiation at dose of 10 kGy. EVA40 viscometry molar mass (Mv) increased from ~ 40 to ~ 105 kg/mol, while EVA25 Mv increased from ~70 to ~110 kg/ml. Gamma irradiation EVA40, in 15 - 20 kGy doses, remains the original molar mass.
Thermal degradation under N2 and refractive index properties of EVA did not undergo significant radiationinduced changes. Gamma irradiation did not significantly change the hydrophobic features of EVA. Combined effect of oxidative degradation and gamma irradiation was observed when gamma-irradiated (500 kGy) EVA (40 and 25) was thermally degraded under O2 atmosphere. Thus, radiolysis accelerates oxidative processes in the copolymers.
Our findings suggest that EVA40 or EVA25 are eligible copolymers for uses in suitable material for irradiated food packaging films, and in electrical cable jacketing materials installed in nuclear facilities.
5. Author’s Contribution
• Conceptualization – Maria Thalita Siqueira de Medeiros; Patricia Araújo; Elmo Silvano de Araújo.
• Data curation – Maria Thalita Siqueira de Medeiros; Thaíses Lima; Patricia Araújo; Elmo Silvano de Araújo.
• Formal analysis – Maria Thalita Siqueira de Medeiros; Thaíses Lima; Elmo Silvano de Araújo.
• Funding acquisition - Patricia Araújo; Elmo Silvano de Araújo.
• Investigation – Maria Thalita Siqueira de Medeiros; Patricia Araújo; Elmo Silvano de Araújo.
• Methodology – Maria Thalita Siqueira de Medeiros; Thaíses Lima; Patricia Araújo; Elmo Silvano de Araújo.
• Project administration – Patricia Araújo; Elmo Silvano de Araújo.
• Resources – Maria Thalita Siqueira de Medeiros; Patricia Araújo; Elmo Silvano de Araújo.
• Software – NA.
• Supervision – Patricia Araújo; Elmo Silvano de Araújo.
• Validation – NA.
• Visualization – NA.
• Writing – original draft – Maria Thalita Siqueira de Medeiros; Patricia Araújo; Elmo Silvano de Araújo.
• Writing – review & editing – Maria Thalita Siqueira de Medeiros; Thaíses Lima; Patricia Araújo; Elmo Silvano de Araújo.
The authors were grateful for the financial support from CNPq (Conselho Nacional de Pesquisa e Desenvolvimento Científico e Tecnológico) and FACEPE (Fundação de Amparo à Ciência e Tecnologia de Pernambuco).
1. Sharma, B. K., Krishnanand, K., Mahanwar, P. A., Sarma, K. S. S., & Chowdhury, S. R. (2018). Gamma radiation aging of EVA/EPDM blends: effect of vinyl acetate (VA) content and radiation dose on the alteration in mechanical, thermal, and morphological behavior. Journal of Applied Polymer Science, 135(18), 46216 http://doi.org/10.1002/app.46216
2 Goulas, A. E., Riganakos, K. A., & Kontominas, M. G. (2003). Effect of ionizing radiation on physicochemical and mechanical properties of commercial multilayer coextruded flexible plastics packaging materials. Radiation Physics and Chemistry, 68(5), 865-872 http://doi.org/10.1016/S0969-806X(03)00298-6
3. Singh, A., & Bahari, K. (2003). Use of high energy radiation in polymer blends technology. In L. A. Utracki (Ed.), Polymer blends handbook (pp. 757-859). Dordrecht: Springer http:// doi.org/10.1007/0-306-48244-4_11
4. Sonnier, R., Taguet, A., & Rouif, S. (2012). Modification of polymer blends by e-beam and γ-irradiation. In V. Mittal (Ed.), Functional polymer blends: synthesis, properties, and performance (pp. 261-304). USA: CRC Press
5 Wündrich, K. (1984). A review of radiation resistance for plastic and elastomeric materials. Radiation Physics and Chemistry (1977) , 24 (5-6), 503-510 http://doi.org/10.1016/01465724(84)90185-7.
6 Gilby, G. W. (1982). Ethylene vinyl acetate copolymers. In A. Whelan (Ed.), Developments in rubber technology – 3 (pp. 101). London: Applied Science Publishers Ltd.
7 Lagaron, J. M., Catalá, R., & Gavara, R. (2004). Structural characteristics defining high barrier properties in polymeric materials. Materials Science and Technology, 20(1), 1-7 http:// doi.org/10.1179/026708304225010442
8 Scaffaro, R., Morreale, M., Re, G. L., & La Mantia, F. P. (2009). Degradation of Mater-Bi®/wood flour biocomposites in active sewage sludge. Polymer Degradation & Stability, 94(8), 12201229. http://doi.org/10.1016/j.polymdegradstab.2009.04.028.
9 Kirwan, M. J., & Strawbridge, J. W. (2003). Plastics in food packaging. In R. Coles, D. McDowell, & M. J. Kirwan (Eds.), Food packaging technology (pp. 174-240). Hoboken: Blackwell Publishing
10 Arnold, R. R., Wei, H. H., Simmons, E., Tallury, P., Barrow, D. A., & Kalachandra, S. (2008). Antimicrobial activity and local release characteristics of chlorhexidine diacetate loaded within the dental copolymer matrix, ethylene vinyl acetate. Journal of Biomedical Materials Research. Part B, Applied Biomaterials, 86(2), 506-513 http://doi.org/10.1002/ jbm.b.31049. PMid:18335433.
11 Boguski, J., Przybytniak, G., & Łyczko, K. (2014). New monitoring by thermogravimetry for radiation degradation of EVA. Radiation Physics and Chemistry, 100, 49-53 http:// doi.org/10.1016/j.radphyschem.2014.03.028
12 Lee, K.-Y., & Kim, K.-Y. (2008). 60Co γ-ray irradiation effect and degradation behaviors of a carbon nanotube and poly(ethylene-co-vinyl acetate) nanocomposites. Polymer Degradation & Stability, 93 (7 ), 1290 -1299 http://doi. org/10.1016/j.polymdegradstab.2008.04.007
13 Guillet, J. (Ed.) (1985). Polymer photophysics and photochemistry Cambridge: University of Cambridge Press
14 Fargere, T., Abdennadher, M., Delmas, M., & Boutevin, B. (1995). Determination of peroxides and hydroperoxides with 2,2-diphenyl-1-picrylhydrazyl (DPPH): application to ozonized ethylene vinyl acetate copolymers (EVA). European Polymer Journal, 31(5), 489-497 http://doi.org/10.1016/00143057(94)00201-0
15 Singh, A. (1999). Irradiation of polyethylene: some aspects of crosslinking and oxidative degradation. Radiation Physics
and Chemistry, 56(4), 375-380 http://doi.org/10.1016/S0969806X(99)00328-X
16 Mai, Y.-W., & Yu, Z.-Z. (Eds.) (2006). Polymer nanocomposites Sawston : Woodhead Publishing Limited . http://doi. org/10.1533/9781845691127.
17 Çopuroğlu, M., & Şen, M. (2004). A comparative study of thermal ageing characteristics of poly(ethylene-co-vinyl acetate) and poly(ethylene-co-vinyl acetate)/carbon black mixture. Polymers for Advanced Technologies, 15(7), 393-399 http:// doi.org/10.1002/pat.485
18 Fonseca, C., Fatou, J. G., & Pereña, J. M. (1991). Study of the acetoxy-hydroxide transformation in ethylenevinyl acetate copolymers. Macromolecular Materials and Engineering , 190 ( 1 ), 137 - 155 http://doi.org/10.1002/ apmc.1991.051900109
19 Allen, N. S., Edge, M., Rodriguez, M., Liauw, C. M., & Fontan , E. ( 2000 ). Aspects of the thermal oxidation of ethylene vinyl acetate copolymer. Polymer Degradation & Stability , 68 (3), 363-371 http://doi.org/10.1016/S01413910(00)00020-3.
20 Madani, M., & El-Sayed, S. M. (2007). Radiation effects on optical properties of ethylene vinyl acetate copolymer films. Journal of Macromolecular Science, Part B: Physics, 46(3), 441-451 http://doi.org/10.1080/00222340701257554
Received: Dec. 07, 2024
Revised: Mar. 25, 2025
Accepted: May 10, 2025
Editor-in-Chief: Sebastião V. Canevarolo
Medeiros, M. T. S., Lima, T., Araújo, P., & Araújo, E. S. Polímeros, 35(3), e20250028, 2025
Eziel Cardoso da Silva1 , Emanuel Airton de Oliveira Farias1,2 , Thais Danyelle Santos Araújo2 , Alyne Rodrigues Araújo2 , Geanderson Emilio de Almeida1 , Lívio César Cunha Nunes3 and Carla Eiras1*
1Laboratório de Pesquisa e Desenvolvimento de Novos Materiais e Sistemas Sensores – MATSENS, Universidade Federal do Piauí – UFPI, Teresina, PI, Brasil
2Universidade Estadual Vale do Acaraú – UVA, Camocim, CE, Brasil
3Laboratório de Inovação Tecnológica e Empreendedorismo – LITE, Universidade Federal do Piauí –UFPI , Teresina, PI, Brasil
*eirasc@ufpi.edu.br
Obstract
Gold nanoparticles (AuNPs) were prepared by green synthesis using the gum extracted from Amburana cearensis (GAmb) exudate. The influence of polysaccharide concentration, precursor salt (HAuCl4), temperature, pH, and reaction time on the final properties of the AuNPs-GAmb was evaluated. The UV-VIS spectrum of the AuNPs-GAmb showed an absorption band in the region of 524 nm, characteristic of spherical nanostructures, and the synthesis conditions strongly influenced the average diameter of these nanoparticles. The optimized AuNPs-GAmb presented a high colloidal stability and spherical shape with an average diameter of 13.22 ± 1.86 nm (when measured by Atomic Force Microscopy -AFM). Later, the catalytic activity of AuNPs-GAmb was evaluated in the degradation of toxic dyes such as toluidine blue (TB), methylene blue (MB), and methyl orange (MO), which were degraded in less than 11 minutes. Thus, the AuNPs-GAmb obtained in this work are eco-friendly and have a high potential for applications in biotechnology
Keywords: tree exudate, green technologies, nanotechnology, environmental remediation.
Data Availability: All data supporting the findings of this study are included in this article and its supplementary materials.
How to cite: Silva, E. C., Farias, E. A. O., Araújo, T. D. S., Araújo, A. R., Almeida, G. E., Nunes, L. C. C., & Eiras, C. (2025). Gold nanoparticles based on polysaccharide from Amburana cearensis for organic dyes degradation. Polímeros: Ciência e Tecnologia, 35(3), e20250029. https://doi.org/10.1590/0104-1428.20240094
Growing environmental awareness has directed efforts toward the search for an approach called “green chemistry” or “sustainable chemistry,” which aims to eliminate harmful reagents in the development of new products[1] .
Gold nanoparticles (AuNPs) are among the most studied nanomaterials due to their excellent properties: high stability, low toxicity, and biocompatibility. Different strategies have been proposed for the synthesis of AuNPs, from the most conventional ones (using reducing agents) to strategies such as photochemical and radiolytic synthesis, among others. However, the green synthesis approach stands out due to the use of natural molecules such as enzymes, amino acids, proteins, and polysaccharides[2]
Considering that gum or polysaccharides extracted from plant species, such as Karaya gum (Sterculia urens) and Acacia gum (Acacia seyal), have been used as reducing and stabilizing agents in the synthesis of AuNPs, the gum extracted from the trunk exudate of the Amburana cearensis AC Smith (GAmb), emerges as a new alternative in the synthesis of these nanoparticles. A. cearensis is a tree that
occurs naturally in Brazil’s northeast, southeast, and centralwest states. It can also be found in other South American countries, such as Argentina, Paraguay, and Bolivia[3] .
Among the applications proposed for AuNPs, their function as a catalyst agent during reducing toxic dyes stands out. Thus, green products such as the AuNPs-GAmb proposed in this work may deactivate dyes such as methyl orange, toluidine blue, and methylene blue.
The methyl orange or MO (C14H14N3NaO3S) is an example of a highly toxic, mutagenic, non-biodegradable, and carcinogenic, widely used in various industrial sectors[4] Another well-known dye is toluidine blue or TB (C15H16N3SCl), which is commonly used in the textile industry. TB has been reported to be mutagenic and may irritate animals’ skin or affect their genomes[5]. Methylene blue or MB (C16H18ClN3S) is a non-biodegradable cationic dye used for decades in paper, rubber, and plastic industries[6]
Although sodium borohydride (NaBH4) is considered a potent reducing agent, including used in the synthesis of Pt, Ag, and Au nanoparticles, it does not favor the degradation
Silva, E. C., Farias, E. A. O., Araújo, T. D. S., Araújo, A. R., Almeida, G. E., Nunes, L. C. C., & Eiras, C.
of these dyes. On the other hand, recent approaches that have been tested include the addition of catalysts, such as metal nanoparticles, preferably from green synthesis routes, to enhance the degradation[7]
Thus, this study aimed to synthesize gold nanoparticles using A. cearensis polysaccharide (AuNPs-GAmb) as a reducing and stabilizing agent for subsequent application in degrading toxic dyes, such as methyl orange, toluidine blue, and methylene blue.
2.1 Isolation and Purification of A. cearensis gum (GAmb)
The methodology used to isolate and purify the polysaccharide from A. cearensis followed that of Farias et al.[8]
2.2 Synthesis of gold nanoparticles (AuNPs-GAmb)
The methodology selected for synthesizing AuNPs-GAmb was adapted from the study by Melo et al.[9]. In an Erlenmeyer flask, 10.0 mL of GAmb solution was added, which was heated and stirred (300 rpm). After, 10.0 mL of tetrachloroauric (III) acid trihydrate (HAuCl4 3.H2O) (Sigma-Aldrich) solution was added. During synthesis, the following parameters were optimized: the concentrations of GAmb variated between 0.1, 0.2, or 0.3% (w/v), and HAuCl4 3.H2O variated between 0.1, 0.2, or 0.3 mM. A volume of 10 mL was maintained for GAmb and HAuCl4 3.H2O in all experiments (total volume = 20 mL). The influence of temperature (varying between 80, 90, or 100 ºC), pH (ranging between 2.5, 3.0, and 3.5), and synthesis time (30, 60, and 120 min) were also evaluated. Table 1 summarizes the synthesis parameters.
Before characterization, the AuNPs-GAmb were subjected to four centrifugation processes at 4,000 rpm for 20 min, based on the study by Silva[10]
UV-Vis analyses were performed using a Shimadzu UV mini 1240 spectrophotometer in the 400-800 nm wavelength
range, using a quartz cuvette containing 1.0 mL of AuNPsGAmb. Infrared spectroscopy (FTIR) measurements were performed on a Shimadzu IRAffinity-1 spectrophotometer in the 400-4000 cm-1 range. DLS (Dynamic Light Scattering) measurements were performed on a Malvern Zetasizer Nano ZS90. AFM analyses were performed in TT-AFM equipment (AFM Workshop, USA), in intermittent contact (vibratory) mode (with a resolution of 512 × 512 pixels), using TAP300-G silicon probes (Ted Pella, USA) and a resonance frequency of approximately 240 kHz. The images obtained were analyzed in the Gwyddion 2.61 software.
2.4 Catalytic activity
After optimizing the synthesis parameters, a study was conducted to investigate the catalytic effect of AuNPs-GAmb on the degradation of methylene blue (MB), toluidine blue (TB), and methyl orange (MO) dyes[11-13]. The effectiveness of the NaBH4 + AuNPs-GAmb system in degrading the dyes (MB, TB, and MO) was estimated using Equation 1: ( ) { } % 0 /0 100 degradationAAtA=−× (1)
Where:
A0 and At are the absorbance at 0 and t minutes, respectively.
2.5 ABTS radical scavenging assay
The antioxidant activity of AuNPs-GAmb was determined by the ABTS method ((2,2′ -Azino-bis-(3-ethylbenzothiazoline6-sulfonic acid), diammonium salt, from the study adapted from Gião et al.[14]
3. Results and Discussions
3.1 Gold nanoparticles reduced and stabilized with GAmb
3.1.1 Synthesis mechanism
The synthesis of AuNPs-GAmb starts from an aqueous solution of gold and a reducing and stabilizer agent (GAmb) solution. The structure of GAmb and the synthesis mechanism
Gold nanoparticles based on polysaccharide from Amburana cearensis for organic dyes degradation
of AuNPs-GAmb are shown in Figure 1. GAmb is a polyhydroxylated biopolymer consisting of a β-D-Galactopyran backbone linked by glycosidic bonds (1→3). At the same time, the side chains exhibit β-Galactopyranose (1→6) and α-L-Arabinofuranoside (1→3,6) monomers[15]. Many hydroxyl groups and the reducing ends of GAmb act as active reaction centers to facilitate the reduction of Au3+ to Au0. The synthesis process goes through the steps of reduction, nucleation, and stabilization, giving rise to AuNPs-GAmb.
In all syntheses performed, the formation of AuNPsGAmb was evidenced by the change in color of the reaction medium, from pale yellow (characteristic of the HAuCl4 - gold salt solution) to red, resulting from the excitation of the surface plasmon resonance (SPR) of AuNPs-GAmb. Thus, during this study stage, the synthesis was optimized to search for AuNPs-GAmb that exhibited the best properties. Therefore, the synthesis parameters (precursor concentration, temperature, pH, and reaction time) were monitored by UV-visible (UV-VIS) spectroscopy and DLS techniques.
Figure 2A shows the UV-VIS spectra obtained in the synthesis of AuNPs-GAmb in which the polysaccharide concentrations were varied at 0.1, 0.2, and 0.3% (w/v). Here, all syntheses were performed in triplicates, maintaining the pH of the reaction medium at 3.5, the concentration of HAuCl4 at 0.2 mM, the reaction temperature at 100 °C, and the synthesis time at 30 minutes. Figure 2B shows the spectra obtained from the average of these measurements.
From the spectra obtained, it can be observed that with the increase in the concentration of GAmb in the reaction medium, the SPR band moved to a region of shorter wavelength with an increase in the absorbance intensity. This behavior shows a tendency of growth in the average diameter of these nanoparticles, corroborating the data obtained by DLS presented in Table 1. This can be explained by an aggregation of nanoparticles, mainly when using 0.3% GAmb. Thus, using GAmb at 0.1, 0.2, or 0.3% made it possible to obtain nanoparticles with diameters varying respectively between 45.93, 53.86, and 94.82 nm.
When GAmb was used at 0.3%, the PDI was 0.726, which characterizes a polydisperse system[16] .
The AuNPs-GAmb obtained at 0.2% of the polysaccharide presented a slightly lower PDI (0.477 ± 0.05) than that obtained for the AuNPs at 0.1% of GAmb (0.530 ± 0.02), Table 1. In addition, the concentration of 0.2%, when compared to 0.1% of GAmb, ensures greater availability of reducing groups such as carbonyl and hydroxyl present in the polysaccharide, which can favor synthesis. According to Chopra et al.[17], the increase in the concentrations of reducers results in a more significant formation of AuNPs. Therefore, the concentration at 0.2% of GAmb was considered the most suitable and kept constant in the following steps of optimization of the synthesis parameters.
A study with locust bean gum (Ceratonia siliqua) demonstrated that the efficiency of AuNPs formation increased with the increase of gum concentration (keeping the HAuCl4 concentration constant). On the other hand, this correlation was not observed when sodium citrate was used as a reduction agent instead of gum during these AuNPs synthesis[18,19]
Subsequently, the influence of the HAuCl4 concentration (0.1, 0.2, or 0.3 mM) on the synthesis of AuNPs-GAmb was evaluated.
Figure 2C and 2D show the spectra absorption obtained in triplicates and its respective averages for AuNPs-GAmb obtained under different concentrations of HAuCl4. The syntheses with HAuCl4 at 0.2 mM recorded the lowest absorbance values at 530 nm, indicating the lowest concentration of nanoparticles in the colloidal suspension. On the other hand, the highest absorbance values were presented in the synthesis using 0.3 mM HAuCl4, indicating more nanoparticles were obtained.
Another important observation is that the increase in the concentration of HAuCl4 promoted a decrease in AuNPs-GAmb diameter, which was 116.7 nm for HAuCl4 at 0.1 mM, 82.8 nm for HAuCl4 at 0.2 mM, and 52.6 nm for HAuCl4 at 0.3 mM (Table 1).
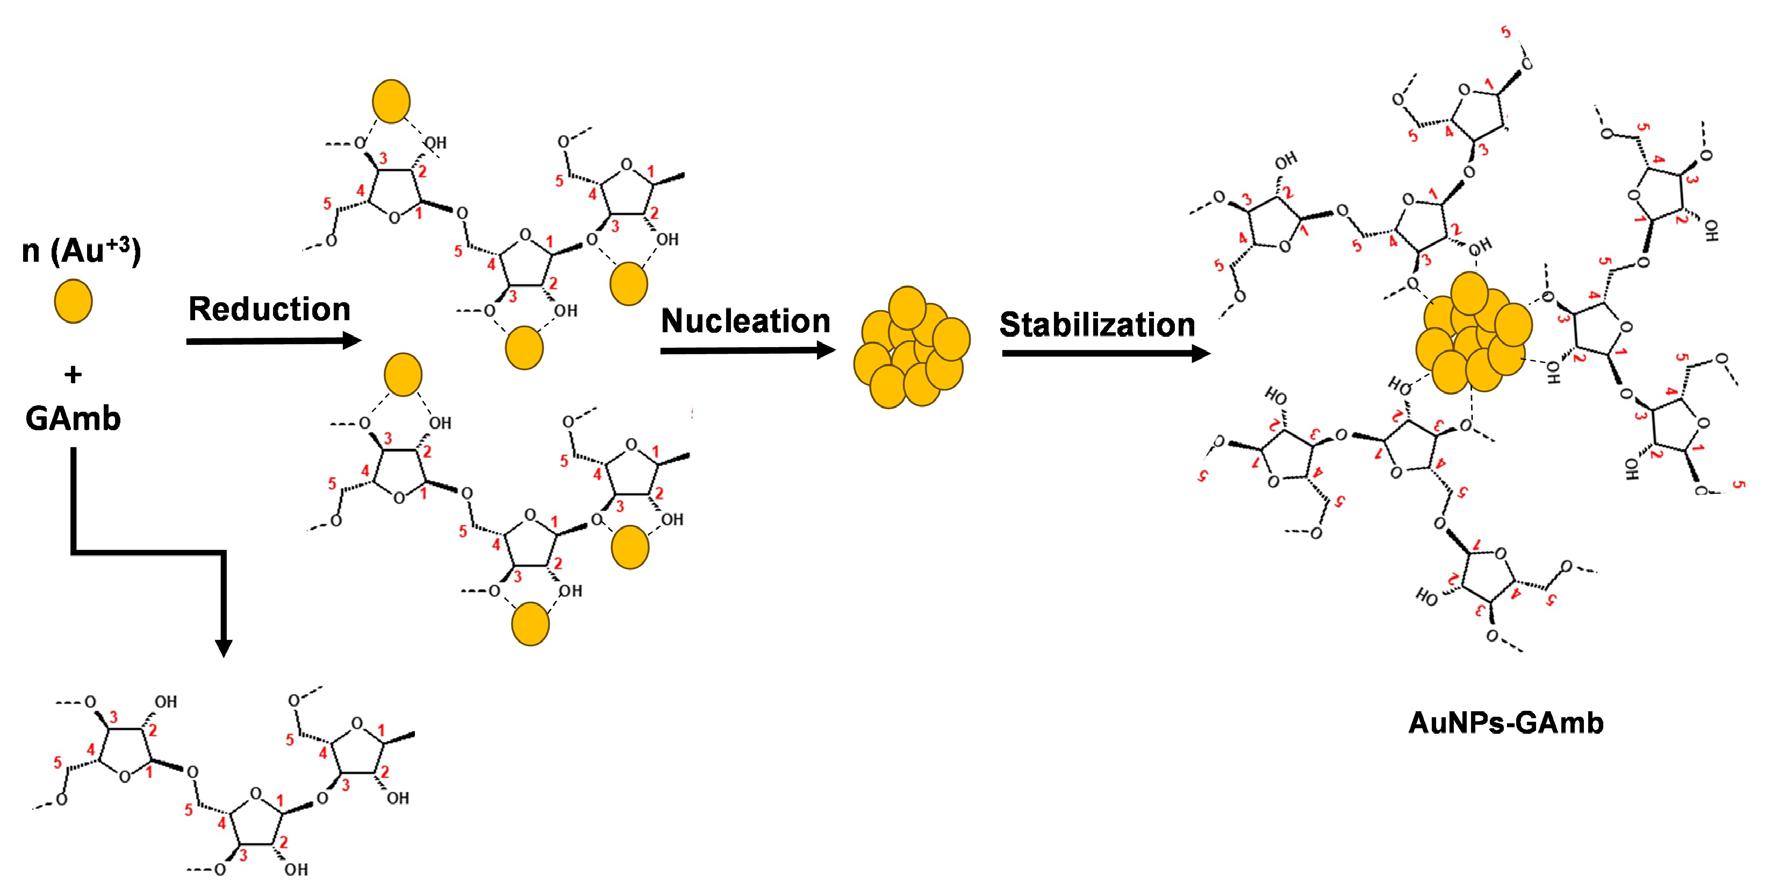
Silva, E. C., Farias, E. A. O., Araújo, T. D. S., Araújo, A. R., Almeida, G. E., Nunes, L. C. C., & Eiras, C.
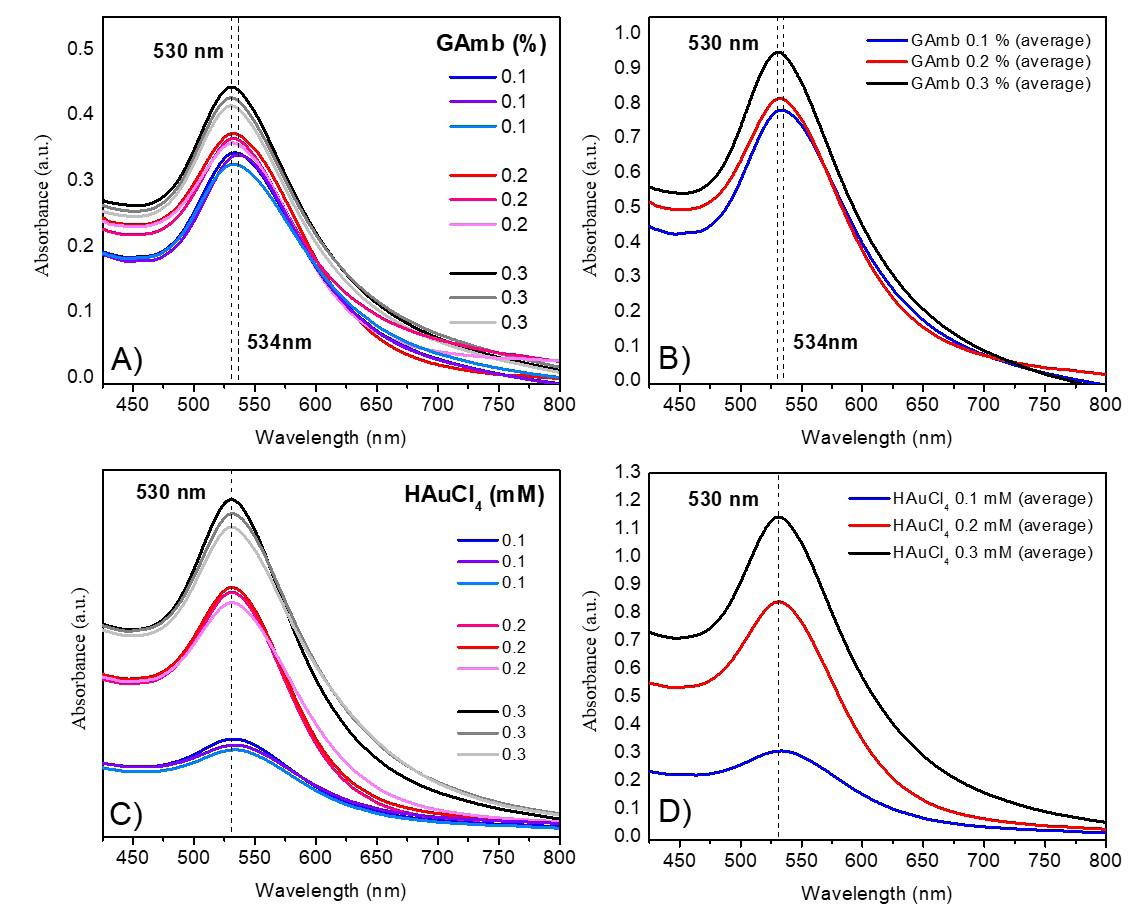
Figure 2. UV-Vis spectra (A) were obtained in triplicates while studying the influence of the GAmb concentration (0.1, 0.2, or 0.3%) and (B) on the average of these triplicates. (C) UV-Vis spectra obtained in triplicates during the study of the influence of HAuCl4 concentration (0.1, 0.2, and 0.3 mM) and (D) average of these triplicates. Constant parameters: pH = 3.5, temperature =100 °C and synthesis time = 30 min.
According to the literature[20], this occurs due to an increase in the concentration of the anion [AuCl4]- a species that provides Au0, which is necessary for the nucleation and formation of nanoparticles (Equation 2). Therefore, the higher the concentration of [AuCl4]- the more nuclei can be provided, contributing to a more significant number of nanoparticles[21]. Therefore, it is concluded that the most suitable concentration of HAuCl4 in AuNPs-GAmb synthesis is 0.3 mM.
favor the formation of larger particles due to the increased supply of Au monomers[22]
Studies using Acacia and Xanthan gums showed that increasing the temperature in the reaction medium promoted an increase in the rate of AuNPs formation and improved the size distribution of the nanoparticles obtained. In the present study, GAmb was associated with the temperature of 100 °C and favored the more excellent formation of nanoparticles; the AuNPs-GAmb obtained at 100 °C presented the lowest polydispersity index (approximately 0.618), Table 1. Given the advantages observed when using the temperature of 100 °C, this was considered the optimal synthesis temperature.
Once the best concentrations of GAmb (0.2%) and HAuCl4 (0.3 mM), the influence of temperature and pH were studied. Figure 3A and 3B show the triplicates and averages of the absorption spectra recorded for the AuNPs-GAmb synthesized at temperatures of 80, 90, or 100 ºC. The results showed that increasing the temperature increased the nanoparticle formation rate, evidenced by the increasing absorbance values. A slight shift from 542 to 530 nm in the SPR band of the AuNPs-GAmb was obtained when the temperature varied from 80 to 90 or 100 ºC. This displacement may be related to an increase in the diameter of these nanoparticles since higher temperatures
The literature reports stated that pH between 2.8 and 4.0 is the most suitable for synthesizing gold nanoparticles, using HAuCl4 as a precursor[23]. According to these studies, the initial amount of the AuCl4 species available for forming AuNPs is directly related to the pH of the reaction medium.
The pH after the 0.2% GAmb and 0.3 mM HAuCl4 mixture was 3.5. From small aliquots of 0.1 mol L-1 HCl, the pH value was adjusted to 3.0 and 2.5 to evaluate the effect of this parameter on AuNPs-GAmb properties. The UV-Vis spectra obtained in the syntheses of AuNPs-GAmb at these pHs are shown in Figure 3C and 3D, where it is
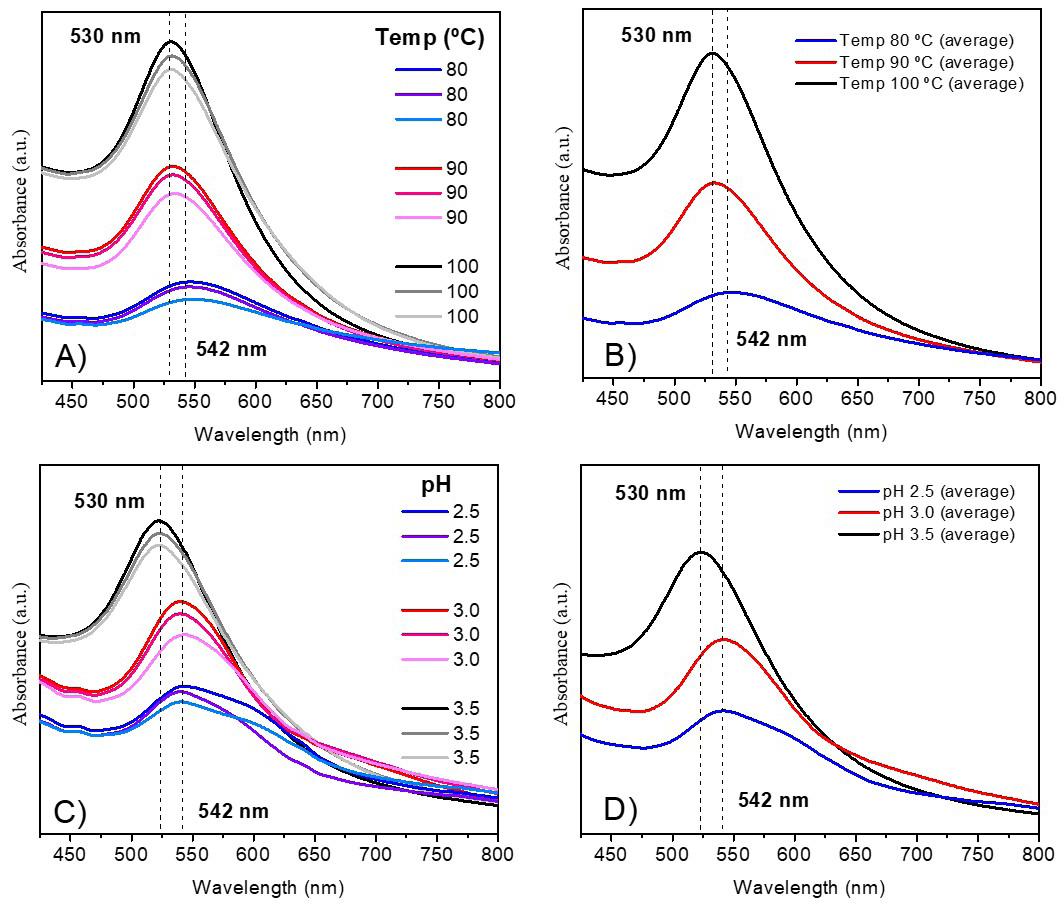
Figure 3. UV-Vis spectra (A) obtained in triplicate during the study of the temperature influence varied at 80, 90, or 100 ºC and (B) average of these triplicates. (C) UV-Vis obtained in triplicate during the pH study, and D) average of these triplicates. Constant parameters: GAmb concentration = 0.2%, HAuCl4 concentration = 0.3 mM, and synthesis time = 30 min.
possible to observe that pH 3.5 promoted the formation of a more significant number of AuNPs-GAmb, in addition to the fact that at this pH the nanoparticles with smaller diameters (52.55 nm) and a higher zeta potential (-21.73 mV), suggesting better colloidal stability, Table 1. The results achieved in our study agree with previous studies, such as in the case of the synthesis of AuNPs using oats (Avena sativa) as a reducing and stabilizing agent, in which the pH of 3.5 was also considered an optimized condition[24] . Wuithschick et al.[25] affirmed that 2.8 is the minimum pH value adequate for synthesizing AuNPs from HAuCl4 as a precursor salt.
The last optimized synthesis parameter was the reaction time. Thus, syntheses were performed at 30, 60, and 120 min, and the UV-Vis spectra obtained are shown in Figure 4A and 4B. After only 30 min of synthesis, it was already possible to observe a well-defined SPR band at around 530 nm for the AuNPs-GAmb. As the reaction time increased, there was an increase in the intensity of this band, indicating that the synthesis time promotes an increase in
the formation of AuNPs-GAmb. The rise in synthesis time also influenced the size of the nanostructures formed, being 52.55 nm for 30 min, 32.39 nm for 60 min, and 26.50 nm for 120 min, Table 1. However, the increase in synthesis time promoted a decrease in the zeta potential value, being -21.73 mV for 30 min, -20.40 mV for 60 min, and -18.80 mV for 120 min. Thus, aiming for the practicality of the synthesis, 60 minutes was chosen as the optimal time for synthesizing AuNPs-GAmb.
The AuNPs-GAmb obtained under optimized conditions (0.2% Gamb, 0.3 mM HAuCl4, temperature of 100 °C, pH 3.5, and time of 60 min) were very stable colloidal systems. After synthesizing the AuNPs-GAmb, they were stored, protected from light, and in a refrigerator for six months. They maintained their spectroscopic profile practically identical to that obtained approximately one hour after the synthesis (Figure 4C). The use of GAmb may explain the high stability of these nanostructures, as GAmb generates a steric barrier around these AuNPs and prevents them from aggregating.
Silva, E. C., Farias, E. A. O., Araújo, T. D. S., Araújo, A. R., Almeida, G. E., Nunes, L. C. C., & Eiras, C.
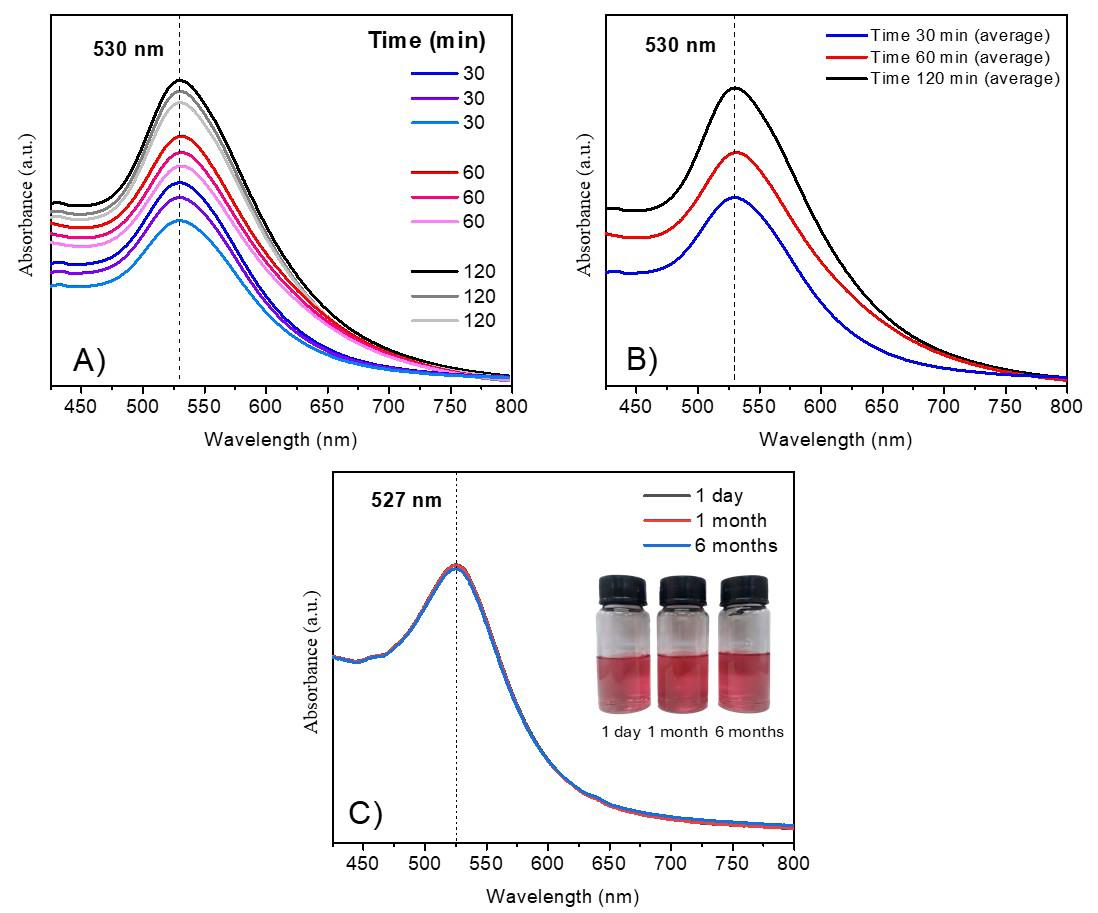
Figure 4. UV-Vis spectra (A) obtained in triplicate during the synthesis time study (30, 60 or 120 minutes) performed in triplicates and (B) average of these spectra. (C) Spectra obtained during the stability test of AuNPs-GAmb obtained one day, one month, and six months after synthesis. Constant parameters: GAmb concentration = 0.2%, HAuCl4 concentration = 0.3 mM, pH = 3.5, and temperature = 100 °C.
Figure 5 shows the FTIR spectra recorded for GAmb and AuNPs-GAmb, with the leading bands at 3423, 2922, 1730, 1640, 1152, 1002, and 782 cm-1. The broad band observed at 3423 cm-1 is attributed to the stretching vibrations of the –OH groups in GAmb. The band at 2922 cm-1 corresponds to the asymmetric stretching vibration of the methylene, methyl, and methoxy groups. The band at 1730 cm-1 can be attributed to carbonyl (C=O) stretching vibrations present in ketones, aldehydes, and carboxylic acids, which is the case of GAmb. The band observed at 1640 cm-1 corresponds to the asymmetric stretching of the carboxylate group (COO-), while the C–O stretching vibration of the ether and alcohol groups is confirmed at 1152 cm-1. The intense band at 1002 cm-1 corresponds to the asymmetric stretching (C-O) bond present in esters and in the glycosidic bond of carbohydrates, as is the case of polysaccharides. The band at 782 cm-1 is associated with the stretching of the glycosidic bond present in carbohydrates[26]
In general, the FTIR spectrum of AuNPs-GAmb also showed the main characteristic peaks of GAmb, Figure 4 A change in intensity in the peaks of the FTIR spectrum of
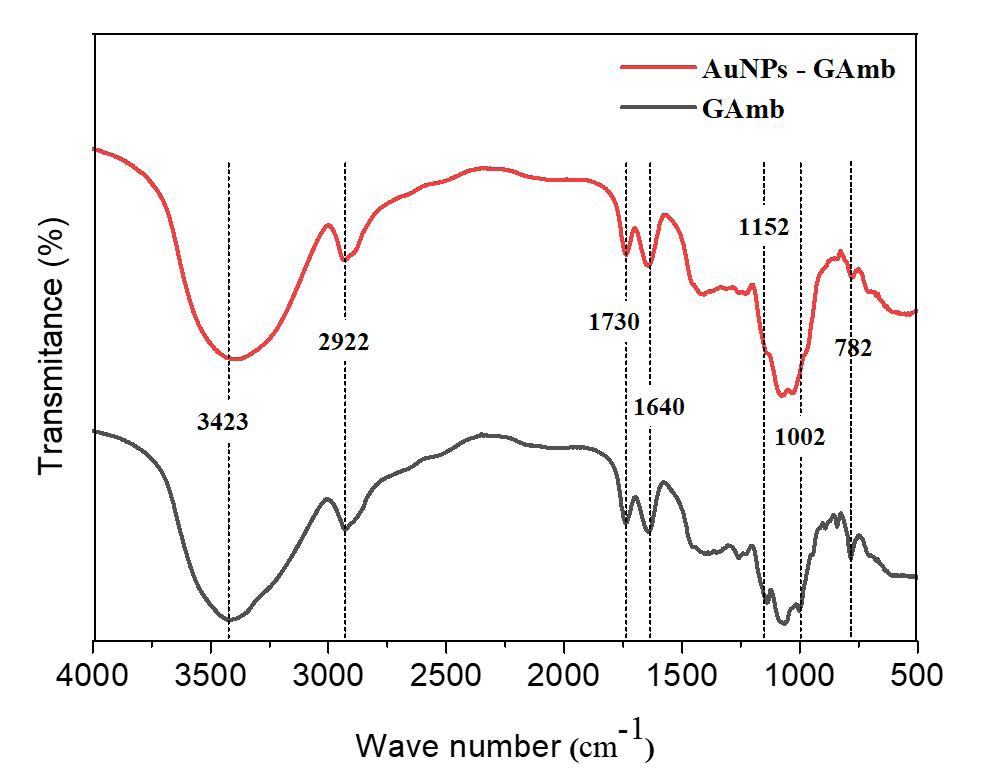
5. FTIR spectra of GAmb and AuNPs-GAmb.
AuNPs-GAmb was observed at 1152 and 1002 cm-1, suggesting an interaction of AuNPs with carboxylate, acetyl and C-O groups of the ethers and alcohols present in the GAmb structure. Thus, FTIR studies suggest that the carbonyl and
Gold nanoparticles based on polysaccharide from Amburana cearensis for organic dyes degradation
hydroxyl groups have a greater affinity to bind to the metal[27] , favoring the formation of a coating on the nanoparticles and increasing stabilization against accumulation.
AFM was used to characterize the size and shape of the AuNPs-GAmb (Figure 6A-E). In general, when measured by AFM, AuNPs-GAmb showed a spherical shape and an average diameter of 13.22 ± 1.86 nm. This diameter value has differed from that found for these nanostructures using
the DLS technique (32.39 ± 0.801 nm). This disagreement was expected since the DLS technique measures the hydrodynamic diameter of the material; that is, in this measurement, both the metallic portion (AuNPs) and its polymeric shell (GAmb) are considered, thus providing information on the dimensions of the entire conjugate[28] After optimizing the synthesis parameters, the nanoparticles presented a Zeta potential of –20.8 mV, indicating that GAmb, which has negatively charged groups, helps to stabilize the nanoparticle. In Figure 6C, both the metallic
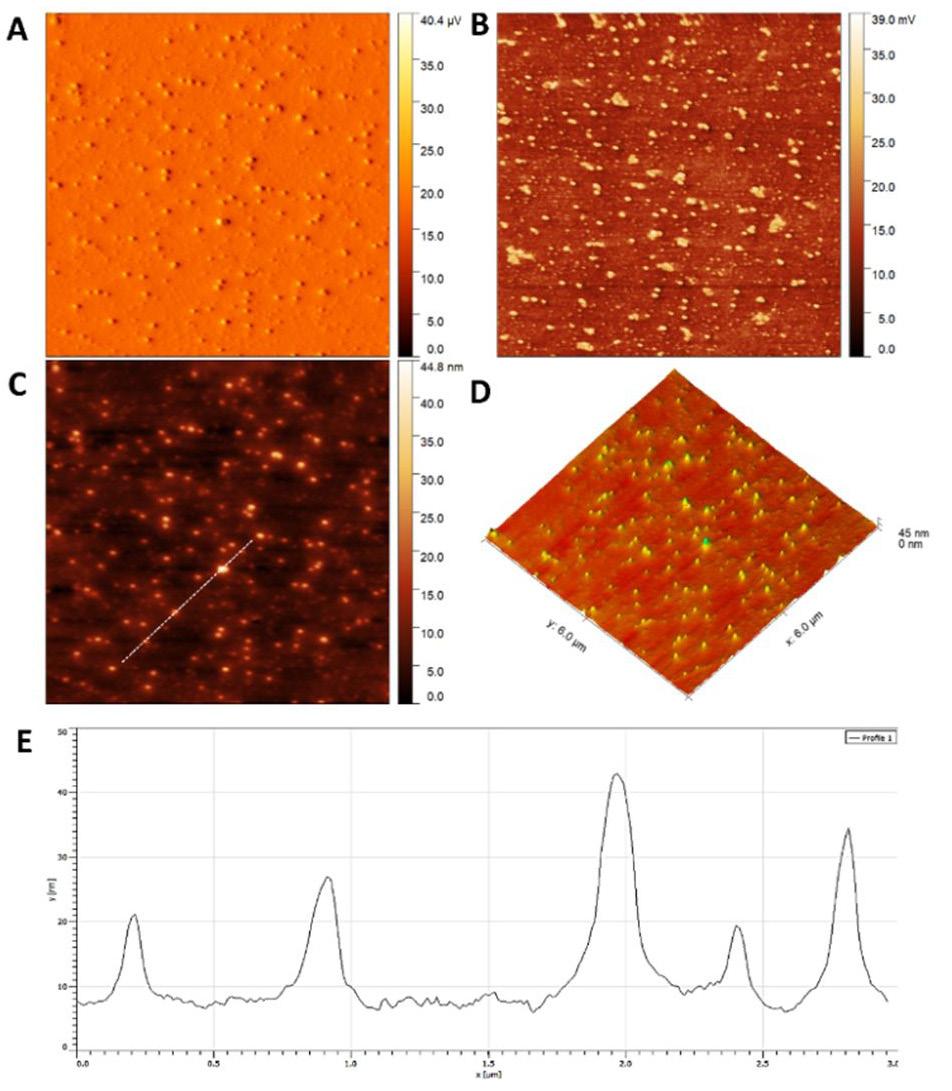
512 pixels resolution.
Silva, E. C., Farias, E. A. O., Araújo, T. D. S., Araújo, A. R., Almeida, G. E., Nunes, L. C. C., & Eiras, C.
and polymeric portions that constitute the AuNPs-GAmb can be observed in detail.
Due to their minimal size and high surface area to volume ratio, metal nanoparticles can act as excellent catalysts in organic synthesis, reduction of pollutants such as 4-nitrophenol, and degradation of organic dyes[29]. Thus, we sought to evaluate the catalytic potential of AuNPs-GAmb against the reduction of methylene blue (MB), toluidine blue (TB), and methyl orange (MO). For comparative purposes, 0.03 M sodium borohydride (NaBH4), a potent reducing agent, was used as a control during these experiments.
The pure aqueous solution of MB has a characteristic blue coloration with a maximum absorbance of 662 nm. When using 1.0 mL of NaBH4 (0.03 mol L-1) in the reduction of MB, only minor variations in its absorbance were observed, even after 120 minutes of the addition of NaBH4, indicating that the reduction of MB with this compound is extremely slow, Figure 7A. On the other hand, after the addition of 100 μL of AuNPs-GAmb to the reaction medium, the characteristic absorption peak of MB disappeared in only 7 minutes, and the MB solution, previously an intense
blue, became colorless, Figure 7B. The action of AuNPsGAmb promoted the efficient catalysis of MB reduction to leucomethylene blue (LB), which is colorless and less toxic[30]. The correlations of the kinetics of this reaction are shown in Figure 7C
Toluidine blue (TB) also has an intense blue coloration and a maximum absorption peak at 631 nm. Like MB, NaBH4 promoted a slow reduction of TB, even after 120 minutes of action, Figure 7D. However, after adding 100 μL of the AuNPs-GAmb suspension, almost 100% of the dye degradation was observed 8 minutes later, Figure 6E. The correlations of the kinetics of this reaction are shown in Figure 07F. These results corroborate with the literature[31], which reported a time of 09 minutes for the catalytic degradation of MB using AuNPs reduced with the polysaccharide extracted from Sargassum serratifolium
Methyl orange (MO) has an azo group (R-N = N-R’) that acts as a chromophore, which gives the dye its orange color and absorbs in the 464 nm region. Figure 7G shows the UV-Vis absorption spectra for MO in the presence of NaBH4 as a function of the action time. As was reported for the previous dyes, minor variations resulting from a slow degradation of MO by NaBH4 were observed. On the other
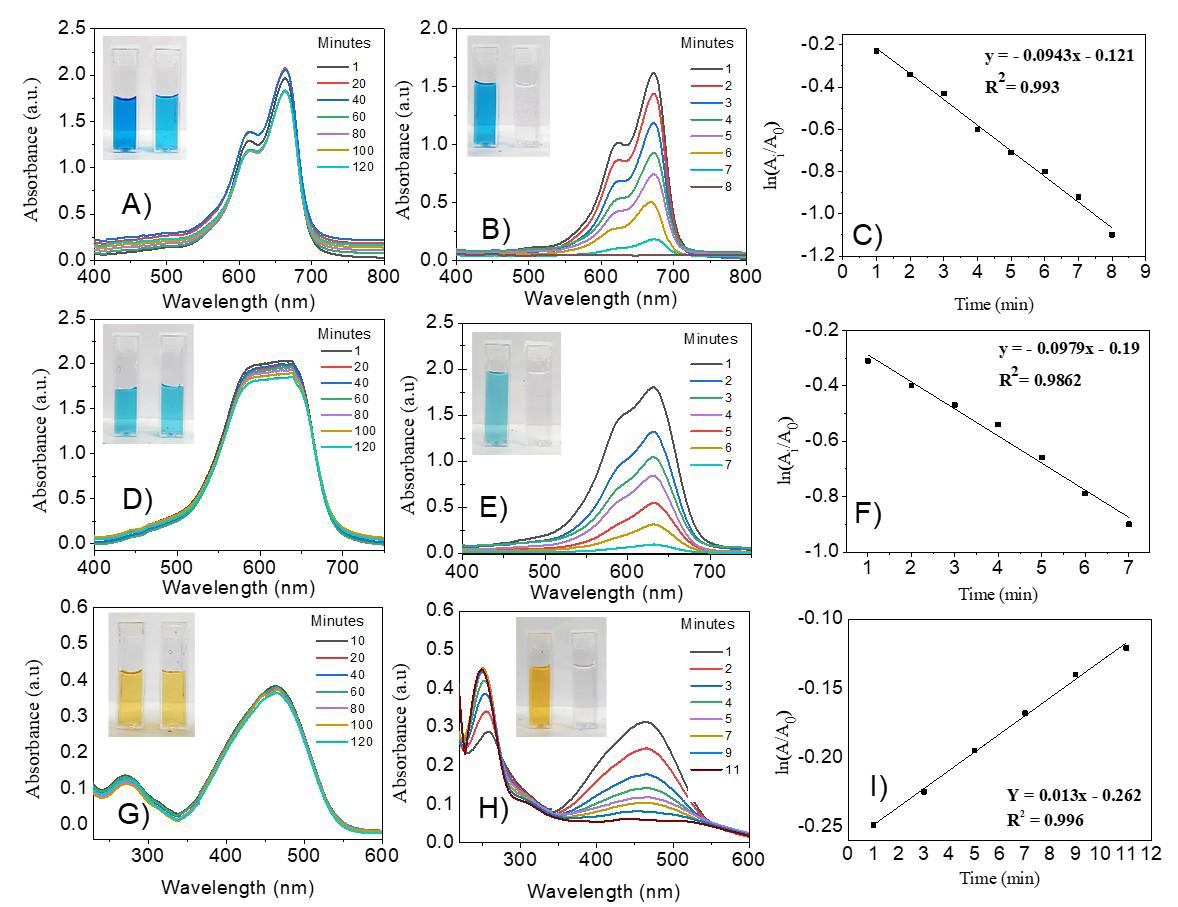
Figure 7. UV-Vis spectra showing the action of AuNPs-GAmb in the degradation of organic dyes. (A) MB + NaBH4, (B) MB + NaBH4 + AuNPs-GAmb, (C) Variation of MB absorbance vs. nanoparticles action time; (D) TB + NaBH4, E) TB + NaBH4 + AuNPs-GAmb, (F) Variation of TB absorbance vs. nanoparticles action time; (G) MO + NaBH4, H) MO + NaBH4 + AuNPs-GAmb, (I) Variation of MO absorbance vs. nanoparticles action time.
Table 2. Results of degradation time, kinetic constant, correlation coefficient and degradation percentage of TB, MB and MO. Dyes
hand, after only 11 minutes of adding 100 μL of AuNPsGAmb to the medium containing the dye, the absorption band at 464 nm reduces considerably, suggesting a rapid degradation promoted by the presence of AuNPs-GAmb, Figure 7H. The MO degradation using AuNPs-GAmb as a catalyst was better than in other studies[32], which achieved a 20-minute degradation time with AuNPs reduced by Persea americana seeds.
Since the concentration of NaBH4 used as a reductant in this study largely exceeds that of the dyes, the reaction rate is assumed to depend only on dye concentration. For this reason, the rate is assumed to be pseudo-first-order kinetics and can be denoted as:
Where:
[C] is the dye concentration at time t, [C0] is the initial concentration value.
Since absorbance is proportional to the solution concentration, the absorbance at time t (A) and time 0 (A0) is comparable to the concentration at time t (C) and time 0 (C0). The linear graphs of ln(A/A0) versus time in both reactions confirmed that the reactions are by pseudo-first-order kinetics (Figure 7C, F, and I). The rate constant of each reaction calculated from the slope of the linear graph of ln(A/A0) versus reaction time is detailed in Table 2. This table also shows the degradation efficiency of the dyes by the catalytic action of AuNPs-GAmb by calculating the % degradation.
In all degradation reactions, AuNPs-GAmb assumed the role of electron transfer mediators between the dye and NaBH4, and the catalytic reduction proceeds by an electron relay effect[33]. As soon as the reagents are adsorbed on the surface of AuNPs-GAmb, the catalytic reaction occurs by electron transmission from BH4- to the dyes, where the nanoparticles assist in the reduction reactions by decreasing the activation energy of these reactions, thus playing the role of an efficient catalyst.
Antioxidants such as metallic nanoparticles inhibit oxidation, preventing the formation of free radicals or even eliminating and decomposing these species. Thus, the antioxidant activity of AuNPs-GAmb was evaluated by the ABTS•+ radical scavenging method. The stabilization of the ABTS•+ radical occurs through the oxidation reaction between the potassium persulfate salt (K2SO5) and the aqueous solution of ABTS•+. Thus, the antioxidant activity of AuNPs-GAmb is evaluated by discoloration of the ABTS•+ radical solution, with the data denoted as the percentage of inhibition of this radical, Figure 8. This study found that AuNPs-GAmb were responsible for inhibiting the ABTS•+ radical in a concentration-
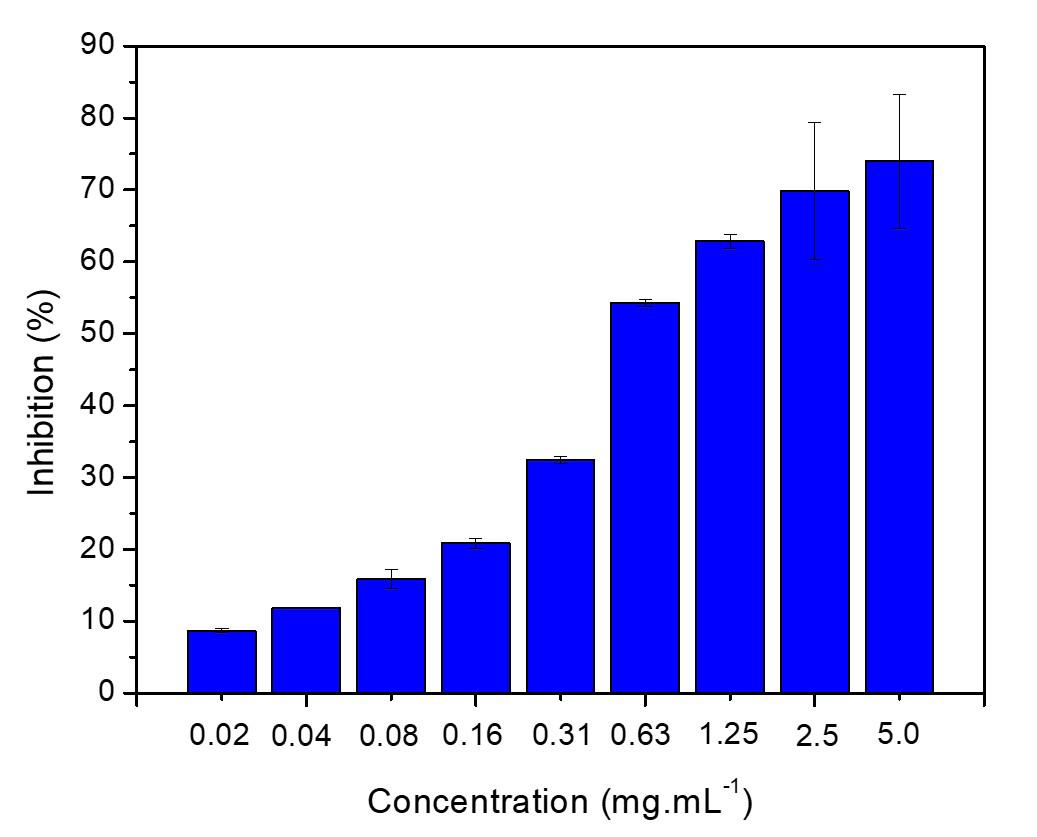
8. Percentage inhibition of the ABTS •+ radical by AuNPs-GAmb.
dependent manner. The IC50 obtained for AuNPs-GAmb was 0.63 ± 0.11 mg mL-1. These results are close to those obtained in other studies involving the antioxidant activity of AuNPs stabilized with natural polymers[34] .
In this study, a route for the green synthesis of gold nanoparticles reduced and stabilized with Amburana cearensis gum (AuNPs-GAmb) was proposed for the first time. Under the optimized conditions, spherical AuNPs-GAmb with a diameter of 13.22 ± 1.86 nm were obtained. AuNPs-GAmb played an efficient role as catalysts in the degradation of harmful dyes, inactivating dyes such as toluidine blue, methylene blue, and methyl orange in less than 11 minutes. In addition, AuNPs-GAmb also showed antioxidant activity against ABTS•+ radical, with IC50 of 0.63 ± 0.11 mg mL-1 . Thus, AuNPs-GAmb are promising, low-cost, and practical green materials for biotechnological applications.
• Conceptualization – Eziel Cardoso da Silva; Emanuel Airton de Oliveira Farias; Thais Danyelle Santos Araújo; Alyne Rodrigues Araújo; Lívio César Cunha Nunes; Carla Eiras.
• Data curation – Eziel Cardoso da Silva; Carla Eiras.
• Formal analysis – Eziel Cardoso da Silva; Carla Eiras.
• Funding acquisition – Carla Eiras.
• Investigation – Eziel Cardoso da Silva; Emanuel Airton de Oliveira Farias; Thais Danyelle Santos Araújo; Alyne
Silva, E. C., Farias, E. A. O., Araújo, T. D. S., Araújo, A. R., Almeida, G. E., Nunes, L. C. C., & Eiras, C.
Rodrigues Araújo; Lívio César Cunha Nunes; Carla Eiras.
• Methodology – Thais Danyelle Santos Araújo; Alyne Rodrigues Araújo; Carla Eiras.
• Project administration – Lívio César Cunha Nunes; Carla Eiras.
• Resources – NA.
• Software – NA.
• Supervision – Carla Eiras; Emanuel Airton de Oliveira Farias.
• Validation – Carla Eiras; Emanuel Airton de Oliveira Farias; Lívio César Cunha Nunes.
• Visualization – Carla Eiras; Emanuel Airton de Oliveira Farias; Lívio César Cunha Nunes.
• Writing – original draft – Carla Eiras; Eziel Cardoso da Silva.
• Writing – review & editing – Carla Eiras; Geanderson Emilio de Almeida; Eziel Cardoso da Silva.
6. Acknowledgements
This work received financial support from CNPq (Process: 310764/2023-8) and INCT iCEIS (process: 406264/2022-8) and FAPEPI/CNPq (process: 00110.000202 /2022-28).
7. References
1 Gómez-López, P., Puente-Santiago, A., Castro-Beltrán, A., do Nascimento, L. A. S., Balu, A. M., Luque, R., & AlvaradoBeltrán, C. G. (2020). Nanomaterials and catalysis for green chemistry. Current Opinion in Green and Sustainable Chemistry, 24, 48-55 http://doi.org/10.1016/j.cogsc.2020.03.001
2 Li, R., Chen, X., Ye, H., & Sheng, X. (2024). Green synthesis of gold nanoparticles from the extract of Crocus sativus to study the effect of antidepressant in adolescence and to observe its aggressive and impulsive behavior in rat models. South African Journal of Botany, 165, 455-465 http://doi.org/10.1016/j. sajb.2023.12.029
3. Younis, H. M., Hussein, H. A., Khaphi, F. L., & Saeed, Z. K. (2023). Green biosynthesis of silver and gold nanoparticles using Teak (Tectona grandis) leaf extract and its anticancer and antimicrobial activity. Heliyon, 9(11), e21698 http://doi. org/10.1016/j.heliyon.2023.e21698. PMid:38027825.
4 Veras, B. O., Moura, G. M. M., Barros, A. V., Silva, M. V., Assis, P. A. C., Aguiar, J. C. R. O. F., Navarro, D. M. A. F., Ximenes, R. M., Wanderley, A. G., Oliveira, M. B. M., & Lopes, A. C. S. (2023). Antinociceptive and anti-inflammatory activities of essential oil of the leaves of Amburana cearensis (Allemão) A.C. Smith. from the semi-arid region of Northeastern Brazil. Journal of Ethnopharmacology, 317, 116858 http:// doi.org/10.1016/j.jep.2023.116858 PMid:37400005.
5 Venkatesan, D., Umasankar, S., Mangesh, V. L., Krishnan, P. S., Tamizhdurai, P., Kumaran, R., & Baskaralingam, P. (2023). Removal of Toluidine blue in water using green synthesized nanomaterials. South African Journal of Chemical Engineering, 45, 42-50 http://doi.org/10.1016/j.sajce.2023.04.006
6 Jayamohan, H., Smith, Y. R., Gale, B. K., Mohanty, S. K., & Misra, M. (2016). Photocatalytic microfluidic reactors utilizing titania nanotubes on titanium mesh for degradation of organic and biological contaminants. Journal of Environmental Chemical Engineering, 4(1), 657-663 http://doi.org/10.1016/j. jece.2015.12.018
7 Deokar, G. K., & Ingale, A. G. (2023). Exploring effective catalytic degradation of organic pollutant dyes using environment benign, green engineered gold nanoparticles. Inorganic Chemistry Communications, 151, 110649 http:// doi.org/10.1016/j.inoche.2023.110649
8 Farias, E. A. O., Almeida, G. E., Araújo, I. C., Araujo-Nobre, A. R., Furtado, N. J. S., Nunes, L. C. C., & Eiras, C. (2024). Screen-printed electrode modified with a composite based on Amburana cearensis gum, multi-walled carbon nanotubes, and gold nanoparticles for electrochemical determination of total isoflavones in soybean cultivars. Journal of Solid State Electrochemistry, 29(3), 1121-1137 http://doi.org/10.1007/ s10008-024-05963-x.
9 Melo, M. A., Jr., Santos, L. S. S., Gonçalves, M. C., & Nogueira, A. F. (2012). Preparação de nanopartículas de prata e ouro: um método simples para introduzir a nanotecnologia em laboratórios de ensino. Quimica Nova, 35(9), 1872-1878 http://doi.org/10.1590/S0100-40422012000900030
10 Silva, A. A. (2016). Síntese e estabilização de nanopartículas de ouro para fins biotecnológicos e cosméticos (Master’s thesis). Universidade de São Paulo, São Paulo
11 Queen, J. E., Prasad, T. A. A., Vithiya, B. S. M., Odhah, O. H., Kumar, N. S., Tamizhdurai, P., Alreshaidan, S. B., Basivi, P. K., Pabba, D. P., & Al-Fatesh, A. S. (2025). Optimized green synthesis of gold nanoparticles from cranberry fruit extract using response surface methodology for enhanced biomedical applications and catalytic degradation. Bioorganic Chemistry, 161, 108546 http://doi.org/10.1016/j.bioorg.2025.108546 PMid:40334423.
12 Princy, K. F. , & Gopinath , A. (2018 ). Optimization of physicochemical parameters in the biofabrication of gold nanoparticles using marine macroalgae Padina tetrastromatica and its catalytic efficacy in the degradation of organic dyes. Journal of Nanostructure in Chemistry, 8(3), 333-342 http:// doi.org/10.1007/s40097-018-0277-2
13 Bogireddy, N. K. R., & Agarwal, L. V. (2019). Persea americana seed extract mediated gold nanoparticles for mercury(II)/ iron(III) sensing, 4-nitrophenol reduction, and organic dye degradation. RSC Advances, 9(68), 39834-39842 http://doi. org/10.1039/C9RA08233F PMid:35541370.
14 Gião, M. S., González‐Sanjosé, M. L., Rivero‐Pérez, M. D., Pereira, C. I., Pintado, M. E., & Malcata, F. X. (2007). Infusions of Portuguese medicinal plants: dependence of final antioxidant capacity and phenol content on extraction features. Journal of the Science of Food and Agriculture, 87(14), 2638-2647. http://doi.org/10.1002/jsfa.3023 PMid:20836172.
15 Silva, J. R. T., Araújo, I. C., Silva, E. C., Santana, M. V., Almeida, G. E., Farias, E. A. O., Lima, L. R. M., Paula, R. C. M., Silva, D. A., Araújo, A. R., & Eiras, C. (2024). Polysaccharide from Cumaru (Amburana cearensis) exudate and its potential for biotechnological applications. Polímeros: Ciência e Tecnologia, 34(1), e20240008 https://doi.org/10.1590/0104-1428.20230025
16 Tessema, B., Gonfa, G., Hailegiorgis, S. M., Prabhu, S. V., & Manivannan, S. (2023). Synthesis and characterization of silver nanoparticles using reducing agents of bitter leaf (Vernonia amygdalina) extract and tri-sodium citrate. NanoStructures & Nano-Objects, 35, 100983 http://doi.org/10.1016/j. nanoso.2023.100983
17. Chopra, H., Bibi, S., Singh, I., Hasan, M. M., Khan, M. S., Yousafi, Q., Baig, A. A., Rahman, M. M., Islam, F., Emran, T. B., & Cavalu, S. (2022). Green metallic nanoparticles: biosynthesis to applications. Frontiers in Bioengineering and Biotechnology , 10 , 874742 http://doi.org/10.3389/ fbioe.2022.874742. PMid:35464722.
18 Kumar, S., Gandhi, K. S., & Kumar, R. (2007). Modeling of formation of gold nanoparticles by citrate method. Industrial
Polímeros, 35(3), e20250029, 2025
Gold nanoparticles based on polysaccharide from Amburana cearensis for organic dyes degradation
& Engineering Chemistry Research, 46(10), 3128-3136 http:// doi.org/10.1021/ie060672j
19 Ji, X., Song, X., Li, J., Bai, Y., Yang, W., & Peng, X. (2007). Size control of gold nanocrystals in citrate reduction: the third role of citrate. Journal of the American Chemical Society, 129(45), 13939-13948 http://doi.org/10.1021/ja074447k PMid:17948996.
20 Al-Radadi, N. S., Al-Bishri, W. M., Salem, N. A., & ElShebiney, S. A. (2024). Plant-mediated green synthesis of gold nanoparticles using an aqueous extract of Passiflora ligularis, optimization, characterizations, and their neuroprotective effect on propionic acid-induced autism in Wistar rats. Saudi Pharmaceutical Journal, 32(2), 101921 http://doi.org/10.1016/j.jsps.2023.101921 PMid:38283153.
21 Ghosh, S., Patil, S., Ahire, M., Kitture, R., Jabgunde, A., Kale, S., Pardesi, K., Bellare, J., Dhavale, D. D., & Chopade, B. A. (2011). Synthesis of gold nanoanisotrops using Dioscorea bulbifera tuber extract. Journal of Nanomaterials, 1, 354793 http://doi.org/10.1155/2011/354793
22 Mohammadi, F. M., & Ghasemi, N. (2018). Influence of temperature and concentration on biosynthesis and characterization of zinc oxide nanoparticles using cherry extract. Journal of Nanostructure in Chemistry, 8(1), 93-102 http://doi.org/10.1007/ s40097-018-0257-6
23 Babaei, Z., Majidi, R. F., Negahdari, B., & Tavoosidana, G. (2018). ‘Inversed Turkevich’ method for tuning the size of gold nanoparticles: evaluation the effect of concentration and temperature. Nanomedicine Research Journal, 3(4), 190-196 http://doi.org/10.22034/nmrj.2018.04.003
24 Armendariz, V., Herrera, I., Peralta-Videa, J. R., Jose-Yacaman, M., Troiani, H., Santiago, P., & Gardea-Torresdey, J. L. (2004). Size controlled gold nanoparticle formation by Avena sativa biomass: use of plants in nanobiotechnology. Journal of Nanoparticle Research, 6(4), 377-382 http://doi.org/10.1007/ s11051-004-0741-4
25 Wuithschick, M., Birnbaum, A., Witte, S., Sztucki, M., Vainio, U., Pinna, N., Rademann, K., Emmerling, F., Kraehnert, R., & Polte, J. (2015). Turkevich in new robes: key questions answered for the most common gold nanoparticle synthesis. ACS Nano, 9(7), 7052-7071 http://doi.org/10.1021/acsnano.5b01579 PMid:26147899.
26 Liu, H., Zhang, M., Meng, F., Wubuli, A., Li, S., Xiao, S., Gu, L., & Li, J. (2024). HAuCl4-mediated green synthesis of highly stable Au NPs from natural active polysaccharides: synthetic mechanism and antioxidant property. International Journal of Biological Macromolecules, 265(Pt 2), 130824 http://doi. org/10.1016/j.ijbiomac.2024.130824. PMid:38492708.
27 Liu , H. , Zhang , M. , Meng , F. , Su , C. , & Li , J. (2023 ). Polysaccharide-based gold nanomaterials: synthesis mechanism, polysaccharide structure-effect, and anticancer activity. Carbohydrate Polymers, 321, 121284. http://doi.org/10.1016/j. carbpol.2023.121284 PMid:37739497.
28 Bhattacharjee, S. (2016). DLS and zeta potential – What they are and what they are not? Journal of Controlled Release, 235, 337-351 http://doi.org/10.1016/j.jconrel.2016.06.017 PMid:27297779.
29 Karami, S., Esfahani, F. E., & Karimi, B. (2023). Gold nanoparticles supported on carbon-coated magnetic nanoparticles: A robust and effective catalyst for aerobic alcohols oxidation in water. Molecular Catalysis, 534, 112772 http://doi.org/10.1016/j. mcat.2022.112772
30. Shahzaib, A., Shaily, Ahmad, I., Alshehri, S. M., Ahamad, T., & Nishat, N. (2024). Green synthesis of ZIF-67 composite embedded with magnetic nanoparticles and ZnO decoration for efficient catalytic reduction of rhodamine B and methylene blue. Chemistry of Inorganic Materials, 2, 100037 http://doi. org/10.1016/j.cinorg.2024.100037
31 Kim, B., Song, W. C., Park, S. Y., & Park, G. (2021). Green synthesis of silver and gold nanoparticles via Sargassum serratifolium extract for catalytic reduction of organic dyes. Catalysts, 11(3), 347 http://doi.org/10.3390/catal11030347
32 Reddy, G. B., Madhusudhan, A., Ramakrishna, D., Ayodhya, D., Venkatesham, M., & Veerabhadram, G. (2015). Green chemistry approach for the synthesis of gold nanoparticles with gum kondagogu: characterization, catalytic and antibacterial activity. Journal of Nanostructure in Chemistry, 5(2), 185-193 http://doi.org/10.1007/s40097-015-0149-y
33 Memon, K., Memon, R., Khalid, A., Al-Anzi, B. S., Uddin, S., Sherazi, S. T. H., Chandio, A., Talpur, F. N., Latiff, A. A., & Liaqat, I. (2023). Synthesis of PVP-capped trimetallic nanoparticles and their efficient catalytic degradation of organic dyes. RSC Advances, 13(42), 29272-29282 http:// doi.org/10.1039/D3RA03663D PMid:37818256.
34 Padalia, H., & Chanda, S. (2021). Antioxidant and anticancer activities of gold nanoparticles synthesized using aqueous leaf extract of Ziziphus nummularia. BioNanoScience, 11(2), 281-294 http://doi.org/10.1007/s12668-021-00849-y
Received: Nov. 25, 2024
Revised: Mar. 18, 2025
Accepted: May 12, 2025
Editor-in-Chief: Sebastião V. Canevarolo
Ágatha Missio da Silva1 , Erick Gabriel Ribeiro dos Anjos1 , Thaís Ferreira da Silva1 , Rieyssa Maria de Almeida Corrêa1 , Thiely Ferreira da Silva1 , Juliano Marini2 and Fabio Roberto Passador1*
1Laboratório de Tecnologia em Polímeros e Biopolímeros – TecPBio, Departamento de Ciência e Tecnologia, Universidade Federal de São Paulo – UNIFESP, São José dos Campos, SP, Brasil
2Departamento de Engenharia de Materiais, Universidade Federal de São Carlos – UFSCar, São Carlos, SP, Brasil
*fabio.passador@unifesp.br
Abstract
Antistatic packaging prevents electrostatic discharge (ESD) damage, protecting electronic components during storage and transport, ensuring reliability in industries like electronics and aerospace. This study develops heterophasic ethylenepropylene copolymer (HEPC) composites reinforced with recycled aircraft graphite for antistatic applications. HEPC composites with 1, 5, and 10 wt% recycled graphite were prepared via twin-screw extrusion and injection molding. Morphological, thermal, rheological, mechanical, and electrical properties were analyzed. Adding 5 wt% graphite increased the elastic modulus by 21.3% and Shore D hardness by 6.1%. Electrical conductivity improved significantly, with a nine-order magnitude increase for 5 wt% graphite, enabling effective electrostatic dissipation. This sustainable approach enhances material performance while promoting circular economy practices by upcycling aerospace waste into high-value functional materials.
Keywords: composites, heterophasic ethylene-propylene copolymer, recycled graphite, antistatic packaging.
Data Availability: Research data is available upon request from the corresponding.
How to cite: Silva, Á. M., Anjos, E. G. R., Silva, T. F., Corrêa, R. M. A., Silva, T. F., Marini, J., & Passador, F. R. (2025). Sustainable heterophasic ethylene-propylene copolymer composites with recycled aircraft graphite for antistatic packaging. Polímeros: Ciência e Tecnologia, 35(3), e20250030. https://doi.org/10.1590/0104-1428.20250016
Antistatic packaging is designed to prevent the accumulation of electrostatic charges, protecting sensitive electronic components and devices from electrostatic discharge (ESD)induced damage[1]. These packaging materials can be conductive, dissipative, or coated with antistatic agents to control charge buildup, ensuring safe handling and transportation. Commonly used in the electronics and aerospace industries, antistatic packaging plays a crucial role in maintaining the integrity and functionality of electronic circuits, semiconductors, and other static-sensitive materials[2]. With technological advancements and the increasing consumption of electronic devices, proper packaging for transportation and storage has become even more critical. A significant challenge in this context is electrostatic discharge (ESD), which can occur due to friction between an electronic component and its packaging. ESD can damage these components, potentially causing small explosions that result in permanent loss of functionality[3]. Detecting and repairing ESD-related damage is often unfeasible due to the high costs involved, significantly contributing to electronic waste and increasing
both financial and environmental burdens[4,5]. To address this issue, antistatic packaging has been developed to protect electronic components by dissipating static charges in a controlled manner[6].
In recent decades, polymers have emerged as competitive alternatives to traditional packaging materials due to their low density, cost-effective production, and ease of processing[7]. The most commonly used polymers for antistatic packaging are polyethylene (PE), polypropylene (PP), polyamide 6 (PA6), and polystyrene (PS), which exhibit high electrical resistivity, acting as electrical insulators and hindering the electrostatic charge dissipation[8 9]
To be used as antistatic packaging, polymers must not only meet mechanical requirements but also exhibit low electrical resistivity[10]. Since most polymers inherently have high electrical resistivity, it is necessary to incorporate antistatic agents, which are electrically conductive components. Among the most widely researched antistatic agents are graphene and graphene-related materials (GRM)[11], semiconducting
Silva, Á. M., Anjos, E. G. R., Silva, T. F., Corrêa, R. M. A., Silva, T. F., Marini, J., & Passador, F. R.
ceramic particles[6], conductive carbon black[12], graphite[13], and carbon nanotubes (CNT)[14]. The incorporation of recycled conductive fillers, such as graphite, into polymer matrices offers a sustainable approach to developing highperformance antistatic packaging solutions[13]
Graphite exhibits outstanding properties, including high electrical conductivity, chemical stability in hightemperature and non-oxidizing environments, significant resistance to thermal shocks, and favorable characteristics for mechanical processing. This work proposes the use of heterophasic ethylene-propylene copolymer (HEPC) as a polymeric matrix. HEPC stands out due to its excellent mechanical properties, such as tensile strength and impact resistance. Additionally, it offers the advantage of being more cost-effective compared to engineering polymers[15] Graphite was incorporated as an antistatic agent to reduce electrical resistivity and achieve the required properties for antistatic packaging applications, characterizing the material as a polymer matrix composite (PMC)[16,17]
Polymer matrix composites (PMCs) are widely used in various technological fields, particularly in the aerospace industry. Their increasing demand in this sector is primarily due to their excellent strength-to-weight ratio, which enhances fuel efficiency and reduces operational costs. On average, commercial aircraft have a lifespan of approximately 20 years, and PMCs constitute around 18.7% of the materials used in their construction. As material advancements continue, this percentage is expected to increase, making the recovery of these composites increasingly important. In this study, mechanical recycling was employed to recover graphite from aircraft waste[18]
Zaggo et al.[13] investigated the use of recycled graphite as an antistatic agent in poly(trimethylene terephthalate) (PTT) composites for antistatic packaging. The authors incorporated recycled graphite into PTT at concentrations ranging from 1 to 20 wt%, with and without a compatibilizer agent (PTT-g-MA), processed by melt extrusion. The findings showed that adding 10 wt% of recycled graphite significantly reduced the electrical resistivity of PTT, making the composite suitable for antistatic applications. The study emphasized the potential of recycled graphite to improve the electrical, thermal, and mechanical properties of polymer composites while promoting sustainability.
Panwar et al.[19] analyzed the dielectric and electromagnetic interference (EMI) shielding properties of polypropylene (PP)-graphite composites. The results indicated that the composites follow the percolation theory model, with the percolation threshold occuring at approximately 5wt% of graphite, beyond which the composites exhibit nearly ohmic behavior. Additionally, the dielectric constant and dissipation factor significantly increases at low and radio frequencies, suggesting potential applications in electromagnetic shielding and electronic devices.
In this work, antistatic packaging based on HEPC with varying contents of recycled graphite from aerospace components was developed. The influence of different graphite contents (1, 5, and 10 wt%) on the rheological, thermal, mechanical, and electrical properties of the HEPCgraphite composites was analyzed, highlighting the potential for developing sustainable, high-performance materials
for advanced packaging solutions. The results not only demonstrate significant improvements in material properties but also provide a pathway for integrating recycled aerospace waste into valuable, functional applications, offering both environmental and technological benefits.
2.1
Heterophasic ethylene-propylene copolymer (HEPC) specified as ES 540S, with a melt flow index of 42 g/10 min (230 °C/2.16 kg) and a density of 0.90 g/cm3 was supplied by Braskem (Brazil). The recycled graphite was supplied by companies from Vale do Paraíba region (Brazil) as components of the aerospace sector. The pieces were ground, and the resulting powder was purified and characterized.
Firstly, the recycled graphite powder was subjected to heat treatment in a tubular furnace (EDG) at 1100°C, with a heating rate of 20°C/min, held for 2 hours under a nitrogen atmosphere, and then cooled at a controlled rate of 30 °C/min to remove residual oils from the aerospace components. The particle size of the powder was homogenized using a 100-mesh sieve.
HEPC composites with different recycled graphite contents (1, 5, and 10 wt%) were prepared by melt mixing method in a co-rotating twin-screw mini extruder from AX Plásticos (model AX16:40DR), with L/D = 40 mm, D = 16 mm and maximum material flow rate of 2 kg/h. The temperature profile was 225/230/240/240/245 ºC, and the feeding and screw speeds were 15 and 80 rpm, respectively. The nomenclature used for the compositions is based on the recycled graphite content. For example, HEPC/1% graphite refers to a composition containing 1 wt% of recycled graphite.
After the extrusion process, the composite filaments were cooled in a water bath at room temperature, pelletized, and then dried in a vacuum oven at 60 °C for 4 hours. Finally, the pellets were injection-molded using a vertical injection molding hot press (manufactured by MH Equipamentos, Brazil) with a barrel temperature of 255 °C, an injection mold pressure of 8 bar, and a mold temperature of 50 °C. The composites were molded in an aluminum injection mold into Type I tensile test specimens, according to ASTM D638-18[20], and Izod impact strength test specimens, according to ASTM D256-06[21]
2.3 Characterizations of recycled graphite, HEPC and composites
2.3.1 Morphological characterization of the recycled graphite, HEPC and composites
The morphologies of the recycled graphite, HEPC, and the composites were analyzed using scanning electron microscopy (SEM) with an Inspect S50 (FEI Company) microscope, equipped with secondary electron (SE) detectors. It was operated at 5 keV, and the samples were placed on aluminum stubs and coated with a thin layer of gold using sputtering.
Sustainable heterophasic ethylene-propylene copolymer composites with recycled aircraft graphite for antistatic packaging
2.3.2 Rheological characterization
The tests in the steady shear and oscillatory regimes were performed using the ARG2 controlled stress rheometer (TA Instruments), with parallel plate geometry of 25 mm diameter and distance between plates of 1.0 mm, at 250 °C under a nitrogen atmosphere (N2). The viscoelastic properties of complex viscosity (η*), storage modulus (G’), and loss modulus (G’’) were analyzed as a function of angular frequency. For the oscillatory tests, strain sweep tests were performed to select a strain amplitude within the linear viscoelastic range (0.5% for all samples).
2.3.3 Electrical characterization
The impedance spectroscopy measurements were conducted using a Solartron SI 1260 impedance analyzer from AMETEK Scientific Instruments, operated at 25 °C and a voltage amplitude of 0.5 V. The volumetric electrical conductivity on alternating current (AC) and the complex permittivity (ε*) were evaluated at the frequency range of 1 to 106 Hz.
The samples were prepared by hot pressing the material between two metal plates, prepared with Chemlease® 41-90 EZ release agent from Chem-Trend. The press used was from MH Equipamentos, model PR8HP. Then, a thin layer of a Gold-Palladium (Au-Pd) alloy was deposited on the faces of the samples as electrodes using the sputtering process. This process was performed in a Q150R ES metallizer from Quantum, with a metalization time of 90s and a current of 20 mA.
2.3.4 Thermal characterization
The thermal behavior of the samples was evaluated using differential scanning calorimetry (DSC) with a TA Instruments Q2000 equipment, operating with nitrogen as the carrier gas at a constant flow rate of 50 mL/min. The samples underwent a thermal cycle consisting of heating at 10 °C/min from -20 °C to 250 °C, where they were held for 3 minutes to eliminate thermal history. Subsequently, they were cooled at 10 °C/min from 250 °C to -20 °C and then reheated at the same rate for a second heating cycle up to 250 °C.
The degree of crystallinity (Xc) was calculated based on the corrected enthalpy of fusion (ΔHmcorr) of the samples and the standard enthalpy of PP when it is 100% crystalline (ΔHmo = 190 J/g)[15]. ΔHmcorr were considered based on the graphite content (ϕ) in the samples, since the measured ΔHm refers only to the neat polymer.
of 50 kN. For each composition, 5 samples were tested according to ASTM D638-18[20]
Izod Impact Strength: A CEAST/Instron Izod impact test machine, model 9050, coupled with a 1.0 J hammer was used to perform the tests. Five samples of each composition were tested according to ASTM D256-06[21]. For the test, the samples were notched with a 0.1-inch depth notch using a manual notching machine.
Statistical Analysis: A one-way analysis of variance (ANOVA) followed by a post-hoc Tukey HSD test to compare pairs at α = 0.05 of significance were executed on the mechanical properties data.
3.1 Recycled graphite characterization
Figure 1 shows the SEM image of recycled graphite. A homogeneous surface is observed, indicating the compaction of the graphite. This suggests that the applied thermal treatment effectively prevented graphite dispersion by removing residual surface impurities. As discussed by Zaggo et al.[13], the removal of these impurities significantly enhances the graphite structure, improving its properties and ensuring greater stability and performance.
3.2 Morphology of the HEPC and composites
The morphology of the HEPC exhibited a heterogeneous structure, with visible cavities within a more continuous matrix, likely indicating PE domains dispersed throughout the PP matrix (Figure 2a). Due to the high immiscibility of these two blocks[23], the secondary PE domains may contribute to the stiffness of the PP. Notably, these domains are not spherical, as would typically be observed in a PE/PP polymer blend[24], suggesting a distinct morphological interaction specific to the block copolymer.
In composites containing 1, 5, and 10 wt% recycled graphite, initial observations at 1wt% revealed only a few graphite fragments within the analyzed region of the matrix. However, as the concentration increased to 5 and 10 wt%,
2.3.5 Mechanical characterization
Shore D Hardness Test: The average hardness of each composition was obtained through the Shore D hardness test at 9 different points on the surface of the specimen using a portable digital durometer (Instrutherm, model DP 400), according to ASTM D2240[22]
Tensile Tests: The tests were performed on an MTS machine, model Criterion 45, with a crosshead speed of 50 mm/min and a load cell with a maximum capacity
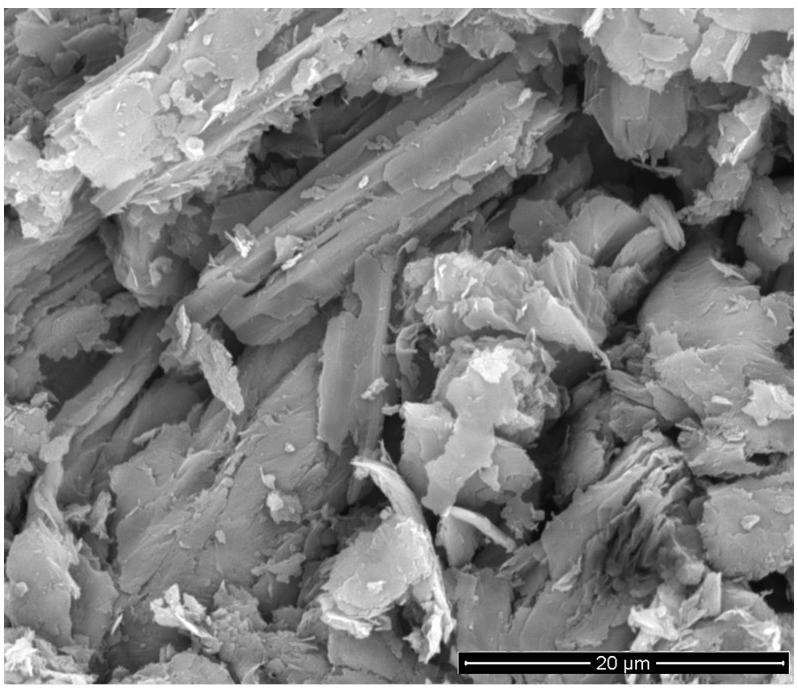
Silva, Á. M., Anjos, E. G. R., Silva, T. F., Corrêa, R. M. A., Silva, T. F., Marini, J., & Passador, F. R.
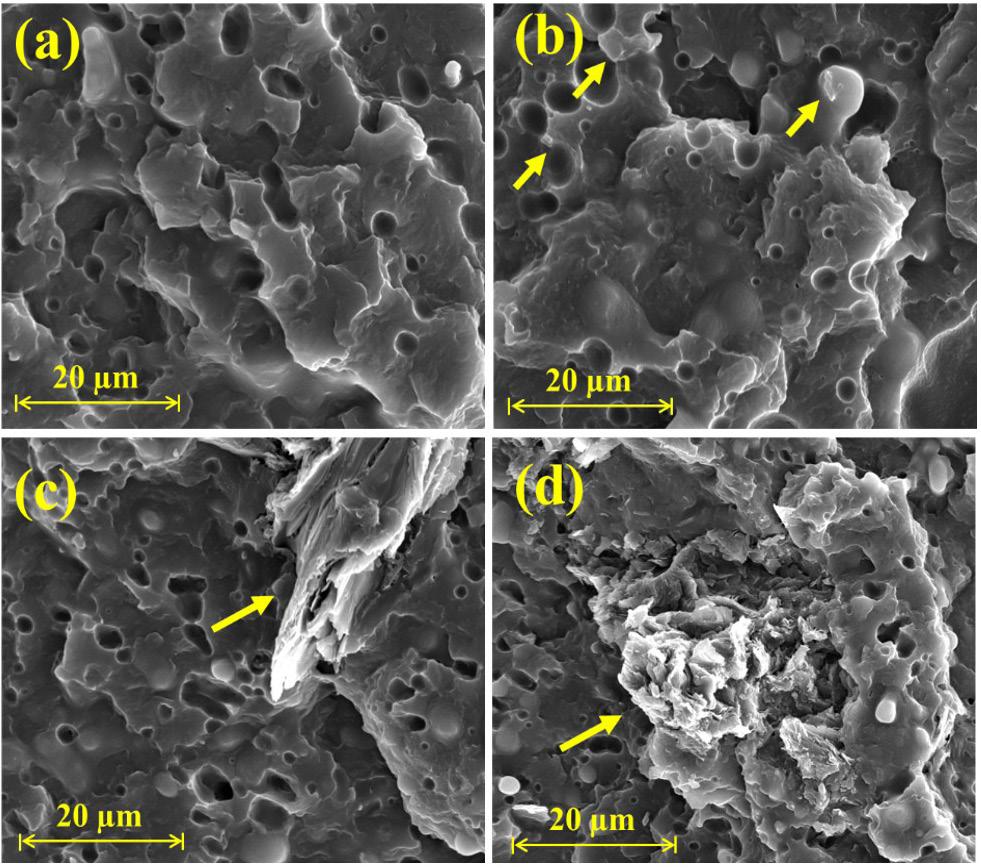
larger agglomerates of ground-recycled graphite were observed, and the layered structure of ground-recycled graphite became evident. The coarse morphology and agglomerate formation differed from previous findings in PTT-recycled graphite composites, likely due to the heterogeneous nature of the HEPC matrix. This structure could potentially be improved with the addition of a compatibilizer agent, as suggested by Zaggo et al.[13]
The rheological behavior of the composites was studied in the oscillatory regime to better understand their viscoelastic properties and their relationship with morphological features (Figure 3a-c). Additionally, rotational testing in the steadystate regime was conducted to evaluate flow behavior at low shear rates (Figure 3d). The HEPC copolymer exhibited a low complex viscosity (103 to 102 Pa·s), with a significant decrease in the terminal angular frequency range (10-2 to 100 rad/s). This drop may be attributed to the stiffer PP chain segments within the heterogeneous copolymer structure. As expected, a liquid-like behavior was observed, with the loss modulus exceeding the storage modulus across most angular
frequencies. Notably, the Cox-Merz rule did not apply to this copolymer, which may be related to phase separation[25], as evidenced by differing behaviors between complex and steady-state viscosity in the terminal region, where the more structured chain features were not visible at low shear rates.
Literature suggests that adding graphite powder to a polymer matrix can create a lubricating effect, facilitating the slippage of polymer chains along the graphite surface and improving flow[26]. This effect was particularly pronounced in the PP segments, where higher graphite concentrations (5 and 10 wt%) led to a reduction in complex viscosity, primarily by decreasing the storage modulus at low frequencies. Despite these changes, the overall viscosity remained largely unaffected by graphite concentration - a favorable outcome for its use as a filler, as it does not compromise the processability of the polymer.
3.4 Electrical characterization of the HEPC and composite films
The intrinsic conductivity of graphite arises from its sp2-hybridized hexagonal lattice structure[13]. Consequently,
Sustainable heterophasic ethylene-propylene copolymer composites with recycled aircraft graphite for antistatic packaging
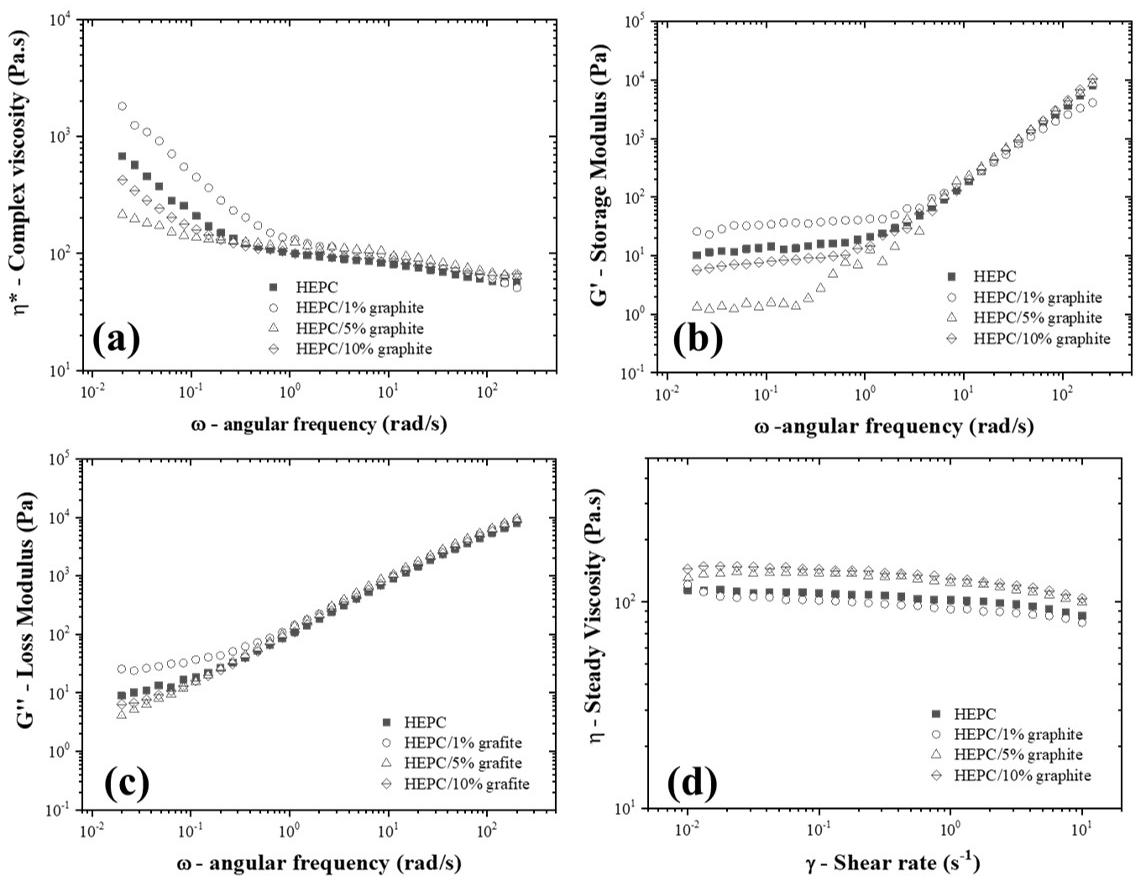
incorporating graphite fragments into a polymer matrix may enhance its electrical conductivity, providing potential benefits for applications such as electrostatic discharge (ESD) protection. AC volumetric electrical conductivity of the films was measured via impedance spectroscopy (Figure 4). The PE/PP block copolymer exhibited typical insulating behavior, with electrical conductivity values below 10−10 S/cm and a frequency-dependent response attributed to variations in electric field incidence.
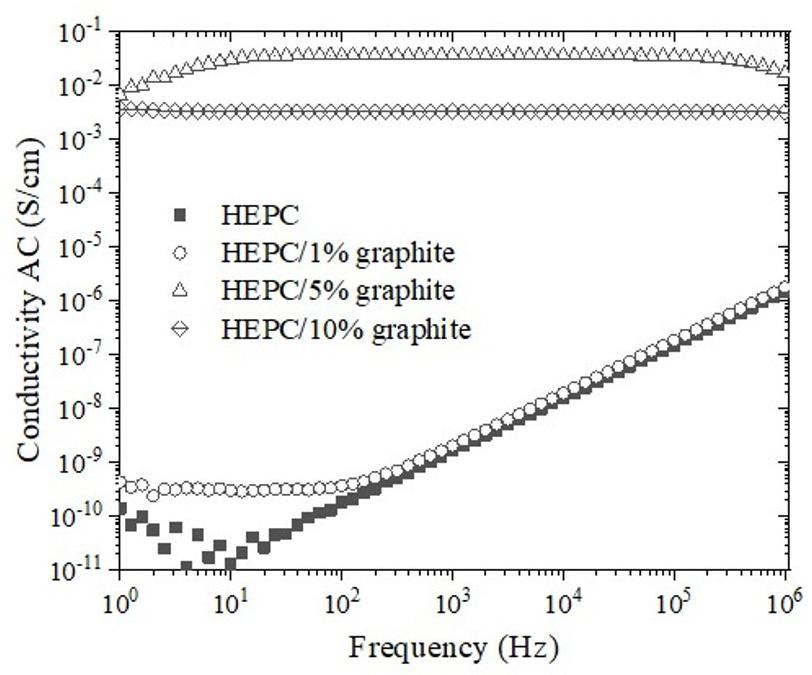
3.5 Thermal characterization of HEPC and composites
Figure 5 shows the DSC curves obtained during the first heating, cooling, and second heating stages, while
Adding 1 wt% graphite did not significantly impact the electrical conductivity of the polymer. However, compositions with 5 wt% and 10 wt% graphite exhibited similar electrical conductivity profiles, dramatically increasing around six orders of magnitude and transitioning to semiconducting behavior suitable for ESD applications, with electrical conductivity around 10-3 S/cm[12]. Two key factors are noteworthy: first, the film form of the samples, which, as observed in a previous study[27] , can lead to higher electrical conductivity values for carbon-based materials; and second, the measurement of volumetric rather than surficial conductivity, which may be more relevant for ESD applications. In certain carbon-based nanocomposites, such as those containing carbon black and higher filler contents, volumetric and surface conductivity values can often converge. Given the obtained electrical conductivity values, composites with 5 wt% and 10 wt% recycled graphite are suitable for use in antistatic packaging.
Silva, Á. M., Anjos, E. G. R., Silva, T. F., Corrêa, R. M. A., Silva, T. F., Marini, J., & Passador, F. R.
the thermal analysis results are summarized in Table 1. No significant difference was observed in the melting temperature (Tm1 = 169°C, Tm2 = 163°C) between the samples. This may suggest that graphite addition had no significant influence on the melting behavior of the HEPC matrix. This conclusion is further supported by the heating curves of all composites, which were nearly identical. Comparing the HEPC sample with the composites reinforced with graphite, a 3°C increase in the crystallization temperature was observed in the HEPC/10% graphite sample. The addition of graphite slightly reduced the degree of crystallinity of the composites from 38% to 34%, depending on the recycled graphite content, suggesting that graphite may act as a barrier to crystallite growth. Similar results were observed by Sarturato et al.[15] in their study on polypropylene/talc hybrid composites with graphene nanoplatelets (GNP). It is important to highlight
that the same polymer matrix was used, and the decision to use the enthalpy of fusion value for the 100% crystalline PP sample was made to ensure a consistent comparison within the studied samples.
3.6 Mechanical characterization of HEPC and composites
Table 2 presents the mechanical properties of the samples, and Figure 6A shows the stress-strain curves. The ultimate tensile strength (UTS), deformation at the break, elastic modulus (E), Shore D hardness, and impact strength were statistically analyzed. Table 2 highlights the statistical differences when comparing the composites with HEPC, with results showing significant differences (p < 0.001). Figure 7 shows the comparative results for elastic modulus and Shore D hardness, accompanied by ANOVA analysis.
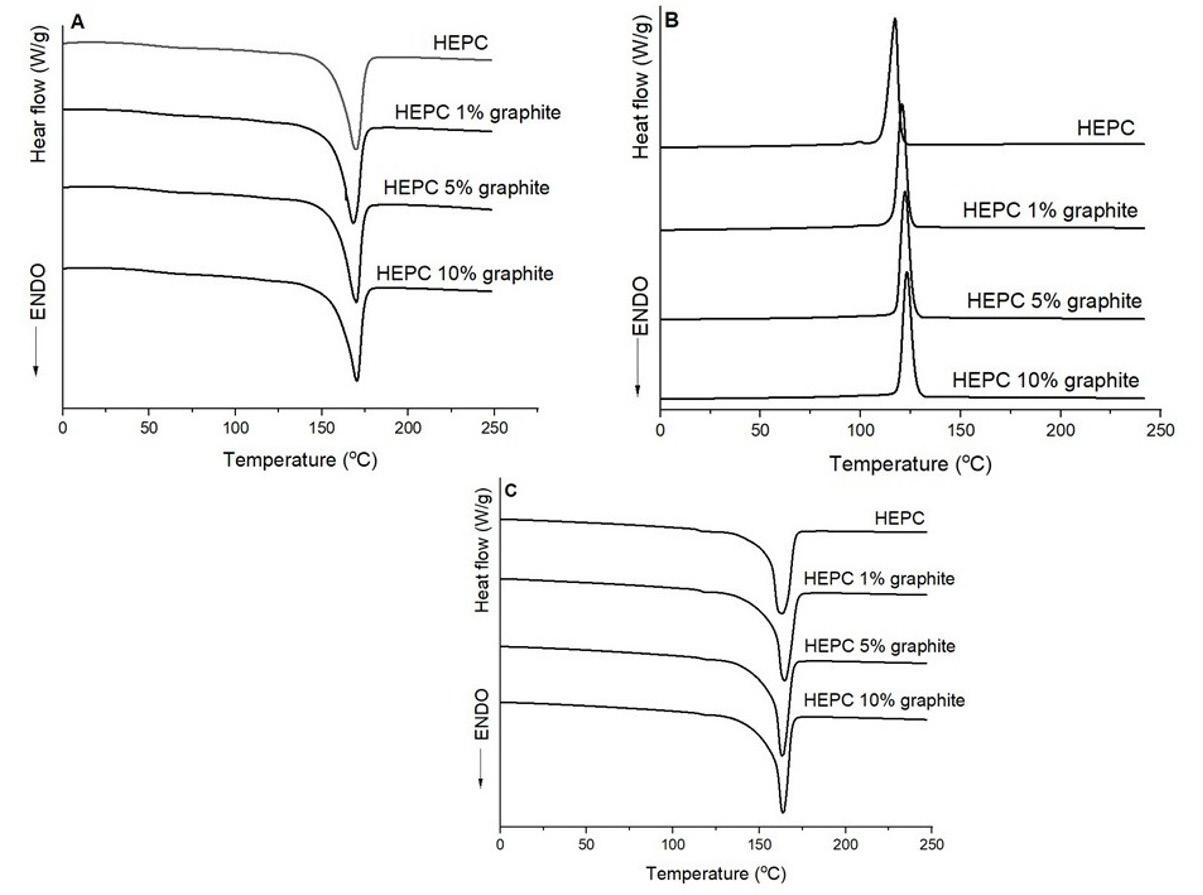
Figure 5. Differential scanning calorimetry curves (A) first heating, (B) cooling, and (C) second heating of the HEPC and HEPC composites with 1, 5, and 10 wt% of recycled graphite.
Table 1. Thermal properties obtained from DSC heating curves of the first heating scan, cooling, and second heating scan for HEPC and HEPC composites with 1, 5, and 10 wt% recycled graphite.
Sustainable heterophasic ethylene-propylene copolymer composites with recycled aircraft graphite for antistatic packaging
Table 2. Mechanical properties of HEPC and HEPC composites with different graphite contents.
Samples
Mean values followed by the same letter do not differ according to the Tukey–Kramer test at a 0.05 significance level.
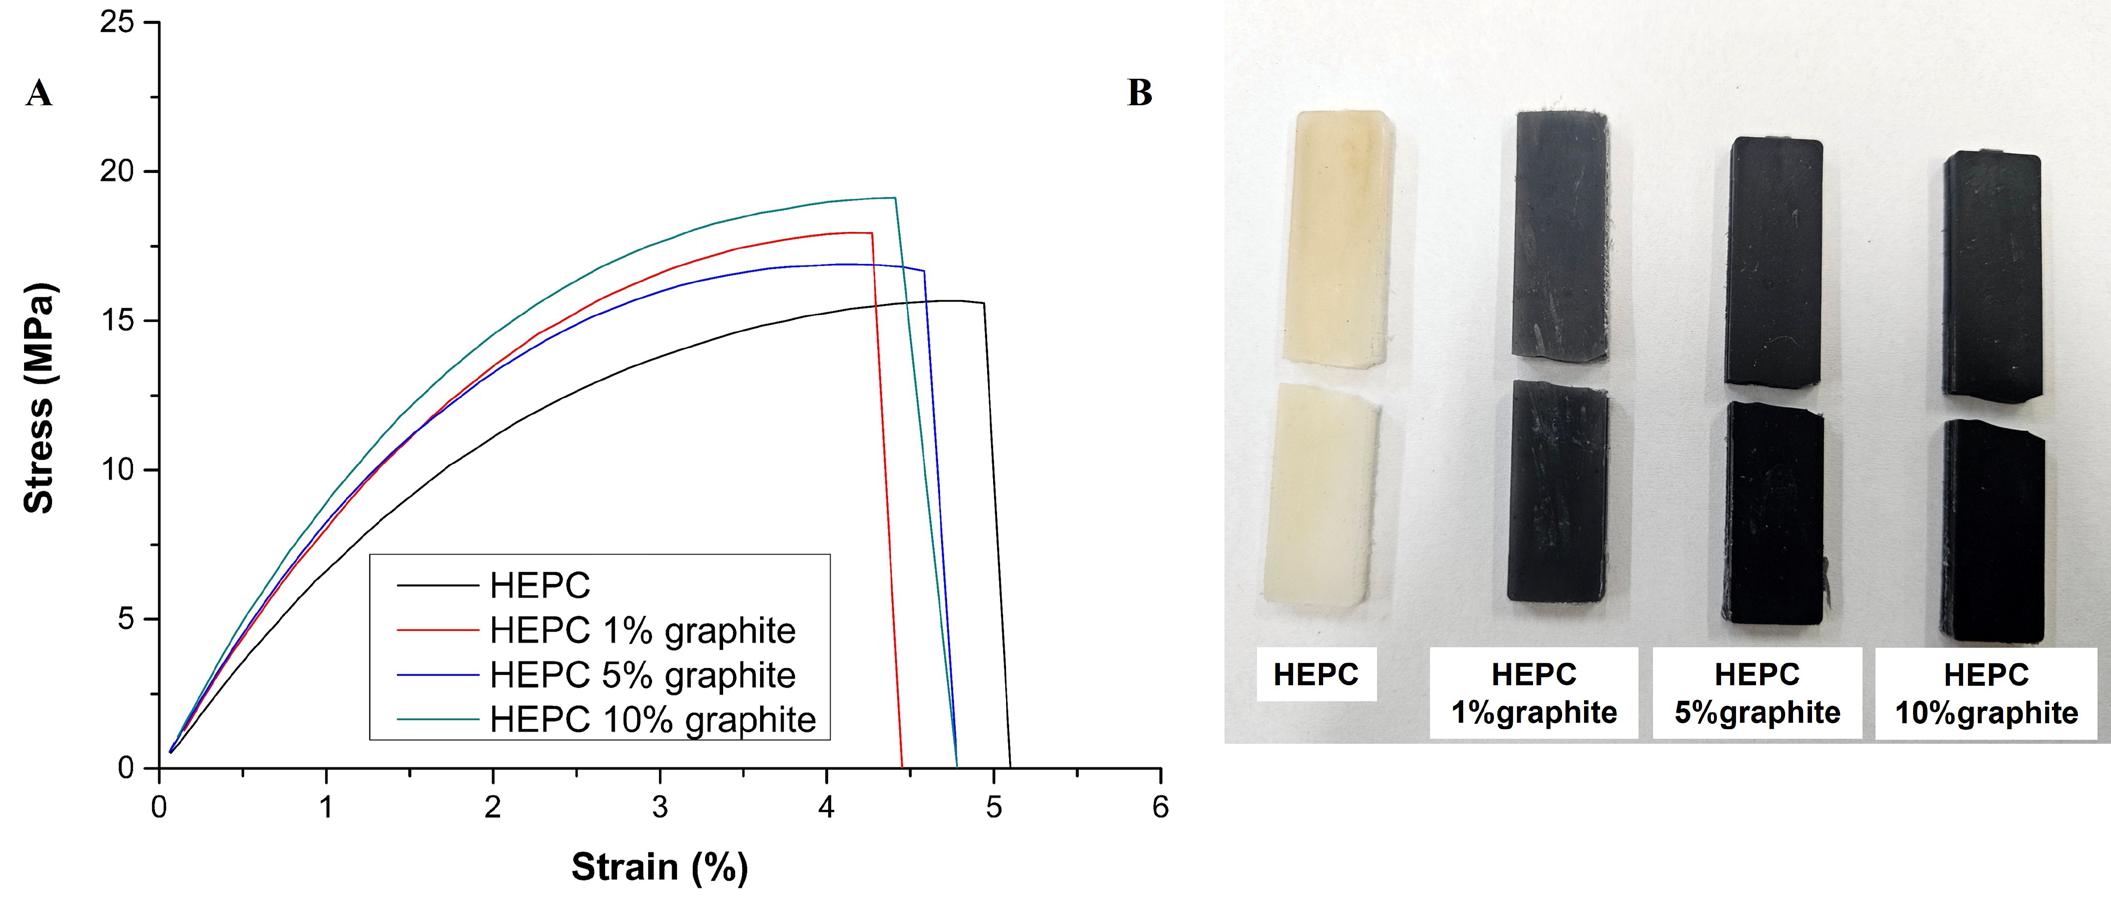
Figure 6. (A) Stress–strain curves and (B) specimens after Izod impact resistance test for HEPC and HEPC composites with different graphite contents.
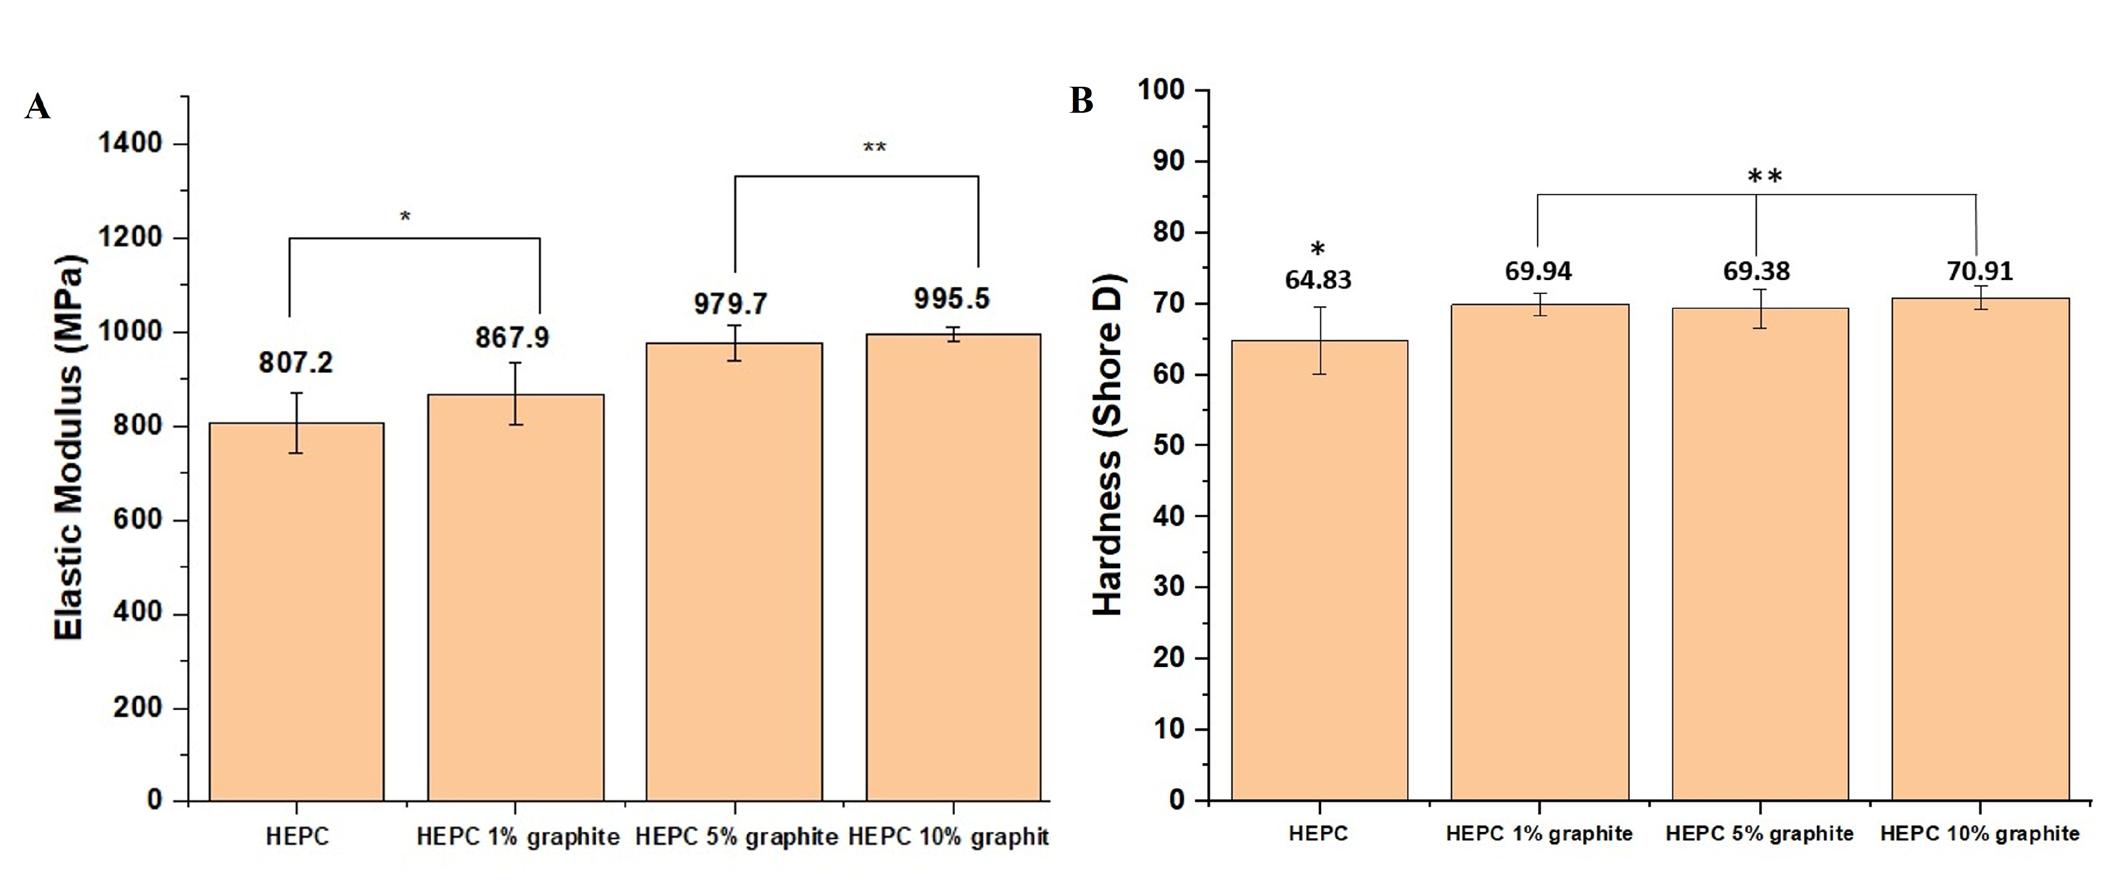
Figure 7. Mechanical test results: (A) Elastic modulus and (B) Shore D Hardness for HEPC and HEPC composites with different graphite contents. Results are given as mean ± standard deviation. Asterisks (*) indicate statistical significance (*p ≤ 0.01; ** p ≤ 0.001).
The incorporation of 10 wt% of recycled graphite resulted in a 23.3% increase in elastic modulus compared to the HEPC matrix, representing the best performance among the samples analyzed. Additionally, the addition of 1 wt% and 5 wt% of recycled graphite also showed promising results, increasing
elastic modulus by 7.5% and 21.3%, respectively, compared to HEPC. This behavior can be attributed to the high intrinsic stiffness of graphite, which restricts the mobility of polymer chains. Consequently, the increase in elastic modulus led to a reduction in deformation at break with the addition of graphite.
Silva, Á. M., Anjos, E. G. R., Silva, T. F., Corrêa, R. M. A., Silva, T. F., Marini, J., & Passador, F. R.
Regarding tensile strength, represented by the ultimate tensile strength (UTS), the composites exhibited slight variations, with all samples showing similar values. This indicates that the addition of recycled graphite (1, 5, and 10 wt%) did not have a significant impact on the UTS.
An analysis of the Shore D hardness results reveals that incorporating graphite into the HEPC matrix led to an approximately 10% increase in Shore D hardness. However, varying the graphite concentration between 1, 5, and 10 wt% did not significantly affect this increase, as all three concentrations exhibited similar hardness values. Considering the standard deviation, the value obtained for the copolymer was comparable to that reported by Alfaro et al. [28]. Regarding impact resistance, the results indicate that the addition of recycled graphite (1, 5, and 10 wt%) did not significantly affect the impact strength of HEPC composites, with values remaining close to those of the neat material (HEPC). Therefore, at the studied concentrations and processing conditions, graphite incorporation does not compromise the impact resistance of the composites, which may be advantageous for applications where maintaining this property is essential.
As expected, the fracture type was identified as brittle for all analyzed compositions, a characteristic behavior of propylene. The fracture of the samples (Figure 6B) occurred at approximately half their length during the Izod impact strength test, indicating that the HEPC composite with recycled graphite has a homogeneous distribution and uniform mechanical properties. This suggests that the manufacturing process was efficient, and that the addition of graphite did not compromise the structural integrity of the material.
Heterophasic ethylene-propylene copolymer (HEPC) composites with varying levels of recycled graphite were successfully produced by extrusion. The resulting properties suggest that this material is suitable for use as antistatic packaging.
The morphological analysis indicated that the composition containing 1 wt% of graphite exhibited good particle dispersion, suggesting a homogeneous distribution in the polymer matrix. However, with an increase in graphite content from 5% to 10 wt%, agglomerations were observed, suggesting that dispersion becomes less efficient at higher concentrations. The addition of recycled graphite slightly decreased the degree of crystallinity of the composites from 38% to 34%, according to the added graphite content, indicating that graphite could act as a possible barrier to crystallite growth.
Regarding mechanical properties, the addition of recycled graphite significantly increased the elastic modulus and Shore D hardness compared to the neat copolymer. However, it led to a slight reduction in tensile strength and Izod impact resistance. Additionally, electrical properties through impedance spectroscopy testing showed that incorporating recycled graphite significantly enhanced the electrical conductivity of the composite, thereby decreasing its electrical resistivity and making it suitable for antistatic packaging applications.
Among the studied compositions, the addition of 5 wt% of recycled graphite resulted in the best balance, improving mechanical properties while ensuring sufficient electrical resistivity for antistatic packaging use.
• Conceptualization – Fabio Roberto Passador.
• Data curation – Fabio Roberto Passador.
• Formal analysis – Ágatha Missio da Silva; Erick Gabriel Ribeiro dos Anjos; Thaís Ferreira da Silva; Rieyssa Maria de Almeida Corrêa; Thiely Ferreira da Silva; Juliano Marini.
• Funding acquisition – Fabio Roberto Passador.
• Investigation – Ágatha Missio da Silva.
• Methodology – Ágatha Missio da Silva.
• Project administration – Fabio Roberto Passador.
• Resources – Fabio Roberto Passador.
• Software – NA.
• Supervision – Fabio Roberto Passador.
• Validation – Erick Gabriel Ribeiro dos Anjos; Thaís Ferreira da Silva; Rieyssa Maria de Almeida Corrêa; Thiely Ferreira da Silva.
• Visualization – Juliano Marini.
• Writing – original draft – Ágatha Missio da Silva.
• Writing – review & editing – Erick Gabriel Ribeiro dos Anjos; Thaís Ferreira da Silva; Rieyssa Maria de Almeida Corrêa; Thiely Ferreira da Silva; Juliano Marini; Fabio Roberto Passador.
The authors are grateful to FAPESP (Fundação de Amparo à Pesquisa do Estado de São Paulo, process 2024/11092-8) and CNPq (Conselho Nacional de Desenvolvimento Científico e Tecnológico, process 307933/2021-0) for financial support. The authors also thank the company Lyondell Basell for the donation of HEPC.
1 Silva, T. F., Menezes, F., Montagna, L. S., Lemes, A. P., & Passador, F. R. (2018). Preparation and characterization of antistatic packaging for electronic components based on poly(lactic acid)/carbon black composites. Journal of Applied Polymer Science, 136(13), 47273 http://doi.org/10.1002/ app.47273
2 Vieira, L. S., Anjos, E. G. R., Verginio, G. E. A., Oyama, I. C., Braga, N. F., Silva, T. F., Montagna, L. S., & Passador, F. R. (2022). A review concerning the main factors that interfere in the electrical percolation threshold content of polymeric antistatic packaging with carbon fillers as antistatic agent. Nano Select, 3(2), 248-260 https://www.doi.org/10.1002/ nano.202100073.
3 Singh, S., & El-Khateeb, H. (1994). Evaluation of a proposed test method to measure surface and volume resistance of static dissipative packaging materials. Packaging Technology & Science, 7(6), 357-362 http://doi.org/10.1002/pts.2770070605
Sustainable heterophasic ethylene-propylene copolymer composites with recycled aircraft graphite for antistatic packaging
4 Mojzes, Á., Tóth, B., & Csavada, P. (2014). Investigation of an electrostatic discharge protective biodegradable packaging foam in the logistic chain. Logistics, Supply Chain, Sustainability and Global Challenges, 5(1), 25-33 https://www.doi.org/10.1515/ jlst-2015-0004
5 Santos, M. S., Montagna, L. S., Rezende, M. C., & Passador, F. R. (2019). A new use for glassy carbon: development of LDPE/glassy carbon composites for antistatic packaging applications. Journal of Applied Polymer Science, 136(11), 47204 http://doi.org/10.1002/app.47204
6. Zhou, Y., Wang, H., Wang, L., Yu, K., Lin, Z., He, L., & Bai, Y. (2012). Fabrication and characterization of aluminum nitride polymer matrix composites with high thermal conductivity and low dielectric constant for electronic packaging. Materials Science and Engineering B, 117(11), 892-896. http://doi. org/10.1016/j.mseb.2012.03.056
7 Huang, H.-D., Ren, P.-G., Zhong, G.-J., Olah, A., Li, Z.-M., Baer, E., & Zhu, L. (2023). Promising strategies and new opportunities for high barrier polymer packaging films. Progress in Polymer Science, 144, 101722 http://doi.org/10.1016/j. progpolymsci.2023.101722
8 Lee, J.-I., Yang, S.-B., & Jung, H.-T. (2009). Carbon nanotubes− polypropylene nanocomposites for electrostatic discharge applications. Macromolecules, 42(21), 8328-8334 http://doi. org/10.1021/ma901612w
9 Rousseaux, D., Lhost, O., & Lodefier, P. (2013). Industrial advanced carbon nanotubes-based materials for electrostatic discharge packaging. In Proceedings of the 14th International Conference on Electronic Packaging Technology (ICEPT) (pp. 386-388). USA: IEEE http://doi.org/10.1109/ICEPT.2013.6756495
10. Vieira, L. S., Anjos, E. G. R., Verginio, G. E. A., Oyama, I. C., Braga, N. F., Silva, T. F., Montagna, L. S., Rezende, M. C., & Passador, F. R. (2021). Carbon-based materials as antistatic agents for the production of antistatic packaging: a review. Journal of Materials Science Materials in Electronics, 32(4), 3929-3947 http://doi.org/10.1007/s10854-020-05178-6
11 Bhardwaj, P., & Grace, A. N. (2020). Antistatic and microwave shielding performance of polythiophene-graphene grafted 3-dimensional carbon fibre composite. Diamond and Related Materials, 106, 107871 http://doi.org/10.1016/j. diamond.2020.107871
12 Silva, L. N., dos Anjos, E. G. R., Morgado, G. F. M., Marini, J., Backes, E. H., Montagna, L. S., & Passador, F. R. (2020). Development of antistatic packaging of polyamide 6/linear lowdensity polyethylene blendsbased carbon black composites. Polymer Bulletin, 77(7), 3389-3409 http://doi.org/10.1007/ s00289-019-02928-3
13 Zaggo, H. M., Braga, N. F., Anjos, E. G. R., Montagna, L. S., Antonelli, E., & Passador, F. R. (2022). Effect of recycled graphite as an antistatic agent on the mechanical, thermal, and electrical properties of poly(trimethylene terephthalate). Macromolecular Symposia, 406(1), 2200014. http://doi. org/10.1002/masy.202200014
14 Braga, N. F., LaChance, A. M., Liu, B., Sun, L., & Passador, F. R. (2019). Influence of compatibilizers and carbon nanotubes on mechanical, electrical and barrier properties of PTT/ABS blends. Advanced Industrial and Engineering Polymer Research, 2(3), 121-125 https://doi.org/10.1016/j.aiepr.2019.07.002
15 Sarturato, A. C. P., Anjos, E. G. R., Marini, J., Morgado, G. F. M., Baldan, M. R., & Passador, F. R. (2023). Polypropylene/ talc/graphene nanoplates (GNP) hybrid composites: effect of GNP content on the thermal, rheological, mechanical, and electrical Properties. Journal of Applied Polymer Science, 140(12), e53657. http://doi.org/10.1002/app.53657.
17 Goyal, R. K., Jagadale, P. A., & Mulik, U. P. (2009). Thermal, mechanical, and dielectric properties of polystyrene/expanded graphite nanocomposites. Journal of Applied Polymer Science, 111(4), 2071-2077 http://doi.org/10.1002/app.29042
18 Ramawat, N., Sharma, N., Yamba, P., & Sanidhi, M. A. T. (2023). Recycling of polymer-matrix composites used in the aerospace industry—A comprehensive review. MaterialsToday: Proceedings In Press https://www.doi.org/10.1016/j. matpr.2023.05.386
19. Panwar, V., Park, J.-O., Park, S.-H., Kumar, S., & Mehra, R. M. (2010). Electrical, dielectric, and electromagnetic shielding properties of polypropylene‐graphite composites. Journal of Applied Polymer Science, 115(3), 1306-1314. http://doi. org/10.1002/app.29702
20 American Society for Testing and Materials – ASTM. (2003). ASTM D638-03: standard test method for tensile properties of plastics West Conshohocken, PA: ASTM International
21 American Society for Testing and Materials – ASTM. (2018). ASTM D256: standard test methods for determining the Izod pendulum impact resistance of plastics West Conshohocken, PA: ASTM International; 2018
22 American Society for Testing and Materials – ASTM. (2013). ASTM D2240: standard test method for rubber property—durometer hardness. West Conshohocken, PA: ASTM International.
23 De Rosa, C., Malafronte, A., Di Girolamo, R., Auriemma, F., Ruiz de Ballesteros, O., & Coates, G. W. (2020). Morphology of isotactic polypropylene−polyethylene block copolymers driven by controlled crystallization. Macromolecules, 53(22), 10234-10244 http://doi.org/10.1021/acs.macromol.0c01316
24 Jose, S., Parameswaranpilla, J., Francis, B., Aprem, A. S., & Thomas, S. (2016). Thermal degradation and crystallization characteristics of multiphase polymer systems with and without compatibilizer. AIMS Materials Science, 3(3), 1177-1198 http://doi.org/10.3934/matersci.2016.3.1177
25. Di, Y., Iannace, S., & Nicolais, L. (2002). Thermal behavior and morphological and rheological properties of polypropylene and novel elastomeric ethylene copolymer blends. Journal of Applied Polymer Science, 86(13), 3430-3439. http://doi. org/10.1002/app.11371
26 Zhang, H., Yang, Z., Su, K., Huang, W., & Zhang, J. (2022). Effects and mechanism of filler content on thermal conductivity of composites: a case study on plasticized polyvinyl chloride/ graphite composites. Journal of Polymer Engineering, 42(7), 599-608 http://doi.org/10.1515/polyeng-2021-0268
27 Anjos, E. G. R., Brazil, T. R., Morgado, G. F. M., Antonelli, E., Rezende, M. C., Pessan, L. A., Moreira, F. K. V., Marini, J., & Passador, F. R. (2023). Renewable PLA/PHBV blendbased graphene nanoplatelets and carbon nanotube hybrid nanocomposites for electromagnetic and electric-related applications. ACS Applied Electronic Materials, 5(11), 61656177 http://doi.org/10.1021/acsaelm.3c01099
28 Alfaro, E. F. (2010). Estudos da utilização de cinzas de casca de arroz como carga em matriz de polipropileno e do efeito da radiação ionizante sobre este compósito (Dissertação de mestrado). Instituto de Pesquisas Energéticas e Nucleares, São Paulo https://www.doi.org/10.11606/D.85.2010.tde08082011-105312
Received: Mar. 17, 2025
Revised: May 21, 2025
Accepted: May 24, 2025
Editor-in-Chief: Sebastião V. Canevarolo
16 Peng, Q., Tan, X., Venkataraman, M., & Militky, J. (2022). Tailored expanded graphite based PVDF porous composites for potential electrostatic dissipation applications. Diamond and Related Materials, 125, 108972 http://doi.org/10.1016/j. diamond.2022.108972
Thuy Thu Truong1,2,3* , Luan Thanh Nguyen1,3,4 , Tin Chanh Duc Doan3,4 , Le-Thu Thi Nguyen1,2,3 and Ha Tran Nguyen1,2,3*
1National Key Laboratory of Polymer and Composite Materials, Ho Chi Minh City, Vietnam 2Ho Chi Minh City University of Technology – HCMUT, District 10, Ho Chi Minh City, Vietnam 3Vietnam National University, Ho Chi Minh City, Vietnam
4Institute for Nanotechnology – INT, Vietnam National University, Thu Duc District, Ho Chi Minh City, Vietnam *trtthuy@hcmut.edu.vn; nguyentranha@hcmut.edu.vn
Obstract
We report an efficient protocol to synthesize rod-coil diblock copolymers of an α-helical polypeptide and poly(4-vinyl pyridine) via a combination of “living” ring-opening polymerization of α-amino acid N-carboxyanhydrides at 0 °C, polymer end-group modification and atom transfer radical polymerization (ATRP) of 4-vinyl pyridine (4-VP). Due to the competent effect of the pyridine groups with the ATRP ligand and the low initiation efficacy of the rigid polypeptide macroinitiator at mild temperatures, the challenge on ATRP of 4-VP was overcome by performing the ATRP process at 100 °C. Relatively well-defined poly(γ-benzyl L-glutamate)-b-poly(4-vinyl pyridine) diblock copolymers were successfully synthesized and characterized. Upon solvent vapor annealing, thin films of the diblock copolymers showed micro-phase separation behavior.
Keywords: polyglutamates, poly(4-vinyl pyridine), block copolymer.
Data Ovailability: Research data is available upon request from the corresponding author.
How to cite: Truong, T. T., Nguyen, L. T., Doan, T. C. D., Nguyen, L. T. T., & Nguyen, H. T. (2025). Synthesis of well-defined polypeptide-based diblock copolymers. Polímeros: Ciência e Tecnologia, 35(3), e20250031. https://doi.org/10.1590/0104-1428.20240104
Among vast synthetic polymeric systems, synthetic polypeptides composed of amino acid units have drawn great interests owing to their biocompatibility and biodegradability[1,2]
A wide diversity of synthetic polypeptide structures can be synthesized and modified with various functional groups to interact with biological targets[3]. Their ordered secondary structures (α-helix or β-sheet) as well as ability of organize supramolecularly via abundant electrostatic and hydrogen bond interactions have been utilized to construct macroand micro-structural architectures[4,5]. Main approaches for synthesizing polypeptides of various α-amino acid monomer units include solution phase coupling, solid phase peptide synthesis and ring opening polymerization (ROP) of α-amino acid N-carboxyanhydrides (NCAs)[6]. The ROP of NCA monomers has been the mostly well-known method to produce high molecular weight polypeptides, in which the reaction initiated via the amine mechanism using a primary amine initiator has been recognized to result in “living” amine chain end[7-9] .
Polypeptide-based block copolymers with interesting combined features of biomaterials and self-assembly
behavior of polypeptide sequences have been explored for various applications, such as tissue engineering scaffolds [10], drug delivery [11], self-healing [12,13] and antimicrobial applications[14]. To fabricate polypeptidebased block copolymer structures, either different kinds of polypeptides can be incorporated or a polypeptide and a biocompatible synthetic polymer can be combined to meet the requirements for specific applications. Within the wide range of poly(α-amino acid), poly(γ-benzyl-L-glutamate) (PBG), with good biocompatibility and high propensity to adopt the α-helix conformation, has been integrated as an α-helical rod block into different block copolymer designs to form self-assemblies[15]. Bonduelle and coworkers have prepared block copolymers of PBG and poly(γ-propagyl-Lglutamate) followed by functionalization of nucleobases via the copper catalyzed-azide-alkyne cycloaddition (CuAAC) reaction[16]. Other examples of polymers that have been combined with PBG include polysarcosine[17], polyethylene[18] , poly(ethylene oxide)[19-22], poly(N-isopropylacryamide)[23] , poly(isobutylene)[24], poly(3,4-dihydroxy-L-phenylalanine)[25] , poly(L-glutamic acid)[26], poly(2-methacryloyloxyethyl phosphorylcholine)[27], poly(ω-pentadecalactone)[28] ,
Truong, T. T., Nguyen, L. T., Doan, T. C. D., Nguyen, L. T. T., & Nguyen, H. T.
poly(L-phenyl alanine)[29], poly(lysine)[30], polystyrene[31] and elastin-like polypeptide[32]
In this work, we report a straightforward approach to synthesize well-defined diblock copolymers of PBG with poly(4-vinyl pyridine) (Scheme 1). PBG was first obtained via the ROP of the benzyl glutamate NCA monomer under reduced temperature condition to achieve a high content of “amine living chains”. PBG with amine end group was modified into an atom transfer radical polymerization (ATRP) macroinitiator to initiate the ATRP polymerization of 4-vinyl pyridine at an enhanced temperature. The performance of the ATRP reaction at a relatively high temperature was found to overcome the problem of low efficacy of the rod polypeptide macroinitiator.
2.1 Materials
L-glutamic acid (Aldrich, 99%), sulfuric acid (Merck, 96%), trifluoroacetic acid (TFA, Merck, 99%), benzyl alcohol (Acros, 99%), triethylamine (Merck, 99%), triphosgene (Acros, 99%), n-hexylamine (Merck, 99%), α-pinene (Sigma-Aldrich 98%), 4-(chloromethyl)benzoyl chloride (Sigma-Aldrich, 97%), tris(2-aminoethyl)-amine (Acros, 96%), benzyl chloride (Merck, 99%), formaldehyde (Merck, 35%), formic acid (Merck, 37%), NaOH (Merck, 99%), aluminum oxide (Merck, basic), CuCl (Acros, anhydrous, 99%), N,N-dimethylformamide (Acros, extra dry) and Dowex Marathon MSC (Sigma-Aldrich, hydrogen form) were used as received. 4-Vinylpyridine (Aldrich, 95%) was purified with basic Al2O3 column prior use. All the solvents (HPLC grade, Fisher Chemicals) were were dried with molecular sieves according to standard procedures.
2.2 Characterizations
1H NMR spectra were recorded in deuterated chloroform (CDCl3) with TMS as an internal reference, on a Bruker Avance 300 at 300 MHz. Attenuated total reflectance (ATR) FT-IR spectra
were collected as the average of 128 scans with a resolution of 4 cm−1 on a FT-IR Tensor 27 spectrometer equipped with a Pike MIRacle ATR accessory with a diamond/ZnSe element. Gel Permeation Chromatography (GPC) measurements were performed in dimethylformamide with 0.01 mol/L LiBr on a Polymer PL-GPC 50 gel permeation chromatograph system equipped with an RI detector. The data analysis was performed with reference to polystyrene standards. Thermogravimetric analysis (TGA) measurements were performed on a NETZSCH STA 409 PC Instruments with a heating rate of 10 °C/min under N2 atmosphere. Differential scanning calorimetry (DSC) measurements were performed using a DSC Q20 V24.4 Build 116 calorimeter with the heating and cooling rate of 10.00 °C/ min. Atomic force microscopy (AFM) images were obtained using a Bruker Dimension 3100 atomic force microscope.
γ-Benzyl-L-glutamate was prepared via Fischer esterification of L-glutamic acid and benzyl alcohol. To a flask containing 30 mL of diethyl ether 6 mL of concentrate sulfuric acid as added dropwise, followed by the addition of 60 mL of benzyl alcohol. Diethyl ether was then removed by rotary evaporation. 8.5 g of L-glutamic acid was added and the mixture was stirred for 24 h at room temperature. 120 mL of ethanol and 50 mL of triethylamine were added slowly to form a white suspension, which was further kept at 5 °C for 24 h. The raw product was collected by filtration and washed with ethanol. After recrystallization from 400 mL of water at 80 °C, the white product was dried under vacuum at 50 °C overnight and was stored at -18 °C. Yield: 65%. 1H-NMR (CDCl3/TFA (10/1, v/v), 300 MHz): δ = 2.106−2.385 (2H, m, CH2), 2.711 (2H, t, CH2), 4.169 (1H, s, CH), 5.108 (2H, d, CH2), 7.216−7.452 (5H, m, phenyl), 7.896 (2H, s, NH2), 12.4 (TFA).
2.4 Synthesis of γ-benzyl-L-glutamate N-carboxyanhydride (BG-NCA)
2.37 g (0.01 mol) of BG was dissolved in 20 mL of dry tetrahydrofuran, followed by addition of 3.8 mL of α-pinene (0.024 mol, 1.2 eq.) and 1.188 g of triphosgene
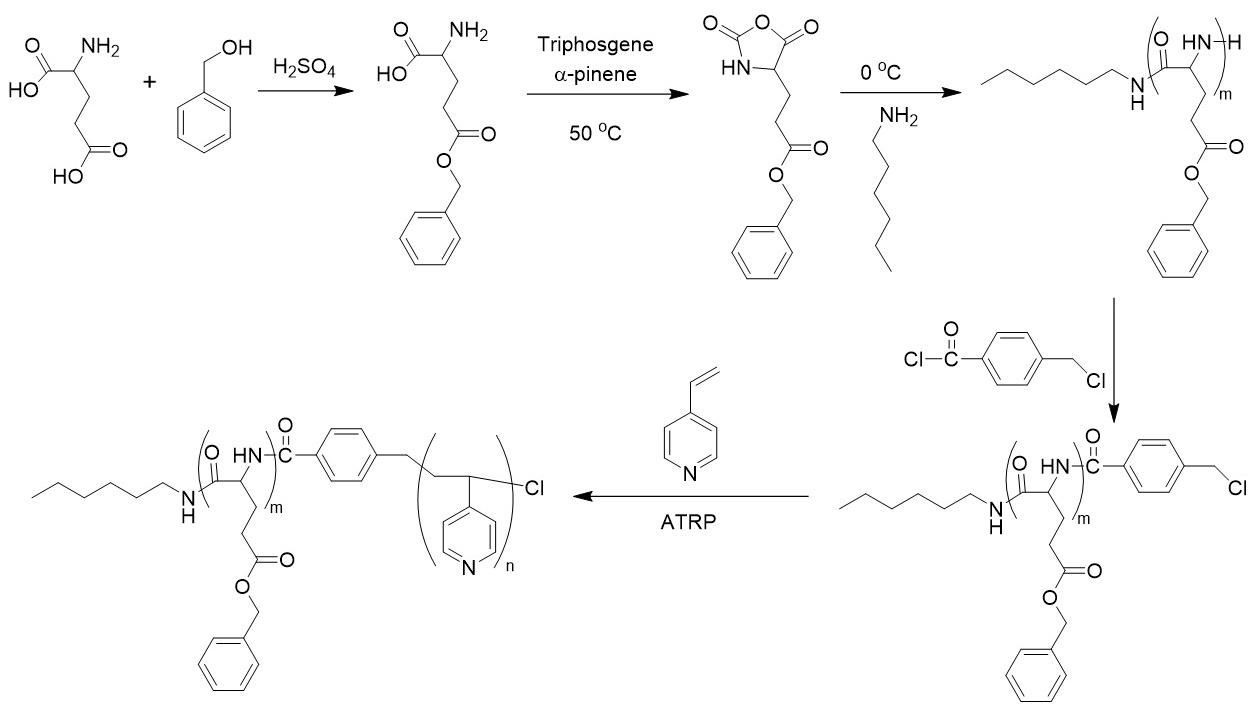
(0.004 mol, 0.4 eq.). The reaction was performed at 50 °C for 2 h until a clear solution was formed. After that, the raw BG-NCA was filtered and precipitated in 300 mL n-hexane, collected by filtration and dried under vacuum. The raw product was dissolved in tetrahydrofuran and precipitated in n-hexane twice to give a white powder, which was stored under nitrogen atmosphere at -18 °C. 1H-NMR (CDCl3, 300 MHz): δ = 2.010−2.353 (1H, m, CH2), 2.589 (2H, t, CH2), 4.377 (1H, t, CH), 5.134 (2H, s, CH2), 6.675 (1H, s, HN), 7.294─7.452 (5H, m, phenyl).
2.5 Synthesis of poly(γ-benzyl-L-glutamate) (PBG)
PBG was synthesized via ring-opening polymerization of BG-NCA according to the previously reported procedure. [9] Under nitrogen atmosphere, to a solution of BG-NCA in chloroform (5% w/v), at 0 °C, n-hexylamine as initiator was injected and the reaction mixture was stirred for 7 days. 2.367 g of BG-NCA and 47.5 μL of n-hexylamine were used to synthesize PBG1, while 2.367 g of BG-NCA and 23.8 μL of n-hexylamine were used to synthesize PBG2. The product was precipitated into methanol, filtered and dried under vacuum at 50 °C, yielding a white product. Yield: 94−95%. 1H-NMR (CDCl3/TFA (10/1, v/v), 300 MHz):
δ = 0.859 (3H, s, CH3 of initiator), 1.267 (8H, s, CH2 of initiator), 1.557 (2H, s, CH2 of initiator), 1.800−2.685 (4H, t, CH2), 3.945 (1H, s, CH), 5.030 (2H, s, CH2), 7.118−7.400 (5H, m, phenyl), 8.050−8.490 (1H, s, NH), (TFA).
2.6 End group modification of PBG
To a solution of PBG in dichloromethane (2%, w/v), α-pinene (10 eq. with respect to PBLG) was added. Then, a solution of 4-(chloromethyl)benzoyl in dichloromethane (2%, w/v) was added dropwise. The reaction mixture was stirred at room temperature for 10 h. After the reaction, the product (PBG-Cl) was precipitated in diethyl ether and dried under vacuum at 50 °C overnight, and was stored in dark at -18 °C.
2.7
Me6TREN was synthesized according to the procedure previously reported[33]. To a mixture of 36 mL of formaldehyde (37%) and 45 mL of formic acid in 16 mL of distilled water, 10 mL of tris(2-aminoethyl)-amine was added dropwise. The mixture was stirred for 30 min at room temperature. The reaction was carried out at 120 °C for 6 h. The orange product was distilled by rotary evaporation to remove water and unreacted reactants. 150 mL of NaOH solution (20% w/v) was added until pH = 10. The oily layer at the bottom was extracted by dichloromethane. After the solvent and other low boiling temperature contaminants were removed by rotary evaporation, the final product was obtained by Kugelrohr distillation (130 °C, 0.2 mbar) as a clear, colorless and oil-like liquid. Me6TREN was stored at 4 °C under nitrogen atmosphere. 1H-NMR (ppm): δ = 2.213 (18H, s, CH3), 2.323−2.400 (6H, m, CH2), 2.553−2.636 (6H, m, CH2).
2.8 Synthesis of homopolymer poly(4-vinyl pyridine) (P4VP)
P4VP was synthesized via the ATRP of 4-vinylpyridine (4-VP) from the initiator. 0.0198 g (0.2 mmol) of CuCl
was dissolved in 1.1 mL of anhydrous dimethylformamide (DMF) under nitrogen atmosphere, followed by the addition of 2.2 mL (20.6 mmol) of 4-VP and 52.6 μL (0.2 mmol) of Me6TREN. The temperature was increased to 50 °C and 6 μL (0.052 mmol) of benzyl chloride was injected. The reaction was carried out at 50 °C overnight. After the reaction, the reaction mixture was diluted with 30 mL of DMF. The product was precipitated into diethyl ether, filtered and dried under vacuum a 50 °C. Yield: 87.4%. For removal of CuCl, a solution of the product in chloroform (2%, w/v) was mixed with Dowex Marathon MSC hydrogen form ion exchange resin at room temperature for 20 h. Copper elemental analysis: < 3.0 ppm. 1H-NMR (CDCl3, 300 MHz): δ = 0.970−2.226 (3H, m, CH2CH), 5.932−6.647 (2H, d, pyridine), 8.318 (2H, s, pyridine). Mn (GPC) = 61000, Đ (GPC) = 1.2.
2.9 Synthesis of diblock copolymer poly(γ-benzyl-Lglutamate)-b-poly(4-vinyl pyridine) (PBG-b-P4VP)
For PBG1-b-P4VP, 0.243 g (0.05 mmol) of PBGl_Cl, 9.9 mg (0.1 mmol) of CuCl, 26.3 μL (0.1 mmol) of Me6TREN dissolved in 2.16 mL of dry DMF were used. For PBG2-bP4VP, 1.21 g (0.1 mmol) of PBGl_Cl, 19.8 mg (0.2 mmol) of CuCl, 52.6 μL (0.2 mmol) of Me6TREN dissolved in 4.3 mL of dry DMF were used. Procedure: In a dry flask under nitrogen atmosphere, PBGl_Cl and CuCl were added. Then, a solution of Me6TREN in dry DMF was injected to the flask, followed by the injection of 2.16 mL (0.02 mol) of 4-vinylpyridine. The flask was stirred at 100 °C for 12 h. After the reaction mixture was cooled down, the reaction mixture was diluted by adding 25 mL of DMF and precipitated in 500 mL of diethyl ether. A solution of the raw product in chloroform (2%, w/v) was mixed with Dowex Marathon MSC hydrogen form ion exchange resin at room temperature for 20 h to remove CuCl. Then, the copolymer product was precipitated in toluene twice. The received product was dried under vacuum overnight. Yield: 65−70%.
The BG and BG-NCA monomers were synthesized according to previous procedures[34]. PBG was synthesized via ring-opening polymerization of BG-NCA using the “living” process reported by Schué and coworkers[9] Conducting the polymerization at 0 °C has been addressed to suppress significant side reactions, resulting in “living” amine chain ends[35]. Two polymers with designed degrees of polymerization (DPs) of 25 and 50 were prepared and named as PBG1 and PBG2, respectively. Figure 1 presents the 1H NMR spectra of BG, BG-NCA, PBG1 and PBG 2, with all the peaks characteristic of their structures. The formation of the NCA ring structure is confirmed by the peak at 6.7 ppm attributed to the amide NH proton and the peak at 4.4 ppm ascribed to the ring methine (CH) proton. The structure of BG and BG-NCA was further confirmed by FT-IR analysis (Figure 2). The FT-IR spectrum of BG showed a very broad vibrational absorption region of overlapping bands in the range of 3033-2600 cm-1 attributed to acid O-H and NH2 stretches, an acid C=O stretching band at 1577 cm-1, a benzyl ester C=O stretching band at 1722 cm-1 and a band at 730 cm-1 ascribed to the aromatic C-H out-of-plane bending vibration.
Truong, T. T., Nguyen, L. T., Doan, T. C. D., Nguyen, L. T. T., & Nguyen, H. T.
The formation of BG-NCA structure was supported by the disappearance of the broad band regions corresponding to (CO)O-H and NH2 vibrations, and the appearance of
characteristic absorption bands at ∼3250 cm-1 (amide N-H stretch), 1771 cm-1 (anhydride carbonyl symmetric stretch), 1726 cm-1 (benzyl ester C=O stretch), 1701 cm-1 (amide I).
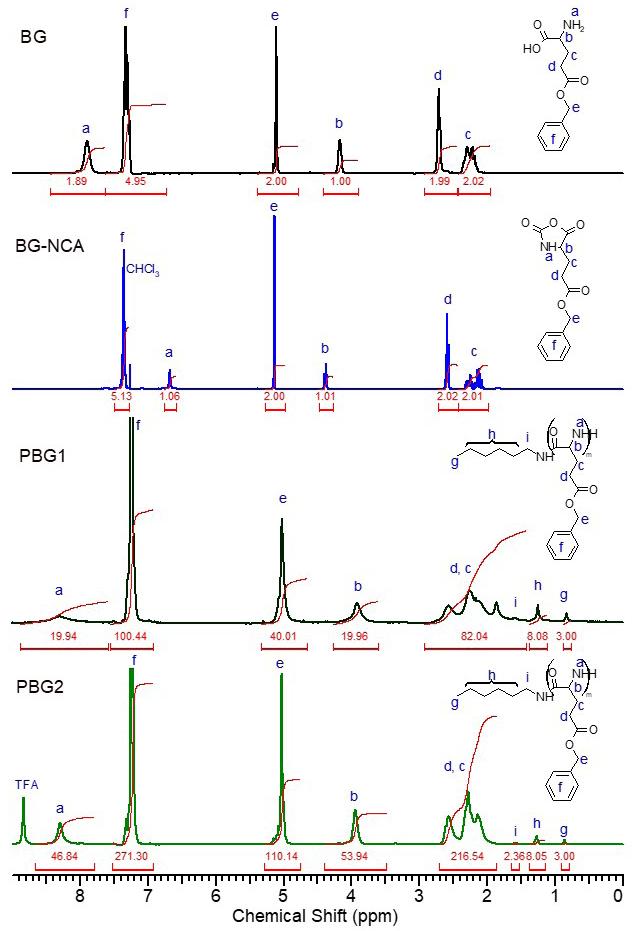
Polímeros, 35(3), e20250031, 2025
The 1H NMR spectra of the resulting polymers PBG1 and PBG2 also revealed peaks typical of the polymer structure, with shift of the amide NH peak to 8.3 (Figure 1, PBG1). In the presence of a few drops of TFA to eliminate aggregation of polymer chains, the amide NH signal at 8.3 ppm became sharper (Figure 1, PBG2). By comparing the integral ratio between peak b at 4.4 ppm (ring methine) and g at 0.86 ppm (CH3 of the n-hexyl end group), DPs values of 21 (Mn = 4601) and 54 (Mn = 11840) were determined for PBG1 and PBG2, respectively. The GPC results gave just slightly higher values of M n of 6600 and 13200 g mol-1 and Đ values of 1.23 and 1.26 for PBG1 and PBG2, respectively (Table 1). The good agreement between the resulting and designed molecular weights suggested a relatively controlled NCA-ring opening polymerization process was obtained. PBGs were further coupled with 4-(chloromethyl)benzoyl chloride to give polymers (named as PBG1_Cl and PBG2_Cl) end-capped with (chloromethyl)benzoyl group that can be used as an initiating group for the ATRP process. According the chloride analysis results of PBG_Cl polymers, capping efficiencies of 76.9 and 82.1% for PBG1_Cl and PBG2_Cl, respectively.
PBG-b-P4VP was then synthesized via the ATRP of 4-vinyl pyridine (4-VP) from the macroinitiator PBG-Cl. PBG-Cl and CuCl were dissolved in anhydrous dimethylformamide (DMF), followed by the addition of 4-VP and Me6TREN. The temperature was increased to 100 °C and the reaction was left overnight. It should be noted that the ATRP of 4VP using PBG_Cl as macroinitiator at room temperature and at 50 °C did not result any trace of P4VP block. After the reaction, the diblock copolymer product was recovered by
precipitation into diethyl ether to eliminate the unreacted 4VP monomers. The copolymer was further purified by double precipitation in toluene, which is a good solvent for PBG but a poor solvent for P4VP and its copolymers. Therefore, the unreacted PBG polymer could be removed. In a comparison of the 1H NMR spectra of the diblock copolymers with that of PBG1_Cl, new peaks attributed to the pyridine ring protons at ∼8.3 and 6.4 ppm and to the backbone methylene and methine protons at around 2.8−0.8 ppm of P4VP block were observed (Figure 3). By comparing the integral ratio between the peak corresponding to the pyridine ring (peak x or y, Figure 3) and the peak arising from the methine proton of the PBG block (peak b, Figure 3), the ratio between the DPs of two blocks were estimated. Taking into consideration of the DPs of PBG1 and PBG2 (determined by 1H NMR), DPs values of the P4VP block were determined to be 399 and 168 for PBG1-b-P4VP and PBG2-b-P4VP, respectively.
Figure 4 compares the GPC curves of the diblock copolymers with those of corresponding macroinitiators. The GPC curves of the copolymers clearly shifted to the higher molecular weight values, indicating the successful formation of the diblock copolymer structure. The GPC results also showed acceptable molecular weight distribution (Đ) values of 1.46 and 1.66 for PBG1-b-P4VP and PBG2b-P4VP, respectively (Table 1).
Figure 5 compares the FT-IR spectra of the homopolymers PBG and P4VP with those of diblock copolymers PBG1-bP4VP and PBG2-b-P4VP. The structure of the polypeptide
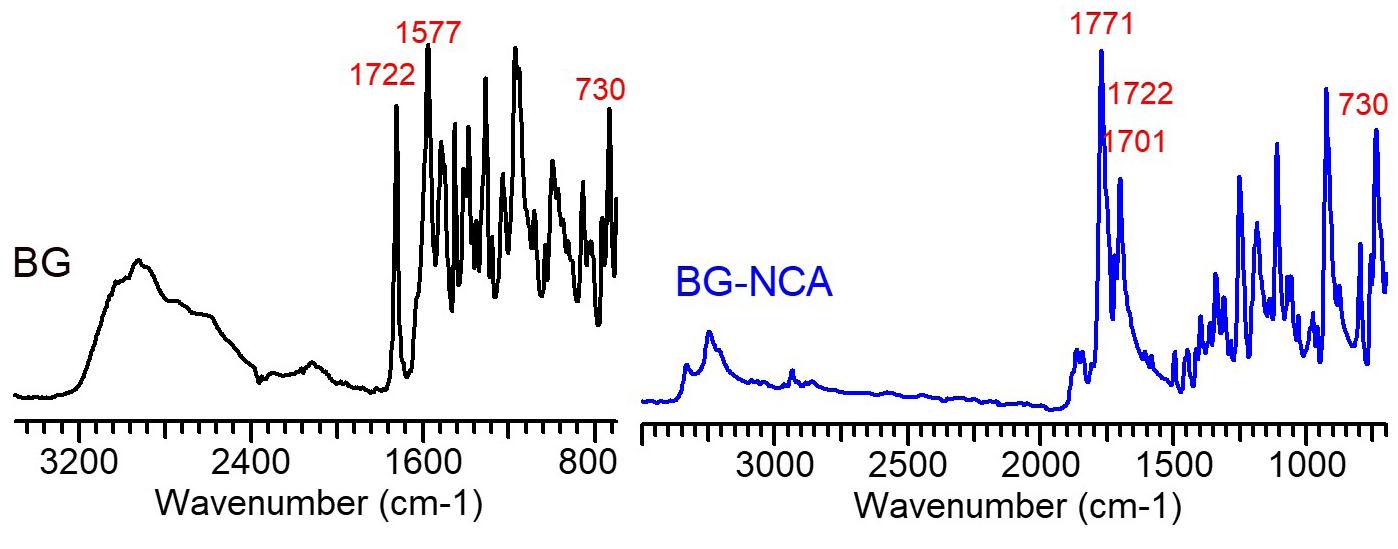
2. FT-IR spectra of BG and BG-NCA.
1. Molecular weight characteristics of PBGs and PBG-b-P4VPs.
acalculated from monomer and initiator/macroinitiator feed ratio; bfrom chloride elemental analysis
ccalculated taking into account the efficacy of macroinitiator and yield of polymerization of 4VP.
Truong, T. T., Nguyen, L. T., Doan, T. C. D., Nguyen, L. T. T., & Nguyen, H. T.
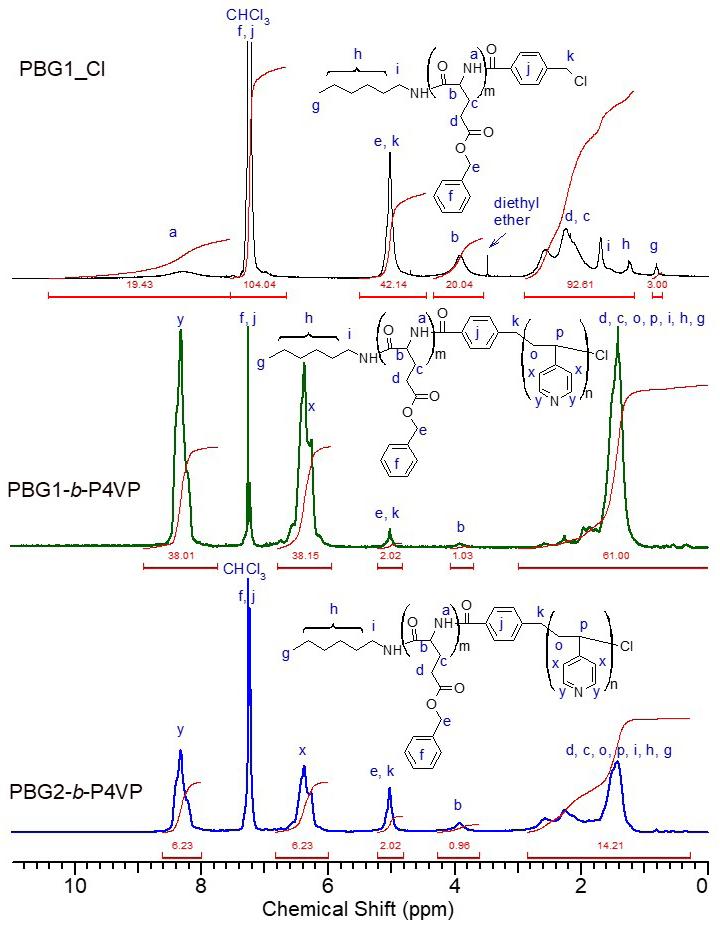
PBG was again confirmed by FT-IR analysis, as indicated by characteristic vibrational absorption bands of amide and ester groups at 3293 cm-1 (amide A), 1728 (ester C=O stretch), 1650 cm-1 (a5mide I) and 1543 (amide II). The FTIR spectrum of P4VP revealed vibrational absorption bands typical of the pyridine ring, including bands at 1596-1556 cm-1 (doublet, pyridine ring stretches), 993 cm-1 (pyridine ring breathing mode) and 818 cm-1 (pyridine C-H out-ofplane deformation).
The differential scanning calorimetry (DSC) heating and cooling scans of the PBG and P4VP homopolymers showed glass transitions at 15.3 and 154.3 °C, respectively (Figure 6). For PBG1-b-P4VP, due to the large length of the P4VP block (DP of P4VP = 399) relative to the PBG block (DP of PBG = 21), only a glass transition attributed to the P4VP block was detectable at a somewhat lower temperature of 149.6 °C. On the other hand, the DSC result of PBG2-bP4VP revealed both glass transitions related to both PBG and
Polímeros, 35(3), e20250031, 2025
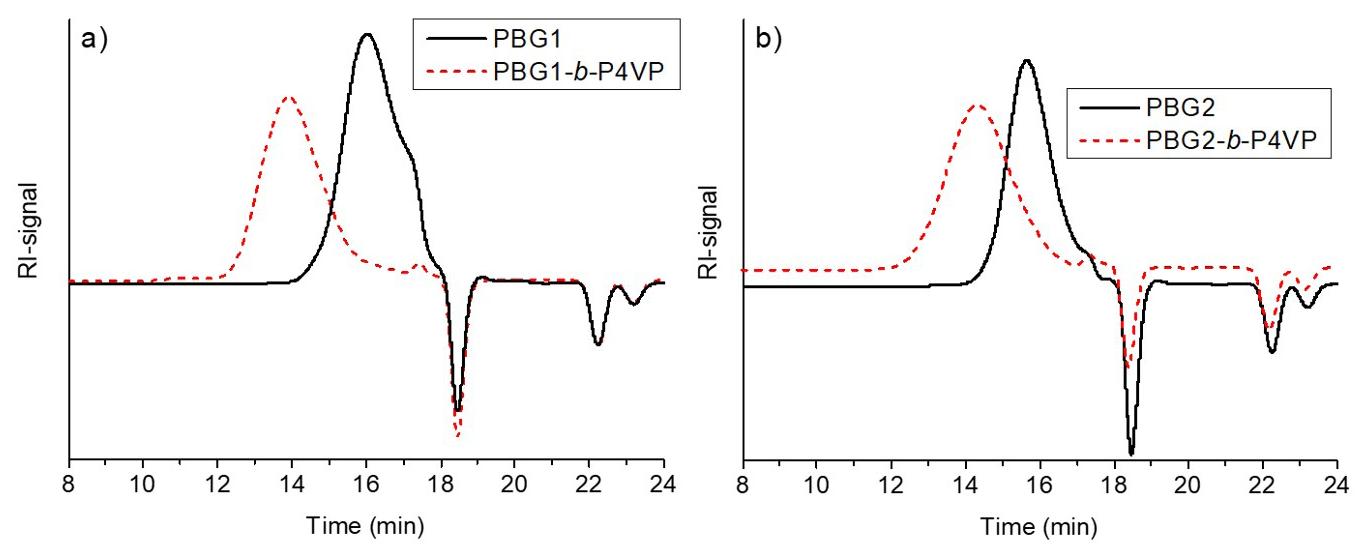
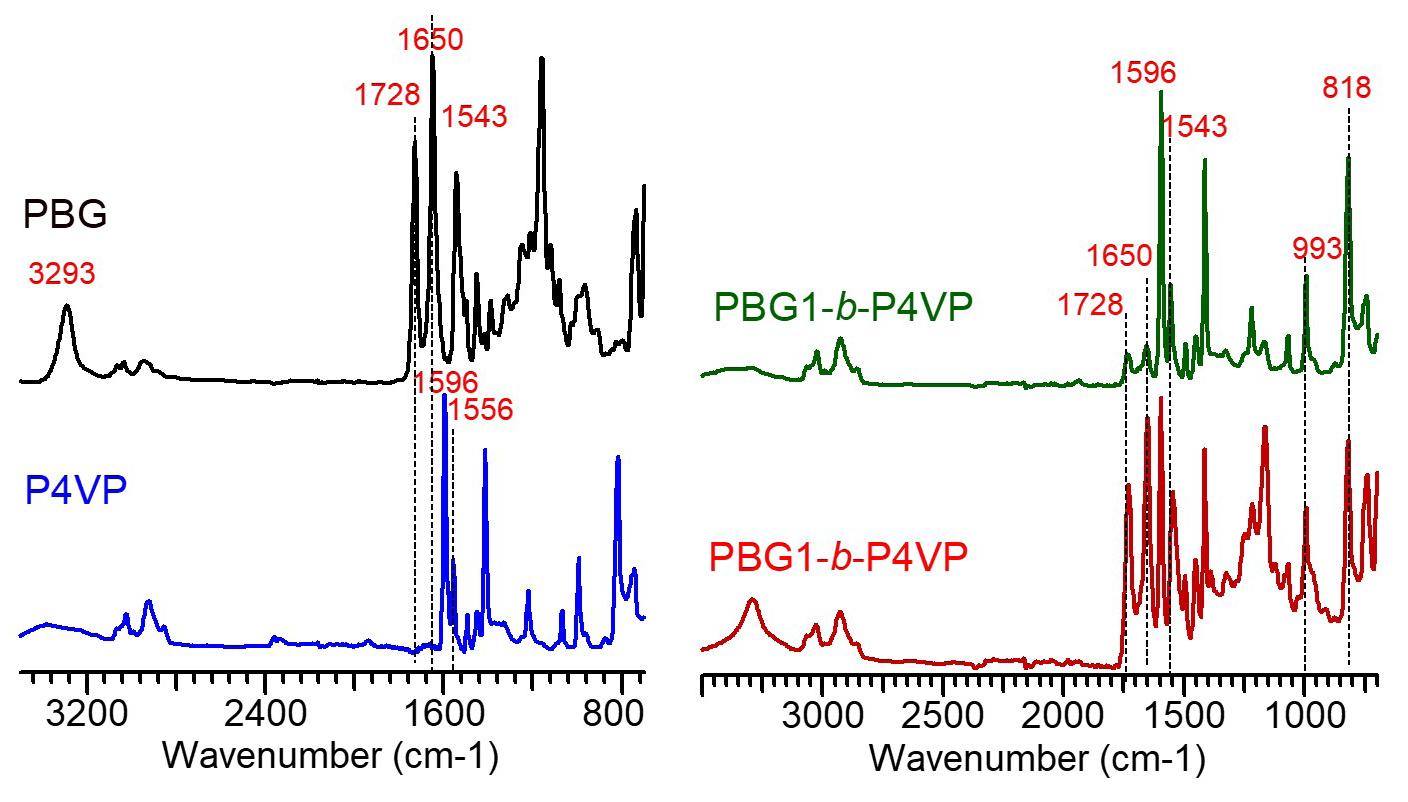
P4VP blocks at 15.5 and 136.5 °C, respectively, indicating the diblock copolymer structure. The clearly lower glass transition temperature of P4VP block in PBG2-b-P4VP compared with that of the P4VP homopolymer could arise from hydrogen bonding interactions between the two blocks.
The thermogravimetric analysis (TGA) results showed that while P4VP was thermally stable up to 325 °C, PBG started to degrade at 265 °C (Figure 7). However, PBG had a relatively high char yield of 14.2% where as P4VP decomposed completely. The TGA curves of the diblock copolymers revealed a two-step degradation process corresponding to consecutive decompositions of the PBG block and P4VP block. The weight loss of the first degradation step and the char yield was well relevant to the weight fraction of the PBG block in the diblock copolymers (Table 2).
Thin films of the diblock copolymers were prepared on silicon wafers via spin-coating and their morphologies were investigated by atomic force microscopy (AFM). As shown in Figure 8a, the film matrix of the film matrix PBG1 -b- P4VP before annealing was quite flat and homogeneous. Some round holes with different diameters were distributed randomly. The reason of forming these holes is still not clear. The ring-in-ring structure in the right and left corners might be due to fast, inhomogeneous evaporation of the solvent, as the domains inside and outside the rings had the same height and composition. Interestingly, after annealing with the vapor of chloroform as a good solvent, the hole structure disappeared, and there appeared some white, drop-like domains embedded in the matrix. The edges of the drop-like domains were rather sharp. Taking the phase image into account (Figure 8a-D),
Table 2. Weight loss and char yield values obtained from the TGA results.
Weigh fraction of PBG blocka Weight loss at 340 °C Char yield_theoreticalb
-b-P4VP
-b-P4VP
acalculated from the Mn values determined by 1H NMR method (Table 1); bcalculated from the char yield of the PBG homopolymer and the weight fraction of the PBG block in the diblock copolymers.

it is very clear that the drop-like domain belonged to the PBG block and the matrix was formed of the P4VP block. The explanation for this could be that the PBG helices were much more rigid than P4VP coil chains and during the solvent annealing process, the helices remained intact while P4VP coils were swollen.
The AFM images of PBG2-b-P4VP are shown in Figure 8b. Before annealing (Figure 8b-A and B), the film surface had an island-like structure. These “islands” had a higher boundary but lower inside domain, and their sizes were not uniform. This was probably due to relatively broader polydispersity (Đ = 1.66) of PBG2-b-P4VP. After chloroform vapor annealing, phase separation became more obvious. From the topographic image (Figure 8b-C), it was clear that instead of the island-like structure, an inhomogeneous network was formed. For both copolymers, drop-like and round-like domains after long-time annealing process converted to partly orientated “worm-like” domains of rod-like PBG block situated in the matrix of coil-like
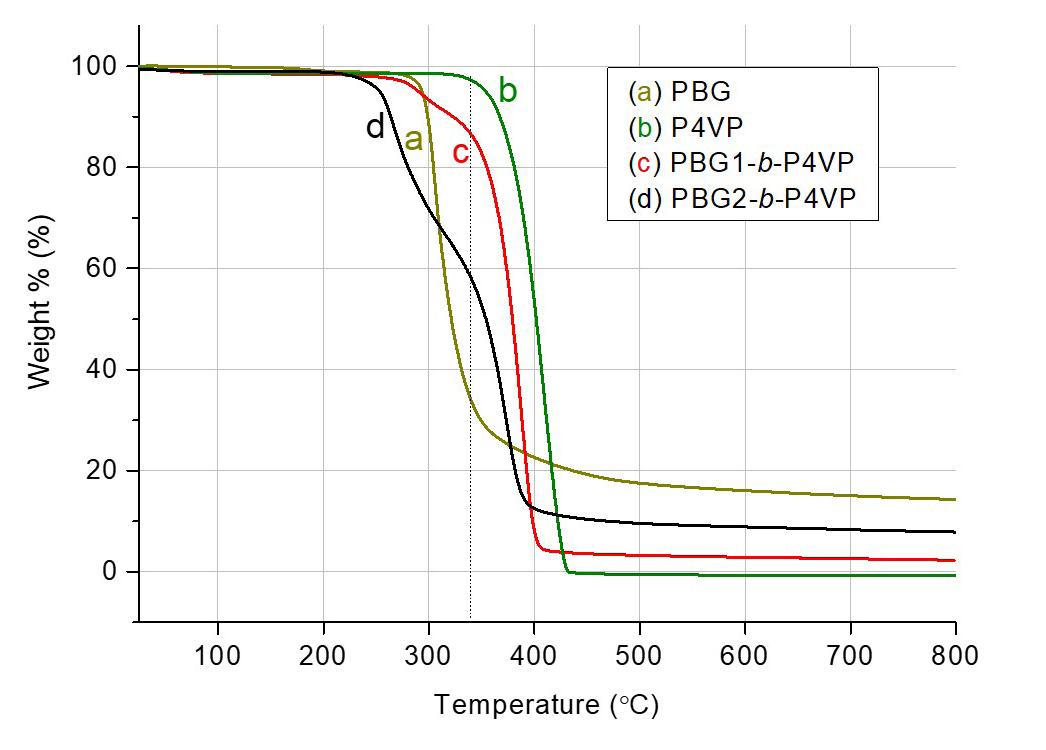
P4VP block. It indicates that during the annealing process, phase rearrangement occurred.
35(3), e20250031, 2025
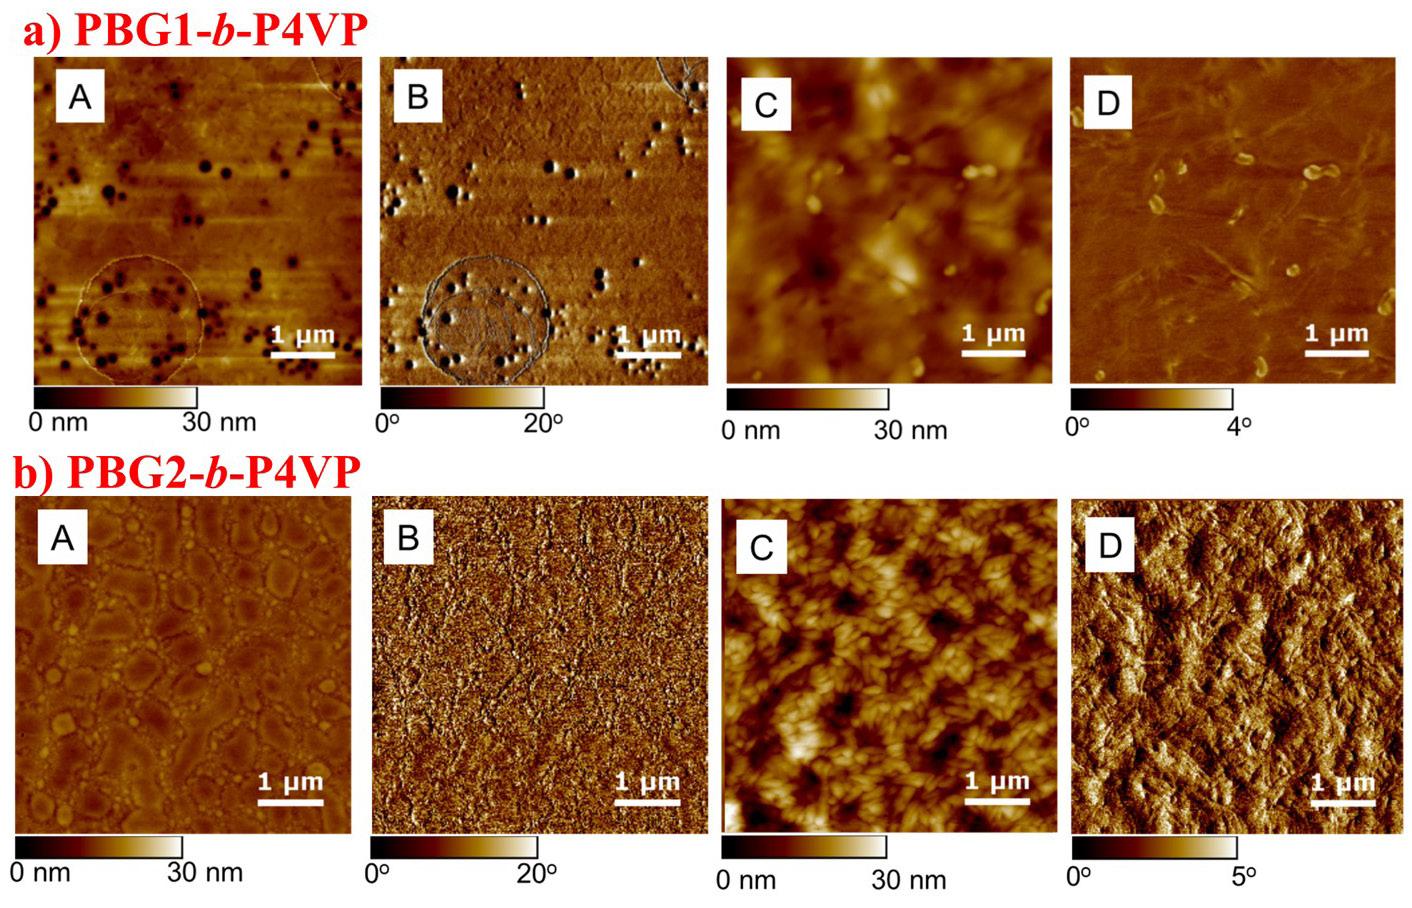
Figure 8. AFM images (5 μm × 5 μm) of PBG1-b-P4VP (a) and PBG2-b-P4VP (b) before annealing (A: topographic image, B: phase image) and after 3-day-chloroform vapor annealing (C: topographic image, D: phase image).
4. Conclusion
Two PBG-b-P4VP diblock copolymers with different block length ratios were successfully synthesized through “living” NCA ring-opening polymerization at 0 °C in combination with ATRP in DMF at 100 °C. Their chemical structures were confirmed by 1H-NMR, and ATR-FTIR. Their molecular weights and thermal properties were characterized by GPC, TGA and DSC. In addition, the AFM results of thin films of the diblock copolymers proved that solvent annealing rearranged phase domains prompting micro-phase separation.
5. Author’s Contribution
• Conceptualization – Le-Thu Thi Nguyen.
• Data curation – NA.
• Formal analysis – NA.
• Funding acquisition – Thuy Thu Truong.
• Investigation – Thuy Thu Truong.
• Methodology – Luan Thanh Nguyen; Tin Chanh Duc Doan; Ha Tran Nguyen.
• Project administration – Ha Tran Nguyen; Thuy Thu Truong.
• Resources – Ha Tran Nguyen.
• Software – NA.
• Supervision – Ha Tran Nguyen.
• Validation – Luan Thanh Nguyen; Tin Chanh Duc Doan; Ha Tran Nguyen.
• Visualization – NA.
• Writing – original draft – Thuy Thu Truong; Luan Thanh Nguyen.
• Writing – review & editing – Luan Thanh Nguyen; Tin Chanh Duc Doan; Le-Thu Thi Nguyen; Ha Tran Nguyen.
6. Acknowledgements
This research is funded by Vietnam National University Hochiminh City (VNU-HCM) under grant number: TX2025-20a-01.
7. References
1 Wang, T.-T., Xia, Y.-Y., Gao, J.-Q., Xu, D.-H., & Han, M. (2021). Recent progress in the design and medical application of in situ self-assembled polypeptide materials. Pharmaceutics, 13(5), 753 http://doi.org/10.3390/pharmaceutics13050753 PMid:34069645.
2. Zhang, P., Li, M., Xiao, C., & Chen, X. (2021). Stimuliresponsive polypeptides for controlled drug delivery. Chemical Communications (Cambridge), 57(75), 9489-9503 http://doi. org/10.1039/D1CC04053G. PMid:34546261.
3 Lin, M., & Sun, J. (2022). Antimicrobial peptide-inspired antibacterial polymeric materials for biosafety. Biosafety and Health, 4(4), 269-279 http://doi.org/10.1016/j.bsheal.2022.03.009
4 Liu, Y., Tang, H., Zhu, M., Zhu, H., & Hao, J. (2022). Controlling self-assembly of co-polypeptide by block ratio and block sequence. Polymer, 254, 125093 http://doi.org/10.1016/j. polymer.2022.125093
5 Abdelghani, M., Shao, J., Le, D. H. T., Wu, H., & van Hest, J. C. M. (2021). Self-assembly or coassembly of multiresponsive
Truong, T. T., Nguyen, L. T., Doan, T. C. D., Nguyen, L. T. T., & Nguyen, H. T.
histidine-containing elastin-like polypeptide block copolymers. Macromolecular Bioscience, 21(6), e2100081 http://doi. org/10.1002/mabi.202100081 PMid:33942499.
6 Liu, Y., Li, D., Ding, J., & Chen, X. (2020). Controlled synthesis of polypeptides. Chinese Chemical Letters, 31(12), 3001-3014 http://doi.org/10.1016/j.cclet.2020.04.029.
7 Badreldin, M., Salas-Ambrosio, P., Ayala, M., Harrisson, S., & Bonduelle, C. (2024). Synthesis of Polypeptides by ringopening polymerization: a concise review. Current Organic Chemistry, 28(15), 1154-1163 http://doi.org/10.2174/01138 52728274519240228105518
8 Rasines Mazo, A., Allison-Logan, S., Karimi, F., Chan, N. J.-A., Qiu, W., Duan, W., O’Brien-Simpson, N. M., & Qiao, G. G. (2020). Ring opening polymerization of α-amino acids: advances in synthesis, architecture and applications of polypeptides and their hybrids. Chemical Society Reviews, 49(14), 4737-4834 http://doi.org/10.1039/C9CS00738E PMid:32573586.
9. Vayaboury, W. , Giani , O. , Cottet , H. , Deratani , A. , & Schué, F. (2004). Living Polymerization of α-Amino Acid N-Carboxyanhydrides (NCA) upon Decreasing the Reaction Temperature. Macromolecular Rapid Communications, 25(13), 1221-1224 http://doi.org/10.1002/marc.200400111
10 Zhao, D., Rong, Y., Li, D., He, C., & Chen, X. (2023). Thermoinduced physically crosslinked polypeptide-based block copolymer hydrogels for biomedical applications. Regenerative Biomaterials, 10, rbad039 http://doi.org/10.1093/rb/rbad039
11 Wang, X., Song, Z., Wei, S., Ji, G., Zheng, X., Fu, Z., & Cheng, J. (2021). Polypeptide-based drug delivery systems for programmed release. Biomaterials, 275, 120913 http:// doi.org/10.1016/j.biomaterials.2021.120913 PMid:34217020.
12. Wang, K.-H., Liu, C.-H., Tan, D.-H., Nieh, M.-P., & Su, W.-F. (2024). Block sequence effects on the self-assembly behaviors of polypeptide-based penta-block copolymer hydrogels. ACS Applied Materials & Interfaces, 16(5), 6674-6686 http://doi. org/10.1021/acsami.3c18954 PMid:38289014.
13 Cai, L., Liu, S., Guo, J., & Jia, Y.-G. (2020). Polypeptide-based self-healing hydrogels: design and biomedical applications. Acta Biomaterialia, 113, 84-100 http://doi.org/10.1016/j. actbio.2020.07.001 PMid:32634482.
14 Maurya, D., Nisal, R., Ghosh, R., Kambale, P., Malhotra, M., & Jayakannan, M. (2023). Fluorophore-tagged poly(ʟ-Lysine) block copolymer nano-assemblies for real-time visualization and antimicrobial activity. European Polymer Journal, 183, 111754. http://doi.org/10.1016/j.eurpolymj.2022.111754.
15 Ma, T.-L., Yang, S.-C., Cheng, T., Chen, M.-Y., Wu, J.-H., Liao, S.-L., Chen, W.-L., & Su, W.-F. (2022). Exploration of biomimetic poly(γ-benzyl-l-glutamate) fibrous scaffolds for corneal nerve regeneration. Journal of Materials Chemistry. B, Materials for Biology and Medicine, 10(33), 6372-6379 http://doi.org/10.1039/D2TB01250B PMid:35950376.
16 Nguyen, M., Ferji, K., Lecommandoux, S., & Bonduelle, C. (2020). Amphiphilic nucleobase-containing polypeptide copolymers: synthesis and self-assembly. Polymers, 12(6), 1357 http://doi.org/10.3390/polym12061357 PMid:32560277.
17 Lebleu, C., Plet, L., Moussy, F., Gitton, G., Da Costa Moreira, R., Guduff, L., Burlot, B., Godiveau, R., Merry, A., Lecommandoux, S., Errasti, G., Philippe, C., Delacroix, T., & Chakrabarti, R. (2023). Improving aqueous solubility of paclitaxel with polysarcosine -b-poly(γ-benzyl glutamate) nanoparticles. International Journal of Pharmaceutics, 631, 122501 http:// doi.org/10.1016/j.ijpharm.2022.122501 PMid:36529355.
18 Lu, Y., Liu, D., Wei, X., Song, J., Xiao, Q., Du, K., Shi, X., & Gao, H. (2023). Synthesis and thermoreversible gelation of coil–rod copolymers with a dendritic polyethylene core and multiple helical poly(γ-benzyl-l-glutamate) arms. Polymers,
15 (22 ), 4351 http://doi.org/10.3390/polym15224351 PMid:38006076.
19 Alsehli, M., & Gauthier, M. (2023). Influence of the core branching density on drug release from arborescent poly(γbenzyl l-glutamate) end-grafted with poly(ethylene oxide). International Journal of Translational Medicine, 3(4), 496-515. http://doi.org/10.3390/ijtm3040035
20 Lin, X., He, X., Hu, C., Chen, Y., Mai, Y., & Lin, S. (2016). Disk-like micelles with cylindrical pores from amphiphilic polypeptide block copolymers. Polymer Chemistry, 7(16), 2815-2820 http://doi.org/10.1039/C6PY00152A
21. Ji, S., Xu, L., Fu, X., Sun, J., & Li, Z. (2019). Light- and metal ion-induced self-assembly and reassembly based on block copolymers containing a photoresponsive polypeptide segment. Macromolecules, 52(12), 4686-4693 http://doi.org/10.1021/ acs.macromol.9b00475
22 El-Mahdy, A. F. M., Yu, T. C., Mohamed, M. G., & Kuo, S.-W. (2021). Secondary structures of polypeptide-based diblock copolymers influence the microphase separation of templates for the fabrication of microporous carbons. Macromolecules, 54(2), 1030-1042 http://doi.org/10.1021/acs.macromol.0c01748
23. Sang, X., Yang, Q., Wen, Q., Zhang, L., & Ni, C. (2019). Preparation and controlled drug release ability of the poly[Nisopropylacryamide-co-allyl poly(ethylene glycol)]-b-poly(γbenzyl-l-glutamate) polymeric micelles. Materials Science and Engineering C, 98, 910-917 http://doi.org/10.1016/j. msec.2019.01.056 PMid:30813098.
24 Spyridakou, M., Tsimenidis, K., Gkikas, M., Steinhart, M., Graf, R., & Floudas, G. (2022). Effects of nanometer confinement on the self-assembly and dynamics of poly(γ-benzyl-l-glutamate) and its copolymer with poly(isobutylene). Macromolecules, 55(7), 2615-2626. http://doi.org/10.1021/acs.macromol.2c00077.
25 Zhang, Y., Song, W., & Kim, I. (2019). Mussel-Inspired Poly(3,4dihydroxy-L-phenylalanine)-Block-Poly(γ-benzyl-L-glutamate) bioconjugate-assisted green synthesis of silver nanoparticles. Journal of Nanoscience and Nanotechnology, 19(10), 65596564 http://doi.org/10.1166/jnn.2019.17075 PMid:31026993.
26. Lavilla, C., Byrne, M., & Heise, A. (2016). Block-sequencespecific polypeptides from α-Amino Acid N-carboxyanhydrides: synthesis and influence on polypeptide properties. Macromolecules, 49(8), 2942-2947 http://doi.org/10.1021/acs.macromol.6b00498
27 Liu, G., Zhuang, W., Chen, X., Yin, A., Nie, Y., & Wang, Y. (2016). Drug carrier system self-assembled from biomimetic polyphosphorycholine and biodegradable polypeptide based diblock copolymers. Polymer, 100, 45-55. http://doi.org/10.1016/j. polymer.2016.08.012
28 Tinajero-Díaz, E., Ilarduya, A. M., & Muñoz-Guerra, S. (2019). Synthesis and properties of diblock copolymers of ω-pentadecalactone and α-amino acids. European Polymer Journal, 116, 169-179 http://doi.org/10.1016/j.eurpolymj.2019.04.009
29. Jacobs, J., Gathergood, N., Heuts, J. P. A., & Heise, A. (2015). Amphiphilic glycosylated block copolypeptides as macromolecular surfactants in the emulsion polymerization of styrene. Polymer Chemistry, 6(25), 4634-4640 http://doi. org/10.1039/C5PY00548E
30 Gauche, C., & Lecommandoux, S. (2016). Versatile design of amphiphilic glycopolypeptides nanoparticles for lectin recognition. Polymer, 107, 474-484. http://doi.org/10.1016/j. polymer.2016.08.077
31 Wang, Y., & Ling, J. (2015). Synthetic protocols toward polypeptide conjugates via chain end functionalization after RAFT polymerization. RSC Advances, 5(24), 18546-18553 http://doi.org/10.1039/C4RA17094F
32. Le Fer, G., Portes, D., Goudounet, G., Guigner, J.-M., Garanger, E., & Lecommandoux, S. (2017). Design and self-assembly of PBLG-b-ELP hybrid diblock copolymers based on synthetic and
Polímeros, 35(3), e20250031, 2025
Synthesis of well-defined polypeptide-based diblock copolymers
elastin-like polypeptides. Organic & Biomolecular Chemistry, 15(47), 10095-10104 http://doi.org/10.1039/C7OB01945A PMid:29170769.
33 Queffelec, J., Gaynor, S. G., & Matyjaszewski, K. (2000). Optimization of atom transfer radical polymerization using Cu(I)/ Tris(2-(dimethylamino)ethyl)amine as a catalyst. Macromolecules, 33(23), 8629-8639 http://doi.org/10.1021/ma000871t
34 Daly, W. H. , & Poché , D. ( 1988 ). The preparation of N-carboxyanhydrides of α-amino acids using bis(trichloromethyl) carbonate. Tetrahedron Letters, 29(46), 5859-5862 http://doi. org/10.1016/S0040-4039(00)82209-1
35 Habraken, G. J. M., Wilsens, K. H. R. M., Koning, C. E., & Heise, A. (2011). Optimization of N-carboxyanhydride (NCA) polymerization by variation of reaction temperature and pressure. Polymer Chemistry, 2(6), 1322-1330 http://doi.org/10.1039/ c1py00079a.
Received: Nov. 25, 2024
Revised: Mar. 31, 2025
Accepted: May 06, 2025
Associate Editor: César L. Petzhold
Crisnam Kariny da Silva Veloso1 , Lucas Rafael Carneiro da Silva2 , Ruth Marlene Campomanes Santana2 , Tatianny Soares Alves1 and Renata Barbosa1*
1Programa de Pós-graduação em Ciência e Engenharia dos Materiais, Universidade Federal do Piauí, Teresina, PI, Brasil
2Programa de Pós-graduação em Engenharia de Minas, Metalúrgica e de Materiais, Universidade Federal do Rio Grande do Sul, Porto Alegre, RS, Brasil
*rrenatabarbosa@yahoo.com
Obstract
Green composites are sustainable alternatives to conventional materials. This study developed composites based on bio-polyethylene (Bio-PE) and babassu mesocarp (BM) (1.5 and 3 phr), using PE-grafted maleic anhydride (PE-g-MA) (3 phr) as a compatibilizer. Materials were processed by extrusion and injection molding. BM exhibited starch-rich structure with a maximum degradation peak at 306 °C. PE-g-MA improved dispersion and surface finish, increasing the contact angle by up to 9.06%. Compared to neat Bio-PE, composites with PE-g-MA showed a 44.33% increase in yield stress and a 50.49% rise in ultimate tensile strength. Izod impact strength remained unchanged. Water absorption increased with BM, but was reduced up to 33.57% with PE-g-MA. This work introduces a novel use of BM in Bio-PE matrices, highlighting its potential as a Brazilian, renewable filler for sustainable composites.
Keywords: compatibilization, contact angle, fracture surface morphology, mechanical properties, water absorption.
Data Ovailability: Research data is available upon request from the corresponding.
How to cite: Veloso, C. K. S., Silva, L. R. C., Santana, R. M. C., Alves, T. S., & Barbosa, R. (2025). Development of green composites based on bio-polyethylene and babassu mesocarp. Polímeros: Ciência e Tecnologia, 35(3), e20250032. https://doi.org/10.1590/0104-1428.20240084
The demand for environmentally friendly materials has grown due to concerns about climate change, plastic waste, and resource scarcity[1]. This transition is supported by regulations on single-use plastics, consumer preference for sustainable materials, and industrial initiatives[2]. Green composites, which combine bio-based polymers with natural reinforcements, offer solutions aligned with the circular economy[3,4]. These materials aim to reduce pollution through biodegradability and renewable inputs while maintaining mechanical performance and cost-effectiveness[4,5]
Polyethylene (PE), widely used for its mechanical strength and chemical resistance, is fossil-based and contributes to environmental issues[4,5]. Bio-polyethylene (Bio-PE), derived from sugarcane ethanol, offers similar properties with reduced carbon emissions—up to 70% less than conventional PE[5,6]. However, concerns remain about land use, water consumption, and its non-biodegradability[7 8]. Incorporating natural fillers into Bio-PE can improve performance and reduce costs and environmental impact[3,5]
Several natural reinforcements have been successfully incorporated into Bio-PE to produce green composites. Dolza et al.[3] demonstrated that the incorporation of hemp,
flax, and jute fibers into Bio-PE significantly improved the stiffness and thermal stability of the resulting composites. Rojas-Lema et al.[5] investigated the use of persimmon peel flour, which contributed to enhanced antioxidant capacity and reduced water absorption. Jorda-Reolid et al.[6] used argan shell waste in Bio-PE composites and observed increased rigidity and reduced material density. Despite these advances, babassu mesocarp (BM), a lignocellulosic material that is typically Brazilian, remains unexplored as a reinforcement in Bio-PE composites.
The babassu palm (Attalea speciosa), native to northern and northeastern Brazil, is socioeconomically important for local communities[9]. This palm produces a fruit with multiple layers (Figure 1), including the epicarp (outer shell), mesocarp (fibrous middle layer), endocarp (woody inner shell), and almonds, which are rich in oil and widely used in the food industry[10]. The mesocarp is a lignocellulosic material containing starch, fibers, and other minor components, making it a low-cost and underutilized residue with potential application in polymer composites[11,12]. Its incorporation into Bio-PE may reduce waste and promote sustainable material development. To date, no studies have investigated BM in Bio-PE composites, highlighting a research gap.
Veloso, C. K. S., Silva, L. R. C., Santana, R. M. C., Alves, T. S., & Barbosa, R.
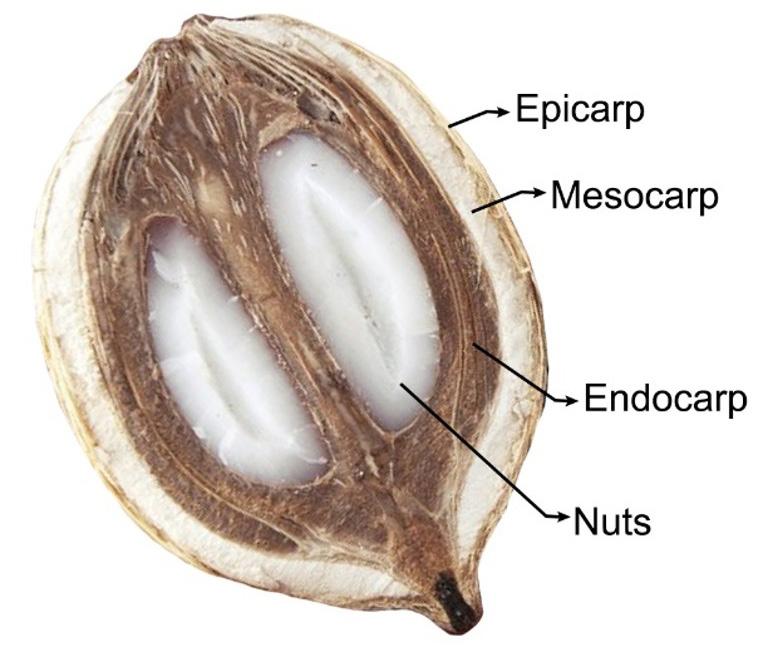
Adding BM to Bio-PE can reduce petroleum-based content, enhance biodegradability, and improve costeffectiveness[1,3]. However, its hydrophilic nature leads to compatibility issues with the hydrophobic polymer matrix, affecting mechanical and barrier properties[13]. Polyethylenegrafted maleic anhydride (PE-g-MA) has been widely used as a compatibilizer in natural filler composites and is a promising strategy to improve the compatibility between BM and the Bio-PE matrix by reducing phase separation and improving dispersion[6 14 15]
This study aims to develop composites combining Bio-PE and BM, using PE-g-MA to address compatibility challenges. The materials were characterized to evaluate the effects of BM and compatibilizer content on the properties of the composites. The use of BM as a Brazilian renewable filler in Bio-PE represents a novel approach for sustainable materials development.
2.1 Materials
Bio-Polyethylene (Bio-PE), grade SHC7260, with a minimum renewable source content of 94% (ASTM D6866) and suitable for injection processing, was used as the polymer matrix (Braskem, Brazil). It has a density of 0.959 g/cm3, a melt flow index (MFI) of 7.2 g/10 min (190 °C/2.16 kg), and a glass transition temperature (Tg) similar to that of High-Density Polyethylene (HDPE) at around -100 °C[16]. Babassu Mesocarp (BM), a byproduct of the babassu oil extraction industry (Florestas Brasileiras S.A., Itapecuru-Mirim, MA, Brazil), was used with an average particle diameter of 38.82 µm[10]. The compatibilizing agent was PE-g-MA, containing 1 wt% maleic anhydride, with a density of 0.954 g/cm3, an MFI of 5 g/10 min (190 °C/2.16 kg), and a melting temperature (Tm) of 128 °C (Arkema, France).
2.2 Development of polymer composites based on Bio-PE/BM
Bio-PE, BM, and PE-g-MA were dried at 80 °C for 24 h, following the method described by Silva et al.[11]
Table 1. Formulations for Bio-PE/BM-based composites without and with the PE-g-MA.
Formulations
Bio-PE/1.5BM
Bio-PE/3BM
Bio-PE/1.5BM/3PE-g-MA 100 1.5 3
Bio-PE/3BM/3PE-g-MA 100 3 3
*The content of BM and PE-g-MA was determined based on phr (parts per hundred resin).
Subsequently, the dried materials were manually mixed in specified proportions to produce various composite formulations, as detailed in Table 1
The formulations were processed using a single-screw extruder (screw diameter: 16 mm, L/D ratio: 26) from AX Plásticos (Model AX-16), Brazil. The heating zones were set at 185, 190, and 195 °C, with a screw speed of 50 rpm. Under these conditions, the virgin Bio-PE pellets were processed to produce the control material. The extruded material was then cooled in water at room temperature (RT), pelletized, and stored for later use. A BM content of 3 wt% was employed due to its favorable processing properties, as higher contents present limitations. An injection molding machine (Model BL52, Eurostec, Brazil) was used to create specimens for tensile strength (ASTM D638) and Izod impact strength tests (ASTM D256). The heating zones were set to 185, 190, 200, and 200 °C from the feeding section to the nozzle, with a cycle time of 35 s, a mold temperature of 25 °C, and injection and holding pressures of 70 and 35 bar, respectively. Figure 2 depicts the entire process of developing Bio-PE/BM composites, from pellet production via extrusion to specimen creation through injection molding.
The Fourier-transform infrared spectroscopy (FTIR) spectrum was recorded using a PerkinElmer Spectrum 1000 spectrophotometer, covering a range from 4000 to 500 cm-1. A BM sample was mixed with potassium bromide (KBr), pressed into a tablet, and analyzed using 32 scans at a resolution of 4 cm-1. Thermogravimetric analysis for the BM was performed using a TA Instruments Q50 V20.13 Build 39 under a nitrogen atmosphere with a gas flow rate of 100 ml/min, a heating rate of 20 °C/min, and a final temperature of 900 °C.
The films’ surface morphology was examined using a Leica DM500 binocular optical microscope in reflection mode, with an ICC50 E camera, 40x magnification, and 500 μm scale. The sessile drop method was employed to assess the contact angle (θ) of composites and determine their hydrophilic or hydrophobic nature. A 10 μl distilled water droplet was placed on the surface, and droplet images were captured using a 48-megapixel camera. The Surftens software (version 4.5) was then used to analyze these images and calculate the contact angle. The final contact angle value was obtained by averaging ten measurements for each composite.
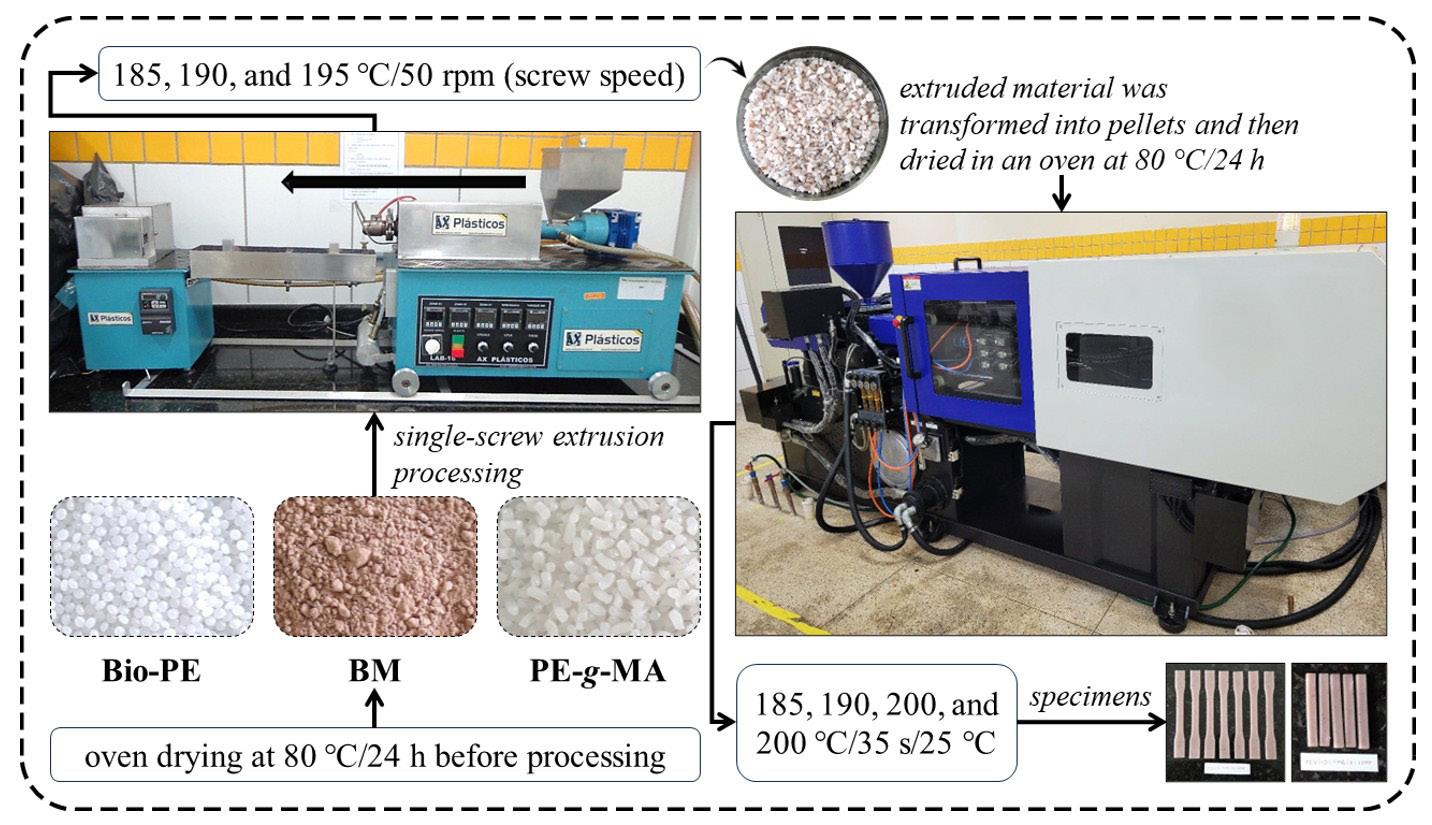
The tensile strength test was conducted using an EMIC DL 30000 Universal Testing Machine by ASTM D638 standards. A 5 kN load cell and a 50 mm/min crosshead speed were employed at RT. This test assessed the material’s yield strength, ultimate tensile strength, and Young’s modulus, representing the average of five specimens. The impact strength test was conducted using the Izod method on a CEAST Resil 5.5 J machine with a 2.75 J hammer at RT, according to ASTM D256. Specimens measuring 60 x 13 x 3.2 mm were notched to a depth of 2.5 mm. The final result corresponded to the average of five specimens.
After the tensile strength test, the fracture morphology was analyzed using gold-coated specimens with a scanning electron microscope (Model VEGA3, TESCAN) set to 20 kV. Micrographs were captured at 200 and 100 µm scale. ASTM D570 standard guided the water absorption test, during which five specimens were submerged in distilled water at RT, 50 °C, and 70 °C. A digital water bath (Model SL-150, Solab, Brazil) was used for heating. The specimens were weighed after 2, 24, 48, and 72 h, following the removal of excess water, using an analytical balance with an accuracy of 0.0001 g. The water content was calculated based on the mass difference, and the specimens were re-submerged after each weighing.
The data were analyzed using one-way ANOVA and compared between pairs of means with the Tukey test at a 5% significance level (p < 0.05) using OriginPro software (version 9.8).
The FTIR technique reveals molecular vibrations by detecting how chemical bonds absorb infrared radiation at specific wavenumbers, thereby aiding in identifying functional groups within a material.
The FTIR spectrum demonstrated that the BM (Figure 3) closely resembles various starches due to its high starch content[12]. Critical absorption bands include 3333 cm-1 for −OH stretching, which is influenced by hydrogen bonding and free water; 2930 cm-1 for −CH2 and −CH3 vibrations from fatty acids; and 1646 cm-1 for hydroxyl groups of absorbed water[17,18]. Additional bands at 1426 and 1372 cm-1 indicated C−H bending in polysaccharides, while bands at 1160, 1079, 1014, 931, 861, and 763 cm-1 correspond to various C−O, C−C, and C−H vibrations in starch[19,20]
The TGA technique assessed the thermal stability of BM, as depicted in Figure 4. The TG and DTG curves revealed three decomposition stages.
The first stage, occurring at 75.30 and 81.37 °C, involved a mass loss of 2.64% due to water evaporation. The second stage, between 277.93 and 335.61 °C, was the main thermal event, showing a mass loss of 72.84% linked to the decomposition of carbohydrates, lipids, and proteins[21]. DTG curve highlighted a peak at 306.30 °C, indicating maximum decomposition temperature. The third stage, occurring from 335.61 to 902.36 °C, resulted in a mass loss of 10.56%, associated with the decomposition of other molecules, leaving a 13.22% residue (probably minerals)[14]. The results obtained are consistent with previous studies that analyzed the thermal decomposition of biomaterials rich in polysaccharides. Silva et al.[11] and Edvan et al.[21] observed that the thermal degradation of babassu mesocarp occurs mainly between 250–350 °C, attributing this range to the decomposition of starch and cellulose.
3.3
The produced composites were visually analyzed, and images were captured to support the observations, as shown in Figure 5
C. K. S., Silva, L. R. C., Santana, R. M. C., Alves, T. S., & Barbosa, R.
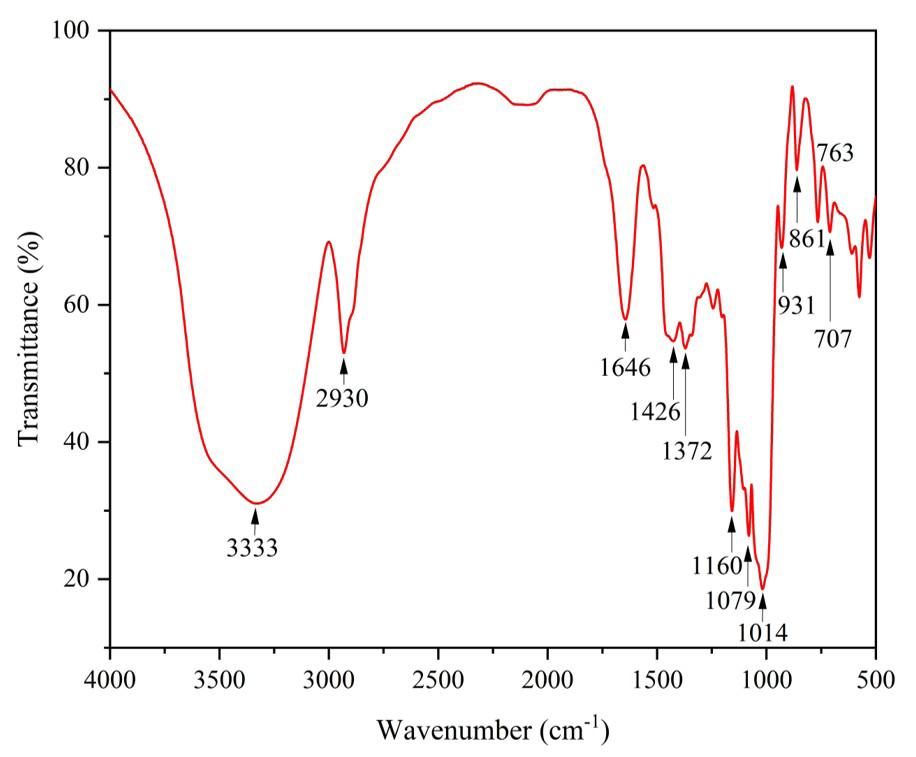
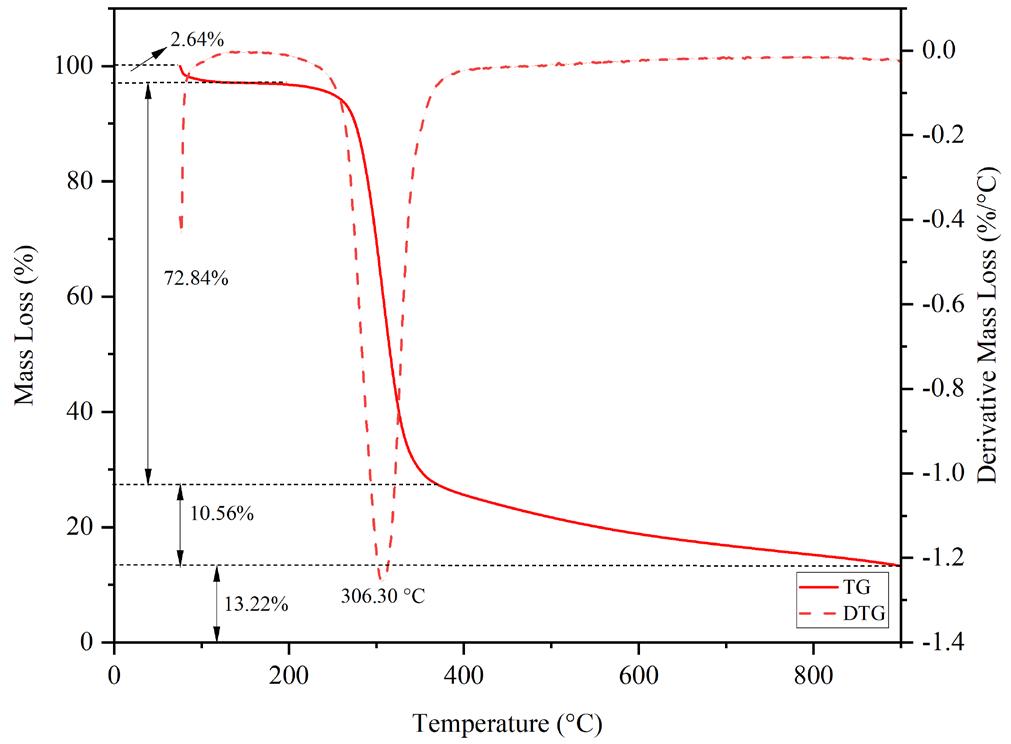
4. TG and DTG curves of BM and the corresponding
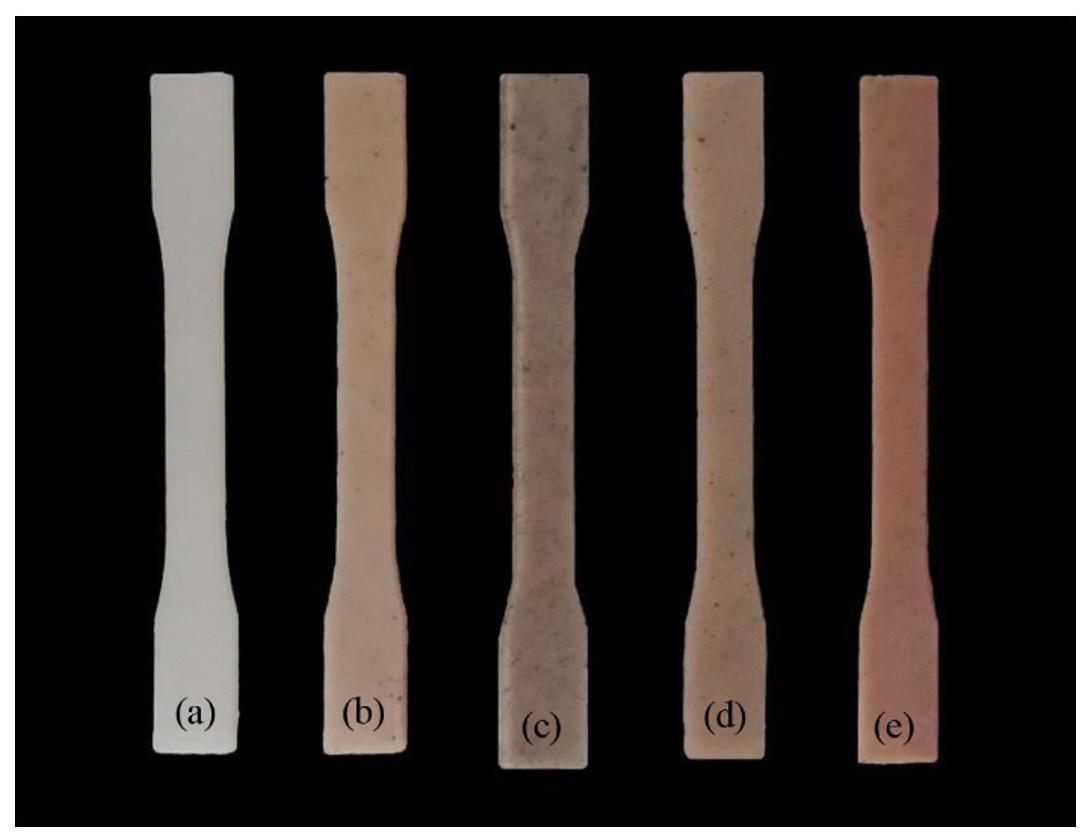
Figure 5. Macroscopic analysis performed for (a) Bio-PE, (b) Bio-PE/1.5BM, (c) Bio-PE/3BM, (d) Bio-PE/1.5BM/3PE-g-MA, and (e) Bio-PE/3BM/3PE-g-MA.
small agglomerates appeared in some areas due to physical interactions between particles. The incorporation of BM particles significantly affected the composite color, changing from the white of neat Bio-PE to a brownish hue, which darkened as the BM content increased from 1.5 to 3 wt%. Composites with PE-g-MA in the formulation exhibited a better surface finish and more uniform color, indicating that the compatibilizer improved wettability and the interfacial bond between the polymer and the filler. Rojas-Lema et al.[5] observed similar results in Bio-PE/Persimmon Peel Flour/ PE-g-MA composites.
Optical microscopy was employed to preliminarily assess the distribution and dispersion of BM particles in Bio-PE, as these factors significantly influence the material’s mechanical properties. Figure 6 illustrates the surface micrographs of the specimens.
None of the specimens exhibited visible bubbles or pores, indicating minimal surface defects. The Bio-PE-based specimen (Figure 6e) presented a more uniform appearance compared to the composites, which showed particle agglomeration increasing with filler content, especially in the absence of PE-g-MA (Figure 6a-b). This agglomeration is partly attributed to the low density of BM particles, which complicates manual pre-mixing.
The incorporation of PE-g-MA (Figure 6.c-d) reduced agglomerates and improved dispersion, although some clusters remained, indicating the need for further processing optimization. The use of a single-screw extruder may have limited shear and mixing efficiency[22]. The disparity in surface energy between the filler and the polymer matrix favors particle coalescence, resulting in small agglomerates. These act as stress concentrators, weakening the mechanical properties under stress[11]. Achieving homogeneous dispersion is essential to maximize the effectiveness of reinforcement.
The contact angle measures the interaction between a surface and a liquid, indicating whether a surface is hydrophilic or hydrophobic. Surfaces are classified as super hydrophilic (θ < 10°), hydrophilic (θ ≤ 90°), hydrophobic (90° < θ ≤ 150°), or superhydrophobic (150° < θ ≤ 180°) [23] Table 2 presents the average contact angle values and droplet images.
All composites were produced using injection molding, resulting in a satisfactory finish and uniform color. However,
The Bio-PE formulation exhibited a contact angle of approximately 86.15°, indicating a hydrophilic surface due to some polar component originating from its synthesis. Similar results were reported by Bezerra et al. [4] and Jorda-Reolid et al.[6], who observed contact angles below 90° for neat Bio-PE, attributed to the presence of residual polar groups and processing agents. Incorporating BM into Bio-PE resulted in a significant reduction in the contact angle, specifically by 2.75% for the Bio-PE/1.5BM and by 4.20% for the Bio-PE/3BM composite, demonstrating increased hydrophilicity. This enhancement is attributed to the numerous free hydroxyl groups in the BM, which increase hydrophilicity despite the relatively low amount of mesocarp in the composites.
Polímeros, 35(3), e20250032, 2025
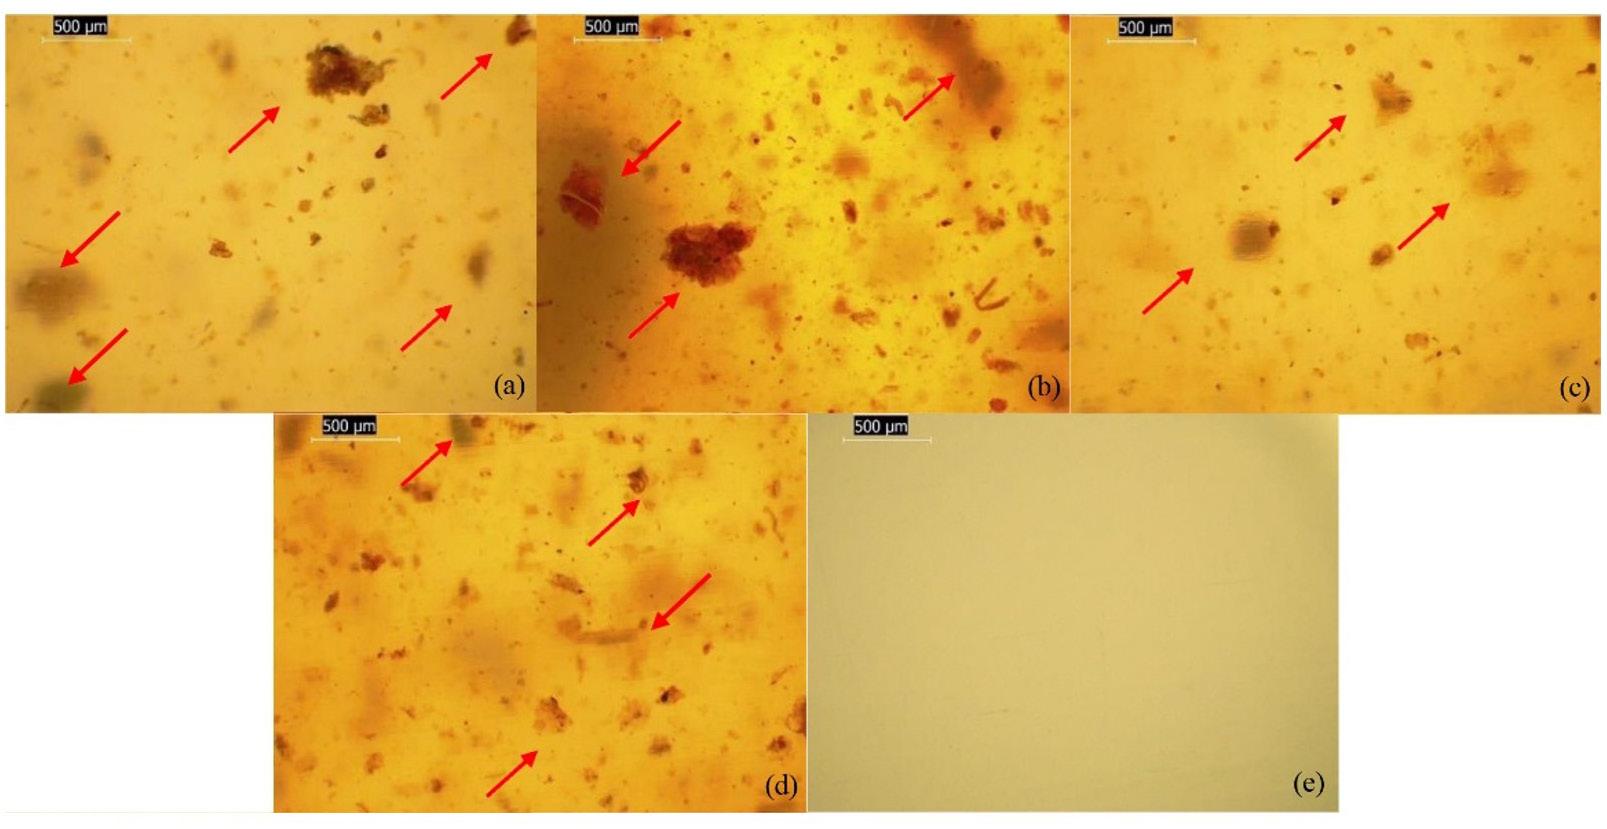
Formulations
Bio-PE 86.15a ± 1.17
Bio-PE/1.5BM 83.80b ± 0.99
Bio-PE/3BM 82.54b ± 1.24
Bio-PE/1.5BM/3PE-g-MA 89.70c ± 1.29
Bio-PE/3BM/3PE-g-MA 90.76c ± 1.96

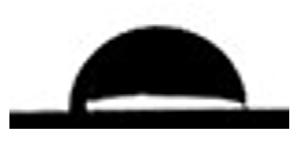

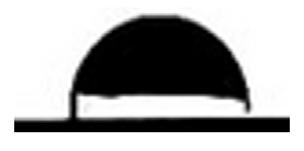
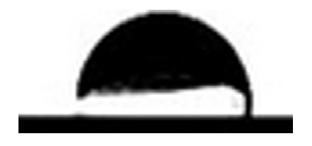
Data were expressed as means ± standard deviation (n = 10). Means with different letters within the same column represent statistically significant differences by the Tukey test (p < 0.05).
Incorporating PE-g-MA into the formulation significantly increased the contact angle, with a 6.58% rise for BioPE/1.5BM/3PE-g-MA and a 9.06% rise for Bio-PE/3BM/3PEg-MA compared to composites without the compatibilizer. This improvement is attributed to the interaction between the maleic anhydride groups in PE-g-MA and the hydroxyl groups on plant fillers, such as BM. This interaction reduces the free hydroxyl groups available for interacting with water, enhancing surface hydrophobicity. Additionally, the long PE chains in PE-g-MA further contribute to hydrophobicity
by diffusing into the polymer. These findings align with the results of manuscripts published by other authors on composites containing PE-g-MA[6,12]
The tensile strength test is a key method in materials science for assessing mechanical properties, including polymers’ response to stress and strain. Table 3 and Figure 7 data are crucial for practical material design and engineering applications.
Figure 7 presents stress−strain curves and images of specimens following a tensile strength test. The Bio-PE exhibited ductile behavior, characterized by significant deformation without fracture. This behavior is likely due to its long molecular chains and high molecular weight, contributing to its resilience and flexibility. The Bio-PE chains rearranged during the tensile test, facilitating substantial plastic deformation without fracturing. The tensile strength was comparable between the neat polymer and the composites. However, the maximum deformation decreased with the BM incorporation, particularly in the Bio-PE/3BM and Bio-PE/3BM/3PE-g-MA composites, which exhibited brittle behavior. This reduction is attributed to a possible incompatibility between the BM and Bio-PE, consistent with other research[2,3]
The reduced deformation observed in composites with 3 wt%, compared to those with 1.5 wt%, is attributable to the particles acting as barriers to polymer chain movement and as stress concentrators. This interference leads to earlier fracture under tension. PE-g-MA improved deformation by 76.49% in the Bio-PE/1.5BM/3PE-g-MA composite (51.50%) compared to the Bio-PE/1.5BM composite (12.11%). However, this benefit did not extend to composites with 3 wt% due to agglomeration, which impaired particle distribution and stress transfer within the polymer matrix[11]
Formulations
NB – No break. Data were expressed as means ± standard deviation (n = 5). Means with different letters within the same column represent statistically significant differences by the Tukey test (p < 0.05).
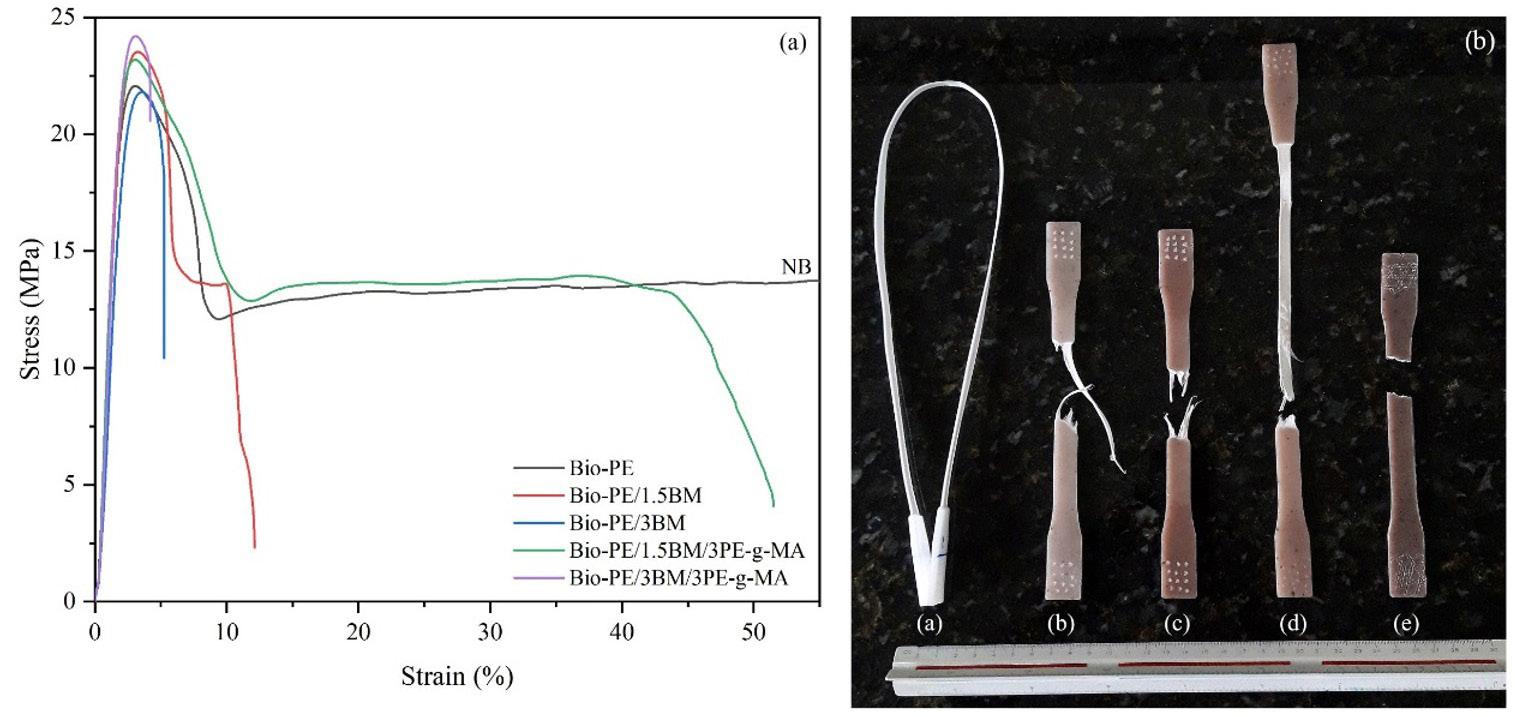
Figure 7. Scheme illustrating (a) the stress–strain curves of Bio-PE and its composites, and (b) the specimens after the tensile strength test: (a) Bio-PE, (b) Bio-PE/1.5BM, (c) Bio-PE/3BM, (d) Bio-PE/1.5BM/3PE-g-MA, and (e) Bio-PE/3BM/3PE-g-MA.
Table 3 reveals a 17.34% reduction in yield stress for the Bio-PE/1.5BM composite compared to Bio-PE, attributed to stress concentration from particles that may accelerate crack propagation[1]. Conversely, the yield stress increased by 13.36% for the Bio-PE/3BM composite, by 13.06% for the Bio-PE/1.5BM/3PE-g-MA composite, and by 30.71% for the Bio-PE/3BM/3PE-g-MA composite. PE-g-MA improved the interfacial adhesion between the filler and the polymer matrix by interacting with the hydroxyl groups of BM. This interaction enhanced stress transfer and increased the composite’s resistance[3].
The Bio-PE specimen did not exhibit ultimate tensile strength because it did not fracture, owing to its significant plastic deformation capacity. Among the composites, BioPE/1.5BM and Bio-PE/1.5BM/3PE-g-MA exhibited similar ultimate tensile strengths due to the absence of fracture in Bio-PE. However, Bio-PE/3BM/3PE-g-MA demonstrated a 50.49% increase in ultimate tensile strength compared to Bio-PE/3BM. This enhancement is attributed to the reinforcing effect of the compatibilizer, which improves the interaction between Bio-PE and BM. During processing, part of the PE-g-MA migrates to the matrix–filler interface, where its anhydride groups react with hydroxyl groups in the BM. This chemical interaction enhances interfacial adhesion, facilitating stress transfer from the matrix to the filler and improving the mechanical strength of the composite[14]
Incorporating BM into Bio-PE resulted in a 13.17% reduction in Young’s modulus for Bio-PE/1.5BM and a 19.79% reduction for Bio-PE/3BM. This reduction may be due to the presence of residual natural components in the BM, such as lipids or waxes, which can act as plasticizing agents and interfere with the rigidity and interfacial bonding of the composite[17]. However, the addition of PE-g-MA restored the modulus, suggesting that the compatibilizer enhanced the interaction between the polymer matrix and the dispersed particles, resulting in more efficient stress transfer. The restoration of the modulus can be attributed to localized interfacial interactions between Bio-PE and BM, promoted by PE-g-MA, which enhanced load transfer despite the non-uniform dispersion of the particles. PE-g-MA may have reduced the incompatibility between the phases, minimizing interfacial defects that could compromise the material’s rigidity[3,6]
Impact strength is critical for polymers, as they often fail under sudden loads. Table 4 shows the results of the Izod test, which measured this property.
The analysis of Izod impact resistance results showed that the inclusion of BM, whether alone or in combination with PE-g-MA, did not result in statistically significant
Development
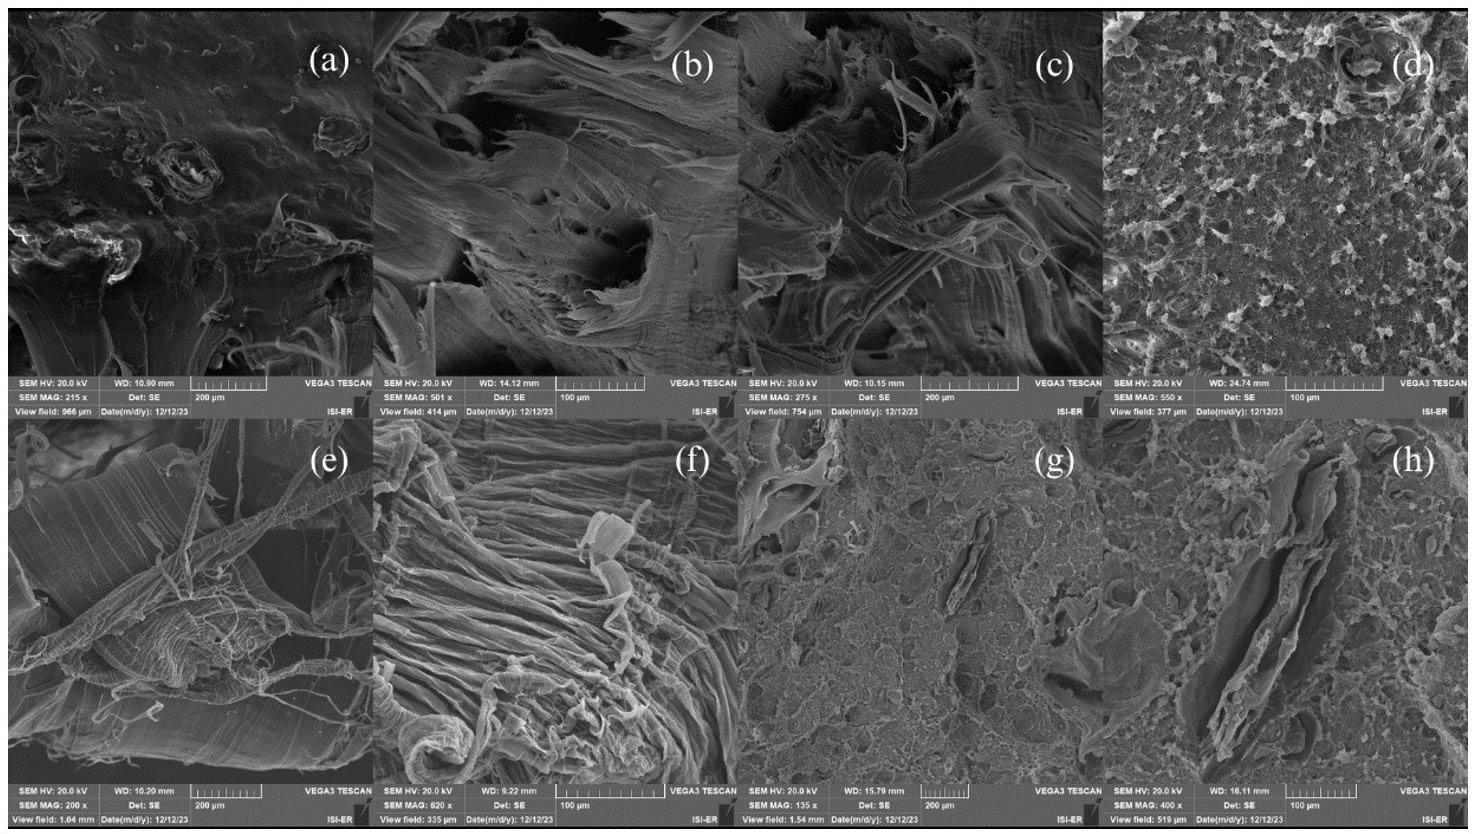
Table 4. Data obtained from the impact strength test for composites based on Bio-PE/BM.
Formulations
Bio-PE
Bio-PE/1.5BM
Bio-PE/3BM
48.77a ± 0.30
48.55a ± 0.26
48.97a ± 0.11
Bio-PE/1.5BM/3PE-g-MA 48.83a ± 0.14
Bio-PE/3BM/3PE-g-MA 48.89a ± 0.25
Data were expressed as means ± standard deviation (n = 5). Means with different letters within the same column represent statistically significant differences by the Tukey test (p < 0.05).
changes in Bio-PE/BM composites compared to pure BioPE, as evidenced by the Tukey test (p < 0.05). Pure Bio-PE exhibited an average impact resistance of 48.77 J/m, while formulations containing 1.5 and 3 wt% of BM, with or without PE-g-MA, showed minimal variations, maintaining values close to the control. This behavior indicates that the inclusion of BM does not affect the material’s energy dissipation in response to impact, even with its reduced dispersion in the polymer matrix[22]. Additionally, the presence of PE-g-MA compatibilizer also did not influence impact resistance, suggesting that, despite its ability to enhance the interaction between BM and the polymer matrix, its action was not effective in altering fracture propagation properties[3]
SEM reveals the composite’s internal structure and fracture details after the tensile strength test, highlighting the interaction between the Bio-PE and the BM particles, which impact the mechanical properties, according to Figure 8 The fracture surface morphology of neat Bio-PE was not
analyzed due to the absence of a fracture. The Bio-PE/1.5BM composite exhibited ductile fracture behavior, with visible plastic deformation, resulting in an irregular, wavy surface with signs of tearing (Figure 8.a-b). The Bio-PE/3BM composite also displayed ductile fracture characteristics but with a rougher surface and indications of less plastic deformation (Figure 8.c-d), suggesting a transition to a more brittle behavior. In Figure 8.d, structural defects, such as voids, valleys, and microcracks, can be observed, acting as stress concentrators[2,5]
The incorporation of PE-g-MA significantly influenced the fracture surface morphology of the composites. A fibrous pattern emerged in the Bio-PE/1.5BM/3PE-g-MA (Figure 8e-f), indicating extensive plastic deformation and energy absorption. This observation suggested that the polymer chains had aligned and stretched, forming fibrils under stress[1]. In contrast, the Bio-PE/3BM/3PE-gMA (Figure 8.g-h) displayed a more irregular and rough morphology, suggesting shallow deformation and rapid crack propagation due to weak adhesion between phases, which compromised stress transfer and reduced ductility[3]
The water absorption test evaluated how moisture affected the strength and stability. Figure 9 and Table S1 (Supplementary Material) display the results at three temperatures.
The research found that water absorption in composites increased over time, with Bio-PE demonstrating superior moisture resistance and lower water absorption. This reduced absorption in Bio-PE is attributed to its non-polar nature and tightly packed polymer chains, which impede water penetration. The absence of polar functional groups
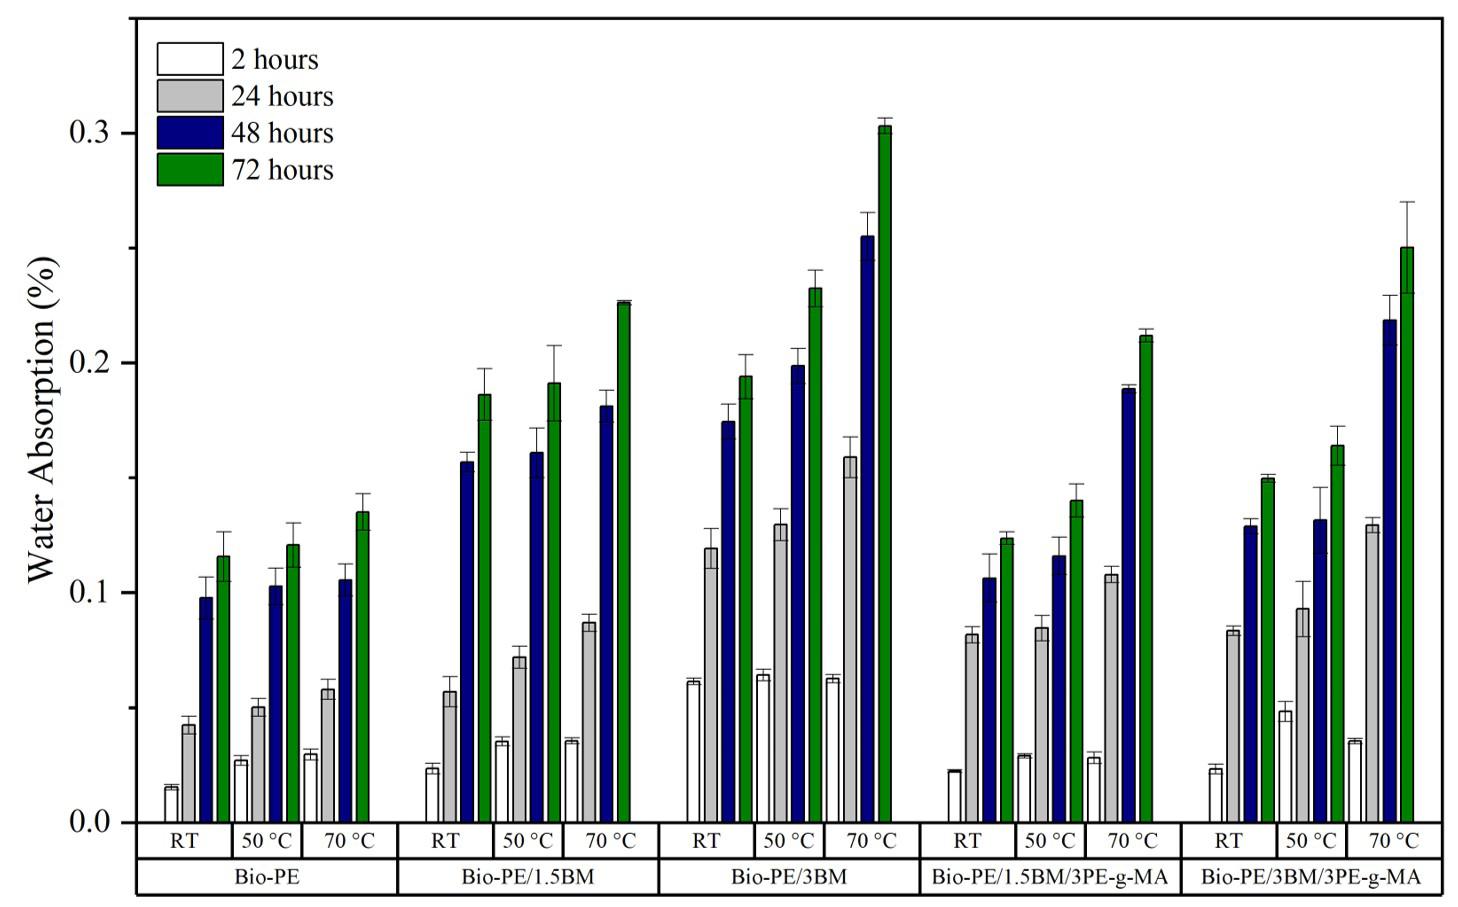
enhances Bio-PE’s hydrophobic properties. A higher BM content in the composites resulted in increased water absorption, except for the Bio-PE/1.5BM composite at RT for 24 h, which exhibited water absorption similar to that of pure Bio-PE. Similarly, the Bio-PE/3BM composite did not differ significantly from the Bio-PE/1.5BM composite at 48 and 72 h. The increased water absorption in the composites is attributed to the polar hydroxyl groups in BM, which attract water molecules through hydrogen bonds, forming a hydration layer.
The Bio-PE/3BM/3PE-g -MA exhibited a reduction in water absorption, whereas the Bio-PE/1.5BM/3PE- gMA did not differ significantly from the Bio-PE/1.5BM. This reduction in water absorption, which ranged from 14.90 to 33.57% over 72 h, is attributed to the improved interaction and adhesion between Bio-PE and BM, which likely minimized voids at the interface and thereby reduced water retention. The PE- g -MA component decreased the composite’s polarity, lowering its water affinity. A manuscript by Panthapulakkal and Sain[24] found that a compatibilizing agent reduced water absorption in HDPE-based composites by minimizing flaws at the matrix/filler interface. However, increased temperature resulted in higher water absorption, ranging from 8.72 to 35.99%, due to decreased water density and viscosity and increased polymer chain mobility, facilitating water penetration[25]
The BM characterization showed it has a chemical structure similar to starch and high thermal stability, with significant degradation only above 200 °C. In composites, injection molding resulted in a well-finished product with well-distributed particles, although some agglomerates affected wettability. Adding PE-g-MA at 1.5 wt% improved plastic deformation. BM content and PE-g-MA usage variations influenced tensile strength, while impact strength remained unchanged. Analyzing the fracture surface using SEM provided insights into the composite’s behavior. BM particles increased water absorption, but PE-g-MA mitigated this effect. The research highlighted the BM potential and value in producing green composites, aligning with ecological and circular economy principles.
• Conceptualization – Crisnam Kariny da Silva Veloso; Renata Barbosa.
• Data curation – Crisnam Kariny da Silva Veloso.
• Formal analysis – Crisnam Kariny da Silva Veloso.
• Funding acquisition – NA.
• Investigation – Crisnam Kariny da Silva Veloso.
• Methodology – Crisnam Kariny da Silva Veloso; Renata Barbosa.
• Project administration – Renata Barbosa.
• Resources – Renata Barbosa; Tatianny Soares Alves; Ruth Marlene Campomanes Santana.
• Software – NA.
• Supervision – Renata Barbosa; Tatianny Soares Alves.
• Validation – Crisnam Kariny da Silva Veloso; Renata Barbosa.
• Visualization – Crisnam Kariny da Silva Veloso.
• Writing – original draft – Crisnam Kariny da Silva Veloso; Lucas Rafael Carneiro da Silva.
• Writing – review & editing – Crisnam Kariny da Silva Veloso; Lucas Rafael Carneiro da Silva; Renata Barbosa.
The authors want to acknowledge the Federal University of Piauí (UFPI), Postgraduate Program in Materials Science and Engineering (PPGCM), Piauí State Research Support Foundation (FAPEPI) [EDITAL FAPEPI/MCTIC/ CNPq Nº 008/2018], National Council for Scientific and Technological Development (CNPq), and Coordination for the Improvement of Higher Education Personnel (CAPES).
1 Essabir, H., Bensalah, M. O., Rodrigue, D., Bouhfid, R., & Qaiss, A. E. K. (2016). Biocomposites based on Argan nut shell and a polymer matrix: effect of filler content and coupling agent. Carbohydrate Polymers, 143, 70-83 http://doi.org/10.1016/j. carbpol.2016.02.002. PMid:27083345.
2 Rodríguez, L. J., Álvarez-Láinez, M. L., & Orrego, C. E. (2022). Optimization of processing conditions and mechanical properties of banana fiber-reinforced polylactic acid/high-density polyethylene biocomposites. Journal of Applied Polymer Science, 139(3), 51501 http://doi.org/10.1002/app.51501
3 Dolza, C., Fages, E., Gonga, E., Gomez-Caturla, J., Balart, R., & Quiles-Carrillo, L. (2021). Development and characterization of environmentally friendly wood plastic composites from biobased polyethylene and short natural fibers processed by injection moulding. Polymers, 13(11), 1692 http://doi. org/10.3390/polym13111692. PMid:34067283.
4 Bezerra, E. B., França, D. C., Morais, D. D. S., Silva, I. D. S., Siqueira, D. D., Araújo, E. M., & Wellen, R. M. R. (2019). Compatibility and characterization of Bio-PE/PCL blends. Polímeros, 29(2), e2019022 http://doi.org/10.1590/01041428.02518.
5 Rojas-Lema, S., Lascano, D., Ivorra-Martinez, J., Gomez-Caturla, J., Balart, R., & Garcia-Garcia, D. (2021). Manufacturing and characterization of high-density polyethylene composites
Development of green composites based on bio-polyethylene and babassu mesocarp
with active fillers from persimmon peel flour with improved antioxidant activity and hydrophobicity. Macromolecular Materials and Engineering, 306(11), 2100430 http://doi. org/10.1002/mame.202100430
6 Jorda-Reolid, M., Gomez-Caturla, J., Ivorra-Martinez, J., Stefani, P. M., Rojas-Lema, S., & Quiles-Carrillo, L. (2021). Upgrading argan shell wastes in wood plastic composites with biobased polyethylene matrix and different compatibilizers. Polymers, 13(6), 922 http://doi.org/10.3390/polym13060922 PMid:33802815.
7 Moshood, T. D., Nawanir, G., Mahmud, F., Mohamad, F., Ahmad, M. H., & AbdulGhani, A. (2022). Sustainability of biodegradable plastics: new problem or solution to solve the global plastic pollution? Current Research in Green and Sustainable Chemistry, 5, 100273 http://doi.org/10.1016/j. crgsc.2022.100273.
8 Spierling, S., Knüpffer, E., Behnsen, H., Mudersbach, M., Krieg, H., Springer, S., Albrecht, S., Herrmann, C., & Endres, H.-J. (2018). Bio-based plastics: a review of environmental, social, and economic impact assessments. Journal of Cleaner Production, 185, 476-491 http://doi.org/10.1016/j.jclepro.2018.03.014
9 González-Pérez, S. E., Coelho-Ferreira, M., Robert, P., & Garcés, C. L. L. (2012). Conhecimento e usos do babaçu (Attalea speciosa Mart. e Attalea eichleri (Drude) A. J. Hend.) entre os Mebêngôkre-Kayapó da Terra Indígena Las Casas, estado do Pará, Brasil. Acta Botanica Brasílica, 26(2), 295308 http://doi.org/10.1590/S0102-33062012000200007
10 Silva, L. R. C., Alves, T. S., Barbosa, R., Morisso, F. D. P., Rios, A. O., & Santana, R. M. C. (2023). Characterization of babassu mesocarp flour as potential bio-reinforcement for poly(lactic acid). Journal of Food Industry, 7(1), 24-53 http:// doi.org/10.5296/jfi.v7i1.21066
11 Silva, N. F. I., Soares, J. E., Fo., Santos, T. G. C., Chagas, J. S., Medeiros, S. A. S. L., Santos, E. B. C., Wellen, R. M. R., Silva, L. B., Carvalho, L., Nunes, M. A. B. S., & Santos, A. S. F. (2021). Biocomposites based on poly(hydroxybutyrate) and the mesocarp of babassu coconut (Orbignya phalerata Mart.): effect of wax removal and maleic anhydride-modified polyethylene addition. Journal of Materials Research and Technology, 15, 3161-3170. http://doi.org/10.1016/j.jmrt.2021.09.008.
12 Maniglia, B. C., Tessaro, L., Lucas, A. A., & Tapia-Blácido, D. R. (2017). Bioactive films based on babassu mesocarp flour and starch. Food Hydrocolloids, 70, 383-391. http://doi. org/10.1016/j.foodhyd.2017.04.022
13 Alim, A. A. A., Baharum, A., Shirajuddin, S. S. M., & Anuar, F. H. (2023). Blending of Low-Density Polyethylene and Poly(Butylene Succinate) (LDPE/PBS) with Polyethylene–Graft–Maleic Anhydride (PE–g–MA) as a compatibilizer on the phase morphology, mechanical and thermal properties. Polymers, 15(2), 261. http://doi.org/10.3390/polym15020261. PMid:36679142.
14 Prajapati, R. S., Jain, S., & Shit, S. C. (2017). Development of basalt fiber-reinforced thermoplastic composites and effect of PE-g-MA on composites. Polymer Composites, 38(12), 2798-2805 http://doi.org/10.1002/pc.23879
15. Bal, T., Yadav, S. K., Rai, N., Swain, S., Shambhavi, Garg, S., & Sen, G. (2020). Invitro evaluations of free radical assisted microwave irradiated polyacrylamide grafted cashew gum (CG) biocompatible graft copolymer (CG-g-PAM) as effective
polymeric scaffold. Journal of Drug Delivery Science and Technology, 56(Pt A), 101572 http://doi.org/10.1016/j. jddst.2020.101572
16 Greene, J. P. (2021). Microstructures of polymers. In J. P. Greene Automotive plastics and composites (pp. 27-37). Norwich: William Andrew Publishing http://doi.org/10.1016/ B978-0-12-818008-2.00009-X
17. Vu, H. P. N., & Lumdubwong, N. (2016). Starch behaviors and mechanical properties of starch blend films with different plasticizers. Carbohydrate Polymers, 154, 112-120 http://doi. org/10.1016/j.carbpol.2016.08.034 PMid:27577902.
18 Thivya, P., Bhosale, Y. K., Anandakumar, S., Hema, V., & Sinija, V. R. (2021). Exploring the effective utilization of shallot stalk waste and tamarind seed for packaging film preparation. Waste and Biomass Valorization, 12(10), 5779-5794 http:// doi.org/10.1007/s12649-021-01402-4
19 Abdullah, A. H. D., Chalimah, S., Primadona, I., & Hanantyo, M. H. G. (2018). Physical and chemical properties of corn, cassava, and potato starchs. IOP Conference Series: Earth and Environmental Science, 160, 012003 http://doi.org/10.1088/17551315/160/1/012003
20 Singh, R., Kaur, S., & Aggarwal, P. (2021). Exploration of potato starches from non-commercial cultivars in ready to cook instant non cereal, non glutinous pudding mix. Lebensmittel-Wissenschaft + Technologie, 150, 111966 http:// doi.org/10.1016/j.lwt.2021.111966
21 Edvan, R., Sá, M., Magalhães, R., Ratke, R., Sousa, H. R., Neri, L. M. L., Silva-Filho, E. C., Pereira, J., Fo., & Bezerra, L. (2020). Copolymerized natural fibre from the mesocarp of orbignya phalerata (babassu fruit) as an irrigating-fertilizer for growing cactus pears. Polymers, 12(8), 1699 http://doi. org/10.3390/polym12081699 PMid:32751245.
22. Barbos, J. D. V., Azevedo, J. B., Cardoso, P. S. M., Garcia, F. C., Fo., & del Río, T. G. (2020). Development and characterization of WPCs produced with high amount of wood residue. Journal of Materials Research and Technology, 9(5), 9684-9690 http:// doi.org/10.1016/j.jmrt.2020.06.073
23. Ahmad, D., van den Boogaert, I., Miller, J., Presswell, R., & Jouhara, H. (2018). Hydrophilic and hydrophobic materials and their applications. Energy Sources. Part A, Recovery, Utilization, and Environmental Effects, 40(22), 2686-2725 http://doi.org/10.1080/15567036.2018.1511642
24. Panthapulakkal, S., & Sain, M. (2007). Agro-residue reinforced high-density polyethylene composites: fiber characterization and analysis of composite properties. Composites. Part A, Applied Science and Manufacturing, 38(6), 1445-1454 http:// doi.org/10.1016/j.compositesa.2007.01.015
25. Chen, R. S., Ab Ghani, M. H., Salleh, M. N., Ahmad, S., & Tarawneh, M. A. A. (2015). Mechanical, water absorption, and morphology of recycled polymer blend rice husk flour biocomposites. Journal of Applied Polymer Science, 132(8), 41494 http://doi.org/10.1002/app.41494
Received: Aug. 29, 2024
Revised: Apr. 23, 2025
Accepted: May 24, 2025
Associate Editor: José A. C. G. Covas
Veloso, C. K. S., Silva, L. R. C., Santana, R. M. C., Alves, T. S., & Barbosa, R.
Supplementary Material
Supplementary material accompanies this paper.
Table S1. Data obtained from the water absorption test for Bio-PE and composites based on Bio-PE/BM. This material is available as part of the online article from https://doi.org/10.1590/0104-1428.20240084
Polímeros, 35(3), e20250032, 2025
Washington José Fernandes Formiga1 , Henrique Almeida Cunha1 , Manoel Ribeiro da Silva2 , Ivana Lourenço de Mello Ferreira1 , Jacira Aparecida Castanharo1* and Marcos Antonio da Silva Costa1
1Instituto de Química, Laboratório de Química de Polímeros, Universidade do Estado do Rio de Janeiro, Rio de Janeiro, RJ, Brasil
2Instituto de Ciências, Laboratório de Física, Universidade Federal de Itajubá, Itajubá, MG, Brasil
*jaciracastanharo@gmail.com
Obstract
Superparamagnetic microspheres of poly(glycidyl methacrylate-co-divinylbenzene) were produced via suspension polymerization and were functionalized with ethylenediamine, diethylenetriamine and triethylenetetramine. The results of Cr(VI) adsorption showed better removal at pH 2. The adsorptive process was best described by the pseudo-second order model, and an equilibrium isotherm study indicated the best suitability of the Langmuir model. The microspheres modified with ethylenediamine had greater adsorption capacity and the highest ΔH value at pH=2 and 318 K. The choice among EDA, DETA, and TETA as substituent groups depends on balancing adsorption efficiency, selectivity and process kinetics. In these studies, R14-DETA showed better performance than the others. The adsorbents had ΔH around 40-45 kJ/mol and ΔS between 148-159 J/mol.K. The results indicated an endothermic process, of chemical nature, with negative ΔG values. This study indicates the potential for applications in Cr(VI) removal.
Keywords: amino functionalization, Cr(VI) removal, divinylbenzene, glycidyl methacrylate, magnetic microspheres.
Data Ovailability: Research data is available upon request from the corresponding author.
How to cite: Formiga, W. J. F., Cunha, H. A., Silva, M. R., Ferreira, I. L. M., Castanharo, J. A., & Costa, M. A. S. (2025). Magnetic poly(glycidyl methacrylate-co-divinylbenzene) with amino groups for chromium VI removal. Polímeros: Ciência e Tecnologia, 35(3), e20250033. https://doi.org/10.1590/0104-1428.20240083
1. Introduction
Industrial wastewater often contains heavy metals. These pollutants can accumulate when discharged in the environment, where they pose a threat to the survival of many animal and plant species, including cancer and other diseases. Among these pollutants, chromium and its compounds directly contribute to industrial wastewater contamination, derived from the leather tanning, textile, electroplating, paint and pigment industries[1,2]. Chromium naturally occurs in two valence states, Cr(III) and Cr(VI). While Cr(III) is generally regarded as less toxic, Cr(VI) is widely recognized as a human carcinogen and an environmental pollutant. According to the International Agency for Research on Cancer (IARC), Cr(VI) is classified as a Group 1 human carcinogen[2,3] .
There are several possible treatments for chromiumcontaining wastewater, such as reduction, precipitation, ion exchange, and reverse osmosis, among others. However, the adsorption process has the benefit of easy and quick removal, so it has strong potential to eliminate Cr(VI) ions from wastewater. Moreover, adsorption also does not produce any additional harmful substances[4 5]
Recently, numerous adsorbents have been developed to remove Cr(VI) ions, like iron-based adsorbents, metal
hydroxides, clay and cellulose[1,4,5]. Some of these approaches can be costly and less effective at low pollutant concentrations. In addition, they may have low adsorption capacities or difficulty to achieve this target due to poor thermal stability, regeneration, and weak mechanical properties[1,5]
Polymeric resins are an interesting class of adsorbents. Their advantage over other adsorbent classes is that in addition to being easily manufactured with a wide range of physical-chemical properties (particle size, size distribution, porosity, hydrophobicity, etc.), they also can be chemically modified to introduce functional groups, producing specific sorbents[6]. Copolymers based on glycidyl methacrylate (GMA) have attracted attention due to the presence of the epoxy group. It is possible by opening the epoxide ring to introduce iminodiacetate, thiol, azole, and pyrazole groups, among others. Sorbents with amine groups are also possible and stand out for their high adsorption, fast kinetics and good selectivity for heavy metal ions, as well as chemical and mechanical stability[7]
Maksin et al.[6] synthesized porous and nonporous poly(metacrylate glydidyl-co-ethylene glycol dimetacrylate) (P(GMA-co-EGDMA)) by suspension copolymerization and functionalization with diethylenetriamine (DETA).
Formiga, W. J. F., Cunha, H. A., Silva, M. R., Ferreira, I. L. M., Castanharo, J. A., & Costa, M. A. S.
They found monolayer adsorption capacity at pH 1.8 and 25◦C for porous materials of this species ranging from 132 to 143 mg.g-1 , and 25.6 mg.g-1 for nonporous materials. Besides this, the thermodynamic parameters revealed that the Cr(VI) adsorption on polymers was endothermic and spontaneous.
Malović et al.[7] also synthesized P(GMA-co-EGDMA) by suspension polymerization with the amine groups ethylene diamine (EDA), diethylene triamine (DETA) and triethylene tetramine (TETA). The most pronounced increase in specific surface area (75%) was observed for P(GMA-co-EGDMA)-TETA. At pH 1.8. The selectivity of P(GMA-co-EGDMA)-TETA with smaller particles of Cr(VI) involving other heavy metal ions was 8.5:1.
Nastasović et al.[8] synthesized a sample of poly(glycidyl methacrylate-co-ethylene glycol dimethacrylate) and another of poly(GMA-co-EGDMA) by suspension polymerization with different porosities. Subsequently, they functionalized the samples through a ring-opening reaction of the pendant epoxide groups with ethylenediamine (EDA) and diethylenetriamine (DETA). The sorption kinetics of Cr(VI), Cu(II), Co(II), Cd(II) and Ni(II) were studied under non-competitive conditions (from a single-component solution of the metal salt) and competitive conditions (mixture of different metal solutions). The adsorption of Cr(VI) ions was very fast, presumably because the sorption process occurred predominantly on the surface of the amino-functionalized granules, with no diffusion of oxyanions into the resin pores, an assumption confirmed by the poor fit of the intraparticle diffusion model.
These studies have demonstrated the potential use of aminated glycidyl methacrylate resins as adsorbents. However, these resins had no magnetic properties. The main advantage of the presence of magnetic material in polymers is that after adsorption, the spent adsorbent is easily separated from the medium by applying an external magnetic field[2]. Indeed, magnetic resins can be reused multiple times and are also suitable for use in continuous processes[9]
Wang et al.[10] synthesized a magnetic poly(GMA-coEGDMA) with EDA groups. The maximum adsorption capacities obtained from the Langmuir model were 236.9, 242.1 and 253.2 mg.g-1 at 298, 308 and 318 K, respectively. The Cr(VI) adsorption equilibrium was achieved within 120 min. and the adsorption kinetics were compatible with the pseudo-second order equation. The thermodynamic parameters of the sorption process revealed that the adsorption was spontaneous and endothermic.
Zhao et al.[11] also studied magnetic poly(GMA-MMADVB)-EDA obtained by suspension polymerization. The authors evaluated the synthesized materials for the removal of Cr(VI). The adsorption data observed at the optimized condition, i.e., 35 ◦C and pH of 2.5, were well fitted by the Langmuir isotherm, and the maximum adsorption capacity increased with rising amount of the functional agent, GMA. The adsorption kinetics data were modeled by the pseudo-second order equation, and the adsorption of Cr(VI) by all the polymers reached equilibrium in 60 min.
Although there are published works describing the synthesis of magnetic polymeric microspheres based on functionalized glycidyl methacrylate (GMA)[10-12] , we found no study of the influence of the chain size of the amine
groups, uptake kinetics and sorption isotherm model in amino functionalized magnetic copolymers based in GMA and DVB for chromium (VI) removal from aqueous effluents.
2.1 Materials
Glycidyl methacrylate (GMA) (Aldrich; purity - 97%); divinylbenzene (DVB) (commercial grade, Nitriflex, Brazil); oleic acid PA (B’Herzog, Brazil); sodium hydroxide PA (B’Herzog, Brazil); ferric chloride PA (FeCl3) (Vetec, Brazil); ferrous sulfate PA (FeSO4) (Vetec, Brazil)); potassium dichromate PA (Merck); ethanol (commercial grade, Sumatex, Brazil); diphenylcarbazide PA (Merck); benzoyl peroxide PA (BPO) (Vetec, Brazil); ethylenediamine (Aldrich; purity - 99%) (EDA); diethylenetetramine (DETA) (Aldrich; purity - 99%); triethylenetetramine (TETA) (Aldrich; purity - 97%); dimethylformamide (DMF) (Aldrich; purity - 99%); and poly(vinyl alcohol) (PVA) (AirProducts, hydrolysis degree of 85% and MM = 80,000 to125,000) were all used as received.
2.2 Magnetic glycidyl methacrylate-co-divinylbenzene copolymer synthesis
Poly(GMA-co-DVB)-M samples were prepared by radical suspension copolymerization. The monomer phase containing the mixture (98% mol of GMA and 2% mol of DVB), BPO (1% mol relative to the total monomers), as initiator, and magnetite (10% w/v) was suspended in the aqueous phase, consisting of 260 g of water and 1.2 g of PVA. The copolymerization was carried out at 70 °C for 24 h with a stirring rate of 800 rpm.
2.3 Amino magnetic copolymer synthesis
The polymer particles were washed with water and ethanol, kept in ethanol for 12 h and dried at 50 °C for 24 h. The amino functionalization occurred from 2 g of poly(GMA-co-DVB) (R14) reacted with 10 mL of EDA, DETA or TETA and 25 mL of DMF at 55 °C, for 72 h, at 300 rpm. The amino copolymers were then washed several times with ethanol and water, filtered and dried at 50 °C for 24 hours[13]
2.4 Characterization
The magnetic amino copolymers were analyzed by scanning electron microscopy-energy dispersive X-ray analysis (SEM-EDX) (FEI Inspect 55 microscope). The samples were coated with a thin layer of gold. Images were generated by secondary electron detectors with acceleration voltage of 20 kV. The thermal properties were evaluated with a Q50 V6.4 Build 193 thermogravimetric analyzer (TA Instruments). The material was heated from 10 to 500 °C in a nitrogen atmosphere with a flow rate of 100 mL min−1 and speed of 20 °C min−1. The magnetic properties were determined by vibrating sample magnetometry (VSM) (Lake Shore 7400) with an applied field of H = ±12 kOe, under ambient conditions. The distribution and average diameter of the magnetic copolymers were obtained by light scattering detection (LSD) (Malvern Nano-ZS analyzer).
Magnetic poly(glycidyl methacrylate-co-divinylbenzene) with amino groups for chromium VI removal
Elemental analysis was performed with a CHNS/O analyzer (PerkinElmer 2400 Series II), applying dynamic flash combustion for sample analysis. Fourier-transform infrared spectroscopy together with attenuated total reflectance (FTIR-ATR) was also used. The spectrum range ranged from 4000 to 400 cm-1 with resolution of 16 cm-1 (PerkinElmer Spectrum One). The UV-Vis spectrophotometric technique (Biospectro SP-22, λ=540 nm) was used to determine the chromium adsorbed on the copolymers.
2.5 Effect of pH on the Cr(VI) adsorption on the amino magnetic copolymers
To evaluate the effect of pH on the Cr(VI) adsorption capacity of the magnetic adsorbents, we tested pH values of 2, 4, 5, 6, 7, 8, 10 and 12. Thus, samples of 100 mg of the copolymer were added to 20 mL of 100 mg L-1 Cr(VI) solutions at different pH values previously adjusted with NaOH and/or HCl solutions. The systems remained under constant stirring at 25 °C for 24 h in a thermostatic bath. After this time, the resin was separated from the medium by the action of a magnet and the supernatant was analyzed by UV-Vis after reaction of these ions with 1,5-diphenylcarbazide to determine the remaining Cr(VI) content and calculate the removal rate.
2.6 Adsorption kinetics of Cr(VI) on the amino magnetic copolymers
The kinetic analysis of the adsorption process was carried out at temperatures of 25, 30, 35, 40 and 45 °C. The experiments were performed in batches with 0.25 g of copolymer at different concentrations of Cr(VI) (5, 15, 20, 25, 50, 75, 100, 150 and 200 mg.L-1) at pH = 2.0. Samples were shaken and aliquots of the supernatant were removed after different intervals (0, 5, 10, 30, 60, 90, 120, 150, 180, 210, 240, 270, 300, 360 and 1400 min). The Cr(VI) concentration was determined by UV-Vis after reaction of these ions with 1,5-diphenylcarbazide. The interpretation of the experimental data and the mechanisms controlling the adsorption process was adjusted to the kinetic models, investigated and validated by the correlation coefficients of their linearized equations: [log (qe - qt) vs t] for the pseudo-first order model; [t/qt vs t] for the pseudo-second order model; and [qt vs t1/2] for the intraparticle diffusion model.
2.7 Adsorption isotherm of Cr(VI) in the amino magnetic copolymers
The adsorption isotherm was analyzed in batch experiments, by placing 0.25 g of copolymer in contact with a series of Cr(VI) solutions in concentrations of 50, 100 and 200 mg Cr(VI).L-1, pH = 2, for 24h. In order to evaluate the effect of temperature on the adsorption process, the isotherms were evaluated at 298.15K, 303.15K, 308.15K, 313.15K and 318.15K. The adsorption results were fitted to the Langmuir and Freundlich models. To calculate the maximum adsorbed capacity (qMAX) and the adsorption constant (KL), the Langmuir model was adopted. The experimental points were fitted to the model using the method of least squares (simple linear regression). The Cr(VI) concentration was determined by UV-Vis.
3.1 Characterization of the material
The elemental analysis (EA) results for the magnetic poly(glycidyl methacrylate-co-divinylbenzene) (P(GMAco-DVB)-M) before modification (R14) and the samples modified with ethylenediamine (R14-EDA), diethylenetriamine (R14-DETA) and triethylenetetramine (R14-TETA) are presented in Table S1, Supplementary Material. In the R14 copolymer, a substantial amount of epoxy groups was obtained, which consequently led to more amino groups attached to the surface of the copolymers, The increase in the nitrogen content in all the amino-functionalized copolymers indicated the success of the chemical modification, by demonstrating that amino groups had been introduced in the magnetic poly(GMA-co-DVB) microspheres. Furthermore, the amino resin functionalized with triethylenetetramine (R14-TETA) had the highest nitrogen content. This result was expected, since TETA has a greater number of amino groups[7].
FTIR-ATR spectra were obtained for all samples (Figure S1, Supplementary Material). Characteristic bands were observed between 1720-1729 cm-1 (υC=O), corresponding to the GMA ester carbonyl absorption band. The bands at 847 and 992 cm-1 were attributed to epoxide groups in copolymer R14. After the ring-opening reaction with the different amines, new bands appeared at 1560, 1559 and 1555 cm-1, corresponding to the δN-H vibrations in the copolymers R14-EDA, R14-DETA and R14-TETA, respectively. These results clearly indicated that the ester groups successfully reacted with the amines. A band referring to the secondary amine appeared around 3225-3295 cm-1 in all amino functionalized copolymers. Although the υNH2 vibrations appeared as a sharp band with weak intensity, the bands of υOH were broad and strong in the region between 3500-3400cm-1. Thus, the vibrations for these groups may have overlapped[7]. The absorption bands found at approximately 847 and 992 cm-1 (epoxide ring vibrations), 1255-1259 and 1455 cm-1 (δ(CH) of the epoxide group) associated with the three functionalized copolymers did not completely disappear from the spectra. They can be attributed to the epoxide groups located inside the microspheres, which were inaccessible to react with the amino groups[7]
Figure S2 (Supplementary Material) shows P(GMAco-DVB)-M scanning electron microscopy (SEM) images of all samples. There were no significant changes in the morphology. The spherical shape remained, indicating good structural resistance during chemical modification. Apparently, the magnetic particles were distributed over the microspheres’ surface grouped into small dots, instead of being randomly distributed. We found similar results in the literature[14-16].
Table S2 in the Supplementary Material presents the diameter, magnetic properties and thermal resistance of the microspheres obtained. As can be seen, there was no significant change in the microspheres’ average size (d(0.5)). This result indicates that no fragmentation or agglomeration occurred during the chemical modification reactions. With regard to magnetization, copolymer R14 had twice the saturation magnetization (MS) as the modified copolymers.
Formiga, W. J. F., Cunha, H. A., Silva, M. R., Ferreira, I. L. M., Castanharo, J. A., & Costa, M. A. S.
Since MS is directly proportional to the amount of magnetic material incorporated, it is possible that the lower values found for the chemically modified microspheres were caused by the leaching of the magnetite located on their surface during the chemical reactions[17]. Similar MS values were also found for chemically modified copolymers based on styrene and divinylbenzene by other authors[18]. The MR/MS (residual magnetization/saturation magnetization) values are reported in Table S2 of the, Supplementary Material. All values are considered low and indicate an appreciable amount of superparamagnetic particles contained in the microspheres[19]. This characteristic is very important because it guarantees that the microspheres will not remain agglomerated after the magnetic field is removed subsequent to the separation process. If they remained clustered, it would make their regeneration difficult. Table S2 in the Supplementary Material also reports the P-(GMA-coDVB)-M thermogravimetric analysis (TGA) results for all samples. Apparently, the amino groups’ incorporation did not cause any change in the initial degradation temperature (TONSET) and also the temperature of maximum degradation rate (TMAX), since the technique’s error was ±4%. The mass loss can be attributed to degradation of the organic material in the copolymer. These residues were very similar, to the point of being considered equal when taking into account the random error of the equipment. The only exception was the copolymer functionalized with triethylenetetramine, for which the difference in relation to the R14 copolymer was about 31% higher. The material obtained as waste probably was iron, which was added in the form of an oxide to give the final material the required magnetic property. The in situ copolymerization was performed with particulate magnetite and the particles’ distribution in the resin was completely random. We expected the level of incorporation of the magnetic material not to have biased behavior. Varying iron contents can even be obtained from the same series of measures.
3.2 Effect of pH on the adsorption of Cr(VI) on the amino magnetic copolymers
Figure S3 (Supplementary Material) shows the effect of pH on the Cr(VI) adsorption (% removal and q) on the results of using the amino functionalized copolymers R14-EDA, R14-DETA and R14-TETA. As can be seen, the optimum range of adsorption of Cr(VI) ions by the three different adsorbents occurred in the acidic pH range (below 6). achieving greatest adsorption at pH=2. On the other hand, the adsorption decreased at basic pH (above 6) until pH=8 and remained constant up to pH 12. The pH value is an important factor affecting the adsorption behavior of adsorbents because of its effect on the surface charge and the protonation degree of functional groups on the active sites of the adsorbent[10].
Bayramoğlu et al.[20] reported that the adsorption of Cr(VI) ions depends on the protonation or deprotonation of amino groups on the microspheres’ surface. In aqueous solutions, Cr(VI) exists in the form of chromic acid (H2CrO4) and dichromate (Cr2O72-) (Supplementary Material). In turn, Cr(VI) behaves like an oxyanion according to its aqueous chemistry, and these species’ fraction is dependent on the chromium concentration and pH of the solution[21]
Anionic forms, such as chromate (CrO42-), can be adsorbed at pH>6, while dichromate (Cr2O72-) and hydrogenchromate (HCrO4-) can be adsorbed at pH between 1-6[10]. Therefore, the distribution of the species of Cr(VI) might have been the main variable affecting the removal of Cr(VI) ions by the adsorbent. The amino groups on the magnetic microspheres’ surface can also affect the type of electrostatic interaction between the metal ions and the sorbent surface for Cr(VI) adsorption. In addition, at lower pH values, the protonated amine group of amino magnetic microspheres causes increased electrostatic attraction between NH3+ and the sorbate anions[21]. Thus, at acidic pH, the amino groups of the adsorbent microspheres R14-EDA, R14-DETA and R14-TETA can be positively charged, leading to electrostatic attraction with the negatively charged chromium (VI) species, since the main species at lower pH was HCrO4-. We can thus conclude that pH dependence of Cr(VI) involves a protic equilibrium in which the protonated HCrO4 - species of the oxyanions influence the adsorption.
According to Malović et al.[7], under the same reaction conditions, the degree of conversion of epoxide groups decreased in order from ethylenediamine to triethylenetetramine. This was expected, since the limitation of the reaction occurs due to a steric hindrance effect, which is one of the main problems in the functionalization of adsorbents with large groups. The higher the degree of conversion of epoxy groups into amine groups, the greater will be the quantity of NH2 groups to be protonated. Therefore, the expected order of the adsorption capacity (q or %removal) is R14-EDA>R14-DETA>R14-TETA. The chemical modification with EDA, DETA and TETA causes the opening of the epoxy ring, and a hydroxyl group is formed together with the amino groups. The hydroxyl comprises a chelating site. However, the number of chelating sites increases gradually according to the number of nitrogen atoms, making them nucleophilic groups, but with different molecular volumes. EDA, a secondary amine, has a nitrogen atom bonded to two alkyl groups. DETA and TETA are tertiary amines, with three and four alkyl groups bonded to the nitrogen atoms, respectively. The additional alkyl groups in DETA and TETA are responsible for increasing the electron density of the nitrogen atoms, making them more significant nucleophiles than EDA. It is known that metal ions can have difficulty diffusing into aminated microspheres due to strong steric hindrance and the cross-linking structures formed by long-chain amino groups, which in turn can result in a lower number of amino groups to be protonated. Amino groups can also easily interact with amino groups adjacent to the hydrogen bond, which leads to significant steric hindrance and an increase in the number of ineffective amino groups[22]. This may explain why R14-TETA had lower adsorption than R14-DETA, despite its higher nitrogen percentage. In metal removal, R14-DETA also had the highest efficiency, with 98.4% (pH= 2), compared to R14-EDA, with 89.6% removal at the same pH. This better result can perhaps be attributed to the presence of a substantial amount of protonated amino groups on the copolymer’s surface. This is unlike the prediction of Malovic et al. R14-TETA had a lower sorption capacity than the others. Another possible explanation involves the relatively large size of Cr(VI) anionic species,
the steric hindrances in interactions with amino group sites provoked by the rigid structure of R14-TETA, and mass transfer resistance[6]
3.3 Adsorption isotherms of the amino magnetic copolymers
The experimental adsorption isotherms for different temperatures (298.15, 303.15, 308.15, 313.15 and 318.15 K) were determined (Table S3, Supplementary Material). The experimental data fitted the Langmuir model better than the Freundlich model, because the former presented correlation coefficients closer to one. The parameters qMAX (mg.g-1) and KL (L.mg-1) are the Langmuir constants associated, respectively, with the capacity and energy. It is also known that the temperature increase is inversely proportional to the reaction medium’s viscosity. As a consequence, there are increases in the kinetic energy and diffusion of the solute molecules into the adsorbent, thus favoring the mass transfer from molecules on the external layer and inside the adsorbent particles’ internal pores[23].
We applied the Langmuir model to calculate the maximum adsorbed capacity (qMAX) and the adsorption constant (K L)[24]. Comparison of the three copolymers in the same temperature range revealed that R14-DETA showed the best results in the Cr(VI) adsorption and also the lowest values of KLr, indicating it is the copolymer that requires the least energy to achieve adsorption. The maximum adsorption value estimated was 78.21 mg.g-1, at 45 °C (318.15 K). In general, temperature increase favored the Cr(VI) adsorption in all amino functionalized copolymers, regardless of the original amino group’s size and/or the number of amino groups bonded to the copolymer (EDA – two amino groups; DETA – three amino groups; TETA – four amino groups) (Figure S4, Supplementary Material). Huang and Chen[25] reported a DETA functionalized magnetic adsorbent which was prepared by covalent bonding of polyacrylic acid (PAA) and obtained maximum Cr(VI) adsorption capacity (qMAX) of 11.24 mg.g−1 at 25 ºC. Another similar EDA functionalized adsorbent, based on magnetic glycidyl methacrylate, presented qMAX = 61.35 mg.g-1 at 35 ºC[11]. Comparison of these results with ours at the same temperatures indicates that both the EDA copolymer (R14-EDA) and DETA copolymer (R-14-DETA) had more significant adsorption values (60.35 mg.g-1 at 25 ºC and 73.20 mg.g-1 at 35 º C, respectively). The results presented in this regard are consistent with the elemental analysis results described in Table S1 of the Supplementary Material for all amino functionalized copolymers. Of particular note, when the nitrogen percentage increased in R14-EDA (N=6.50%) and R14-DETA (N=6.98%), their qMAX values also increased at all temperatures and in the same order. Although R14-TETA achieved the greatest nitrogen incorporation (N=7.71%), this result was not observed in its qMAX values. This can be explained by the steric hindrance effect caused by the presence of larger groups in this copolymer[4,6]. Probably not all amino groups present in R14-TETA were available for the Cr(VI) adsorption process due to the relatively large size of Cr(VI) anionic species[6]. The higher qMAX values can also indicate prominence of amino groups available in the copolymers synthesized in this work, which are promising particles for Cr(VI) removal from wastewater.
In order to investigate the controlling mechanism of the Cr(VI) adsorption process, we used kinetic models, validated by the correlation coefficients of their linearized equations: [log (qe - qt) vs t] for the pseudo-first order model; [t/qt vs t] for the pseudo-second order model; and [qt vs t1/2] for the intraparticle diffusion model. All the kinetic parameters were obtained for each model, where Ko1 (min-1) represents the adsorption kinetic rate constant for the pseudo-first order model, Ko2 (g mg-1. min-1) is the adsorption kinetic rate constant for the pseudo-second order model, and Kd is the rate constant in the intraparticle diffusion model. The correlation coefficients and linearized equations of these three kinetic models for the R14 copolymer functionalized by the three different amines (R14-EDA, R14-DETA and R14-TETA) are reported in Tables S4, S5 and S6 of the Supplementary Material. For all three kinetic models fitted, the reaction rates increased with rising temperature of all the functionalized copolymers studied. Furthermore, at the temperatures analyzed, the best fits of the experimental data were provided by the pseudo-second order model, with the correlation coefficients being closer to one (R2=0.99) for most of the copolymers. Thus, the adsorption of Cr(VI) on the amino magnetic copolymers was best described by the pseudo-second order kinetic model, in which the adsorption capacity of the adsorbent is determined by the chemical bonding (chemisorption) between the Cr(VI) and functional groups on the adsorbent surface (amino magnetic copolymers)[26].
Figure S5 (Supplementary Material) shows the variation of Cr(VI) concentrations in the liquid phase (C/C O) as a function of the contact time of the different amino magnetic copolymers. C and C O correspond to the concentration of the metals at time t and at the initial concentration. According to Sun and Xu[27], the first stage of adsorption can be affected by the adsorbate concentration and agitation. Therefore, increasing the concentration of the adsorbate in the initial part can accelerate its diffusion from the solution to the surface of the adsorbent. Next, adsorption becomes dependent on the nature of the adsorbate molecules. At the end of the process, the third stage is generally considered the determining stage, which depends on the nature of the adsorbent as its reactive sites become saturated. We observed that the adsorption of Cr(VI) followed this pattern as described in the literature. It was faster in the initial stage and became slower when approaching the final equilibrium. Moreover, equilibrium for Cr(VI) removal occurred in approximately 300 min for all amino-functionalized copolymers. Equilibrium occurs because over time, the number of empty sites decreases, which progressively reduces the percentage of Cr(VI) removal. Otherwise, the adsorbent sites became saturated, and from that moment on, the sorption becomes slow in longer time intervals[28]. The adsorption speed was directly proportional to the concentration gradient. As the saturation of the adsorption sites occurred, the concentration decreased[29]. The control of the adsorption mechanism of this process is chemisorption, involving valence forces through the sharing or exchange of electrons between the adsorbent and adsorbate[4]
Formiga, W. J. F., Cunha, H. A., Silva, M. R., Ferreira, I. L. M., Castanharo, J. A., &
We studied the thermodynamic parameters of adsorption in a range of 298.15 to 318.15 K (Table S7, Supplementary Material). The increase in temperature favored the removal of Cr(VI) oxyanions from the solution, considering that the free energy values increased in modulus. Among the three copolymers evaluated, the adsorbent R14-EDA was the most favored by the increase in temperature from 25 to 45 °C, with an increase in free energy of 123%. The negative ∆G° values confirmed its spontaneous nature, and the adsorption process was feasible because the increase in ∆G° modulus was directly proportional to temperature. This indicated that the affinity of Cr(VI) for amino magnetic copolymers was greater at higher temperature. The standard enthalpy values (∆H◦) for the adsorption of Cr(VI) were 41.51 kJ/mol (R14-EDA), 44.80 kJ/mol (R14-DETA) and 41.85 kJ/mol (R14-TETA), while the standard entropy (∆S◦) values were 148.32 J/mol.K, 159.42 J/mol.K and 150.55 J/mol.K, respectively. The positive value showed that Cr(VI) adsorption was an endothermic process, in agreement with the increase in adsorption capacity with rising temperature observed (Item 3.3). In addition, we also noted that the values of the Langmuir constant (KL) increased with rising temperature, confirming the endothermic nature of the adsorption (Table S3, Supplementary Material). Furthermore, the positive results indicated that randomness increased at the solid/solution interface during the Cr(VI) adsorption on the magnetic amino copolymers. The R14-DETA adsorbent presented the highest ΔH° value, indicating its greater binding energy with the Cr(VI). The positive values of ΔH° and ΔS° suggest that entropy contributed more than enthalpy to obtain negative values of ΔG°. The magnitudes of ΔH° of R14-EDA, R14-DETA and R14-TETA were above 20.9 kJ.mol-1 This confirmed that the nature of the adsorption was by chemisorption, in agreement with the results obtained in the study of kinetic models[30]. These results show that all amino magnetic copolymers synthesized in this work can be used as adsorbents in conventional processes for decontamination of water or effluents containing hexavalent chromium (Cr(VI)).
The results presented here improve the understanding of Cr(VI) adsorptive processes as well as the different magnetic adsorbent synthesis routes with a weak base (amino functionalized). During the copolymers’ amino functionalization, their magnetic properties were maintained as well as their superparamagnetism and thermal resistance. The results demonstrated that the Cr(VI) adsorption process depends on the pH of amino magnetic copolymers. All amino magnetic copolymers studied have strong potential use as Cr(VI) adsorbents in aqueous media. However, R14-DETA had the highest maximum removal capacity values (qMAX), of 63.95 mg.g-1 at 298.15 K and 77.35 mg. g-1 at 318.15 K. The kinetic modeling showed that the effectiveness of Cr(VI) adsorption from aqueous solutions strongly depends on the adsorption dynamics. Thermodynamic studies showed that the Cr(VI) adsorption on the functionalized copolymers presented 41.5 kJ/mol <ΔH< 44.8 kJ/mol and
148 J/mol.K <ΔS< 159 J/mol.K. The results indicated an endothermic process having a chemical nature, with energetically favorable sorption and negative ΔG values as well as growth in modulus with increasing temperature. The adsorptive process became more favorable with increasing temperature, and despite being endothermic, adsorption was spontaneous and entropically directed.
5. Authors’ Contributions
• Conceptualization – Washington José Fernandes Formiga; Marcos Antonio da Silva Costa.
• Data curation – Washington José Fernandes Formiga; Marcos Antonio da Silva Costa.
• Formal analysis – Washington José Fernandes Formiga; Manoel Ribeiro da Silva.
• Funding acquisition - Marcos Antonio da Silva Costa.
• Investigation –Washington José Fernandes Formiga; Ivana Lourenço de Mello Ferreira; Marcos Antonio da Silva Costa.
• Methodology – Washington José Fernandes Formiga; Marcos Antonio da Silva Costa.
• Project administration – Marcos Antonio da Silva Costa.
• Resources – Marcos Antonio da Silva Costa; Ivana Lourenço de Mello Ferreira; Manoel Ribeiro da Silva.
• Software – NA.
• Supervision – Marcos Antonio da Silva Costa.
• Validation – Marcos Antonio da Silva Costa.
• Visualization – Washington José Fernandes Formiga; Henrique Almeida Cunha; Jacira Aparecida Castanharo.
• Writing – original draft – Washington José Fernandes Formiga.
• Writing – review & editing – Marcos Antonio da Silva Costa; Jacira Aparecida Castanharo; Manoel Ribeiro da Silva; Ivana Lourenço de Mello Ferreira.
The authors thank Fundação de Amparo à Pesquisa do Estado do Rio de Janeiro (FAPERJ) Process E-26010.000982/2019: “Cooperative Research Network on Nanostructured Materials and Device Engineering”, and Conselho Nacional de Desenvolvimento Científico e Tecnológico (CNPq) for further financial support.
1. Suter, E., Rutto, H., Makomere, R., Banza, M., Seodigeng, T., Kiambi, S., & Omwoyo, W. (2024). Preparation, characterization and application of polymeric ultra-permeable biodegradable ferromagnetic nanocomposite adsorbent for removal of Cr(VI) from synthetic wastewater: kinetics, isotherms and thermodynamics. Frontiers in Environmental Chemistry, 5, 1451262 http://doi.org/10.3389/fenvc.2024.1451262
2 Katiyar, S., & Katiyar, R. (2024). A comprehensive review on synthesis and applications of nanocomposites for adsorption of chromium: status and future prospective. Applied Water Science, 14(1), 11 http://doi.org/10.1007/s13201-023-02062-6
Magnetic poly(glycidyl methacrylate-co-divinylbenzene) with amino groups for chromium VI removal
3 Wise, J. P., Jr., Young, J. L., Cai, J., & Cai, L. (2022). Current understanding of hexavalent chromium [Cr(VI)] neurotoxicity and new perspectives. Environment International, 158, 106877. http://doi.org/10.1016/j.envint.2021.106877 PMid:34547640.
4 Pakade, V. E., Tavengwa, N. T., & Madikizelac, L. M. (2019). Recent advances in hexavalent chromium removal from aqueous solutions by adsorptive methods. RSC Advances, 9(45), 26142-26164. http://doi.org/10.1039/C9RA05188K. PMid:35531021.
5 Liu, B., Xin, Y.-N., Zou, J., Khoso, F. M., Liu, Y.-P., Jiang, X.-Y., Peng, S., & Yu, J.-G. (2023). Removal of chromium species by adsorption: fundamental principles, newly developed adsorbents and future perspectives. Molecules (Basel, Switzerland) , 28 (2), 639 http://doi.org/10.3390/ molecules28020639 PMid:36677697.
6 Maksin, D. D., Nastasović, A. B., Milutinović-Nikolić, A. D., Suručić, L. T., Sandić, Z. P., Hercigonja, R. V., & Onjia, A. E. (2012). Equilibrium and kinetics study on hexavalent chromium adsorption onto diethylene triamine grafted glycidyl methacrylate based copolymers. Journal of Hazardous Materials, 209-210, 99-110 http://doi.org/10.1016/j.jhazmat.2011.12.079
PMid:22284173.
7 Malović, L., Nastasović, A., Sandić, Z., Marković, J., Đorđević, D., & Vuković, Z. (2007). Surface modification of macroporous glycidyl methacrylate based copolymers for selective sorption of heavy metals. Journal of Materials Science, 42(10), 3326-3337 http://doi.org/10.1007/s10853-006-0958-y
8 Nastasović, A., Sandić, Z., Suručić, Lj., Maksin, D., Jakovljević, D., & Onjia, A. (2009). Kinetics of hexavalent chromium sorption on amino-functionalized macroporous glycidyl methacrylate copolymer. Journal of Hazardous Materials, 171(1-3), 153-159 http://doi.org/10.1016/j.jhazmat.2009.05.116
PMid:19573985.
9 Ixom Water Care. (2024). Retrieved in 2024, September 6, from https://www.ixomwatercare.com/equipment/miex-magneticion-exchange-systems
10 Wang, K., Qiu, G., Cao, H., & Jin, R. (2015). Removal of chromium(VI) from aqueous solutions using Fe3O4 magnetic polymer microspheres functionalized with amino groups. Materials (Basel), 8(12), 8378-8391. http://doi.org/10.3390/ ma8125461 PMid:28793717.
11 Zhao, Y.-G., Shen, H.-Y., Pan, S.-D., & Hu, M.-Q. (2010). Synthesis, characterization and properties of ethylenediaminefunctionalized Fe3O4 magnetic polymers for removal of Cr(VI) in wastewater. Journal of Hazardous Materials, 182(1-3), 295-302 http://doi.org/10.1016/j.jhazmat.2010.06.029 PMid:20621418.
12 Formiga, W. J. F., Costa, M. A. S., Ferreira, I. L. M., Souza, J. V. S., & Silva, M. R. (2016). Preparation of magnetic poly (glycidyl methacrylate-co-divinylbenzene) microspheres with amino or quaternary groups for Cr(VI) removal from aqueous solutions. International Journal of Scientific Research in Science and Technology, 2(6), 126-133
13 Paredes, B., González, S., Rendueles, M., Villa-Garcia, M. A., & Díaz, J. M. (2005). Egg-white protein fractionation using new weak anion-exchange resins based on poly(glycidyl methacrylate-co-ethylendimethacrylate). Preparation and characterization. Journal of Chromatographic Science , 43(5), 241-248. http://doi.org/10.1093/chromsci/43.5.241. PMid:15975242.
14 Castanharo, J. A., Ferreira, I. L. M., Costa, M. A. S., Silva, M. R., Costa, G. M., & Oliveira, M. G. (2015). Magnetic microspheres based on poly (divinylbenzene-co-methyl methacrylate) obtained by suspension polymerization. Polímeros: Ciência e Tecnolofia, 25(2), 192-199 https://www. doi.org/10.1590/0104-1428.1666
15 Formiga, W. J. F., Silva, M. R., Cunha, H. A., Castanharo, J. A., Ferreira, I. L. M., & Costa, M. A. da S. (2023). Influence of benzoyl peroxide and divinylbenzene concentrations on the properties of poly (glycidyl methacrylate-co-divinylbenzene) magnetic microspheres. Macromolecular Reaction Engineering, 17(4), 2200070 http://doi.org/10.1002/mren.202200070
16 Santa Maria, L. C., Leite, M. C. A. M., Costa, M. A. S., Ribeiro, J. M. S., Senna, L. F., & Silva, M. R. (2004). Characterization of magnetic microspheres based on network styrene and divinylbenzene copolymers. Materials Letters , 58 (24), 3001-3006 http://doi.org/10.1016/j.matlet.2004.05.028
17 Chung, T.-H., Pan, H.-C., & Lee, W.-C. (2007). Preparation and application of magnetic poly (styrene-glycidyl methacrylate) microspheres. Journal of Magnetism and Magnetic Materials, 311(1), 36-40 http://doi.org/10.1016/j.jmmm.2006.11.165
18 Lee, Y., Rho, J., & Jung, B. (2003). Preparation of magnetic ion-exchange resins by the suspension polymerization of styrene with magnetite. Journal of Applied Polymer Science, 89(8), 2058-2067 http://doi.org/10.1002/app.12365
19 Santa Maria, L. C., Costa, M. A. S., Soares, J. G. M., Wang, S. H., & Silva, M. R. (2005). Preparation and characterization of manganese, nickel and cobalt ferrites submicron particles in sulfonated crosslinked networks. Polymer, 46(25), 11288-11293 http://doi.org/10.1016/j.polymer.2005.09.055
20 Bayramoğlu , G. , Çelik , G. , Yalçın , E. , Yılmaz , M. , & Arica, M. Y. (2005). Modification of surface properties of Lentinus sajor-caju mycelia by physical and chemical methods: evaluation of their Cr6+ removal efficiencies from aqueous medium. Journal of Hazardous Materials, 119(1-3), 219 - 229 h ttp://doi.org/10.1016/j.jhazmat.2004.12.022 PMid:15752869.
21 Bayramoğlu, G. , & Arica , M. Y. ( 2008 ). Adsorption of Cr(VI) onto PEI immobilized acrylate-based magnetic beads: Isotherms, kinetics and thermodynamics study. Chemical Engineering Journal, 139(1), 20-28 http://doi.org/10.1016/j. cej.2007.07.068
22 Wang, M., Qu, R., Sun, C., Yin, P., & Chen, H. (2013). Dynamic adsorption behavior and mechanism of transition metal ions on silica gels functionalized with hydroxyl- or amino-terminated polyamines. Chemical Engineering Journal, 221, 264-274 http://doi.org/10.1016/j.cej.2013.02.036
23 Hunter, R. J. (1993). Introduction to modern colloid science Oxford: Oxford University Press
24 Atia, A. A., Donia, A. M., & Yousif, A. M. (2008). Removal of some hazardous heavy metals from aqueous solution using magnetic chelating resin with iminodiacetate functionality. Separation and Purification Tecnology , 61(3), 348-357 https://www.doi.org/10.1016/j.seppur.2007.11.008
25 Huang, S.-H., & Chen, D.-H. (2009). Rapid removal of heavy metal cations and anions from aqueous solutions by an amino-functionalized magnetic nano-adsorbent. Journal of Hazardous Materials, 163(1), 174-179 http://doi.org/10.1016/j. jhazmat.2008.06.075 PMid:18657903.
26 Ebelegi, A. N., Ayawei, N., & Wankasi, D. (2020). Interpretation of adsorption thermodynamics and kinetics. Open Journal of Physical Chemistry, 10(3), 166-182 http://doi.org/10.4236/ ojpc.2020.103010.
27 Xu, X., & Sun, G. (1997). Sunflower stalks as adsorbents for color removal from textile wastewater. Industrial & Engineering Chemistry Research, 36(3), 808-812 http://doi.org/10.1021/ ie9603833
28 Aravind, J., Sudha, G., Kanmani, P., Devisri, A. J., Dhivyalakshmi, S., & Raghavprasad, M. (2015). Equilibrium and kinetic study on chromium (VI) removal from simulated waste water using gooseberry seeds as a novel biosorbent. Global Journal of Environmental Science and Management, 1(3), 233-244
29 Marjanović, V., Lazarević, S., Janković-Častvan, I., Potkonjak, B., & Janaćković, D. (2013). Adsorption of chromium(VI) from aqueous solutions onto amine-functionalized natural and acid-activated sepiolites. Applied Clay Science, 80-81, 202-210 http://doi.org/10.1016/j.clay.2013.04.008
30 Venugopal, V., & Mohanty, K. (2011). Biosorptive uptake of Cr(VI) from aqueous solutions by Parthenium hysterophorus weed: equilibrium, kinetics and thermodynamic studies. Chemical
Engineering Journal, 174(1), 151-158 http://doi.org/10.1016/j. cej.2011.08.068
Received: Sep. 06, 2024
Revised: May 19, 2025
Accepted: May 25, 2025
Associate Editor: Artur J. M. Valente
Formiga, W. J. F., Cunha, H. A., Silva, M. R., Ferreira, I. L. M., Castanharo, J. A., & Costa, M. A. S. Polímeros, 35(3), e20250033, 2025
Magnetic poly(glycidyl methacrylate-co-divinylbenzene) with amino groups for chromium VI removal
Supplementary material accompanies this paper.
Table S1. Elemental analysis of the P(GMA-co-DVB)-M before (R14) and after functionalization with ethylenediamine (R14-EDA), diethylenetriamine (R14-DETA) and triethylenetetramine (R14-TETA).
Figure S1. P(GMA-co-DVB)-M FTIR-ATR spetra before (R14) and after functionalization with ethylenediamine (R14-EDA), diethylenetriamine (R14-DETA) and triethylenetetramine (R14-TETA). R14: GMA/DVB = 98/2; BPO = 1% (mol BPO/mol monomers); magnetite = 10% w/v; T = 80 °C).
Figure S2. P(GMA-co-DVB)-M SEM images: a) before (R14) and after functionalization with b) ethylenediamine (R14-EDA), c) diethylenetriamine (R14-DETA), and d) triethylenetetramine (R14-TETA) (2500x magnification, R14: GMA/DVB = 98/2; BPO = 1% (mol BPO/mol of monomers); magnetite = 10%w/v; T = 80 °C).
Table S2. P(GMA-co-DVB)-M average size, magnetic properties, and thermal degradation results before (R14) and after functionalization with ethylenediamine (R14-EDA), diethylenetriamine (R14-DETA) and triethylenetetramine (R14-TETA).
Figure S3. Effect of pH on the Cr(VI) adsorption by P(GMA-co-DVB)-M: functionalization with ethylenediamine ( R14-EDA ), diethylenetriamine (R14-DETA) and triethylenetetramine (R14-TETA) (C0 = 100 mg Cr(VI).L-1; Volume = 50 mL; stirring speed = 200 rpm; temperature = 25 °C; 24h).
Table S3. Parameters of adjustments to the Langmuir and Freundlich models for different temperatures used in the Cr(VI) adsorption by P(GMA-co-DVB)-M: functionalization with ethylenediamine (R14-EDA), diethylenetriamine (R14-DETA) and triethylenetetramine (R14-TETA).
Figure S4. Adsorption isotherms of Cr(VI) adsorption by P(GMA-co-DVB)-M: functionalization with ethylenediamine (R14-EDA), diethylenetriamine (R14-DETA) and triethylenetetramine (R14-TETA) at different temperatures, 24h, pH=2.
Table S4. R14-EDA copolymer velocity constants obtained in the kinetic fits for temperatures of 298, 303, 308, 313 and 318K.
Table S5. R14-DETA copolymer velocity constants obtained in the kinetic fits for temperatures of 298, 303, 308, 313 and 318K.
Table S6. R14-TETA copolymer velocity constants obtained in the kinetic fits for temperatures of 298, 303, 308, 313 and 318 K.
Figure S5. Effect of contact time on Cr(VI) adsorption by P(GMA-co-DVB)-M (5,0g.L-1) functionalization with ethylenediamine (R14-EDA), diethylenetriamine (R14-DETA) and triethylenetetramine (R14-TETA). (Co – initial concentration of Cr(VI); C - concentration at any given time; at 25°C; pH=2; 200rpm; C0=100mg/L).
Table S7. Equilibrium parameters for calculating the Gibbs free energy of the assortative process and analysis of the thermodynamic parameters of the Gibbs equation in the Cr(VI) adsorption by P(GMA-co-DVB)-M: functionalization with ethylenediamine (R14-EDA), diethylenetriamine (R14-DETA) and triethylenetetramine (R14-TETA).
This material is available as part of the online article from https://doi.org/10.1590/0104-1428.20240083
Carolina
Antoniazzi1 , Jocelei Duarte1,2 , Wendel Paulo Silvestre2* and Camila Baldasso1,2
1Curso de Engenharia Química, Universidade de Caxias do Sul – UCS, Caxias do Sul, RS, Brasil
2Programa de Pós-graduação em Engenharia de Processos e Tecnologias – PGEPROTEC, Universidade de Caxias do Sul – UCS, Caxias do Sul, RS, Brasil
*wpsilvestre@ucs.br
Obstract
This study assessed films of different formulations produced from whey protein and gelatin by casting. The results were compared with synthetic polycrystalline wool (PCW) polymer. Citric acid was used as a crosslinker at 10 wt.% - 40 wt.% relative to whey mass. Adding citric acid increased the films’ thickness and solubility. Only the formulations with the highest concentration of citric acid were hydrophilic. The morphological analysis showed that all films have uniform and dense structures. The films had lower thermal stability concerning the standard, and the increase in the citric acid concentration decreased the mass loss in the films. The characterization revealed that the films produced with 10 wt.% and 20 wt.% citric acid have the potential to be used as packaging for feminine pads. The study of the proposed application for films produced based on whey and gelatin is promising since there is little literature regarding the suggested application.
Keywords: biodegradable polymer, biopolymer, blend, cross-linking.
Data Ovailability: Research data is available upon request from the corresponding author
How to cite: Antoniazzi, C., Duarte, J., Silvestre, W. P., & Baldasso, C. (2025). Crosslinking agent in the production of biodegradable whey-gelatin films. Polímeros: Ciência e Tecnologia, 35(3), e20250034. https://doi.org/10.1590/0104-1428.20250008
An alternative to classic polymers is the production of biodegradable polymers, which decompose more quickly in the environment and are obtained from biomass. The degradation of biodegradable materials occurs through the action of microorganisms, such as fungi, bacteria, and algae, which generate carbon dioxide, water, and residual biomass. The main application of biodegradable materials is in disposable packaging[1]. Paoli also mentions other uses in the agribusiness sector, such as seed encapsulation, controlled release of pesticides, covering crops, and containing slopes to prevent erosion[2]
Whey is an industrial effluent generated on a large scale from manufacturing dairy products. Because it has a high organic load, whey is a pollutant with a high potential for contamination. Depending on the type of cheese and the process used for its production, whey has a chemical oxygen demand (COD) between 50-80 g∙L-1, a value 100 times higher than domestic sewage, making its inadequate disposal in water problematic[3]. In contrast, whey has desirable characteristics and high nutritional quality, being an important source of proteins, lactose, minerals, and vitamins, which can make it a raw material for the development of new products[4] Due to the relatively low cost of this effluent, whey can be reinserted into the economic chain in several fields[5]
Gelatins are combinations of high molar mass proteins produced from collagen denaturation. It is used to stabilize
dairy products, clarify beverages, as a thickening agent in yogurts, vitamin supplements, and medicine capsules, edible films for confectionery, and food stabilizers, among other uses[6]
Crosslinking occurs through chemical, physical, or enzymatic processes. In addition, the process can occur with combinations of processes when, for example, proteins are exposed to heat, which is a physical process, causing the breaking of bonds and the denaturation of the protein itself[7]
As examples of cross-linking agents, Shi et al.[8] mention glutaraldehyde, boric acid, and epichlorohydrin, which have limited applications because they generate a crosslinked matrix that presents toxicity. Within this context, research cites citric acid as an object of study to improve the mechanical properties of biopolymers enhanced with this crosslinker, in addition to being renewable, biodegradable, and non-toxic[8,9]
Due to its structure, citric acid is an intermediary in crosslinking by inserting covalent bonds that strengthen intermolecular bonds and improve properties[10]. Shi et al.[8] also comment on this characteristic, citing the insertion of covalent bonds to complete the already existing intermolecular hydrogen bonds. This crosslinking agent has a chemical chain suitable for forming esters[10] .
Kumar et al.[11] mention using biodegradable polymers in the agroindustry through a thin film of this material to protect
Antoniazzi, C., Duarte, J., Silvestre, W. P., & Baldasso, C.
crops during frost. Deng et al.[12] mention the functionality of biodegradable polymers in biomedicine and tissue engineering because they present biocompatibility, hydrophilicity, and bioactivity, which help support the encapsulation of bioactive compounds. Despite this, the largest portion of biodegradable polymer production is aimed at packaging production, especially in the food sector. Jesus reports that several studies related to this area point to improving the quality and preservation of food by becoming an obstacle to adversities such as humidity and gases[4]. In this sense, whey and gelatin become an antimicrobial agent to slow the development of microorganisms in the packaging content.
In this context, the objective of this work was the production of biodegradable films produced from whey and gelatin, adding different concentrations of the crosslinker citric acid, aiming to compare the properties of the films produced with synthetic feminine pad packaging.
For the production of the films, demineralized whey powder (Sooro, Brazil), PA gelatin (Dinâmica, Brazil), sodium hydroxide (99 %, Dinâmica, Brazil), glycerol (99 %, Vetec, Brazil), chitosan (85 %, Sigma-Aldrich, USA), glacial acetic acid (99 %, Sigma-Aldrich, USA) and citric acid (99 %, Dinâmica, Brazil) and distilled water were used. The whey powder was mainly composed of 80.0 wt.% de protein, 4.5 wt.% lactose, 2.0 wt.% fat, and 5.0 wt.% ash, among other components.
Chitosan was used in film preparation as an additive because it favors the formation of films and has an antimicrobial effect, helping to increase the shelf life of the biopolymer. The incorporation of this additive must be done in its liquid form, since the dissolution of solid chitosan in an acidic medium interferes with the formation and properties of the films[6]
The 1.0 % w/v chitosan suspension was previously prepared by mixing 1.0 g of chitosan, 50 mL of distilled water, and 50 mL of 2.0 % w/v citric acid under continuous stirring on a magnetic stirrer for 3 h[4]. An aqueous solution of 200 mL of distilled water, 6 g of demineralized whey powder, and 6 g of gelatin powder was prepared under constant stirring at 23±2 °C. If the pH was not neutral (7.0), it was corrected with NaOH solution.
Subsequently, protein denaturation was performed on a magnetic stirrer at 90 °C for 30 min. At the end of the process, with the temperature reduced to room temperature (23±2 °C), 0.6 mL of glycerol and 1.0 mL of the previously prepared chitosan solution were added under magnetic stirring for 30 min. Finally, the solution was subjected to an ultrasound bath for 15 min[4]
The biopolymers have a production process similar to that of the control sample. The preparation differs in adding chitosan and glycerol, where citric acid is added in the desired percentage, as explained in Figure 1, remaining under magnetic stirring for 30 min. The proportions of citric acid used for the work were 10 wt.%, 20 wt.%, 30 wt.%, and 40 wt.% relative to the whey mass.
The solution formed is liquid; for this reason, it is commonly cooled and spread with or without the aid of equipment that influences the thickness. During drying, the solvent evaporates, leading to the film’s formation[4] . The experiment used the Petri dish spreading technique, where samples of each formulation were produced in 10 cm and 12 cm diameter Petri dishes coated with Teflon, in the amount of 10 mL, which were placed on a level surface for 48 h at room temperature (23 °C) to obtain a homogeneous film. Afterward, the films were put on Teflon-coated glass plates and subjected to heat treatment. Before testing, the biopolymeric films were stored in a desiccator at room temperature (23±2 °C) for 48 h[4]
The films were characterized through physical, mechanical, and morphological properties, chemical composition, and thermal stability to analyze the influence of the cross-linking agent content added to the films produced and compare the efficiency of the polymer produced with the standard. Two samples of each formulation were measured at five different points to measure the average thickness of the films with the aid of a 150 mm digital caliper from Digimess.
For the solubility test in distilled water, the methodology adapted from Jesus was used. Triplicate samples measuring 2.0 cm × 2.0 cm were dried in a Tecnolab electric oven at

Crosslinking agent in the production of biodegradable whey-gelatin films
60 °C. After 24 h of drying, the initial mass of the samples was determined, and they were submerged in distilled water in a container composed of polystyrene (PS) for 24 h[4]
Subsequently, the samples that remained intact were removed with the aid of a spatula, and the samples that did not remain intact were filtered. The retained materials were dried again, at the same temperature and time as the first drying, to determine the final mass and calculate the percentage of dry matter solubilized in water using Equation 1, presented below.
( ) % *100 initialmassfinalmass Solubility initialmass = (1)
At this stage, the pH and electrical conductivity of the filtered water were also analyzed to verify acidification and the transfer of ions from the crosslinker to the water. For this purpose, a digital pH meter from MS Tecnopon Instrumentação and a conductivity meter model DM-3P from Digimed were used.
In order to estimate the affinity of the films with water, a microdrop of deionized water was superimposed on three different points of each film sample to evaluate the contact angle between water and film. The analysis was performed in an environment with a controlled temperature of 23 °C and relative humidity of 60 %. Images of each drop were captured immediately after being deposited with a highfocus digital camera, and the contact angle was obtained using the Surftens software.
The ASTM D882-2018 standard was used to determine tensile strength and elongation at break[13]. For this purpose, a 2 cm × 10 cm sample of the standard polymer, the reference sample, and the polymeric films produced were stored for 48 h in an environment with a temperature of 23±2 °C and relative humidity controlled with a saturated Mg(NO3)2 solution. The tests were performed on an Emic universal machine, model DL2000, submitted to a speed of 25 mm∙min-1, and a 20 kN capacity cell.
A sample of the standard, control, and produced films was attached to metal stubs with carbon adhesive tape for field emission scanning electron microscopy. For cross-section microscopy, liquid nitrogen was used to fracture the samples. After the samples were coupled, the metallization technique was applied using the Desk V equipment from Denton Vacuum. The SEM analysis was performed using the MIRA 3 equipment from Tescan to reveal the analyzed material’s three-dimensional topographic and microstructural information, with magnifications of 250x, 1000x, 2000x, and 5000x.
Fourier transform infrared spectroscopy (FTIR) was performed using a Nicolet IS10 equipment, Thermo Scientific
model, in the wavenumber range of 550-4500 cm-1 and a resolution of 4.0 cm-1
Thermogravimetric analysis (TG) was performed using a Shimadzu TGA-50 equipment in an atmosphere with a nitrogen flow rate of 50 mL∙min-1. The initial mass of the samples was approximately 10 mg, which were heated from room temperature (25 °C) to 800 °C at a heating rate of 10 °C∙min-1. The equipment software generated the differential thermogravimetry (DTG) curve using the TG data.
All films were produced and analyzed in triplicate, in a completely randomized design, with the amount of crosslinker added to the formulation as the factor. The results were analyzed for homoscedasticity (Levene’s test) and normality of residues (Shapiro-Wilk test) and were subjected to Analysis of Variance (ANOVA), and the means were compared by Tukey’s test at a significance level of 5 %, using the Statistica 13 software (Tibco, USA).
Adding citric acid was expected to reduce degradation time and make the final product intact throughout its useful life. Furthermore, the biodegradable polymer film is also likely to be effective in replacing the packaging of traditional external absorbents produced from non-renewable sources. Finally, the best formulation was selected based on the properties required for the desired application.
The formulations produced without citric acid and with 10 wt.%, 20 wt.%, and 30 wt.% of the crosslinker formed films that were apparently stable and easy to handle, enabling all characterization tests to be carried out.
In turn, the films produced with 40 wt.% citric acid formed sticky films that were difficult to handle, making it impossible to perform tensile strength and elongation at break tests. During the production of these films, it was noted that when the samples were removed from the heat treatment, the films were stable, given their low moisture content. However, during the exposure of the films to the environment, they absorbed moisture, resulting in the binding of the hydroxyls of the citric acid with the water in the ambient atmosphere, giving the samples a sticky feel.
The thickness results for the different formulations of the polymeric films obtained are presented in Table 1.
Means in column followed by the same lowercase letter do not differ statistically from Tukey’s test at a 5% significance level.
Antoniazzi, C., Duarte, J., Silvestre, W. P., & Baldasso, C.
Comparing the thickness of the blank samples with that of the films with citric acid, adding the crosslinker reduced the amount of evaporated solvent without causing significant changes in most thicknesses.
Relating the films produced to the standard synthetic polymer, the films made with 10 mL of solution and different percentages of citric acid on a mass basis presented thicknesses greater than that of the standard, which is 36 mm thick. To obtain smaller thickness, it would be necessary to reduce the volumes of film-forming solution applied to the plate to obtain thickness closer to that presented by the standard sample.
The standard, blank samples and formulations with 10 wt.% citric acid maintained their integrity after 24 h of immersion, while the other films disintegrated. Despite the low water solubility of whey proteins caused by strong intermolecular bonds during the denaturation process, gelatin has a high absorption capacity and solubility in water, which may have caused disintegration[14]
Table 1 shows the average mass of the triplicates after the first and second drying of the standard, control, and films produced based on whey and gelatin for different formulations, as well as the percentage of solubility in water of all samples.
In general, the solubility values obtained for the films made from whey and gelatin are higher than the standard, and the films produced without the addition of citric acid presented the lowest solubility content. The increased solubility of the films made with citric acid is due to the interactions of the hydroxyl functional groups present in citric acid and water.
The films produced with 10 wt.% citric acid showed a gradual increase in water solubility as the film thickness increased, which occurred inversely for the films made with 20 wt.% citric acid, which had their solubility percentage reduced with increasing thickness. The AC30 formulation showed high solubility, and the other films produced with 30 wt.% and 40 wt.% citric acid showed complete solubility in water. The increase in the degree of solubility of the films produced suggests that citric acid acted as a plasticizer.
Concerning the standard, the films produced with the addition of citric acid showed an increase in the solubilization capacity in water. It is possible to establish a direct proportional relationship between the concentration of citric acid and the degree of solubility since when there is an increase in the additive in the formulations, there is an increase in the percentage of solubility of the films due to the hydrogen bonds between citric acid and water.
Table
Jesus reported that films produced with whey, gelatin, glycerol, and chitosan remained intact after 24 h of immersion in water, resulting in a solubility of 58.4 %, confirming the values obtained for the tests on the blank samples[4] Kaewprachu et al.[15] reported water solubility of 71.8 % for films based on bovine gelatin and glycerol.
By analyzing Table 2, it is possible to see the increase in the migration of film components into the water, together with the decrease in pH and the increase in electrical conductivity of the filtrate, as there is a higher citric acid content in the formulations.
From the readings, acidification of the distilled water used to immerse the samples can be seen, suggesting an increase in the migration of citric acid into the water with the increase in the cross-linking agent content in the formulations. The increased electrical conductivity of the filtered water occurs due to the transfer of ions from the citric acid to the water.
Since the function of citric acid is to cross-link the films, it should form covalent bonds with the polymer chain and, consequently, become insoluble. Still, it was observed that citric acid acts as a plasticizing agent and, therefore, its solubilization may indicate excess acid in the formulation.
For each sample, a static measurement of the contact angle was performed since the films with the addition of citric acid swelled at the site of microdrop deposition and solubilized, making it impossible to evaluate the contact angle over time. Kurek et al.[16] reported that this fact may have occurred due to the presence of glycerol in the formulation since this is a hygroscopic additive. In addition, because proteins and carbohydrates predispose to hydrophilicity, the water/film interaction can cause changes in the film surface[4]
Taking into account hydrophilicity at θ < 90° and hydrophobicity at θ > 90°, Table 1 presents the average contact angle for each film formulation, estimating the affinity of each film with water. The films of the standard, the BR (control) sample, and the formulations with 10 wt.%, 20 wt.%, and 30 wt.% citric acid resulted in a contact angle greater than 90º and, although some films presented points of hydrophilicity, there was a predominance of hydrophobicity. The samples of the AC40 formulation had a hydrophilic character on the film’s surface, which confirms the high degree of solubility of these samples.
This behavior may be associated with the effect of surface energy and surface tension since, according to Lima, the interactions at the liquid-solid interface are decisive in various phenomena, such as adhesion[17]. A drop of
pH and electrical conductivity of the filtered liquid referring to the solubility tests of the films produced.
Means in column followed by the same lowercase letter do not differ from Tukey’s test at a 5% significance level.
Crosslinking agent in the production of biodegradable whey-gelatin films
water tends to be spherical, as this is the geometric shape that uses the lowest energy state of the molecule, using a volume with contact in a smaller area. The term wettability of solid surfaces by liquids also helps in understanding the physical attraction between neutral surfaces, where effective wettability occurs when the elevations and depressions of the solid surface are covered by the liquid, displacing the air present in the contact area[17]
Jesus reported a contact angle of 91.5º for films produced from whey, gelatin, glycerol, and chitosan, confirming the values obtained for the BR samples[4]. The values obtained are also similar to the values cited for gelatin-based films, around 85-105º[18 19]
3.2
Table 3 presents the values of the modulus of elasticity (E), elongation at break (εB), and stress at break (σB) of the standard, control, and films produced from whey and gelatin with the addition of citric acid. Data for the films made with 40 wt.% citric acid were not obtained due to the impossibility of handling the sample during coupling to the equipment since the formulation presented a sticky consistency.
The discrepancies between the values obtained are the result of the formulations of each film, that is, the synergy between the reagents used and the characteristics of each component. Through the characterizations seen in Table 3, it is possible to see the action of citric acid as a plasticizer due to the agent’s interactions with water (ambient humidity). Thus, the increase in the concentration of citric acid in the samples presented a relationship directly proportional to the elongation at break and inversely proportional to Young’s modulus and the stress at break. Results with low stress values at break and Young’s modulus indicate flexible characteristics of the films, consequently increasing the film’s stretching.
Relating the blank to the literature, Jesus found close values for Young’s modulus and stress at break and higher values for elongation at break for films produced with the same reagents[4]. Kaewprachu et al.[15] made a film based on whey protein concentrate (WPC) and glycerin, finding a very similar value for elongation at break (0.84 %) and a lower value for stress at break (6.14 MPa). Films produced based on WPC, potassium sorbate, and beeswax also showed similar values for elongation at break and lower values for stress at break[20]
The elongation at break characteristic was the principal value listed in the comparison between the films produced and the standard since, in the suggested application, the film will become an “envelope” with the edges joined by
heating the films. This envelope will be opened completely to remove the feminine pad, and for this, the film does not need to stretch too much. The AC20 film presented the closest result concerning the standard, followed by the AC30, AC10, and BR (control) films.
Figure 2 shows the micrographs of the surfaces at 10 kV with 250x magnification of the sample BR (control) and samples of formulations AC10, AC20, AC30, AC40, and standard. The analysis made it possible to verify that all the films produced have dense structures, regardless of the composition. The samples produced with citric acid in the formulation show a volume growth.
The addition of crosslinker to the formulations showed that the empty spaces were filled, suggesting possible crystallization. The crystallization mechanism is influenced by the concentration and/or excess of solute in the solution, and crystal growth occurs by transporting solute ions to the surface[21] . Grains in some films suggest incomplete solubility of the reagents. Minor discrepancies in the films may be attributed to glycerol and impurities in the solids that make up the formulations[4]. The standard sample presents a dense, uniform, homogeneous surface with few pores, as shown in Figure 2F
Figure 3 shows the micrographs of the cross sections at 10 kV and with 1000 times magnification of the samples BR (control), AC10, AC20, AC30, AC40, and standard.
In general, micrographs have characteristics like those of rough films due to the volume growth observed in surface microscopy and the presence of some bubbles. The micrographs also reveal an increase in film thickness as the citric acid concentration in the samples increases. The apparent cracks in samples AC10 and AC40 may occur for two reasons: they may have been generated during the fracturing of the sample with liquid nitrogen, or the excess citric acid may have caused the crystallization of the film, making it brittle. Figure 3F shows the micrograph of the cross-section at 10 kV and with a magnification of 1000 X of the standard, and it also reveals a very uniform film.
Figure 4A shows the FTIR spectrum for the films produced from whey and gelatin with the addition of glycerol and chitosan in the same proportions and the addition of citric acid in different proportions on a mass basis. The spectra of the five samples show bands positioned in the same
Table 3. Results of tensile strength, elongation at break, and stress at break for whey and gelatin films produced with increasing concentrations of citric acid as a cross-linking agent.
Means in column followed by the same lowercase letter do not differ from Tukey’s test at a 5% probability level.
Antoniazzi, C., Duarte, J., Silvestre, W. P., & Baldasso, C.
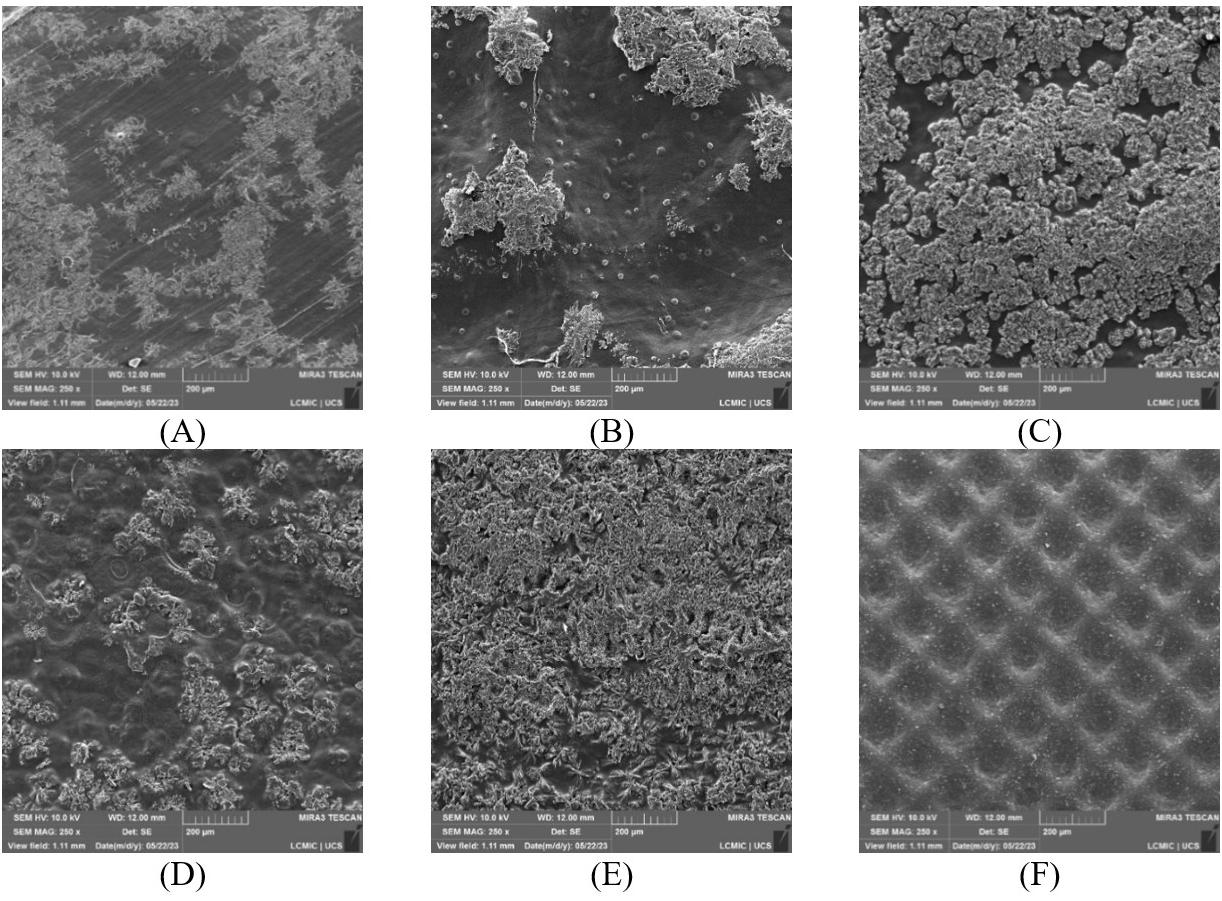
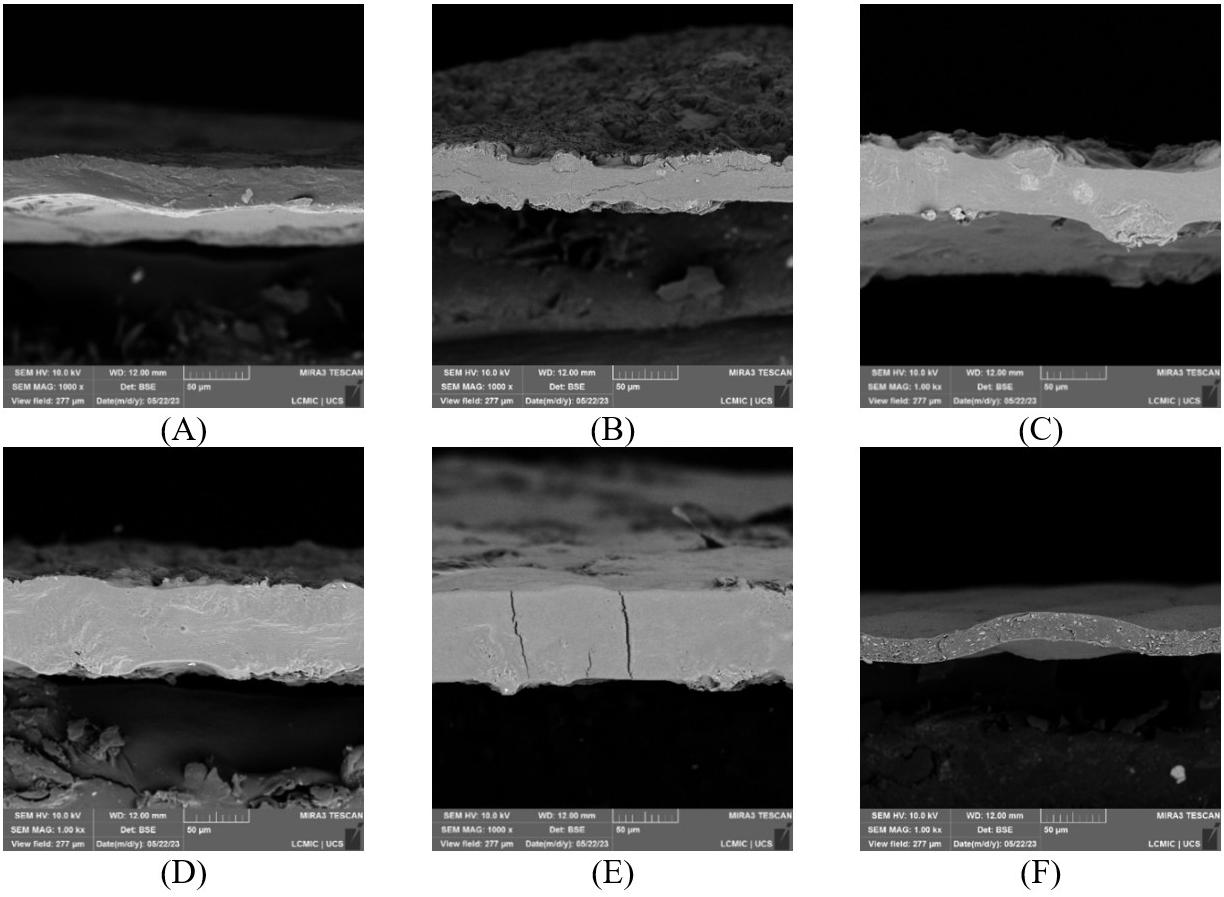
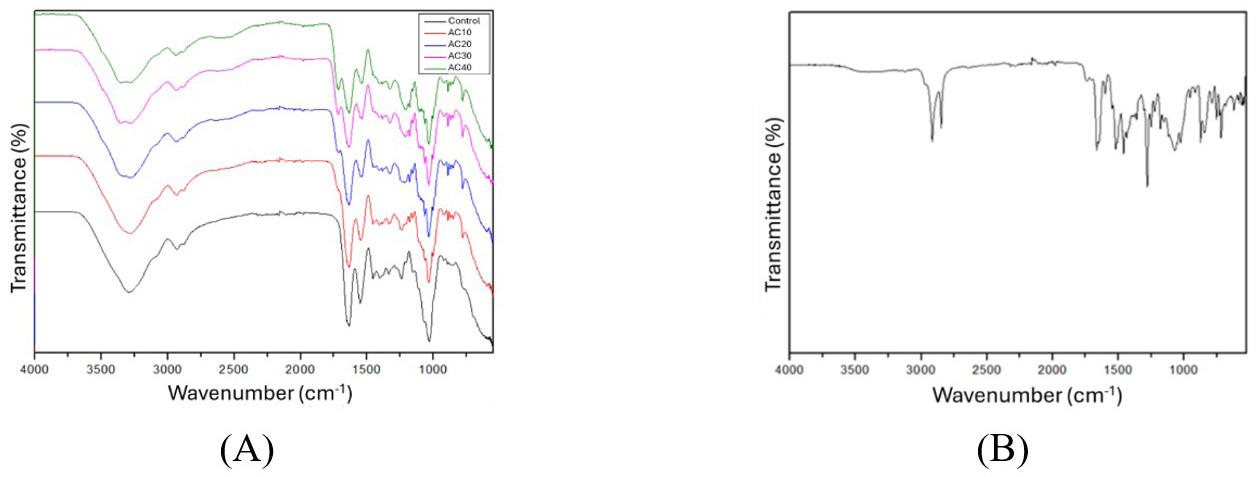
regions. Thus, it can be seen that the incorporation of the crosslinker does not significantly alter the FTIR spectrum.
The region around 3000-3600 cm-1 has bands corresponding to the -OH and -NH groups, which can bond hydrogen with the protein peptide bond through the carbonyl group[22]. According to Jesus, the stretching and vibration of the -OH and -NH groups in the spectra of whey powder and gelatin powder cause their bands to have higher intensities than those of the films[4] . Jesus also reports that “this change suggests that hydrogen bonds occur between the amino group and -OH of the protein molecules”, indicating a reduction in hydrophilicity since the free -OH groups of gelatin are associated with hydrogen bonds so that they are less exposed to hydration[4,23]
Amides are identified in the bands located around 1500-1725 cm-1. The region close to 1625 cm-1, here indicated as amide I, indicates the presence of the C-N amide group and, above all, the presence of stretching of the C=O bond. The region close to 1525 cm-1 indicates the presence of angular deformation in the NH plane and stretching of the CN bond.
The bands around 800 and 1150 cm-1 are related to the axial vibrations of the C-C and C-O bond of the plasticizing agent[14]. Abedinia et al.[24] and Oliveira et al.[23] reported that the band formed around 1050 cm-1 indicates interaction between the OH group of glycerol and the film proteins.
The films’ spectra were very similar to the spectra of whey and gelatin. The predominant influence comes from gelatin, observed between the bands from 3750-1500 cm-1 , while the similarity with whey powder can be observed in the fingerprint region, from 1500 cm-1 and below. The presence of citric acid in the samples results in subtle changes, with Shi et al.[8] reporting partial esterification during mixing and an increase in the degree of esterification as the citric acid content increases when studying samples of cornstarch plasticized only with glycerol and plasticized with glycerol and citric acid. A possible CO binding can be observed by the presence of a broad band between 1280-1160 cm-1 and an increase in the peak height in the region between 1710-1720 cm-1, which may suggest an increase in the number of ester-type bonds.
Figure 5B shows the spectrum of the standard sample, with the predominance of bands occurring in the fingerprint region that extends from 1800-400 cm-1. The presence of the Si-H bond is indicated by almost imperceptible bands in the region between 2300-2100 cm-1, in addition to the
bands between 950-800 cm-1, confirming the presence of the raw material. The produced films and the synthetic standard have no apparent similarities.
Based on the thermogravimetric data presented, it is possible to verify that all films produced with different concentrations of citric acid have similar behaviors, and the addition of the crosslinker influenced the decrease in TD and the increase in mass loss. The decline in thermal stability may be related to the reduction in the interaction between proteins caused by the addition of citric acid, which probably stabilizes the structure of the polymer network[4]
Three degradation stages can also be analyzed from the thermograms of the films produced from whey and gelatin, presented in Figure 5.
Presenting a mass reduction of around 15% for the BR, AC10, and AC20 films and around 40% for the AC30 and AC40 films, the first stage of degradation may be related to the loss of free water adsorbed on the films.
Depending on the sample, the second stage begins at 160 °C and ends at around 230 °C. Since the TD of glycerol is in tune with these temperatures, this decomposition stage may concern the glycerol incorporated into the polymer matrix[6]. The last stage starts from 250 °C until the end of the test (800 °C). It is mainly related to the degradation of whey and gelatin, resulting in the complete degradation of the organic part and the generation of waste composed of organic material[4]. According to Ramos et al.[14], the presence of a single initial decomposition temperature, TD, suggests the compatibility between the reagents selected for the composition of the films[13]. The percentage of residues of the films at 800 °C was between 20-25%.
In the literature, films produced based on whey and/or gelatin are also found, which present the same pattern of three stages of thermal decomposition and only one TD [4 14]. For example, Jesus obtained similar values for TD and slightly lower values for TMAX and mass loss[4]. Shi et al.[8] report a decrease in mass loss when comparing films produced based on thermoplastic starch plasticized only with glycerol and plasticized with glycerol and citric acid.
Figure 6F shows the thermogram for the synthetically produced standard sample, which presents a well-defined
Antoniazzi, C., Duarte, J., Silvestre, W. P., & Baldasso, C.
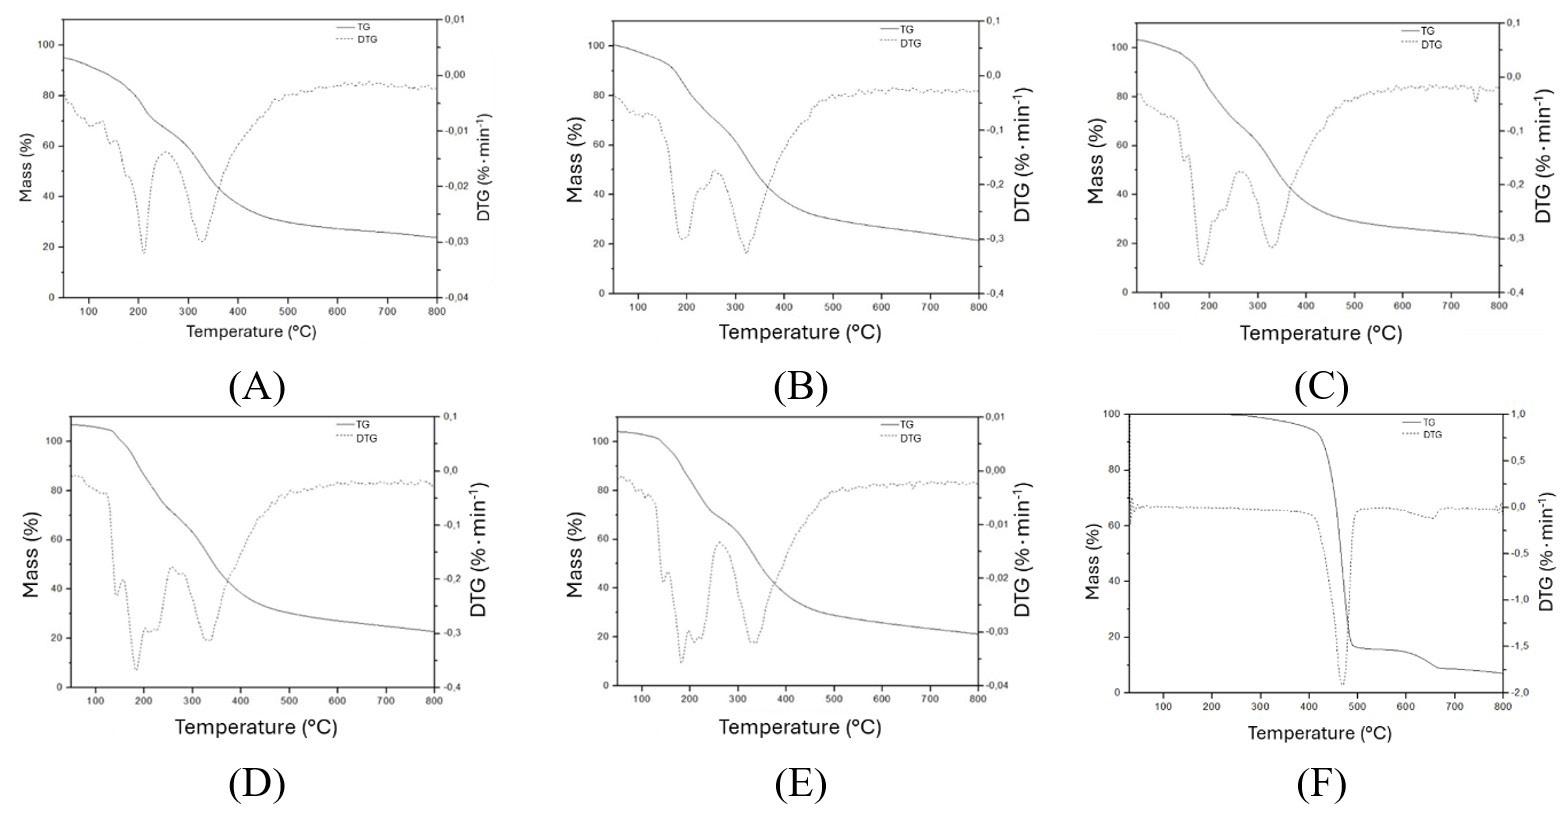
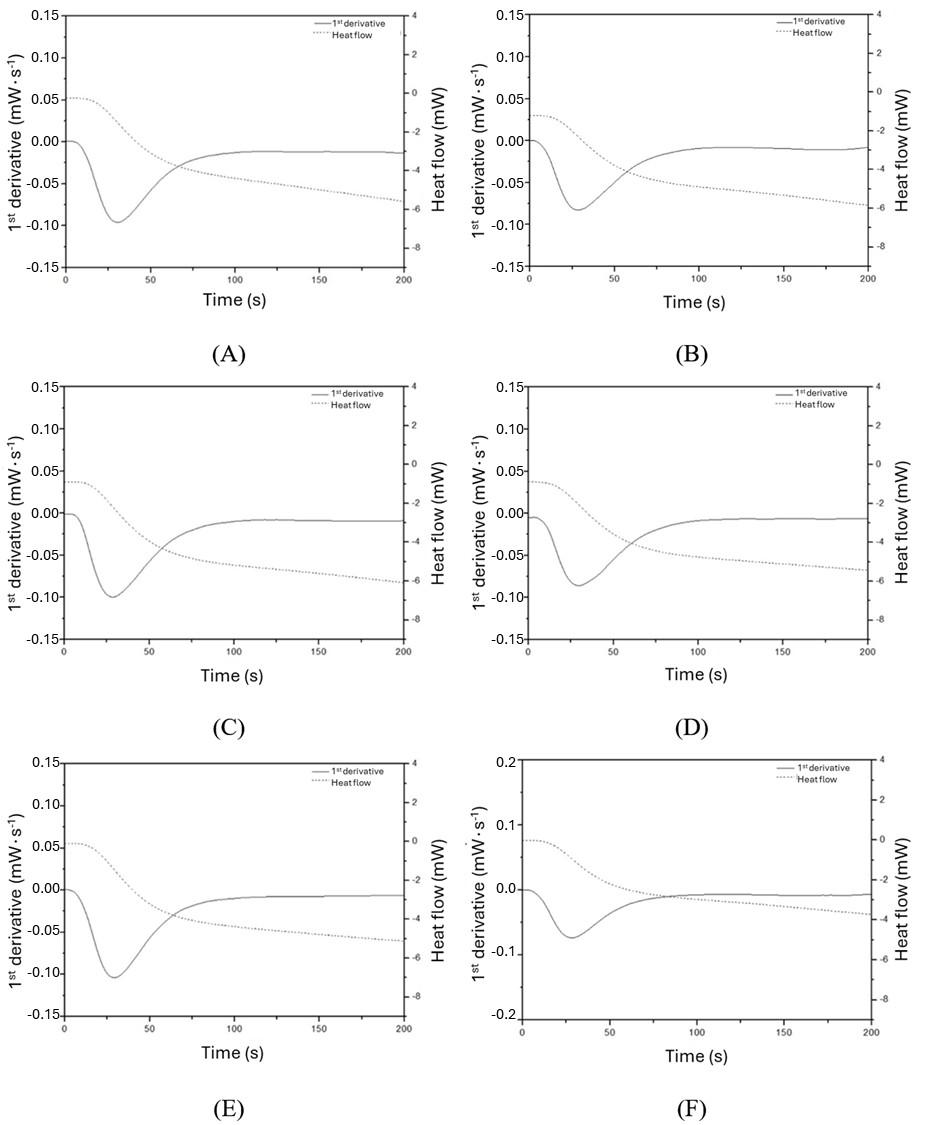
thermal event and a second event, which occurs more slowly. The first stage of degradation can also be related to the loss of water from the material and begins at around 250 °C and ends at around 500 °C. The second stage starts at around 575 °C and stabilizes at around 675 °C.
Comparing all the films analyzed, the standard is the film that presented greater thermal stability and mass loss. In contrast, the other films produced based on whey and gelatin with and without the addition of citric acid presented very similar behaviors.
The glass transition temperature (Tg) is important for checking the mobility of the chains. Polymers below their T g exhibit rigid solid behavior and are often fragile. Those that are above T g have a flexible amorphous structure.
The glass transition temperature values of the standard film samples and the films produced based on whey and gelatin with and without the addition of citric acid are presented in Table 4
The glass transition temperature of the BR (control) sample is the highest among the films produced based on whey and gelatin. Even though there is a subtle difference, the behavior of the films reveals a decrease in T g with the addition of citric acid.
Figure 6 shows the differential scanning calorimetry of films produced with whey and gelatin.
The DSC curves of the film samples demonstrate the compatibility of glycerol with whey and gelatin and the effectiveness of the plasticization process[4]. The incorporation of citric acid into the films produced caused a slight reduction in T g, which remained between the Tg of whey powder and gelatin, indicating the formation of a miscible blend between the two biopolymers used in the film’s production.
Shi reports that in films produced based on cornstarch, glycerol, and citric acid, Tg decreased as the citric acid content increased, having found temperatures below zero. Therefore, at room temperature, the films are flexible[8]. The decrease in the glass transition temperature may be related to the reduction in molar mass as citric acid is incorporated into the formulation.
In contrast, Dabove reported a glass transition temperature of around 80 °C for films produced with glycerol and citric acid, and the high Tg may be associated with the multifunctionality of the molecules of these additives, forming a rigid and voluminous three-dimensional network[25] .
Figure 6F shows the DSC of the standard sample, revealing a glass transition temperature of around 23.27 °C,
Table 4. Glass transition temperatures of gelatin and whey-based films with increasing concentrations of citric acid as a crosslinking agent. Sample Glass transition temperature – Tg (°C)
very close to the Tg of gelatin and slightly higher than that of whey powder and the films produced.
The thermograms presented also reveal that the films produced remained homogeneous during the heating and cooling cycles due to the absence of phase separation, i.e., melting and crystallization peaks in the temperature range tested.
Based on the experimental results obtained, it can be noted that a homogeneous blend was formed between whey and gelatin. The films produced with 10 wt.% and 20 wt.% citric acid relative to the amount of whey proved promising for potential use as packaging for feminine pads. The films with 30 wt.% and 40 wt.% crosslinker were discarded as options for the suggested application, mainly because they presented a high degree of solubility, which could cause problems in practical and/or commercial applications.
• Conceptualization – Carolina Antoniazzi; Camila Baldasso.
• Data curation – Carolina Antoniazzi.
• Formal analysis – Wendel Paulo Silvestre.
• Funding acquisition – Camila Baldasso.
• Investigation – Carolina Antoniazzi; Jocelei Duarte.
• Methodology – Wendel Paulo Silvestre; Camila Baldasso.
• Project administration – Camila Baldasso.
• Resources – Jocelei Duarte; Camila Baldasso.
• Software – NA.
• Supervision – Camila Baldasso.
• Validation – Carolina Antoniazzi.
• Visualization – Carolina Antoniazzi; Wendel Paulo Silvestre.
• Writing – original draft – Carolina Antoniazzi; Wendel Paulo Silvestre.
• Writing – review & editing – Jocelei Duarte; Camila Baldasso.
The authors would like to thank the National Council for Scientific and Technological Development (CNPq - Brazil) for the financial support as scholarships.
1 Borschiver, S., Almeida, L. F. M., & Roitman, T. (2008). Technological and market monitoring of biopolymers. Polímeros: Ciência e Tecnologia, 18(3), 256-261. http://doi.org/10.1590/ S0104-14282008000300012
2 Paoli, M. A. (2008). Biodegradation of polymers: introduction: what is biodegradation? In J. C. Andrade (Ed.), Degradação e estabilização de polímeros (pp. 107-208). Campinas: Chemkeys.
3 Murari, C. S., Moraes, D. C., Bueno, G. F., & Del Bianchi, V. L. (2013). Evaluation of the reduction in pollution of dairy products
Antoniazzi, C., Duarte, J., Silvestre, W. P., & Baldasso, C.
from whey fermentation in ethanol by yeast Kluyveromyces marxianus 229. Revista do Instituto de Latícinios Cândido Tostes, 68(393), 42-50 http://doi.org/10.5935/2238-6416.20130034
4 Jesus, G. L. (2020). Obtaining, characterizing and comparison of whey protein-based films (Doctoral thesis). Universidade Federal do Rio Grande do Sul, Porto Alegre
5 Faria, E. F. (2004). Study of the environmental impact generated in water bodies by effluent from the dairy industry in Minas Gerais (Master’s dissertation). Universidade Federal de Minas Gerais, Belo Horizonte.
6 Sarbon, N. M., Badii, F., & Howell, N. K. (2015). The effect of chicken skin gelatin and whey protein interactions on rheological and thermal properties. Food Hydrocolloids, 45, 83-92 http://doi.org/10.1016/j.foodhyd.2014.10.008
7. Oliveira, M. J. A., Almeida, M., Amato, V. A., Parra, D. F., & Lugão, A. B. (2009). Membranas de hidrogéis de PVAL/ PVP/ácido cítrico para liberação de droga. In Anais do 10º Congresso Brasileiro de Polímeros, Foz do Iguaçu, Brazil. São Carlos: ABPol
8 Shi, R., Bi, J., Zhang, Z., Zhu, A., Chen, D., Zhou, X., Zhang, L., & Tian, W. (2008). The effect of citrus acid on the structural properties and cytotoxicity of the polyvinyl alcohol/starch films when molding at high temperature. Carbohydrate Polymers, 74(4), 763-770 http://doi.org/10.1016/j.carbpol.2008.04.045
9 Jiang, Y., Li, Y., Chai, Z., & Leng, X. (2010). Study of the physical properties of whey protein isolate and gelatin composite films. Journal of Agricultural and Food Chemistry, 58(8), 5100-5108 http://doi.org/10.1021/jf9040904 PMid:20356044.
10 Yang, J., Webb, A. R., & Ameer, G. A. (2004). Novel citric acid- based biodegradable elastomers for tissue engineering. Advanced Materials, 16(6), 511-516. http://doi.org/10.1002/ adma.200306264
11 Kumar, A. A., Karthick, K., & Arumugam, K. P. (2011). Biodegradable Polymers and Its Applications. International Journal of Bioscience, Biochemistry, Bioinformatics, 1(3), 173-176 http://doi.org/10.7763/IJBBB.2011.V1.32
12 Deng, L., Zhang, X., Li, Y., Que, F., Kang, X., Liu, Y., Feng, F., & Zhang, H. (2018). Characterization of gelatin/zein nanofibers by hybrid electrospinning. Food Hydrocolloids, 75, 72-80 http://doi.org/10.1016/j.foodhyd.2017.09.011
13 American Society for Testing and Materials – ASTM. (2018). ASTM D882-18: standard test method for tensile properties of thin plastic sheeting West Conshohocken: ASTM International
14. Ramos, Ó. L., Reinas, I., Silva, S. I., Fernandes, J. C., Cerqueira, M. A., Pereira, R. N., Vicente, A. A., Poças, M. F., Pintado, M. E., & Malcata, F. X. (2013). Effect of whey protein purity and glycerol content upon physical properties of edible films manufactured therefrom. Food Hydrocolloids, 30(1), 110-122 http://doi.org/10.1016/j.foodhyd.2012.05.001
15 Kaewprachu, P., Osako, K., Benjakul, S., Tongdeesoontorn, W., & Rawdkuen, S. (2015). Biodegradable protein-based films and their properties: a comparative study. Packaging Technology & Science, 29(2), 77-90 http://doi.org/10.1002/pts.2183
16 Kurek, M., Galus, S., & Debeaufort, F. (2014). Surface, mechanical and barrier properties of bio-based composite films based on chitosan and whey protein. Food Packaging and Shelf Life , 1 ( 1 ), 56 - 67 http://doi.org/10.1016/j. fpsl.2014.01.001.
17 Lima, J. E. S. (2019). Determination of contact angle, surface tension and adhesion work of a urethane adhesive primer. Revista Caleidoscópio, 11, 1-6
18 Flaker, C. H. C., Lourenço, R. V., Bittante, A. M. Q. B., & Sobral, P. J. A. (2015). Gelatin-based nanocomposite films: a study on montmorillonite dispersion methods and concentration. Journal of Food Engineering, 167, 65-70 http://doi.org/10.1016/j. jfoodeng.2014.11.009.
19 Wang , W. , Li , C. , Zhang , H. , & Ni , Y. ( 2016 ). Using liquid smoke to improve mechanical and water resistance properties of gelatin films. Journal of Food Science , 81 (5), E1151 - E1157 http://doi.org/10.1111/1750-3841.13282 PMid:27061211.
20 Soazo, M., Rubiolo, A. C., & Verdini, R. A. (2011). Effect of drying temperature and beeswax content on physical properties of whey protein emulsion films. Food Hydrocolloids, 25(1), 1251-1255 http://doi.org/10.1016/j.foodhyd.2010.11.022
21 Guerrero, P., Stefani, P. M., Ruseckaite, R. A., & de la Caba, K. (2011). Functional properties of films based on soy protein isolate and gelatin processed by compression molding. Journal of Food Engineering, 105(1), 65-72. http://doi.org/10.1016/j. jfoodeng.2011.02.003
22 Le Tien, C., Letendre, M., Ispas-Szabo, P., Mateescu, M. A., Delmas-Patterson, G., Yu, H.-L., & Lacroix, M. (2000). Development of biodegradable films from whey proteins by cross- linking and entrapment in cellulose. Journal of Agricultural and Food Chemistry, 48(11), 5566-5575 http:// doi.org/10.1021/jf0002241 PMid:11087520.
23. Oliveira, A. C. S., Ugucioni, J. C., Rocha, R. A., & Borges, S. V. (2018). Development of whey protein isolate/polyaniline smart packaging: morphological, structural, thermal, and electrical properties. Journal of Applied Polymer Science, 136(14), 47316 http://doi.org/10.1002/app.47316
24 Abedinia, A., Ariffin, F., Huda, N., & Mohammadi Nafchi, A. (2018). Preparation and characterization of a novel biocomposite based on duck feet gelatin as alternative to bovine gelatin. International Journal of Biological Macromolecules , 109, 855-862 http://doi.org/10.1016/j.ijbiomac.2017.11.051 PMid:29133087.
25 Dabove, D. A. C. (2013). Development of gycerol-based polymers (Master’s dissertation). Universidade Federal de São Carlos, São Carlos
Received: Feb. 19, 2025
Revised: May 08, 2025
Accepted: May 24, 2025
Editor-in-Chief: Sebastião V. Canevarolo
Alexandre Oka Thomaz Cordeiro1 , Marcelo Eduardo da Silva1 and Cristiane Reis Martins1*
1Laboratório de Engenharia e Controle Ambiental, Departamento de Engenharia Química, Instituto de Ciências Ambientais, Químicas e Farmacêuticas, Universidade Federal de São Paulo, Diadema, São Paulo, SP, Brasil *cr.martins@unifesp.br
Obstract
This study examines the impact of three surface treatment methods on sisal fibers used as reinforcement in styrene-butadiene rubber (SBR) composites: washing with water, alkaline treatment (mercerization), and silanization, with each composite containing 5 wt% of fibers. The preparation process involved using an internal mixer and rubber mixing mill to shape the composites, followed by vulcanization in an automated system press. The effectiveness of the treatments was evaluated using scanning electron microscopy, along with tensile tests, rheometer analysis, and measurements of hardness and density. The treatments enhanced fiber modification by increasing surface roughness through the grafting of silanol groups, thereby improving their interaction with the elastomeric matrix. Notably, composites reinforced with silanized fibers exhibited the highest performance and interaction among the various treatment methods, showing a higher modulus at 100%. Alkaline and silanization treatments reduced vulcanization time. Sisal fibers combined with SBR waste can promote sustainability in the footwear industry.
Keywords: fiber surface treatment, sisal fiber, styrene-butadiene rubber, footwear industry, composites.
Data Availability: Research data is available upon request from the corresponding author.
How to cite: Cordeiro, A. O. T., Silva, M. E., & Martins, C. R. (2025). Sustainable styrene-butadiene composites with sisal fiber and rubber waste from footwear. Polímeros: Ciência e Tecnologia, 35 (3), e20250035. https://doi.org/10.1590/0104-1428.20250004
1. Introduction
Growing concerns about production waste and its environmental impact have led to changes in the footwear industry. Implementing a circular economy and finding new uses for the waste generated by the industry is an option to reduce environmental impacts and promote sustainability. Another solution to promote sustainability is using materials from renewable and/or biodegradable sources, such as plant fibers[1-5]
The circular economy is a concept that focuses on delivering positive benefits for society, aiming to reduce waste in the production chain and promote the reuse of resources. Currently, most of the waste from the footwear industry is discarded, causing a negative environmental impact on the industry. As a solution, incorporating waste into new composites and products can be a way to add value to the material and promote sustainability[1,3,6]. In addition to the automotive sector, the footwear industry, which uses SBR extensively, is one of the primary producers of styrene-butadiene rubber (SBR) waste[7,8]. Concern about environmental pollution and the waste of raw materials with suitable properties and high added value motivates the reuse of this rubber[9-12]. One method of recycling this residue is to mill it into a fine powder, making it easier to flow and mix with virgin resin to produce new
formulations. In this way, it can be used as a consumable in a new process[7,8,13,14] .
A further method to enhance sustainability in the footwear industry involves a new category of materials for footwear production: biodegradable materials and renewable sources, including vegetable fibers such as sisal, cotton, flax, bamboo, coconut, hemp, cork, and soy[1,4,15]. Vegetal fibers offer several advantages, including low density, low cost, high availability, biodegradability, ease of acquisition and handling, and ecological benefits from their renewable sources[16-18]. Sisal is one of the most utilized vegetable fibers in elastomeric matrix composites. It stands out beyond its ecological aspect as its cultivation plays a vital role in enhancing agriculture in the northeast semiarid regions of Brazil[16 19-25]
However, fibers are incompatible with most matrices because of their composition and hydrophilic nature. In polymer composites, high moisture fibers can impact their final properties, and the hydrophilic nature of the fibers makes it very difficult to disperse within a hydrophobic rubber matrix[17,26-28]. Several surface modification methods are used, including both physical and chemical treatments, and coupling agents are used to improve interfacial bonding between fibers and matrix[28-31]. Alkaline treatments increase possible reaction sites and surface roughness. In contrast,
silane treatments promote a stable surface on the fiber and create hydrogen bonds between the silane molecule and the hydrogens of the polymer matrix. Both treatment methods are commonly used for vegetable fibers reinforcing thermoplastic, thermoset, and rubber composites[18,26,27,32]. There are few studies on the effects of incorporating vegetal fibers into elastomeric matrices compared to other polymer matrices.
To promote sustainability, this study aims to develop a composite formulation for footwear applications by reusing SBR residues from the footwear industry and incorporating sisal fibers treated with various surface methods. The work involves characterizing the composite’s mechanical and morphological properties, evaluating the impact of sisal fiber incorporation on these properties, and assessing the technical feasibility of utilizing the material in sandal production for the footwear industry.
2.1 Materials
In this study, the following materials were used: sodium hydroxide (NaOH) P.A. (Labsynth); Silquest A-178 methacryloxypropyltrimethoxysilane (Momentive); sisal fibers (refugo type), supplied by Hamilton Rios (Conceição do Coité, BA, Brazil); and two grades of random poly(styrene-butadiene) (SBR) elastomer copolymers, referred to as SBR A and SBR B, with approximate styrene contents of 23.5% and 48%, respectively. The rubber formulation in this work resembles a compound derived from expanded vulcanized SBR waste generated by the footwear industry. Alpargatas SA kindly supplied all ingredients.
2.2 Sisal fiber treatments
Sisal fibers were cut to a precise length of 6 mm using a guillotine paper cutter. The fibers were then ground in a knife mill (Tecnal) and effectively sieved through a Tyler 16 sieve with a 1 mm opening. The following superficial treatments were evaluated to increase the interfacial interaction between sisal fibers and the elastomeric matrix. Washed sisal fibers (WSF) were washed in deionized water under agitation for 1 h at 80 °C and then dried in an air circulation oven at 60 °C for 12 h[22]. Mercerized sisal fibers (MSF) were treated with agitation in a 5% NaOH solution at room temperature (21 °C) for 3 h, then washed until neutralized pH (~7) and dried in an air circulation oven at 60 °C for 12 h[22]. Silanized sisal fibers (SSF) were washed in deionized water under agitation for 1 h at 80 °C and dried in an air circulation oven at 60 °C for 12 h. A 0.3% solution of γ-methacryloxypropyltrimethoxysilane in alcohol (60% ethanol in water) was prepared. Fibers were submerged in agitation with the silane solution at 1:3 (silane to fiber) for 90 min at room temperature. Afterward, fibers were dried in an air circulation oven at 70 °C for 24 h until constant weight was achieved[31] .
Rubber compounds were prepared by blending varying SBR A and SBR B concentrations, incorporating SBR waste from the footwear industry. The mixing process was
performed using a Banbury internal mixer BT (Luxor) located at Flexlab (Santo André, São Paulo, Brazil) under the following conditions with 60 rpm and a piston pressure of 5 kgf/cm2
Figure 1 illustrates the methodology adopted for treating sisal fibers and preparing SBR/Sisal fiber (SF) composites. The formulations used in preparing the rubber and composite are detailed in Table 1. A preliminary study was conducted to ensure that the developed formulation would resemble the properties of rubber waste provided by the footwear industry. Figure 1a shows the sisal fibers following various surface treatments, while Figure 1b presents the two types of SBR elastomers utilized. In the first mixing stage, the SBR elastomers were added to a Banbury mixer and masticated for one minute. Subsequently, all other ingredients, excluding sulfur and sisal fibers, were incorporated and mixed for three minutes. In the second stage, sulfur was added and mixed for one minute, achieving a total mixing time of five minutes. The compound was then transferred to a two-roll mill (MBL, Luxor) for further homogenization for approximately 10 minutes before being sheeted out, followed by a 24 hour resting period at room temperature (Figure 1c). The SBR/SF composites were prepared on the same two-roll mill by incorporating 8.8 phr of treated sisal fibers into the SBR60/40 blend (Figure 1c). A portion of the material, both with and without sisal fibers, was used to determine optimal curing conditions. The remaining material was vulcanized in a hydraulic press at 160 °C for 15 minutes (Figure 1e). Figure 1f displays a final product manufactured from the SBR/SF composite.
For morphological analysis, the fibers’ surfaces were examined using scanning electron microscopy (SEM) 6610 L20 (JEOL JSM) at an acceleration voltage of 5 kV. For all treatments, the surfaces were coated with gold.
Sustainable styrene-butadiene composites with sisal fiber and rubber waste from footwear
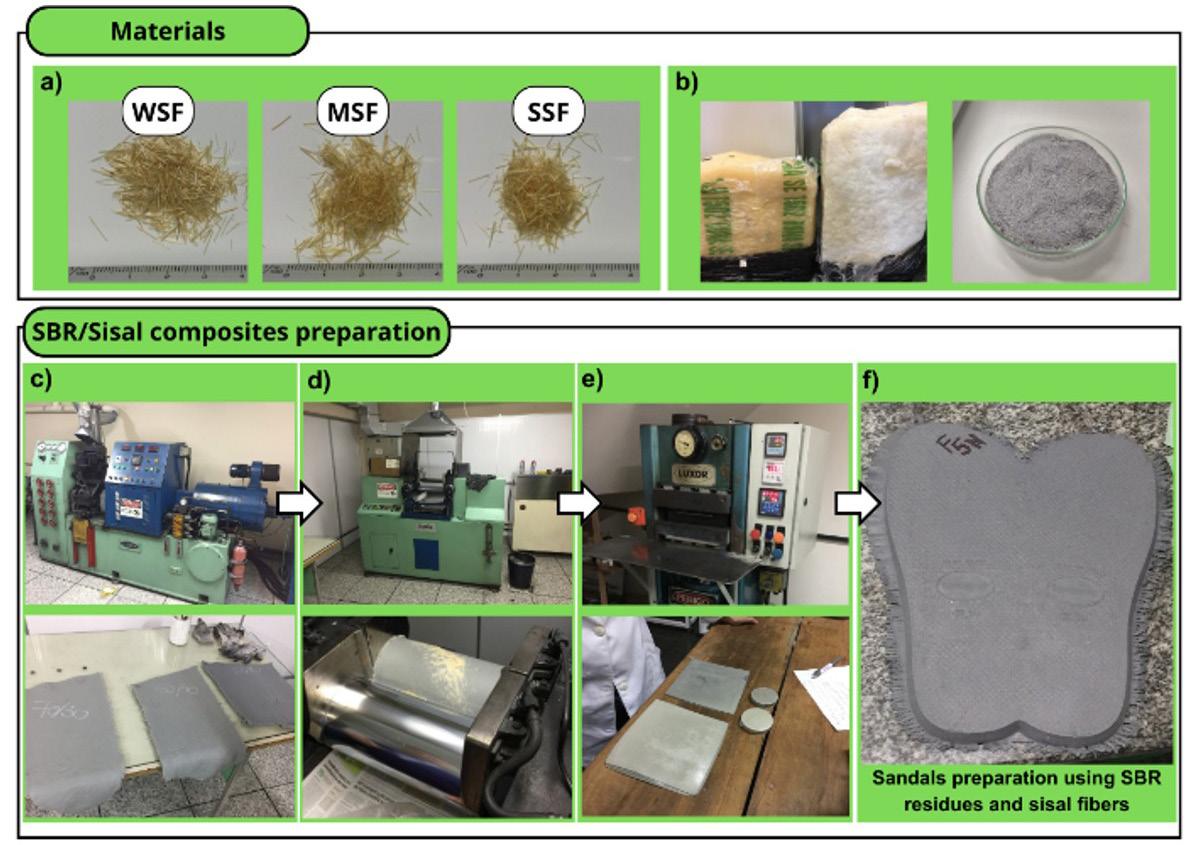
The Fourier Transform Infrared (FTIR) Spectrophotometer (IR Prestige, Shimadzu Corporation) was used to analyze the functional compounds in the sisal fibers subjected to various treatments. The FTIR scans were conducted in the wavenumber range of 4000 to 500 cm−1, with a resolution of 4 cm−1 and a total of 128 scans. These measurements were performed in a controlled environment with regulated temperature and humidity, using transmittance mode based on the wavelength.
The thermogravimetric (TGA) technique evaluated the sisal fibers’ thermal behavior before and after treatment. The analysis was conducted on a DTG-60H (Shimadzu) located at NIPE from Unifesp, Campus Diadema, São Paulo. Tests were carried out under an N2 atmosphere with a gas flow rate of 50 mL/min, a heating rate of 10 °C/min, and a temperature range from 30 to 600 °C.
2.5 Rubber compounds and SBR/SF composites characterization
Rheological analysis was used to understand the formulations’ vulcanization behavior. Samples were analyzed using a motorless cure rheometer MDR 2000 (Alpha Technologies) located at Flexlab. The tests were carried out at 160 °C for 30 minutes, according to ASTM D5289-19a. Disk format samples of about 7 g with an approximate volume of 5 cm3 were used.
Hardness tests were measured with a Shore A durometer TEC-017 (X.F. Instruments) using five samples for each
specimen according to NBR 14454/07. The density was obtained by Archimedes’ method according to NBR 1739/10.
Stress-strain tests were conducted using a universal testing machine, Tensometer 2000 (Monsanto), located at Flexlab, following the ASTM D412-06A standard. The samples used were of type C shape (dimensions). The cross-head feed rate was set to 500 mm/min, and a load cell with a capacity of 1.0 kN was employed. Five samples of each formulation were used.
The mechanical properties results were statistically evaluated using Analysis of Variance (ANOVA), applying Tukey’s test at a 5% significance level, with the aid of Minitab® 16.0 software.
The microscopy images were obtained using a scanning electron microscope (SEM) 6610 L20 (JEOL JSM), with a gold coating applied to the samples fractured cryogenically.
3.1 Sisal fibers characterization
Figure 2 shows the SEM micrograph of the surface of sisal fibers with and without treatment. Figure 2a shows that untreated fibers have a surface with microfibril cellulose structures that are barely exposed and covered by the sedimentary materials that make up their surface, with no definition of the parenchyma regions of the sisal fiber. This is different from what was observed in other works[19,23,33] , which may be related to the fact that the fibers are of the refugo type and have lower quality[34]
Cordeiro, A. O. T., Silva, M. E., & Martins, C. R.
Compared to other types of sisal fiber supplied by the company, in addition to the fact that the fibers may present variations in their composition according to their origin and position on the leaf from which they were obtained[23]
The SEM micrographs of the fibers after washing with water (WSF) are shown in Figure 2b. The SEM micrographs of the fibers after the alkaline treatment (MSF) are shown in Figure 2c, and silanized sisal fibers (SSF) are shown in Figure 2d. By comparing the micrographs in Figures 2a and 2b between the untreated fibers and the washed fibers, partial removal of the materials that cover the surface can be observed, as well as the appearance of well-defined regions of the parenchyma on the surface of the fiber. Unlike the results obtained in the literature, where washing the fiber did not generate notable changes in its appearance[33], this treatment proved effective for waste-type fibers.
In the alkaline treatment, the extraction of hemicellulose, lignin, as well as waxes, greases, and oils that make up the fiber, is observed, thus creating a more exposed surface with a smaller number of sedimentary materials and greater surface roughness that can lead to more significant mechanical interaction[32]. Despite going through a washing step (Figure 2d), the silanized fibers present a different surface appearance than the only washed fibers. A smoother surface is observed without well-defined cell structures, which may be associated with eliminating substances that directly influence hydrophilicity, such as pectin, lignin,
and amorphous wax in fiber cuticles, through coupling agent treatments[19]
FTIR analysis is a valuable technique for analyzing the structure of fibers and identifying changes that occur due to different treatments. This study used the FTIR spectrum to compare the untreated fibers with those treated with WSF, MSF, and SSF. The results for SF with and without treatment are shown in Figure 3. Fibers are known to consist mainly of cellulose, lignin, and hemicellulose. When fibers undergo alkaline treatment, a loss of mass occurs, which is attributed to the dissolution of hemicellulose. This is confirmed by the disappearance of the carbonyl group band at 1730 cm-1 in the FTIR curve of the alkaline-treated fibers compared to the untreated fibers[31]. In the case of silanization treatment, the silane bonds with hydroxyl groups of the fiber surface[35]. The introduction of an amine group (NH2) is expected. A band can identify this at 3200 cm-1 in the FTIR spectrum. Additionally, the silanization treatment leads to higher intensity absorbance related to the Si-O and Si-O-Si groups, which can be observed at 1285, 1075, and 1018 cm-1 , respectively[36-38]. The low silane concentration and weak interaction with fiber components may limit the detection of silanization effects in the FTIR spectra. The Si–O–C bond is difficult to identify due to strong cellulose absorption between 1000–1200 cm-1[39]. However, the reduced intensity of the 1023 cm-1 peak, where Si–O–C and C–O bands overlap after treatment, suggests the formation of Si–O–C bonds.
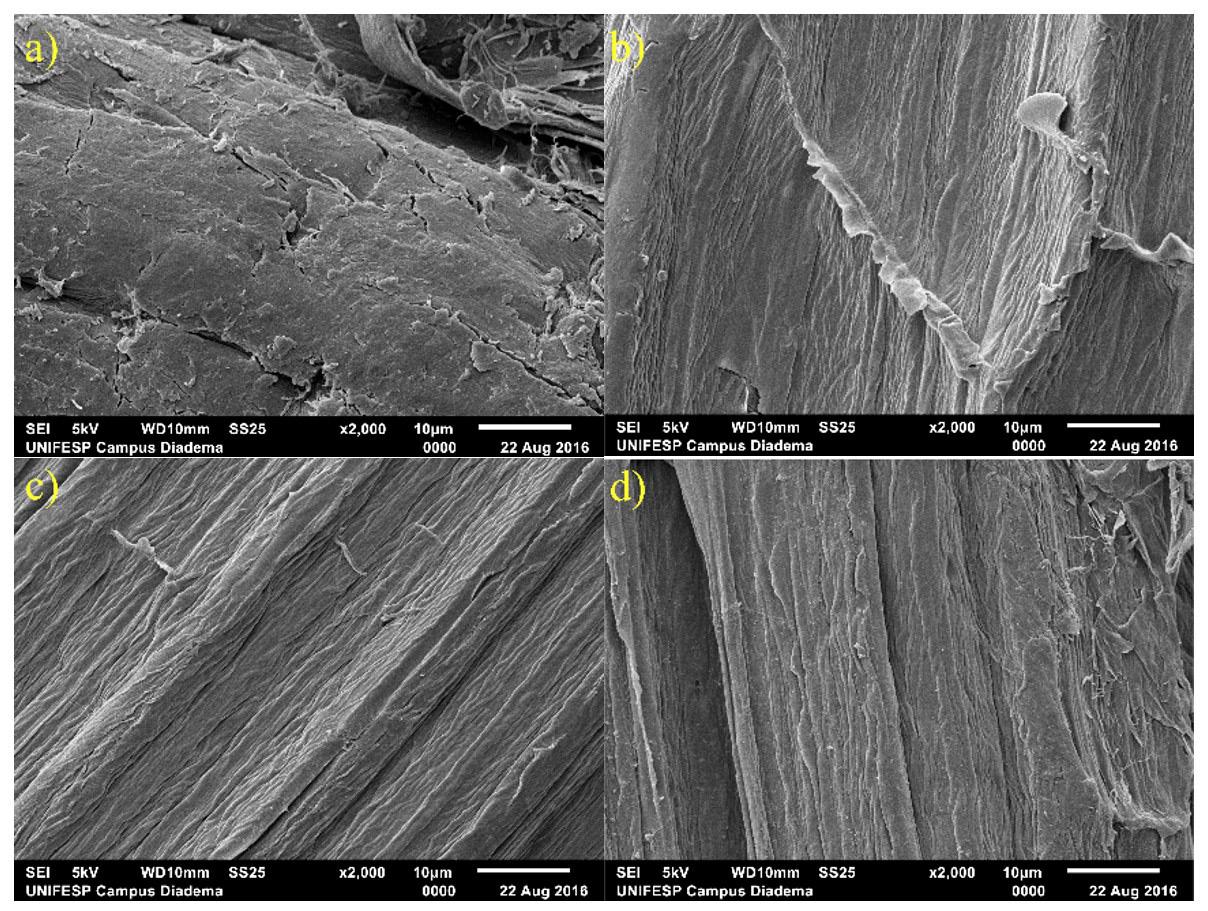
Sustainable styrene-butadiene composites with sisal fiber and rubber waste from footwear
The thermal characteristics of untreated and variously treated sisal fibers have been examined. The TGA curves are shown in Figure 4a, and the DTG curves are shown in Figure 4b. The thermal analysis results show three main stages of mass loss of the fiber during its degradation. The first stage occurred at up to about 100 °C, which may be related to the loss of water associated with the moisture present in the fibers and volatile compounds such as waxes, fats, and oils. The second stage occurred between 200 and 360 °C. This mass loss stage is linked to the degradation process of hemicellulose and cellulose present in the fiber. The third stage commenced at 400 °C. The degradation of lignin occurs more slowly and at higher temperatures than that of hemicellulose and cellulose. Although they all undergo drying stages, the complete removal of water is hindered due to the hydrophilic nature of the fibers. SF exhibits thermal stability between a 100 to 190 °C, while treated fibers withstand up to 200 to 220 °C. The increase in the thermal resistance of the fibers after treatment may be associated with the partial removal of hemicellulose, lignin, waxes and fats. For WSF, where the removal of these materials is more extensive, better thermal stability is observed[25,40,41] .
By varying the amount of SBR B and SBR A in the rubber formulation (1) 50/50% (SBR50/50), (2) 60/40% (SBR60/40), and 70/30% (SBR70/30) of SBR B and SBR A, respectively, we obtained pure rubber blankets. The influence of the two different types of SBR on the sulfur vulcanization of the prepared rubber compounds was evaluated based on selected parameters of the vulcanization characteristics from the rheological records of their vulcanization curves. The curing parameters were assessed: minimum torque (ML), maximum torque (MH), the difference between MH and ML (ΔM) (Equation 1), scorch time (ts1), optimum cure time (t90), and cure rate index (CRI) (Equation 2). The values of the basic parameters of vulcanization characteristics of individual rubber compounds containing SBR are shown in Table 2
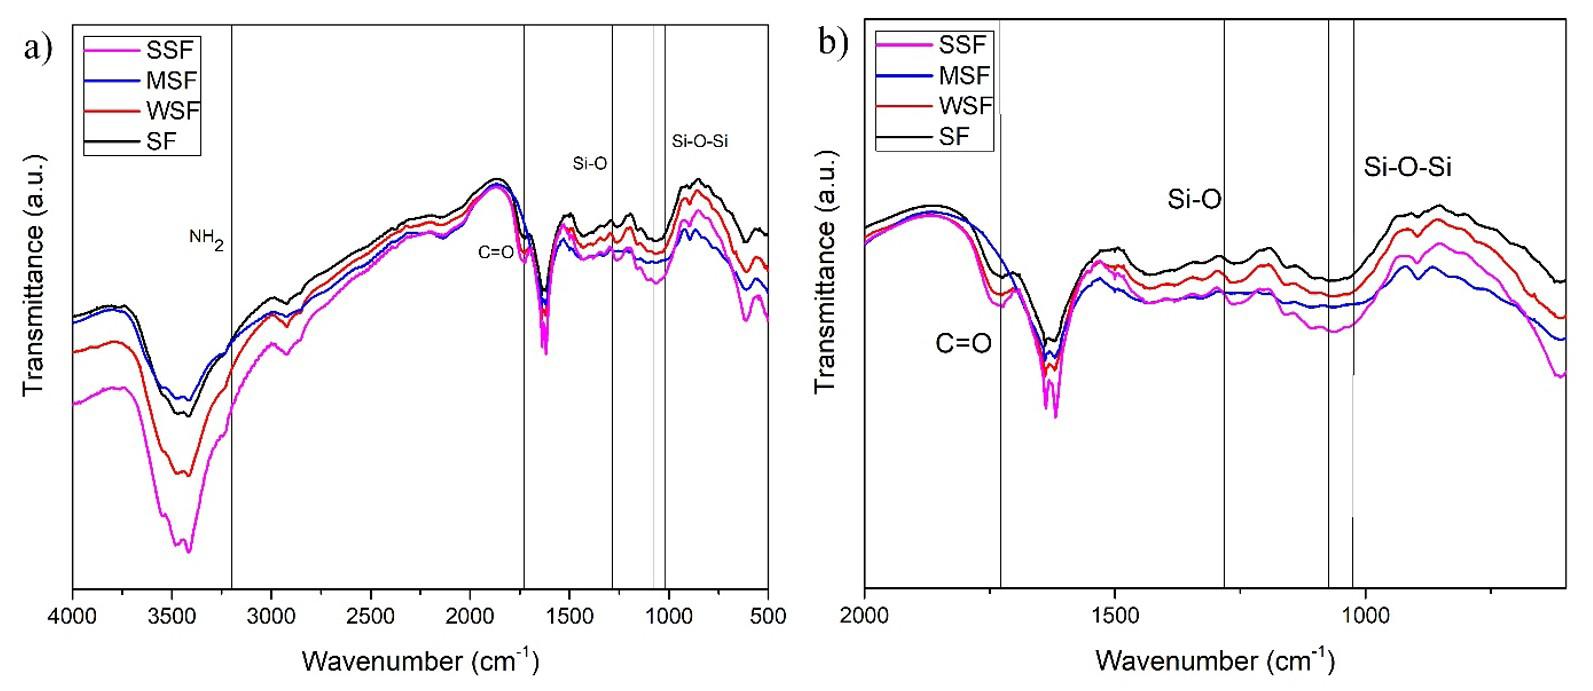
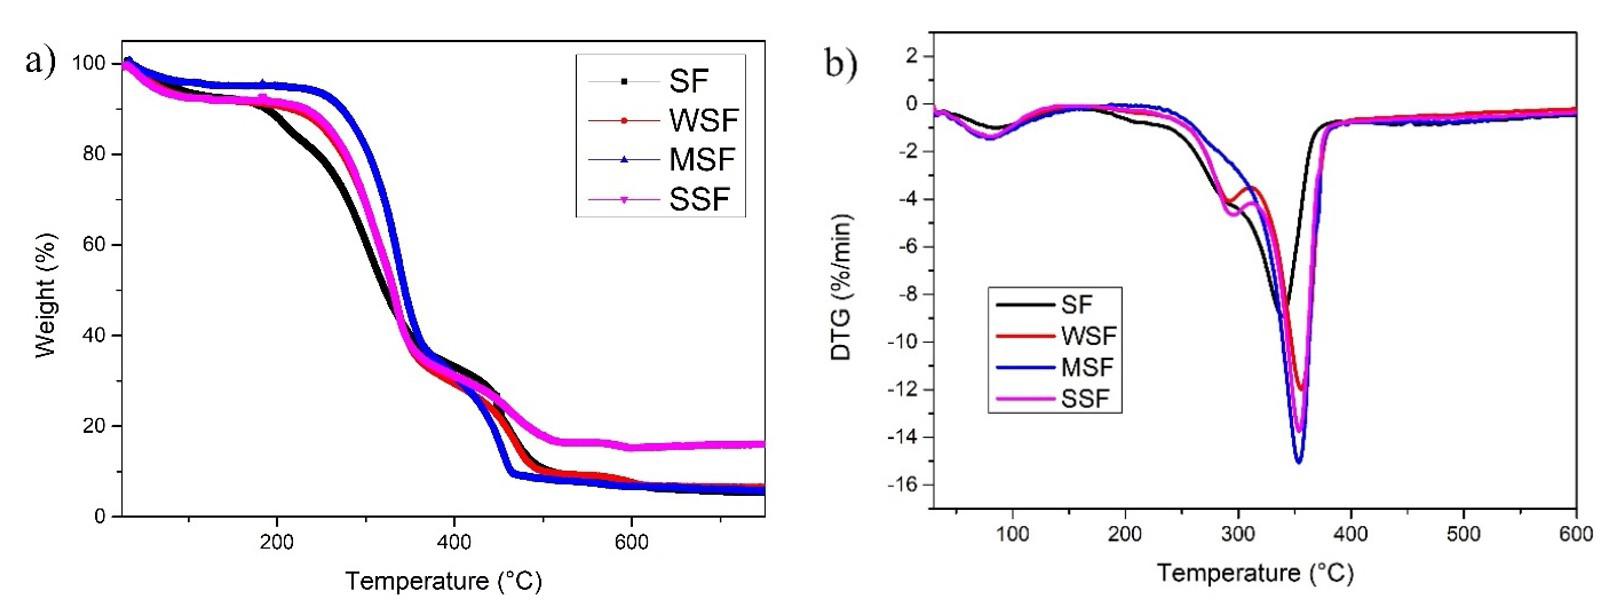
Cordeiro, A. O. T., Silva, M. E., & Martins, C. R.
Curing parameters change notably with blend ratios. ML is the rigidity and viscosity of an unvulcanized elastomer and an indicator of its processability. As the SBR B increases in ratio, a slight increase in ML is observed. MH directly relates to the compound’s modulus and measures the material’s stiffness. When the SBR B content increases, a lower MH is observed. This is due to increased styrene content in the compound, thus reducing MH. ΔM is an indicator of the cross-link density of the blends[42]. As the content of SBR B increases, the compound contains more styrene and less butadiene, resulting in fewer active sites available for the sulfur vulcanization process. This decreases the cross-link density and lengthens the time required for the material to vulcanize, as evidenced by the higher ts1 and t90 numbers and a lower observed CRI value.
Table 3 presents the results of the mechanical tests of the rubber formulations. There was no significant change regarding the mechanical properties of the SBR rubber compound, such as tensile strength, elongation at break, and modulus. The density increases with the ratio of styrene in the rubber compound. A slight increase in hardness is seen with the SBR60/40 formulation. We believe the rubber expansion causes the hardness to increase as the styrene ratio rises.
Figure 5 shows the micrographs obtained from the cryo-fractured surface of the rubber formulation SBR60/40. By analyzing the surface of these rubbers, the presence of many pores (closed cells) well-distributed throughout the matrix is observed. This characteristic is guaranteed by the blowing agent content in the rubber formulation due to the amount of gas produced from the thermal decomposition of azodicarbonamide[43]
The SBR60/40 formulation was designed as the standard formulation for evaluating various fiber treatments. Due to its properties and that most closely resembles the composition of SBR waste used from the footwear industry. The values of the basic parameters of vulcanization characteristics of SBR composites containing SF are shown in Table 4.
Table 2. Rheological characteristics of SBR rubber compounds at different ratios.
ML: minimum torque; MH: maximum torque; ΔM: difference between MH and ML; ts1: scorch time; t90: optimum cure time; CRI: cure rate index.
Table 3. Mechanical and physical properties of SBR rubber compound.
(Shore A)
Table 4. Rheological characteristics of SBR/Sisal fibers composites.
CRI (min-1) 7.69 7.12 7.72 7.79
ML: minimum torque; MH: maximum torque; ΔM: difference between MH and ML; ts1: scorch time; t90: optimum cure time; CRI: cure rate index.
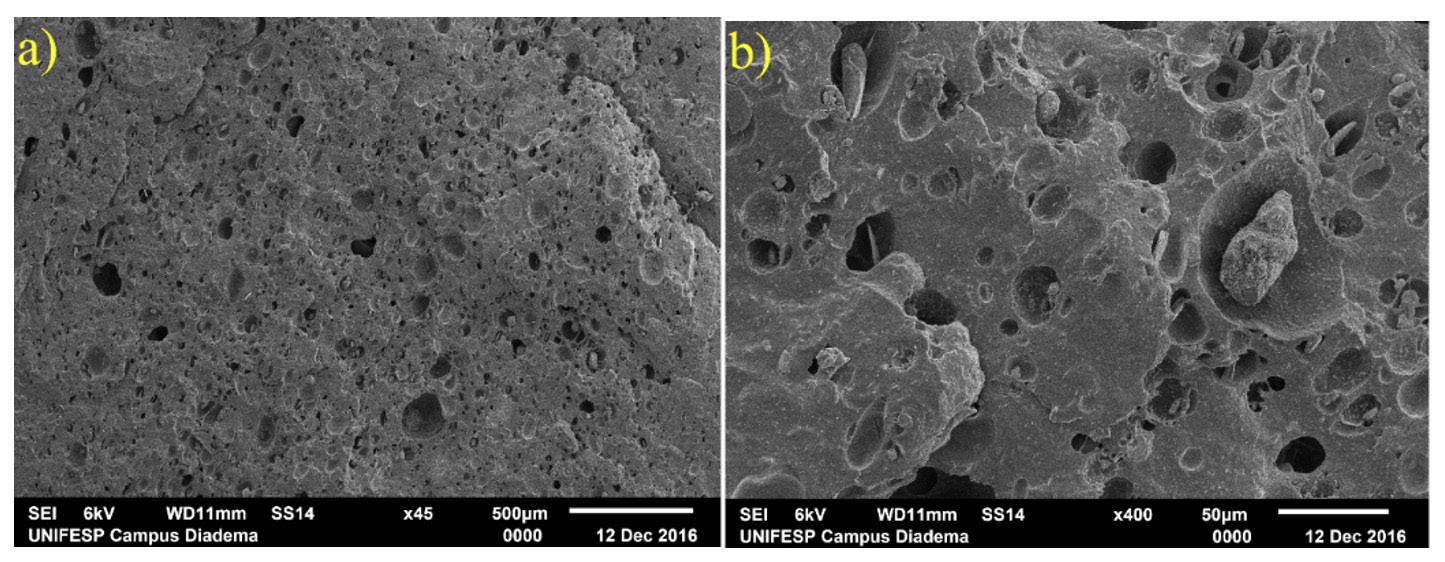
Sustainable styrene-butadiene composites with sisal fiber and rubber waste from footwear
The measure results indicate the influence of sisal fibers on SBR rheological behavior. Fibers increased the rigidity and viscosity of the composite and its stiffness, as shown by more remarkable ML and MH values. This resulted in a higher reinforcement of the material in the composite, which can be attributed to improved interaction between fibers and the rubber matrix. Sisal fibers without treatment increased the vulcanization time, whereas silanized sisal fibers showed a lower vulcanization time. Curing chemical reactions occur in a base media, and adding a material that can increase the system’s acidity may cause the initiation of curing chemical reactions to increase[44,45]. These changes may be related to the acidity of the sisal fiber after each different treatment. The vulcanization process requires a significant amount of time and energy[46]. Except for the sample that included WSF, there was a noticeable reduction in the time required for vulcanization when treated fibers were present. This reduction positively impacts the production time of the rubber artifact.
The micrographs in Figure 6 show the cryogenically fractured region of the SBR60/40 composites. The composites reinforced with fibers that were only washed (WSF, Figure 6a) and with silanization treatment (SSF, Figure 6c) exhibited better interaction with the matrix fiber compared to fibers treated with alkaline (MSF, Figure 6b). This was evident in the interface region between the matrix and fiber, where smaller distances between the materials indicated a better penetration of the elastomeric matrix on the fiber surface. Chemical treatments using agents such as silanes result in more significant fiber-matrix interaction by promoting a stable surface for adhesion. By creating hydrogen bonds between the silane molecule and the hydrogens in the polymer matrix, a stronger bond is achieved, leading to increased interaction between the fiber and the matrix[31,32,36]
The micrographs of the fiber-reinforced composite with alkaline treatment (SBR60/40M) showed larger pores compared to other composites and low interaction of the fibers to the elastomeric matrix. This could be attributed to a significant amount of moisture in the fibers during processing. This hinders matrix interaction and results in large empty spaces and a smaller interface region than fibers that were only washed or silanized. Despite having a rougher surface due to
the treatment, the alkaline-treated fibers did not interact well with the matrix. This was evidenced during sample processing, where the material exhibited a high number of bubbles on its external surface compared to untreated composites, which may be attributed to the increased moisture content in the fibers treated with alkaline, causing exposure of hydroxyl groups in cellulose and resulting in a more hydrophilic material[28]. In contrast to previous works which showed mechanical performance with mercerized and acetylated fibers[22,47], it has been reported that alkaline treatment can increase moisture content in the fiber after treatment[28,30] and adversely affect the expansion process of the material, leading to regions with high pore concentration.
Table 5 presents the mechanical results of the composites produced compared to the rubber formulations. The interaction between sisal fibers and the rubber matrix increases tensile strength. The filler particles and aggregates must be synchronized, well-dispersed, and wetted efficiently by the rubber matrix to increase the tensile strength. If not, inherent defects can act as stress concentration points and consequently decrease the tensile strength of the vulcanizates[44]
Table 5. Mechanical and physical properties of SBR rubber compound and SBR/SF composites.
(Shore A)
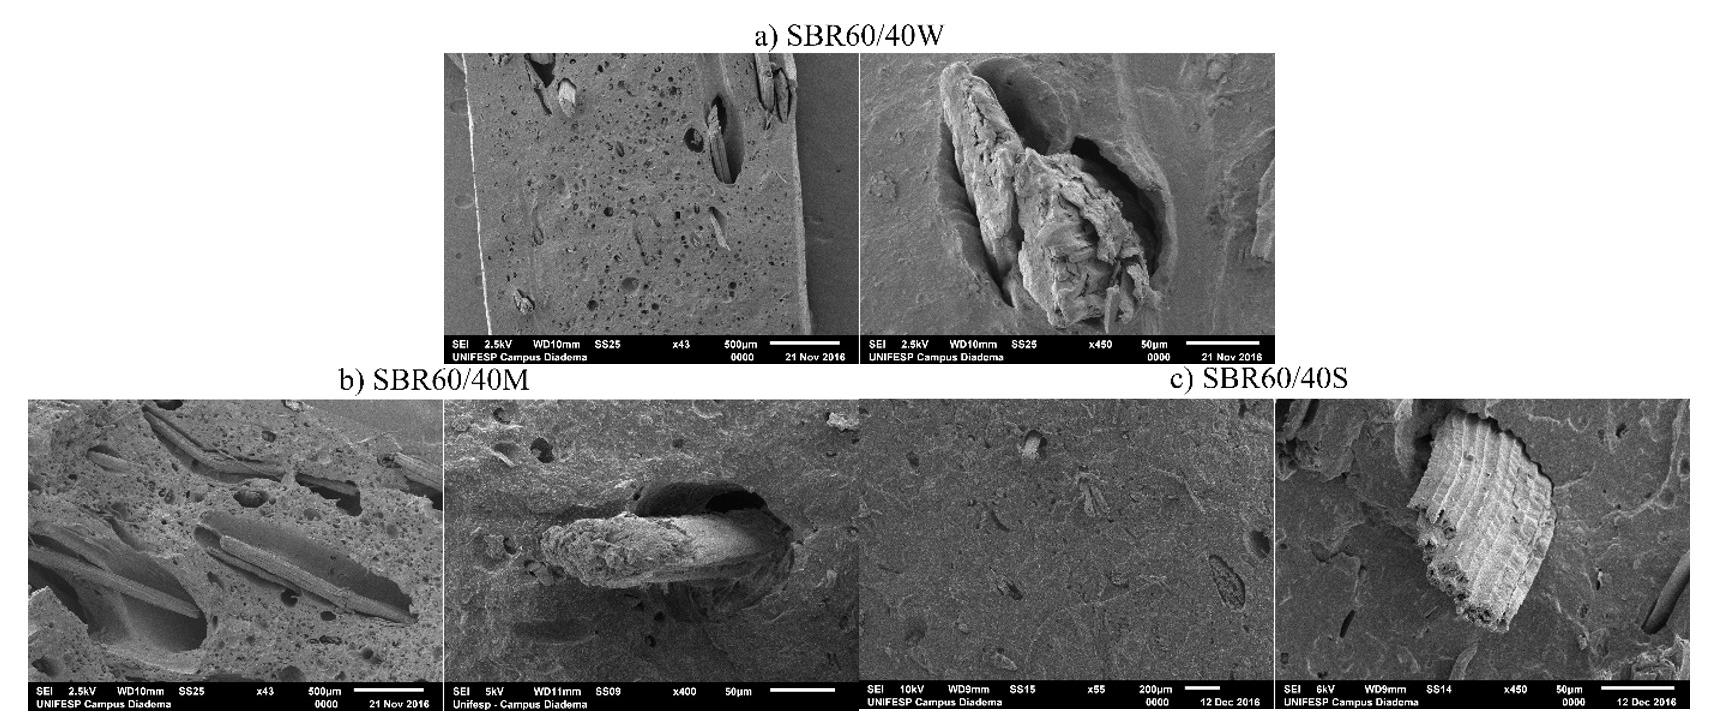
As observed in the SEM micrographs of the SBR/Sisal composites, the tensile results in Figure 7a for SSF showed no significant differences from the pure SBR compound. For WSF, a decrease in tensile results is observed. With only the partial removal of materials covering the surface of the sisal fiber through washing, it was not enough for the fibers to act as reinforcement in the composite. As observed in SEM micrographs, MSF exhibited interaction with the rubber matrix. Thus, lower tensile strength was obtained. For SSF, using silanes resulted in more significant fibermatrix interaction than other treatments.
Composites incorporated only with MSF reduce the elongation at break, as shown in Table 5 and Figure 7b
R.
Incorporating poorly adhering fillers into a rubber matrix disrupts chain alignment. These results in weaker interfacial regions between the filler surface and the rubber matrix, as seen in SEM micrographs (Figure 6b). Fractures at lower elongation can occur due to cracks traveling quickly through weaker interfacial areas[19,25,44,45,47]
Stresses were determined at different elongations to understand the evolution of deformation resistance of the SBR compound in the presence of SF upon loading. Figure 8 shows the M100, M200, and stress at 300% (M300) over different treated sisal fibers. Adding rigid and stiff particle fillers increases the composites’ modulus by restricting the polymer molecules’ movement.
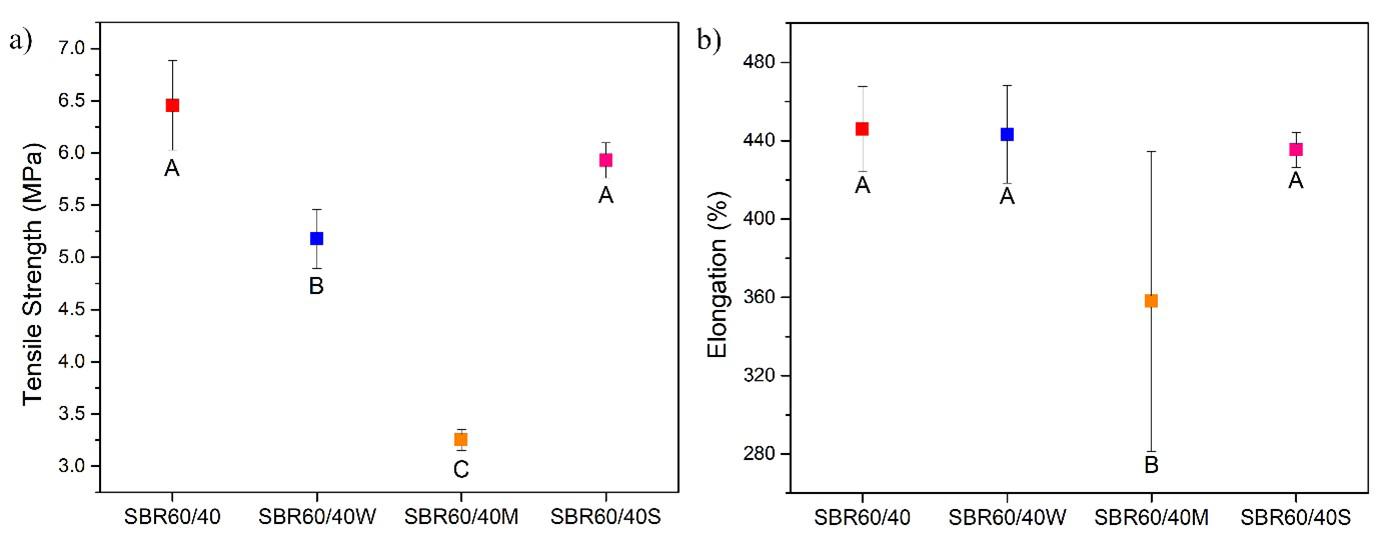
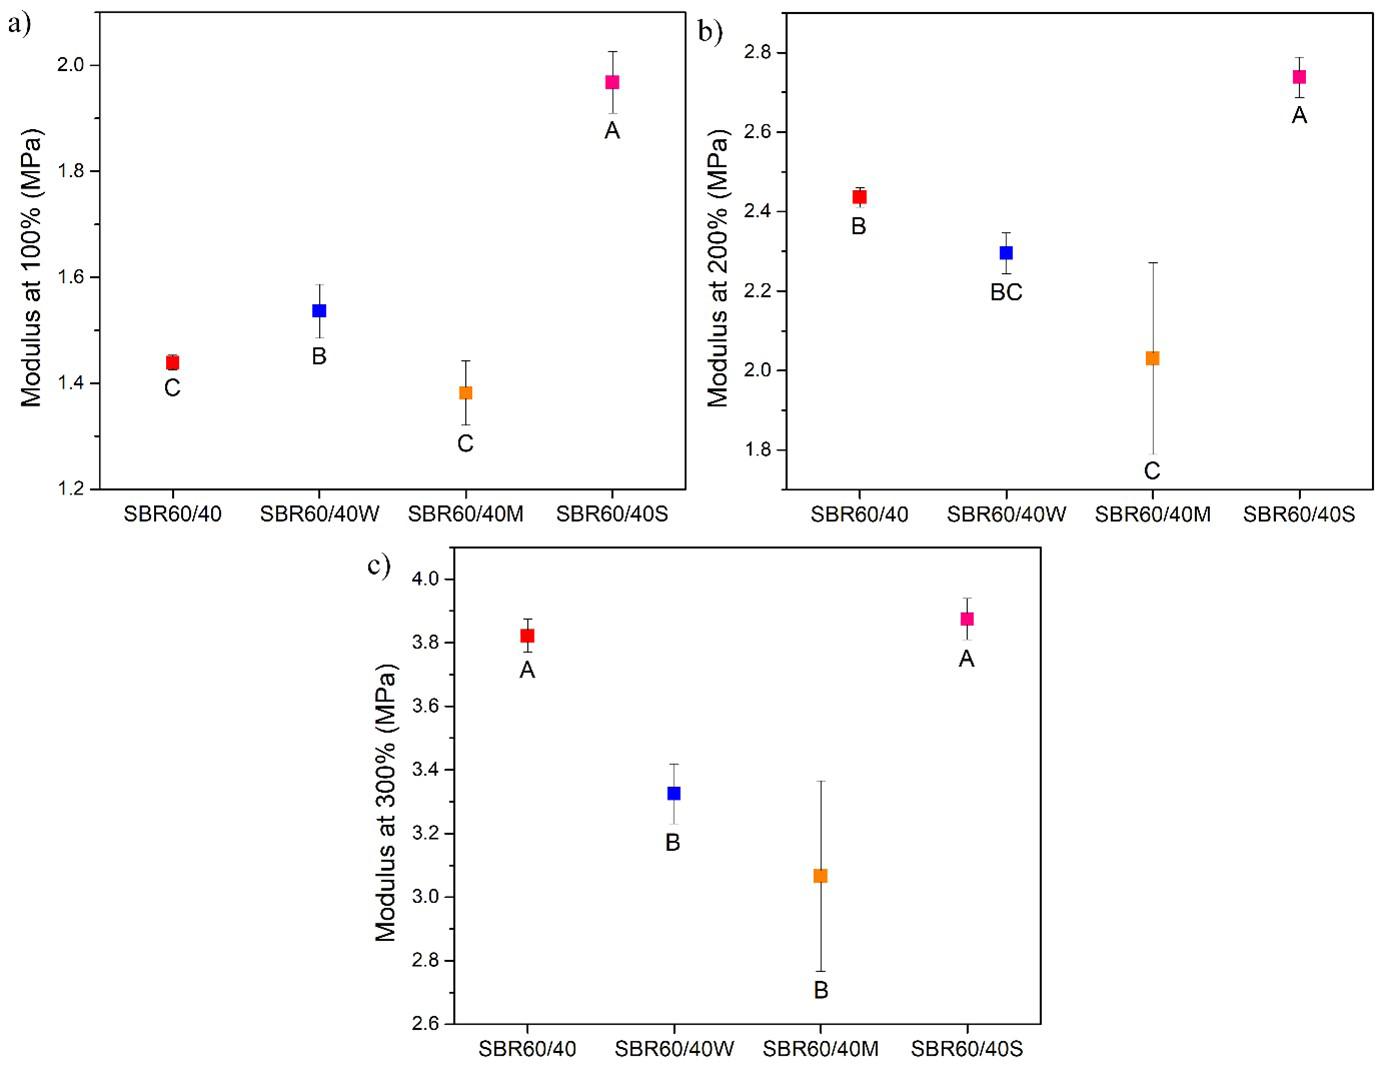
Sustainable styrene-butadiene composites with sisal fiber and rubber waste from footwear
Modulus is influenced by surface reactivity, aggregation, particle size and shape, structure, and particle dispersion in rubber[42,44]. This effect is only observed by SBR60/40S, in which the modulus was markedly increased compared to pure SBR and other SBR/Sisal composites. Also, it could be due to the increase in the cross-link density observed in the rheological tests in the presence of the signalized sisal fibers.
Understanding the influence of fibers on the hardness of the final material is essential for the footwear industry, as hardness directly affects the perceived comfort of footwear[48] The addition of sisal fibers increases the hardness of the composite by restricting the mobility of rubber chains, resulting in a more rigid material structure. Hardness is closely related to elastic modulus; therefore, an increase in hardness is expected, as cellulose particles have a higher modulus than the rubber matrix[44,45]. In general, the density of vegetable fibers is lower compared to rubber. Depending on the volume of a fraction of the fibers, the composite’s overall density may decrease when added to the rubber matrix. However, as observed in the SEM micrographs (Figure 6), the sisal fibers in the rubber matrix can influence the expansion process during the thermal degradation of the blowing agent azodicarbonamide. Composites containing SSF exhibited fewer pores than those with other treated fibers, which may be attributed to the increased material density. Previous studies on sisal and wood flour have reported that silane treatments can enhance hardness[49 50] Accordingly, the improved interfacial adhesion between the fiber and the rubber matrix, as evident in the SEM micrographs, likely facilitates more efficient stress transfer, contributing to increased hardness and elastic modulus in the SSF reinforced composites.
Regarding the mechanical properties of the composites, tensile strength, elongation at break, and modulus, the Tukey test revealed significant differences among all fiber-reinforced formulations, except for the SSF composite. Despite the known incompatibility between vegetal fibers and the SBR matrix, silanization treatment improved interfacial adhesion. This allowed the treated sisal fiber composites to achieve mechanical performance comparable to the reference while demonstrating a notably higher modulus at 100%.
A formulation of the SBR compound was successfully developed by efficiently utilizing and incorporating SBR waste. Formulation modifications determined by the content of two types of SBR significantly affect the compound’s final properties. Lower styrene concentrations in the rubber result in a reduced vulcanization time.
After being incorporated into the SBR matrix, the silanization treatment was only applied to sisal fibers, resulting in better mechanical performance. Compared to the pure SBR compound, silanized sisal fiber composites displayed a greater modulus at 100 and 200%. The presence of the fibers also increases the composite’s hardness.
This study underscores the considerable potential of sisal fibers in developing sustainable composites. Combining SBR waste from the footwear industry with this renewable material, which holds significant social and economic value, can pave the way for innovative and eco-friendly products.
These composites can meet industry demands and transform the sector through adjustments to the formulation and treatment of the fibers. Future research will aim to increase fiber concentration and optimize the composition to enhance their application in footwear.
• Conceptualization – Alexandre Oka Thomaz Cordeiro; Cristiane Reis Martins.
• Data curation – Alexandre Oka Thomaz Cordeiro; Cristiane Reis Martins.
• Formal analysis – Alexandre Oka Thomaz Cordeiro; Cristiane Reis Martins.
• Funding acquisition – Cristiane Reis Martins.
• Investigation – Alexandre Oka Thomaz Cordeiro; Cristiane Reis Martins.
• Methodology – Alexandre Oka Thomaz Cordeiro; Marcelo Eduardo da Silva; Cristiane Reis Martins.
• Project administration – Cristiane Reis Martins.
• Resources – Cristiane Reis Martins.
• Software – NA.
• Supervision – Cristiane Reis Martins.
• Validation – Alexandre Oka Thomaz Cordeiro; Cristiane Reis Martins.
• Visualization – Alexandre Oka Thomaz Cordeiro; Cristiane Reis Martins.
• Writing – original draft – Alexandre Oka Thomaz Cordeiro; Cristiane Reis Martins.
• Writing – review & editing – Alexandre Oka Thomaz Cordeiro; Marcelo Eduardo da Silva; Cristiane Reis Martins.
The authors thank Alpargatas S.A., Hamilton Rios Ind. Com. e Exp., Flexlab Consultoria e Treinamento Ltda, and Centro de Equipamentos e Serviços Multiusuários (CESMICAQF) at UNIFESP, Diadema Campus.
1 Abreu, C. S., & Silva, A. P. (2024). Improving the circular economy in the footwear industry. European Journal of Materials Science and Engineering, 9(3), 175-182 http://doi. org/10.36868/ejmse.2024.09.03.175
2 Elayaraja, K., & Kumar, M. V. (2024). Innovations in non-leather footwear design and development. International Journal of Research Publication and Reviews, 5(6), 5975-5978. Retrieved in 2025, February 26, from https://ijrpr.com/uploads/V5ISSUE6/ IJRPR30510.pdf
3 Specht, I. R., Froehlich, C., Bondan, J., & Nodari, C. H. (2024). Frugal innovation and sustainability in the footwear sector. Revista de Administração Contemporânea, 28(3), e230228 http://doi.org/10.1590/1982-7849rac2024230228.en.
4 Asabuwa Ngwabebhoh, F., Saha, N., Saha, T., & Saha, P. (2022). Bio-innovation of new-generation nonwoven natural fibrous materials for the footwear industry: current state-of-the-art and sustainability panorama. Journal of Natural Fibers, 19(13), 4897-4907 http://doi.org/10.1080/15440478.2020.1870635
Cordeiro, A. O. T., Silva, M. E., & Martins, C. R.
5 Munny, A. A., Ali, S. M., Kabir, G., Moktadir, M. A., Rahman, T., & Mahtab, Z. (2019). Enablers of social sustainability in the supply chain: an example of footwear industry from an emerging economy. Sustainable Production and Consumption, 20, 230-242 http://doi.org/10.1016/j.spc.2019.07.003
6. Conti, T. M., Catto, A. L., & Amico, S. C. (2022). Composite for insole shoe assembly based on polyvinyl acetate and polyester fabric waste from the footwear industry. Polymer Composites, 43(10), 7360-7371 http://doi.org/10.1002/pc.26813
7. Ferreira, C. A., Serrano, C. L. R., & Kuyven, P. S. (2011). Use of analysis of variance and linear regression as a prediction tool for mechanical performance of SBR. Plastics, Rubber and Composites, 40(1), 40-45 http://doi.org/10.1179/17432 8911X12940139029329
8 Pikoń, K., Poranek, N., Marczak, M., Łaźniewska-Piekarczyk, B., & Ścierski, W. (2024). Raw and pre-treated styrene butadiene rubber (SBR) dust as a partial replacement for natural sand in mortars. Materials (Basel), 17(2), 441 http://doi.org/10.3390/ ma17020441 PMid:38255609.
9 Van Rensburg, M. L., Nkomo, S. L., & Mkhize, N. M. (2020). Life cycle and end-of-life management options in the footwear industry: a review. Waste Management & Research, 38(6), 599-613 http://doi.org/10.1177/0734242X20908938 PMid:32181706.
10. Bashpa, P., Bijudas, K., Dileep, P., Elanthikkal, S., & Francis, T. (2022). Reutilization of polyurethane-based shoe sole scrap as a reinforcing filler in natural rubber for the development of high-performance composites. Journal of Elastomers and Plastics, 54(6), 1040-1060. http://doi.org/10.1177/00952443221108514.
11 Alves, L. M. F., Luna, C. B. B., Costa, A. R. M., Ferreira, E. S. B., Nascimento, E. P., & Araújo, E. M. (2024). Toward the reuse of styrene–butadiene (SBRr) waste from the shoes industry: Production and compatibilization of BioPE/SBRr blends. Polymer Bulletin, 81(11), 10311-10336 http://doi. org/10.1007/s00289-024-05181-5
12. Marsura, G., Bahú, J. O., Tovar, L. P., Fernandez-Felisbino, R., & Gomes, E. L. (2024). Recycled PVC to eco-friendly materials for footwear industry: process and mechanical properties. Polímeros: Ciência e Tecnologia, 34(4), e20240040 http://doi.org/10.1590/0104-1428.20240064.
13 Pereira, D. C., Farias, L. A., Perazzo, B. N., & Torres, M. S. (2014). Light cementitious composites with wastes from the footwear industry. Key Engineering Materials, 600, 648-656 http://doi.org/10.4028/www.scientific.net/KEM.600.648
14 Sobrinho, E. D. M., Ferreira, E. S. B., Silva, F. U., Bezerra, E. B., Wellen, R. M. R., Araújo, E. M., & Luna, C. B. B. (2024). From waste to Styrene–Butadiene (SBR) reuse: developing PP/SBR/SEP mixtures with carbon nanotubes for antistatic application. Polymers, 16(17), 2542 http://doi.org/10.3390/ polym16172542 PMid:39274174.
15 Kohan, L., Martins, C. R., Duarte, L. O., Pinheiro, L., & Baruque-Ramos, J. (2019). Panorama of natural fibers applied in Brazilian footwear: materials and market. SN Applied Sciences, 1(8), 895 http://doi.org/10.1007/s42452-019-0927-0
16 Lozada, E. R., Aguilar, C. M. G., Carvalho, J. A. J., Sánchez, J. C., & Torres, G. B. (2023). Vegetable cellulose fibers in natural rubber composites. Polymers , 15 (13 ), 2914 http://doi.org/10.3390/polym15132914. PMid:37447558.
17 Pereira, P. H. F., Rosa, M. F., Cioffi, M. O. H., Benini, K. C. C. C., Milanese, A. C., Voorwald, H. J. C., & Mulinari, D. R. (2015). Vegetal fibers in polymeric composites: a review. Polímeros: Ciência e Tecnologia, 25(1), 9-22 http://doi. org/10.1590/0104-1428.1722
18 Prashanth, S., Subbaya, K. M., Nithin, K., & Sachhidananda, S. (2017). Fiber reinforced composites – A review. Journal of Marine Science and Engineering, 6(3), 341 http://doi. org/10.4172/2169-0022.1000341
19 Lopes, F. F. M., Araújo, G. T., Nascimento, J. W. B., Gadelha, T. S., & Silva, V. R. (2010). Estudo dos efeitos da acetilação em fibras de sisal. Revista Brasileira de Engenharia Agrícola e Ambiental, 14(7), 783-788 http://doi.org/10.1590/S141543662010000700015
20. Pappu, A., Saxena, M., Thakur, V. K., Sharma, A., & Haque, R. (2016). Facile extraction, processing, and characterization of biorenewable sisal fibers for multifunctional applications. Journal of Macromolecular Science, Part A: Pure and Applied Chemistry, 53(7), 424-432. http://doi.org/10.1080/10601325. 2016.1176443
21 Jacob, M., Thomas, S., & Varughese, K. T. (2006). Novel woven sisal fabric reinforced natural rubber composites: tensile and swelling characteristics. Journal of Composite Materials, 40(16), 1471-1485 http://doi.org/10.1177/0021998306059731
22 Iozzi, M. A., Martins, G. S., Martins, M. A., Ferreira, F. C., Job, A. E., & Mattoso, L. H. C. (2010). Estudo da influência de tratamentos químicos da fibra de sisal nas propriedades de compósitos com borracha nitrílica. Polímeros: Ciência e Tecnologia, 20(1), 25-32 http://doi.org/10.1590/S010414282010005000003.
23 Martin, A. R., Martins, M. A., Mattoso, L. H. C., & Silva, O. R. R. F. (2009). Caracterização química e estrutural de fibra de sisal da variedade Agave sisalana Polímeros: Ciência e Tecnologia, 19(1), 40-46 http://doi.org/10.1590/S0104-14282009000100011
24 Prasantha Kumar, R., Manikandan Nair, K. C., Thomas, S., Schit, S. C., & Ramamurthy, K. (2000). Morphology and melt rheological behaviour of short-sisal-fibre-reinforced SBR composites. Composites Science and Technology, 60(9), 1737-1751 http://doi.org/10.1016/S0266-3538(00)00057-9
25 Li, Y., Mai, Y.-W., & Ye, L. (2000). Sisal fiber and its composites: A review of recent developments. Composites Science and Technology, 60(11), 2037-2055 http://doi.org/10.1016/S02663538(00)00101-9
26. John, M. J., & Anandjiwala, R. D. (2008). Recent developments in chemical modification and characterization of natural fiberreinforced composites. Polymer Composites, 29(2), 187-207 http://doi.org/10.1002/pc.20461
27 Roy, K., Debnath, S. C., Pongwisuthiruchte, A., & Potiyaraj, P. (2021). Recent advances of natural fibers based green rubber composites: properties, current status, and future perspectives. Journal of Applied Polymer Science, 138(35), 50866 http:// doi.org/10.1002/app.50866
28 Chandrasekar, M., Ishak, M. R., Sapuan, S. M., Leman, Z., & Jawaid, M. (2017). A review on the characterisation of natural fibres and their composites after alkali treatment and water absorption. Plastics, Rubber and Composites, 46(3), 119-136 http://doi.org/10.1080/14658011.2017.1298550
29 Ma, L., He, H., Jiang, C., Zhou, L., Luo, Y., & Jia, D. (2012). Effect of alkali treatment on structure and mechanical properties of acrylonitrile-butadiene-styrene/bamboo fiber composites. Journal of Macromolecular Science, Part B: Physics, 51(11), 2232-2244 http://doi.org/10.1080/00222348.2012.669688
30 Li, X., Tabil, L. G., & Panigrahi, S. (2007). Chemical treatments of natural fiber for use in natural fiber-reinforced composites: a review. Journal of Polymers and the Environment, 15(1), 25-33. http://doi.org/10.1007/s10924-006-0042-3.
31 Mani, P., & Satyanarayana, K. G. (1990). Effects of the surface treatments of lignocellulosic fibers on their debonding stress. Journal of Adhesion Science and Technology, 4(1), 17-24 http://doi.org/10.1163/156856190X00036
32 Srisuwan, S., Prasoetsopha, N., Suppakarn, N., & Chumsamrong, P. (2014). The effects of alkalized and silanized woven sisal fibers on mechanical properties of natural rubber modified epoxy resin. Energy Procedia, 56, 19-25 http://doi.org/10.1016/j. egypro.2014.07.127
Sustainable styrene-butadiene composites with sisal fiber and rubber waste from footwear
33 Iozzi, M. A., Martins, M. A., & Mattoso, L. H. C. (2004). Propriedades de compósitos híbridos de borracha nitrílica, fibras de sisal e carbonato de cálcio. Polímeros: Ciência e Tecnologia, 14(2), 93-98 http://doi.org/10.1590/S0104-14282004000200012
34. Lima, P. R. L., Santos, R. J., Ferreira, S. R., & Toledo, R. D., Fo. (2013). Characterization and treatment of sisal fiber residues for cement-based composite application. Engenharia Agrícola, 34(5), 812-825 http://doi.org/10.1590/S010069162014000500002
35. Xie, Y., Hill, C. A. S., Xiao, Z., Militz, H., & Mai, C. (2010). Silane coupling agents used for natural fiber/polymer composites: a review. Composites. Part A, Applied Science and Manufacturing, 41(7), 806-819. http://doi.org/10.1016/j. compositesa.2010.03.005
36 Rong, M. Z., Zhang, M. Q., Liu, Y., Yang, G. C., & Zeng, H. M. (2001). The effect of fiber treatment on the mechanical properties of unidirectional sisal-reinforced epoxy composites. Composites Science and Technology, 61(10), 1437-1447 http://doi.org/10.1016/S0266-3538(01)00046-X
37 Sreekumar, P. A., Saiah, R., Saiter, J. M., Leblanc, N., Joseph, K., Unnikrishnan, G., & Thomas, S. (2008). Thermal behavior of chemically treated and untreated sisal fiber reinforced composites fabricated by resin transfer molding. Composite Interfaces, 15(6), 629-650 http://doi.org/10.1163/156855408785971317
38 Bledzki, A. K., & Gassan, J. (1999). Composites reinforced with cellulose based fibres. Progress in Polymer Science, 24(2), 221-274 http://doi.org/10.1016/S0079-6700(98)00018-5
39 Rajkumar, S., Tjong, J., Nayak, S. K., & Sain, M. (2015). Wetting behavior of soy-based resin and unsaturated polyester on surfacemodified sisal fiber mat. Journal of Reinforced Plastics and Composites, 34(10), 807-818 http://doi.org/10.1177/0731684415580630
40 Bledzki, A. K., Reihmane, S., & Gassan, J. (1996). Properties and modification methods for vegetable fibers for natural fiber composites. Journal of Applied Polymer Science, 59 ( 8 ), 1329 - 1336 http://doi.org/10.1002/(SICI)10974628(19960222)59:8<1329::AID-APP17>3.0.CO;2-0
41 Satyanarayana, K. G., Sukumaran, K., Mukherjee, P. S., Pavithran, C., & Piuai, S. G. K. (1990). Natural fibre-polymer composites. Cement and Concrete Composites, 12(2), 117-136 http://doi.org/10.1016/0958-9465(90)90049-4
42 Abdelsalam, A. A., Araby, S., El-Sabbagh, S. H., Abdelmoneim, A., & Hassan, M. A. (2021). A comparative study on mechanical and rheological properties of ternary rubber blends. Polymers & Polymer Composites, 29(1), 15-28 http://doi.org/10.1177/0967391119897177
43 Charoeythornkhajhornchai, P., Samthong, C., Boonkerd, K., & Somwangthanaroj, A. (2017). Effect of azodicarbonamide on microstructure, cure kinetics and physical properties of natural rubber foam. Journal of Cellular Plastics, 53(3), 287-303. http://doi.org/10.1177/0021955X16652101.
44 Haghighat, M., Zadhoush, A., & Nouri Khorasani, S. (2005). Physicomechanical properties of α-cellulose-filled styrenebutadiene rubber composites. Journal of Applied Polymer Science, 96(6), 2203-2211 http://doi.org/10.1002/app.21691
45 Meissner, N., & Rzymski, W. M. (2013). Use of short fibers as a filler in rubber compounds. AUTEX Research Journal, 13(2), 40-43 http://doi.org/10.2478/v10304-012-0025-5
46 Bosselmann, S., Frank, T., Wieltzka, M., & Ortmaier, T. (2018). Optimization of process parameters for rubber curing in relation to vulcanization requirements and energy consumption. In Proceedings of the 2018 IEEE/ASME International Conference on Advanced Intelligent Mechatronics (AIM) (pp. 804-809). USA: IEEE. http://doi.org/10.1109/AIM.2018.8452354.
47 Martins, M. A., & Mattoso, L. H. C. (2004). Short sisal fiberreinforced tire rubber composites: dynamic and mechanical properties. Journal of Applied Polymer Science, 91(1), 670-677 http://doi.org/10.1002/app.13210
48 Papagiannis, P., Koutkalaki, Z., Azariadis, P., & Papanikos, P. (2016). Definition and evaluation of plantar mechanical comfort for the support of footwear design. Computer-Aided Design and Applications, 13(2), 162-172 http://doi.org/10.1 080/16864360.2015.1084189
49 Buitrago, O., Palacio, O., & Delgado, E. (2017). Evaluation of silanes in SBR 1502/Telinne monspessulana flour composites. Polímeros: Ciência e Tecnologia, 27(2), 116-121 http://doi. org/10.1590/0104-1428.2206.
50 Changjie, Y., Zhang, Q., Junwei, G., Junping, Z., Youqiang, S., & Yuhang, W. (2011). Cure characteristics and mechanical properties of styrene-butadiene rubber/hydrogenated acrylonitrile-butadiene rubber/silica composites. Journal of Polymer Research, 18(6), 2487-2494 http://doi.org/10.1007/ s10965-011-9670-y
Received: Feb. 26, 2025
Revised: May 07, 2025 Accepted: May 30, 2025
Associate Editor: Artur J. M. Valente
Traian Zaharescu1,2* , Ademar Benévolo Lugao2 , Heloísa Augusto Zen2 , Radu Mirea3 and Dorel Buncianu4*
1Centrul de Radiochimie, Institutul National de Cercetare, Dezvoltare pentru Inginerie Electrica, Bucharest, Romania
2Centro de Química e Meio Ambiente – CQMA, Instituto de Pesquisas Energéticas e Nucleares – IPEN, São Paulo, SP, Brasil
3Institutul National de Cercetare, Dezvoltare Turbomotoare, Bucharest, Romania
4Facultatea de Mecanica, Universitatea Politehnica din Timisoara, Timişoara, Romania *traian.zaharescu@icpe-ca.ro; dorel.buncianu@upt.ro
Obstract
This investigation presents a deep examination on the behavior of radiation effects on pristine (IIR) and halogenated butyl (IIR-Cl, IIR-Br) rubbers. The retrieving these materials is appropriately achieved by the radiolysis fragmentation of main chains that initiates the structural modifications based on the radiation susceptibilities of studied rubbers. The γ-irradiation process causes oxidation under air atmosphere and the effects are revealed by chemiluminescence and FTIR characterizations. The radiolysis on butyl rubbers is conducted onto a specific fragmentation, which allows the two antagonistic processes: oxidation and recombination. During the γ-radiolysis in rubbers is revealed the influence of the electronegativity possesed by the halogen atoms presented in polymer structures, determining the values of activation energy for their oxidative degradation. The γ-processing suggests an ecological procedure for an appropriate preparation of blends or for the recycling as composite products. The calculated activation energies place the polymers in the following stability order of IIR<IIR-Cl<IIR-Br.
Keywords: halogenated butyl rubber, irradiation, chemiluminescence, FTIR.
Data Ovailability: All data supporting the findings of this study are available from the corresponding author upon request.
How to cite: Zaharescu, T., Lugao, A. B., Zen, H. A., Mirea, R., & Buncianu, D. (2025). Sustainable recycling of butyl rubbers: an insight into the radiation processing. Polímeros: Ciência e Tecnologia, 35(3), e20250036. https://doi.org/10.1590/0104-1428.20240124
The radiation processing is a pertinent procedure through which various classes of polymers may be converted into useful industrial products with foreseen characteristics[1]
The large interest in the remaking rubbers as the flexible and resistant items is motivated by the stability degree of material, which concerns the foreseen aplications of materials under specific operation conditions. The main-chain degradation promoted by exposure to the high energy radiation as an accelerated protocol has functional characteristic that depicts the warranty level addressed to special usage[2,3]. Accordingly, the special attention of any customer is directed onto the class of rubbers, whose extensive application ranges cover the areas of material engineering, commodity, transport, medicine wear or food packaging. Their versatility is based on the presence of weaker bonds in the polymer backbones, which allows the effortless breaking and the formation of free radicals which can be capable to promote crosslinking[4]
The butyl rubbers, including the halogenated versions are susceptible to scission, because their molecules contain
unsaturated units, highly substituted carbon atoms and in some types polarizing atoms like chlorine or bromine atoms. The Figure 1 illustrates the molecular structure of raw rubber materials, which were studied in this work.
The modifications developed by the radiolysis of butyl rubbers were previously investigated[5-7] revealing the susceptivity to initiate the availability for their processing, but the energetic parameter were not quantified. The stability effects of weaker spots (quaternary carbon atoms, double bonds and halogenous substituents) are illustrated by the evaluation of degradation rates, the free volume and the accumulation of gel fraction.
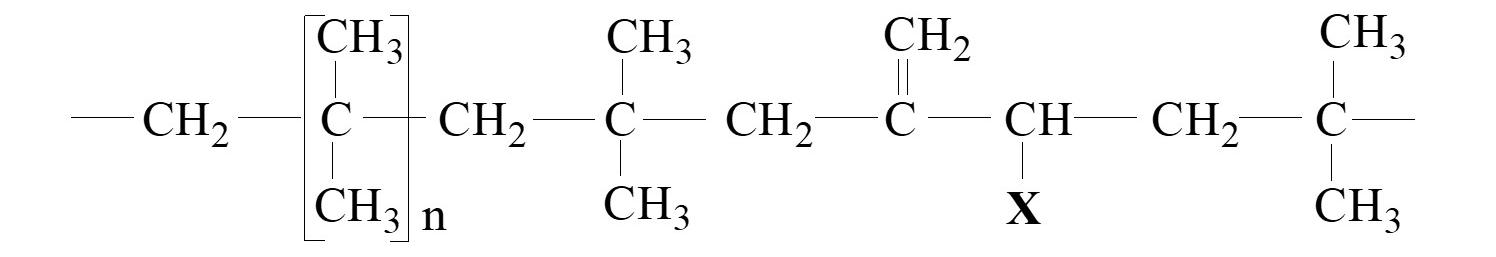
Figure 1. Molecular structure of halogenated butyl rubber. X = H (IIR); Cl (IIR-Cl); Br (IIR-Br).
Zaharescu, T., Lugao, A. B., Zen, H. A., Mirea, R., & Buncianu, D.
The progress of oxidation is obtained after the attaining certain threashold dose (100 kGy), when the degradation hinders crosslinking. The achieved properties of the radiolysed butyl rubbers are comparable with the sulfur cured materials at low doses, when the free radicals are decayed preferentially by recombination to each other. This behavior is the solution for the compatibilization of rubber with other polymers like polyethylene[8] and ethylene-propylene elastomer[9]. It was reported the successful radiation grafting of butyl acrylate and methyl methacrylate on the macromolecules of butyl rubber[10]. The decomposition of butyl rubber occurred during its exposure to the action of high energy radiation and to the addition of small organic on its skeleton[11] was envisaged, when the target of study was the explanation of the product behavior. However, this kind of energetic treatment is appropriate over low dose range, when the examination of morphology shows a local curing of polymer.
Nowadays, the conversion of used polymers into valuable products by radiation recycling can be achieved[12]. The polymer blends consisting of one component that provides a large amount of radicals feeding the material processing and the second component that becomes a scheleton on which the crosslinking is occurred are the best systems, where the transformations take efficiently place[13]. As this paper demonstrates, butyl rubbers are appropriate materials that are able to promote recycling[14] due to their susceptibility to the fragmentation under γ-irradiation followed by the building up of new crosslinked phase[15,16]. .Accordingly, the association of butyl rubbers with other more stable polymer affords the initiation of recycling based on the despeached property of the modeling into new structured materials.
The recycling of butyl rubbers can be accomplished by the radiation processing due to the free radicals generates by γ-exposure, when their mixture is able to be associated by grafting on other polymer backbones[17]. The electron beam processing at 70-100 kGy proves to be a valid method for the achieving optimal mechanical properties, when the regeneration of rubber wastes is under consideration[18]. While the early breaking of molecular chains is followed by the disproportion of intermediate radicals, this process generates unsaturation which becomes a new source of radicals[19]. This mechanism was previously reported for halogenated butyl rubber[5], when the ongoing effects of radiation are certain modifications involving the crosslinking by the formation of several intermolecular bridges. At higher dose, excceding 100 kGy, the peroxidation of molecules on the α-position in respect with the initial double bond is followed by scission and, consequently, alcohols and aldehydes are formed[20]
A significant application of butyl rubber is its usage in the manufacture of products destined to the cosmic space[21]. The Charlesby-Pinner representation discloses the main outcome of post-irradiation heating on the irradiated samples as a positive result, because it promotes the recombination of radicals instead of their oxidation. This treatment indicates the possibility to decelerate oxidative degradation and the increase of durability of irradiated polymer materials[22]
The decrease of degradation rates of irradiated rubbers can be reached by the addition of stable fillers in their producer formulations, like graphene oxide[23,24], which acts as an efficient scavenger hindering the progress of material deterioration[25]. The radiation protection can be
achieved, when the degrading polymer follows a radical mechanism. It demonstrates that the scavenging action during the migration of intermediates radials into the free space of carbon layers promotes the progress of stability[26]
The technological support of radiation processing concerns the intimate compatibilization of components[27] , crosslinking[28], grafting[29], copolymerization[30]. The basic concept is the generation of radicals, which are able to participate at the reconstruction of a new polymer structure. This recombination step defines the availability of raw material for the increase of stability. Simultaneously, the oxidation must be hindered. The radiation treatment ensures the fragmentation of initial macromolecules without other simultaneous processes that decrease the efficiency of reassambling.
The present paper presents the behavior of butyl rubber samples as raw halogenated structures. The presented results can be used for the preparation and characterization of various formulations for sealing materials, food packaging and medical wear applications. The degradation experiments perfomed in this study provided a comparative evaluation of material strengths, when they are subjected to an intensive exposure to an accidental event or these materials are inserted in some formulations destined to radiation recycling.
2.1
The pristine materials were purchased by Exxon Mobile Chemicals, Machelen (Belgium) as the following grades: butyl rubber (IIR) – Butyl 268, chlorobutyl rubber (IIR-Cl) – chlorobutyl HT 1066 and bromobutyl rubber (IIR-Br) – bromobutyl 2222. These raw products were used as received, because the obtained results are addressesed to the interested industrial manufacturers.
2.2
The preparation of samples was carried separately out by the dissolution of rubbers in chloroform. Each series of samples containing one of the three specific solutions was poured into round aluminum caps. The dry and thin films with the weights around 3 μg are finaly obtained. These specimens were submitted to γ-processing in an irradiation machinery provides with 60Co source by the greatful aid of IPEN (Sao Paulo, Brazil); the exposures at 25, 50 and 100 kGy were achieved. The FTIR and CL investigations were carried on the non-irradiated; the irradiated samples show the existent differences between the polymers with similar structures. The stability characterization of material was carried out by chemiluminescence (CL) using LUMIPOL 3 spectrometer (Slovak Academy of Sciences, Bratislava, Slovakia). The both investigation methods, isothermal and nonisothermal CL measurements were applied. While the nonisothermal determintions were done at a heating rate of 5 °C min-1, the isothermal measurements were carried out at 160, 170 and 180 °C. The rate evidences between the recorded intensities emited by oxidized fragments and hydroperoxide content at any measurement stage is the key of the result interpretation from CL spectra. Figure 2 shows the basic reaction that illustrate the photon release from the reaction intermediates.
Sustainable recycling of butyl rubbers: an insight into the radiation processing
The complementary procedure of this study, infrared spectroscopy (FTIR), was also preferred for the evaluation of oxidation degrees. The device, JASCO 4200 (Japan), allowed to record the transmission spectra for the characterization of the accumulation of carbonyl compounds by the absorbance at 1720 cm-1
The radiation stability investigation of polymers involves the evaluation of the oxidation states characterized by the degradation level as well as the generation routes of final products[31,32]. The competition between the basic processes, scission and crosslinking[33] in the irradiated butyl rubbers configurates the material behavior determining the distribution of final products and the generation of certain structures in direct relation with the radiation resistance of processed substrate[3] .
In this paper, two complementary methods of the stability investigation are used due to their availability to the detailed introspection, high sensitivities, reliability of evidences[34,35].Thus, the progress of oxidation is described accurately and the results are rightly evaluated.
The accumulation of oxygen-containing final products occurs by the reactions of free radicals that are consumed during radiolysis. Figure 3 presents the evolution of transmission peak characterized by the formation of carbonyl functions for the three investigated butyl rubbers.
By the distinct evolutions of this peak it is possible to understand either the differenes that exist between the radiation resistance of rubbers or the various contributions of the further consumption reactions as the steps of oxidation mechanism. The order of stability is demonstrated by the hights and widths of these peaks. The presence of small shoulders indicates the complexity of carbonyl type structures, which consists of aldehyde, ketones, peracids[36].The increase of peak hights is the consequence of the fragmentation of backbones either on various molecular positions and the attack of oxygen on the radical head or on the disproportion intermediates. The contributions of halogen atoms on the degradation progress are designed by the peak widths for IIR-Cl and IIR-Br irradiated at 25 kGy,which are larger in comparison with the similar characteristic peak of IIR. At the the dose of 100 kGy, the brominated rubber presents the most advanced level of degradation indicated by the highest amounts of carbonyl structures, whose the proportional contributions to the peak formation also determine the shape of the degradation curves.
The accelerated oxidation induced by radiation exposure can be satisfactorily characterized by the photon emission counting, which are provided by the degrading polymer samples[37]. The formation of hydroperoxides according with the autooxidation scheme[38] takes place after the macromolecules scission and the deexcitation of triplet carbonyl allows their amount to be counted[39]. The increase of the degradation temperature of samples causes faster
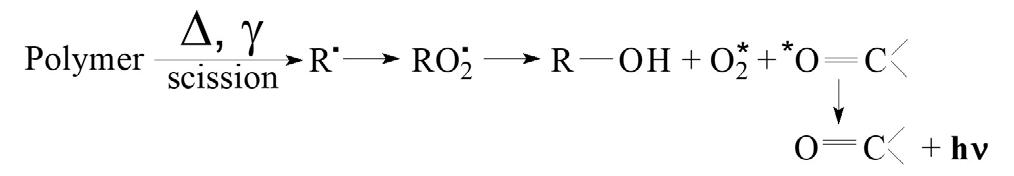
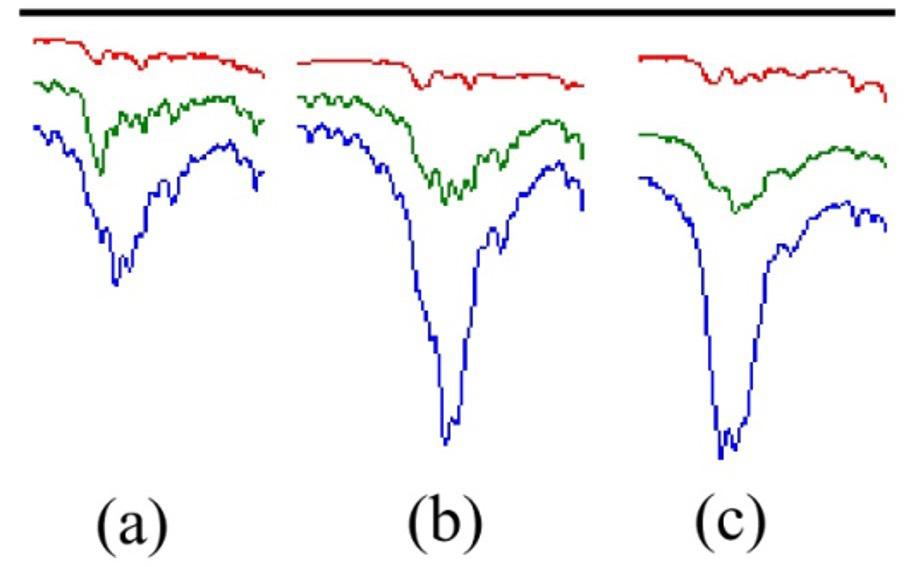
Figure 3. The transmission peaks at 1720 cm -1 for (a) IIR; (b) IIR-Cl; (c) IIR-Br. (upper line) 0 kGy; (middle line) 25 kGy; (lower line) 100 kGy.
oxidation, which starts after the attaining the characteristic values of onset oxidation temperatures (OOT). The structural deterioration causes a deacrease on the OOT values, because the presence of the higher amount of radicals reacting with oxygen determines a higher number of emitted photon. Figure 4 presents the nonisothermal CL spectra recorded at all applied irradiation doses.
The nonisothermal determinatons of material stability provide the functional details on the capacity of substrate to preserve the oxidation state when the operation temperature is increasing. The thermal evolution is related to the safeguard capacity of material by which the product can be properly used. In the present cases, the shapes of nonisothermal curves indicate which temperature is suitably selected for the processing material, when they are associates with other structures for the development of new caterial construction. The analysis of these spectral highlights suggests some specific features:
- these rubbers start their oxidation at high temperature, around 217-220 °C, when they are not γ-irradiated. It means that their oxidation reactions are not influenced by the presence of halogen atoms;
- the pristine butyl rubber is the most stable structure of studied polymers under the action of γ-rays. It presents the most less prominant oxidation peak at 100 °C, when the scission of backbones takes simultaneously place on different positions of the molecules;
- the bromine rubber is somewhat resistant at low radiation doses in comparison with chlorinated form due to its lower electronegativity. However, at 100 kGy the brominated rubber is stronger oxidized than the other two studied configurations, because the bond energy of C – Br is 276 kJ.mol-1, while the bonds C – Cl and C – H are characterized by the energies of 339 kJ.mol-1 and 413 kJ.mol-1, respectively[34];
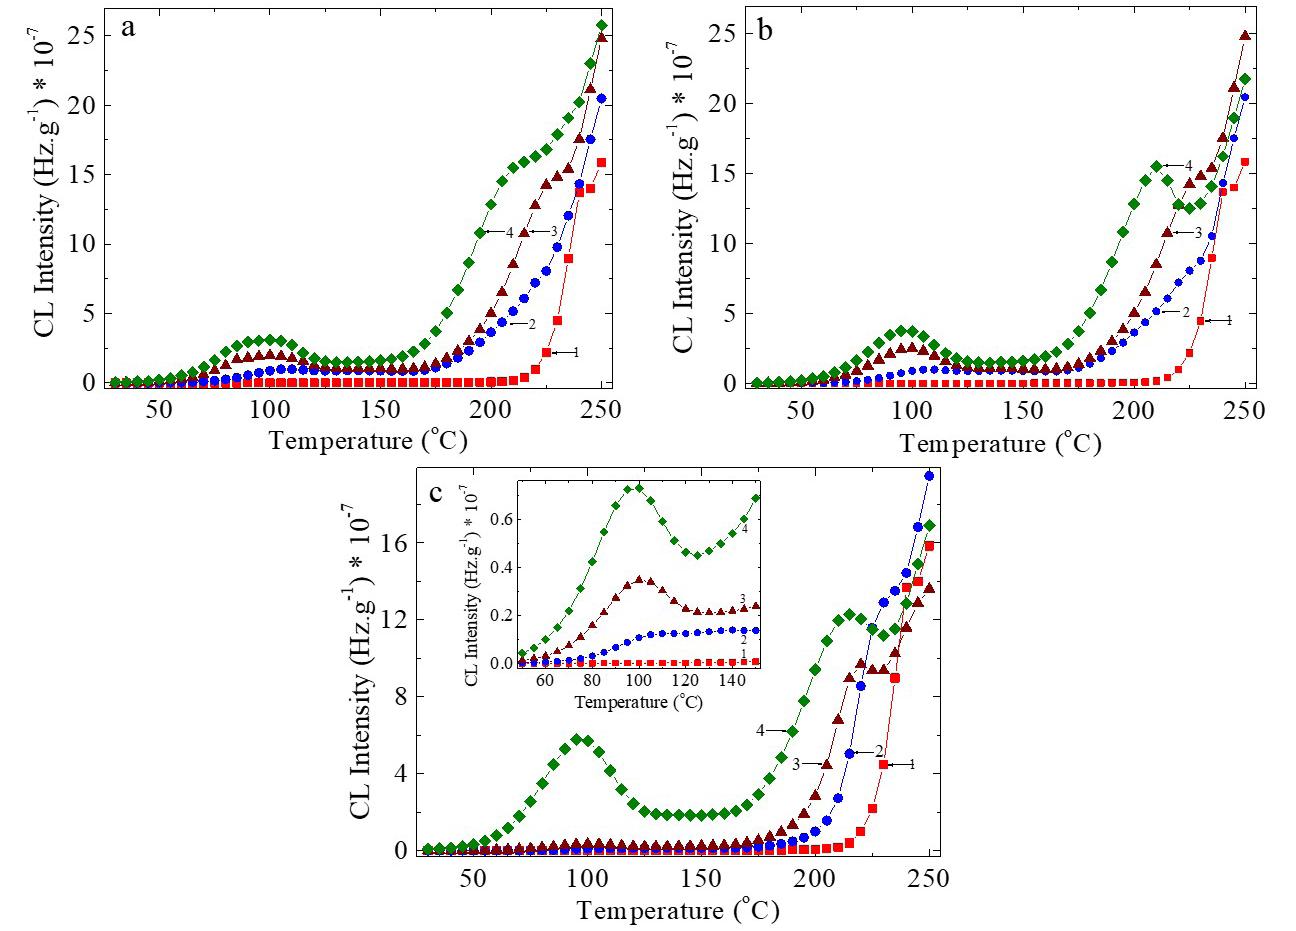
Dose: (1) 0 kGy, (2) 25 kGy, (3) 50 kGy, (4) 100 kGy.
- the general aspects of presented curves suggest that the initiation of degradation does not start by the breaking C – X bond. As it was reported earlyer[20] , the tautomery of double bonds makes possible to promote scission, because its localization on the backbones facilitates the scission;
- the increase in the processing dose shifts the initial oxidation peaks towards lower temperatures indicating an advanced sensitization of double bond and the acceleration of degradation.
The nonisothermal CL measurements demonstrate that the butyl rubbers can be process at lower temperatures, when these materials are the raw components for the manufacture of new structures by their compatibilization with other polymers[40 41] or in the presence of appropriate fillers[15 42] by radiation processing.
The isothermal CL curves allowed to identify the values of the oxidation induction time (OIT). These periods when the oxidation degree does not suffer any change are presented in Figure 5. The evolution of oxidation studied by isothermal CL measurements differs from one rubber to the other, the degradation rates being a basic criterium for comparison of polymer stabilities. The families of the isothermal CL spectra recorded on the three butyl rubber compounds are differently positioned, because these materials are unlikely oxidized. The butyl rubber samples (IIR) present certain OIT periods, that indicate their thermal stability even at medium exposure doses up to 50 kGy. The presence of halogen atoms drops down the radiation stability due to the contribution of breaking C – X bond.
The polymer instability at all processing doses is increased by the halogen atoms. In the case of IIR-Br irradiated at 50 kGy, an interesting aspect of the degradation may be emphasized. This sample presents a mimimum CL intensity after 22 min of degradation followed by an increase in the measured intensity. It may be ascribed to the further fragmentation of the free bromine intermediates. This feature is slightly emphasized by the irradiated IIR-Cl structures. It would be correct to assume that a part of halogenated molecules is not damaged and its contribution to the material degradation would appear later. The same behavior can be noticed in the case of IIR. In addition, the duration of degradation for irradiated IIR-Cl polymer is longer, because it progresses by the two scission ways: one route involves partially C – Cl bond breakand the other way is the decay of intermediates by the recombination and disproportination[42]. The results of isothermal measurements confirm the sequence of stabilities establishes on the nonisothermal determination data.
The isothermal CL determinations at three temperatures provide the value of oxidation induction time by the calculus of the activation energies (Ea) required for the thermal oxidation (Table 1). The Ea values are similar with the other reported results on polymers[43], whose degradation is propagated by the self-catalytic mechanism initiated by the diffused molecular oxygen[37]. The kinetic study carried out on IIR-Br[44] confirms the present results, which represent an evaluation of the ageing behavior during the radiation processing. These Ea values confirm the contribution of substituents to the structural stability, when the γ-exposure is applied for the material processing.
The preparation of butyl rubber blends and composites may be accomplished starting from the present stability information due to the inteactions between the minor components and polymer matrix[45]. The initiation of oxidation in hybrid compound based on the application of radiation processing is a convenient procedure to obtained new structures.
Sustainable recycling of butyl rubbers: an insight into the radiation processing
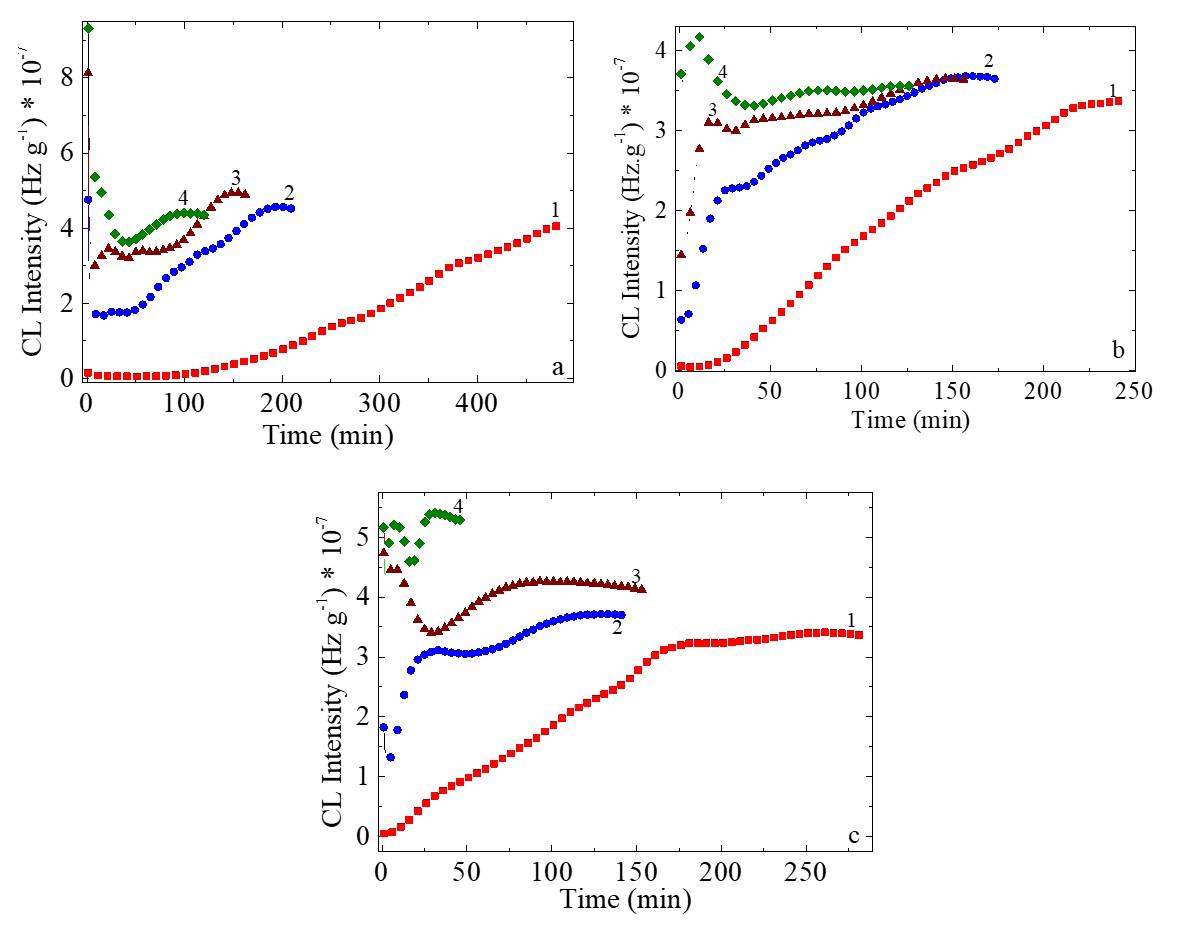
Figure 5. The isothermal CL spectra recorded on (a) IIR samples; (b) IIR-Cl sampels; (c) IIR-Br samples at 180°C. Irradiation doses: (1) 0 kGy; (2) 25 kGy; (3) 50 kGy; (4) 100 kGy.
Table 1. Activation energies for the degradation of the studies IIR structures.
Polymer
Correlation factor Activation energy (kJ mo1-1)
Irradiation dose: 0 kGy
A certain long term stability can be reached by the appropriate fillers, like metallic oxides[46] .
The radiation technologies applied to the butyl rubbers have received a special attention[7,11,16,47], because the application areas of these materials are extended on various technical articles, especially the manufacture of tires[47] . Due to several considerations less energetic consuming, the lack of wastes, the high processing volumes, the different versions of formulations, the easiness of manufacture by radiation exposure, the availabilities of various additive and fillers that ensure the high performances, the high energy irradiations by gamma and electron beams provide the desired quality of resulting materials with foreseen characteristics. After the irradiation of butyl and halobutyl rubbers may be successfully used in the compositions of other flexible rubber products due to the molecular fragmanation that causes a remarkable decrease in the viscosity of gamma or electron beam processed substrates.
The radiation exposure of three sorts of butyl rubber (pristine structure and chlorinated or brominated materials) show different thermal resistances that depend on their susceptivity to generate fragments. The FTIR investigation reveals the accumulation of carbonyl compound due to the reactions of intermediates radicals with diffused oxygen. This behavior differentiates the studied butyl rubbers placing then in the following stability sequence:
IIR > IIR-Cl > IIR-Br
The higher stability of chlorinated material in respect to the brominated one is explained taking into account their electronegativity difference. The nonisothermal CL analysis carried out for the characterization on the thermal stability of γ-irradiated rubbers points out the influence of irradiation doses that is responsible by the decrease in the
Zaharescu, T., Lugao, A. B., Zen, H. A., Mirea, R., & Buncianu, D.
values of onset oxidation temperature, as well as in the increase of the photoemission intensities characterizing the scission of the C – C bond in the vicinity of unsaturation of isobutylene segments. The isothermal chemiluminescence measurements allow to calculate the activation energies required photooxidative degradation of studied rubbers confirming the stability order previously established.
This paper provides the background information for the recycling of butyl rubber-based composites by radiation processing that may be produced for the manufacture of several sealing products with the foreseen elasticity and hardness. All the presented results are important for the evaluation of the contribution of butyl rubber components, when they are blended with other polymers, even though they are raw materials or wastes. The present results may be considered as the pertinent recommendations for the compatibilization of polymer mixtures under the action of high energy radiation due to the formation of active radicals by the breaking simultaneously occurredC – C, C – X and double bonds.
This study provides basic details for the manufacture of addition components in several rubbery materials for the decrease of their viscosity. The results present intrinsic value, because they are shown as a comparative analysis. The radiation processing of these butyl rubbers indicatesthe way, which may be followed, when a preirradiation treatment creates the reaction centers in the recycling technologies.
5. Author’s Contribution
• Conceptualization – Traian Zaharescu; Ademar Benévolo Lugao.
• Data curation – NA.
• Formal analysis – NA.
• Funding acquisition – Ademar Benévolo Lugao.
• Investigation – Traian Zaharescu; Ademar Benévolo Lugao; Heloisa Augusto Zen; Radu Mirea; Dorel Buncianu.
• Methodology – Traian Zaharescu; Ademar Benévolo Lugao.
• Project administration – Traian Zaharescu; Ademar Benévolo Lugao.
• Resources – NA.
• Software – NA.
• Supervision – Traian Zaharescu.
• Validation – Heloisa Augusto Zen.
• Visualization – Radu Mirea; Dorel Buncianu.
• Writing – original draft – Traian Zaharescu; Ademar Benévolo Lugao.
• Writing – review & editing – Heloisa Augusto Zen; Radu Mirea; Dorel Buncianu.
The authors want to tkank FAPESP for the financial support by the grant 2024/11337-0, by which the presented experiments were possible.
1 Chmielewski, A. G. (2023). Radiation technology: the furure is today. Radiation Physics and Chemistry, 213, 111233 http://doi.org/10.1016/j.radphyschem.2023.111233
2 Celina, M., Linde, E., Brunson, D., Quintana, A., & Giron, N. (2019). Overview of accelerated ageing and polymr degradation kinetics for combined radiation-thermal encironments. Polymer Degradation & Stability, 166, 353-378 http://doi.org/10.1016/j. polymdegradstab.2019.06.007
3 Ferry, M., & Ngono, Y. (2021). Energy transfer in polymers submitted to ionizing radiation: A review. Radiation Physics and Chemistry, 180, 109320 http://doi.org/10.1016/j.radphyschem.2020.109320
4 Spadaro, G., Alessi, S., & Dispenza, C. (2017). Ionizing radiation-induced crosslinking and degradation of polymers. In Y. Sun, & A. Chielewski (Eds.), Application of ionizing radiation in material processing (pp. 167-182). Warsaw: Institute of Nuclear Chemistry and Technology.
5 Zaharescu, T., Postolache, C., & Giurginca, M. (1996). The structural changes in butyl and halogenated butyl elastomers during gamma irradiation. Journal of Applied Polymer Science, 59(6), 969-974. http://doi.org/10.1002/(SICI)10974628(19960207)59:6<969::AID-APP9>3.0.CO;2-N
6 Şen, M., Uzun, C., Kantoǧlu, Ö., Erdoǧan, S. M., Deniz, V., & Güven, O. (2003). Effect of gamma irradiation conditions on the radiation-induced degradation of isobutylene–isoprene rubber. Nuclear Instruments & Methods in Physics Research. Section B, Beam Interactions with Materials and Atoms, 208, 480-484 http://doi.org/10.1016/S0168-583X(03)01111-X
7. Scagliusi, S. R., Cardoso, E. C. L., & Lugao, A. B. (2012). Radiation-induced degradation of butyl rubber vulcanized by three different crosslinking systems. Radiation Physics and Chemistry, 81(8), 991-994 http://doi.org/10.1016/j.radphyschem.2012.01.011
8. Maziad, N. A., & Hassan, M. M. (2007). Study of some properties of waste LDPE/waste butyl rubber blends using different compatibilizing agents and gamma irradiation. Journal of Applied Polymer Science , 106(6), 4157-4163 http://doi.org/10.1002/app.26441
9 Stelescu, M. D., Airinei, A., Manaila, E., Craciun, G., Fifere, N., Varganici, C., Pamfil, D., & Doroftei, F. (2018). Effects of electron beam irradiation on the mechanical, thermal, and surface properties of some EPDM/butyl rubber composites. Polymers, 10(11), 1206. http://doi.org/10.3390/polym10111206. PMid:30961131.
10 Haldar, S. K., & Singha, N. K. (2006). Grafting of butyl acrylate and methyl methacrylate on butyl rubber using electron beam radiation. Journal of Applied Polymer Science, 101(3), 1340-1346 http://doi.org/10.1002/app.23005
11 Chen, H.-B., Wang, P.-C., Liu, B., Zhang, F.-S., & Ao, Y.-Y. (2018). Gamma radiation induced effects of butyl rubber based damping material. Radiation Physics and Chemistry, 145, 202-206 http://doi.org/10.1016/j.radphyschem.2017.11.001
12 Mészáros, L., Bárány, T., & Czvikovszky, T. (2012). EBpromoted recycling of waste tire rubber with polyolefins. Radiation Physics and Chemistry , 81 ( 9 ), 1357 - 1360 . http://doi.org/10.1016/j.radphyschem.2011.11.058
13 Zaharescu, T., Bumbac, M., Nicolescu, C. M., Stelescu, M. D., Borbath, T., & Borbath, I. (2025). Evaluation of γ-Irradiation Effects on EPDM/SBS Blends for Durability and Recycling Potential. Polymers, 17(10), 1314 http://doi.org/10.3390/ polym17101314 PMid:40430610.
14 Karmanova, O. V., Tikhomirov, S. G., Kayushnikov, S. N., Shashok, Z. S., & Polevoy, P. S. (2019). Obtaining and using of reclaimed butyl rubber with the use of ionizing radiation. Radiation Physics and Chemistry, 159, 154-158 http://doi.org/10.1016/j.radphyschem.2019.02.038
Sustainable recycling of butyl rubbers: an insight into the radiation processing
15 Karaağaç, B., Şen, M., Deniz, V., & Güven, O. (2007). Recycling of gamma irradiated inner tubes in butyl based rubber compounds. Nuclear Instruments & Methods in Physics Research. Section B, Beam Interactions with Materials and Atoms, 265(1), 290-293 http://doi.org/10.1016/j.nimb.2007.08.061
16. Scagliusi, S. R., Cardoso, E. L. C., Esper, F. J., Lugão, A. B., & Wiebeck, H. (2023). Study of mechanical properties of inner tubes exposed to gamma radiation. Polímeros: Ciência e Tecnologia, 33(2), e20230019 http://doi.org/10.1590/0104-1428.20220010
17. Telnov, A. V., Zavyalov, N. V., Khokhlov, Yu. A., Sitnikov, N. P., Smetanin, M. L., Tarantasov, V. P., Shadrin, D. N., Shorikov, I. V., Liakumovich, A. L., & Miryasova, F. K. (2002). Radiation degradation of spent butyl rubbers. Radiation Physics and Chemistry, 63(3-6), 245-248 http://doi.org/10.1016/S0969806X(01)00645-4
18 Molanorouzi, M., & Mohaved, S. O. (2016). Reclaiming waste tire rubber by an irradiation technique. Polymer Degradation & Stability, 128, 115-125 http://doi.org/10.1016/j. polymdegradstab.2016.03.009
19 Tikhomirov, S. G., Polevoy, P. P., Semenov, M. E., & Karmanov, A. V. (2019). Modeling of the destruction process of butyl rubber. Radiation Physics and Chemistry, 158, 205-208 http://doi.org/10.1016/j.radphyschem.2019.01.010
20. Singh, R. P., & Chandra, R. (1982). Ageing of butyl rubber by UV irradiation. Polymer Photochemistry, 2(4), 257-267 http://doi.org/10.1016/0144-2880(82)90019-7
21 Smith, M., Berlioz, S., & Chailan, J. F. (2013). Radiochemical ageing of butyl rubbers for space applications. Polymer Degradation & Stability, 98(2), 682-690 http://doi.org/10.1016/j. polymdegradstab.2012.10.013
22. Valencia, L. M., Hernández-Saz, J., Molina, S. I., & Herrera, M. (2024). Degradation of thermoplastic polymers for fused filament fabrication under (S)TEM electron beam irradiation. Polymer Degradation & Stability, 230, 111030 http://doi.org/10.1016/j.polymdegradstab.2024.111030.
23 Chinnasamy, S. , Rathanasamy, R. , Kumar, H. K. M. , Jeganathan, P. M., Palaniappan, S. K., & Pal, S. K. (2020). Reactive compatibilization effect of graphene oxide reinforced butylrubber nanocomposites. Polímeros: Ciência e Tecnologia, 30(3), e2020032 http://doi.org/10.1590/0104-1428.05920
24 Muradov, M., Baghirov, M. B., Eyvazova, G., Gahramanli, L. , Mammadyarova , S. , Aliyeva , G. , Huseynov, E. , & Abdullayev, M. (2023). Influence of gamma radiation on structure, morphology, and optical properties of GO and GO/ PVA nanocomposite. Radiation Physics and Chemistry, 208, 110926. http://doi.org/10.1016/j.radphyschem.2023.110926.
25 Harada, J., Marcondes, C. A., Arquinto, J., Pereira, M. C. C., & Silva, L. G. A. (2024). Evaluation of graphene incorporation for mechanical properties of polypropylene composites. Polímeros: Ciencia e Tecnologia, 34(3), e20240027 http://doi.org/10.1590/0104-1428.20240016
26 Xu, P., Lv, J., Guo, J., Hou, D., Zhang, L., Sun, Y., Li, R., & Li, C. (2023). Preparation of EPDM/silicon nanofibers-graphene nanocomposites with enhanced interfacial structure: highly reinforcing and stabilizing effect. Diamond and Related Materials, 140, 110564 http://doi.org/10.1016/j.diamond.2023.110564
27 Lazim, N. H., Shamsudin, S. A., & Hidzir, N. M. (2023). Mechanical and thermal studies on modified 50/50 natural rubber latex/poly(styrene-block-isoprene-block-styrene) blend by gamma irradiation and comparison with sulphur and peroxide vulcanization methods. Radiation Physics and Chemistry, 207, 110857 http://doi.org/10.1016/j.radphyschem.2023.110857
28 Yasin, T., Khan, S., Nho, Y.-C., & Ahmad, R. (2012). Effect of polyfunctional monomers on properties of radiation crosslinked EPDM/waste tire dust blend. Radiation Physics and Chemistry, 81(4), 421-425 http://doi.org/10.1016/j.radphyschem.2011.12.008
29 Kiss, L., Simon, D. Á., Bárány, T., & Mészáros, L. (2022). Synergistic effects of gamma pre-irradiation and additional vulcanizing agent in case of ground tire rubber containing vulcanizates. Radiation Physics and Chemistry, 201, 110414 http://doi.org/10.1016/j.radphyschem.2022.110414
30 Głuszewski , W. , Zagórski , Z. P. , & Rajkiewicz , M. (2014 ). Protective effects in radiation modification of elastomers. Radiation Physics and Chemistry, 105, 53-56 http://doi.org/10.1016/j.radphyschem.2014.06.024.
31 Alam, T. M., Celina, M., Assink, R. A., Clough, R. L., & Gillen, K. T. (2001). 17O NMR investigation of oxidative degradation in polymers under γ-irradiation. Radiation Physics and Chemistry, 60(1-2), 121-127 http://doi.org/10.1016/ S0969-806X(00)00314-5
32 Bernstein, R., Thornberg, S. M., Irwin, A. N., Hochrein, J. M., Derzon, D. K., Klamo, S. B., & Clough, R. L. (2008). Radiation–oxidation mechanisms: volatile organic degradation products from polypropylene having selective C-13 labeling studied by GC/MS. Polymer Degradation & Stability, 93(4), 854-870 http://doi.org/10.1016/j.polymdegradstab.2008.01.020
33 Tamada, M. (2018). Radiation processing of polymers and its applications. In H. Kado (Ed.), Radiation Applications (An Advanced Course in Nuclear Engineering, Vol. 7, pp. 63-80). Singapore: Springer http://doi.org/10.1007/978-981-10-7350-2_8
34 Khan, S. A., Khan, S. B., Khan, L. U., Farooq, A., Akhtar, K., & Asiri, A. M. (2018). Fourier transform infrared spectroscopy: Fundamentals and application in functional groups and nanomaterial characterization. In S. Sharma (Ed.), Handbook of material characterization (pp. 317-344). Springer Cham. http://doi.org/10.1007/978-3-319-92955-2_9
35 Zaharescu, T., & Jipa, S. (2013). Radiochemical modifications in polymers. In K. F. Arndt , & M. D. Lechner (Eds.), Landolt-Börnstein: Numerical data and functional relationships in science and technology - New Series (Vol. 6, Subvol. A, Part 1, pp. 93-184). Berlin: Springer
36 Camara, S., Gilbert, B. C., Meier, R. J., Van Duin, M., & Whitwood, A. C. (2006). EPR studies of peroxide decomposition, radical formation and reactions relevant to cross-linking and grafting in polyolefins. Polymer, 47(13), 4683-4693 http://doi.org/10.1016/j.polymer.2006.04.015
37 Jozef, R., Lyda, R., Igor, N., Vladimír, V., Jozef, P., Ivica, J., & Ivan, C. (2020). Thermooxidative stability of hot melt adhesives based on metallocene polyolefins grafted with polar acrylic acid moieties. Polymer Testing, 85, 106422 http://doi.org/10.1016/j.polymertesting.2020.106422
38 Bolland, J. L., & Gee, G. (1946). Kinetic study in the chemistryof rubber and related materials. III. Thermochemistry and mechanism of olefin oxidation. Transactions of the Faraday Society, 42, 244-250 http://doi.org/10.1039/tf9464200244
39 Dean, J. A. (1999). Properties of atoms, radicals and bonds. In J. A. Dean (Ed.), Lange’s Handbook of chemistry (pp. 4.1-4.84). Columbus: McGraw-Hill
40 Aoshuang, Y., Zhengtao, G., Li, L., Ying, Z., & Peng, Z. (2002). The mechanical properties of radiation-vulcanized NR/BR blending system. Radiation Physics and Chemistry, 63(3-6), 497-500 http://doi.org/10.1016/S0969-806X(01)00634-X
41 Saif, M. J., Naveed, M., Asif, H. M., & Akhtar, R. (2018). Irradiation applications for polymer nano-composites: a state-ofthe-art review. Journal of Industrial and Engineering Chemistry, 60, 218-236 http://doi.org/10.1016/j.jiec.2017.11.009
42. Das, P., & Tiwari, P. (2017). Thermal degradation kinetics of plastics and model selection. Thermochimica Acta, 654, 191-202 http://doi.org/10.1016/j.tca.2017.06.001
43. Zhang, W., Zang, Y., Lu, Y., Lin, W., Zhao, S., & Xiong, J. (2021). Thermal decomposition of brominated butyl rubber. Materials, 14(22), 6767 http://doi.org/10.3390/ma14226767 PMid:34832167.
Zaharescu, T., Lugao, A. B., Zen, H. A., Mirea, R., & Buncianu, D.
44 Magill, P. C., Adkinson, D. K., & Schenkel, R. I. (2011). Rubber–clay nanocomposites based on butyl and halobutyl rubbers. In M. Galimberti (Ed.), Rubber‐clay nanocomposites: science, technology, and applications (pp. 431-464). Hoboken: John Wiley & Sons, Ltd. http://doi.org/10.1002/9781118092866.ch14.
45 Zaharescu, T. (2019). Stabilization effects of doped inorganic filler on EPDM for space and terrestrial applications. Materials Chemistry and Physics, 234, 102-109 http://doi.org/10.1016/j. matchemphys.2019.05.068
46. Binglin, W., Ziyan, X., Xingmiao, Z., Shiming, M., Yuxi, Z., & Daoming, S. (1993). Study and application of the radiation reclaiming waste butyl rubber products by γ-rays. Radiation Physics and Chemistry , 42 ( 1-3 ), 215 - 218 . http://doi.org/10.1016/0969-806X(93)90237-O
47 Ramarad, S., Ratnam, C. T., Khalid, M., Chuah, A. L., & Hanson, S. (2017). Improved crystallinity and dynamic mechanical properties of reclaimed waste tire rubber/EVA blends under the influence of electron beam irradiation. Radiation Physics and Chemistry, 130, 362-370. http://doi. org/10.1016/j.radphyschem.2016.09.023
Received: Dec. 12, 2024
Revised: May 26, 2025
Accepted: Jun. 03, 2025
Editor-in-Chief: Sebastião V. Canevarolo
Polímeros, 35(3), e20250036, 2025

The XIX Latin American Symposium on Polymers
The XIX Latin American Symposium on Polymers (SLAP) will be organized by the Brazilian (SLAP) will be organized by the Brazilian Polymer Association (ABPol) in 2026 and will Polymer Association (ABPol) in 2026 and will also host the XVII Ibero-American Congress on also host the XVII Ibero-American Congress on Polymers. Held biennially since 1988, SLAP Polymers. Held biennially since 1988, SLAP brings together approximately 500 participants brings together approximately 500 participants and is one of the most important scientif ic and is one of the most important scientif ic events in Latin America focused on polymers. events in Latin America focused on polymers. The symposium aims to foster discussions on The symposium aims to foster discussions on current and highly relevant topics in polymer current and highly relevant topics in polymer science, technology, and innovation, promoting science, technology, and innovation, promoting interaction between academia and industry interaction between academia and industry f rom across the region and beyond. f rom across the region and beyond.
The 2026 edition will take place in Salvador, The 2026 edition will take place in Salvador, Bahia, a historic and mul ticul tural coastal city Bahia, a historic and mul ticul tural coastal city that offers an inspiring setting for knowledge that offers an inspiring setting for knowledge exchange and collaboration. exchange and collaboration.
Registration opens on Registration opens on February 2, 2026 February 2, 2026
Visit the website to learn more: Visit the website learn more: slap2026.com.br slap2026.com.br
sslap2026.com.br lap2026 com br

abpol.org.br abpol org br


São Paulo 994 St. São Carlos, SP, Brazil, 13560-340
Phone: +55 16 3374-3949
Email: abpol@abpol.org.br
2021