Volume XXXIV - Issue IV - December., 2024

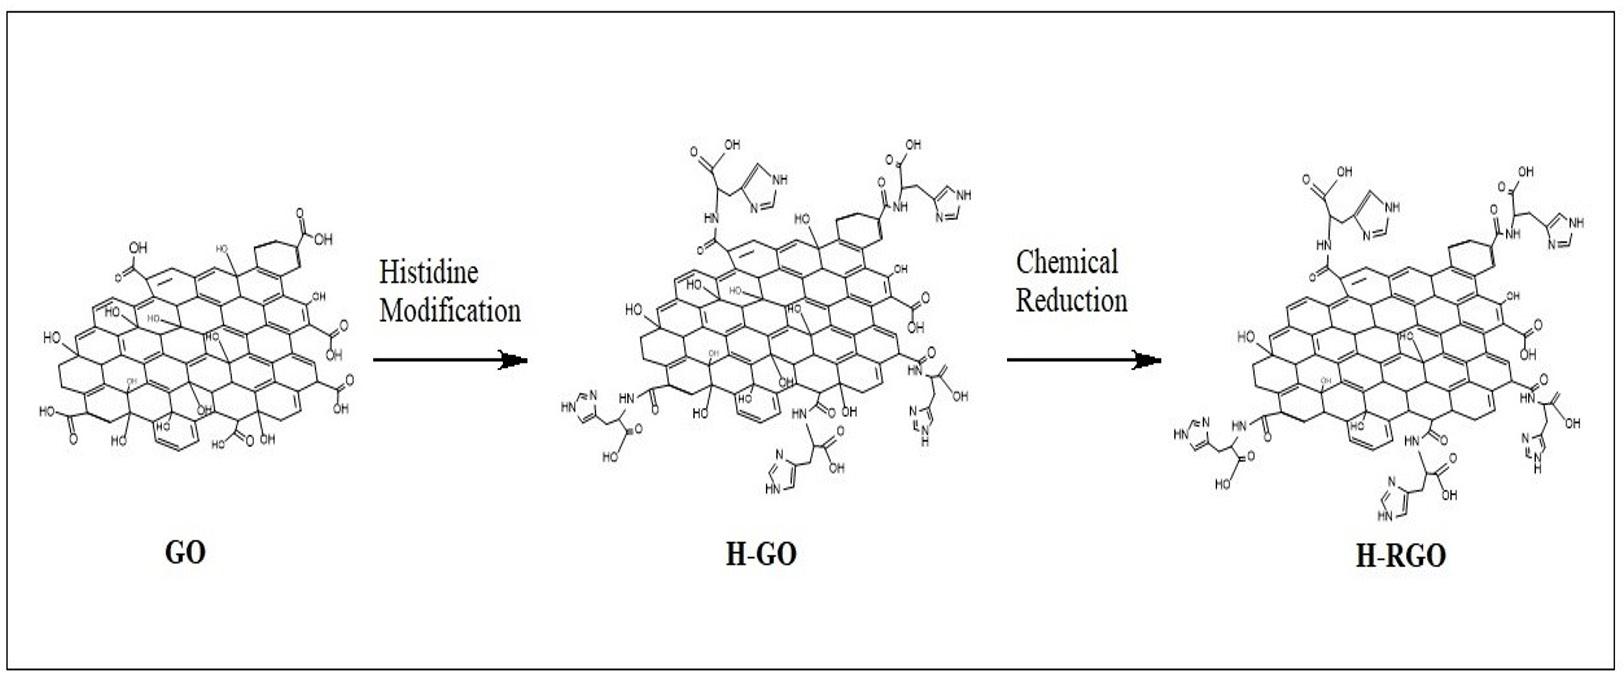

Histidine-modified reduced Graphene Oxide GO (H-RGO).

Volume XXXIV - Issue IV - December., 2024


Histidine-modified reduced Graphene Oxide GO (H-RGO).
e d I tor I al C ou NCI l
Antonio Aprigio S. Curvelo (USP/IQSC) - President m ember S
Ailton S. Gomes (UFRJ/IMA), Rio de Janeiro, RJ (in memoriam)
Alain Dufresne (Grenoble INP/Pagora)
Artur José Monteiro Valente (UC/DQ)
Bluma G. Soares (UFRJ/IMA)
César Liberato Petzhold (UFRGS/IQ)
Cristina T. Andrade (UFRJ/IQ)
Edson R. Simielli (Simielli - Soluções em Polímeros)
Edvani Curti Muniz (UEM/DQI)
Elias Hage Jr. (UFSCar/DEMa)
José Alexandrino de Sousa (UFSCar/DEMa)
José António C. Gomes Covas (UMinho/IPC)
José Carlos C. S. Pinto (UFRJ/COPPE)
Júlio Harada (Harada Hajime Machado Consutoria Ltda)
Luiz Antonio Pessan (UFSCar/DEMa)
Luiz Henrique C. Mattoso (EMBRAPA)
Marcelo Silveira Rabello (UFCGU/AEMa)
Marco Aurelio De Paoli (UNICAMP/IQ)
Nikos Hadjikristidis (KAUST/ PSE)
Osvaldo N. Oliveira Jr. (USP/IFSC)
Paula Moldenaers (KU Leuven/CIT)
Raquel S. Mauler (UFRGS/IQ)
Regina Célia R. Nunes (UFRJ/IMA)
Richard G. Weiss Washington (GU/DeptChemistry) (in memoriam)
Roberto Pantani, (UNISA/DIIn)
Rodrigo Lambert Oréfice (UFMG/DEMET)
Sebastião V. Canevarolo Jr. (UFSCar/DEMa)
Silvio Manrich (UFSCar/DEMa)
Financial support:
Available online at: www.scielo.br

e d I tor I al C omm I ttee
Sebastião V. Canevarolo Jr. – Editor-in-Chief
a SS o CI ate e d I tor S
Alain Dufresne
Artur José Monteiro Valente
Bluma G. Soares
César Liberato Petzhold
José António C. Gomes Covas
José Carlos C. S. Pinto
Marcelo Silveira Rabello
Paula Moldenaers
Richard G. Weiss (in memoriam)
Roberto Pantani
Rodrigo Lambert Oréfice
d e S kto P P ubl IS h IN g www.editoracubo.com.br
“Polímeros” is a publication of the Associação Brasileira de Polímeros
São Paulo 994 St. São Carlos, SP, Brazil, 13560-340 Phone: +55 16 3374-3949
emails: abpol@abpol.org.br / revista@abpol.org.br http://www.abpol.org.br
Date of publication: December 2024
Polímeros / Associação Brasileira de Polímeros. vol. 1, nº 1 (1991) -.- São Carlos: ABPol, 1991-
Quarterly v. 34, nº 4 (December 2024)
ISSN 0104-1428
ISSN 1678-5169 (electronic version)
1. Polímeros. l. Associação Brasileira de Polímeros.

Website of the “Polímeros”: www.revistapolimeros.org.br
E E E E E E E E E E E E E E
Production and characterization of PLA/PBAT-based films incorporated with natural and maleinized vegetable oils
Raquel do Nascimento Silva, Maria Eloisa Sousa Santos, Tatianny Soares Alves, Lucas Rafael Carneiro da Silva, Ruth Marlene Campomanes Santana, Laura Hecker de Carvalho, Amanda Dantas de Oliveira and Renata Barbosa e20240037
Rheo-optical characterization of polymer chain uncoil and disentanglement in shear flow
Murilo Tambolim and Sebastião Vicente Canevarolo e20240038
Modelling hydration effect on the mechanical performance of polyamide 6.6/glass fibers composites
Allan Oliveira Rodrigues, Gabriel Fornazaro, Gabriel Vinicius Alves Silva, Eduardo Radovanovic, Andressa dos Santos, Hederson Majela do Nascimento, Antonio Guilherme Basso Pereira and Silvia Luciana Favaro e20240039
Recycled PVC to eco-friendly materials for footwear industry: process and mechanical properties
Giovanna Marsura Juliana Otavia Bahú, Laura Plazas Tovar, Romilda Fernandez-Felisbino and Eliezer Ladeia Gomes e20240040
Oxidative stability of sacha inchi oil microparticles covered with ovalbumin
Ermelindo de Souza Silva Neto, Margarida Masami Yamaguchi, Marianne Ayumi Shirai, Claudio Takeo Ueno, Izabela Dutra Alvim, Fabio Yamashita, Carlos Raimundo Ferreira Grosso and Lyssa Setsuko Sakanaka e20240041
Gamma irradiation effect on properties of modified graphene doped PVA nanocomposite films
Thaises Lima, Filipe Diniz, Elmo Araújo and Patrícia Araújo e20240042
Neste introduces co-processed renewable Neste RE feedstock for the polymers and chemicals industry
• Neste complements its offering of more sustainable feedstock for polymers and chemicals production with co-processed Neste RE, a complementary solution to existing renewable and recycled Neste RE
• Thanks to the use of renewable raw materials in the production of Neste RE, the product has a smaller carbon footprint than conventional fossil feedstock commonly used in the chemicals industry
Neste expands its offering for the polymers and chemicals industry by introducing a co-processed renewable feedstock under its established Neste RE™ brand. By co-processing renewable raw materials such as used cooking oil together with fossil crude oil in its conventional oil refinery in Porvoo, Finland, Neste is able to produce a complementary type of Neste RE, a drop-in feedstock for the production of plastics and chemicals. Replacing fossil crude oil with renewable raw materials leads to a feedstock with a reduced carbon footprint compared to conventional fossil feedstock used in the chemicals industry.
A mass balance approach will be applied to attribute the renewable raw materials used in the process as well as the related sustainability benefits to the Neste product, which encompasses pure hydrocarbons that can replace fossil feedstocks such as naphtha or propane in plastics and chemicals manufacturing.
“Our goal is simple: reduce the use of fossil raw materials in the chemicals industry,” explains Jeroen Verhoeven, Commercial Director for Polymers and Chemicals at Neste. “With co-processing of renewable raw materials, we are expanding our offering for the chemicals industry. At the same time, it marks another step in the gradual transformation of our crude oil refinery in Porvoo into a renewable and circular solutions refining hub.”
With the co-processing of renewable raw materials, Neste introduces a third route to produce Neste RE, complementing the production from 100% renewable raw materials at the company’s renewables refineries based on the company’s proprietary NEXBTL technology, as well as via chemical recycling of circular raw materials such as hard-to-recycle plastic waste.
With this new co-processed Neste RE feedstock for the polymers and chemicals industry, Neste is building on experience gained in the co-processing of renewable raw materials into marine fuel and heating liquids. Neste Corporation
Source: Neste – neste.com
Wiped in seconds by a quick burst of heat, this mechanical storage system can encode data by depth for increased storage densities.
Researchers from Flinders University, the University of New South Wales (UNSW) Sydney, and the University of Adelaide have developed a new polymer that, they say, could deliver a big boost for high-density data storage — by encoding values by depth.
“This research unlocks the potential for using simple, renewable polysulfides in probe-based mechanical data storage, offering a potential lower-energy, higher density and more sustainable alternative to current technologies,” says first author Abigail Mann, a PhD candidate in Flinders University’s College of Science and Engineering, of the team’s work and its potential impact — at a time when the demands of the artificial intelligence (AI) boom put ever-growing strain on storage, compute, and energy resources.
“The age of big data and artificial intelligence is increasingly driving demand for data storage solutions,” adds senior author Justin Chalker. “New solutions are needed for the ever-growing computing and data storage needs of the information era. Alternatives are being sought to hard disk drives, solid-state drives and flash memory which are constrained by data density limits – or the amount of information they can store in a particular area or volume.”
The team’s polymer works, in the simplest terms possible, a little like a classic punchcard: rather than magnetic flux, like a traditional hard drive, data is encoded as physical indentations — though at a much smaller scale than your classic 80-column card. Rather than simply recording data as to whether there is an indentation at a particular location, though, the system developed by the team allows a single “bit” to store multiple possible values by varying the depth of the indent.
“Exquisite control of indentation depth is possible over 1-30nm,” the researchers explain. “This control enables data encoding not just as a function of the presence or absence of an indent, but also indentation depth. This ternary coding increases the data density fourfold over binary coding. Furthermore, the coding can be done at room temperature which is rare for mechanical information storage.”
The polymer developed by the team has other advantages, too. One is that it’s cheap to make, using readilyaccessible sulfur and dicyclopentadiene; another is that it can be wiped clean in seconds through the application of heat, and reused multiple times. The only real roadblock to its broad adoption: at present, data is stored and read using a probe guided by an atomic force microscope — not the cheapest piece of equipment, and not something you can shrink down to fit in your average laptop.
Source: Hackster – hackster.io
ANTEC® 2025
Date: March 3-6, 2025
Location: Philadelphia, Pennsylvania, United States of America
Website: 4spe.org/antec
Frontiers of Engineering 2025: International Conference on Mechanical, Electrical, Chemical, and Materials Engineering Innovations
Date: March 8-9, 2025
Location: Tokyo, Japan
Website: expertsaer.com/mecme-2025/
Conference Mechanics of Bond Breaking: from Single Molecules to Polymer Networks (MBB 2025)
Date: March 10-12, 2025
Location: Brussels, Belgium
Website: mbb2025.org
Annual International Conference on Materials Science and Nanoscience (AICMSN2025)
Date: March 13-15, 2025
Location: Rome, Italy
Website: aicmsn2025.synergiasummits.com
National Graduate Research Polymer Conference
Date: March 18-21, 2025
Location: Arizona State University, Tempe, Arizona, United States of America
Website: 2025ngrpc.asu.edu/
April
40th International Conference of the Polymer Processing Society
Date: April 22-25, 2025
Location: Auckland, New Zealand Website: www.pps-40.org/
May
Polymer Sourcing and Distribution
Date: May 19-21, 2025
ADLocation: Malaga, Spain
Website: ami-events.com/event/f82e6fcc-bfc5-4deb-b4814f20b4c03717/summary?RefId=Website_AMI
Plastic Closure Innovations
Date: May 19-21, 2025
Location: Malaga, Spain
Website: ami-events.com/event/2738902d-d7c8-4610-8199ec58a3f6f9d8/summary?RefId=Website_AMI
Polymers in Energy
Date: May 21-22, 2025
Location: Tampa, Florida, United States of America
Website: ami-events.com/event/ee6dd45c-66e3-4791-a77a9678202743cf/home?RefId=Website_Home
June
5th Edition of Chemistry World Conference
Date: June 2-4, 2025
Location: Rome, Italy
Website: chemistryworldconference.com
Plastics Recycling Technology
Date: June 10-11, 2025
Location: Long Beach, California, United States of America
Website: ami-events.com/event/8663c550-b6d5-496e-9ca315f9fd54094e/summary?RefId=Website_AMI
11th International Meeting of the Hellenic Society of Rheology - HSR 2025
Date: June 11-14, 2025
Location: Syros, Greece
Website: mathweb.aegean.gr/hsr2025
International Conference on Macromolecular and Supramolecular Chemistry - ICMSC 2025
Date: June 21-22, 2025
Location: Vienna, Austria
Website: waset.org/macromolecular-and-supramolecularchemistry-conference-in-june-2025-in-vienna EPF 2025 — European Polymer Congress 2025
Date: June 22-25, 2025
Location: Groningen, Netherlands Website: www.epf2025.org
Fluoropolymers 2025
Date: June 22-25, 2025
Location: Savannah, Georgia, United States of America Website: polyacs.org/25fluoropolymers
August
14th World Congress on Biopolymers and Biomaterials
Date: August 18-19, 2025
Location: Valencia, Spain
Website: biopolymerscongress.conferenceseries.com
Bioplastics
Date: August 26-27, 2025
Location: Cleveland, Ohio, United States of America Website: ami-events.com/event/5e7218cb-45fb-4e84-bb428c3ca9fbcf6c/summary?RefId=Website_AMI
September
39th International Conference on Solution Chemistry - ICSC 2025
Date: September 14-17, 2025
Location: Monastir, Tunisia Website: sctunisie.org/icsc2025
International Conference on Materials Science & Engineering
Date: September 25-26, 2025
Location: Dubai, United Arab Emirates Website: materials-science.nexovoconferences.com
XXIII B-MRS Meeting
Date: September 28 – October 2, 2025
Location: Salvador, Bahia, Brazil Website: sbpmat.org.br/23encontro/
October
18th Brazilian Polymer Conference (CBPol2025)
Date: October 19-23, 2025
Location: Campos do Jordão, São Paulo, Brazil Website: cbpol.com.br/?lang=en_US
96th Annual Meeting of the Society of Rheology
Date: October 19-23, 2025
Location: Santa Fe, New Mexico, United States of America Website: rheology.org/sor/Annual_Meeting/Default.aspx
November
Polymers for Fuel Cells, Energy Storage, and Conversion
Date: November 2-5, 2025
Location: Safety Harbor, Florida, United States of America Website: aiche.org/conferences/aiche-annual-meeting/2025
2025 AIChE Annual Meeting
Date: November 2-6, 2025
Location: Boston, Massachusetts, United States of America Website: polyacs.org/2025fuelcells/
Raquel do Nascimento Silva1 , Maria Eloisa Sousa Santos2 , Tatianny Soares Alves1,2 , Lucas Rafael Carneiro da Silva3 , Ruth Marlene Campomanes Santana3 , Laura Hecker de Carvalho4 , Amanda Dantas de Oliveira5 and Renata Barbosa1,2*
1Programa de Pós-graduação em Ciência e Engenharia dos Materiais, Universidade Federal do Piauí –UFPI, Teresina, PI, Brasil
2Graduação em Engenharia de Materiais, Universidade Federal do Piauí – UFPI, Teresina, PI, Brasil
3Programa de Pós-graduação em Engenharia de Minas, Metalúrgica e de Materiais, Universidade Federal do Rio Grande do Sul – UFRGS, Porto Alegre, RS, Brasil
4Programa de Pós-graduação em Ciência e Engenharia de Materiais, Universidade Federal de Campina Grande – UFCG, Campina Grande, PB, Brasil
5Programa de Pós-graduação em Ciência e Engenharia de Materiais, Universidade Federal de Pelotas –UFPel, Pelotas, RS, Brasil
*rrenatabarbosa@yahoo.com
Obstract
This manuscript explored film production for food packaging using Ecovio® and natural additives (Babassu, Castor, and Cotton Vegetable Oil), emphasizing the oil’s maleinization to optimize compatibility with the polymer. The thermogravimetric analysis revealed variations in the maximum thermal decomposition temperature of maleinized vegetable oils (Thermal event II; natural oil to maleinized oil): from 402 to 338 °C (Babassu), 441 to 446 °C (Castor), and 413 to 430 °C (Cotton). The films were produced by casting, resulting in average thicknesses varying between 0.047 and 0.065 mm, and presented low surface defects. Optical micrographs showed that films with maleinized vegetable oil were more homogeneous due to maleic anhydride. Infrared spectroscopy showed that unsaturated fatty acid bonds affected the matrix and oil interaction. The presence of oils impacted the thermal stability, moisture content, and mechanical properties. This research promotes the use of renewable resources, contributing to the development of sustainable packaging.
Keywords: casting, Ecovio®, maleinization, packaging, vegetable oil.
How to cite: Silva, R. N., Santos, M. E. S., Alves, T. S., Silva, L. R. C., Santana, R. M. C., Carvalho, L. H., Oliveira, A. D., & Barbosa, R. (2024). Production and characterization of PLA/PBAT-based films incorporated with natural and maleinized vegetable oils. Polímeros: Ciência e Tecnologia, 34(4), e20240037. https://doi.org/10.1590/0104-1428.20240030
The demand for polymer materials, commonly known as plastics, has increased considerably in the industrial sector and society due to their commercial availability, low density, and processability in different shapes and sizes. The favorable characteristics of plastics have led to substantial research into their potential applications in a wide range of areas. Without a doubt, plastics have become ubiquitous and indispensable in our daily lives, as they are used in various industries, such as packaging, construction, electronics, and medical devices[1,2]. Although plastics derived from non-renewable sources, such as petroleum, offer many advantages, the increase in their global production and consumption, especially of single-use plastics, has resulted in a high generation of plastic waste and rampant pollution of the environment. A promising approach to minimizing the harmful effects of non-biodegradable plastics on the environment is their
replacement with biodegradable polymers, mainly in the food packaging industry[3-5]
Ecovio® is an ecological alternative to conventional petroleumderived plastics (e.g., Polyethylene and Polystyrene) among the biodegradable polymers available. It was developed from a polymer blend of Poly(Butylene Adipate-co-Terephthalate) (PBAT) and Poly(Lactic Acid) (PLA), sold by BASF. PBAT provides flexibility while PLA provides rigidity, resulting in a polymer suitable for various applications, such as packaging film production[6,7], which sparked interest in this research. Using vegetable oils as natural additives incorporated into polymers can provide several advantages compared to petrochemical-based additives. For example, it can reduce production costs and act as a plasticizer, providing greater flexibility to the polymer film. Final properties can be adjusted by varying the type and content of oil incorporated into the
Silva, R. N., Santos, M. E. S., Alves, T. S., Silva, L. R. C., Santana, R. M. C., Carvalho, L. H., Oliveira, A. D., & Barbosa, R.
polymer matrix. Because vegetable oils are produced from sustainable and renewable resources, the resulting films can have a reduced environmental impact, making them a more environmentally friendly option[8,9]
Wide availability and relatively low cost make vegetable oils an industrially attractive material for the plastics industry[10] . Among the different types of vegetable oils, babassu, castor, and cotton oils are attractive for various applications, including as additives in biodegradable polymers to optimize properties, as already mentioned, and can even act as a compatibilizing agent[11]. These oils are abundant in Brazilian territory, being triglycerides rich in fatty acid, linoleic acid, ricinoleic acid, and lauric acid. The properties of vegetable oils depend mainly on the chemical structure of fatty acids. In other words, this involves the number and position of double bonds and the chain length. Due to their unsaturated chains, fatty acids can insert themselves between polymer chains, improving mobility. On the other hand, ester groups can interact effectively with the functional sites of the polymer, resulting in greater compatibility with the matrix[12,13]. The chemical modification of vegetable oils can be done through maleinization, aiming to increase reactivity and improve their compatibility with the polymer. This process involves the reaction of maleic anhydride with the double bonds of unsaturated fatty acids[14,15]
Given the above, the novelty of this research lies in combining a biodegradable polymer with vegetable oil from babassu, castor, and cotton in its natural and maleinized form for producing polymer films intended for future application in food packaging. These films, made from renewable and abundant resources, can potentially reduce the environmental footprint of food packaging. The maleinization process chemically modifies the vegetable oils and facilitates their integration into the polymer matrix. This adaptability opens up many potential applications and functionalities for biodegradable polymers, sparking curiosity and further exploration. Producing these films using the casting method allows the production of relatively homogeneous films, promoting a sustainable and ecological approach. This approach promotes sustainability and reduces dependence on petrochemical resources, instilling confidence in the ecological soundness of the process.
2.1 Materials
The polymer matrix used was Ecovio® (PBAT/PLA), grade F2224, supplied by BASF (Germany), with a mass
density of 1.24-1.26 g/cm3 (ISO 1183), Melt Volume Rate (MVR) of 3.0-6.5 mL/10 min at 190 °C/5 kg (ISO 1133), and Melting Temperature (T m) of 110-155 °C. The vegetable oils included babassu (COPPALJ, Maranhão, Brazil), castor (Mercado Central, Piauí, Brazil), and cotton oil (ICOFORT, Ceará, Brazil). Maleic anhydride (99% purity) from SigmaAldrich (USA) was used for maleinization, and chloroform from Synth (Brazil) was used as the solvent for film production.
The vegetable oil maleinization process involved heating each oil (100 g) with maleic anhydride (27 g) in a 500 mL volumetric flask at 100 °C with magnetic stirring for 4 h. After the reaction, the maleinized oils were cooled to room temperature. This methodology was adapted from Eren et al.[16] and Alarcon et al.[17]. The oils were labeled as follows: BN and BM (babassu), CAN and CAM (castor), and CON and COM (cotton) for the natural and maleinized forms, respectively.
2.3
Ecovio® was dried in an oven at 80 °C for 2 h (Solab, Brazil) before creating a film-forming solution. This involved diluting it in 50 mL of chloroform and stirring it magnetically for 90 min. After resting for 24 h, an additional 20 mL of chloroform was added, and the solution was heated and stirred again at 80 °C for 90 min. The solution was transferred to a beaker, topped up to 100 mL with solvent, and poured onto glass plates to evaporate at room temperature for 24 h (control film). These films were removed and stored in desiccators for analysis[18]. The same procedure was used to create films with natural and maleinized vegetable oils (Table 1), added after the polymer-based solution (neat Ecovio®) had rested for 24 h.
The thermal stability of vegetable oils and films produced was analyzed using Shimadzu TGA-50 equipment. The analysis was conducted in a platinum crucible under a nitrogen atmosphere (N2) with a 50 ml/min gas flow and a 20 °C/min heating rate. The oil sample was heated to 900 °C, and the films were heated to 500 °C from room temperature.
The films were visually evaluated on a macroscopic scale to assess the impact of the casting method and vegetable oil content on film quality. Photographs were taken using a 12 MP smartphone camera. The thickness of the film
Incorporation of vegetable
Production and characterization of PLA/PBAT-based films incorporated with natural and maleinized vegetable oils
samples was measured with a thickness gauge (Model 130.125, DIGIMESS, São Paulo, Brazil) with a 0.01 mm graduation and ±0.02 mm accuracy. Five film samples of each composition (3 × 3 cm) were analyzed, with thickness measured at ten different points on each sample.
The film samples were analyzed for surface morphology using a Leica DM500 binocular optical microscope (Wetzlar, Germany) in transmission mode with a 40x magnification and a 500 μm scale. Fourier transform infrared spectroscopy (FTIR) was conducted using a Shimadzu Prestige 21 spectrophotometer (Kyoto, Japan), covering a range of 4000-500 cm-1. The moisture content was measured by the mass loss method (mI) (Equation 1), drying five 1.7 × 1.7 cm samples in an oven at 105 °C for 24 h (Solab, Brazil), then cooling them to room temperature and reweighing (mF).
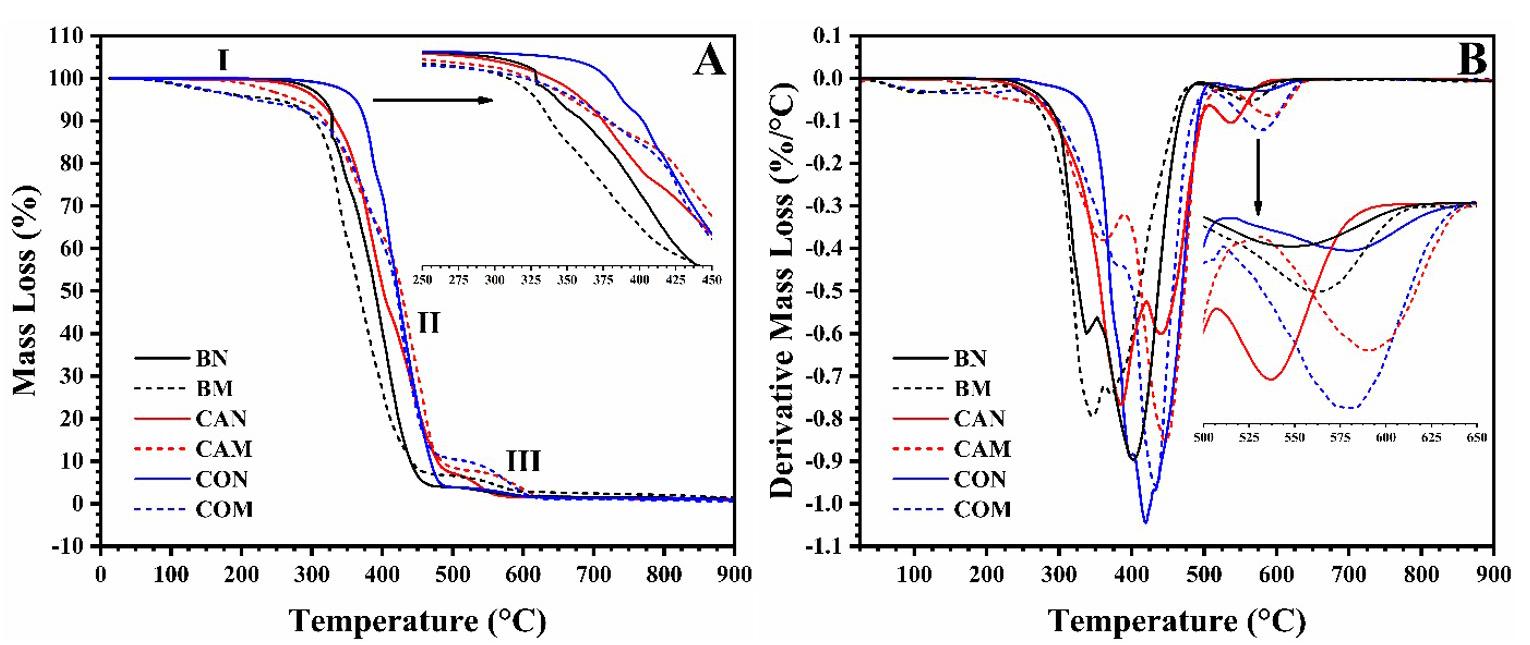
Natural vegetable oils remained stable up to 150 °C when water evaporation and loss of low molar mass compounds occurred[20]. Maleinized babassu (BM) and cotton (COM) oils showed mass losses at 76 and 84 °C, respectively, with BM losing 5.26% and COM losing 3.29%. Natural oils maintained their thermal stability up to 218 °C. BN experienced a significant mass loss of 47.83% between 242 and 398 °C, indicating decomposition and carbonization. Similar findings were reported by Alarcon et al.[21]. CAN had a T onset at 219 °C with a mass loss of 58.68%, linked to chain scission, and a T max of 383 °C[22]. CON had a T onset of 311 °C and a mass loss of 76.98%, likely due to its higher fatty acid content.
where: mI and mF are the sample mass (g) before and after drying[19] .
Following the ASTM D882 Standard, the tensile strength test was performed using a Universal Testing Machine (Model DL 30000, EMIC, Brazil). The test used a 500 N load cell and a crosshead speed of 50 mm/min at room temperature, measuring tensile strength (MPa) and elongation (%). Results were averaged from six specimens, each 10 mm long and 1 mm wide, for each formulation.
The data were analyzed using One-Way ANOVA and compared between pairs of means with the Tukey Test at a 5% significance level (p < 0.05) using OriginPro software.
3.1 Thermogravimetric analysis (TGA) of vegetable oils
The thermal stability of vegetable oils (both natural and maleinized) is essential for their use as additives in Ecovio®, as they must endure high processing temperatures. TGA analysis was conducted to evaluate this, and the results are shown in Figure 1 and Table 2
For BM and COM, thermal event II happened between 213 and 218 °C, with a notable mass loss. CAM decomposed between 177 and 360 °C, showing a 35.78% mass loss. In the literature, polymers synthesized from maleinized vegetable oils had their thermal stability evaluated. The authors observed that the thermal decomposition of maleic anhydride occurred close to 182 °C[21]. The thermal stability of natural vegetable oils was ranked as CON > BN > CAN. The maleinization process did not enhance the stability of vegetable oils, which vary in fatty acid types and contents based on origin, cultivation, and extraction methods.
3.2 Visual evaluation, thickness, and Optical Microscopy (OM)
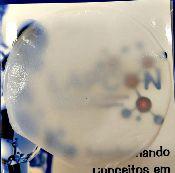
Table 3 presents three results: a macroscopic image of each film produced, the average thickness, and the surface morphology analyzed by optical microscopy.
All the films produced were flexible and exhibited few surface defects like cracks and bubbles, indicating that the casting method was effective and provided a degree of standardization. The ECO film, which lacked vegetable oil, was the most transparent. Adding various natural oils to the Ecovio® matrix altered the film’s transparency, making it more translucent or opaque, and also affected its gloss. These changes benefit packaging, especially for photosensitive foods that need more opaque materials to reduce light exposure, thereby preserving food quality and nutritional value. The decreased transparency was due to
Silva, R. N., Santos, M. E. S., Alves, T. S., Silva, L. R. C., Santana, R. M. C., Carvalho, L. H., Oliveira, A. D., & Barbosa, R.
Table 2. Thermal parameters extracted from the TGA and DTG curves.
Thermal
Caption: T onset = Initial thermal decomposition temperature; T max = Maximum thermal decomposition temperature; Tendset = Final thermal decomposition temperature; ML = Mass Loss; Residue at 900 °C.
Table 3. Physical and superficial characteristics of the films produced.
Means with different letters indicate a statistically significant difference (p < 0.05).





Production and characterization of PLA/PBAT-based films incorporated with natural and maleinized vegetable oils
Table 3. Continued...
ECO-COM

Means with different letters indicate a statistically significant difference (p < 0.05).
the varying refractive indices of the vegetable oil and the polymer matrix, which caused greater light dispersion and increased translucency or opacity.
Regarding the incorporation of maleinized vegetable oils, similar results were observed about the incorporation of natural vegetable oils. It was clear that in the presence of vegetable oil, the film surface became rougher; this was due to only partial compatibility with the polymer matrix, which led to phase separation. Consequently, it was possible to visualize the oil droplets on the film surface on a microscopic scale, which can cause an increase in surface roughness. As the oil droplets are not thoroughly mixed with the polymer, the film edges become more irregular, especially in ECO-COM film. Despite the yellowish color of most vegetable oils, the films maintained the milky appearance resulting from the Ecovio®
According to Table 3, the average thickness of the films produced varied between 0.047-0.065 mm, within the thickness range mentioned by Barlow and Morgan[23] . According to the authors, the film thickness used in food packaging can vary from 10 to 250 µm (0.01-0.25 mm). Ensuring that the film thickness is determined ensures that the film meets the specifications necessary for its application, such as strength, durability, and flexibility. Films ECO, ECOBN, ECO-BM, and ECO-CAM did not show a statistically significant difference (p > 0.05); that is, the thickness was very similar, which implies reasonable quality control of the film produced and uniformity in production. Balancing thickness and production cost is essential, as thicker films imply higher production costs. However, a considerable thickness was not obtained in the films produced in this research.
The optical micrographs revealed that the ECO film had a smooth macroscopic appearance but was microscopically heterogeneous due to phase segregation. PBAT and PLA, though similar in their structural groups, showed that PBAT polarizable groups led to coalesced clusters and uneven distribution within the PLA phase[24]. Films with natural vegetable oils (ECO-BN and ECO-CAN) displayed larger oil droplets as distinct phases, as vegetable oil does not thoroughly mix with Ecovio®, resulting in droplet formation.
± 0.008c

0.065 ± 0.010d

Surface tension between the oil and polymer can also lead to droplet formation. Despite partial miscibility, using vegetable oil as an additive benefits flexibility and has ecological and economic advantages. Films with maleinized vegetable oil, such as ECO-CAM and ECO-COM, exhibited greater homogeneity due to maleic anhydride[17]. Maleic anhydride may have facilitated the oil’s dispersion in the polymer matrix and reduced phase separation, which improved homogeneity. At the same time, ECO-CON showed good homogeneity even without it, indicating effective interactions with polymer chains.
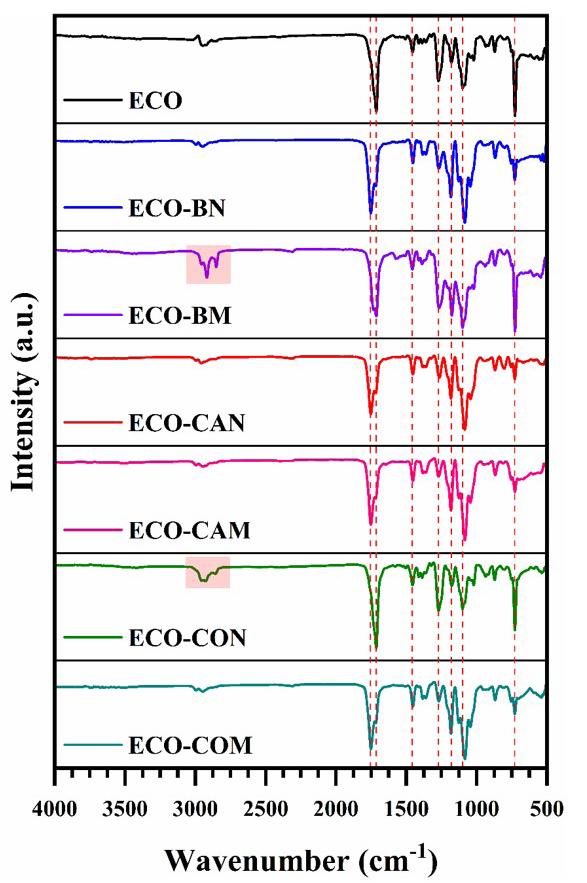
The FTIR spectrum of all films produced was obtained to investigate possible interactions between Ecovio® and vegetable oils. The spectrum referring to the neat polymer matrix was also obtained (Figure 2).
The spectrum corresponding to the ECO film exhibited the absorption bands characteristic of its components. For PBAT, the following bands were observed: −CH2− stretching at 2950 and 1413 cm-1, −C−H stretching at 2929 cm-1, C=O stretching at 1714 cm-1, −C−H stretching at 1502 and 872 cm-1 , and −C−H bending at 725 cm-1[25]. For PLA, some absorption bands appeared to overlap with the PBAT bands, as both polymers have a spectrum similar due to their classification as polyesters. Bands located at 1360 (−CH3 deformation), 1276 (−C−O− stretching), and 1180 cm-1 (−C−O−C− stretching) were attributed to the PLA[26]. With the incorporation of vegetable oil, it was observed that the bands located between 3000 and 2800 cm-1 were more defined for the ECO-BM film and the ECO-CON film. Such bands were attributed to the vibration of symmetric/asymmetric aliphatic hydrocarbons and lipid compounds. The band at 1710 cm-1 indicated the ester group in the triglycerides[27] .
In the region around 1700-1690 cm-1, C=C bonds were observed, indicating the presence of unsaturated fatty acids from the Diels-Alder reaction with maleic anhydride. A shoulder was observed around 1710 and 1720 cm-1 , especially in the ECO-CAM and ECO-COM films, due to the carbonyl stretching associated with the ester group in
Silva, R. N., Santos, M. E. S., Alves, T. S., Silva, L. R. C., Santana, R. M. C., Carvalho, L. H., Oliveira, A. D., & Barbosa, R.
maleic anhydride[17,28]. Limited interactions between polymer chains and vegetable oils may be due to the low oil content, which might not have caused measurable changes. However, changes in band intensity, particularly in the ester group, were noted. Future research with varying oil content could enhance the environmental friendliness of these products.
3.4 Thermogravimetric Analysis (TGA)
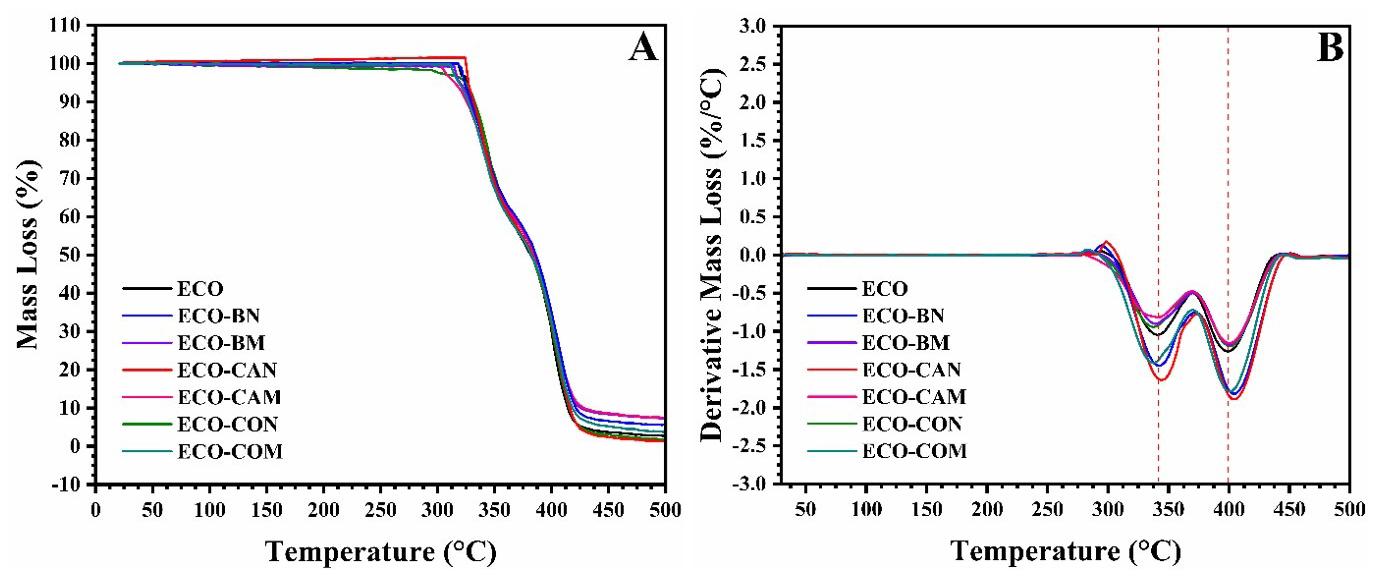
Figure 3 presents the TGA and DTG curves of the films produced with natural and maleinized vegetable oils,
and Table 4 presents the parameters of each thermal event extracted from the curves.
As shown in Figure 3, the TGA curves showed a similar trend for mass loss; that is, two thermal events were observed. Usually, the beginning of the TGA curve for many materials refers to the loss of water molecules (residual moisture) or low molecular weight compounds; however, this mass loss was minimal for the films produced here, as no thermal event was observed (< 100 °C). The temperature range for mass loss was between 300-450 °C (significant mass loss). The DTG curves corroborated this result due to the two well-defined and relatively symmetrical peaks (inflection point) around 340 and 400 °C, respectively. The thermal events observed are related to the thermal decomposition of the polymer matrix due to the increase in the kinetic energy of the molecules with increasing temperature, which led to the scission of the polymer chains in smaller volatile molecules. The two different thermal events can be explained by the lack of thermodynamic compatibility between the two polymers[29]. Dhakal et al. [30] and Nekhamanurak[31] obtained a similar TGA curve for the Ecovio®
The thermal curves of films with vegetable oils are similar to ECO film. However, physical or chemical interactions with the polymer matrix can affect the matrix’s molecular chain organization and thermal stability (e.g., can inhibit thermal decomposition reactions and/or eliminate free radicals). The ECO-CAN film had the highest T onset value (321 °C), while ECO-BN and ECO-CON also showed higher T onset than ECO film. Incorporating maleinized vegetable oils reduced T onset due to unreacted maleic anhydride in the polymer matrix, creating reactive sites susceptible to thermal decomposition at lower temperatures. Even though the maleinization process can improve the suitability of vegetable oils in polymer matrices, adding new reactive sites and structural changes can make the modified oils more susceptible to thermal degradation, reducing their stability when incorporated into polymers. The residue from initial thermal decomposition was less than 8%, attributed to thermally resistant formulation components requiring higher temperatures for decomposition.
Production and characterization of PLA/PBAT-based films incorporated with natural and maleinized vegetable oils
Caption: Residue at 500 °C. ML = Mass Loss.
Evaluating the moisture content in polymer films applied to food packaging is crucial, as moisture plays a fundamental role in packaged food safety, quality, and durability (shelflife). In this way, the moisture content was determined, and the result is shown in Table 5
The ECO film exhibited a moisture content value of less than 2%. The moisture content depends on storage conditions, such as temperature and relative humidity. This value obtained for Ecovio® is due to the moisture absorption from the environment by the polymers that make it up. Furthermore, the polymer’s chemical structure allows it to attract and retain water molecules; therefore, biodegradable polymers must be dried before processing due to their moisture sensitivity[32]. Ecovio® has polar hydroxyl and carboxyl groups, which can form hydrogen bonds with water molecules. Incorporating natural vegetable oils (BN and CAN) into the polymer did not significantly change the moisture content value (p > 0.05) about the value obtained for the ECO film. The lower value associated with ECOCAN film may be due to the high concentration of ricinoleic acid in the polymer matrix, the main constituent of castor vegetable oil[22] .
The highest value among natural vegetable oils was obtained for the film incorporated with cotton oil, possibly due to more effective plasticizing action, increasing the mobility of the polymer chains and making the polymer more susceptible to moisture absorption. Incorporating maleinized vegetable oils caused significant changes in the moisture content value (p < 0.05), mainly for castor (ECO-CAM) and cotton (ECOCOM) vegetable oils. For the vegetable oils mentioned, the moisture content of the films produced was greater than 2%. Maleinization enhances the moisture absorption capacity of nonpolar fatty acid chains by adding polar maleic anhydride groups. Groups that form hydrogen bonds with water can increase moisture content. Films with high moisture content are better for packing aqueous foods, while those with low moisture content are better for pacing fatty foods[14,33]
Evaluating tensile strength is crucial to ensure that polymer films used in food packaging meet safety, reliability, and
5. Moisture content determined for the films produced.
Film Composition Moisture Content (%) ECO 1.016 ± 0.068a
1.657 ± 0.726ac
1.772 ± 0.403acd ECO-CAN 0.805 ± 0.241a
ECO-CAM 2.894 ± 0.649bcd
ECO-CON 2.648 ± 0.440cd
ECO-COM 2.765 ± 0.702d
Means with different letters indicate a statistically significant difference (p < 0.05).
durability standards. Figure 4 presents the tensile strength and elongation properties of films produced with vegetable oils before and after the maleinization.
According to Figure 4, the ECO film presented the highest tensile strength and elongation value, corresponding to 11.05 MPa and 103.87%, respectively. In the literature, similar results were observed in the manuscript by Chen et al.[34] and Mohammadi et al.[35]. The results also showed that incorporating vegetable oils into the polymer matrix reduced tensile strength and elongation. Based on the results obtained, it can be deduced that the polymer chains are more cohesive in the ECO film, allowing for better structural integrity and greater tensile strength. Incorporating babassu, castor, and cotton vegetable oils in Ecovio® may have caused an uneven distribution of stresses, reducing the mechanical properties. The lower values of the mechanical properties may also have occurred due to structural interruptions of the polymer matrix caused by vegetable oils. It is worth mentioning that optical micrographs showed the formation of separate phases in the polymer, which can act as weak points under tensile load. Consequently, with weak points and a less cohesive structure, the matrix may not withstand the applied tension, leading to the observed results.
The film-incorporated maleinized castor oil (ECOCAM) had the lowest tensile strength at 3.67 MPa, while the film with maleinized cotton oil (ECO-COM) showed the lowest elongation at 3.96%. Higher elongation generally indicates better flexibility in polymer films. Maleinization can sometimes lead to cross-linking between the polymer
R. N., Santos, M. E. S., Alves, T. S., Silva, L. R. C., Santana, R. M. C., Carvalho, L. H., Oliveira, A. D., & Barbosa, R.
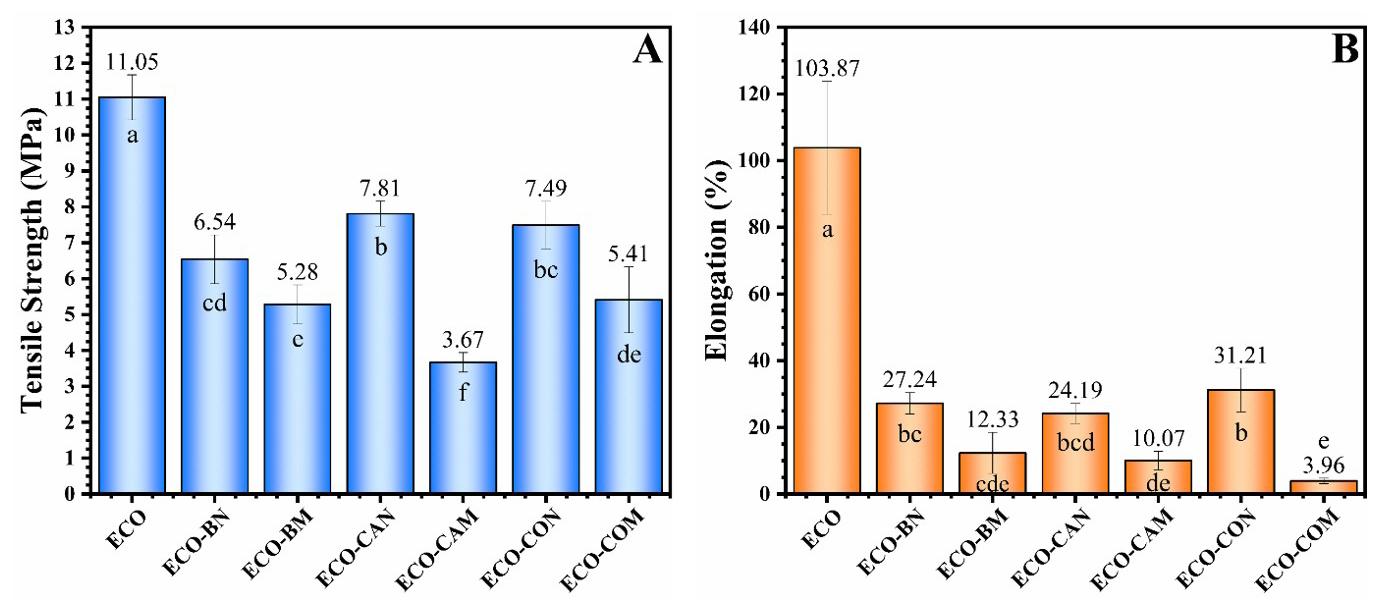
Figure 4. Mechanical properties of Ecovio®-based films: (A) tensile strength and (B) elongation. Means with different letters indicate a statistically significant difference (p < 0.05).
chains and the modified oil[36], reducing chain mobility and elongation. This research found that maleinization reduced tensile strength and elongation compared to natural oils. Differences in mechanical properties among the films were attributed to each oil’s unique chemical compositions and properties, which affected their interaction with the polymer. These variations influenced the mechanical outcomes despite a consistent 5% oil content. Carbonell-Verdu et al. [37] also observed that adding maleinized cottonseed oil to PLA-based films decreased mechanical properties above 5-7.5 wt%. Although maleinized oils were influential in achieving lower mechanical properties, further research is needed to optimize film properties.
This manuscript explored incorporating natural and maleinized vegetable oils into the Ecovio® polymer matrix to create flexible films using the casting method. Natural vegetable oils’ thermal stability ranked as CON > BN > CAN, and maleinization did not enhance this stability. The films had minimal surface defects, indicating the casting method’s effectiveness and a certain standardization level, with thicknesses ranging from 0.047 to 0.065 mm. Larger oil drops were visible in films with natural vegetable oils, while FTIR confirmed the effective incorporation of oils into the polymer matrix. Maleinized oils reduced the initial thermal decomposition temperature and significantly altered moisture content, particularly for castor and cotton oils. Maleinization also lowered tensile strength and elongation compared to natural oils. The films produced are a promising and sustainable alternative for reducing global plastic waste and producing food packaging.
• Conceptualization – Raquel do Nascimento Silva; Maria Eloisa Sousa Santos; Renata Barbosa.
• Data curation – Raquel do Nascimento Silva.
• Formal analysis – Raquel do Nascimento Silva; Lucas Rafael Carneiro da Silva.
• Funding acquisition – NA.
• Investigation – Raquel do Nascimento Silva; Maria Eloisa Sousa Santos.
• Methodology – Raquel do Nascimento Silva; Maria Eloisa Sousa Santos; Renata Barbosa.
• Project administration – Renata Barbosa.
• Resources – Renata Barbosa; Tatianny Soares Alves; Ruth Marlene Campomanes Santana; Amanda Dantas de Oliveira, Laura Hecker de Carvalho.
• Software – NA.
• Supervision – Renata Barbosa; Tatianny Soares Alves.
• Validation – Raquel do Nascimento Silva; Renata Barbosa.
• Visualization – Raquel do Nascimento Silva.
• Writing – original draft – Raquel do Nascimento Silva.
• Writing – review & editing – Renata Barbosa; Lucas Rafael Carneiro da Silva.
The authors want to acknowledge the Federal University of Piauí (UFPI), Postgraduate Program in Materials Science and Engineering (PPGCM), Coordination for the Improvement of Higher Education Personnel (CAPES) [process nº 88887.813955/2023-00], and Piauí State Research Support Foundation (FAPEPI nº 008/2018794076/2013).
1 Ardusso, M., Forero-López, A. D., Buzzi, N. S., Spetter, C. V., & Fernández-Severini, M. D. (2021). COVID-19 pandemic repercussions on plastic and antiviral polymeric textile causing pollution on beaches and coasts of South America. The Science of the Total Environment, 763, 144365 http://doi.org/10.1016/j. scitotenv.2020.144365 PMid:33360513.
Production and characterization of PLA/PBAT-based films incorporated with natural and maleinized vegetable oils
2 Moshood, T. D., Nawanir, G., Mahmud, F., Mohamad, F., Ahmad, M. H., & AbdulGhani, A. (2022). Biodegradable plastic applications towards sustainability: a recent innovations in the green product. Cleaner Engineering and Technology, 6, 100404 http://doi.org/10.1016/j.clet.2022.100404
3 Costa, A. R. M., Ito, E. N., Carvalho, L. H., & Canedo, E. L. (2019). Non-isothermal melt crystallization kinetics of poly(3hydroxybutyrate), poly(butylene adipate-co-terephthalate) and its mixture. Polímeros: Ciência e Tecnologia, 29(1), e2019006. http://doi.org/10.1590/0104-1428.11217
4 Rajvanshi, J., Sogani, M., Kumar, A., Arora, S., Syed, Z., Sonu, K., Gupta, N. S., & Kalra, A. (2023). Perceiving biobased plastics as an alternative and innovative solution to combat plastic pollution for a circular economy. The Science of the Total Environment, 874, 162441 http://doi.org/10.1016/j. scitotenv.2023.162441. PMid:36858235.
5 Walker, T. R., & Fequet, L. (2023). Current trends of unsustainable plastic production and micro(nano)plastic pollution. Trends in Analytical Chemistry, 160, 116984. http://doi.org/10.1016/j. trac.2023.116984
6 Facchi, D. P., Souza, P. R., Almeida, V. C., Bonafé, E. G., & Martins, A. F. (2021). Optimizing the Ecovio® and Ecovio®/ zein solution parameters to achieve electrospinnability and provide thin fibers. Journal of Molecular Liquids, 321, 114476 http://doi.org/10.1016/j.molliq.2020.114476
7 Sikorska, W., Musioł, M., Zawidlak-Węgrzyńska, B., & Rydz, J. (2021). End-of-life options for (bio)degradable polymers in the circular economy. Advances in Polymer Technology, 2021(1), 6695140. http://doi.org/10.1155/2021/6695140.
8 Islam, M. R., Beg, M. D. H., & Jamari, S. S. (2014). Development of vegetable-oil-based polymers. Journal of Applied Polymer Science, 131(18), 40787. http://doi.org/10.1002/app.40787.
9 Zhang, C., Garrison, T. F., Madbouly, S. A., & Kessler, M. R. (2017). Recent advances in vegetable oil-based polymers and their composites. Progress in Polymer Science, 71, 91-143. http://doi.org/10.1016/j.progpolymsci.2016.12.009
10 Samarth, N. B., & Mahanwar, P. A. (2015). Modified vegetable oil based additives as a future polymeric material: review. Open Journal of Organic Polymer Materials, 5(1), 1-22 http://doi. org/10.4236/ojopm.2015.51001
11 Monte, E. F., Fagundes, T. C., Ximenes, A. F., Moura, F. S., & Costa, A. R. S. (2016). Environmental impact of oil disposal: case study of the perception of the residents of Maranguape I Paulista – PE. Revista Geama, 1(2), 205-219. Retrieved in 2024, March 8, from https://www.journals.ufrpe.br/index.php/ geama/article/view/488
12 Giakoumis, E. G. (2018). Analysis of 22 vegetable oils’ physico-chemical properties and fatty acid composition on a statistical basis, and correlation with the degree of unsaturation. Renewable Energy, 126, 403-419 http://doi.org/10.1016/j. renene.2018.03.057
13 Marturano, V., Marotta, A., Salazar, S. A., Ambrogi, V., & Cerruti, P. (2023). Recent advances in bio-based functional additives for polymers. Progress in Materials Science, 139, 101186 http://doi.org/10.1016/j.pmatsci.2023.101186
14 Mazo, P., Rios, L., Estenoz, D., & Sponton, M. (2012). Selfesterification of partially maleated castor oil using conventional and microwave heating. Chemical Engineering Journal, 185186, 347-351 http://doi.org/10.1016/j.cej.2012.01.099
15 Ferri, J. M., Garcia-Garcia, D., Montanes, N., Fenollar, O., & Balart, R. (2017). The effect of maleinized linseed oil as biobased plasticizer in poly(lactic acid)-based formulations. Polymer International, 66(6), 882-891 http://doi.org/10.1002/ pi.5329
16 Eren, T., Küsefoğlu, S. H., & Wool, R. (2003). Polymerization of maleic anhydride-modified plant oils with polyols. Journal of
Applied Polymer Science, 90(1), 197-202 http://doi.org/10.1002/ app.12631
17 Alarcon, R. T., Holanda, B. B. C., Oliveira, A. R., Magdalena, A. G., & Bannach, G. (2016). Produção e caracterização de um novo polímero termoplástico a partir do óleo de linhaça e glicerol seguindo os princípios da química verde. Revista Virtual de Química, 9(1), 163-175
18 Silva, R. N., Silva, L. R. C., Morais, A. C. L., Alves, T. S., & Barbosa, R. (2021). Study of the hydrolytic degradation of poly3-hydroxybutyrate in the development of blends and polymeric bionanocomposites. Journal of Thermoplastic Composite Materials, 34(7), 884-901 http://doi.org/10.1177/0892705719856044
19. Silva, L. R. C., Silva, L. O., Carvalho, L. H., Oliveira, A. D., Bardi, M. A. G., Mesquita, A. B. S., Ferreira, J. H. L., Alves, T. S., & Barbosa, R. (2022). Physical, morphological, structural, thermal and antimicrobial characterization of films based on poly(lactic acid), organophilic montmorillonite and oregano essential oil. Materials Research, 25, e20220043 http://doi. org/10.1590/1980-5373-mr-2022-0043
20 Lauer, M. L., Ribeiro, K. C., Amadei, E., & Carvalho, B. M. (2020). Nanocellulosis masterbatch for the production of nanocomposites from thermoplastic matrices. Brazilian Journal of Development, 6(2), 5369-5382 http://doi.org/10.34117/ bjdv6n2-002
21 Alarcon, R. T., Almeida, M. V., Rinaldo, D., & Bannach, G. (2017). Synthesis and thermal study of polymers from soybean, sunflower, and grape seed maleinated oil. European Journal of Lipid Science and Technology, 119(10), 1600515. http://doi. org/10.1002/ejlt.201600515
22 Liang, H., Liu, L., Lu, J., Chen, M., & Zhang, C. (2018). Castor oil-based cationic waterborne polyurethane dispersions: storage stability, thermo-physical properties and antibacterial properties. Industrial Crops and Products, 117, 169-178 http:// doi.org/10.1016/j.indcrop.2018.02.084
23. Barlow, C. Y. , & Morgan , D. C. (2013 ). Polymer film packaging for food: an environmental assessment. Resources, Conservation and Recycling, 78, 74-80 http://doi.org/10.1016/j. resconrec.2013.07.003
24 Rodrigues, S. C. S., Mesquita, F. A. S., Carvalho, L. H., Alves, T. S., Folkersma, R., Araújo, R. S. R. M., Oliveira, A. D., & Barbosa, R. (2021). Preparation and characterization of polymeric films based on PLA, PBAT and corn starch and babassu mesocarp starch by flat extrusion. Materials Research Express, 8(3), 035305 http://doi.org/10.1088/2053-1591/ abeaca
25. Pascoalino, L. A., Souza, R. L., Marques, N. N., & Curti, P. S. (2020). Characterization and evaluation of thermoresponsive Ecovio®/PNIPAAm electrospun fibers. Revista Matéria, 25(3), e-12830 http://doi.org/10.1590/s1517-707620200003.1130
26 Wang, L.-F., Rhim, J.-W., & Hong, S.-I. (2016). Preparation of poly(lactide)/poly(butylene adipate-co-terephthalate) blend films using a solvent casting method and their food packaging application. Lebensmittel-Wissenschaft + Technologie, 68, 454-461 http://doi.org/10.1016/j.lwt.2015.12.062
27 Fasihi, H., Noshirvani, N., & Hashemi, M. (2023). Novel bioactive films integrated with Pickering emulsion of ginger essential oil for food packaging application. Food Bioscience, 51, 102269 http://doi.org/10.1016/j.fbio.2022.102269
28 Maia, D. L. H., & Fernandes, F. A. N. (2019). Effects of operating conditions on the copolymerization of castor oil maleate-styrene by suspension polymerization. Macromolecular Reaction Engineering, 13(5), 1900017 http://doi.org/10.1002/ mren.201900017
29. Silva, T. C. P., Fortes, A. G. S., Abreu, I. R., Carvalho, L. H., Almeida, Y. M. B., Alves, T. S., & Barbosa, R. (2022). Development of biodegradable PLA/PBAT-based filaments for
Silva, R. N., Santos, M. E. S., Alves, T. S., Silva, L. R. C., Santana, R. M. C., Carvalho, L. H., Oliveira, A. D., & Barbosa, R.
fertilizer release for agricultural applications. Materials, 15(19), 6764 http://doi.org/10.3390/ma15196764 PMid:36234105.
30 Dhakal, K. N., Krause, B., Lach, R., Wutzler, A., Grellmann, W., Le, H. H., Das, A., Wießner, S., Heinrich, G., & Adhikari, R. (2022). Electrically conductive nanocomposites based on poly(lactic acid)/flexible copolyester blends with multiwalled carbon nanotubes. Journal of Applied Polymer Science, 139(4), 51554 http://doi.org/10.1002/app.51554
31 Nekhamanurak, B. (2022). Property improvement of processed PLA/PBAT using chain extenders. Materials Research Express , 9 (6), 064002. http://doi.org/10.1088/2053-1591/ ac7381
32 Siegenthaler, K. O., Künkel, A., Skupin, G., & Yamamoto, M. ( 2011 ). Ecoflex® and Ecovio®: biodegradable, performance-enabling plastics. In B. Rieger, A. Künkel, G. Coates, R. Reichardt, E. Dinjus, & T. Zevaco (Eds.), Synthetic biodegradable polymers (pp. 91-136) Berlin: Springer http:// doi.org/10.1007/12_2010_106
33. Cozmuta, A. M., Turila, A., Apjok, R., Ciocian, A., Cozmuta, L. M., Peter, A., Nicula, C., Galić, N., & Benković, T. (2015). Preparation and characterization of improved gelatin films incorporating hemp and sage oils. Food Hydrocolloids, 49, 144-155. http://doi.org/10.1016/j.foodhyd.2015.03.022.
34 Chen, W., Qi, C., Li, Y., & Tao, H. (2021). The degradation investigation of biodegradable PLA/PBAT blend: thermal stability, mechanical properties and PALS analysis. Radiation Physics and Chemistry, 180, 109239 http://doi.org/10.1016/j. radphyschem.2020.109239.
35 Mohammadi, M., Heuzey, M.-C., Carreau, P. J., & Taguet, A. (2021). Interfacial localization of CNCs in PLA/PBAT blends and its effect on rheological, thermal, and mechanical properties. Polymer, 233, 124229 http://doi.org/10.1016/j.polymer.2021.124229
36. Wu, F., & Musa, O. M. (2016). Vegetable oil-maleic anhydride and maleimide derivatives: syntheses and properties. In O. Musa (Ed.)., Handbook of maleic anhydride based materials (pp. 151-208). Cham: Springer International Publishing. http:// doi.org/10.1007/978-3-319-29454-4_3
37 Carbonell-Verdu, A., Garcia-Garcia, D., Dominici, F., Torre, L., Sanchez-Nacher, L., & Balart, R. (2017). PLA films with improved flexibility properties by using maleinized cottonseed oil. European Polymer Journal, 91, 248-259 http://doi. org/10.1016/j.eurpolymj.2017.04.013
Received: Mar. 08, 2024
Revised: Jul. 27, 2024
Accepted: Aug. 24, 2024
Murilo Tambolim1 and Sebastião Vicente Canevarolo2*
1Programa de Pós-graduação em Ciência e Engenharia de Materiais – PPGCEM, Universidade Federal de São Carlos - UFSCar, São Carlos, SP, Brasil
2Departamento de Engenharia de Materiais – DEMa, Universidade Federal de São Carlos – UFSCar, São Carlos, SP, Brasil
*caneva@ufscar.com.br
Obstract
Rheo-optical studies allow the monitoring of rheological properties by indirect measurements of optical properties. For pure polymeric fluids, flow birefringence can be used to quantify the molecular orientation level by the application of shear strain rates. In this work, flow birefringence experiments were carried out with a pure polystyrene under different shear rates, shear cycles, and temperature conditions, in a polarized light optical microscope under controlled shear. The level of orientation and its correlation with the dynamics of uncoil/recoil and disentanglement were analyzed. The expected increase in the orientation level as a function of the increase in the shear rate due to the chain uncoiling was confirmed. Following, the chain orientation level reduces over time, associated with chain disentanglement and its subsequent recoiling. Disentanglement behaves irreversibly, while uncoiling and recoiling are reversible processes. A model is proposed to represent these dynamics.
Keywords: disentanglement, polymer chain orientation, flow birefringence, rheo-optical measurement, polystyrene.
How to cite: Tambolim, M., & Canevarolo, S. V. (2024). Rheo-optical characterization of polymer chain uncoil and disentanglement in shear flow. Polímeros: Ciência e Tecnologia, 34(4), e20240038. https://doi.org/10.1590/0104-1428.202400636
Rheo-optics techniques jointly address the rheology of polymers and their optical properties, such as birefringence. Flow birefringence can be used to quantify chain orientation level, due to the anisotropy of polymer chains[1-5]. A relevant concept in polymer rheology is the dynamics of uncoiling/ recoiling and disentanglement/reentanglement of chains during their orientation process under melt flow.
The first theories of molecular chain motions were developed by Rouse[6], Bueche[7], Zimm[8] and Peticolas[9] in the 1950s and 1960s, in which polymer chains are considered as a succession of equal submolecules, represented by a sequence of spheres connected by springs. This model is useful for polymer solutions with low concentration. For polymer flow in the melt state, the understanding of the entanglement concept is fundamental. This concept emerged in the 1930s[10] and has been an important topic ever since[11-18]. The de Gennes’[19] chain reptation model is one of the most adopted theories to correlate properties of polymeric fluids in the presence of entanglements. It assumes that the chain motion is restricted by entanglements, as if the chain was inside a tube, and the reptation mechanism allows the molecule to slip inside it.
There are several studies to develop methods to disentangle polymer chains, such as during the polymerization, under polymer solution, etc. Disentangling chains in the molten or softened state was first proposed by Ibar[20,21]
The development of grades with prior disentanglement treatment is interesting to achieve lower viscosities during processing and, thefore, better processability, especially for polymers with high molecular weight. It is known that high levels of disentanglemnt are possible to be obtained when applying shear rates for a long period, just as it is expected that the disentanglement rate decreases over time[20-23] . In 2018, Li and Matsuba[24] proposed that the higher level of entanglement is responsible for preserving molecular orientation in shear flow. Wattanabe et al.[25] and Noirez et al. [26] studies challenged the assumptions that flow shear thinning of entangled polymer chains is due to significant orientation of the segments between the entanglements under shear flow. In their studies, both concluded that the chains remained largely undeformed under steady-state shear flow conditions for which extensive shear thinning was present. These results also represent a challenge for the reptation model. Wang et al.[27] experimentally demonstrated that the chain retraction step of the tube model does not occur, which led to the conclusion that the current understanding of the flow and relaxation of entangled polymers based on the theoretical reptation model is limited.
The reentanglement effect is a much slower process. Roy and Roland[28] studied the process of reentangling polyisobutylene, it was more than an order of magnitude slower than expectations based on the linear relaxation
time of the fully entangled material. Ibar[29] concluded that the recovery time of untangled PMMA treated by the socalled shear strengthening machine was 17 million times greater than its longest relaxation time (5 ms). Fu et al. [30] showed that higher shear rates induce higher levels of disentanglement, resulting in up to 93.7% lower viscosity, greater molar mass between entanglements, and longer reentanglement time.
The objective of this work is, by using flow birefringence optical measurement of a polystyrene (PS) during shearing flow, correlate it with the level of orientation of the chains, and propose a model for the dynamics of uncoiling, disentanglement and recoiling. The experiments are carried out in a shearing parallel plate system (CSS450) with temperature and shear rate control, fitted in a polarized light optical microscope, and a homemade optical detector for quantifying the cross polarized transmitted light intensity through the soften polymer to get the flow birefringence. The measurements were done under different shearing conditions, varing its maximum value, sequence and time of disentanglement shearing treatment, and temperature. With that, a model have been proposed for molecular chain disentanglement and recoiling.
Pure GPPS N 2560 from Innova was used. It is a pure atactic homopolystyrene with high molar mass ( w M260.000 g/mol ≅ , n M140.000 g/mol ≅ ). Polystyrene shows negative birefringence, high polarizability and intrinsic birefringence for completely oriented chains of 4 n0.11,00010∆ ≅−=−× [31]
The rheo-optical characterization of the polymer was carried out using a Leica DMRXP polarized light optical microscope (MOLP), with attachment of an Cambridge Shearing System CSS450 accessory from Linkam Scientific Instruments and an optical detector made of a light dependent resistor LDR, placed in the microscope optical tube, partially covered to reduce the sample measuring area and so unwanted changes in the shear rate. This sensor is set after the analyzer polarization filter. The cross polarized transmitted light intensity signal I, measured by the LDR, is normalized ( N 0I1 ≤≤ ) using Equation 1, converted into Optical Path Difference (OPD) using Equation 2, and finally converted into flow birefringence ( n∆ ) using Equation 3, knowing the sample film thickness.
550 nm λ= the average wavelength of the white light, the damping coefficient, and t400 m=µ the sample thickness. The data is collected at a frequency of 5 Hz by a software written in LabVIEW 8.6, developed inhouse[32], and edited as needed to better suit these measurements.
The normalized cross polarized transmitted light intensity N I , measured by the optical detector was calibrated using a Berek compensator B containing a tilting magnesium fluoride MgF2 plate[33], measurements taken every 0.1º tilting degree, in both directions (named black and red scales), up to 4 light interference orders. The two curves were shifted to minimize the uncertainty of the compensator screw drum at OPDZero nm = . By tilting the crystal an angle i, a phase difference δ (nm) is introduced in the optical path, following Equation 4[33]:
being IC the transmitted light intensity with polarizers set crossed (minimum intensity), P I the transmitted light intensity with polarizers set parallels (maximum intensity),
being, t the crystal thickness ( 61.52510 nm × ), o n1.37859 = and e n1.39043 = the ordinary and extraordinary refractive indices of the MgF2 crystal respectively, given an intrinsic birefringence of 4 eo nnn118.410 ∆=−=× , measured by a monochromatic light with 546.1 nm λ= (e line).
Two different shearing procedures were applied, using 0.27 g of the material in melt state. (1) Shearing scan: Shear the sample from 11 0.01 s180 s ≤γ≤ (reaching the maximum shear rate of the equipment for the fixed sample thickness of 400 μm, set by the gap between the quartz plates), in a profile of 20 steps distributed on a log scale values, holding 60 seconds at each one to collect the signal and average it to get N I . Various isothermal scans in the range of 180 T230≤≤ ℃℃were tested. (2) Disentanglement shearing treatment: The sample, starting at rest, is rapidly sheared ( ) time1 min ≤ with increasing shear rates up to 1 180 s γ= at 180℃. The rise in shear rate is done quickly to minimize the unwanted pre-disentanglement of the chains. Then the sample is kept at a constant 1 180 s γ= for a preset shearing time (2, 5 and 60 min, as indicated). The data is collected at 5 Hz and displayed.
2.1 Increase in the molecular chain orientation level during shearing scan
The sample was subjected to the shearing scan profile at 180 °C. This temperature was set under preliminary measurements at which a balance of high flow birefringence values and good melt flow stability is obtained for the PS used. The normalized intensity N I , optical path difference OPD and flow birefringence n∆ as a function of the shear rate γ were calculated and displayed.
2.2 Reduction in the molecular chain orientation level during disentanglement shearing treatment
The sample at 180 °C is rapidly sheared from rest up to 1 180 s γ= . The polymer chains are disentangled by keeping the shear rate 1 180 s γ= constant during 60 min. The curve of N I as a function of time is obtained to monitor the changes in the level of chain orientation, revealed as flow birefringence.
Rheo-optical characterization of polymer chain uncoil and disentanglement in shear flow
2.3 Reduction in the molecular chain orientation level during sequential runs of disentanglement shearing treatments
The effect of cumulative chain disentanglement levels in the material was quantified by cycling up to three sequential shearing scans at 180 °C. Each cycle is done by the following steps: 1) fast shear rate increase up to 1 180 s γ= ; 2) 60 min disentanglement shearing treatment at constant shear rate of 1 180 s γ= ; 3) fast shear rate reduction down to rest; and 4) 1 min rest. After resting, a new cycle is applied. During each complete cycle, N I , OPD and n∆ as a function of γ were calculated.
2.4 Molecular chain orientation level after sequential disentanglement shearing treatment runs
Four shearing scans followed by disentanglement shearing treatment were applied sequentially at 180 °C. The sequence was performed twice, for 2 and 5 min disentanglement shearing treatment times. Flow birefringence n∆ as a function of shear rate γ was calculated and displayed.
2.5 Molecular chain orientation level as a function of melt shearing temperature
Shear scans were applied for melt temperatures of 180, 190, 200, 210, 220 and 230 °C, either without applying previous disentanglement or after applying 60 min shearing disentanglement treatment, by using different samples. N I , OPD and n∆ as a function of γ were calculated. By fitting straight lines in the initial portion of the n vs ∆γ curves (110n41044 ×<−∆<× ), their extrapolation to n0∆ = leads to the polymer average relaxation time r λ as Equation 5.
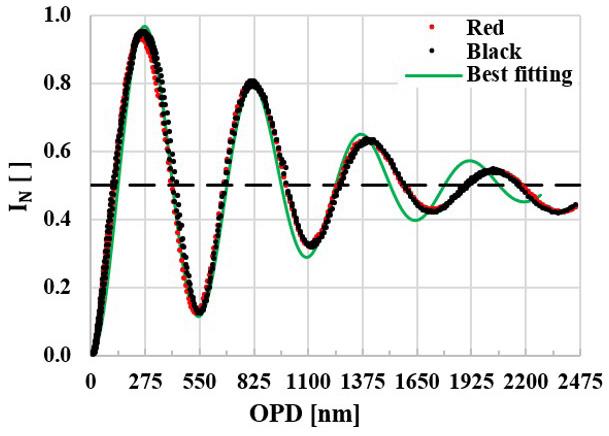
line), which by applying Equation 2, one gets coefficient 0.12 β= . The experimental data follows closely the expected theoretical curve, confirming the efficiency of the optical arrangement for quantitative measurements.
3.2 Increase in the molecular chain orientation level during shearing scan
Figure 2 shows the curve of normalized cross-polarized transmitted light intensity as a function of shear rate γ applied to the PS sample at 180 °C. The maximum N I value (0.95) is obtained at γ = 8.8 1 s , revealing the half of the first light interference order, i.e. an OPD = 275 nm. The end of the first order occurs approximately at 20 to 30 1 s for a N I close to 0.30 to 0.40, for an OPD = 550 nm. Half of the second order occurs at approximately 60 to 100 1 s and N I close to 0.80 to 0.90, for an OPD = 825 nm. At the maximum measurable shear rate delivered by the equipment 1 180 s γ= , the N I obtained is 0.58, lying between the middle and the end of the second order.
The curve of birefringence ∆n as a function of shear rate γ applied is shown in Figure 3. It establishes a more direct correlation with the orientation level. At shear rates high enough to overcome the effect of molecular chain relaxation, the chains uncoil themselves and orient along the direction of stress, resulting in -Δn > 0. Increasing further ã leads to higher -Δn values, that is, higher molecular chain orientation levels, as expected. The results are similar to those got by Vasconcelos’[34], which were obtained for the same material and equipment, but at 210 °C.
3.3 Reduction in the molecular chain orientation level during disentanglement shearing treatment
3. Results and Discussions
3.1 Optical detector calibration
Figure 1 shows the normalized cross polarized transmitted light intensity N I experimental points (black and red) measured by inserting the Berek compensator B in the light path and the best fitting theoretical curve (continuous green
N I as a function of disentanglement shearing treatment time at 1 180 s and 180 °C for up to 60 minutes is presented in Figure 4. In the same figure, there is a miniature representation of Figure 2 at the top right, to support the interpretation. The initial N I value is 0.64 , given a 4 n23.310∆=−× , i.e. ~43 times lower than the intrinsic birefringence of polystyrene ( 4 n1,00010∆=−× ) and ~75 times lower than the calcite crystal ( 4 n1,720*10∆=− ). The value is close to that obtained in Figure 2 at 180 1 s , as expected. During the 60 min treatment, N I reduces towards values that would be

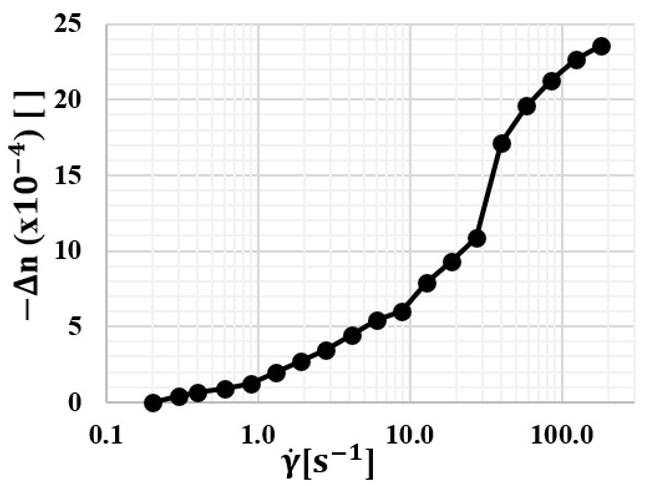
3. Flow birefringence -Δn of polystyrene as a function of shear

Figure 4. Changes in the normalized cross-polarized transmitted light intensity N I as a function of time during polystyrene disentanglement shearing treatment at 180 °C and 180 1 s . After 60 min the flow birefringence of polystyrene reduces to 4 n3.710∆=−× .
obtained at lower γ values, which can be easily interpreted by following the curve presented in the miniature insert. Therefore, the molecular chain orientation level reduces over time. At the end of the experiment, N I = 0.57, setting its OPD in between the half and end of the first light interference order and, reaching a 4 3.710 n ∆=−× , ~84% lower than the initial value.
Maintaining a constant shear rate γ , the reptation motion allows entangled chain segments that are closer to their chain ends to disentangle more easily. Gradually lower levels of entanglement are expected, as observed by Buchdahl[13] and Ibar[20,21]. The disentanglement leads to an increase in the conformational freedom of the chain, facilitating its partial recoiling, resulting in a gradual reduction in the orientation level over time. This dependence of the orientation on the entanglement level was also observed by Li and Matsuba[24]. The lower orientation level of the chain segments reduces the ability of the chains to disentangle, as they are in a more relaxed state. Therefore, the molecular chain disentanglement rate decreases over time, leading eventually to its stabilization.
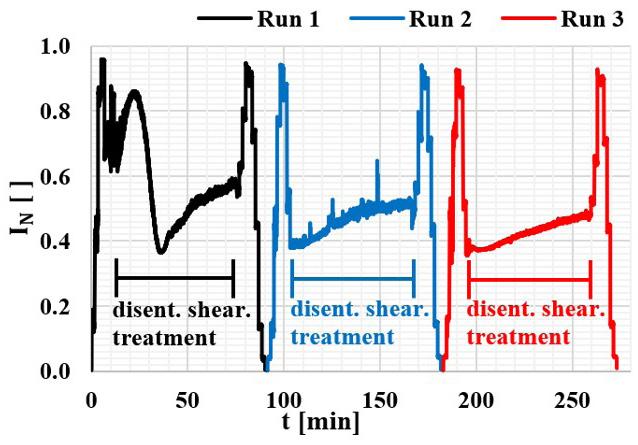
Figure 5. Changes in the normalized cross-polarized transmitted light intensity N I as a function of time t for three sequentially applied runs of disentanglement shearing treatment of 60 min at 180 °C and 1 180 s
3.4 Reduction in the molecular chain orientation level during sequential runs of disentanglement shearing treatments
The effect of multiple disentanglement shearing treatments can be followed by measuring N I as a function of time for three consecutive applied runs at 180 °C, which is shown in Figure 5. The increasing orientation with increasing shear rate γ is seen up to the initial 15 minutes of shearing, when 1 180 s γ= is reached. After that, the shear rate is kept constant at this value and the disentanglement shearing treatment takes place. At its start, N I0.65 = , given a flow birefringence of 4 n23.210∆=−× . The disentanglement rate reduces over time and after 60 min of disentanglement shearing treatment, the OPD have passed by the first half of the second order and the end of the first order, reaching a N I0.57 = i.e. a flow birefringence of 4 n3.810∆=−× . After the first disentanglement shearing treatment, the shear rate is reduced down to zero, while the molecular chain orientation also reduces by chain recoiling. By applying a second run, the N I value starts at N I0.40 = and then follows the previous behavior. During this second run, the molecular chain orientation level reduces at a much lower rate. Upon applying a third run, the whole N I curve shape is kept very similar to that of the second run, revealing that the reduction in molecular chain orientation during disentanglement shearing treatment had already occurred mainly in the first run. After that, the molecular chain entanglement level remains constant, independent of increasing further the time of treatment, at the same shear level. The disentanglement rate is high at the beginning of the first run and stabilizes by the end of the treatment. Thus the final molecular chain relaxation is the combination of a reversible behavior due to the molecular chain uncoiling/ recoiling effect, and an irreversible contribution of the molecular chain disentanglement effect.
3.5 Molecular chain orientation level after sequential disentanglement shearing treatment runs
The flow birefringence -Δn as a function of shear rates γ after the sample had been subjected to consecutive
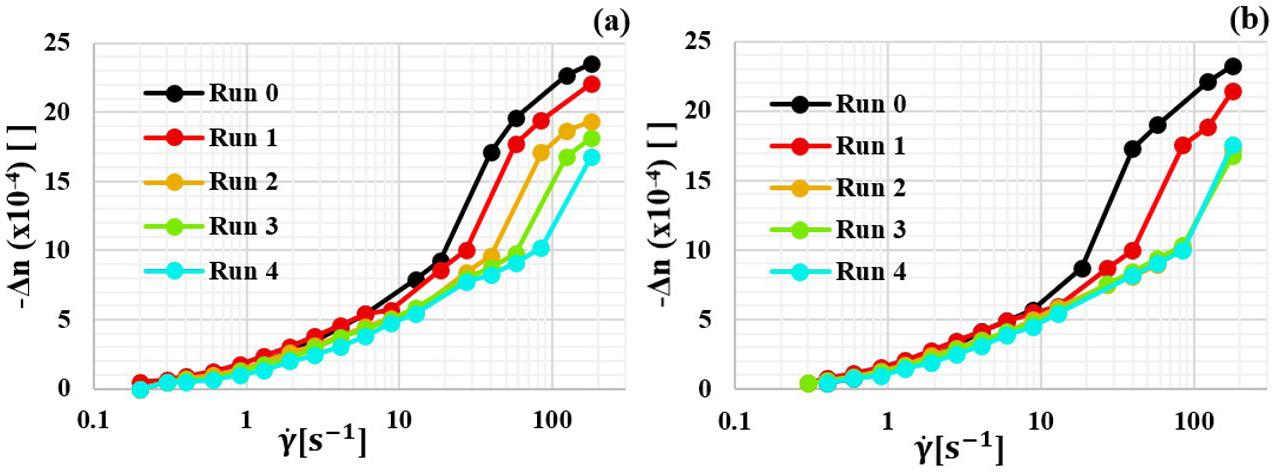
disentanglement shearing treatment runs at 1 180 s and 180℃ for 2 min and 5 min treatments are presented in Figure 6
Run 0 represents the first curve obtained while the shear rate profile is applied for the first time. The subsequent runs count the number of disentanglement shearing treatments that the sample was subjected to. In general, at low s γ levels, -Δn reduces slightly, suggesting a irrelevant reduction in the chains average relaxation time R λ . At high γ , the shift is much more significant, indicating that the level of molecular chain orientation is more affected by disentanglement when the polymer melt is at high s γ . The flow birefringence curve shown during Run 1, which is done after 2 min of shearing treatment time, shifts to the right, indicating a reduction in the accumulative level of chain orientation. In the subsequent runs, there is an irreversible accumulation of disentanglement, which is also shown during runs after 5 min shearing treatment times. However, after 10 min cumulative treatment time (i.e. from Run 2 onwards), the curves overlap, indicating the stabilization of the orientation level reached by the partially disentangled chains.
The values of -Δn at 180 °C and 180 1 s as a function of the accumulated disentanglement shearing treatment time after each run shown in Figure 6 were consolidated in Figure 7 There is a fast reduction of -Δn up to approximately 10 min of accumulated treatment time, subsequently leading to stability. The level of entanglement reduces with shearing treatment time, leveling after ~10 min of cumulative treatment, due to the reduction in the capacity of more disentagled chains to orient themselves.
3.6 Molecular chain orientation level as a function of melt shearing temperature
Figure 8 presents -Δn as a function of γ at different melt shearing temperatures without (a); and after 60 min disentanglement shearing treatment at 180 1 s and 180 °C (b). In both (a) and (b) cases, ∆n decreases with increasing temperature, due to reducing R λ as the chains present greater mobility and, therefore, the γ necessary for the orientation to overcome the relaxation effect is greater. There is a shift to the right of (b) in relation to (a), which demonstrates the disentanglement effect. ∆n are
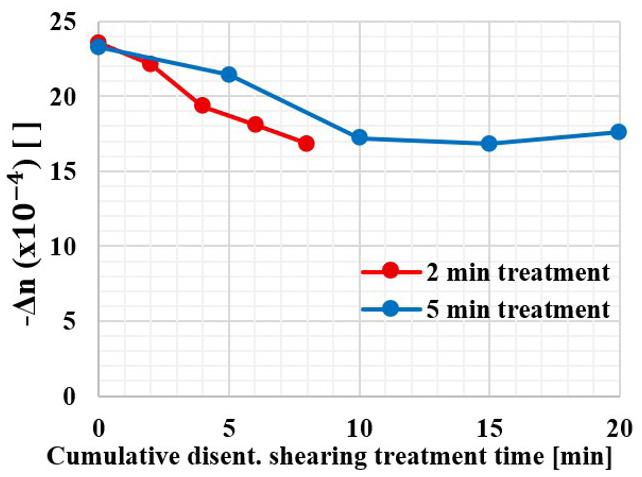
Figure 7. Flow birefringence values -Δn at 180 °C and 1 180 s for consecutive runs with 2 and 5 min disentanglement shearing treatment time as a function of the cumulative treatment time.
smaller after the treatment and the same previous conclusions are valid at different temperatures.
The PS chains average relaxation times R λ at varying melt shearing temperatures from 180 °C up to 230 °C were obtained by extrapolation the best fitting curve in the flow birefringence -∆n to zero, and calculated following Equation 5. Figure 9 shows R λ as a function of 1/T. There is a reduction of R λ with increasing temperature (reducing 1/T) analogous to the results obtained by Bernardo[35]. After disentanglement shearing treatment, R λ is shifted to lower values, this effect being more pronounced at lower temperatures.
The rheo-optical data obtained for shear melt flow of polystyrene can be represented in a model of the disentanglement and recoiling dynamics of the polymer chain in Figure 10. Polymer chains in the molten or softened state at rest are in a coiled and entangled equilibrium conformation. When subjected to shear rates high enough to overcome molecular relaxation, they uncoil and orient along the direction of stress.

Figure 8. Flow birefringence -Δn as a function of shear rate γ at different temperatures (a) without; and (b) after applying 60 min disentanglement shearing treatment at 180 °C and 180 1 s
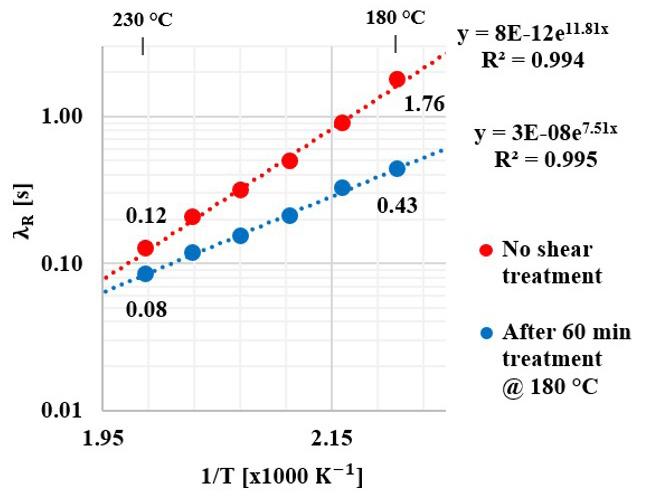
Figure 9. PS chain average relaxation times R λ as a function of the reciprocal of the melt flow temperature 1/T, without and after applying 60 min of disentanglement shearing treatment at 180 °C.

Figure 10. Dynamics of polymer chain disentanglement, recoiling and the following reduction in the molecular chain orientation level during the shearing polymer flow.
Simultaneously, there is a reduction in the entanglement level through reptation mechanisms, in agreement with recent model proposals[36-39]. An increase in the applied shear rate leads to an increase in the level of chain uncoiling and orientation. Maintaining a constant shear rate, the reptation allows entangled segments that are closer to chain ends to disentangle easier. Gradually lower levels of entanglements lead to an increase in the conformational freedom degree of the
chain segment, facilitating its partial recoiling, with a gradual reduction in the level of orientation over time, analogous to the conclusions of Watanabe et al.[25] and Noirez et al.[26]
The lower orientation level reduces the ability of the chains to disentangle, as they are in a more relaxed state. Therefore, the disentanglement rate decreases over time, leading to stabilization. The disentanglement rate increases when applying higher shear rates, as the reptation speed and orientation will
Rheo-optical characterization of polymer chain uncoil and disentanglement in shear flow
be greater, in agreement with Fu et al.[30] and Liu et al.[40] Higher temperatures reduce the disentanglement rate, as the orientation levels will be lower, due to the shorter average relaxation time. With a rapid suppression of shear, the chains recoil quickly and reversibly. However, reentanglement occurs much more slowly, as also observed by Roy and Roland[28] , Ibar[29], and Litvinov et al.[41], and an irreversible effect can be assumed, within the time scale of this work.
Rheo-optical measurements quantifying polymer melt flow birefringence under controlled melt shearing conditions were carried out for a pure polystyrene of high molar mass with a Cambridge Shearing System CSS450 fitted in a polarized light optical microscope, and an optical detector to monitor the cross-polarized transmitted light intensity. With this rheooptical setting, the level of the polymer chain orientation and its correlation with the dynamics of uncoiling/recoiling and disentanglement of the chains were studied. The expected increase in the average polymer chain orientation level with the increase in the applied shear rate due to chain uncoiling was confirmed. Under continuous shearing the average chain orientation level reduces over time, associated with the chain disentanglement, happening mainly by loosen the chain entanglements closest to the chain ends, leaving the terminal chain segments free to recoil. Under shearing, the disentanglement is irreversible, assuming that reentanglement is insignificant, while uncoiling and recoiling are reversible, depending on the level of the applied shear rate and flow temperature. A molecular model is proposed to represent these dynamics.
5. Author’s Contribution
• Conceptualization – Murilo Tambolim; Sebastião Vicente Canevarolo.
• Data curation – Murilo Tambolim; Sebastião Vicente Canevarolo.
• Formal analysis – Murilo Tambolim; Sebastião Vicente Canevarolo.
• Funding acquisition – Murilo Tambolim; Sebastião Vicente Canevarolo.
• Investigation – Murilo Tambolim; Sebastião Vicente Canevarolo.
• Methodology – Murilo Tambolim; Sebastião Vicente Canevarolo.
• Project administration – Murilo Tambolim; Sebastião Vicente Canevarolo.
• Resources – Murilo Tambolim; Sebastião Vicente Canevarolo.
• Software – Murilo Tambolim; Sebastião Vicente Canevarolo.
• Supervision – Sebastião Vicente Canevarolo.
• Validation – Murilo Tambolim; Sebastião Vicente Canevarolo.
• Visualization – Murilo Tambolim; Sebastião Vicente Canevarolo.
• Writing – original draft – Murilo Tambolim; Sebastião Vicente Canevarolo.
• Writing – review & editing – Murilo Tambolim; Sebastião Vicente Canevarolo.
This study was financed by the Coordenação de Aperfeiçoamento de Pessoal de Nível Superior - Brasil (CAPES) - Finance Code 001, Conselho Nacional de Desenvolvimento Científico e Tecnológico (CNPq) for a PQ scholarship 310441/2020-0 to S.V. Canevarolo, and the Programa de Pós-Graduação em Ciência e Engenharia de Materiais (PPG-CEM) of Federal University of São Carlos (UFSCar).
1. Fuller, G. G., & Leal, L. G. (1981). Flow birefringence of concentrated polymer solutions in two‐dimensional flows. Journal of Polymer Science. Polymer Physics Edition, 19(4), 557-587. http://doi.org/10.1002/pol.1981.180190402.
2 Frattini, P. L., & Fuller, G. G. (1984). Note: a note on phase‐modulated flow birefringence: a promising rheo‐optical method. Journal of Rheology (New York, N.Y.), 28(1), 61-70 http://doi. org/10.1122/1.549768
3 Zebrowski, B. E., & Fuller, G. G. (1985). Rheo‐optical studies of concentrated polystyrene solutions subjected to transient simple shear flow. Journal of Polymer Science. Polymer Physics Edition , 23(3), 575-589 http://doi.org/10.1002/ pol.1985.180230313
4 Silva, J., Santos, A. C., & Canevarolo, S. V. (2015). In-line monitoring flow in an extruder die by rheo-optics. Polymer Testing, 41, 63-72 http://doi.org/10.1016/j.polymertesting.2014.10.007
5 Soares, K., Santos, A. M. C., & Canevarolo, S. V. (2011). In-line rheo-polarimetry: a method to measure in real time the flow birefringence during polymer extrusion. Polymer Testing, 30(8), 848-855 http://doi.org/10.1016/j.polymertesting.2011.08.007
6 Rouse, P. E., Jr. (1953). A theory of the linear viscoelastic properties of dilute solutions of coiling polymers. The Journal of Chemical Physics, 21(7), 1272-1280 http://doi. org/10.1063/1.1699180
7. Bueche, F. (1954). Influence of rate of shear on the apparent viscosity of A-Dilute Polymer Solutions, and B-Bulk polymers. The Journal of Chemical Physics, 22(9), 1570-1576 http://doi. org/10.1063/1.1740460.
8 Zimm, B. H. (1956). Dynamics of polymer molecules in dilute solution: viscoelasticity, flow birefringence and dielectric loss. The Journal of Chemical Physics, 24(2), 269-278 http://doi. org/10.1063/1.1742462
9 Peticolas, W. L. (1963). Introduction to the molecular viscoelastic theory of polymers and its applications. Rubber Chemistry and Technology, 36(5), 1422-1458. http://doi.org/10.5254/1.3539650.
10 Busse, W. F. (1932). The physical structure of elastic colloids. Journal of Physical Chemistry, 36(12), 2862-2879 http://doi. org/10.1021/j150342a002
11. Treloar, L. R. G. (1940). Elastic recovery and plastic flow in raw rubber. Rubber Chemistry and Technology, 13(4), 795-806 http://doi.org/10.5254/1.3546559
12 Flory, P. J. (1944). Network structure and the elastic properties of vulcanized rubber. Chemical Reviews, 35(1), 51-75 http:// doi.org/10.1021/cr60110a002
13 Buchdahl, R. (1948). Rheology of Thermoplastic Materials. I. Polystyrene. Journal of Colloid Science, 3(2), 87-98 http:// doi.org/10.1016/0095-8522(48)90060-9 PMid:18863839.
14 Nielsen, L. E., & Buchdahl, R. (1949). Viscoelastic and photoelastic properties of polystyrene above its softening temperature. The Journal of Chemical Physics, 17(9), 839-840 http://doi.org/10.1063/1.1747411
15 Bueche, F. (1952). Viscosity, self‐diffusion, and allied effects in solid polymers. The Journal of Chemical Physics, 20(12), 1959-1964. http://doi.org/10.1063/1.1700349.
16 Bueche, F. (1956). Viscosity of polymers in concentrated solution. The Journal of Chemical Physics, 25(3), 599-600 http://doi.org/10.1063/1.1742998
17 Berry, G. C., & Fox, T. G. (1968). The viscosity of polymers and their concentrated solutions. Advances in Polymer Science, 5(3), 261-357 http://doi.org/10.1007/BFb0050985
18 Onogi, S., Masuda, T., & Kitagawa, K. (1970). Rheological properties of anionic polystyrenes. I. Dynamic viscoelasticity of narrow-distribution polystyrenes. Macromolecules, 3(2), 109-116 http://doi.org/10.1021/ma60014a001
19 Gennes, P. G. (1971). Reptation of a polymer chain in the presence of fixed obstacles. The Journal of Chemical Physics, 55(2), 572-579. http://doi.org/10.1063/1.1675789.
20 Ibar, J. P. (2012). Processing polymer melts under rheo-fluidification flow conditions, part 1: boosting shear-thinning by adding low frequency nonlinear vibration to induce strain softening. Journal of Macromolecular Science, Part B: Physics, 52(3), 407-441 http://doi.org/10.1080/00222348.2012.711999
21 Ibar, J. P. (2012). Processing polymer melts under rheofluidification flow conditions, part 2: simple flow simulations. Journal of Macromolecular Science, Part B: Physics, 52(3), 442-461 http://doi.org/10.1080/00222348.2012.712004
22 Wang, Y., Liu, M., Chen, J., Luo, J., Min, J., Fu, Q., & Zhang, J. (2020). Efficient disentanglement of polycarbonate melts under complex shear Field. Polymer, 201, 122610 http://doi. org/10.1016/j.polymer.2020.122610.
23 Tapadia, P., & Wang, S.-Q. (2004). Nonlinear flow behavior of entangled polymer solutions: yieldlike entanglementdisentanglement transition. Macromolecules, 37(24), 90839095 http://doi.org/10.1021/ma0490855
24 Li, K., & Matsuba, G. (2017). Effects of relaxation time and zero shear viscosity on structural evolution of linear lowdensity polyethylene in shear flow. Journal of Applied Polymer Science, 135(13), 46053. http://doi.org/10.1002/app.46053.
25 Watanabe, H., Kanaya, T., & Takahashi, Y. (2007). RheoSANS behavior of entangled polymer chains with local label under fast shear flow. Activity Report on Neutron Scattering Research: Experimental Reports, 14, 265
26. Noirez, L., Mendil-Jakani, H., & Baroni, P. (2009). New light on old wisdoms on molten polymers: conformation, slippage and shear banding in sheared entangled and unentangled melts. Macromolecular Rapid Communications, 30(20), 1709-1714. http://doi.org/10.1002/marc.200900331 PMid:21638441.
27 Wang, Z., Lam, C. N., Chen, W.-R., Wang, W., Liu, J., Liu, Y., Porcar, L., Stanley, C. B., Zhao, Z., Hong, K., & Wang, Y. (2017). Fingerprinting molecular relaxation in deformed polymers. Physical Review X, 7 (3), 031003 http://doi. org/10.1103/PhysRevX.7.031003
28 Roy, D., & Roland, C. M. (2013). Reentanglement kinetics in polyisobutylene. Macromolecules, 46(23), 9403-9408 http:// doi.org/10.1021/ma402074b
29 Ibar, J. P. (2015). Trouble with polymer physics: development of “sustained orientation” contradicts the current understanding of the liquid state of polymers. Journal of Macromolecular Science, Part B: Physics, 54(6), 722-748 http://doi.org/10.1 080/00222348.2015.1037209
30. Fu, J., Wang, Y., Shen, K., Fu, Q., & Zhang, J. (2019). Insight Into Shear‐Induced Modification for Improving Processability of Polymers: effect of shear rate on the evolution of entanglement state. Journal of Polymer Science. Part B, Polymer Physics, 57(10), 598-606 http://doi.org/10.1002/polb.24816
31 Okada, Y., Urakawa, O., & Inoue, T. (2016). Reliability of intrinsic birefringence estimated via the modified stressoptical rule. Polymer Journal, 48(11), 1073-1078 http://doi. org/10.1038/pj.2016.74
32 Vasconcelos, R. L. (2019). Caracterização em tempo real da birrefringência de forma do Sistema PS/PP por técnica reoóptica (Dissertação de mestrado). Universidade Federal de São Carlos, São Carlos.
33 Berek, M. (1913). Compensator B Manual Germany: Ernst Leitz, GmbH For the complete theory of the compensator see M. Berek (1913). Zentralblatt furr Mineralogie, pgs 388-396, 427-435, 464-470, and 580-582
34 Vasconcelos, R. L., & Canevarolo, S. V. (2020). Rheo-optical characterization of dilute polymer mixtures under shear flow. Polymer Testing, 90, 106737 http://doi.org/10.1016/j. polymertesting.2020.106737
35 Bernardo, F. O. C. (2022). Caracterização óptica on-line das misturas dispersiva e distributiva na extrusão dupla rosca (Tese de doutorado). Universidade Federal de São Carlos, São Carlos.
36 Andreev, M., Khaliullin, R. N., Steenbakkers, R. J. A., & Schieber, J. D. (2013). Approximations of the discrete sliplink model and their effect on nonlinear rheology predictions. Journal of Rheology (New York, N.Y.), 57(2), 535-557 http:// doi.org/10.1122/1.4788909
37 Ianniruberto, G., & Marrucci, G. (2014). Convective constraint release (CCR) revisited. Journal of Rheology (New York, N.Y.), 58(1), 89-102 http://doi.org/10.1122/1.4843957
38. Nafar Sefiddashti, M. H., Edwards, B. J., & Khomami, B. (2016). Steady shearing flow of a moderately entangled polyethylene liquid. Journal of Rheology (New York, N.Y.), 60(6), 1227-1244 http://doi.org/10.1122/1.4963800
39 Dolata, B. E., & Olmsted, P. D. (2023). A thermodynamically consistent constitutive equation describing polymer disentanglement under flow. Journal of Rheology (New York, N.Y.), 67(1), 269-292 http://doi.org/10.1122/8.0000476
40 Liu, M., Wang, Y., Chen, J., Luo, J., Fu, Q., & Zhang, J. (2020). The retarded recovery of disentangled state by blending hdpe with ultra-high molecular weight polyethylene. Polymer, 192, 122329 http://doi.org/10.1016/j.polymer.2020.122329
41 Litvinov, V., Christakopoulos, F., & Lemstra, P. J. (2024). Disentangled melt of ultrahigh-molecular-weight polyethylene: fictitious or real? Macromolecules, 57(8), 3719-3730 http:// doi.org/10.1021/acs.macromol.4c00271
Received: June 14, 2024
Revised: Aug. 25, 2024
Accepted: Sept. 12, 2024
Allan Oliveira Rodrigues1 , Gabriel Fornazaro1* , Gabriel Vinicius Alves Silva1 , Eduardo Radovanovic2 , Andressa dos Santos1 , Hederson Majela do Nascimento1 , Antonio Guilherme Basso Pereira3 and Silvia Luciana Favaro1
1Laboratório de Engenharia Mecânica, Departamento de Engenharia Mecânica, Universidade Estadual de Maringá – UEM, Maringá, PR, Brasil
2Laboratório de Química, Departamento de Química, Universidade Estadual de Maringá – UEM, Maringá, PR, Brasil
3Laboratório de Bioprocessos e Biotecnologia, Coordenação de Engenharia de Bioprocessos e Biotecnologia, Universidade Tecnológica Federal do Paraná – UTFPR, Dois Vizinhos, PR, Brasil *gabriel_fornazaro@hotmail.com
Obstract
Composites of polyamide 6.6 (PA 6.6) reinforced with glass fibers exhibit strong mechanical properties; however, the hygroscopic nature of PA 6.6 introduces variability due to water absorption, which can affect these properties. This study aimed to develop a statistical model to assess the impact of hydration on the mechanical properties of PA 6.6/ glass fiber composites. A 23 factorial design was employed to analyze the effects of time, temperature, and glass fiber content on tensile strength, impact resistance, and flexural properties. Characterization of the composites using scanning electron microscopy (SEM), X-ray diffraction (XRD), and differential scanning calorimetry (DSC) revealed excellent fiber-matrix adhesion and an increased degree of crystallinity, which contributed to enhanced Young’s modulus. The analysis showed that time and temperature were the primary factors influencing water absorption. A statistical model was created to predict the mechanical properties of the composites, incorporating the effects of hydration directly into the predictions.
Keywords: hydration, mechanical properties, PA 6.6, optimization.
How to cite: Rodrigues, A. O., Fornazaro, G., Silva, G. V. A., Radovanovic, E., Santos, A., Nascimento, H. M., Pereira, A. G. B., & Favaro, S. L. (2024). Modelling hydration effect on the mechanical performance of polyamide 6.6/glass fibers composites. Polímeros: Ciência e Tecnologia, 34(4), e20240039. https://doi.org/10.1590/0104-1428.20240046
Polyamide 6.6 (PA 6.6) is a widely utilized engineering plastic known for its high performance and technical reliability in manufacturing various parts[1,2]. Its long-standing success and reliability over more than five decades make it one of the most established materials in the industry[2,3]. However, despite its widespread use, PA 6.6 presents significant challenges related to moisture absorption, which can negatively impact its mechanical properties, particularly in environments with fluctuating humidity. Understanding these effects is critical for industries, such as automotive and electronics, where material performance under different environmental conditions is essential. PA 6.6 is produced through polycondensation reactions between adipic acid and hexamethylenediamine. The planar zigzag structure of the PA chains facilitates intermolecular hydrogen bonding, resulting in a strong, dense, and crystalline polymer[3] The degree of crystallinity, which is directly related to the spacing of the hydrogen bonds, can be influenced by adsorbed moisture[4,5], significantly affecting the mechanical properties of PA 6.6 and making it more ductile[2,6] .
The chemical properties of PA 6.6 allow for the incorporation of various additives, including elastomers, mineral fillers, and glass fibers (GF), among others[5,7-9]. These additions enhance its properties, enabling PA 6.6 to replace metals, thermosets, and other construction materials. Glass fibers are the most used reinforcing agents in PA 6.6 composites[7,10-12], due to their favorable chemical and physical characteristics, such as a high strength-to-weight ratio, resistance to high temperatures, and resistance to corrosion and moisture[1,8]. Glass fiber-reinforced PA 6.6 composites are extensively employed in the automotive industry, agricultural parts, and electrical components, with commercial composites typically containing 10 to 30 wt% GF. The high tensile strength of glass fibers enhances the composite’s resistance, increasing both Young’s modulus and flexural modulus, as well as tensile strength. Conversely, the hygroscopic nature of the polymer matrix tends to increase ductility and reduce tensile strength[12-14]. However, the interaction between glass fibers and the PA 6.6 matrix is significantly affected by water absorption, which compromises the material’s mechanical integrity over time.
Rodrigues,
A.
O., Fornazaro,
G.,
Silva, G. V. A., Radovanovic, E., Santos, A., Nascimento, H. M., Pereira, A. G. B., & Favaro, S. L.
Previous studies have demonstrated the adverse effects of water absorption on the mechanical performance of PA 6.6/glass fiber composites, but there is limited information on the behavior of these materials under controlled hydration conditions, such as partial saturation at different humidity levels. Research has shown that water absorption adversely affects the mechanical properties of PA 6.6/glass fiber composites. Chaichanawong et al.[13] investigated the impact of moisture absorption on these properties by immersing composites in distilled water for 60 days, noting significant changes in mechanical performance, including peak load impact responses across various energy levels. Zhang et al. [15] focused on the diffusion coefficient and final moisture concentration in composites subjected to different hydration conditions. Their findings indicated that equilibrium moisture concentration was influenced by relative humidity and fiber content, with moisture diffusion effects varying according to humidity-temperature interactions. Hassan et al.[16] reported that specimens in wet conditions exhibited lower tensile strength and modulus compared to dry composites, while fracture strain increased under approximately 50% relative humidity. Despite the extensive data provided by polymer and composite suppliers for dried materials, information under other conditions, such as saturation at 50% relative humidity, is often scarce. In the plastic injection and processing industry, it is crucial to understand the mechanical properties of materials under conditions not covered in standard data sheets, especially for parts with tight assembly tolerances. This gap in knowledge is particularly relevant for manufacturing industries where precise mechanical performance is crucial, especially for components that must meet tight assembly tolerances. This study aims to assess the impact of hydration time and temperature on the mechanical properties of PA 6.6 composites with 10 to 30 wt% glass fiber, reflecting common commercial compositions. A statistical model was developed to predict the tensile strength and impact resistance of these composites under the studied conditions. Additionally, to minimize the thermal energy required in industrial hydration processes, temperatures below 40 °C were investigated, with a view to utilizing water from cooling processes of injection molds or leveraging solar energy.
2.1 Materials and specimens processing
Polyamide 6.6 in its pure form and with various glass fiber contents were sourced from Petropol Polímeros® and processed by Haplos Indústria e Comércio Ltda. The materials studied included: Polyamide 6.6 (Nypol A3 HL NR310), Polyamide with 10% Glass Fiber (Nypol A3 G10 NR512), Polyamide with 20% Glass Fiber (Nypol G20 NR441), and Polyamide with 30% Glass Fiber (Nypol G30 NR399). The raw material was provided in pellet form and without pigmentation; it was dried in an oven at 90 °C for 4 hours.
To prepare the specimens, composites of the PA 6.6 matrix reinforced with glass fiber (PA/GF) were produced with 10, 20, and 30 wt% glass fiber content (denoted as PA/ GF10, PA/GF20, and PA/GF30, respectively). The injection molding of the specimens, adhering to ASTM D638-2a Type
I and ASTM D256 standards, was performed using an MG 100/200 injection machine. The process parameters included a barrel temperature of 275 °C, mold temperature of 80 °C, injection pressure of 90 bar, holding pressure of 40 bar, and an injection speed of 80 mm/s. The specimens were then stored in an airtight package until they were subjected to hydration. Six specimens per condition were prepared to ensure accurate measurement and minimize errors.
A full factorial design (Montgomery, 2013) was implemented as a statistical method for all mechanical testing after the hydration to evaluate the main factors and to develop mathematical models to predict PA/GF mechanical properties. The factors were glass fiber percentage (X1), hydration temperature (X2) and hydration time (X3), as shown in Table 1. The responses were named as the moisture absorption (Y1), young’s modulus (Y2), yield strength (Y3), strain (Y4) and impact strength (Y5). The inputs and responses were drawn up in a 23 full factorial design with 8 base runs, 4 central points and a replicate, to generate 20 total runs to each response, providing the optimized conditions for the hydration related to the yield and the mechanical responses. R Studio 3.5.0 software was used for statistics at 0.05 level of significance.
The analysis of variance (ANOVA) was used as statistical method to analyze the effect of glass fiber and hydration on the mechanical response of the composites. These ANOVA tests allow us to generate a mathematical model as shown by follow statistical model (Equation 1):
where Xi and Xj are the independent input variables where the response y depends on them and the experimental errors term, denoted as ∈. The y will be proposed using the second order polynomial regression model, which is called the quadratic model. The iβ represents the linear effect of Xi, iiβ represents the quadratic effect of Xi 2 and ijβ reveals the linear-by-linear interaction between Xi and Xj
The hydration was performed in a thermostatic bath, Tecnal TE-184, using deionized water. The weights of specimens were measured in an analytical balance (Denver Instruments APX-200 with a resolution of 0.1 mg) before and after the treatment. Equation 2 was used to calculate the amount of absorbed water.
*100 hi ab i mm A m = (2)
where mi and mh are the weight of samples in the beginning and after hydration, respectively.
The tensile strength tests were performed according to ASTM D638 in a universal testing machine, EMIC DL
Modelling hydration effect on the mechanical performance of polyamide 6.6/glass fibers composites
10000, using a load cell of 20 kN under 5 mm/min speedup to the failure. The results of all mechanical properties are averages of five tested specimens.
2.5 Izod impact test
The impact resistance tests were carried out in the CEAST equipment with pendulum 2.75 J, model Resil Impactor Junior, according to ASTM D256.The notch specimens were prepared using a CEAST Notchvis machine with a resolution of 1 µm. The results of all mechanical properties are averages of five tested specimens.
2.6 Scanning electron microscopy (SEM)
Scanning electron microscopy images of the fractured specimens from tensile tests, previously coated with gold by sputtering, were taken using a QUANTA 250 equipment from FEI, with a magnification of 250x.
2.7 X-ray diffraction analysis (XRD)
X-ray diffraction analysis was performed at room temperature on a Shimadzu X-ray diffractometer, model XRD-7000, with Cu-Kα radiation(λ = 1.5406 Å) in a current of 30 mA, and potential of 40 kV at 2°/min from 10 to 40° (2θ).
2.8 Differential scanning calorimetry (DSC)
DSC analyses were carried out on DSC-Q20 (TA instruments), using no hermitic aluminum pans, heating and cooling rates of 10 °C/min, from 25 to 300 °C, under
compressed air flux of 50 mL/min. Equation 3 was used to determine the degree of crystallinity of the polymer matrix.
(3)
where ΔHf is the heat of fusion of the sample and ΔHf° is the heat of fusion of a hypothetically 100% crystalline polymer. In the case of PA 6.6 the value of ΔHf° used was 195 J/g, frequently mentioned in the literature[14,17] .
3.1 Statistical
Five primary experiments were conducted for all mechanical tests, with the results of the tensile testing presented in Figure 1. The factorial experimental design was employed as the statistical methodology to analyze the impact of water absorption on various mechanical properties, considering the influence of factors such as glass fiber content, temperature, and treatment duration. The experimental factors, their respective levels, and the observed responses are detailed in Table 1
The statistical analysis was conducted at a significance level of 0.05, utilizing R Studio 3.5.0 software to calculate the effects of various model terms through regression analysis. The p-values obtained indicated that all factors and their interactions significantly affected the moisture absorption response (Y1), with a p-value of less than 0.05.
Rodrigues, A. O., Fornazaro, G., Silva, G. V. A., Radovanovic, E., Santos, A., Nascimento, H.
M.,
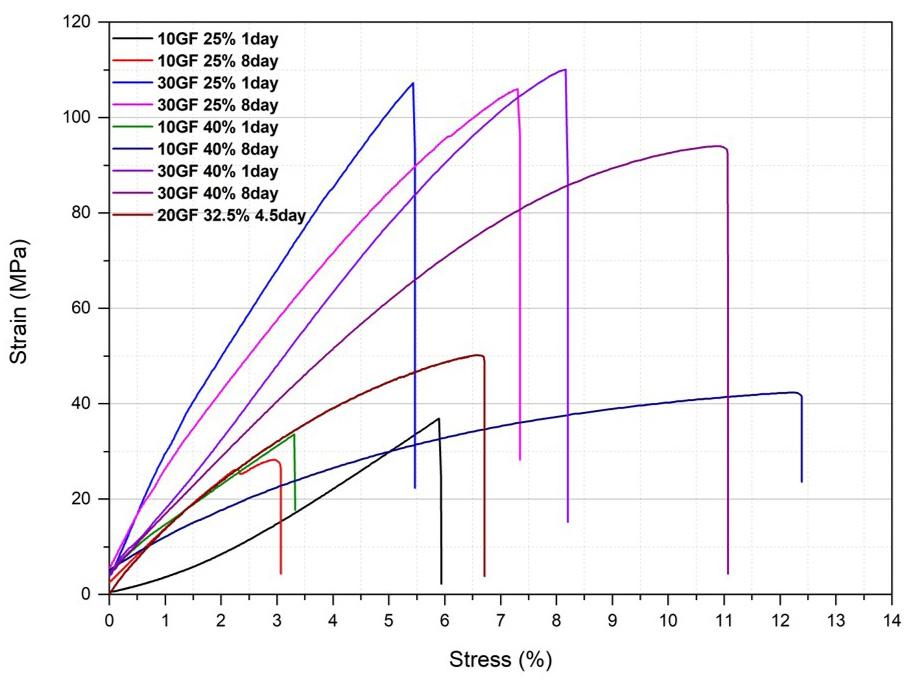
The mathematical model describing the factors influencing moisture absorption is given by: ( ) 1 2313 23 1 2.239073– 0.23935
0.539980.97216–0.16305: 0.23052:
2 98.81%. R =
For other responses, the mathematical models are as follows: ( ) 12312 ’ 2 1488.9 372.5– 288.1 99.0– 113.7: YoungsmodulusY XXXXX =+
2 91.79%. R = ( ) 13 3 50.00 19.869.13 YieldStrengthY XX=+−
2 83.01%. R =
1.553 0.72671:2 0.821:3 1.822:3 1.181:2:3 StrainY XX XXXXX XXXXX
( ) 1 4 7.35 0.672.052
2 93.58%.
2 93.28%. R =
The analysis of variance (ANOVA) confirmed the goodness of fit for the mathematical models, with R-squared values of 0.988 for moisture absorption, 0.9179 for Young’s modulus, 0.8301 for yield strength, 0.9358 for strain, and 0.9328 for impact strength. The F-Test values (p-values) were less than 0.05, indicating that the null hypothesis could be rejected with a probability of less than 5%. Therefore, the models obtained were deemed significant, as the p-values were substantially smaller than 0.05, and the R-squared values were close to 1.0, demonstrating a good fit to the experimental data.
To validate and verify the accuracy of the models, a software tool for easy industry verification was developed,
and the results showed good correlation with the experimental findings. These results will be detailed in a future publication. The mathematical models indicated excellent correspondence with the experimental data.
The ANOVA analysis identified statistically significant interactions. Time (X3) had the greatest effect on moisture absorption (Y1), with minimal impact on Young’s modulus. Glass fiber content (X1) significantly influenced Young’s modulus, and similar trends were observed for yield strength (Y3), where X1 and X3 were the major factors. Temperature (X2) had the most substantial effect on strain (Y4), while X3 had the most significant influence on impact strength (Y5).
According to ANOVA, all main effects and some interaction effects were statistically significant for moisture absorption (Y1), except for the interactions X1X2 (glass fiber and temperature) and X1:X2:X3 (glass fiber, temperature, and time), which had p-values greater than 0.05, rendering them statistically insignificant. Hydration time (X3) and temperature (X2) were the primary factors influencing moisture absorption, with time being more critical. The presence of glass fiber limited moisture absorption, as it does not absorb water as significantly as natural fibers[15,18]. For Young’s modulus (Y2), ANOVA revealed that all main effects and the X1X2 interaction were statistically significant. The amount of glass fiber (X1) had the most substantial effect on Young’s modulus, followed by temperature (X2). Increased fiber content required greater force to achieve deformation, enhancing the material’s resistance to tensile stresses. In contrast, higher hydration temperatures reduced Young’s modulus by improving treatment efficiency and increasing the material’s ductility[15,19-22]
Yield strength (Y3) was primarily influenced by glass fiber content (X1) and time (X3), with the former having the most significant impact. Increased glass fiber content improved tensile strength, while hydration time affected the efficiency of the hydration process, impacting the material’s ductility and yield point[13]
For strain (Y4), all inputs were statistically significant, with temperature (X2), time (X3), and their interaction (X2X3) being the primary contributors. Increased temperature and hydration time improved the composite’s ductility, as evidenced by stress-strain curves f other studies[23,24] . The relationship between Young’s modulus and strain was well-documented, with hydration leading to increased strain due to plasticization of the polymer matrix[13] .
Impact strength (Y5) showed that all main effects were statistically significant, with the X2X3 interaction also significant. Glass fiber content (X1), temperature (X2), and time (X3) contributed significantly to impact resistance, with each factor positively influencing the response. The increase in temperature and time improved the material’s ductility, enhancing its energy dissipation upon impact. Although higher glass fiber content increased material fragility, the fibers helped prevent crack propagation, consistent with findings by Yoo et al.[25] and Hancox and Wells[26]
To optimize the responses of glass fiber content (X1), temperature (X2), and time (X3) on moisture absorption, Young’s modulus, yield strength, strain, and impact strength,
Pereira, A. G. B., & Favaro, S. L. Polímeros, 34(4), e20240039, 2024
Modelling hydration effect on the mechanical performance of polyamide 6.6/glass fibers composites
response surface methodology was employed. Threedimensional plots generated from this analysis are shown in Figure 2 Figure 2a illustrates that moisture absorption increased with temperature (X2) and time (X3), while glass fiber content (X1) had a minimal effect. For Young’s modulus (Y2), increased glass fiber content (X1) improved the response, as shown in Figure 2b. Yield strength (Y3), depicted in Figure 2c, was most affected by glass fiber content (X1), with minimal influence from temperature (X2) and time (X3). Strain (Y4) increased with temperature (X2) and time (X3), as shown in Figure 2d, while impact strength (Y5) increased with all factors, as demonstrated in Figure 2e
Increasing the fiber content in polyamide 6.6 (PA 6.6) composites leads to increased fragility, accompanied by higher values of Young’s modulus, yield strength, and strain, which are intrinsically proportional. The incorporation of glass fibers into the PA 6.6 matrix results in composites that absorb less energy and exhibit a lower damping factor compared to the pure polymer. The absorption of moisture in the composites is directly proportional to both the temperature and duration of hydration, leading to a reduction in the material’s crystalline regions and glass transition temperature. This effect occurs because water acts as a plasticizer, thereby affecting the composite’s mechanical properties.
Under the conditions examined, the impact of hydration was most pronounced on Young’s modulus and strain. The glass fiber content significantly influenced yield strength, aligning with findings by Chaichanawong[13] . However, increased temperature and hydration time were responsible for enhancing the material’s ductility, allowing it to dissipate more energy upon impact. In addition to the response surface plots, the adequacy and predictive capability of the developed model, as verified by the software created by the authors, are detailed in Table 2
The SEM images of the fracture surfaces from the tensile test specimens, shown in Figure 3, reveal distinct fracture characteristics under varying hydration conditions. Specifically, ductile fractures are evident in specimens that experienced higher water absorption. Notably, samples hydrated at 25 °C for 1 day exhibit a higher prevalence of fragile fractures, characterized by a greater number of fiber pull-outs. In contrast, specimens treated at 40 °C for 8 days display regions with ductile fractures. The SEM analysis indicates good interfacial adhesion between the fibers and the matrix. However, as hydration temperature and duration increase, the presence of crevice lines between the fiber and matrix becomes more apparent, which adversely affects the mechanical properties. Additionally, the SEM images reveal fiber-matrix adhesion, which contributes to a significant increase in Young’s modulus and yield strength. This increase is attributed to the high variability in the cross-section of the fibers within the matrix, particularly in composites with higher fiber content[13,14,25] .
The X-ray diffraction patterns, depicted in Figure 4, reveal two prominent peaks indicative of the presence of
the α phase in polyamide 6.6 (PA 6.6). The first peak at 2θ = 20.2° corresponds to the distances between chains connected by hydrogen bonds in the plane (100), while the second peak at 2θ = 22.6° relates to the planes (010) and (110), representing the separation between layers bound by hydrogen bonds[17,26-28]. It is noteworthy that the peak thickness was consistent across all samples.
An observed decrease in peak resolution and an increase in the amorphous halo with higher glass fiber content indicate a reduction in the degree of crystallinity of the composite. This reduction is attributed to the physical obstruction created by the fibers within the matrix, which impedes polymer packing and increases the average distance between the chains, as previously noted by Ota et al.[27]
The melting temperature of the PA 6.6 matrix was approximately 260 °C, as shown in Figure 5. This value aligns with previously reported data[14,29] and is consistent with the information provided in the supplier’s data sheet. Additionally, a notable curvature in the region around 100 °C indicates the presence of adsorbed water within the samples[30,31]
Table 3 displays the values for the heat of fusion and the calculated degree of crystallinity (DC) of the composites, as determined using Equation 2. The degree of crystallinity was found to decrease with increasing temperature and hydration time, which aligns with the observations from the X-ray diffraction (XRD) analysis. According to Fabre et al. [32,33], an increase in the degree of crystallinity typically leads to higher Young’s modulus and yield stress. In this study, higher values of Young’s modulus and yield stress were observed in samples with the same fiber content but hydrated for shorter times and at lower temperatures, which resulted in lower degrees of crystallinity. These findings are consistent with the results obtained from both the XRD and differential scanning calorimetry (DSC) analyses.
Table 2. Comparison between the model and the results obtained for the test condition to 10% at 36 °C for 3 days.
Table 3. Thermal characteristic and degree of crystallinity of PA6.6/ GF composites hydrated under boundary conditions.
Rodrigues, A. O., Fornazaro, G., Silva, G. V. A., Radovanovic, E., Santos, A., Nascimento, H. M., Pereira, A. G. B., & Favaro, S. L.

Polímeros, 34(4), e20240039, 2024
Modelling hydration effect on the mechanical performance of polyamide 6.6/glass fibers composites

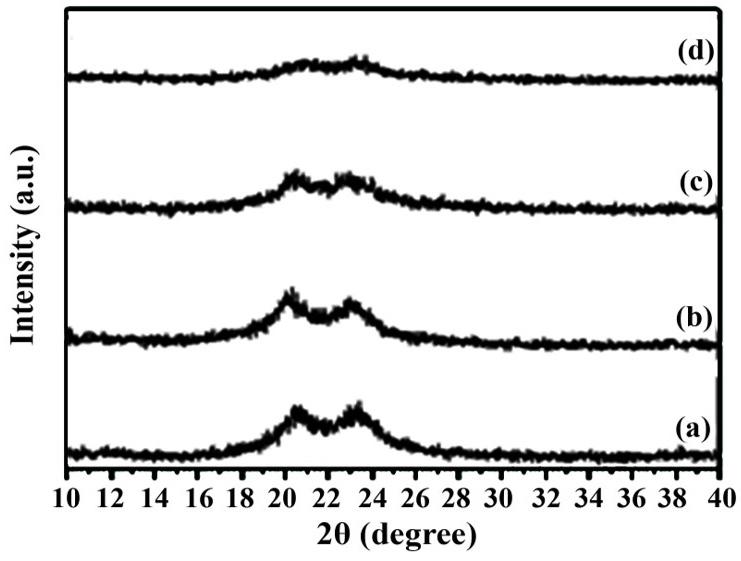
Rodrigues, A. O., Fornazaro, G., Silva, G. V. A., Radovanovic, E., Santos, A., Nascimento, H. M., Pereira, A. G. B., & Favaro, S. L.
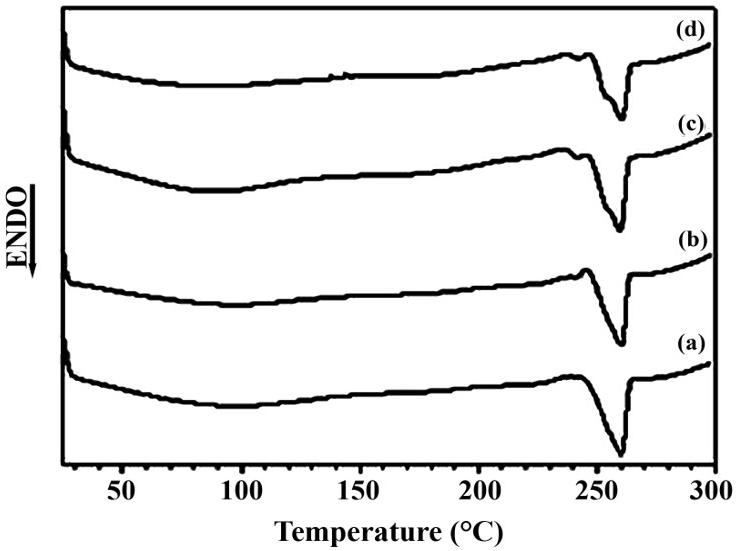
Figure 5. DSC curves of PA6.6/GF composites hydrated under boundary conditions (a) 10% GF 25 °C 1 day, (b) 10% GF 40 °C 8 days, (c) 30% GF 25 °C 1 day and (d) 30% GF 40 °C 8 days.
The conclusion addresses the study objectives by detailing how the influence of hydration parameters and fiber reinforcement on the mechanical properties of polyamide 6.6 (PA 6.6) composites with glass fibers was thoroughly investigated. The influence of hydration parameters and fiber reinforcement on the mechanical properties of polyamide 6.6 (PA 6.6) composites with glass fibers was thoroughly qualified and quantified through mechanical testing and statistical analysis. The primary factors affecting the amount of water absorbed by the composites were found to be hydration time and temperature, in that order of significance. The glass fiber content emerged as the most influential parameter on the mechanical properties of the composites, positively affecting all properties except for strain, confirming the study’s aim to assess how fiber reinforcement affects these properties. The presence of glass fibers also impeded crack propagation during rupture and led to a reduction in the degree of crystallinity of the PA 6.6 matrix. The mechanical test results were corroborated by characterization techniques, fulfilling the objective of validating the findings.
Furthermore, the development of a statistical model to predict tensile strength, impact strength, and flexural properties directly supports the study’s objective of providing predictive capabilities under various conditions. A statistical model was developed to predict the tensile strength, impact strength, and flexural properties of the composites under the studied conditions. To facilitate the application and understanding of these statistical models, a software tool named HIDRAPA was created. This tool aims to simplify and enhance access to the predictive capabilities of the model.
5. Author’s Contribution
• Conceptualization – Silvia Luciana Favaro.
• Data curation – Allan Oliveira Rodrigues.
• Formal analysis – Andressa dos Santos.
• Funding acquisition - Eduardo Radovanovic; Silvia Luciana Favaro.
• Investigation – Allan Oliveira Rodrigues.
• Methodology – Allan Oliveira Rodrigues.
• Project administration – Silvia Luciana Favaro.
• Resources – Silvia Luciana Favaro.
• Software – NA.
• Supervision – Silvia Luciana Favaro.
• Validation – Eduardo Radovanovic.
• Visualization – Gabriel Fornazaro; Gabriel Vinicius Alves Silva.
• Writing – original draft – Antonio Guilherme Basso Pereira.
• Writing – review & editing – Antonio Guilherme Basso Pereira; Gabriel Fornazaro; Gabriel Vinicius Alves Silva; Andressa dos Santos; Hederson Majela do Nascimento.
6. Acknowledgements
This study was financed in part by the Coordenação de Aperfeiçoamento de Pessoal de Nível Superior – Brasil (CAPES) – Finance Code 001. We would like to thank for producing the specimens Haplos Indústria e Comércio Ltda.
7. References
1 Wiebeck, H., & Harada, J. (2005). Plásticos de engenharia: tecnologia e aplicações São Paulo: Editora Artilber
2 Djukic, S., Bocahut, A., Bikard, J., & Long, D. R. (2020). Mechanical properties of amorphous and semi-crystalline semi-aromatic polyamides. Heliyon, 6(4), e03857. http://doi. org/10.1016/j.heliyon.2020.e03857 PMid:32368659.
3 Simielli, E. R., & Santos, P. A. (2010). Plásticos de engenharia: principais tipos e sua moldagem por injeção São Paulo: Artilber
Modelling hydration effect on the mechanical performance of polyamide 6.6/glass fibers composites
4 Sun, J., Zhang, D., Yang, Y., Guo, Z., Fang, Z., Chen, P., & Li, J. (2023). Improving flame retardancy and mechanical properties of polyamide 6 induced by multiple reactions among flame retardants and matrix. Reactive & Functional Polymers, 187, 105590 http://doi.org/10.1016/j.reactfunctpolym.2023.105590
5. Wang, Q., Ge, M., Dou, Y., Yang, F., Wang, J., Shao, Y., & Huang, A. (2020). Engineering ultrafine Pd clusters on laminar polyamide: a promising catalyst for benzyl alcohol oxidation under air in water. Molecular Catalysis, 497, 111203 http:// doi.org/10.1016/j.mcat.2020.111203
6 Arif, M. F., Meraghni, F., Chemisky, Y., Despringre, N., & Robert, G. (2014). In situ damage mechanisms investigation of PA66/GF30 composite: effect of relative humidity. Composites. Part B, Engineering, 58, 487-495 http://doi.org/10.1016/j. compositesb.2013.11.001
7 Callister, W. D., Jr., & Rethwisch, D. G. (2016). Ciência e engenharia de materiais: uma introdução Rio de Janeiro: LTC
8. McIntee, O. M., Welch, B. C., Greenberg, A. R., George, S. M., & Bright, V. M. (2022). Elastic modulus of polyamide thin films formed by molecular layer deposition. Polymer, 255, 125167 http://doi.org/10.1016/j.polymer.2022.125167
9 Fajardo-Diaz, J. L., Takeuchi, K., Morelos-Gomez, A., CruzSilva, R., Yamanaka, A., Tejima, S., Izu, K., Saito, S., Ito, I., Maeda, J., & Endo, M. (2023). Enhancing boron rejection in low-pressure reverse osmosis systems using a cellulose fiber–carbon nanotube nanocomposite polyamide membrane: a study on chemical structure and surface morphology. Journal of Membrane Science, 679, 121691 http://doi.org/10.1016/j. memsci.2023.121691
10 Fu, X., Wang, J., He, Y., Ji, Y., Bi, Q., Wang, X., & Liu, F. (2023). Nanofiltration membrane with asymmetric polyamide dual-layer through interfacial polymerization for enhanced separation performance. Desalination, 564, 116806. http:// doi.org/10.1016/j.desal.2023.116806
11 Sam-Daliri, O., Ghabezi, P., Steinbach, J., Flanagan, T., Finnegan, W., Mitchell, S., & Harrison, N. (2023). Experimental study on mechanical properties of material extrusion additive manufactured parts from recycled glass fibre-reinforced polypropylene composite. Composites Science and Technology, 241, 110125 http://doi.org/10.1016/j.compscitech.2023.110125
12 Petraşcu, O.-L., & Pascu, A.-M. (2023). Comparative study of polyamide 6 (PA6) and polyamide 6 reinforced with 30% of glass fiber (PA6GF30). Materials Today: Proceedings, 6(Part 4), 625-626 http://doi.org/10.1016/j.matpr.2023.04.112
13. Chaichanawong, J., Thongchuea, C., & Areerat, S. (2016). Effect of moisture on the mechanical properties of glass fiber reinforced polyamide composites. Advanced Powder Technology, 27(3), 898-902 http://doi.org/10.1016/j.apt.2016.02.006
14 Ştefănoaea, N., & Pascu, A. M. (2022). Study of implementation the tensile data of the glass fiber reinforced polyamide into the finite element analyses. Materials Today: Proceedings, 93(Part 4), 736-742 http://doi.org/10.1016/j.matpr.2023.06.026
15 Zhang, S., Huang, Z., Zhang, Y., & Zhou, H. (2015). Experimental investigation of moisture diffusion in short-glass-fiber-reinforced polyamide 6,6. Journal of Applied Polymer Science, 132(37), 42369 http://doi.org/10.1002/app.42369
16. Hassan, A., Rahman, N. A., & Yahya, R. (2012). Moisture absorption effect on thermal, dynamic mechanical and mechanical properties of injection-molded short glass-fiber/polyamide 6, 6 composites. Fibers and Polymers, 13(7), 899-906 http://doi. org/10.1007/s12221-012-0899-9
17 Teixeira, D., Giovanela, M., Gonella, L. B., & Crespo, J. S. (2013). Influence of flow restriction on the microstructure and mechanical properties of long glass fiber-reinforced polyamide
6.6 composites for automotive applications. Materials & Design, 47, 287-294 http://doi.org/10.1016/j.matdes.2012.12.030
18 Montgomery, D. C. (2013). Design and analysis of experiments New York: John Wiley & Sons
19 Kumar Maurya, A., Kumar, S., Singh, M., & Manik, G. (2023). Polyamide fiber reinforced polymeric composites: a short review. Materials Today: Proceedings, 80(Part 1), 98-103 http://doi.org/10.1016/j.matpr.2022.10.171
20 Pai, R., Bangarappa, L., Lokesh, K. S., Shrinivasa Mayya, D., Naveen, C. R., & Pinto, T. (2022). Hybridization effect on water absorption and flexural properties of E-glass/banana fibre/epoxy composites. Materials Today: Proceedings, 52(Part 3), 1841-1845 http://doi.org/10.1016/j.matpr.2021.11.491
21 Silva, L., Tognana, S., & Salgueiro, W. (2013). Study of the water absorption and its in fl uence on the Young’s modulus in a commercial polyamide. Polymer Testing, 32(1), 158-164 http://doi.org/10.1016/j.polymertesting.2012.10.003
22 Pizzorni, M., & Prato, M. (2023). Effects of hygrothermal aging on the tensile and bonding performance of consolidated 3D printed polyamide-6 composites reinforced with short and multidirectional continuous carbon fibers. Composites. Part A, Applied Science and Manufacturing, 165, 107334. http:// doi.org/10.1016/j.compositesa.2022.107334
23 Taktak, R., Guermazi, N., Derbeli, J., & Haddar, N. (2015). Effect of hygrothermal aging on the mechanical properties and ductile fracture of polyamide 6 : experimental and numerical approaches. Engineering Fracture Mechanics, 148, 122-133 http://doi.org/10.1016/j.engfracmech.2015.09.001
24 Ferreño, D., Carrascal, I., Ruiz, E., & Casado, J. A. (2011). Characterisation by means of a fi nite element model of the in fl uence of moisture content on the mechanical and fracture properties of the polyamide 6 reinforced with short glass fi bre. Polymer Testing, 30(4), 420-428 http://doi.org/10.1016/j. polymertesting.2011.03.001
25 Yoo, Y., Spencer, M. W., & Paul, D. R. (2011). Morphology and mechanical properties of glass fi ber reinforced Nylon 6 nanocomposites. Polymer, 52(1), 180-190 http://doi. org/10.1016/j.polymer.2010.10.059.
26 Hancox, N. L., & Wells, H. (1973). Izod impact properties of carbon-fibre/glass-fibre sandwich structures. Composites, 4(1), 26-30 http://doi.org/10.1016/0010-4361(73)90292-9
27 Ota, W. N., Amico, S. C., & Satyanarayana, K. G. (2005). Studies on the combined effect of injection temperature and fiber content on the properties of polypropylene-glass fiber composites. Composites Science and Technology, 65(6), 873881 http://doi.org/10.1016/j.compscitech.2004.10.025
28 Li, J., Zuo, Y., Cheng, X., Yang, W., Wang, H., & Li, Y. (2009). Preparation and characterization of nano-hydroxyapatite/ polyamide 66 composite GBR membrane with asymmetric porous structure. Journal of Materials Science. Materials in Medicine, 20(5), 1031-1038. http://doi.org/10.1007/s10856008-3664-2 PMid:19115093.
29 Ji, W., Wang, X., Ding, T., Chakir, S., Xu, Y., Huang, X., & Wang, H. (2023). Electrospinning preparation of nylon-6@ UiO-66-NH2 fiber membrane for selective adsorption enhanced photocatalysis reduction of Cr(VI) in water. Chemical Engineering Journal, 451(Part 4), 138973 http:// doi.org/10.1016/j.cej.2022.138973.
30 Wang, K., Zhao, K., Meng, Q., Li, X., Bai, Q., Jiao, H., & Tang, Y. (2022). Preparation of zirconium carbide nanofibers by electrospinning of pure zirconium-containing polymer. Ceramics International, 48(17), 25474-25483 http://doi. org/10.1016/j.ceramint.2022.05.226
31. Wang, P., Ke, L., Sze, A. N. S., Wang, Z., Zhao, J., Li, W., & Leung, C. K. Y. (2023). Effects of relative humidity, alkaline concentration and temperature on the degradation of plain/
Rodrigues, A. O., Fornazaro, G., Silva, G. V. A., Radovanovic, E., Santos, A., Nascimento, H. M., Pereira, A. G. B., & Favaro, S. L.
coated glass fibers: experimental investigation and empirical degradation model. Construction & Building Materials, 391, 131757 http://doi.org/10.1016/j.conbuildmat.2023.131757
32 Men, Y., & Rieger, J. (2004). Temperature dependent wide angle X-ray diffraction studies on the crystalline transition in water saturated and dry polyamide 6/66 copolymer. European Polymer Journal, 40(11), 2629-2635 http://doi.org/10.1016/j. eurpolymj.2004.07.003
33 Fabre, V., Quandalle, G., Billon, N., & Cantournet, S. (2018). Time-temperature-water content equivalence on dynamic mechanical response of polyamide 6, 6. Polymer, 137, 22-29 http://doi.org/10.1016/j.polymer.2017.10.067
Received: May 13, 2024
Revised: Sept. 09, 2024
Accepted: Sept. 17, 2024
Polímeros, 34(4), e20240039, 2024
Giovanna
Marsura1 , Juliana Otavia Bahú2 , Laura Plazas Tovar1* , Romilda Fernandez-Felisbino1 and Eliezer Ladeia Gomes1
1Departamento de Engenharia Química, Universidade Federal de São Paulo – UNIFESP, Diadema, SP, Brasil
2Centro de Estudos de Energia e Petróleo, Universidade Estadual de Campinas – Unicamp, Campinas, SP, Brasil
*laura.tovar@unifesp.br
Obstract
Recycling polyvinyl chloride (PVC) is a significant challenge for the footwear industry due to its short lifecycle and environmental impact. This study focused on recycling thermoplastic polyvinyl chloride (rPVC) from used sports shoes, sourced from a recycling company. The rPVC and thermoplastic polyurethane (TPU) were melt-blended and prepared using industrial injection molding with varying compositions. These polymer blends were then characterized morphologically, thermally, and mechanically. The recycled polymer blends demonstrated improved properties compared to the virgin polymers. Blending TPU with rPVC resulted in a material with notable hardness and enhanced abrasion resistance, with TPU/rPVC blends (67/33 and 50/50 wt.%) showing double the abrasion resistance of pure PVC. Additionally, the rPVC blend exhibited a rupture strength of 14.73 MPa, 1.6 times greater than virgin PVC. The TPU/ rPVC blend (50/50 wt.%) also offered higher deformation resistance, indicating a more entangled and tensile structure. These advancements support the development of environmentally friendly footwear
Keywords: circular economy, polymer blend, polyvinyl chloride, thermoplastic polyurethane, upcycling
How to cite: Marsura, G., Bahú, J. O., Plazas Tovar, L., Fernandez-Felisbino, R., & Gomes, E. L. (2024). Recycled PVC to eco-friendly materials for footwear industry: process and mechanical properties. Polímeros: Ciência e Tecnologia, 34(4), e20240040, https://doi.org/10.1590/0104-1428.20240064
The footwear industry promotes about 1.4% of global GHG emissions[1], and this encourages the footwear industry to improve its perception of environmental management by reusing different materials and footwear parts, improving profitability, and reducing operating costs[2]. Footwear comprises canvas, leather, and petrochemical-derived materials (plastic and rubber), and the design can be developed using faux leather made of synthetic components such as polyvinyl chloride (PVC) or thermoplastic polyurethane (TPU). Specifically, the sole comprises PVC (~8% wt. %) and TPU (~17% wt. %), and their blends[3]
Recycling the PVC materials used in shoe soles is crucial for promoting sustainable development and reducing pollution. Various methods, such as incineration, landfill, and mechanical, chemical, thermal, and biological recycling, have been employed for decades. However, these methods have resulted in increased emissions of hazardous exhaust gases, reduced landfill capacity by up to 10% by 2030 and high energy consumption[4]. Therefore, there is a need to explore alternative options for recycling materials based on TPU and PVC. Few studies have investigated the properties of TPU/PVC blends with recycled plasticized PVC (r-PVC)[5]. Interesting properties were obtained with
50% TPU/PVC blends, which showed better mechanical (impact strength) and chemical resistance[6]. The plasticizer action of TPU in the polymer blend was also noted since the deformability increased with TPU content, lowering its rigidity[7]. The abrasion resistance[8] and elongation at break[9] of these blends can also be improved by regulating the TPU content. However, these blends commonly use crosslinking agents, plasticizers, or modifiers[10], to improve the TPU miscibility in the PVC polymeric chains and enhance some mechanical properties.
The actual processing of the blends can also influence their final properties[11]. Injection molding, the typical processing method used to produce TPU-PVC shoe soles, involves parameters such as temperature, screw – shape, rotation speed and injection pressure, which affect the TPU/PVC performance[12]. The injection molding process allows for the preparation of blends to combine polymers and seek to integrate their best physical and chemical properties, producing a final material with more interesting characteristics, reducing costs, and obtaining eco-friendly end-products[2].
Adding TPU to PVC or recycled PVC to produce PVCbased blends is attractive from a commercial point of view,
Marsura, G., Bahú, J. O., Tovar, L. P., Fernandez-Felisbino, R., & Gomes, E. L.
and benefits from achieving some of the SDGs agenda, such as Goal 15: Life on land providing a mitigation strategy for the carbon footprint. Their production encounters challenges due to the miscibility issues between PVC and TPU[7], and achieving desirable properties under conventional blending and reprocessing conditions remains difficult. Significant efforts have been devoted to understanding recycled PVC, but there is a notable gap in research on recycled PVC from the footwear industry, a readily available material. In this study, the properties of pure TPU/PVC and TPU/rPVC polymer blends processed by injection molding without other extra components (additives or fillers) are compared. The properties measured regarding shoe applications (density, abrasion, mechanical strength, thermal stability) substantiated the potential for the applicability of the reprocessed PVC blend (TPU/rPVC) for shoe soles, also contributing to the sustainability of the footwear sector.
2.1 Pure PVC, Pure TPU, and Recycled PVC materials
This research utilized pure polyvinyl chloride pellets (PVC) 60A (Braskem Co, Brazil, CAS number 9002-86-2, hardness 50–65 Shore A) and pure thermoplastic polyurethane pellets (TPU) Desmopan 3972AW (NeoRez® R-3972, Covestro Polymer Industry and Trade Ltda., Brazil, hardness 71–75 Shore A). Recycled PVC (rPVC) was sourced from Prisma Thermoplastic Compounds Ltda. (Campo Bom, Rio Grande do Sul, Brazil) and derived from the soles of various used sports shoes, primarily composed of PVC polymer. PVC and TPU were used as received, without additional treatment.
2.2 Recycled PVC Pretreatment
The pretreatment began with the rPVC (as received) being manually sorted into broad categories (such as “free-from-fragments” and “with-fragments”) and the other sole components (other polymers), glass, paper, and metal components, such as eyelets, removed. The samples were then manually washed with soap and water, ultrasonicated to remove minor contaminants, dried in an air circulation oven at 80 °C for 3 hours, and subsequently automatically shredded and ground, the sieve size fraction used in this study is 2.8–4 mm. The pretreated rPVC was kept in the zipper bags for further processing and characterization.
Before melt blending, the PVC, TPU, and rPVC samples were dried at 80 °C for four hours in an air circulation oven. The polymer blends were prepared by melt-mixed extrusion using a co-rotating twin-screw extruder coupled to an industrial injection molding machine (1500-740 LHN ACTUAL; HIMACO, Novo Hamburgo, Brazil) at a temperature of 80 °C with a screw speed of 200 rpm. The extrudate was cooled to solidification and then cut into pellets using a pelletizer. The polymer blends were dried at 80 °C for three hours in an air circulation oven and then kept in desiccators for 24 hours before injection molding. The electrical injection unit has a maximum injection velocity varying from 34 to57 g s−1 (hydraulic motor torque of 100.6 kgfm)
facilitated by a four-zone (barrel/mold) screw varying from 50 to 65 mm diameter (L/D varying from1:18 to 1:13.8) and an injection volume varying from 406 to 687 cm3 The nozzle, barrel and mold temperatures were maintained at 80, 160-170, and 120 °C, respectively (based on industrial operation). The TPU/PVC blend ratios were 100/0, 33/67, 50/50, 67/33, and 0/100 (wt.%) and the TPU/rPVC blend ratios were 50/50, 67/33, and 0/100 (wt.%).
2.4.1 Density, thermogravimetric (TGA/DTG) and X-Ray Diffraction (XRD) analyses
Density was measured following ASTM D972 at around 25 °C, with results averaged from triplicates.
Polymer blends were examined using a Shimadzu DTG 60 thermogravimetric analyzer with platinum crucibles and approximately 10 mg samples, heated from room temperature to 600 °C at 10 °C/min in an oxidizing atmosphere (air flow rate=50 mL min-1).
The diffractograms were obtained using a Bruker model D8 Advance diffractometer. The radiation was emitted by a Cu-Kα laser emitter (λ = 1.5418°), operating at 40 kV and 30 mA from 5 to 80° (2θ), with a Ni filter and angular speed of 2° min-1 .
2.4.2 Shore A Hardness
Shore A hardness was measured per ASTM D2240 using an analog tester with a 6 mm thick indenter, with data collected from three specimen points.
2.4.3 Abrasion resistance
The abrasion resistance was analyzed at room temperature according to the DIN ISO 4649 standard, using a MAQTEST abrasimeter using the following parameters: A cylindrical bar with corundum (aluminum oxide) grit 60 rotating at 40±1 cycles per minute, 4.2±0.4 mm lateral displacement, 150±0.2 mm cylinder diameter, 40±0.2 mm abrasion course, and 5.0±0.1 or 10.0±0.2 N vertical pressure (compression). The vertical inclination of the center of the axis of the specimen support was 3°, and the horizontal distance between the center of the cylinder and the center of the gripper was < 1 mm. Thus, the volume loss in mm3 of the sample (∆V) is defined as the ratio between the mass loss (∆M in g) and the volume bulk density of the sample (ρB in g mm-3). The results reported the mean value of triplicate experiments.
2.4.4 Tensile strength analysis
The tensile strength was determined in an EMIC –DL2000 universal testing equipment according to ASTM D638, using the 500 N load cell. The TPU samples were previously annealed at 90 °C for 20 h before the compression tests, resulting in a mean value of quintuplicate measurements.
3.1 Samples and X-Ray Diffraction (XRD)
Figure 1a, b shows the images of the polymeric blend specimens, TPU/PVC (100/0, 33/67, 50/50, 67/33,
Recycled PVC to eco-friendly materials for footwear industry: process and mechanical properties
0/100 wt.%), and TPU/rPVC (50/50, 67/33, 0/100 wt.%), respectively. No pores were found on their surfaces. Moreover, the injection molded plates presented an excellent visual appearance, free of bubbles and lumps and well-leveled. In Figure 1b, the specimens had a purplish color due to the PVC reused in recycling, and no transparency was observed. However, the coloration of the rPVC and its blends was homogeneous, with no thermal decomposition. Regarding texture, the recycled PVC and its blends were softer to the touch, and no porosity was noticed. The TPU/ rPVC (33/67) blend had technical problems and could not be produced with the injection molding machine used in this work (image not shown).
The addition of PVC to the TPU did not alter the diffraction patterns (Figure 1c) of the TPU/PVC blends produced via mechanism described in Supplementary Material (S1 and Figure S1). These results indicated that the blends remained amorphous polymers, independent of the PVC added. In addition, some small diffraction peaks
were observed at 42.6 and 49.4° for the pure TPU and its blends, which might be related to the additives used in the formulation of the TPU. According to the manufacturer, up to 2 wt.% of these additives (anti-hydrolysis agents, UV stabilizers, etc.) are added to improve the polymerspecific properties or processing characteristics[13]. Previous studies have also reported that TPU/PVC blends generally maintain an amorphous structure because of the nature of both polymers. For instance, Laukaitiené et al.[7] noted that TPU/PVC blends exhibit no significant crystallinity changes in XRD patterns, similar to the observations in this study.
Density measurements are crucial for screening qualified samples before conducting further mechanical testing. As the TPU content increased, the density of the TPU/ PVC polymer blends decreased. Specifically, the densities of the TPU/PVC polymer blends were measured as 1.209, 1.192, 1.196, 1.199, and 1.183 g/cm3 for TPU contents

Figure 1. Visual appearance of the specimens (a) TPU/PVC polymer blends: (1) 0/100 wt.%, (2) 33/67 wt.%, (3) 50/50 wt.%, (4) 67/33 wt.%, (5) 100/0 wt.%; and (b) TPU/rPVC polymer blends: (1) 0/100 wt.%, (2) 50/50 wt.%, and 67/33 wt.%; (c) diffractograms of the polymer samples (pure TPU, TPU/PVC (50/50 wt.%) blend, and TPU/PVC (67/33 wt.%) blend.
Marsura, G., Bahú, J. O., Tovar, L. P., Fernandez-Felisbino, R., & Gomes, E. L.
of 0%, 33%, 50%, 67%, and 100 wt.%, respectively (see Supplementary Material, Figure S2). The densities calculated for the mixtures based on the densities of PVC (1.209 g/ cm3) and TPU (1.183 g/cm3) accurately predicted these results, indicating that the number of voids in the blends was minimal. This consistency suggests that the melt blending conditions used were appropriate for this study.
The observed decrease in density with increasing TPU content aligns with the fact that TPU generally has a lower density than PVC[14]. However, it is important to address that TPU used in this study is a linear block copolymer, which differs from what might be implied by a “heterogeneous polymeric chain”. In contrast to PVC, which has a more compact structure due to significant intermolecular forces, such as dipolar interactions between polymer chains, the density of TPU is lower not only because of its polymeric structure, but also because of its lower inherent density and less efficient packing. PVC’s denser PVC structure results from strong intermolecular forces that enhance its compactness during the injection process.
The average apparent density of the TPU/rPVC polymer blend was 1.243 g/cm3 (67/33 wt.%), 1.229 g/cm3 (50/50 wt.%), and 1.267 g/cm3 (0/100 wt.%). These findings corroborate recent research indicating a significant increase in the apparent density of TPU/rPVC polymer blends with higher PVC content[5,6]. This trend of decreasing density with increasing TPU content was also observed in the present study (Supplementary Material, Figure S2).
TGA and DTG measurements were used to investigate the thermal stability of the TPU/PVC and TPU/rPVC blends. Table S1 (in Supplementary Material) reports the maximum decomposition temperatures obtained by TG/DTG curves. Figure 2a, b depicts the TGA profiles with four stages of thermal decomposition. The small degradation stage occurred in the temperature range from 100 to 145 °C, which can be attributed to the evaporation of water adsorbed on the polymer surface. The next degradation stage was in the temperature range from 145 to 367 °C, representing the main stage with a 79.0% mass loss (Figure 2a). According to Hamidi[15], dehydrochlorination and the formation of aromatic compounds from PVC can occur. However, the three peaks that appeared during this stage (at 189, 259, and 285 °C) suggest intermediate degradation stages related to interconnected chain scission mechanisms, due to the gradual reaction with oxygen. The third stage started at 365 °C with the appearance of three more peaks at 419, 430, and 451 °C, and ended at 480 °C, with a 13.0% mass loss (Figure 2a) related to the polyenes suffering scission in the oxidant atmosphere. Nagy et al.[14] discussed the oxidation mechanisms of polyenes during the thermal degradation of PVC, reporting that they occur in distinct steps. The last degradation stage was noted in the range from 480 to 530 °C with an 18.0% mass loss, related to the backbone of the polymer blend.
The TGA plots of the TPU/PVC polymer blends showed a behavior that appeared to be dictated by the PVC, mainly at 250 and 390 °C (Figure 2a). Above this temperature, the stages became similar, be it the pure polymer or the blend.
Figure 2b shows a shift of the maximum decomposition temperature (Td = 257 °C) as the TPU concentration decreased. The value of Td shifted with increasing PVC or rPVC content due to extra interactions with the TPU, destabilizing the polymer blend. Thus, the addition of PVC or rPVC to TPU resulted in interactions that disrupted the thermal stability of the polymer blend. These interactions could be chemical, such as reactions between PVC/rPVC and TPU, or physical, such as changes in the heat distribution within the blend. Moreover, in the temperature range of 490 – 550 °C, the TPU/rPVC polymer blends underwent a significant weight loss, estimated at 12% (Figure 2b). The shift in the decomposition temperature range of the blend is attributed to the stabilization of the TPU by the migration of stabilization components from the rPVC.
The hardness of pure TPU is related to the ratio of the rigid and flexible segments in its polymeric chains. According to Kim et al.[16], a 2.1 ratio (rigid/soft segments) corresponds to a TPU hardness of 70, in agreement with the TPU evaluated here (Figure 3a), which presented a Shore A hardness of 76 and a rigid/flexible segments ratio close to 2.8.
Regarding the TPU/PVC polymer blends, the Shore A hardness decreased slightly with the addition of PVC (TPU/ PVC (33/67 wt.%) – Figure 3a), and up to the TPU/PVC blend composition of (67/33 wt. %), the Shore A hardness remained practically unaltered (Figure 3a). However, from this point up to the pure PVC, the Shore A hardness drastically reduced (Figure 3a), characterizing a non-linear behavior for this parameter. The recycled PVC Shore A hardness was higher than that of virgin PVC (75 > 62), in agreement with the data informed by the suppliers. Thus, the rPVC impacted the Shore A hardness of the TPU/rPVC polymer blends, which remained practically constant at any composition, ranging from 74–76 (Figure 3a). After reprocessing the PVC (rPVC), the Shore A hardness enhanced the thermal degradation of the process, which can decrease the polymer molar mass by reducing the polymeric chain size[17]. Also, to improve its flexibility, the plasticizer added to the PVC formulation could “detach” from the main PVC polymeric chain, reducing the flexibility of the PVC.
The rPVC polymer blends showed a Shore A hardness equivalent to that of pure TPU, which positively impacts the footwear industry, allowing for the possibility of using polymeric upcycling strategies[18]. This enables the replacement of virgin polymers (pure PVC) by recycled ones (rPVC) to produce polymeric soles with high-quality properties.
In the abrasion test, the volume loss of the specimen after testing is inversely proportional to its abrasion resistance. Analyzing the results for TPU, virgin PVC, rPVC, and their blends, an increase in abrasion resistance can be seen as the amount of TPU in the blend increases (Figure 3b). The abrasion resistance of the TPU-PVC and TPU-rPVC blends revealed significant differences in their performance. The pure TPU exhibited the highest abrasion resistance at 30 mm3, highlighting its durability. As the PVC content increased, the abrasion loss increased for the TPU/PVC
Recycled PVC to eco-friendly materials for footwear industry: process and mechanical properties
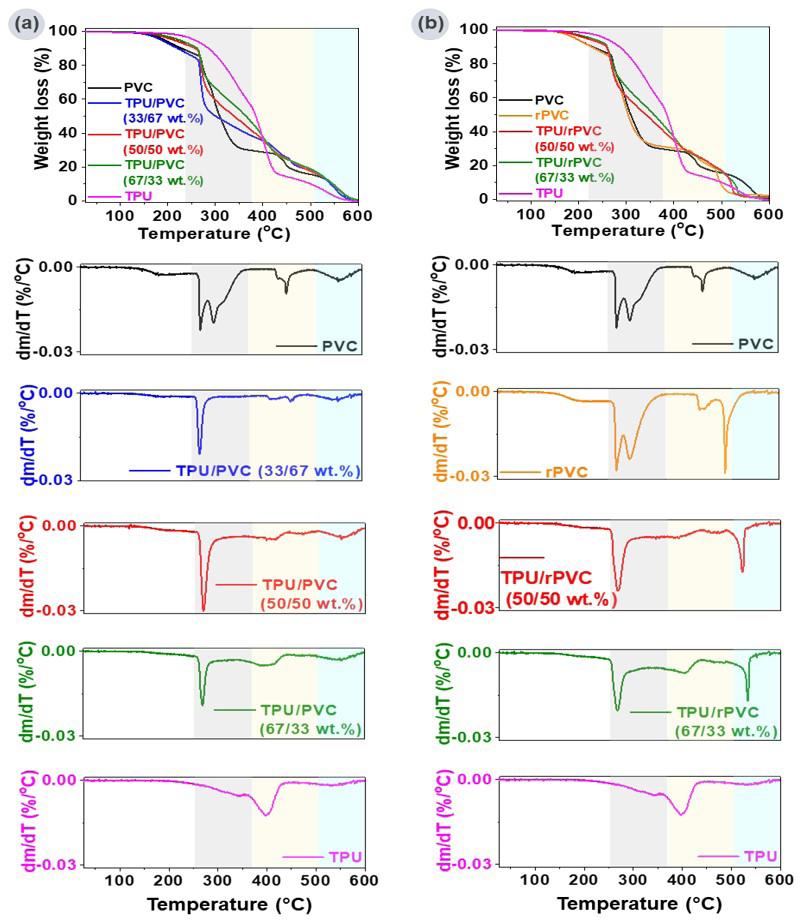
(33/67 wt. %) showing 110 mm3, compared to pure PVC at 120 mm3. In contrast, the rPVC blends consistently performed better than PVC blends. For instance, TPU/ rPVC (67/33 wt. %) shows 49 mm3 abrasion loss, lower than the 60 mm3 for TPU/PVC (67/33 wt.%) blend. This trend continued with equal concentrations of TPU and PVC/rPVC, with the rPVC blend (76 mm3) outperforming the PVC blend (97 mm3). These results suggest that, while TPU remains the most resistant to abrasion, incorporating rPVC instead of PVC can improve abrasion resistance in blends, making it a potentially better choice for applications where durability is crucial. The blends prepared with pure PVC had no linear trend, which might be related to an incompatibility between the PVC and TPU thermoplastics[9]
This is evident for blends with a higher proportion of virgin PVC. However, when the percentage of PVC is above 50 wt.%, the abrasion resistance starts to vary at a lower rate (Figure 3b). Another study demonstrated superior abrasion resistance for TPU/rPVC polymer blends (70/30 and 50/50 wt.%) as compared to pure and virgin PVC[8]. These blends reduced the need for solvent cleaning before use as an adhesive, reducing the amount of volatile organic compounds (VOCs) in the workplace. In addition, the costs of applying this blend were much lower than applying pure TPU. Ames[8] suggested that the blend TPU/rPVC (70/30 wt.%) showed the best processing conditions, as also observed in the present work for the TPU/rPVC blend (67/33 wt.%).
Marsura, G., Bahú, J. O., Tovar, L. P., Fernandez-Felisbino, R., & Gomes, E. L.
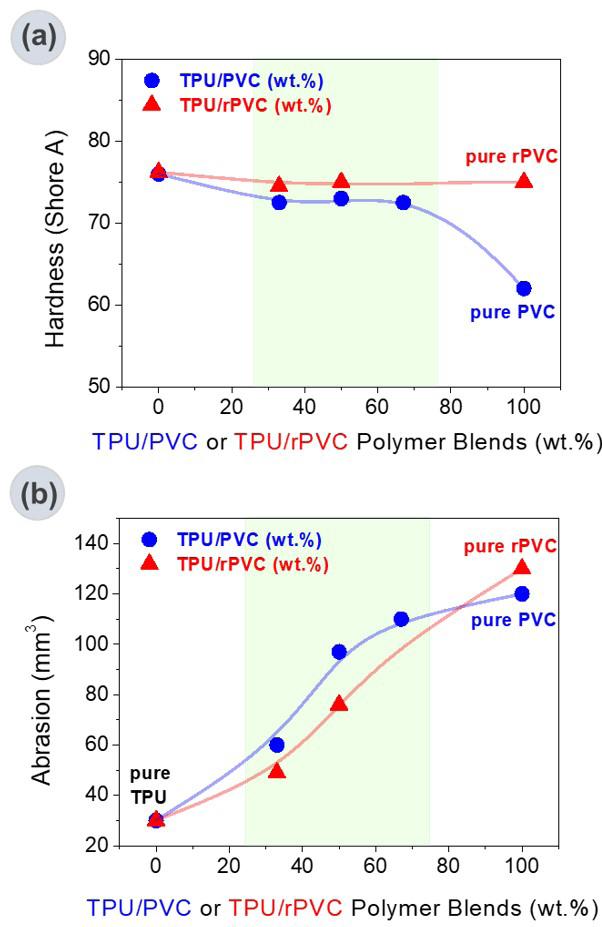
Figure 3. (a) Shore A hardness of the TPU/PVC and TPU/rPVC polymer blends. (b) Abrasion test results of the TPU/PVC and TPU/rPVC polymer blends.
Abrasion resistance is an essential property in the footwear industry, more specifically for shoe soles, since it is directly related to the main mechanical stress the sole suffers, extending its life cycle. According to the results, blends containing rPVC (30–50 wt%) could be a good option for a line of sustainable casual shoes, being linked to upcycling and sustainable development.
The visual appearance of the specimens (Figure 4 a and b) after the tensile test was registered to assess the type of fracture and the stress caused by stretching. Table S2, from the Supplementary Material, summarizes the tensile test data for the polymers and blends evaluated. Also, Figures S3-S5 (Supplementary Material) present the force versus deformation curves for all the specimens and their replicates evaluated. For the virgin PVC and rPVC blends, elongation at rupture increased with an increase in the proportion of TPU in the blend, consistent with the flexible nature of TPU. Virgin TPU did not fracture during the test, evidence of its highly elastic behavior. The addition of virgin PVC shifts the force-deformation curves upwards (Figure 4c and d), with the material becoming more resistant to deformation due to the increase in Young’s modulus, but not linearly as expected. In general, the blends have greater or equal tensile strength, deforming less at a specific applied force than
pure PVC or TPU. This means that the interaction between the flexible/rigid segments of linear PVC or TPU chains provides materials with structures that are more resistant to deformation than individual polymers. The linear portion of the curves referring to virgin PVC (Figure 4c), with elastic deformation occurring up to 25 mm (applied force between 23–27 N). Except for pure TPU, the elastic limit occurred with 10 mm deformation (≈12 N) with a slight variation for TPU/PVC (67/33 wt.%) blend. This blend (Figure 4c) behaved similarly to TPU, but the presence of PVC made the material more resistant than all the other polymers and blends. The addition of 33 wt.% of PVC to the TPU provided desirable characteristics for better resistance of a shoe sole.
The addition of recycled PVC led to blends that were more deformation-resistant than pure TPU (Figure 4d), showing strength that was intermediate between TPU and recycled PVC, especially regarding the plastic deformation region. More significant tensile strengths were gradually obtained as the proportion of rPVC in the blend increased, with the linear chains of recycled PVC (smaller and more compact) gradually interreacting and intertwining with the flexible/rigid TPU segments, providing stronger materials as the proportion of recycled PVC increased. The elastic region behaved slightly differently from the plastic region. The elastic region (the linear portion of the curve) occurred up to ≈20 mm (applied force ≈30 N), except for pure TPU, and in this region the TPU/rPVC (50/50 wt.%) blend was slightly more resistant to deformation (black line) than pure PVC or the TPU/rPVC (67/33 wt.%) blend. In this case, the addition of 50 wt.% rPVC to the TPU might be interesting for some applications.
The addition of TPU to PVC alters its mechanical properties, increasing the elongation at break and decreasing the tensile strength. Similar effects have been observed in TPU/polypropylene blends, where a ductile-to-brittle transition occurs at specific blend ratios[19]. The miscibility of segmented polyurethanes (SPUs) and PVC blends depends on the hard-segment content of SPU and the presence of functional groups in PVC[20]
Figure 5a shows the elasticity modules of the blends. Comparing PVC and recycled PVC, the latter showed greater tensile strength and a larger elasticity modulus. For each type of PVC blend, the highest tensile strengths were TPU/PVC (67/33 wt.%) and TPU/rPVC (50/50 wt.%). Polyurethanes (TPU) generally show remarkable mechanical properties, with tensile strengths ranging from 20–60 MPa and elongation from 300 to 650%[21]. On the other hand, PVC has a tensile strength between 10–25 MPa and elongation between 150-400%[22]. The rupture strength curve (Figure 5b) for the TPU/PVC polymer blend (blue line) exhibited a rupture strength that has an inverse relationship with PVC content. This inverse correlation arises from the increased flow of TPU polymeric chains, necessitating a higher force for rupture. Notably, the TPU/rPVC blend with a TPU/rPVC composition of (67/33 wt.%) showed the highest rupture strength evaluated, surpassing that of pure TPU. The rupture strength of rPVC (14.73 MPa) was higher than that of virgin PVC (9.11 MPa), and the rPVC polymer blends with compositions similar to those of virgin PVC blends also showed higher tensile strengths. This result reinforces that
Polímeros, 34(4), e20240040, 2024
Recycled PVC to eco-friendly materials for footwear industry: process and mechanical properties
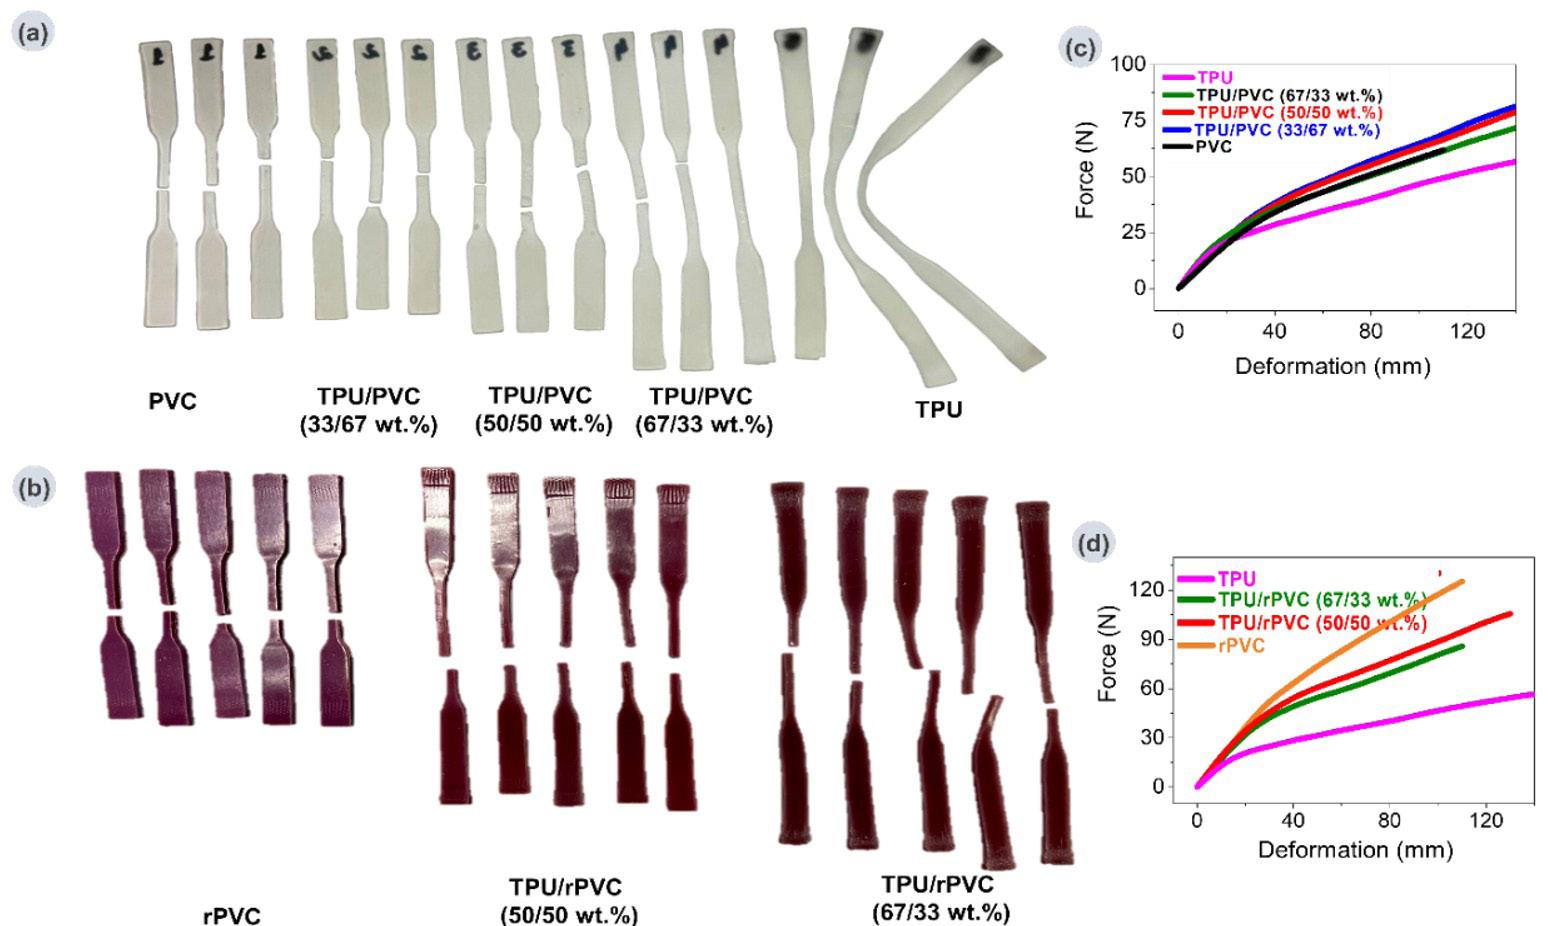
Figure 4. Specimens after applying the tensile test: (a) TPU/PVC polymer blends (0/100, 33/67, 50/50, 67/33, 100/0 wt.%); (b) TPU/rPVC polymer blends (0/100, 50/50, 67/33 wt.%). Force (N) versus deformation (mm) curves of: (c) TPU/PVC polymer blends (0/100, 33/67, 50/50, 67/33, 100/0 wt.%); (d) TPU/rPVC polymer blends (0/100, 50/50, 67/33 wt.%). Curves represent average behavior for each group.
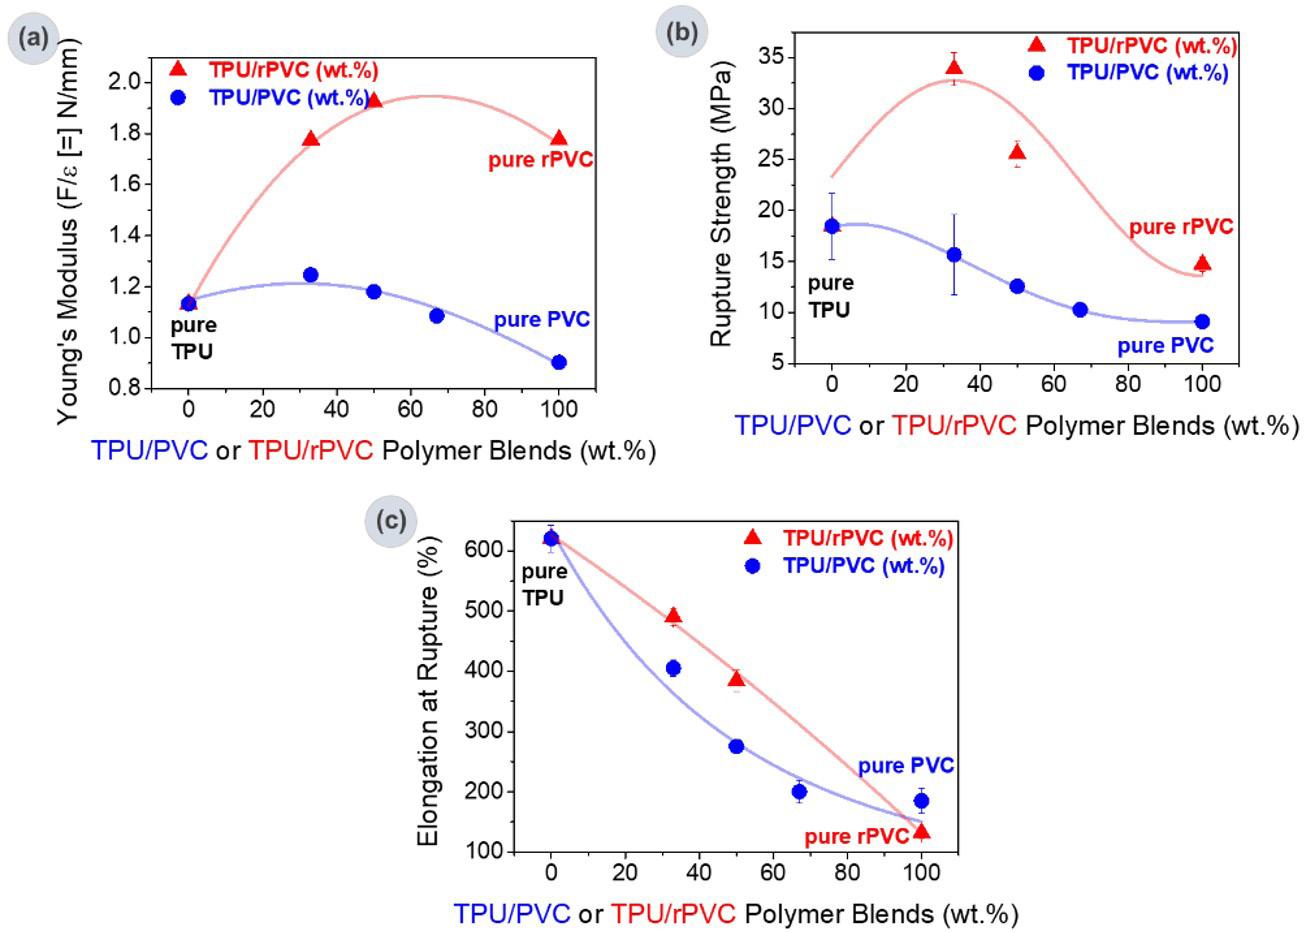
5. Results of mechanical testing of TPU, PVC, rPVC, and their blends: a) Young’s modulus; b) rupture strength; c) elongation at rupture.
Marsura, G., Bahú, J. O., Tovar, L. P., Fernandez-Felisbino, R., & Gomes, E. L.
the denser and more entangled structure of rPVC provides greater resistance and, consequently, greater tensile strength.
The zero values obtained for the tensile stress measurements with strains of 10, 100, and 300% mean that rupture of the specimen occurred until reaching a specific strain. The values for elongation at rupture of the polymeric blends (Figure 5) increased with the TPU content of the blend, in agreement with previous results, which showed that the blends underwent greater elongation since the entanglement of PVC with TPU provided a greater flow of polymeric chains. The modulus of elasticity (Figure 5c) was higher in the blends with TPU and rPVC than in pure PVC. The results from both sources align well, confirming that blending TPU with PVC or rPVC enhances mechanical properties, such as tensile strength and elongation, with recycled PVC contributing positively to strength while reducing flexibility. The provided values and trends are consistent with the results reported in Laukaitienė et al.[7] and Ha et al.[9], as the TPU content increased to 20 wt. %, the yield strength decreased from 40.5 MPa to 20.3 MPa. This reduction in yield strength was accompanied by a significant decrease in tensile strength, which fell by approximately threefold, from 37.9 MPa to 13.8 MPa[7]. This reduction was expected because of the elastomeric nature of TPU[9]
Results for virgin PVC, TPU, and their blends (blue line) showed a gradual increase in elongation at rupture up
to 33 wt.% TPU. These data support the observation that the elongation at rupture of the TPU/PVC blends remained relatively constant for TPU contents below 33 wt.%. In contrast, for TPU contents of >33 wt. %, elongation at rupture increases in an almost linear trend up to 100% TPU. For recycled PVC, TPU, and their blends (red line), the elongation at rupture presented a practically linear behavior with increased TPU content in the polymer blend, probably because the elongation of the blend formed was directly controlled by the interaction of the TPU with the structures formed, mainly by the TPU/rPVC proportions, making it easy to predict the elongation at break by a simple linear regression. Comparable observations were reported, with TPU/PVC blends exhibiting enhanced elongation at rupture in comparison to pure PVC[7]. The elongation at rupture increased proportionally with the TPU content. Specifically, TPU/PVC (40/60 wt. %) demonstrated approximately 150%[7]
Figure 6 presents the results obtained in the tensile tests for 10%, 100%, and 300% of the applied load. The tensile strength is evaluated from the load applied per unit area at the time of failure. The elongation represents the percentage increase in the length of the specimen under tension. The stresses at 10%, 100%, and 300% are related to the load necessary to produce the deformations related to these stresses. The results obtained with the load of 300% occurred because the specimen fractured before reaching
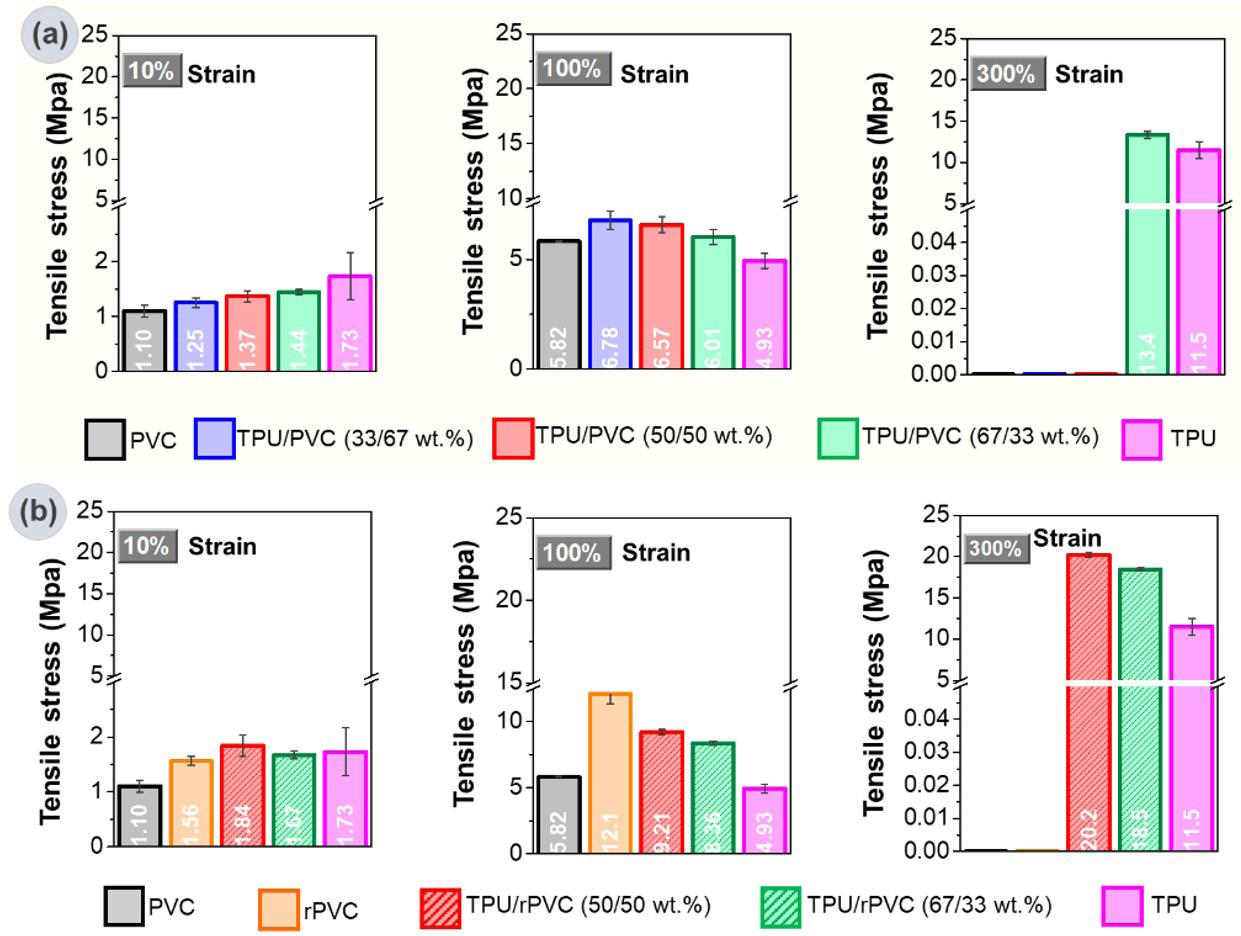
Recycled PVC to eco-friendly materials for footwear industry: process and mechanical properties
the end of the test, but some specimens withstand great stress before they fracture. The strain values applied at 10%, 100%, and 300% followed technical standards that the market typically reports in the technical bulletin of the polymer sector. Figure 6a presents the stresses required for a 10% deformation of the polymers and their blends. All the stresses were below 1.9 MPa for this condition. Blends based on recycled PVC required greater tension than those required for virgin PVC blends. The TPU/rPVC (50/50 wt.%) blend was the most resistant in the tensile test under this condition. The virgin PVC blends showed increasing resistance with the TPU content. Figure 6b shows the stresses required for 100% deformation of the polymers and their blends. All stresses were between 4.9 and 12.2 MPa for this deformation, and the blends based on recycled PVC were more deformation-resistant. Under this tension, recycled PVC showed the greatest resistance to deformation of the polymers evaluated in this study.
TPU/PVC (67/33 wt.%), TPU/PVC (50/50 wt.%), and recycled PVC blends fractured before reaching 300% elongation (Figure 6). All stresses were below 21 MPa for this deformation except for the fractured polymers, and the blends based on recycled PVC proved to be more resistant to deformation, especially the TPU/rPVC (50/50 wt.%) blend, which withstood more than 20 MPa of tension without breaking. Polymer blends based on recycled PVC are generally more resistant and less elastic, so it is up to the footwear producer to adapt resistance, elasticity, and comfort to achieve an excellent cost-benefit ratio, maintaining the quality demanded by the consumer[23]. Similar observations were reported for TPU/PVC blends, demonstrating enhanced elongation at rupture compared to that of pure PVC. Recycled PVC in the blends generally resulted in increased tensile strength and better performance in terms of deformation resistance compared to virgin PVC. This study presents more favorable results than those already presented in the literature[24,25]. The origin of the recycled PVC used here (shoe soles from the footwear industry), was probably less heterogeneous in terms of manufacture, having undergone fewer structural alterations than the recycled PVC used by previous authors, which originated from landfills and civil construction, and was processed in cooperatives by mechanical recycling.
The origin and quality of recycled PVC are critical for producing TPU/PVC polymer blends that meet market demands for diverse applications. Our research introduces innovative blends utilizing recycled PVC, which demonstrate improved tensile strength and reduced elasticity. Further research and comprehensive testing are essential to validate the practicality of these materials for eco-friendly footwear. This includes evaluating the performance in real-world conditions, specifically assessing attributes such as comfort, durability, and overall functionality. Such studies are pivotal to confirming the suitability of these blends for sustainable manufacturing processes and ensuring their effectiveness in practical applications.
4. Conclusions
These findings demonstrate that blending TPU with PVC or recycled PVC (rPVC) yields materials with distinct and
promising properties. X-Ray Diffraction analysis showed that these blends maintained an amorphous structure with only minor diffraction peaks related to the TPU additives. Density measurements confirmed that the blend compositions aligned closely with the theoretical predictions, indicating minimal voids and effective melt blending. Thermal stability tests revealed that while PVC content influenced the decomposition temperatures, rPVC exhibited higher thermal degradation than virgin PVC. Mechanical testing highlighted that TPU/rPVC blends, particularly those with higher rPVC content, offer superior tensile strength and elongation compared to both pure PVC and virgin TPU. These blends also generally exhibit lower abrasion losses than virgin PVC, making them suitable for applications such as footwear. These results suggest that TPU/rPVC blends are a viable option for eco-friendly and high-performance polymeric materials. Further investigations of their long-term durability and commercial applications are recommended.
5. Author’s Contribution
• Conceptualization – Giovanna Marsura; Eliezer Ladeia Gomes.
• Data curation – Giovanna Marsura; Eliezer Ladeia Gomes.
• Formal analysis – Giovanna Marsura; Eliezer Ladeia Gomes; Juliana Otavia Bahú; Laura Plazas Tovar; Romilda Fernandez-Felisbino.
• Funding acquisition - Eliezer Ladeia Gomes.
• Investigation – Giovanna Marsura.
• Methodology – Giovanna Marsura; Eliezer Ladeia Gomes.
• Project administration – Giovanna Marsura; Eliezer Ladeia Gomes.
• Resources – Eliezer Ladeia Gomes; Romilda Fernandez-Felisbino.
• Software – NA.
• Supervision – Eliezer Ladeia Gomes; Romilda Fernandez-Felisbino.
• Validation – Giovanna Marsura; Juliana Otavia Bahú.
• Visualization – Giovanna Marsura; Eliezer Ladeia Gomes; Juliana Otavia Bahú; Laura Plazas Tovar.
• Writing – original draft –Juliana Otavia Bahú; Laura Plazas Tovar.
• Writing – review & editing –Juliana Otavia Bahú; Laura Plazas Tovar.
6. Acknowledgements
The authors wish to thank Covestro Polymer Industry and Trade Ltda. and Prisma Thermoplastic Compounds Ltda. for the supplies provided for this work.
7. References
1 Yadav, S. S., Kar, S. K., & Rai, P. K. (2022). Why do consumers buy recycled shoes? An amalgamation of the theory of reasoned action and the theory of planned behaviour. Frontiers in
Marsura, G., Bahú, J. O., Tovar, L. P., Fernandez-Felisbino, R., & Gomes, E. L.
Environmental Science, 10, 1007959 http://doi.org/10.3389/ fenvs.2022.1007959
2 Dwivedi, A., Moktadir, M. A., Chiappetta Jabbour, C. J., & Carvalho, D. E. (2022). Integrating the circular economy and industry 4.0 for sustainable development: implications for responsible footwear production in a big data-driven world. Technological Forecasting and Social Change, 175, 121335 http://doi.org/10.1016/j.techfore.2021.121335
3 Sánchez-Valdes, S., Ramos-De Valle, L. F., & Manero, O. (2013). Polymer blends. In E. Saldívar-Guerra, & E. VivaldoLima (Eds.), Handbook of polymer synthesis, characterization, and processing (pp. 505-517). USA: John Wiley & Sons, Inc http://doi.org/10.1002/9781118480793.ch27
4 Khalid, M. Y., Arif, Z. U., Ahmed, W., & Arshad, H. (2022). Recent trends in recycling and reusing techniques of different plastic polymers and their composite materials. Sustainable Materials and Technologies, 31, e00382 http://doi.org/10.1016/j. susmat.2021.e00382.
5 Yoo, H.-J., Lee, Y.-H., & Hyeob, B.-S. (2001). Properties of original thermoplastic polyurethane (TPU)/plasticized poly(vinyl chloride) and recycling TPU/PVC blends. The Korean Fiber Society, 34(2), 9-12
6 Hakim, M. I., Shahnaz, S. S. B., Luqman, M., Anis, N. I., Shuhaida, Y., Zaharah, S. A., Baidi, M. B., Yu, C. W., & Kathiresan, V. S. (2016). Investigation on the mechanical and physical properties of TPU/PVC blend as potential material of bedpan. IOP Conference Series. Materials Science and Engineering, 133, 012018 http://doi.org/10.1088/1757899X/133/1/012018
7. Laukaitiené, A., Jankauskaité, V., Žukiene, K., Norvydas, V., Munassipov, S., & Janakhmetov, O. (2013). Investigation of polyvinyl chloride and thermoplastic polyurethane waste blend miscibility. Polymer Composites, 19(4), 397-402. http://doi. org/10.5755/j01.ms.19.4.3145
8 Ames, K. A. (2004). Elastomers for shoe applications. Rubber Chemistry and Technology, 77(3), 413-475. http://doi. org/10.5254/1.3547832
9 Ha, C.-S., Kim, Y., Lee, W.-K., Cho, W.-J., & Kim, Y. (1998). Fracture toughness and properties of plasticized PVC and thermoplastic polyurethane blends. Polymer, 39(20), 47654772 http://doi.org/10.1016/S0032-3861(97)10326-3
10. Wu, K., Wang, J., Lin, F., Liu, Y., Yang, K., Zhou, X., & Zhang, D. (2014). Modification and characterization of the poly(vinyl chloride)/thermoplastic polyurethane foam composite material. Polymer Composites, 35(9), 1716-1722. http://doi.org/10.1002/ pc.22825
11 Pita, V. J. R. R., Sampaio, E. E. M., & Monteiro, E. E. C. (2002). Mechanical properties evaluation of PVC/plasticizers and PVC/thermoplastic polyurethane blends from extrusion processing. Polymer Testing, 21(5), 545-550 http://doi. org/10.1016/S0142-9418(01)00122-2
12 Dimonie, D., Coserea, R. M., Singurel, G., Zaharia, C., Darie, R. N., & Pop, S. F. (2009). Rheological properties of polyvinyl chloride - thermoplastic polyurethane blends. Materiale Plastice, 46(3), 321-326. Retrieved in 2024, June 30, from https://revmaterialeplastice.ro/pdf/DIMONIE%20 DOI%203.pdf
13 COVESTRO. (2023, July 24). Retrieved in 2024, June 30, from https://www.tpu.covestro.com/Library/Brochures.aspx
14 Nagy, T. T., Kelen, T., Turcsányi, B., & Tüdös, F. (1977). Initiated oxidation of polyenes formed in the thermal degradation of PVC. Journal of Polymer Science: Polymer Chemistry Edition, 15(4), 853-864 http://doi.org/10.1002/pol.1977.170150408
15. Hamidi, N. (2023). Upcycling poly(vinyl chloride) waste tubes: studies of thermal stability and kinetics of films made of waste polyvinylchloride tube at the initial steps of degradation. Journal of Applied Polymer Science, 140(13), e53663 http:// doi.org/10.1002/app.53663
16. Kim, Y., Cho, W.-J., & Ha, C.-S. (1999). Dynamic mechanical and morphological studies on the compatibility of plasticized PVC/thermoplastic polyurethane blends. Journal of Applied Polymer Science, 71(3), 415-422. http://doi.org/10.1002/ (SICI)1097-4628(19990118)71:3<415::AID-APP7>3.0.CO;2-Z 17 Abd-El-Messieh, S. L., Mansour, S. H., El-Nashar, D., & Ikladious, N. E. (2004). Evaluation of polyester resin as a new compatibilizer for SBR/PVC blends. Canadian Journal of Chemical Engineering, 82(2), 358-370 http://doi.org/10.1002/ cjce.5450820217
18 Kibria, M. G., Masuk, N. I., Safayet, R., Nguyen, H. Q., & Mourshed, M. (2023). Plastic waste: challenges and opportunities to mitigate pollution and effective management. International Journal of Environmental Research, 17(1), 20 http://doi. org/10.1007/s41742-023-00507-z PMid:36711426.
19 Bajsić, E. G., Šmit, I., & Leskovac, M. (2007). Blends of thermoplastic polyurethane and polypropylene. I. Mechanical and phase behavior. Journal of Applied Polymer Science, 104(6), 3980-3985 http://doi.org/10.1002/app.26222
20 Sudaryanto, T. N., Ueno, M., Asaoka, S., & Nakamae, K. (2001). Miscibility of segmented polyurethane/poly(vinyl chloride) blends. Journal of Applied Polymer Science, 82(12), 3022-3029 http://doi.org/10.1002/app.2157
21 Sikdar, P., Dip, T. M., Dhar, A. K., Bhattacharjee, M., Hoque, M. S., & Ali, S. B. (2022). Polyurethane (PU) based multifunctional materials: emerging paradigm for functional textiles, smart, and biomedical applications. Journal of Applied Polymer Science, 139(38), e52832. http://doi.org/10.1002/app.52832.
22 Braskem. (2002, julho). Tecnologia e aplicações de perfis de PVC rígido expandido (Boletim Técnico, nº 07 PVC) Braskem. Retrieved in 2024, June 30, from https://www. braskem.com.br/portal/principal/arquivos/html/boletm_tecnico/ tecnologia_do_pvc_expandido.pdf
23 Dubé, M. A., Gabriel, V. A., Pakdel, A. S., & Zhang, Y. (2021). Sustainable polymer reaction engineering: are we there yet? Canadian Journal of Chemical Engineering, 99(1), 31-60 http://doi.org/10.1002/cjce.23865
24. Vela, I. C., Maric, J., González-Arias, J., & Seemann, M. (2024). Feedstock recycling of cable plastic residue via steam cracking on an industrial-scale fluidized bed. Fuel, 355, 129518 http:// doi.org/10.1016/j.fuel.2023.129518.
25 Santos, G., Esmizadeh, E., & Riahinezhad, M. (2023). Recycling construction, renovation, and demolition plastic waste: review of the status quo, challenges and opportunities. Journal of Polymers and the Environment, 32(2), 479-509 http://doi. org/10.1007/s10924-023-02982-z
Received: Jun. 30, 2024
Revised: Sept. 17, 2024
Accepted: Oct. 07, 2024
2024
Recycled PVC to eco-friendly materials for footwear industry: process and mechanical properties
Supplementary material accompanies this paper.
S1. Mechanism of TPU/rPVC Blends.
Figure S1. Scheme of the formation mechanism of TPU/rPVC polymer blends. MDI: 4,4’-Diphenylmethane diisocyanate; BDO: 1,4-Butanediol.
Figure S2. Density of blends prepared from pure TPU, pure PVC, and recycled PVC.
Figure S3. Tensile testing results for pure polymers: a) PVC, b) rPVC, and c) TPU.
Figure S4. Tensile test results for the blends: a) TPU/PVC (33/67 wt. %), b) TPU/PVC (50/50 wt.%), and c) TPU/ PVC (67/33 wt.%).
Figure S5. Tensile testing results for recycled blends: a) TPU/rPVC (50/50 wt. %), and b) TPU/PVC (67/33 wt.%).
Table S1. Weight loss from thermogravimetric analysis for TPU/PVC polymer blends: 100/0, 33/67, 50/50, 67/33, 0/100 wt.%, and TPU/rPVC polymer blends: 50/50, 67/33, and 0/100 wt.%.
Table S2. Tensile test results for blends prepared from pure TPU, pure PVC, and recycled PVC
This material is available as part of the online article from https://doi.org/10.1590/0104-1428.20240064
Ermelindo de Souza Silva Neto1 , Margarida Masami Yamaguchi1 , Marianne Ayumi Shirai1* , Claudio Takeo Ueno2 , Izabela Dutra Alvim3 , Fabio Yamashita4 , Carlos Raimundo Ferreira Grosso1 and Lyssa Setsuko Sakanaka1
1Programa de Pós-graduação em Tecnologia de Alimentos, Universidade Tecnológica Federal do Paraná –UTFPR, Londrina, PR, Brasil
2Departamento Academico de Alimentos, Universidade Tecnológica Federal do Paraná –UTFPR, Londrina, PR, Brasil
3Centro de Tecnologia de Cereais e Chocolates, Instituto de Tecnologia de Alimentos –ITAL, Campinas, SP, Brasil
4Programa de Pós-graduação em Ciência de Alimentos, Universidade Estadual de Londrina –UEL, Londrina, PR, Brasil
*marianneshirai@utfpr.edu.br
Obstract
The coating of microparticles obtained by ionic gelation with protein is a strategy adopted to increase the oxidative stability of different oils. In this work, the effect of different concentrations of alginate and calcium on the production of microparticles and the oxidative stability of microencapsulated sacha inchi oil coated with ovalbumin was evaluated. The sacha inchi oil demonstrated to be a source of polyunsaturated fatty acids, especially linolenic and linoleic acids. The obtained coated and uncoated microparticle showed spherical morphology with continuous walls, encapsulation efficiency about 72%, and the average size of 239 µm and 309 µm, respectively. The higher size of coated microparticle is due to high amounts of ovalbumin adsorbed, which ranged from 51.8 to 70.9%. The Oxidative stability evaluation showed that the presence of ovalbumin adsorption contributed to the stability of sacha inchi oil, when compared to the oil present in particles without protein coating.
Keywords: microencapsulation, accelerated shelf life, egg protein, unsaturated fatty acids, oxidative stability.
How to cite: Silva Neto, E. S., Yamaguchi, M. M., Shirai, M. A., Ueno, C. T., Alvim, I. D., Yamashita, F., Grosso, C. R. F., & Sakanaka, L. S. (2024). Oxidative stability of sacha inchi oil microparticles covered with ovalbumin. Polímeros: Ciência e Tecnologia, 34(4), e20240041. https://doi.org/10.1590/0104-1428.20240060
1. Introduction
Sacha inchi oil is originally from the Amazon region and contains a high amount of Ω-3 and Ω-6 polyunsaturated fatty acids. The amount of these acids can reach 94%, with 49% of α-linolenic acids and 37% of linoleic essential fatty acids, considered essential to human health[1,2]. Thus, polyunsaturated sacha inchi oil, are subject to oxidation forming free radicals, which undergoes a reaction of oxidation responsible for producing unpleasant flavors in foods. The avoidance of its oxidation is essential, and as an alternative the microencapsulation[3] followed by coating have been proposed and systematically studied[4-7] .
Among the microencapsulation techniques, the ionic gelation stands out for its simplicity and for not using toxic solvents. The production of gels as spherical microparticles can be achieved by dripping an anionic polysaccharide solution/emulsion containing the core material into a cation solution. Formation kinetics, particle volume, and stability are dependent on cation and polysaccharide concentration,
which in combination with ionic strength and pH, are parameters that influence the microparticle formation[8,9]
During the gelation process, not all carboxylic groups are bound to the calcium ion, and the remaining negative charge on the particles allows another positively charged polyelectrolyte to be electrostatically adsorbed onto the microparticle surface[10]. The oppositely charged polyelectrolyte may be a protein at a pH adjusted below its isoelectric point. The interaction depends on the polysaccharide: protein ratio used, the pH and the remaining electric charge in the gelled particle and the protein used, the ionic strength, and the concentration of the polyelectrolytes[11]
Several works describe the microencapsulation of sacha inchi oil by spray drying, freeze drying and complex coacervation techniques[3,12-14], and few studies[9] report the use of ionic gelation followed by protein coating as strategy to improve the oxidative stability of sacha inchi oil and expand their use in food formulation. Hence, the
objectives of this work were to evaluate the effect of different concentrations of alginate and calcium ions on the production of microparticles containing sacha inchi oil, and then coat with ovalbumin and subsequently evaluate the properties and oxidative stability of free and encapsulated oil.
2.1 Material
The materials used for this study were anhydrous calcium chloride (Exodo, Brazil), pasteurized / dehydrated ovalbumin (Saltos Alimentos, Brazil), sodium alginate with high molecular weight and high guluronic acid content (Exodo, Brazil) and cold pressed sacha inchi oil with 6.50 ± 0.14 mg KOH g-1 of acidity and 1.73 ± 0.28 meq O2Kg of peroxide index (Tikuna, Colombia).
2.2 Determination of fatty acid composition of Sacha inchi oil
The composition of sacha inchi oil was determined by gas chromatography (Agilent CGC 6850 Series GC System, USA), and samples were prepared as fatty acid methyl esters according to Ce 1f-96 (AOCS 1997). An Agilent Capillary DB-23 column (50% cyanopropyl and methyl polysiloxane, USA) 60 m long and 0.25 mm in diameter with 0.25 mm internal films was used to separate the methyl esters. The conditions used were: 1.0 mL/min column flow rate, 24 cm/s linear velocity, detector and injector temperature 280 °C, helium gas as the carrier gas, and injected volume was 1 µL. The column temperature was maintained at 110 °C for 5 min, then a ramp of 5 °C per min until 215 °C, remaining at this temperature for 24 min. Identification of fatty acid methyl esters was made by comparing retention times with times obtained for a standard mixture of fatty acid methyl esters (Nu Check Inc., USA).
2.3 Microparticle production by external ionic gelation
The microparticle production was performed with two concentrations of sodium alginate, 1.50% and 2.25% (w/w) and three concentrations of calcium chloride, 1.50%, 3.0% and 4.50% (w/w). Sacha Inchi oil, 0.75%, 1.50% and 2.25% (w/w), was added to the alginate solution and subjected to homogenization in a Ultraturrax at 15,000 rpm for 5 min (T-18 IKA, Germany). The emulsions were sprayed onto the aqueous calcium chloride solution, kept under constant agitation by a magnetic stirrer, using a 0.7 mm diameter double fluid atomizer (LABMAQ, Brazil), air flow of 30 L/ min, and emulsion flow rate of 200 mL/h. The atomizing nozzle was kept at 23 cm above the surface of the calcium chloride solution surface. After spraying was complete, the microparticles were stirred for 30 min to ensure the migration of calcium ions into the center of the microparticles. They were then washed with deionized water (adjusted to pH 4.0) and a portion of the microparticles was lyophilized (Alpha 1-2 LDplus, Martin Christ, Germany). The wet and dry particles were packed in capped vials and kept refrigerated for further electrostatic adsorption of ovalbumin and lipid oxidation evaluation, respectively.
2.4 Electrostatic adsorption of ovalbumin on alginate microparticles
For the adsorption tests, a solution of ovalbumin (4%, w/v) and particle suspension were adjusted to pH 4.0. Fifty grams of wet microparticles were added to ovalbumin solution (200 mL) and kept under stirring for 1 h. Then the particles were washed with pH 4.0 deionized water to remove proteins that were not adsorbed by the microparticles. The amount of protein adsorbed on the microparticles was determined by the Kjeldahl method[15]
2.5 Mean diameter, size distribution, and polydispersity index
The average diameter (D0.5) and size distribution of the microparticles with and without adsorbed proteins were determined using light scattering technique (LV950-V2, Horiba, Japan) and water as dispersing medium at pH 4.0. The polydispersity index (SPAN) was calculated by (D0.9 - D0.1) divided by D0.5, where: D0.9 - particle diameter below which 90% of the distribution was quantified; D0.1particle diameter below which 10% of the distribution has been quantified and D0.5 - considered as the average particle diameter. A minimum of six independent repetitions was performed.
2.6 Zeta potential of particles
The microparticle zeta potentials were determined using a Zetasizer Nano-Z (Malvern Instruments, UK) at pH 4.0. The microparticles were ground before dilution and reading to obtain a colloidal suspension smaller than 10 µm in size[16]. Wet microparticles were milled in a mill (IKA, Germany) at 26,000 rpm with twenty impact cycles for two sec on each impact and then sieved (62 µm) and kept in a refrigerator for sedimentation for 72 h. The colloidal supernatant was analyzed for its mean diameter in a Horiba particle diameter determiner (LV950-V2, Horiba, Japan). After size verification, the supernatant was diluted to 0.2% in deionized water adjusted to pH 4.0 and zeta potential determined with six replicates for each sample.
2.7
To determine the encapsulation efficiency (EE%) of sacha inchi oil, approximately 5 g of lyophilized microparticles were subjected to a calcium citrate solution (3% w/w) for their complete solubilization and release of encapsulated sacha inchi oil. After this procedure, sacha inchi oil was extracted and quantified according to Bligh and Dyer[17], and the EE % was calculated considering the relation between extracted oil content and initial oil content[18]
2.8 Calcium adsorbed on microparticles produced by ionic gelation
Calcium quantification of the microparticles without protein-coated was performed using an atomic absorption spectrophotometer (Analytic Jena AG-NOVAA300, Germany) and a calcium solution (1000 µg/mL, SCP Science, Canada) in absorption mode with an air-acetylene flame detector. The method consisted of direct injection of a solution
Oxidative stability of sacha inchi oil microparticles covered with ovalbumin
prepared with 400 mg of wet particles dissolved in 25 mL of 3% (w/w) sodium citrate solution[19]
2.9 Morphology of alginate particles with and without protein coating
The morphology of the protein-coated and uncoated wet microparticles was observed with an optical microscope (BX-4, Olympus, Japan) using a 10X objective lens. Samples were illuminated by incident light provided by an optical fiber source (model LGPS, light optical fiber, Olympus 9095, Japan). Images were acquired with a digital camera (Q-Color 3, Olympus, Japan).
2.10 Oxidative stability of sacha inchi oil-free and microencapsulated
The oxidative stability of free sacha inchi oil, coated and uncoated microparticles was evaluated by peroxide index (PI) under accelerated oxidative conditions at 60 °C for 4 days[20]. Microparticles samples formed with 1.50% alginate, 1.50% calcium chloride and 1.50% sacha inchi oil were used. For uncoated microparticles, 0.5 g of sample were hydrated in 8 mL of deionized water for 18 h. Subsequently, sodium citrate (3%, w/v) was incorporated to solubilize the microparticles and release the oil. Coated microparticles (0.5 g) were suspended in 8 mL deionized water pH 7.0, and 0.5 mg/mL trypsin enzyme was added and kept for 18 h at 37 °C for protein hydrolysis, then sodium citrate solution was added to promote the release of the oil. The extraction of oil was performed according to Bligh and Dyer[17]. The PI was determined in triplicate by spectrophotometer (Libra S60, Biochrom, USA) following standard method IDF 74A (1991), and calculated using a standard Fe(III) curve (1 to 20 μg).
2.11.1 Effect of alginate and calcium concentrations on the adsorption of ovalbumin on the particles
A 21x31 mixed factorial design with two replications was used to evaluate the effect of alginate (1.50% e 2.25%), and calcium chloride (1.5%, 3.0% e 4.5%) on the ovalbumin adsorption on the microparticles (Y1). The experimental design and the coded and real values of the independent variables are given in Table 1. The coefficients (β) of the mathematical model (Equation 1) for each dependent variable were calculated using Statistica software (StatSoft, Tulsa, USA). YXX 01122
121222212312
(1)
where Y is the response (protein adsorption) β0 is grand mean, β1 (alginate), β2 (calcium chloride), β12 (alginate x calcium chloride interaction), β22 (calcium chloride squared) and β123 (alginate x calcium chloride squared interaction).
2.11.2 Effect of alginate and calcium concentrations and coating or uncoating with ovalbumin on the mean diameter, span, and the zeta potential
A 22x31 mixed factorial design with two replications was used to evaluate the effect of sodium alginate (1.50 and 2.25%), protein coating (uncoated and coated) and calcium chloride (1.5; 3.0 and 4.5%) on the mean diameter (Y2), span (Y3), and zeta potential (Y4). The experimental design and the coded and real values of the independent variables are given in Table 2. The coefficients (β) of the mathematical model (Equation 2) for each dependent variable were calculated using Statistica software (StatSoft, Tulsa, USA).
Y X X 01122
X XX XX 3312121313 2
XX X 2323333
β+β+β+
β+β+ +β +β + (2)
22 XX XX 1331323323 =β+β+β+
where Y is the response (mean diameter, span or zeta potential) β0 is grand mean, β1 (protein coating), β2 (alginate), β3 (calcium chloride) and β12 (coating x alginate interaction), β13 (coating x calcium chloride interaction), β23 (alginate x calcium chloride interaction), β33 (calcium chloride - squared), β133 (coating x calcium chloride - squared interaction) and β233 (alginate x calcium chloride - squared interaction).
3.1 Fatty acid composition of Sacha inchi oil
Sacha inchi oil presented 90.49% of polyunsaturated and 9.51% of saturated fatty acids, with a higher amount for linolenic fatty acid 45.51%, followed by linoleic fatty acid
Table 1. Mixed Factorial Design Matrix 21x31 - Effect of alginate and calcium chloride concentrations on the amount of protein adsorbed in the microparticles and calcium adsorbed on microparticles without adsorbed protein.
Table 2. Mixed factorial design matrix 22x31 - Effect of alginate and calcium chloride concentrations without or with protein adsorption on average diameter D(0.5), Span Index and Zeta potential with coded and real values used.
*RP: Protein adsorption; Zp: zeta potential.
C12:0 – lauric 0.06 ± 0.02
C18:2 - trans-t-linoleic 0.08 ± 0.00
C14:0 – miristic 0.07 ± 0.01 C18:2 – linoleic
C15:0 – pentadecanoic 0.02 ± 0.00
C16:0 – palmític 5.56 ± 0.08
C16:1 – palmitoleic 0.12 ± 0.01
C17:0 – margáric 0.14 ± 0.00
C17:1 - cis-10-heptadecenoic 0.06 ± 0.00
C18:0 – stearic 3.47 ± 0.02
C18:1 – oleic 9.12 ± 0.03
35.13% and oleic acid 9.12%, out of a total of 17 identified fatty acids (Table 3). Concentration of 59.23% linolenic acid and 33.46% linoleic acid were previously reported[12]. Minor differences in oil composition may be due to variations in lipid concentrations of sacha inchi oil due to the time of seed harvest, soil composition, climatic and geographical variations, and also different subspecies[21]
3.2 Electrostatic adsorption of ovalbumin on alginate microparticles
The amount of protein adsorbed on the ionic gelation particles ranged from 51.84 ± 0.91% to 70.94 ± 7.63% (Table 1). In a previous study, variations in protein adsorption by the particles of alginate were between 14.84 ± 0.64% to 47.37 ± 1.15%[6]. According to the factorial design model, the use of a lower concentration of calcium chloride (1.50%) and alginate (1.50%) led to higher levels of protein adsorption, and the model can be described as Y1 = 62.71 – 3.14X1 – 4.46X2 – 4.23X2 2. The coefficient of determination (R2) was 0.77, and although it is a low value, it is suitable to evaluate the effect of calcium and alginate concentration on the protein adsorption. Concentrations of calcium chloride above 1.50% decreased the amount of protein adsorbed by the alginate microparticles (Figure 1a). The higher adsorption of ovalbumin at lower concentrations of calcium and alginate was due to the greater availability
± 0.02
C18:3 - trans-t-linolenic 0.25 ± 0.00
C18:3 – linolenic 45.51 ± 0.01
C20:0 – araquídic 0.1 ± 0.01
C20:1 – eicosenoic 0.22 ± 0.00
C22:0 – behenic 0.06 ± 0.01
C24:0 – lignoceric 0.03 ± 0.01
of non-crosslinked negative carboxylic groups allowing a higher association with the protein below its isoelectric point, and therefore positively charged. Protein adsorption on the surface of the microparticles is related to the amount of total charge available on these microparticles, where microparticles with different zeta potentials assimilated different amounts of proteins.
Alginate particles produced without protein coating had mean diameters (D0.5) ranging from 102.00 ± 09.31 µm to 238.63 ± 15.09 µm (Table 2). Different sizes can be obtained due to various parameters such as atomizer nozzle tip diameter, atomizer nozzle tip distance, ion, and alginate concentration and alginate chemical composition[22]. For this response, the follow mathematical model was obtained Y2 = 212.61 + 23.55X1 – 18.75X2 + 31.18X3 – 9.81X1X3 –8.95X12X32 + 12.25X22X32 (R2 = 0.72). The coefficients indicated that the linear parameters of protein coating, alginate, and calcium chloride had a greater influence on the microparticle diameter, and there were interactions between protein coating and calcium chloride and alginate and calcium chloride.
The response surface (Figure 1b) shows that the higher the calcium concentrations, the higher the diameters of uncoated microparticles, and this parameter had the highest positive
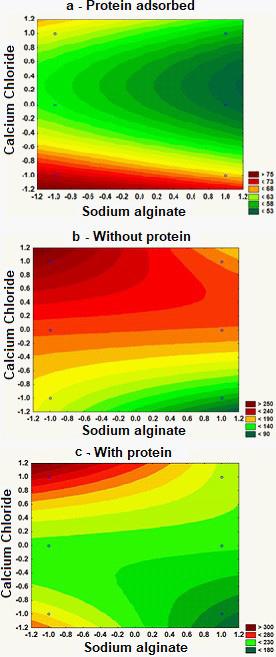
Figure 1. Effect of calcium and alginate concentration on protein adsorbed on the particles (a), mean diameter of microparticles (D 0,50) without protein adsorbed (b) and mean diameter of microparticles (D0,5) with protein adsorbed (c).
effect on microparticle size. Smrdel[23] reported that particles produced with 0.10 and 0.27 M of calcium chloride solution were significantly smaller than particles produced with 0.50 and 1.00 M of calcium chloride solution. Zeeb et al.[24] worked with alginate and calcium chloride and obtained microparticles with smaller diameters with increasing calcium concentration. According to literature[25], higher calcium concentration enables calcium crosslinking with the alginate by increasing the number of crosslinks in the particle, producing particle-matrix compaction, which should produce a particle size decrease. In our experiment, the calcium concentrations probably were not high enough to increase the calcium-alginate crosslinking and, consequently, reduce the diameter of the particles.
The average diameter of microparticles without protein coating had decreased with higher alginate concentration (2.25%) and lower concentrations of calcium chloride (Figure 1b). The alginate concentration had a negative effect on the average microparticle diameter because of the larger number of carboxylic groups in the most concentrated solution, allowing a broader set of interactions. The gel becomes stronger as the crosslinked groups increase, reducing the spaces occupied by the alginate, decreasing particle diameters under these conditions[26]. Zeeb et al.[24] working with nanoemulsions dripped in a calcium solution, also observed that an increase in alginate concentration led to the formation of more rigid spheres, with a decrease in pore and particle size.
Adsorption of protein molecules on the surface of the microparticles by electrostatic interaction led to an increase in their mean diameter, regardless of the alginate concentration used (Table 2). With the ovalbumin coating, the microparticles produced with higher alginate concentration had a smaller average diameter (Figure 1c), but had a higher average diameter than those without protein coating. Tello et al.[6] reported similar behavior in a study with whey protein and ovalbumin, the microparticles produced with alginate and coated with protein had their diameters increased.
The coated particles diameters ranged from 231.74 ± 11.09 µm to 308.79 ± 68.41 µm (Table 2), and the coating had a significant and positive effect on the microparticle size, and negatively interacted with calcium chloride. This behavior demonstrates that the negative interaction between coating and calcium chloride leads to a limitation on the influence of the coating parameter on the average diameter of the microparticles. Particle diameter increased when 1.50% alginate and 1.50% calcium chloride particles were coated with protein (Table 2), coinciding with the point where there was higher protein adsorption by the microparticles.
The polydispersity indices (Span) were high (Table 2), ranging from 2.32 ± 0.24 to 3.37 ± 0.45, and the model can be described as Y3 = 2.76 – 0.21X1 – 0.07X2 – 0.15X3 (R2 = 0.55). Ovalbumin protein coating and higher alginate and calcium chloride concentrations reduced the polydispersity index leading to the formation of particles with more uniform diameters. The microparticles produced with 1.50% alginate, without protein coating, presented the highest polydispersity indexes.
Particles without coating produced with the lowest alginate and calcium concentration had a significantly lower zeta potential, due to the higher binding of calcium cation with negative groups of alginate at higher calcium concentrations. More calcium available in solution provides a higher calcium ion-carboxylic group association of the guluronic acid present in the gel and thus produce less negative charge on the particle.
The zeta potentials of microparticles without protein (Table 2) were all negative as observed before[27]. Alginate, as an anionic polymer when in solution, presents charge and negative zeta potential above its pKa value as reported before, -70 mV at pH 4.0[28]. After bound to calcium ions during gelation, the zeta value decreases, meanwhile
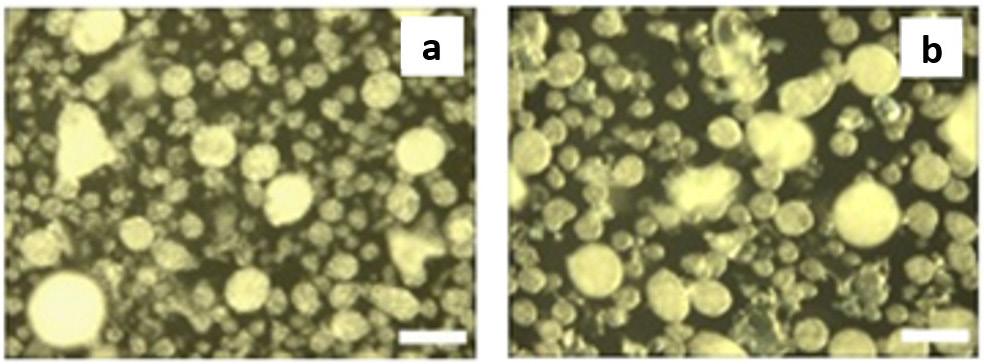
remaining negative as not all carboxylic groups bound with available ions. The remaining negative charge after gelation allows electrostatic interaction with positively charged polyelectrolytes[10] .
The zeta potential values of the coated particles were negative, contradicting the theory that when a new positive polyelectrolytic layer, in adequate quantities, is adsorbed onto an oppositely charged surface produces a charge inversion of the zeta potential[16] These results suggest that the grinding augmented the surface areas containing negatively charged carboxylic groups, not associated with calcium ions, and also not associated with the positive charges present on the protein. A systematic investigation of the effect of grinding on the resulting zeta potential needs to be further investigated.
3.5 Encapsulation efficiency of sodium alginate particles
The experimental condition of lower alginate concentration (1.50%), lower calcium concentration (1.50%) and oil content of 1.50% was chosen for the determination of encapsulation efficiency (EE%). For this system, the EE% was 72.38 ± 5.53%. Chan (2011)[29] worked with 30% oil in relation to total solids and reported that encapsulation efficiency increased as the alginate concentration in solution increased, achieving a maximum encapsulation efficiency of 93%. Sacha inchi oil encapsulated by complex coacervation[30] and spray drying[31] showed encapsulation efficiency of 99.54% and 96.3%, respectively, higher than obtained in this work.
3.6 Calcium adsorbed on microparticles produced by ionic gelation
The calcium adsorbed by the particles ranged from 117.20 ± 4.60 to 182.94 ± 20.00 mg Ca/g microparticles (Table 1). Similar values (155 to 182 mg Ca /g particles) were previously reported[5] for particles produced by ionic gelation (2% of alginate solution and 0.8; 1.6 and 2.4% of calcium solution).
3.7 Morphology of alginate particles
All the other conditions studied produced spherical particles with cohesive structure (Figure 2a) due to an efficient polymeric cross-linking between the polysaccharide
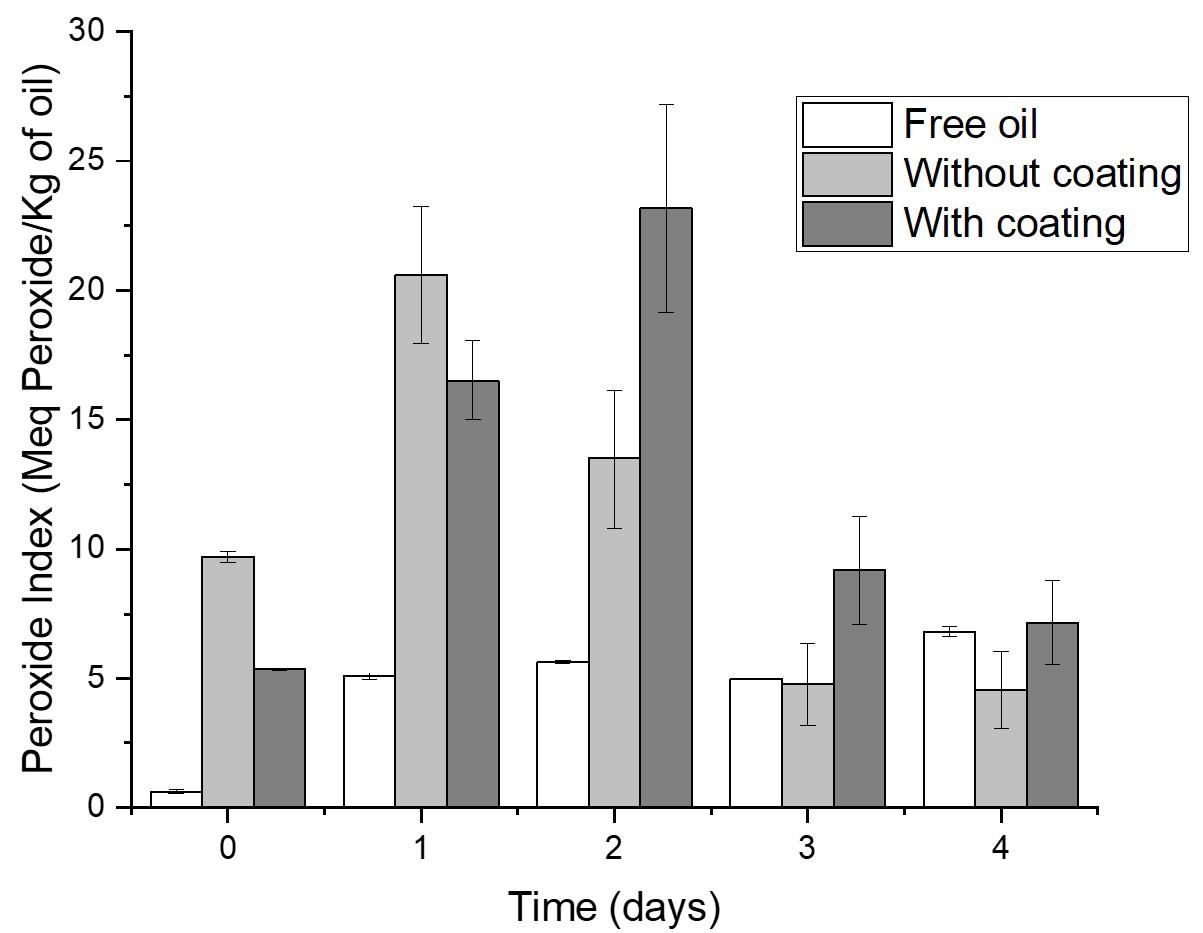
and calcium ions. There were enough binding sites to maintain a structure capable of trapping sacha inchi oil inside the particles, protecting the lipid reaction with the environment and providing an increase in the shelf life of the oil. The alginate particles coated with ovalbumin (Figure 2b) had the same characteristics as observed for particles without protein. Although spherical and continuous, the micrographs showed particles with a high polydispersity in their size with or without protein coating.
3.8 Oxidative stability of free and microencapsulated sacha inchi oil
The peroxide index (PI) (Figure 3), regardless of whether the oil was free or encapsulated had oxidation peaks at different times for the different treatments and then a drop in the PI values. This behavior was previously reported[32,33] , and according to the theory of lipid oxidation, in the early stage of lipid oxidation, hydroperoxides are formed until they reach a maximum oxidation value, reducing these values at the final oxidation stage due to the formation of secondary compounds not detected by the determination of the peroxide index[34]
The PI peak of the non-microencapsulated oil occurred after the fourth day, in accelerated conditions, corresponding to 120 days at room temperature[20]. For microencapsulated oil without protein coating, the PI occurred after the first day, corresponding to 30 days at room temperature and for microencapsulated with protein after the third day, corresponding to 90 days at room temperature.
The PI of the free oil occurred after the PI observed for microencapsulated oil with or without protein coating, a non-expected result, and contradicts the premise that microencapsulation would protect the oil from oxidative rancidity. According to Polavarapu et al.[32], non-encapsulated olive and fish oil were more stable to oxidation than encapsulated ones due to the smaller surface area of the non-encapsulated oils making it challenging to compare them. On the other hand, Strobel et al.[35] studied the oxidative stability of fish oil microencapsulated in alginate microparticles, and they observed the higher stability of the polyunsaturated fatty acids present in the microencapsulated oil than the nonmicroencapsulated ones. The PI alone is not an entirely reliable method for assessing oil quality and other tools that, as follow the secondary compounds formed during the oxidation process, could give more accurate information of the oil quality[33]
When the time of occurrence of PI peak of microparticles without protein coating is compared with microparticles with one additional layer of protein, it can be seen better protection after protein layer addition as observed before[6]. Authors used a model oil, microparticles produced by ionic gelation with and without protein coating. Both particles covered with whey protein or ovalbumin were more protective against oxidation than microparticles without protein adsorption.
At the initial time, the PI value for free oil was 0.63 ± 0.08 meq peroxide /kg of oil, and Cisneros et al.[34], reported a PI of 0.57 ± 0.01 meq of peroxide/kg of oil, close to that observed in this work. The microparticles coated with ovalbumin had a PI of 5.38 ± 0.04 meq of oil/kg, and the microparticles without coating presented a PI of 9.70 ± 0.22 meq of peroxide/kg of oil. The variations in PI at the initial time were probably due to the manipulation during the emulsification, atomization, microencapsulation, and especially during the oil removal from the particles for the subsequent determination of PI. Figure 3 also shows a variation of PI, probably because, at the later stage of the oxidation process the concentrations of primary oxidation products decrease, and the formation rates of new oxidation products are lower than their oxidation rate extinction. Smith et al.[33] observed that the primary compounds formed in the oxidation process extinguish as quickly as they are formed, which corroborates with the idea that a proper and reliable method for assessment of the oxidative products is crucial to define the oil quality.
4. Conclusions
Sacha inchi oil presented a high percentage of polyunsaturated fatty acids, and their encapsulation by ionic gelation had a high efficiency (~ 72%). Lower calcium concentration (1.50%) during ionic gelation enhanced the protein adsorption and increased the diameter of the
microparticles. Particles presented a spherical format and a well-defined and stable structure, with high polydispersity. The ovalbumin adsorbed on the particles contributed to the stability of microencapsulated sacha inchi oil. However, although the peroxide index is an indicator of oils oxidation, evaluations of secondary products from oxidation are required for a more refined assessment of the actual oxidation state of oil protected by different types of microparticles.
5. Author’s Contribution
• Conceptualization – Ermelindo de Souza Silva Neto; Carlos Raimundo Ferreira Grosso; Lyssa Setsuko Sakanaka.
• Data curation – NA.
• Formal analysis – Margarida Masami Yamaguchi; Marianne Ayumi Shirai; Izabela Dutra Alvim; Fabio Yamashita.
• Funding acquisition – NA.
• Investigation – Claudio Takeo Ueno; Izabela Dutra Alvim.
• Methodology – Margarida Masami Yamaguchi; Full Name.
• Project administration – Carlos Raimundo Ferreira Grosso.
• Resources – NA.
• Software – NA.
• Supervision – Carlos Raimundo Ferreira Grosso; Lyssa Setsuko Sakanaka.
• Validation – NA.
• Visualization – NA.
• Writing – original draft – Ermelindo de Souza Silva Neto.
• Writing – review & editing – Marianne Ayumi Shirai; Lyssa Setsuko Sakanaka.
6. Acknowledgements
The authors thank the Multiuser Laboratory (LabMultLD) of the Universidade Tecnológica Federal do Paranácampus Londrina.
7. References
1 Goyal, A., Tanwar, B., Kumar Sihag, M., & Sharma, V. (2022). Sacha inchi (Plukenetia volubilis L.): an emerging source of nutrients, omega-3 fatty acid and phytochemicals. Food Chemistry, 373, 131459 http://doi.org/10.1016/j.foodchem.2021.131459
2 Hermida, L. G., & Gallardo, G. (2015). Food applications of microencapsulated omega-3 oils. In L. M. C. Sagis (Ed.), Microencapsulation and microspheres for food applications (pp. 271-299). Netherlands: Elsevier http://doi.org/10.1016/ B978-0-12-800350-3.00018-2
3 Suwannasang, S., Zhong, Q., Thumthanaruk, B., Vatanyoopaisarn, S., Uttapap, D., Puttanlek, C., & Rungsardthong, V. (2022). Physicochemical properties of yogurt fortified with microencapsulated Sacha Inchi oil. Lebensmittel-Wissenschaft + Technologie , 161 , 113375 http://doi.org/10.1016/j. lwt.2022.113375
4 Aguilar, K. C., Tello, F., Bierhalz, A. C. K., Garnica Romo, M. G., Martínez Flores, H. E., & Grosso, C. R. F. (2015). Protein adsorption onto alginate-pectin microparticles and films produced by ionic gelation. Journal of Food Engineering, 154, 17-24 http://doi.org/10.1016/j.jfoodeng.2014.12.020
5. Silverio, G. B., Sakanaka, L. S., Alvim, I. D., Shirai, M. A., & Grosso, C. R. F. (2018). Production and characterization of alginate microparticles obtained by ionic gelation and electrostatic adsorption of concentrated soy protein. Ciência Rural, 48(12), e20180637. http://doi.org/10.1590/0103-8478cr20180637.
6 Tello, F., Falfan-Cortés, R. N., Martinez-Bustos, F., Silva, V. M., Hubinger, M. D., & Grosso, C. (2015). Alginate and pectin-based particles coated with globular proteins: production, characterization and anti-oxidative properties. Food Hydrocolloids, 43, 670-678 http://doi.org/10.1016/j. foodhyd.2014.07.029
7. Beraldo, J. C., Nogueira, G. F., Prata, A. S., & Grosso, C. R. F. (2021). Effect of molar weight of gelatin in the coating of alginate microparticles. Polímeros: Ciência e Tecnologia, 31(2), e2021018 http://doi.org/10.1590/0104-1428.20210027
8 Mestdagh, M. M., & Axelos, M. A. V. (1998). Physico-chemical properties of polycarboxylate gel phase and their incidence on the retention/release of solutes. Biopolymer Science: Food and Non-food Applications, 91(1), 303-314
9 Silva, K. F. C., Carvalho, A. G. S., Rabelo, R. S., & Hubinger, M. D. (2019). Sacha inchi oil encapsulation: emulsion and alginate beads characterization. Food and Bioproducts Processing, 116, 118-129. http://doi.org/10.1016/j.fbp.2019.05.001.
10 Vos, P., de Haan, B. J., Kamps, J. A. A. M., Faas, M. M., & Kitano, T. (2007). Zeta‐potentials of alginate‐PLL capsules: A predictive measure for biocompatibility? Journal of Biomedical Materials Research. Part A, 80(4), 813-819 http:// doi.org/10.1002/jbm.a.30979 PMid:17058213.
11 Ye, A. (2008). Complexation between milk proteins and polysaccharides via electrostatic interaction: principles and applications: a review. International Journal of Food Science & Technology, 43(3), 406-415 http://doi.org/10.1111/j.13652621.2006.01454.x
12 Otálora, M. C., Camelo, R., Wilches-Torres, A., CárdenasChaparro, A., & Gómez Castaño, J. A. (2020). Encapsulation effect on the in vitro bioaccessibility of Sacha Inchi oil (Plukenetia volubilis L.) by soft capsules composed of gelatin and cactus mucilage biopolymers. Polymers, 12(9), 1995 http://doi.org/10.3390/polym12091995 PMid:32887385.
13 Rodríguez-Cortina, A., & Hernández-Carrión, M. (2023). Microcapsules of Sacha Inchi seed oil (Plukenetia volubilis L.) obtained by spray drying as a potential ingredient to formulate functional foods. Food Research International, 170, 113014 http://doi.org/10.1016/j.foodres.2023.113014 PMid:37316081.
14 Soares, B. S., Carvalho, C. W. P., & Garcia-Rojas, E. E. (2021). Microencapsulation of Sacha Inchi oil by complex coacervates using ovalbumin-tannic acid and pectin as wall materials. Food and Bioprocess Technology, 14(5), 817-830 http://doi.org/10.1007/s11947-021-02594-2
15 Association of Official Methods Analytical Chemists – AOAC (2006). Official methods of analysis. Washington: AOAC
16 Doherty, S. B., Auty, M. A., Stanton, C., Ross, R. P., Fitzgerald, G. F., & Brodkorb, A. (2012). Application of whey protein micro-bead coatings for enhanced strength and probiotic protection during fruit juice storage and gastric incubation. Journal of Microencapsulation, 29(8), 713-728 http://doi.or g/10.3109/02652048.2011.638994 PMid:22970750.
17 Bligh, E. G., & Dyer, W. J. (1959). A rapid method of total lipid extraction and purification. Canadian Journal of Biochemistry and Physiology, 37(8), 911-917 http://doi.org/10.1139/o59-099 PMid:13671378.
18 Vicente, J., Cezarino, T. S., Pereira, L. J. B., Rocha, E. P., Sá, G. R., Gamallo, O. D., Carvalho, M. G., & Garcia-Rojas, E. E. (2017). Microencapsulation of sacha inchi oil using emulsion-based delivery systems. Food Research International, 99(Pt 1), 612-622 http://doi.org/10.1016/j.foodres.2017.06.039. PMid:28784524.
19 Sriamornsak, P., & Kennedy, R. A. (2008). Swelling and diffusion studies of calcium polysaccharide gels intended for film coating. International Journal of Pharmaceutics, 358(12), 205-213 http://doi.org/10.1016/j.ijpharm.2008.03.009 PMid:18423917.
20 Michotte, D., Rogez, H., Chirinos, R., Mignolet, E., Campos, D., & Larondelle, Y. (2011). Linseed oil stabilisation with pure natural phenolic compounds. Food Chemistry, 129(3), 1228-1231 http://doi.org/10.1016/j.foodchem.2011.05.108 PMid:25212361.
21 Follegatti-Romero, L. A., Piantino, C. R., Grimaldi, R., & Cabral, F. A. (2009). Supercritical CO2 extraction of omega-3 rich oil from Sacha inchi (Plukenetia volubilis L.) seeds. The Journal of Supercritical Fluids, 49(3), 323-329 http://doi. org/10.1016/j.supflu.2009.03.010
22. Paques, J. P. (2015). Alginate nanospheres prepared by internal or external gelation with nanoparticles. In L. M. C. Sagis (Ed.), Microencapsulation and microspheres for food applications (pp. 39-55). Netherlands: Elsevier http://doi.org/10.1016/ B978-0-12-800350-3.00004-2
23. Smrdel, P., Bogataj, M., & Mrhar, A. (2008). The influence of selected parameters on the size and shape of alginate beads prepared by ionotropic gelation. Scientia Pharmaceutica, 76(1), 77-89. http://doi.org/10.3797/scipharm.0611-07.
24 Zeeb, B., Saberi, A. H., Weiss, J., & McClements, D. J. (2015). Formation and characterization of filled hydrogel beads based on calcium alginate: factors influencing nanoemulsion retention and release. Food Hydrocolloids, 50, 27-36 http:// doi.org/10.1016/j.foodhyd.2015.02.041
25 Islam, A., Taufiq-Yap, Y. H., Ravindra, P., Moniruzzaman, M., & Chan, E.-S. (2013). Development of a procedure for spherical alginate–boehmite particle preparation. Advanced Powder Technology, 24(6), 1119-1125 http://doi.org/10.1016/j. apt.2013.03.021
26 Velings, N. M., & Mestdagh, M. M. (1995). Physico-chemical properties of alginate gel beads. Polymer Gels and Networks, 3(3), 311-330. http://doi.org/10.1016/0966-7822(94)00043-7.
27 You, J.-O., Park, S.-B., Park, H.-Y., Haam, S., Chung, C.-H., & Kim, W.-S. (2001). Preparation of regular sized Ca-alginate microspheres using membrane emulsification method. Journal of Microencapsulation, 18(4), 521-532 http://doi. org/10.1080/02652040010018128 PMid:11428680.
28 Klemmer, K. J., Waldner, L., Stone, A., Low, N. H., & Nickerson, M. T. (2012). Complex coacervation of pea protein isolate and alginate polysaccharides. Food Chemistry, 130(3), 710-715. http://doi.org/10.1016/j.foodchem.2011.07.114
29 Chan, E.-S. (2011). Preparation of Ca-alginate beads containing high oil content: influence of process variables on encapsulation efficiency and bead properties. Carbohydrate Polymers, 84(4), 1267-1275 http://doi.org/10.1016/j.carbpol.2011.01.015
30 Soares, B. S., Siqueira, R. P., Carvalho, M. G., Vicente, J., & Garcia-Rojas, E. E. (2019). Microencapsulation of sacha inchi oil (Plukenetia volubilis L.) using complex coacervation: formation and structural characterization. Food Chemistry, 298, 125045 http://doi.org/10.1016/j.foodchem.2019.125045 PMid:31261002.
31 Sanchez-Reinoso, Z., & Gutiérrez, L.-F. (2017). Effects of the emulsion composition on the physical properties and oxidative stability of Sacha Inchi (Plukenetia volubilis L.) oil microcapsules produced by spray drying. Food and Bioprocess Technology, 10(7), 1354-1366. http://doi.org/10.1007/s11947-017-1906-3.
Silva Neto, E. S., Yamaguchi, M. M., Shirai, M. A., Ueno, C. T., Alvim, I. D., Yamashita, F., Grosso, C. R. F., & Sakanaka, L. S. Polímeros, 34(4), e20240041, 2024
32 Polavarapu, S., Oliver, C. M., Ajlouni, S., & Augustin, M. A. (2011). Physicochemical characterisation and oxidative stability of fish oil and fish oil-extra virgin olive oil microencapsulated by sugar beet pectin. Food Chemistry, 127(4), 1694-1705 http://doi.org/10.1016/j.foodchem.2011.02.044
33 Smith, S. A., King, R. E., & Min, D. B. (2007). Oxidative and thermal stabilities of genetically modified high oleic sunflower oil. Food Chemistry, 102(4), 1208-1213 http://doi. org/10.1016/j.foodchem.2006.06.058
34 Cisneros, F. H., Paredes, D., Arana, A., & Cisneros-Zevallos, L. (2014). Chemical composition, oxidative stability and antioxidant capacity of oil extracted from roasted seeds of
Sacha-Inchi (Plukenetia volubilis L.). Journal of Agricultural and Food Chemistry, 62(22), 5191-5197 http://doi.org/10.1021/ jf500936j PMid:24823227.
35 Strobel, S. A., Hudnall, K., Arbaugh, B., Cunniffe, J. C., Scher, H. B., & Jeoh, T. (2020). Stability of fish oil in calcium alginate microcapsules cross-linked by in situ internal gelation during spray drying. Food and Bioprocess Technology, 13(2), 275-287 http://doi.org/10.1007/s11947-019-02391-y
Received: Jun. 12, 2024
Revised: Aug. 13, 2024
Accepted: Sept. 17, 2024
Thaises Lima1* , Filipe Diniz1 , Elmo Araújo1 and Patrícia Araújo2
1Laboratório de Polímeros e Nanoestruturas, Departamento de Energia Nuclear, Universidade Federal de Pernambuco – UFPE, Recife, PE, Brasil
2Departamento de Engenharia Biomédica, Universidade Federal de Pernambuco – UFPE, Recife, PE, Brasil *thaises.lima@ufpe.br
Obstract
Gamma radiation effects on extrinsically electrical semiconducting polymer nanocomposite films of poly(vinyl alcohol) (PVA) and 0.5 wt% histidine-modified reduced graphene oxide (H-RGO) filler were evaluated. Thermogravimetric analysis showed thermal degradation stages of the films and UV-Vis analysis allowed the study of optical parameters. Optical band gap energy (Eg) of PVA was shifted from 6.20 to 3.76 eV with the addition of H-RGO filler into the polymer matrix, while the electrical conductivity changed from 10-11 (isolator) to 10-6 (semiconductor) S/cm and PVA/H-RGO nanocomposite reached 10-4 S/cm at 25 kGy gamma-radiation dose. PVA/H-RGO nanocomposite films are promising in a wide range of potential applications, such as bio and chemical sensors, catalysis, and active layers for optoelectronic devices.
Keywords: electrical conductivity, gamma radiation, optical band gap, polymer composites, thermal analysis.
How to cite: Lima, T., Diniz, F., Araújo, E., & Araújo, P. (2024). Gamma irradiation effect on properties of modified graphene doped PVA nanocomposite films. Polímeros: Ciência e Tecnologia, 34 (4), e20240042. https://doi.org/10.1590/0104-1428.20230106
Electrically conducting polymer materials are at the forefront of semiconductors research since they can be used in optoelectronics, capacitors, photovoltaics, UV-blockers, biosensors, and optical limiters applications[1-3]. Polyvinyl alcohol (PVA) and polyvinyl pyrrolidone (PVP) are among the most popular polymers due to their unique properties such as dielectric nature, adherence property, fast hydrodissolution, and water solubility. The semi-crystalline nature of PVA and its ability to form hydrogen bonds make this polymer a suitable candidate in many industrial applications such as photovoltaic solid-state electrolytes[4,5]
Gamma irradiation is used extensively in many areas of industry, medicine, military, research, and nuclear power production. However, gamma irradiation is known to affect the electrical, optical, and mechanical properties of polymers or polymer composites. These changes happen through different mechanisms, e.g. main chain scissions[6] , crosslinking[7], grafting[8], stable radicals formation[9] , crystallinity reduction[10], and alteration in particle size of embedded loads[11]. Furthermore, evaluating the impact of high-energy radiation on polymer composites may be crucial when these materials are in use in challenging environments, such as nuclear power plants, aircraft, spacecraft, satellites, and other applications.
Numerous studies target graphene/polymer nanocomposites to investigate the effects of gamma radiation[12-14]. Poly(vinyl alcohol) (PVA) has become of special interest as a polymer matrix
for graphene nanocomposites due to its good physicochemical properties. PVA is a water-soluble, biocompatible synthetic polymer[15] capable of forming strong hydrogen-bonding interactions through its hydroxyl group. In this work, it was used graphene oxide covalently modified with the proteic amino acid histidine, and chemically reduced with cysteine, another proteic amino acid, to produce histidinemodified reduced graphene oxide (H-RGO). The aim is to present an extensive study of these composites focused on optoelectronic applications. These nanocomposite films were gamma-irradiated with doses of up to 100 kGy, and their thermal, optical, and electrical properties were assessed. The findings suggest that nanocomposite material has a good potential as a gamma radiation resistant electronic component, which might be very suitable for optoelectronics, avionics, and aerospace applications.
2.1 Materials
Intercalated graphite flakes, PVA (OH-terminated, Mn = 89-98 kg.mol-1), Histidine, and L-cysteine were purchased from Sigma Aldrich. Sulfuric acid (H2SO4), nitric acid (HNO3), and ethanol were purchased from Cinetica Química (Brazil). Potassium permanganate (KMnO 4), sodium hydroxide (NaOH), and sodium nitrate (NaNO3) were purchased from Dinâmica Química
Lima, T., Diniz, F., Araújo, E., & Araújo, P.
(Brazil). Hydrogen peroxide (H2O2) was purchased from VETEC. All reagents were of analytical grade and were used as supplied.
2.2.1 Preparation of modified and reduced graphene oxide (H-RGO)
Graphene oxide (GO) was obtained from intercalated graphite flakes through Hummer’s chemical oxidation method[16,17] . GO covalent modification was prepared as described in previous studies[18,19] to obtain histidine-modified graphene oxide (H-GO). In brief, 0.5 g of GO was suspended in 50 mL of deionized water, and approximately 9 mmol of histidine was added under stirring. Aqueous NaOH (0.2 mol.L-1) was mixed with the suspension and left under stirring for 24 h at 80 °C. The product was filtered and dried in an oven at 60 °C for 24 h. Chemical reduction of H-GO was performed with L-cysteine[20]. H-GO (0.25 g) was added to 150 mL of deionized water. The suspension was sonicated (Ultrasonic probe Sonic Vibracell, 500 W) for 5 min at room temperature under 50% amplitude. Reducing agent L-cysteine (5 g) was added and the mixture was stirred for 72 h. After this time, 20 mL NaOH (1 M) was added, and the resulting mixture was filtered. The residue was washed with absolute ethanol and dried for 24 h at 60 °C to yield 0.21 g of the final product H-RGO. A scheme for H-RGO preparation is presented in Figure 1
2.2.2 Nanocomposite films preparation
Composite films were prepared by casting solution method. An aqueous solution of PVA (10 w/v%) was heated at 90 °C for 1h. 10 mL of the aqueous suspension of H-RGO (0.5 wt%) was sonicated for 10 min at 50% amplitude and added to PVA hot solution. The resulting mixture was stirred for 24 hours at 90 °C. The suspension was then cast on Petri dishes and dried in a dry box at 27 °C. PVA and PVA/H-RGO (0.5 wt%) nanocomposite films with 10 μm thick were peeled off the dishes. The films were gamma irradiated in 25, 50, and 100 kGy doses (60Co, Eγ ~ 1.25 MeV, dose rate ~ 1.6 kGy/h, CG 220 Excel Irradiatior – MDS Nordion Gamma Cell, Canada) in air at room temperature (~27 °C). Here, it was used 0.5 wt% of H-RGO into the PVA matrix to obtain PVA/H-RGO nanocomposite films, since this filler concentration reached better dispersion in water resulting in homogeneous nanocomposite films, as described in earlier studies[19] .
3.1 Fourier Transform Infrared (FTIR) spectroscopy
GO, H-GO, and H-RGO were analyzed through Fourier Transform Infrared (FTIR) Spectroscopy in a FTIR-4600, JASCO-Japan, equipped with an Attenuated Total Reflection accessory ATR ProOne (ZnSe Crystal). Experiments were performed with 32 scans, 4 cm-1, in the 4000 - 500 cm-1 wavenumber range.
Thermogravimetry Analysis (TGA) were performed in a Simultaneous Thermal Analyzer (TGA/DSC2 STARe System - Mettler Toledo) in 70 microliters aluminum oxide crucibles under nitrogen flux (50 mL.min-1), in the 25-600 °C range, with heating rates (β) of 10 °C.min-1 .
UV-Vis spectra were obtained in a V-730 Spectrophotometer (JASCO – Japan), in the 190 - 800 nm wavelength range. Optical band gap energy (Eg) was determined from absorbance versus wavelength data through Mott and Davis Equation 1[21]:
(1)
in which α is the absorbance coefficient calculated from the absorbance-film thickness ratio[22], C is a constant related to sample structure, Eg is the optical band-gap energy, h is the Plank´s constant, and n is the electronic transition index, varying from 1/2 to 3/2 for direct transitions, or from 2 to 3 for indirect transitions, depending on whether allowed or forbidden, respectively[23]. Previous works attributed n = 1/2[23,24] to PVA, as it exhibits allowed direct transitions. Eg values were obtained from (αhν)2 versus hν plot, by linear extrapolation of the curves to zero absorption value. Eg is related to the number of carbon atoms per carbonaceous cluster in the PVA matrix by Equation 2[11]:
34.3 g E M = (2)
Here, M is the carbon atoms number per cluster.
The exponential part of the absorption coefficient curve is called the Urbach tail. This tail appears in disordered or

poorly crystalline materials as these materials present localized states extended in the band gap. The spectral dependence of α and photon energy (hν) is given by Equation 3[11,22]:
where α0 is a constant and E u is the Urbach energy, which is interpreted as the width of the tails of localized states in the band gap and, in general, represents the degree of disorder and irregularities in the amorphous semiconductors[25].
3.4 Electrical conductivity determinations
Superficial electrical conductivity (σ) calculations of composite films were made from electrical resistance (R´) measurements performed in an Electrometer (KEITHLEY 6517B model). Adapted Moon and Spencer Equation[26] was used to calculate σ (Equation 4):
stretching vibrations (1475 cm-1)[28]. Due to NaOH treatment during the modification process, a decrease in the relative intensity of OH broadband in the 3600-2600 cm-1 region could be noticed[29]. At higher wavenumbers, the N-H stretching vibration single band appears at 3320 cm-1 , evidencing covalent bonding between histidine and GO. Additional evidence of histidine presence was observed in the 3108 cm-1 band, attributed to the imidazole ring =C-H stretching vibration[30], in the 2888 cm-1 band, associated with histidine aliphatic CH2 stretching; and in the band at 1571 cm-1, corresponding to the imidazole ring’s skeleton vibration[31]. After reduction, H-RGO showed even fewer FTIR-detectable oxygen groups. N-H stretching at 3320 cm1, and the aliphatic C-H stretching at 2880 cm-1 were still present, but with lower intensity probably due to histidine detachment after the reduction process. The presence of bands in 1598 and 1503 cm-1 in H-RGO might be associated with the restoration of graphene-conjugated lattice, as reported by Pfaffeneder-Kmen et al.[32] for in-situ ATR-FTIR analysis of GO electrochemical reduction.
where t = sample thickness, d = distance between contacts, d0 = diameter of contacts.
4. Results and Discussions
4.1 FTIR analysis
Figure 2 shows FTIR-ATR spectra for GO, H-GO, and H-RGO. For the GO spectrum, the broad band around 3200 cm-1 is typical of hydrogen-bonded carboxyl OH group stretching[27]. The band around 1713 cm-1 is attributed to carbonyl stretching, while the band at 1041 cm-1 is attributed to C-OH stretching[18]. The vibrations of the unoxidized graphitic skeleton occur at 1618 cm-1[27]. These data suggest effective graphite chemical oxidation. After superficial covalent modification with histidine, the product H-GO exhibited carboxylate group symmetrical

Figure 3 shows FTIR spectra for PVA and H-RGO nanocomposites. PVA data are in accordance with previous reports[33,34]. A broad band centered in 3239 cm-1 was attributed to OH groups stretching and peaks around 2900 cm-1 were attributed to CH asymmetrical stretching vibrations. Peaks at around 1657, 1415, and 1084 cm-1 were assigned to C=O, C-H, and C-O stretch vibration, respectively. C=O groups are related to residual acetate groups after partial PVA hydrolysis. The spectra of composites do not significantly differ from the spectrum of PVA. The irradiated samples exhibited more intense absorption bands for oxygenated groups in both PVA and H-RGO samples. This suggests that irradiation-induced oxidation occurred, regardless of the presence of H-RGO filler. The increase in the intensity of the C-O bands suggests the presence of free radicals due to the interaction of ionizing radiation with PVA. These radicals can interact with OH groups leading to the formation of bonds between the polymer chains, which leads to crosslinking, an expected behavior for PVA matrices[35,36]
Graphene derivatives GO and H-RGO, the PVA matrix, and the PVA/H-RGO were analyzed for their thermal behavior and thermograms are shown in Figure 4. GO has a significant mass loss (approximately 13%) below 100 °C, attributed to the removal of water from the material, which is known for its hydrophilic nature. The first stage of GO degradation begins around 200 ºC and is associated with the decomposition of surface oxygenated functional groups, and the graphite residue does not degrade until 800 °C[18] .
H-RGO presents a more stable behavior up to 240 ºC since most of its oxygenated functional groups are removed during chemical reduction. Then, the material underwent fast thermal degradation and lost almost 70% of its mass. PVA thermogram initially shows a slight loss of mass below 100 °C, attributed to the evaporation of water absorbed during film formation. It is observed that PVA, as reported in the literature[37], presented two stages of thermal degradation. The first stage took place
Lima, T., Diniz, F., Araújo, E., & Araújo, P.
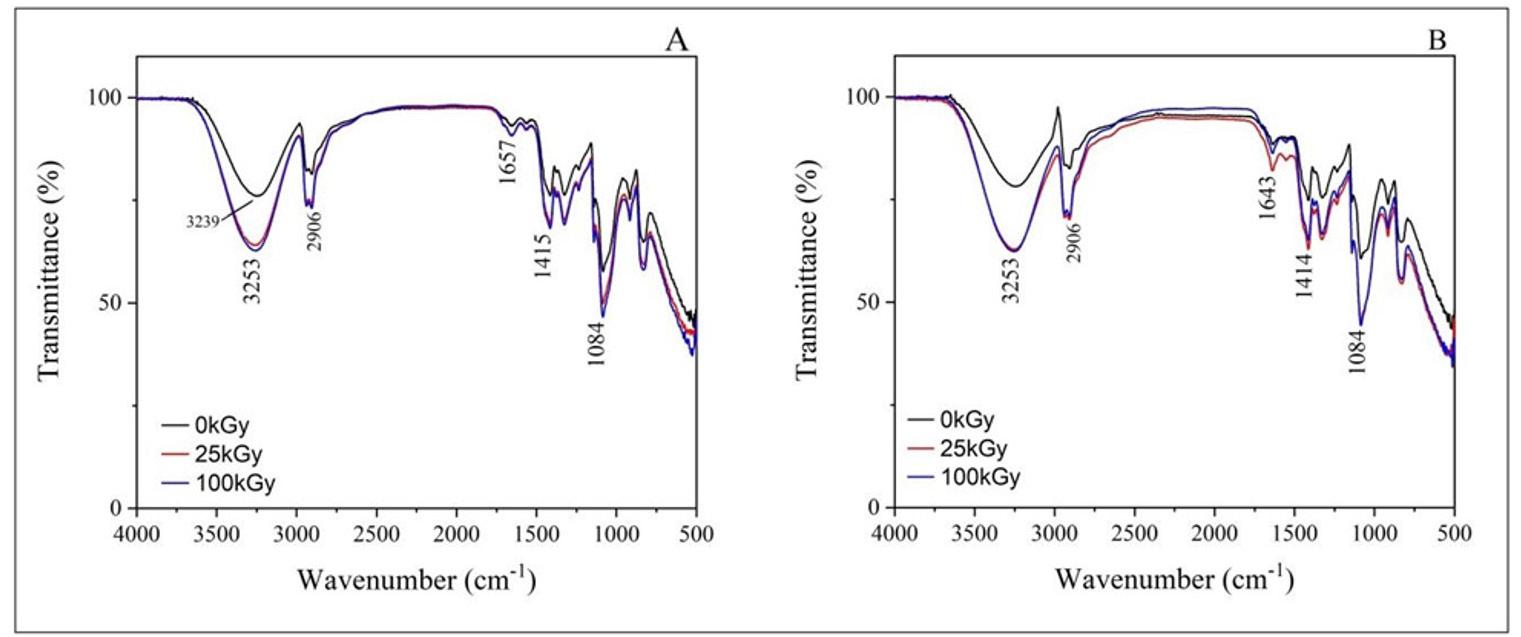
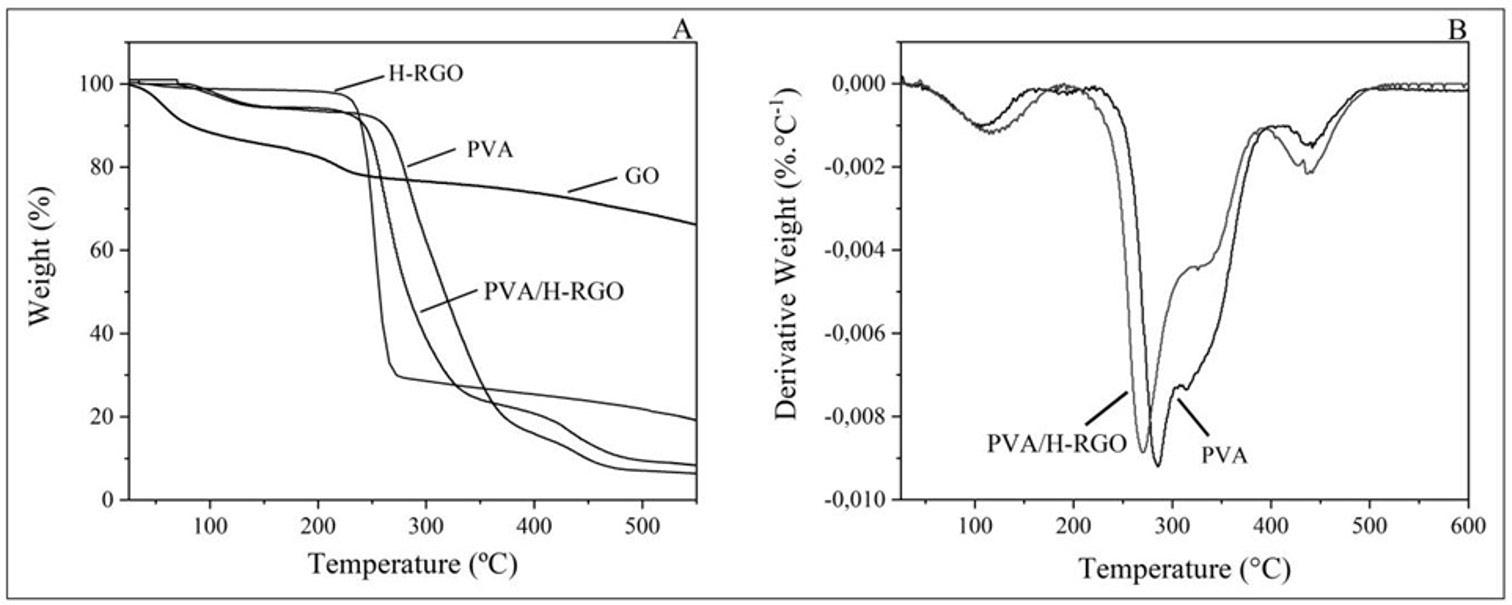
around 264 ºC when the elimination of hydroxyl side groups, main chain scissions, and formation of volatile compounds happened, leading to a loss of 76% of the polymer mass. The second stage, with a less significant mass loss (7%) initiated around 424 °C, is related to the elimination of newly formed compounds and continued removal of residual acetate groups from the polymerization starting material[37]. With the addition of the filler to the polymer matrix, only a decrease of 15.2 °C in the initial temperature (Tonset) of the first degradation stage could be noticed, indicating nanocomposite thermal stability after the insertion of H-RGO filler. After irradiation, the PVA matrix underwent small changes in its thermal degradation steps, while PVA/H-RGO presented the same degradation steps, even after exposure to 100 kGy dose. It is clear that H-RGO, when embedded into the PVA matrix promotes radiolytic protection to the nanocomposite system. All data for initial temperature (Tonset), temperature of maximum degradation rate (Tmax), and mass loss percentage (Δm) at each degradation step are shown in Table 1
Figure 5 shows UV-Vis spectra for PVA (5A) and PVA/HRGO nanocomposite (5B), before and after irradiation. PVA transparency to visible light allowed low absorbance in the 400 – 800 nm region. PVA/H-RGO nanocomposite films presented good transparency, with absorbance around 0.4 in the same region. After irradiation, PVA films began to gradually exhibit an absorption peak around 230 and 270 nm (UV region), indicating the formation of C=O chromophores. In the nanocomposite, this peak appears centered at 230 nm, indicating that the presence of H-RGO might facilitate the processes of splitting C-H and O-H bonds, resulting in the formation of C=O groups during gamma irradiation.
UV-Vis analysis allows the study of the optical band gap of PVA films and their composites from parameters taken from absorption versus wavelength spectra. Absorption coefficient (α), and photon energy (hν) were determined considering films with 10µm in thickness. Figure 6 shows the optical absorption coefficient versus photon energy
Gamma irradiation effect on properties of modified graphene doped PVA nanocomposite films
Table 1. Thermogravimetry analysis data for GO, H-RGO, unirradiated and gamma-irradiated films.
System
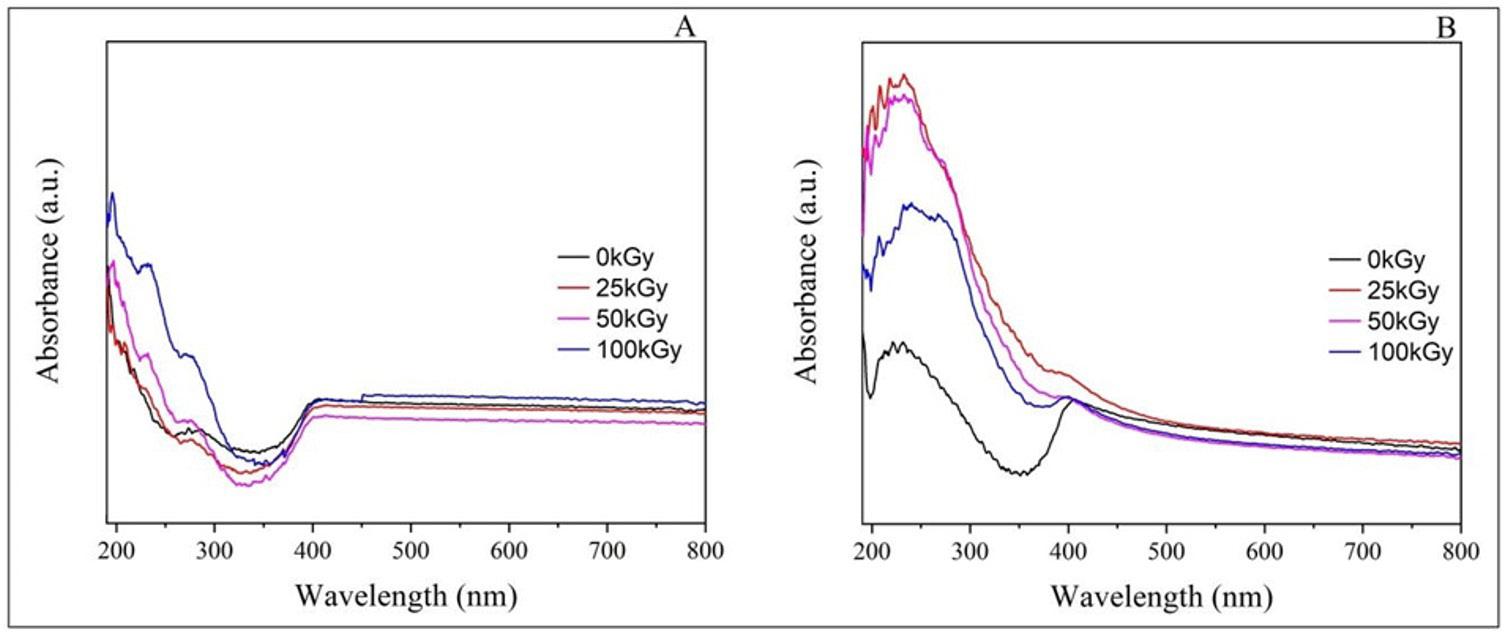
Figure 5. (A) PVA and (B) PVA/H-RGO (0.5 wt%) nanocomposite films UV-Vis spectra for unirradiated or gamma-irradiated (25, 50, and 100 kGy) samples.
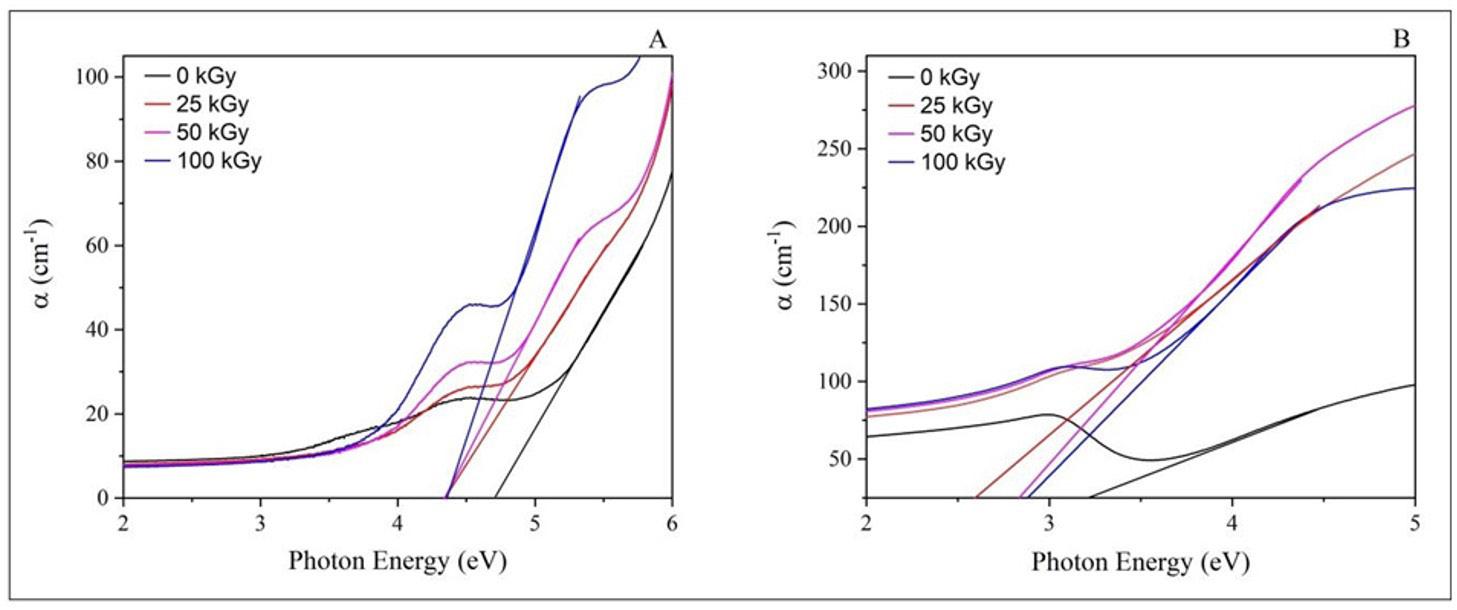
Figure 6. Optical absorption coefficient (α) versus photon energy for (A) PVA and (B) PVA/H-RGO, at 0, 25, 50, and 100 kGy doses.
curves for PVA and PVA/H-RGO nanocomposite films. The absorption edge (Ed) is determined by extrapolating the linear part of α versus hν (eV) curves to zero absorption value[23]. It is observed that the absorption edge is reduced from 4.89 to 3.42 after adding H-RGO nanofillers into the PVA matrix (Table 2). Also, gamma irradiation on polymer systems promoted the reduction of Ed values in both PVA and PVA/H-RGO nanocomposite.
Curves obtained from (αhν)2 versus hν plots were used for drawing a tangential line as an extrapolation of the curve linear region. For (αhν)2 = 0, optical band gap energy values (Eg) were determined. These curves, as well as their linear extrapolations, are presented in Figures 7 and 8, for PVA and PVA/H-RGO films, respectively.
E g value (Table 2) for PVA was 6.20 eV, which is in agreement with previous reports[34]. The addition of H-RGO
Lima, T., Diniz, F., Araújo, E., & Araújo, P.
Table 2. Optical parameters for PVA and PVA/H-RGO (0.5 wt%) composites before and after gamma irradiation. System
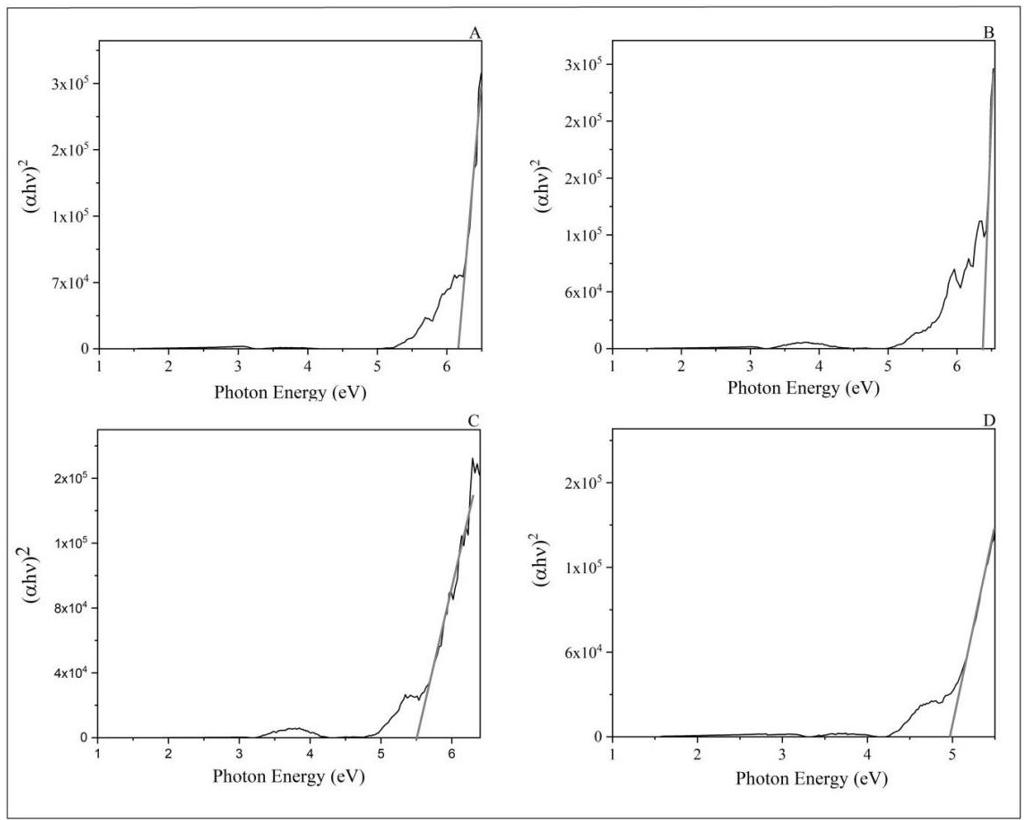
into the PVA matrix decreases E g values from 6.20 to 3.76 eV, turning this novel polymer nanocomposite into a useful material for optoelectronic applications. This decrease might be associated with an increase in the density of localized states in the band gap of the PVA matrix, generating new energy levels between the bands of the highest occupied molecular orbital (HOMO) and the lowest unoccupied molecular orbital (LUMO), due to an increase in disorder level after H-RGO filler incorporation[34]
Urbach energy (Eu) values were found from the slope of the linear region of the ln(α) versus hν plot (Figure 9). Eu values decrease from 2.62 eV (PVA) to 0.35 eV (PVA/H-RGO).
In general, the energy difference between localized states in the valence band and extended states in the conduction band represents Eg, and the sum Eg + E u represents the mobility band gap energy[34,38]. Thus, the decrease in the mobility band gap energy values of the gamma-irradiated PVA, as seen in Table 2, can be explicated by the formation of radiolytic events such as main chain scissions, free radicals, and oxidation, which promote disorder and imperfections in the structure of the polymer matrix. These events lead to the creation of new localized states of various depths in the forbidden band energy, which, in general, contributes to the decrease in optical band gap energy. It is worth
Gamma irradiation effect on properties of modified graphene doped PVA nanocomposite films
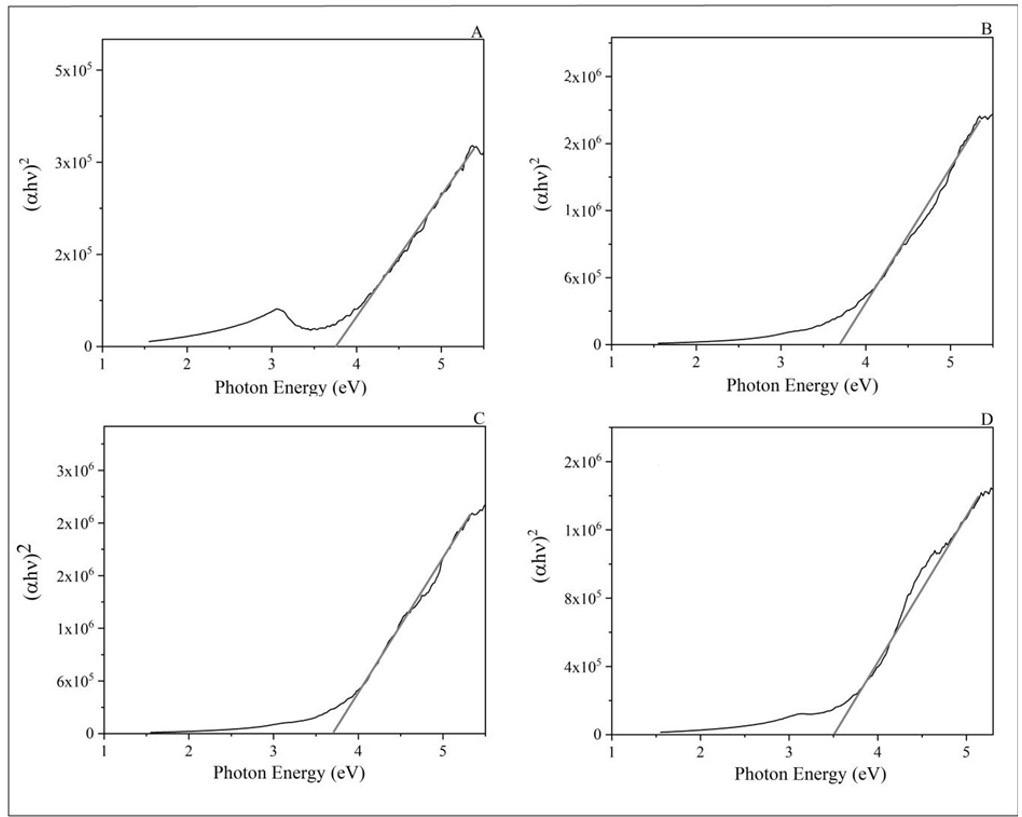
8. Optical band gap (Eg) of PVA/H-RGO (0.5 wt%) nanocomposite films after irradiation with doses of (A) 0 kGy, (B) 25 kGy, (C) 50 kGy and (D) 100 kGy.
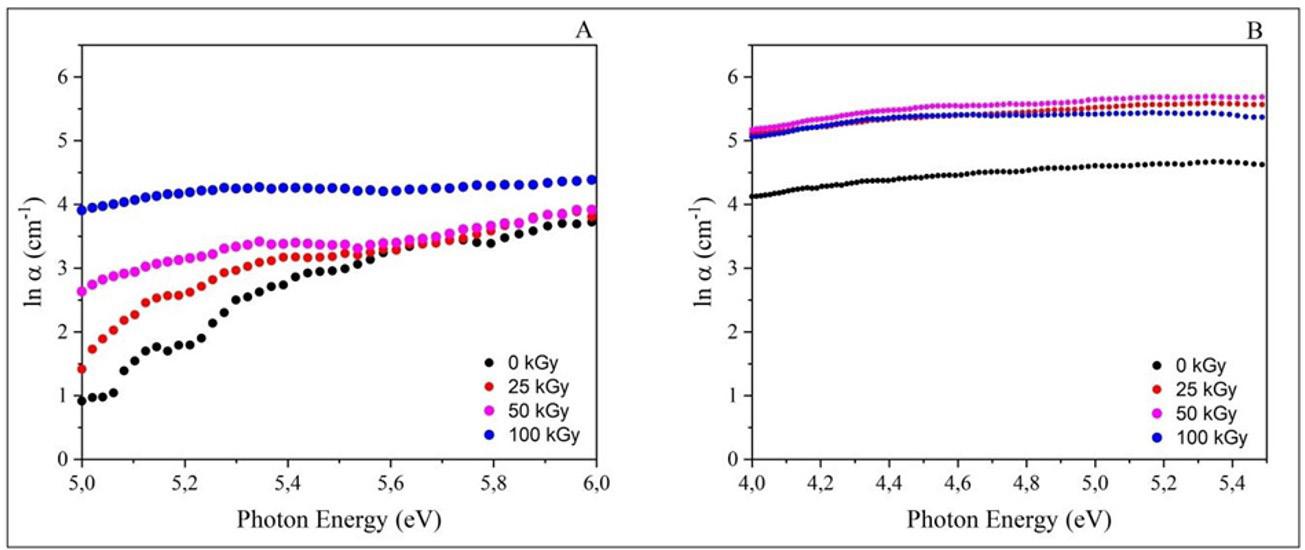
mentioning that the reduction of Tonset and T max in the first stage of gamma-irradiated PVA thermal degradation is characteristic of main chain scission effects (Table 1). However, the mobility band gap energy of the PVA/H-RGO nanocomposite did not significantly change with gamma irradiation. It is well known that aromatic structures promote radiolytic protection on polymer systems[39], as they disperse
excess energy through delocalized electrons in the aromatic system. It is possible to infer that H-RGO, a filler that bears a number of aromatic fused rings into its graphene structure, might stabilize PVA against gamma-irradiation damages up to 50 kGy dose.
The number of carbon atoms per carbonaceous grouping, M, for the unirradiated PVA matrix was 31,
Lima, T., Diniz, F., Araújo, E., & Araújo, P.
and for the nanocomposite increased to 83. This increase in M values is due to the conjugation of PVA hydroxyl groups and hydrogen bond-forming groups present in H-RGO, such as secondary amino (N-H), imidazole, and carboxylate from histidine (see FTIR analysis, section 4.1), along with possible residual hydroxyl and carboxy groups from incomplete graphene oxide reduction, among others. Abdelhamied et al.[23] reported a considerable increase in M when pristine PVA was filled with polyaniline emeraldine hydrochloric salt (PANI-HCl). While PVA presented M of 34.5, PVA/PANI-HCl (10 wt%) composites M values were found to be around 58. Noticeably, both fillers, PANI-HCl and H-RGO are able to form strong intermolecular interactions with the PVA matrix. Nevertheless, H-RGO was used in a much smaller concentration (0.5 wt%) than PANI-HCl (10 wt%)[40]. Optical parameters of PVA and PVA/H-RGO films were significantly affected by gamma irradiation, as shown in Table 2. Nevertheless, these radiation-induced modifications on optical parameters do not exclude PVA/HRGO nanocomposites from optoelectronic applications, since the parameters remain within the expected range, as also observed by other researchers[17,19] .
PVA is an electrical insulator material, and its conductivity is around 10-11 S.cm-1. With the addition of H-RGO, the composite showed electrical conductivity 5 orders of magnitude higher, reaching semiconductivity with 10-6 S.cm-1 (Figure 10). PVA and PVA/H-RGO films were exposed to gamma irradiation doses of 25, 50, and 100 kGy. An increase from 10-11 S.cm-1 to 10-9 S.cm-1 after 25 kGy dose was observed for PVA. Gamma-irradiated PVA/HRGO nanocomposite reached 10-4 S.cm-1 in conductivity, after the same dose. It is worth noting that the range 10-6 < σ < 10-1 S.cm-1 characterizes semiconductor materials[41] According to Prabha and Jayanna[42], the increase in polymer conductivity is related to the presence of free ions connected to the polymer chain. Thus, radiation-induced polymer radiolytic products might contribute to increased electrical conductivity of the polymer system. PVA/H-RGO nanocomposites underwent considerable change in electrical conductivity after gamma irradiation. These materials might
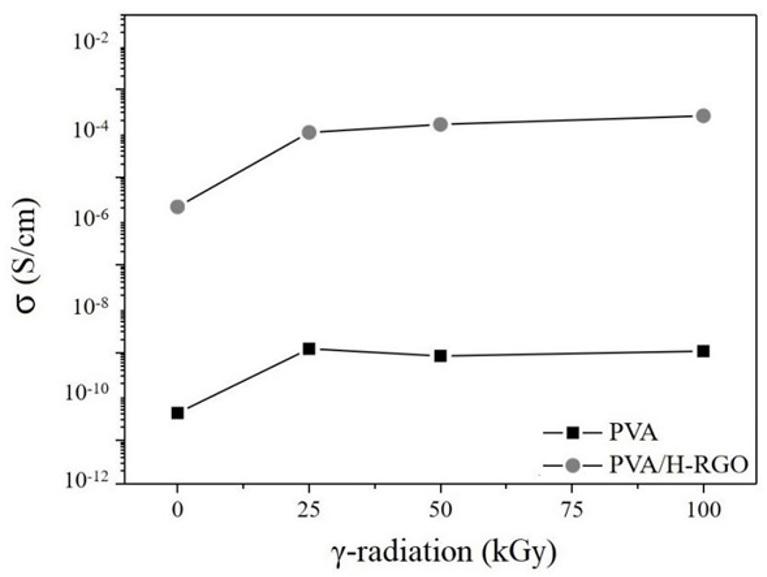
Figure 10. Surface electrical conductivity versus gamma-radiation dose for PVA or PVA/H-RGO (0.5 wt%) nanocomposite films.
play important roles in environments exposed to ionizing radiation, such as outer space or nuclear power plants.
The influence of gamma irradiation on graphene-based polymer nanocomposites was studied in the scope of their thermal, optical, and electrical properties. Graphene oxide, when chemically modified with histidine, a natural metabolite, and mildly reduced with cysteine, another natural metabolite H-RGO, and embedded into the PVA matrix promotes radiolytic protection to the nanocomposite system, since thermal parameters were not significantly changed by gamma irradiation. From the analysis of UV-Vis spectrophotometry was possible to obtain optical parameters for PVA and PVA/H-RGO composites. The optical band gap energy value found for PVA was 6.20 eV, this value decreased especially at higher doses of gamma irradiation. For the PVA/H-RGO nanocomposite films containing 0.5% filler, a significant decrease in the optical band gap from 6.20 to 3.76 eV took place. The mobility band gap energy of PVA/H-RGO nanocomposite films was not significantly changed with gamma doses up to 50 kGy. Additionally, PVA/H-RGO nanocomposite films presented electrical conductivity around 10-6 S.cm-1, thus, being semiconducting materials. Thus, the modified graphene filler is a good alternative to impart electrical conductivity to the PVA matrix without interfering with relevant matrix physical properties, even after exposure to high doses of gamma irradiation. This novel polymer nanocomposite has great potential for optoelectronic, sensor, and avionics devices.
• Conceptualization – Thaises Lima; Elmo Araújo; Patrícia Araújo.
• Data curation – Thaises Lima; Filipe Diniz.
• Formal analysis – Thaises Lima; Filipe Diniz.
• Funding acquisition - Elmo Araújo; Patrícia Araújo.
• Investigation – Thaises Lima; Filipe Diniz.
• Methodology – Thaises Lima; Elmo Araújo; Patrícia Araújo.
• Project administration – Elmo Araújo; Patrícia Araújo.
• Resources – Thaises Lima; Filipe Diniz; Elmo Araújo; Patricia Araújo.
• Software – NA.
• Supervision – Elmo Araújo; Patrícia Araújo.
• Validation – NA.
• Visualization – NA.
• Writing – original draft – Thaises Lima; Filipe Diniz; Elmo Araújo; Patricia Araújo.
• Writing – review & editing – Thaises Lima; Filipe Diniz; Elmo Araújo; Patricia Araújo.
The authors were grateful for the financial support from CNPq (Conselho Nacional de Pesquisa e Desenvolvimento
Científico e Tecnológico), CAPES (Coordenação de Aperfeiçoamento Pessoal de Nível Superior) and FACEPE (Fundação de Amparo à Ciência e Tecnologia de Pernambuco).
1. Badawi, A. (2020). Engineering the optical properties of PVA/ PVP polymeric blend in situ using tin sulfide for optoelectronics. Applied Physics. A, Materials Science & Processing, 126(5), 335 http://doi.org/10.1007/s00339-020-03514-5
2 Badawi, A., Alharthi, S. S., Mostafa, N. Y., Althobaiti, M. G., & Altalhi, T. (2019). Effect of carbon quantum dots on the optical and electrical properties of polyvinylidene fluoride polymer for optoelectronic applications. Applied Physics. A, Materials Science & Processing, 125(12), 858 http://doi. org/10.1007/s00339-019-3160-1
3 Karthikeyan, B., Hariharan, S., Mangalaraja, R. V., Pandiyarajan, T., Udayabhaskar, R., & Sreekanth, P. (2018). Studies on NiOPVA composite films for opto-electronics and optical limiters. IEEE Photonics Technology Letters, 30(17), 1539-1542. http:// doi.org/10.1109/LPT.2018.2859042
4 Fan, L., Wang, M., Zhang, Z., Qin, G., Hu, X., & Chen, Q. (2018). Preparation and characterization of PVA alkaline solid polymer electrolyte with addition of bamboo charcoal. Materials, 11(5), 679 http://doi.org/10.3390/ma11050679 PMid:29701694.
5 Ali, F. M., Kershi, R. M., Sayed, M. A., & AbouDeif, Y. M. (2018). Evaluation of structural and optical properties of Ce3+ ions doped (PVA/PVP) composite films for new organic semiconductors. Physica B, Condensed Matter, 538, 160-166. http://doi.org/10.1016/j.physb.2018.03.031
6 Otaguro, H., Lima, L. F. C. P., Parra, D. F., Lugão, A. B., Chinelatto, M. A., & Canevarolo, S. V. (2010). High-energy radiation forming chain scission and branching in polypropylene. Radiation Physics and Chemistry, 79(3), 318-324 http://doi. org/10.1016/j.radphyschem.2009.11.003
7 Yoshiga, A., Otaguro, H., Parra, D. F., Lima, L. F. C. P., & Lugão, A. B. (2009). Controlled degradation and crosslinking of polypropylene induced by gamma radiation and acetylene. Polymer Bulletin, 63(3), 397-409. http://doi.org/10.1007/ s00289-009-0102-7
8 Xu, Z., Huang, Y., Zhang, C., Liu, L., Zhang, Y., & Wang, L. (2007). Effect of γ-ray irradiation grafting on the carbon fibers and interfacial adhesion of epoxy composites. Composites Science and Technology, 67(15-16), 3261-3270 http://doi. org/10.1016/j.compscitech.2007.03.038
9 Araújo, E. S., Khoury, H. J., & Silveira, S. V. (1998). Effects of gamma-irradiation on some properties of durolon polycarbonate. Radiation Physics and Chemistry, 53(1), 79-84 http://doi. org/10.1016/S0969-806X(97)00300-9.
10 Sunitha , V. R. , & Radhakrishnan , S. ( 2020 ). Gamma irradiation effects on conductivity and dielectric behaviour of PEO-based nano-composite polymer electrolyte systems. Polymer Bulletin, 77(2), 655-670 http://doi.org/10.1007/ s00289-019-02770-7
11 Chahal, R. P., Mahendia, S., Tomar, A. K., & Kumar, S. (2012). γ-Irradiated PVA/Ag nanocomposite films: materials for optical applications. Journal of Alloys and Compounds, 538, 212-219 http://doi.org/10.1016/j.jallcom.2012.05.085
12 Huang, G., Ni, Z., Chen, G., & Zhao, Y. (2016). The influence of irradiation and accelerated aging on the mechanical and tribological properties of the graphene oxide/ultra-highmolecular-weight polyethylene nanocomposites. International Journal of Polymer Science , 2016 , 2618560 http://doi. org/10.1155/2016/2618560
13 Zhang, D., Yang, S., Chen, Y., Liu, S., Zhao, H., & Gu, J. (2018). 60Co γ-ray irradiation crosslinking of chitosan/graphene oxide composite film: swelling, thermal stability, mechanical, and antibacterial properties. Polymers, 10(3), 294 http://doi. org/10.3390/polym10030294 PMid:30966329.
14 Ramya, J. R., Arul, K. T., Sathiamurthi, P., Nivethaa, E. A. K., Baskar, S., Amudha, S., Mohana, B., Elayaraja, K., Veerla, S. C., Asokan, K., & Kalkura, S. N. (2019). Gamma irradiated poly (methyl methacrylate)-reduced graphene oxide composite thin films for multifunctional applications. Composites. Part B, Engineering, 163, 752-760 http://doi.org/10.1016/j. compositesb.2019.01.041
15 Paradossi, G., Cavalieri, F., Chiessi, E., Spagnoli, C., & Cowman, M. K. (2003). Poly(vinyl alcohol) as versatile biomaterial for potential biomedical applications. Journal of Materials Science. Materials in Medicine, 14(8), 687-691. http://doi.org/10.1023/A:1024907615244 PMid:15348409.
16 Hummers, W. S., Jr., & Offeman, R. E. (1958). Preparation of graphitic oxide. Journal of the American Chemical Society, 80(6), 1339 http://doi.org/10.1021/ja01539a017
17 Geng, Y., Wang, S. J., & Kim, J.-K. (2009). Preparation of graphite nanoplatelets and graphene sheets. Journal of Colloid and Interface Science, 336(2), 592-598 http://doi.org/10.1016/j. jcis.2009.04.005 PMid:19414181.
18 Mallakpour, S., Abdolmaleki, A., & Borandeh, S. (2014). Covalently functionalized graphene sheets with biocompatible natural amino acids. Applied Surface Science, 307, 533-542 http://doi.org/10.1016/j.apsusc.2014.04.070
19 Lima, T. B. S., Silva, V. O., Araujo, E. S., & Araujo, P. L. B. (2019). Polymer nanocomposites of surface-Modified graphene I: thermal and electrical properties of poly(vinyl alcohol)/amino acid-functionalized graphene. Macromolecular Symposia, 383(1), 1800051 http://doi.org/10.1002/masy.201800051
20 Chen, D., Li, L., & Guo, L. (2011). An environment-friendly preparation of reduced graphene oxide nanosheets via amino acid. Nanotechnology, 22(32), 325601 http://doi.org/10.1088/09574484/22/32/325601 PMid:21757797.
21. Davis, E. A., & Mott, N. F. (1970). Conduction in non-crystalline systems V. Conductivity, optical absorption and photoconductivity in amorphous semiconductors. Philosophical Magazine, 22(179), 903-922 http://doi.org/10.1080/14786437008221061
22 Muhammad, F. F., Aziz, S. B., & Hussein, S. A. (2015). Effect of the dopant salt on the optical parameters of PVA:NaNO3 solid polymer electrolyte. Journal of Materials Science Materials in Electronics, 26(1), 521-529. http://doi.org/10.1007/s10854014-2430-0
23 Abdelhamied, M. M., Atta, A., Abdelreheem, A. M., Farag, A. T. M., & El Okr, M. M. (2020). Synthesis and optical properties of PVA/PANI/Ag nanocomposite films. Journal of Materials Science Materials in Electronics, 31(24), 22629-22641 http:// doi.org/10.1007/s10854-020-04774-w
24 Selvi, J., Mahalakshmi, S., Parthasarathy, V., Hu, C., Lin, Y.-F., Tung, K.-L., Anbarasan, R., & Annie, A. A. (2019). Optical, thermal, mechanical properties, and non-isothermal degradation kinetic studies on PVA/CuO nanocomposites. Polymer Composites, 40(9), 3737-3748 http://doi.org/10.1002/ pc.25235
25. Sharma, P., & Katyal, S. C. (2008). Effect of tin addition on the optical parameters of thermally evaporated As–Se–Ge thin films. Materials Chemistry and Physics, 112(3), 892-897 http://doi.org/10.1016/j.matchemphys.2008.07.035
26 Moon, P., & Spencer, D. E. (1961) Field Theory for Engineers. Princeton: D. Van Nostrand Company, Inc. http://doi. org/10.1119/1.1937573
27 Stankovich, S., Piner, R. D., Nguyen, S. T., & Ruoff, R. S. (2006). Synthesis and exfoliation of isocyanate-treated graphene
Lima, T., Diniz, F., Araújo, E., & Araújo, P.
oxide nanoplatelets. Carbon, 44(15), 3342-3347 http://doi. org/10.1016/j.carbon.2006.06.004
28 Zhang, Y., Li, H., Xi, B., Che, Y., & Zheng, J. (2008). Growth and characterization of l-histidine nitrate single crystal, a promising semiorganic NLO material. Materials Chemistry and Physics, 108(2-3), 192-195 http://doi.org/10.1016/j. matchemphys.2007.09.006
29 Rajaura, R. S., Sharma, V., Ronin, R. S., Gupta, D. K., Srivastava, S., Agrawal, K., & Vijay, Y. K. (2017). Synthesis, characterization and enhanced antimicrobial activity of reduced graphene oxide–zinc oxide nanocomposite. Materials Research Express, 4(2), 025401 http://doi.org/10.1088/2053-1591/aa5bff
30 Viruthagiri, G., Praveen, P., Mugundan, S., & Anbuvannan, M. (2013). Growth and characterization of L-histidine doped thiourea single crystals by slow evaporation method. Indian Journal of Advances in Chemical Science, 1(4), 193-200 Retrieved in 2023, December 21, from http://ijacskros.com/ artcles/IJACS-M29.pdf
31 Epishina, L. V., Slovetskii, V. I., Osipov, V. G., Lebedev, O. V., Khmel’nitskii, L. I., Sevost’yanova, V. V., & Novikova, T. S. (1967). Infrared spectra and the structure of salts of imidazoles. Chemistry of Heterocyclic Compounds, 3(2), 570-575 http:// doi.org/10.1007/BF00481609
32 Pfaffeneder-Kmen, M., Falcon Casas, I., Naghilou, A., Trettenhahn, G., & Kautek, W. (2017). A multivariate curve resolution evaluation of an in-situ ATR-FTIR spectroscopy investigation of the electrochemical reduction of graphene oxide. Electrochimica Acta, 255, 160-167 http://doi.org/10.1016/j. electacta.2017.09.124.
33 Xue, B., Ji, L., Deng, J., & Zhang, J. (2016). In situ FTIR spectroscopy study on the rapid dissolution process of modified poly(vinyl alcohol). Journal of Polymer Research, 23(10), 209 http://doi.org/10.1007/s10965-016-1100-8
34. Abdullah, O. G., Aziz, S. B., & Rasheed, M. A. (2016). Structural and optical characterization of PVA:KMnO4 based solid polymer electrolyte. Results in Physics, 6, 1103-1108 http://doi.org/10.1016/j.rinp.2016.11.050.
35 Ali, Z. I., Ali, F. A., & Hosam, A. M. (2009). Effect of electron beam irradiation on the structural properties of
PVA/V2O5 xerogel. Spectrochimica Acta. Part A: Molecular and Biomolecular Spectroscopy, 72(4), 868-875 http://doi. org/10.1016/j.saa.2008.12.013 PMid:19157963.
36 Kamoun, E. A., Chen, X., Mohy Eldin, M. S., & Kenawy, E.R. S. (2015). Crosslinked poly(vinyl alcohol) hydrogels for wound dressing applications: a review of remarkably blended polymers. Arabian Journal of Chemistry, 8(1), 1-14 http://doi. org/10.1016/j.arabjc.2014.07.005
37 Ravari, F., Noori, M., & Ehsani, M. (2019). Thermal stability and degradation kinetic studies of PVA/RGO using the modelfitting and isoconversional (model-free) methods. Fibers and Polymers, 20(3), 472-480 http://doi.org/10.1007/s12221-0198606-8
38. Sbeih, S. A., & Zihlif, A. M. (2009). Optical and electrical properties of kaolinite/polystyrene composite. Journal of Physics. D, Applied Physics, 42(14), 145405 http://doi. org/10.1088/0022-3727/42/14/145405
39 Silva, F. F., Aquino, K. A. S., & Araujo, E. S. (2008). Effects of gamma irradiation on poly(vinyl chloride)/polystyrene blends: investigation of radiolytic stabilization and miscibility of the mixture. Polymer Degradation & Stability, 93(12), 2199-2203 http://doi.org/10.1016/j.polymdegradstab.2008.07.024
40 Heeger, A. J. (2001). Nobel Lecture: Semiconducting and metallic polymers: the fourth generation of polymeric materials. Reviews of Modern Physics, 73(3), 681-700. http:// doi.org/10.1103/RevModPhys.73.681
41 Pang, H., Xu, L., Yan, D.-X., & Li, Z.-M. (2014). Conductive polymer composites with segregated structures. Progress in Polymer Science, 39(11), 1908-1933 http://doi.org/10.1016/j. progpolymsci.2014.07.007
42 Prabha, K., & Jayanna, H. S. (2015). Study the frequency dependence of dielectric properties of gamma irradiated PVA(1-x) PS x polymer blends. Open Journal of Polymer Chemistry, 5(4), 47-54. http://doi.org/10.4236/ojpchem.2015.54006.
Received: Dec. 21, 2023
Revised: Sept. 25, 2024
Accepted: Oct. 28, 2024
São Paulo 994 St. São Carlos, SP, Brazil, 13560-340
Phone: +55 16 3374-3949
Email: abpol@abpol.org.br 2021