Volume XXXV - Issue II - July., 2025

Volume XXXV - Issue II - July., 2025

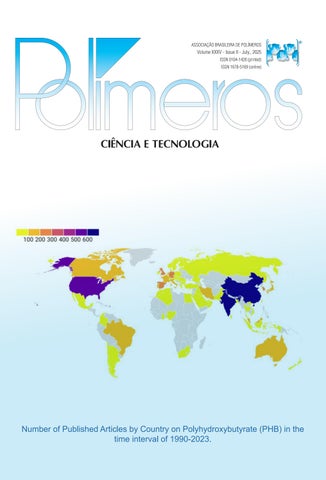
Number of Published Articles by Country on Polyhydroxybutyrate (PHB) in the time interval of 1990-2023.

DATA: DATA: 19 A 23 DE OUTUBRO DE 2025 19 A 23 DE OUTUBRO DE 2025
LOCAL: LOCAL: CAMPOS DO JORDÃO CONVENTION CENTER/SP CAMPOS DO JORDÃO CONVENTION CENTER/SP

O CBPOL

O CBPol é o principal evento científ ico da América Latina dedicado à
O CBPol é o principal evento científ ico da América Latina dedicado à área de polímeros, reunindo renomados pesquisadores e especialistas área de polímeros, reunindo renomados pesquisadores e especialistas da academia e da indústria, tanto do Brasil quanto do exterior. O da academia e da indústria, tanto do Brasil quanto do exterior. O congresso oferece um espaço privilegiado para a discussão das mais congresso oferece um espaço privilegiado para a discussão das mais recentes pesquisas, avanços tecnológicos e inovações no campo dos recentes pesquisas, avanços tecnológicos e inovações no campo dos polímeros. Aproveite a oportunidade de interagir com os maiores polímeros. Aproveite a oportunidade de interagir com os maiores especialistas do setor e contribuir para o futuro dos materiais especialistas do setor e contribuir para o futuro dos materiais poliméricos! poliméricos!
Venha fazer parte deste evento, inscreva-se em: Venha fazer parte deste evento, inscreva-se em: www.cbpol.com.br www.cbpol.com.br


Organização e Realização:


Apoio:


S
ndexed
e d I tor I al C ou NCI l
Antonio Aprigio S. Curvelo (USP/IQSC) - President m ember S
Ailton S. Gomes (UFRJ/IMA), Rio de Janeiro, RJ (in memoriam)
Alain Dufresne (Grenoble INP/Pagora)
Artur José Monteiro Valente (UC/DQ)
Bluma G. Soares (UFRJ/IMA)
César Liberato Petzhold (UFRGS/IQ)
Cristina T. Andrade (UFRJ/IQ)
Edson R. Simielli (Simielli - Soluções em Polímeros)
Edvani Curti Muniz (UEM/DQI)
Elias Hage Jr. (UFSCar/DEMa)
José Alexandrino de Sousa (UFSCar/DEMa)
José António C. Gomes Covas (UMinho/IPC)
José Carlos C. S. Pinto (UFRJ/COPPE)
Júlio Harada (Harada Hajime Machado Consutoria Ltda)
Luiz Antonio Pessan (UFSCar/DEMa)
Luiz Henrique C. Mattoso (EMBRAPA)
Marcelo Silveira Rabello (UFCGU/AEMa)
Marco Aurelio De Paoli (UNICAMP/IQ)
Nikos Hadjikristidis (KAUST/ PSE)
Osvaldo N. Oliveira Jr. (USP/IFSC)
Paula Moldenaers (KU Leuven/CIT)
Raquel S. Mauler (UFRGS/IQ)
Regina Célia R. Nunes (UFRJ/IMA)
Richard G. Weiss Washington (GU/DeptChemistry) (in memoriam)
Roberto Pantani, (UNISA/DIIn)
Rodrigo Lambert Oréfice (UFMG/DEMET)
Sebastião V. Canevarolo Jr. (UFSCar/DEMa)
Silvio Manrich (UFSCar/DEMa)
Financial support:
Available online at: www.scielo.br

e d I tor I al C omm I ttee
Sebastião V. Canevarolo Jr. – Editor-in-Chief
a SS o CI ate e d I tor S
Alain Dufresne
Artur José Monteiro Valente
Bluma G. Soares
César Liberato Petzhold
José António C. Gomes Covas
José Carlos C. S. Pinto
Marcelo Silveira Rabello
Paula Moldenaers
Richard G. Weiss (in memoriam)
Roberto Pantani
Rodrigo Lambert Oréfice
d e S kto P P ubl IS h IN g www.editoracubo.com.br
“Polímeros” is a publication of the Associação Brasileira de Polímeros
São Paulo 994 St. São Carlos, SP, Brazil, 13560-340 Phone: +55 16 3374-3949
emails: abpol@abpol.org.br / revista@abpol.org.br http://www.abpol.org.br
Date of publication: July 2025
Polímeros / Associação Brasileira de Polímeros. vol. 1, nº 1 (1991) -.- São Carlos: ABPol, 1991-
Quarterly v. 35, nº 2 (July 2025)
ISSN 0104-1428
ISSN 1678-5169 (electronic version)
1. Polímeros. l. Associação Brasileira de Polímeros.

Website of the “Polímeros”: www.revistapolimeros.org.br
E E E E E E E E E E E E E E


Development of Polyhydroxybutyrate (PHB) production articles: a bibliometric analysis (1990-2023)
Kharis Yohan Abidin, Abdullah, Yeyen Nurhamiyah, Dewi Nandyawati, Hadiyanto and Istadi e20250020
Recovery of the post-industrial recycled ABS thermomechanical properties by adding graphene oxide
Lucas Pacanaro de Lima, André Petraconi, Natália Ferreira Braga, Lidiane Cristina Costa, Ricardo Jorge Espanhol Andrade and Guilhermino José Macêdo Fechine e20250013
NanoSSIEFARL polymeric nanoparticles-based immunotherapeutic for the treatment of genital herpes
Renata Zorzetto, Flávia Pires Peña, Aline Cláudio de Oliveira, Jayme de Castilhos Ferreira Neto, Gabriel Tardin Mota Hilario, Fernanda Teresa Bovi Frozza, Marvin Paulo Lins, Fernanda Poletto, Marcelo Jung Eberhardt, Pedro Roosevelt Torres Romão, Tanira Alessandra Silveira Aguirre and Luiz Carlos Rodrigues Junior e20250014
Composites of natural rubber with curaua fibers
João D’Anuzio Lima de Azevedo, Virgínia Mansanares Giacon and José Roberto Ribeiro Bortoleto .......................................... e20250015
Superabsorbent hydrogel derived from hide trimming waste
Febriani Purba, Arief Rahmad Maulana Akbar, Agung Cahyo Legowo, Alan Dwi Wibowo, Agung Nugroho, Hairu Suparto and Raihan Sari Afifah e20250016
Sentiment mapping of microplastic awareness in educational environments
Viviane Silva Valladão, Fernando Gomes de Souza Júnior, Sérgio Thode Filho, Fabíola da Silveira Maranhão, Letícia de Souza Ribeiro, Maria Eduarda da Silva Carneiro and Raynara Kelly da Silva dos Santos e20250017
Physico-mechanical and structural characterization of polyethylene films and thermoplastic pinto bean starch
Tomás Jesús Madera-Santana, Anabell Espinoza Verdugo, Víctor Rejón-Moo and Judith Fortiz Hernández e20250018
Surface modification of poly(ε-caprolactone) electrospun fibers with bone powder by DBD
Marcos Rodrigues Oliveira, Lauriene Gonçalves da Luz Silva, Brenda Jakellinny de Sousa Nolêto, Gabriely Gonçalves Lima, Renan Matos Monção, Marcos Cristino de Sousa Brito, Lucas Pereira da Silva, Ediones Maciel de Sousa, Thercio Henrique de Carvalho Costa, Fernanda Roberta Marciano and Rômulo Ribeiro Magalhães de Sousa e20250019
Biocomposite films utilizing sugar cane bagasse and banana peel aiming seedling applications
Thiago Torres Matta Neves, Simone Taguchi Borges, Luiz Antonio Borges Junior, Edla Maria Bezerra Lima, Cristiane Hess de Azevedo Meleiro, Ana Paula Duarte Moreira, Antonieta Middea and Renata Nunes Oliveira ........................ e20250021
Contemporary methods of industrial composite material production technology
Andrii Bieliatynskyi, Olena Bakulich, Viacheslav Trachevskyi and Mingyang Ta e20250022
Determination of elastomer content in NR/SBR/BR blends
Alexandra Helena de Barros, Rachel Farias Magalhães, Lídia Mattos Silva Murakami, Milton Faria Diniz, Natália Beck Sanches, Taynara Alves de Carvalho, Jorge Carlos Narciso Dutra and Rita de Cássia Lazzarini Dutra e20250023
Oxygen anomalous diffusion during photooxidation of polypropylene
José William de Lima Souza, Lucas Cordeiro de Oliveira, Taynah Pereira Galdino, Marcus Vinicius Lia Fook and Rômulo Feitosa Navarro e20250024
Leaf-inspired design makes bioplastics degradable and stronger
Society has long struggled with petroleum-derived plastic pollution, and awareness of microplastics’ detrimental effects on food and water supplies adds further pressure. In response, researchers have been developing biodegradable versions of traditional plastics, or “bioplastics.” However, current bioplastics face challenges as well: Current versions are not as strong as petrochemical-based plastics and they only degrade through a high-temperature composting system.
Researchers at Washington University in St. Louis, who have solved both problems with inspiration from the humble leaf. Long before plastic, humans wrapped their food in leaves, which easily biodegrade due to an underlying structure of cellulose-rich cell walls. WashU’s chemical engineers decided to introduce cellulose nanofibers to the design of bioplastics. “We created this multilayer structure where cellulose is in the middle and the bioplastics are on two sides,” said Joshua Yuan, the Lucy and Stanley Lopata Professor and chair of energy, environmental and chemical engineering at the McKelvey School of Engineering. Yuan is also director for the National Science Foundation-funded Carbon Utilization Redesign for Biomanufacturing (CURB) Engineering Research Center. “In this way, we created a material that is very strong and that offers multifunctionality,” he added.
The technology emerged from working with two of the highest production bioplastics today, polyhydroxybutyrate (PHB) and polylactic acid (PLA). Yuan and colleagues used a variation of their leaf-inspired cellulose nanofiber structure to improve the strength and biodegradability of PHB, a starch-derived plastic; they further refined their technique for PLA, as detailed in a new paper just published in Nature Communications.
The plastic packaging market is a $23.5 billion industry dominated by polyethylene and polypropylene; polymers made from petroleum that break down into harmful microplastics. The researchers’ optimized bioplastic, called Layered, Ecological, Advanced and multi-Functional Film (LEAFF), turned PLA into a packaging material that is biodegradable at room temperature. Additionally, the structure allows for other critical properties, such as low air or water permeability, helping keep food stable, and a surface that is printable. This improves bioplastics’ affordability since it saves manufacturers from printing separate labels for packaging. “On top of all of this, the LEAFF’s underlying cellulose structure gives it a higher tensile strength than even petrochemical plastics like polyethylene and polypropylene,” explained Puneet Dhatt, a PhD student in Yuan’s lab and first author on the article.
The innovation was in adding that cellulosic structure that WashU’s engineers replicated, cellulose fibrils embedded within the bioplastics. “This unique biomimicking design allows us to address the limitations of bioplastic usage and overcome that technical barrier and allow for broader bioplastic utilization,” Yuan said.
The United States is uniquely positioned to dominate the bioplastics market and establish a “circular economy” wherein waste products are reused, fed back into systems instead of left to pollute the air and water or sit in landfills. Yuan hopes this technology can scale up soon and seeks commercial and philanthropic partners to help bring these improved processes to industry. Competitors from Asian and European research institutions also are working to develop similar technology. But U.S. industries have an advantage due to the country’s vast agriculture system — and WashU is near the center of the nation’s agrichemical industry. “The U.S. is particularly strong in agriculture,” Yuan said. “We can provide the feedstock for bioplastic production at a lower price compared to other parts of the world.”
The “feedstock” Yuan is referring to are chemicals such as lactic acid, acetate or fatty acids like oleate, products of corn or starch fermentation by microbes that serve as bioplastic factories. Pseudomonas putida, for instance is a microbial strain widely used in the fermentation industry, including to produce a variety of polyhydroxyalkanoates (PHA), as well as PHB.
McKelvey Engineering researchers have designed ways to convert various wastes, including carbon dioxide, lignin and food waste, into bioplastics using strains such as P. putida. With improved bioplastic design, Yuan’s research further fills in that loop, with a version of PHB and PLA that could be produced much more efficiently and degrade safely into the environment. “The United States has a waste problem, and circular reuse could go a long way to turning that waste into useful materials,” Yuan said. “If we can ramp up our bioplastic supply chain, it would create jobs and new markets,” he said.
Source: PlasticStar: Material Science News – plasticstar.io
DAAugust
14th World Congress on Biopolymers and Biomaterials
Date: August 18-19, 2025
Location: Valencia, Spain
Website: biopolymerscongress.conferenceseries.com
Bioplastics
Date: August 26-27, 2025
Location: Cleveland, Ohio, United States of America
Website: ami-events.com/event/5e7218cb-45fb-4e84-bb428c3ca9fbcf6c/summary?RefId=Website_AMI
September
Polymers in Hydrogen and CCUS Infrastructure
Date: September 10-11, 2025
Location: Düsseldorf, Germany
Website: ami-events.com/event/024afd7e-7a6a-40b7-b4a893a6eb9b92f2/summary?RefId=Website_AMI
39th International Conference on Solution Chemistry - ICSC 2025
Date: September 14-17, 2025
Location: Monastir, Tunisia Website: sctunisie.org/icsc2025
International Conference on Macromolecular and Supramolecular Chemistry - ICMSC 2025
Date: September 18-19, 2025
Location: Zurich, Switzerland
Website: waset.org/macromolecular-and-supramolecularchemistry-conference-in-september-2025-in-zurich
Americas Regional Meeting of the Polymer Processing Society
Date: September 23-25, 2025
Location: Guelph, Ontario, Canada
Website: pps2025.ca
International Conference on Materials Science & Engineering
Date: September 25-26, 2025
Location: Dubai, United Arab Emirates
Website: materials-science.nexovoconferences.com
XXIII B-MRS Meeting
Date: September 28 – October 2, 2025
Location: Salvador, Bahia, Brazil
Website: sbpmat.org.br/23encontro/ October
2nd Global Research Conference On Polymer Science and Composite Materials - GRCPOLYMER2025
Date: October 2-4, 2025
ALocation: Frankfurt, Germany
Website: fosterresearch.org/2025/polymerscience
Plastics Summit - Global Event 2025
Date: October 6, 2025
Location: Lisbon, Germany
Website: plasticssummit-globalevent.com
18th Brazilian Polymer Conference (CBPol)
Date: October 19-23, 2025
Location: Campos do Jordão, São Paulo, Brazil
Website: cbpol.com.br/?lang=en_US
96th Annual Meeting of the Society of Rheology
Date: October 19-23, 2025
Location: Santa Fe, New Mexico, United States of America
Website: rheology.org/sor/Annual_Meeting/Default.aspx
8th Global Summit on Polymer Chemistry
Date: October 20-21, 2025
Location: Paris, France
Website: polymerchemistry.annualcongress.com
XVII Argentine Symposium on Polymers - SAP 2025
Date: October 22-24, 2025
Location: Salta Capital, Argentina
Website: sap2025.ing.unsa.edu.ar/en/
World Summit and Expo on Polymers and Composite Materials (WSEPCM-2025)
Date: October 28-30, 2025
Location: Kyoto, Japan
Website: polymerssummit.org/
Polymers for Fuel Cells, Energy Storage, and Conversion
Date: November 2-5, 2025
Location: Safety Harbor, Florida, United States of America Website: aiche.org/conferences/aiche-annual-meeting/2025 2025 AIChE Annual Meeting
Date: November 2-6, 2025
Location: Boston, Massachusetts, United States of America Website: polyacs.org/2025fuelcells/ 6th World Expo on Biopolymers and Bioplastics
Date: November 6-7, 2025
Location: Dubai, United Arab Emirates Website: biopolymers.materialsconferences.com
Performance Polyamides North America
Date: November 11, 2025
Location: Cleveland, Ohio, United States of America Website: ami-events.com/event/49708194-0018-4fa3-a5d113d7565968ad/summary?RefId=Website_AMI
Recy-Plastech 2025
Date: November 13, 2025
Location: São Paulo, Brazil Website: en.recy-plastech.com Bioplastex 2025
Date: November 21-22, 2025
Location: Bangalore, India Website: bioplastex.com
International Conference on Polymer Science and Composite Materials
Date: November 24-25, 2025
Location: Prague, Czechia Website: polymerscienceconference.org/index.php
Fire Resistance in Plastics
Date: December 1-3, 2025
Location: Düsseldorf, Germany Website: ami-events.com/event/5e2d20bb-0531-4947-9d805c827694a2cf/home?RefId=website
European Bioplastics Conference
Date: December 2-3, 2025
Location: Berlin, Germany (hybrid) Website: european-bioplastics.org/events/ebc
Polymer Engineering for Energy
Date: December 2-3, 2025
Location: London, United Kingdom
Website: ami-events.com/event/d1969227-3d81-4adf-90332bdb782f9d71/summary?RefId=Website_AMI
Polyolefin Additives
Date: December 2-3, 2025
Location: Cologne, Germany Website: ami-events.com/event/c4f01ff1-939e-4a06-aaac80dc63435792/summary?RefId=Website_AMI 2026
May
41st International Conference of the Polymer Processing Society (PPS-41)
Date: May 31-June 4, 2026
Location: Salerno, Italy Website: pps-41.org
October
XIX Latin American Symposium on Polymers and XVII IberoAmerican Congress on Polymers - SLAP 2026
Date: October 19-23, 2026
Location: Salvador, Bahia, Brazil Website: slap2026.com.br

Kharis Yohan Abidin1,2* , Abdullah1 , Yeyen Nurhamiyah2* , Dewi Nandyawati3 , Hadiyanto1 and Istadi1
1Department of Chemical Engineering, Diponegoro University, Semarang, Indonesia
2Research Center of Biomass and Bioproduct, National Research and Innovation Agency – BRIN, Cibinong, Indonesia
3Research Center of Agroindustry, National Research and Innovation Agency – BRIN, Cibinong, Indonesia *khar001@brin.go.id; yeye01@brin.go.id
Rbstract
Since the 1940s, the rise in plastic manufacturing has led to increasing plastic waste and environmental damage, driving the need for biodegradable plastics like polyhydroxybutyrate (PHB). PHB is sustainably produced through microbial fermentation using agricultural and industrial waste and is applied in packaging, agriculture, biomedicine, and 3D printing due to its biodegradability and biocompatibility. Advances from 1990 to 2023 include optimized genetic engineering in bacterial strains like Cupriavidus necator, low-cost feedstocks such as molasses, and scalable bioreactor designs for efficient large-scale production. Mixed microbial cultures in wastewater treatment plants exemplify innovations that combine PHB production with pollution mitigation. A bibliometric analysis of Science Direct highlights China’s leading role in PHB research, evidenced by the highest publication and citation rates. This study enhances the literature by revealing significant trends and advancements in PHB development.
Keywords: biodegradable, plastics, polyhydroxybutyrate, bibliometric.
Data Rvailability: Research data is available upon request from the corresponding author.
How to cite: Abidin, K. Y., Abdullah, Nurhamiyah, Y., Nandyawati, D., Hadiyanto, & Istadi. (2025). Development of Polyhydroxybutyrate (PHB) production articles: a bibliometric analysis (1990-2023). Polímeros: Ciência e Tecnologia, 35(2), e20250020. https://doi.org/10.1590/0104-1428.20240101
1. Introduction
In today’s globalized world, humans will never be separated from plastic. Plastic consumption is increasing every year. The increase in plastic manufacturing since the 1940s illustrates a notable surge in plastic waste, culminating in a staggering global total of 230 million tonnes by 2009—accounting for approximately 8% of the world’s oil production. Across the globe, plastic has emerged as an integral component of everyday life for humanity. Every item humans need is inseparable from plastic polymers, whether for food, electronics, vehicles, buildings, or others. Plastic pollution has become a severe problem in society, with plastic produced between 2004 and 2018 equivalent to plastic production in the previous half-century. Most of this plastic will end up in landfills and also directly discharged into the environment. As the plastics currently consumed are mainly derived from petroleum, the plastics industry cannot avoid issues related to fossil fuel depletion and climate change[1]. In addition, plastics derived from fossil fuels have characteristics that are difficult to decompose in nature or the environment. The ability of fossil fuel plastics to decompose in nature is tens to hundreds of years; the decomposition of fossil fuel plastics will not disappear entirely but become microplastics and nanoplastics. Recent projections indicate that approximately 8 million tonnes of
plastic are introduced into the oceans annually from coastal nations, with forecasts predicting that this figure could potentially double by the year 2050[2]. The accumulation of plastic waste poses numerous environmental issues and challenges, primarily as much of this waste ends up in landfills and natural surroundings. In recent years, a significant body of research has highlighted the prevalence of microplastics (MP) across diverse ecosystems, particularly focusing on aquatic environments such as oceans, rivers, estuaries, lakes, and even the pristine waters of the Arctic and its estuarine areas[3-5]
In light of the profound long-term environmental consequences associated with the utilization of fossil fuelbased plastics, there is a growing demand for and production of biodegradable plastics. These eco-friendly alternatives are anticipated to find applications across multiple sectors, including agriculture, pharmaceuticals, cosmetics, and the food industry[6]. In the last few decades, there has been much research in the development of new materials to deal with the environmental problems presented by fossil-based plastics, including the development of starch-based biodegradable plastics for the food and beverage packaging sector, but due to their properties that are still far from fossil-based plastics, the development of starch-based biodegradable
Abidin, K. Y., Abdullah, Nurhamiyah, Y., Nandyawati, D., Hadiyanto, & Istadi
plastics is not very significant. Because of this, many new biodegradable plastic material developments have been presented by researchers around the world, including the development of Poly Lactic Acid (PLA), and the most recent and widely developed in the last ten years include polyhydroxyalkanoate (PHA) and polyhydroxybutyrate (PHB). In the global world, polyhydroxyalkanoate (PHA) production in 2018 was 29,000 tonnes and increased in 2023 to about 37,000 tonnes[7]. Hydroxybutyrate (PHB), just like PHA biopolymers, can be obtained from microbial fermentation. Based on a compound annual growth rate (CAGR) of 11.2% and a prediction of the PHB market in 2024 of $98 million[8]. While the advancement of innovative biodegradable plastic materials, including PLA, PHA, and PHB, is substantial, substantial backing from governments, corporations, and individuals globally is essential to foster the production of high-quality, cost-effective biodegradable plastics. This support is crucial for replacing fossil fuelbased plastics, ultimately mitigating both immediate and long-term environmental issues associated with their use. In this regard, scientific research and bibliometric analyses can offer critical insights to inform more effective policies aimed at promoting the development of biodegradable plastics as alternatives to these environmentally detrimental fossil-based options.
Several researchers have conducted bibliometric studies on plastic pollution and specific plastic waste treatment strategies, such as thermochemical conversion, recycling through pyrolysis, and biodegradation[9-14]. However, to the authors’ knowledge, no bibliometric study has systematically analyzed the development of biodegradable polyhydroxybutyrate (PHB) plastics. This highlights the need for a comprehensive bibliometric study to explore the research trends, gaps, and global progress in developing PHB biodegradable materials.
This study aims to focus on the development and production of polyhydroxybutyrate (PHB) biodegradable plastics by providing insights into their scientific evolution. A thorough bibliometric review was conducted using the ScienceDirect database from 1990–2023, employing quantitative methods for performance analysis and scientific mapping. The analysis includes key aspects such as research trends, author contributions, institutional and national outputs, as well as citation patterns. The study leverages the VOSviewer application to visualize and evaluate collaborative networks, knowledge clusters, and thematic developments in PHB research.
By emphasizing the scientific and technological advancements in the production of PHB materials, this research aspires to provide a roadmap for future studies and foster informed, collaborative efforts in enhancing the quality and sustainability of biodegradable plastic production. The findings are expected to guide stakeholders in academia, industry, and policymaking toward innovative solutions for global plastic pollution.
Bibliometric analysis is a quantitative study of an article or topic about a bibliographic survey that provides
an overview of a particular field of research, which can be classified by research article, author, and journal[15]. In this study, the authors relied on the database from Science Direct to collect publication articles related to the development of polyhydroxybutyrate (PHB) plastic biodegradable materials. Science Direct is an open-access digital platform that provides access to publications from Elsevier, one of the world’s leading acadelic publishers of scientific content[16]. The author started this research on 12 March 2024, where this article focuses on international journals related to the development of PHB plastic biodegradable materials in the period 1990 to 2023. The keywords that the author used in searching for articles for this bibliometric study were “Production” and “Polyhydroxybutyrate” to show the development of new biodegradable plastic polyhydroxybutyrate PHB in the world from 1990 to 2023. The author found many articles from Science Direct about developing production of polyhydroxybutyrate as a new material to replace fossil-based plastics, which were then analyzed using the VOS Viewer application. To export article metadata from ScienceDirect, use the Export or Download Citations options and select formats such as Txt. or BibTeX for bibliometric purposes. The exported data can be directly used in tools like VOSviewer without manual conversion. If a .txt format is required, the file can be opened in a text editor and saved with a .txt extension. This process facilitates bibliographic data analysis to support research visualization and mapping[17] The matrix used by the author in creating this bibliometric article is the author of the article, the affiliation of the article publisher, the country of the article publisher, the impact of the journal that published the article, and the year of writing the article. The master data from Science Direct covers several disciplines, including science, engineering, social sciences, and humanities. Based on the source with the keyword “polyhydroxybutyrate production” in Science Direct, 4,577 scientific articles were obtained.
Bibliometric analysis, in general, is widely used to obtain comprehensive data or knowledge about a researcher and its structure, themes, topics, and terminology[18]. The mapping method used in bibliometric articles is the VOSviewer application[19-22] for mapping and data analysis carried out by the author using the VOSviewer version 1.6.15 application after the data from Science Direct is downloaded. VOS viewer helps build and visualize bibliometric and network articles, citations, co-authorship, and publication databases[23] VOSviewer, a widely used software for visualizing bibliometric networks, can be freely downloaded from its official website VOSviewer. The website provides different versions of the software to accommodate various operating systems, including Windows, macOS, and Linux[24]. This bibliometric technique will identify emerging topics, research limitations, and core journals in the research field to produce comprehensive and well-structured data. The bibliometric results of biodegradable production polyhydroxybutyrate (PHB) plastic development articles are increasing from year to year, which reflects the concern about the environmental threat of fossil-based plastics so the need for the development of new materials as a substitute for fossil-based plastics.
VOSviewer is widely used to visualize and explore bibliometric networks, such as relationships between authors, keywords, or citations. A key step in this analysis involves
Development of Polyhydroxybutyrate (PHB) production articles: a bibliometric analysis (1990-2023)
importing data from text files (.txt) extracted from scientific databases like ScienceDirect. These text files typically contain bibliographic information in a format compatible with VOSviewer, including metadata such as author names, article titles, affiliations, keywords, and inter-entity relationships. The text file is uploaded into VOSviewer using the API and DOI columns, allowing seamless integration of the .txt format. The software processes this data to generate a relational matrix, such as co-occurrence or co-citation networks, which are then visualized as maps or network diagrams to provide meaningful insights[25]. For this study, comprehensive analyses were conducted using co-authorship, co-occurrence, citation, and bibliographic coupling techniques. Units of analysis included authors, organizations, countries, sources, and documents, enabling a detailed exploration of bibliometric patterns within VOSviewer”.
3.1 Data source
Data sources from science-direct data-based bibliometric data related to developing polyhydroxybutyrate (PHB) plastic degradable materials from 1990 to 2023 are shown in Table 1. ScienceDirect was selected for this bibliometric analysis due to its reputation as a leading database providing high-quality scientific articles across disciplines, particularly in biochemistry, materials science, chemical engineering, and environmental science. Its reliable data consistency and well-organized metadata enable efficient filtering by document type, field, or keywords, ensuring[26]. A total of 4,577 articles with the keyword “polyhydroxybutyrate production” originated from 1990 to 2023. Four thousand five hundred seventy-seven articles cover a variety of document types, including research papers of 2,074 articles, followed by 1,055 review articles, 112 encyclopedia articles, 863 book chapters, and 61 conference abstract articles. Based on the publication title, 346 articles were related to biosource technology, followed by 191 articles from the International Journal of Biological Macromolecules, 96 articles related to the science of total environment, 84 articles titled Water research, and 82 articles titled Biotechnology. In addition, the subject of the article is displayed on Science Direct, where biochemistry, genetics, and molecular biology have 1,234 articles, followed by material science with 947 articles, chemical engineering with 1,101 articles, environmental science with 807 articles, and immunology and microbiology by 648 articles and in the last five years interval with environmental issues caused by fossil-based plastics in nature resulted in an increasing number of publications of articles related to biodegradable polyhydroxy butyrate (PHB) plastic materials as shown by 1,143 research articles produced over the last five years, followed by 781 review articles, and 547 book chapters. The documents produced over the last five years illustrate the wide-ranging scientific inquiry within the realm of polyhydroxybutyrate (PHB) biodegradable plastics. They also reflect the various methodologies and viewpoints presented by researchers and experts in this domain, which play a crucial role in the development of novel eco-friendly plastic materials intended to replace fossil fuel-derived plastics.
Table 1. Information from Science Direct about development articles of polyhydroxybutyrate interval 1990-2023.
From year to year, research related to the development of polyhydroxybutyrate plastic biodegradable materials continues to increase from 1990 to 2023 in Science Direct, where the peak occurred in the last five years, as shown in Figure 1. Where the development of articles related to the production of polyhydroxybutyrate (PHB) has increased since 2018 reaching 256 articles, 2019 reached 312 articles, 2020 reached 339 articles, 2021 reached 537 articles, 2022 reached the highest at 622 articles, and 2023 reached 578 articles. There was a decline in publications in 2023 compared to 2022 regarding polyhydroxybutyrate (PHB) production. Several factors contributed to this decrease. Technical challenges such as high production costs, low yields, complex technologies, and difficulties in downstream processing have hindered progress in PHB research. Additionally, a shift in research focus to more promising or industry-relevant areas has reduced interest in PHB production. Funding limitations for bioplastics research also constrained the number of studies published. Lastly, the lingering effects of the COVID-19 pandemic up to 2022 likely disrupted research and publication activities, collectively explaining the decline in PHB-related
Abidin, K. Y., Abdullah, Nurhamiyah, Y., Nandyawati, D., Hadiyanto, & Istadi

publications in 2023[27]. According to research conducted by Yeo et al.[28], the contributions of researchers, biologists, and engineers in advancing polyhydroxybutyrate (PHB) are crucial for enhancing its industrial acceptance and popularity. Key emerging areas associated with PHB development encompass the establishment of cost-efficient fermentation methods aimed at reducing production expenses, thereby rendering PHBs more economically viable than conventional petroleum-based plastics. Additionally, there is a focus on designing recycling and reuse strategies for all PHB products prior to commercialization, conducting comprehensive life cycle assessments of these materials, and improving the overall mechanical and thermal properties of PHBs[29]
Based on articles related to the production of Polyhydroxybutyrate (PHB), the most published subject areas are biochemistry, genetics, and molecular biology with 1,234 articles, followed by material science with 1,101 articles, chemical engineering with 947 articles, environmental science with 807 articles, immunology and microbiology with 648 articles, chemistry with 436 articles, energy with 400 articles, engineering with 256 articles, and earth and planetary science with 127 articles. These subject areas are shown in Figure 2.
This study aims to deliver a bibliographic overview, with the insights gleaned from this article poised to stimulate increased research into polyhydroxybutyrate (PHB) biodegradable plastics as a gradual substitute for fossil fuel-derived plastics, ultimately helping to mitigate the environmental impacts associated with them. The evolution of keywords and research trends can serve as a valuable reference for scholars seeking to explore new topics and avenues within related fields, thereby enhancing stakeholder investment and fostering policy support[30]. Feedback and suggestions on this article have a good purpose in limiting future innovations in polyhydroxybutyrate (PHB), which is cheap and has characteristics equivalent to fossil-based plastics. The ultimate goal of PHB research is for PHB to
become a competitive composite to replace petroleum-based polymers[28,29]
The analysis results in Figure 3 show that ten relevant journals published on polyhydroxybutyrate (PHB) production development in the period 1990-2023. The VOSviewer map provides a detailed visualization of research clusters based on bibliometric data, categorized by distinct colors. The red cluster focuses on applied biotechnology topics such as bioplastic production, polymer degradation, and engineering, as indicated by key nodes like Elsevier Ebooks. The green cluster represents metabolic and synthetic biotechnology, with journals like Metabolic Engineering and Current Opinion in Biotechnology highlighting advancements in biological process optimization. The light blue cluster relates to environmental management, including waste management and pollution studies, evident in journals such as Waste Management and Environmental Pollution. The dark blue cluster emphasizes aquatic systems, particularly aquaculture and algal research, as seen in Algal Research The yellow cluster highlights renewable energy and green biotechnology, addressing topics like sustainable fuel production. The light green cluster is dedicated to soil biology and biochemistry, represented by Soil Biology & Biochemistry. The brown cluster focuses on plant physiology and agricultural biotechnology, while the pink cluster delves into microbiology and molecular engineering, illustrated by FEBS Letters[31]. Where Elsevier book contributed the most, namely (401) documents published related to PHB, followed by Biosource Technology (271) documents, International Journal of biological molecular (133) (documents, journal of Biotechnology (79) documents, Current Opinion in biotechnology (77) documents, water research (52) documents, metabolic engineering (48) documents, new biotechnology (42) documents, science of total environment (40) documents, and international journal of hydrogen (40). To generate such a map using VOSviewer, bibliographic data is prepared from Science Direct databases in formats Txt. The analysis type is selected co-authorship and co-
Development of Polyhydroxybutyrate (PHB) production articles: a bibliometric analysis (1990-2023)

Subject area publication articles polyhydroxybutyrate from 1992-2023.

3. (a) Published Journal Matrix of production PHB interval 1990-2023; (b) top 10 published journal of production PHB interval 1990-2023.
Polímeros, 35(2), e20250020, 2025
Abidin, K. Y., Abdullah, Nurhamiyah, Y., Nandyawati, D., Hadiyanto, & Istadi
occurrence of keywords, followed by setting thresholds for publication or keyword frequency. Clustering is refined by adjusting resolution and minimum cluster size, and node sizes are determined based on frequency or link strength. The resulting visualization highlights research interconnections and trends, providing valuable insights for bibliometric analysis in the scientific domain[32]. This data reflects that the development of innovation or research on the production of polyhydroxybutyrate (PHB) plastic biodegradable materials is still very much in demand by experts and researchers, as seen from the number of documents published in the Scopus reputable journal, which is relatively high. In conducting bibliometric analysis, a detailed description is needed related to which journals publish these topics and the scope of the journals that publish them[33].
Table 2 shows the number of citations in journals that discuss the topic of Polyhydroxybutyrate (PHB) in the period 1990-2023. The number of citations generated shows enthusiasm for the topic of polyhydroxybutyrate research, shown by the top 10 journals with the most citations in science directly related to this topic, where the highest is in the journal bioresource technology with 18,490 citations, followed by progress in polymer science with 9,244 citations, international journal of biological molecular with 5,629 citations, current opinion in biotechnology with 4,460 citations, journal of biotechnology with 4,423 citations, biotechnology advances with 4,317 citations, biomaterials with 4,226 citations, water research with 4,192 citations, trends in food science and technology with 3,744 citations, and metabolic engineering with 3,321 citations. The increasing citations also indicate the importance and development of innovation related to polyhydroxybutyrate (PHB) research today, and many research topics are being developed related to polyhydroxybutyrate (PHB) research. Bioresource Technology is one of the journals with the most articles and citations related to PHB production, where several articles focus on genetic engineering with examples of “Cost-effective production of bioplastic polyhydroxybutyrate via introducing heterogeneous constitutive promoter and elevating acetyl-Coenzyme A pool of rapidly growing cyanobacteria”[34] and “Utilizing microalgal hydrolysate from dairy wastewater-grown Chlorella sorokiniana SU-1 as a sustainable feedstock for polyhydroxybutyrate and β-carotene production by engineered Rhodotorula glutinis #100-29”[35]. In addition, some articles that are widely
Table 2. Amount of Citation on Journals with PHB Topic Interval 1990-2023. Journals
discussed in bioresource technology are on media optimization, such as “Impact of added nutrients in tequila vinasse on the production of hydrogen and polyhydroxybutyrate through photofermentation utilizing Rhodopseudomonas pseudopalustris”[36] and “A closed-loop biorefinery strategy for the production of polyhydroxybutyrate (PHB) utilizes sugars extracted from carob pods as the exclusive raw material, while also implementing downstream processing that incorporates lignin, a co-product of the process”[37]. The data in Table 2 were obtained through bibliometric analysis using the ScienceDirect database, covering publications from 1990 to 2023. The clustering and visualization were done using VOSviewer software, which allows the identification of relationships between publications and the number of citations they receive. The collection process uses citation analysis and extracted while still a table before finishing with a diagram image of the relationship between citations[38].
Figure 4 illustrates the network of authors, affiliations, and publishing countries of articles related to polyhydroxybutyrate (PHB). This data includes the name of the author or authors, the affiliation of the article, and the country that published it. The data in Figure 4 were obtained through bibliometric analysis using VOSviewer software. Data was initially collected from the ScienceDirect database by keyword search of ‘Polyhydroxybutyrate Production’ and metadata analysis of publications, using author criteria to see the relationship and data matrix between authors in this study. Based on the polyhydroxy butyrate (PHB) analysis matrix based on authors or authors of articles, the five authors who most often write articles with the theme of PHB production are Guoqiang Chen with (29) articles, followed by Shashi Kant Bhatia (22) articles, maria a.m. reis with (20) articles, yung hun yang with (19) articles, and ranjna sirohi with (16) articles. Guoqiang Chen, over the past five years, has published three articles related to PHB. In addition, some prominent names, such as Guoqiang Chen, Armando J. Domb, and Saeed Karbaschi, are at the center of the large cluster, indicating that they are central figures in the research on this topic. In 2019, he wrote an Encyclopedia related to polyhydroxyalkanoates/polyhydroxy butyrate, and in 2020, he wrote about “Rewiring Carbon Flux in Escherichia coli Using a Bifunctional Molecular Switch”. In 2022, he also wrote about “Engineering Halomonas bluephagenesis via Small Regulatory RNAs”[39,40]. Guo-Qiang Chen is one of the consistent authors, and he must have published articles related to PHB every year from 2000 to 2022. His articles on PHB are mostly research articles related to genetic engineering to produce polyhydroxybutyrate (PHB). Furthermore, analysis based on the affiliation of the organization publishing polyhydroxybutyrate (PHB) particles is shown in Table 3. Where the most affiliation is from Tsinghua University with (47) PHB-related article documents, followed by the Chinese Academy of Science (40) documents; French National Center for Scientific with (33) documents; Delf University of Technology with (32) documents; Universidade Nova de Lisboa with (26) documents, Konkuk University with (25) documents, Technical University of Denmark with (24) documents, University of Queensland with (22) documents, Redede
Development of Polyhydroxybutyrate (PHB) production articles: a bibliometric analysis (1990-2023)

Luc Averous with 2607 citations, and Van Loosdrecht with 2500 citations. The citation data on the author shows that Quangqiang Chen also produces the most publications and the most citations, which shows that the quality of research and articles related to polyhydroxybutyrate (PHB) published by Quoqiang Chen is of high quality so that many other researchers refer to Quoqiang Chen’s research. Although the number of articles is slight, many citations indicate the excellent quality of the article, whereas if there are many articles by an author but few citations, it can be said that the quality of the article is not good or the topic is not attractive.
quimica e technology with (21) documents, and Academy of Scientific and Innovation with (20) documents. This shows that both universities and research institutes around the world in Asia (China and Korea), Europe (Netherlands, Portugal, France, Denmark), and Australia are very interested in research and development related to polyhydroxybutyrate (PHB) biodegradable plastic materials.
The data in Figure 5 was obtained through bibliometric analysis using VOSviewer software. The process began with collecting bibliographic data from the ScienceDirect database using the keyword ‘Polyhydroxybutyrate’ for the period 1990-2023. Metadata was extracted using the ‘citation’ and ‘authors’ criteria in the VOSViewer application. data analysis based on the highest number of citations to 20 authors of polyhydroxybutyrate (PHB) articles in the interval period 1990 to 2023 showed that the author from China, Quoqiang Chen, got the most citations with 2698 citations, followed by
Based on Figure 6, it is found that Tsinghua University holds the top 3 most affiliations from China with 47 articles related to the development and research of PHB. The Chinese Academy of Science follows this with 40 articles, and the French National Scientific with 33 articles related to PHB from 1990 to 2023. In line with the number of articles, Tsinghua University is also an affiliate of PHB production research and development articles with the most citations, namely 3,275 citations, followed by the Delf University of Technology with 3,111 citations, and the National Institute for Interdisciplinary Science and Technology with 2,573 citations. This shows that Tsinghua University is not only productive in PHB research and development articles, but its articles are also of good quality, with the most citations from 1990 to 2023. Some articles from Tsinghua University include “controlling cell volume for Efficient PHB Production by Halomonnas”, “polyhydroxyalkanoate/polyhydroxy butyrate” and “Unsterile and Continous Production of Polyhydroxybutyrate by Halomonas TD01”[29,41,42]
Furthermore, related to the analysis of countries that published polyhydroxy butyrate (PHB) articles, where there


are top 10 countries that published the most articles related to this, according to Figure 5. and the most are China with (350) articles, followed by the USA with (335) articles, India with (316) articles, UK with (144) articles, South Korea with (140) articles, Germany with (118) articles, Spain with (113) articles, Italy with (101) articles, Japan with (92) articles. This data shows that the understanding of PHB research is widespread worldwide, starting from mainland Europe, America, and Asia. All countries in the top 10 most published countries are developed countries with very high technological development of new materials or biomaterials. This indicates that the state, through its government, supports research related to new materials, both polyhydroxybutyrate (PHB) and other materials. Based on data analysis using the VOSviewer application, the database from Science Direct shows and reveals that China, USA, and India are three countries that are concerned about research on polyhydroxybutyrate (PHB) biodegradable plastic materials, shown by clustering in VOSviewer. The three countries dominate in terms of publication documents and citations, indicating that research related to PHB is more focused in these countries. This trend reflects their
Abidin, K. Y., Abdullah, Nurhamiyah, Y., Nandyawati, D., Hadiyanto, & Istadi Polímeros, 35(2), e20250020, 2025
Development of Polyhydroxybutyrate (PHB) production articles: a bibliometric analysis (1990-2023)
significant investment in the development of biodegradable materials, with India, China, and the USA leading the way in both the volume of research conducted and the international recognition of their findings. The clustering also highlights the prominent role these nations play in advancing the science and application of PHB, particularly in industries such as packaging, medicine, and environmental sustainability[43] For example, in 2023, the articles published by China on PHB reached 132 articles and the highest number of citations, namely 785 citations; in second place was India with 102 articles, and the number of citations reached 598. This is in line with data from VOSviewer, which indicates that these two countries are very focused on research related to this PHB. For example, some articles published by these two countries are “Concurrent generation of polyhydroxybutyrate and biogas from paper mill sludge utilizing a sodium citratemediated disperser to facilitate phase separation during pretreatment” written by Preethi et al.[44] with the country
of affiliation is India. In addition, Preethi also wrote another article in 2023 titled “Augmentation in polyhydroxybutyrate and biogas production from waste activated sludge via mild sonication-assisted thermo-Fenton disintegration”[45]. For China there are many articles related to process engineering and microorganisms in PHB research, where there are using N, N-dimethylamide/LiCl solvent in the PHB extraction system and obtained high PHB purity results, that there is also research related to PHB characteristics using a rare isolate, namely Actinomycetes Aquabacterium sp A7-Y[46,47]. In Figure 7a, the color intensity indicates the number of publications for each country over the period 1990-2023. Light yellow indicates countries with fewer publications (5 documents), while dark purple indicates countries with the highest number of publications (up to 352 documents). In this case, China appears dominant with dark purple (350 articles), followed by the United States (335 articles) and India (316 articles).

Abidin, K. Y., Abdullah, Nurhamiyah, Y., Nandyawati, D., Hadiyanto, & Istadi
Meanwhile, in Figure 7b, the visualization matrix uses the size and brightness of the nodes to show the number of publications and the level of connectivity between countries. Larger and brighter nodes, such as those of China, the United States, and India, indicate their leading role in PHB research both in terms of the number of publications and influence in the global collaboration network. The lines between countries show the collaboration that occurs in research, with the United States appearing to have greater connectivity than China and India[48].
Based on Figure 8, data analysis of countries producing polyhydroxy butyrate (PHB) articles, it shows that the USA, China, India, and the UK are the top 4 countries with the most citations for PHB articles where these four countries show support regulations from the government, researchers, academics who support regulations for the creation of new materials, especially in the field of biodegradable plastics (PHB) so that the amount and quality of research produced from these four countries is very high quality and the number of documents indicates that research innovation in these four countries is significantly developed.
During the 1990s to early 2000s, the main focus of research on polyhydroxyalkanoate (PHB) production was on identifying microorganisms that could efficiently produce PHBs through fermentation. Research during this period highlighted microbes such as Ralstonia eutropha and Cupriavidus necator, which are capable of producing PHBs from diverse carbon sources, including agricultural waste and simple feedstocks such as glucose[49]. The main merit of this research is the increased in-depth understanding of biotechnology and PHB-producing microorganisms, which paves the way for more efficient production processes. However, although significant progress was made in terms of understanding microorganisms, a major obstacle during this time was the still very high production cost, which
hindered the widespread commercialization of PHBs as biotechnology-based products[50]
Entering the 2010s, the research focus turned to the use of renewable and cheaper feedstocks, such as lignocellulosic waste, vegetable oils, and other biomass, to lower the production cost of PHBs. In addition, advances in genetic engineering technology opened up new opportunities with the genetic modification of microorganisms to increase PHB production yields[51]. The advantages of this approach are the significant reduction in production costs thanks to the use of cheap feedstocks as well as the potential for higher yield increases through genetic engineering. However, the challenges lie in the complexity of genetic engineering techniques that require time and large investments to achieve optimal results, as well as strict regulatory constraints regarding the use of genetically modified organisms on an industrial scale[52]. In this decade, steps towards reducing production costs have begun to show great potential in the commercial application of PHBs, although the road to widespread implementation still requires overcoming several technical and economic barriers[53]
The author would like to shed light on future polyhydroxybutyrate (PHB) developments in this subchapter. These trends are analyzed based on the keywords of the principal authors in the research period 1990 to 2023. These keywords were used in titles, abstracts, and publication keywords. The keywords represent how popular and desirable the field is for research[54,55]. The most influential keywords on the development of polyhydroxybutyrate (PHB) production are shown in Figure 9
From the Word Cloud data, it is obtained that the word with the highest frequency appearing in the keyword is “Engineering,” meaning that researchers are researching

Development of Polyhydroxybutyrate (PHB) production articles: a bibliometric analysis (1990-2023)

the development of PHB production in terms of engineering or process engineering. In addition, the keywords that often appear are “Science,” “Environmental,” “Biology,” “Carbon,” and “Acid”. This means that the development of PHB production is related to engineering carbon sources that influence the environment.
Figure 10 illustrates the keywords over time, and the researchers developed these keywords into 6 clusters. Cluster 1 is colored Green, where this cluster of keywords revolves around biological systems related to microorganism genes, metabolic engineering, and microorganism metabolism. This shows that the development of this green cluster is more towards genetic engineering of microorganisms as an example in the research of Meng et al. in 2022, wherein the production of PHB, the cloning of propylene in-house L72T was expressed into Escherichia coli[56]. In addition, there is also an increase in PHB production by distributing metabolic flux in recombinant Escherichia coli[57] .
Cluster 2 is in blue, where this cluster has repeated keywords in engineering, bioplastics, biotechnology, and production economics. In this cluster, the most visible relationship is the relationship to increase production efficiency by biotechnology to increase production yields and reduce production costs. This is shown in several articles in the last five years that show how to reduce PHB production costs. One illustration involves the utilization of crude glycerol for polyhydroxybutyrate (PHB) synthesis through the genetic modification of Rhodotorula glutinis. In this context, glycerol, which is a by-product of sugar manufacturing, serves as a substrate for the production of PHB[58]. Additionally, there is research on polyhydroxybutyrate (PHB) production utilizing molasses and tap water without the need for sterilization, employing Priestia sp. YH4. This study highlights the use of inexpensive carbon sources to lower production expenses, emphasizing that omitting sterilization further contributes to cost reduction[59]
Cluster 3 is red, repeating keywords polymer chemistry, Polymer Science, Polylactic Acid, strength, and Crystalline. In cluster 3, the relationship that is very visible from the
repeated keywords of the authors is related to the characteristics of PHB biopolymers formed by many words such as thermoplastic, biocomposite, crystallinity, and mechanical properties. Based on research from Sookswat et al. 2023. This research is based on PHB production by utilizing glycerol to determine the thermal properties of PHB films. This study shows the development of PHB production technology based on physical and chemical properties, and it shows that PHB is resistant to heat 90-175 °C[60]
Cluster 4 is yellow, with keywords most related to chemical reactions; in this cluster, the keywords that often appear are chemical and fermentation reactions. Where there are words bioreactor, COD, Chemistry, hydrogen, and nitrogen, based on these keywords, the cluster has a relationship between keywords related to the parameters of the PHB production process. An example is a study related to the impact of carbon-to-nitrogen ratio and pH on the microbial prevalence and microbial polyhydroxybutyrate production levels using a mixed microbial starter culture in 2022, where this study discusses growth conditions to optimize PHB production, which is influenced by the ratio of carbon and nitrogen sources and PH[61]. Furthermore, additional research has examined the impact of growth conditions on the molecular weight of Poly-3-hydroxybutyrate synthesized by Azotobacter chroococcum 7B. where this research shows the Effect of pH, aeration, and temperature on the PHB production process[62]
Cluster 5, which is purple, and Cluster 6, which is orange, show keywords that are related to loose or distant, where these keywords are not related to PHB directly, such as cluster 5, there are fructose, sucrose, fermentation, biodiesel, and biofuel. This is probably because the keywords in cluster 5 can also be related to research with other topics, such as biodiesel and biofuels, such as sucrose and fructose, which can be hydrolyzed into biodiesel, bioethanol, and other energy sources. Cluster 6, colored orange, is likely related to data science because the keywords that appear on the World Wide Web are related to data science. Cluster 6 is the most distantly related to PHB production.
Abidin, K. Y., Abdullah, Nurhamiyah, Y., Nandyawati, D., Hadiyanto, & Istadi

From 1990 to 2023, several fields emerged as implications of biodegradable materials research, including polyhydroxybutyrate (PHB) plastics. Based on the data from these keywords, it can be seen that the researchers are pushing for further research related to genetic engineering, increasing PHB extraction, and using waste as a source of PHB culture nutrients to produce PHB with a high yield value and low price so that it will have a competitive value against fossil-based plastics[63]
This study provides in-depth insights into the research trends on polyhydroxybutyrate (PHB) as a biodegradable plastic material that serves as a potential alternative to fossilbased plastics from 1990 to 2023. Using the ScienceDirect database and the VOSviewer application, our analysis reveals that research on PHB has experienced rapid growth since the early 2010s, with a significant surge between 2017 and 2023, reaching 300-600 publications per year. This growing interest highlights the increasing importance of PHB research, which serves as a foundation for policymakers, academics, and industries in developing sustainable regulations and eco-friendly materials.
Our subject area analysis indicates that the fields of biochemistry, genetics, and molecular biology have the highest number of publications, totaling 1,234 articles, including research papers and reviews. Elsevier Book is one of the main publishers in this domain, with 401 publications
over 32 years. However, citation trends show that Biosource Technology holds the highest number of citations, with 18,490 citations over 23 years. Among researchers, Quioqiang Chen stands out as the most prolific author, with 29 publications and the highest number of citations (2,698). Tsinghua University is identified as the leading institution in PHB research, contributing 47 publications and receiving 3,275 citations. Geographically, China has the highest number of publications (350 articles), while the United States ranks first in citations, with 21,324 citations over the same period.
Emerging research trends indicate that the most frequently occurring keywords include “biology,” “engineering,” and “composite materials”. This reflects a growing focus on the biological engineering of microorganisms to enhance PHB production, aiming to develop composite PHB materials with superior properties and higher yields.
Given these findings, PHB research holds great potential for fostering sustainable and environmentally friendly material innovations. To accelerate its development and application, further collaboration between academia, industry, and policymakers is essential.
● Conceptualization – Kharis Yohan Abidin; Abdullah.
● Data curation – Kharis Yohan Abidin.
● Formal analysis – Kharis Yohan Abidin; Yeyen Nurhamiyah; Dewi Nandyawati.
Development of Polyhydroxybutyrate (PHB) production articles: a bibliometric analysis (1990-2023)
● Funding acquisition – Kharis Yohan Abidin.
● Investigation – Yeyen Nurhamiyah; Abdullah.
● Methodology – Hadiyanto; Istadi.
● Project administration – Kharis Yohan Abidin.
● Resources – Kharis Yohan Abidin; Hadiyanto; Istadi.
● Software – Kharis Yohan Abidin; Hadiyanto; Istadi.
● Supervision – Abdullah.
● Validation – Abdullah.
● Visualization – Abdullah.
● Writing – original draft – Kharis Yohan Abidin; Yeyen Nurhamiyah; Dewi Nandyawati.
● Writing – review & editing – Kharis Yohan Abidin; Yeyen Nurhamiyah; Dewi Nandyawati.
The authors would like to thank BRIN (National et al. Agency Republic of Indonesia) and Diponegoro University Semarang for their regulatory and financial support of this project.
8. References
1 Bhatia, S. K., Otari, S. V., Jeon, J.-M., Gurav, R., Choi, Y.K., Bhatia, R. K., Pugazhendhi, A., Kumar, V., Banu, J. R., Yoon, J.-J., Choi, K.-Y., & Yang, Y.-H. (2021). Biowaste to bioplastic (polyhydroxyalkanoates): conversion technologies, strategies, challenges, and perspective. Bioresource Technology, 326, 124733 http://doi.org/10.1016/j.biortech.2021.124733 PMid:33494006.
2 Rinanda, R., Sun, Y., Chang, K., Sulastri, R., Cui, X., Cheng, Z., Yan, B., & Chen, G. (2023). Plastic waste management: a bibliometric analysis (1992-2022). Sustainability, 15(24), 16840 http://doi.org/10.3390/su152416840
3 Bellasi, A., Binda, G., Pozzi, A., Galafassi, S., Volta, P., & Bettinetti, R. (2020). Microplastic contamination in freshwater environments: a review, focusing on interactions with sediments and benthic organisms. Environments, 7(4), 30 http://doi. org/10.3390/environments7040030.
4 Li, C., Busquets, R., & Campos, L. C. (2020). Assessment of microplastics in freshwater systems: a review. The Science of the Total Environment, 707, 135578 http://doi.org/10.1016/j. scitotenv.2019.135578 PMid:31784176.
5 Xu, S., Ma, J., Ji, R., Pan, K., & Miao, A.-J. (2020). Microplastics in aquatic environments: occurrence, accumulation, and biological effects. The Science of the Total Environment, 703, 134699 http://doi.org/10.1016/j.scitotenv.2019.134699 PMid:31726297.
6 Patil, T. D., Ghosh, S., Agarwal, A., Patel, S. K. S., Tripathi, A. D., Mahato, D. K., Kumar, P., Slama, P., Pavlik, A., & Haque, S. (2024). Production, optimization, scale-up, and characterization of polyhydroxyalkanoate copolymers utilizing dairy processing waste. Scientific Reports, 14(1), 1620. http:// doi.org/10.1038/s41598-024-52098-0 PMid:38238404.
7 Cardozo, J. R. G., Bucheli, R. V., Pareja, N. M., Villadiego, O. S. R., Londoño, G. A. C., & Martínez, A. L. M. (2020). Fedbatch production and characterization of polyhydroxybutyrate by Bacillus megaterium LVN01 from residual glycerol. Dyna, 87(214), 111-120 http://doi.org/10.15446/dyna.v87n214.83523
8. Lee, J., Park, H. J., Moon, M., Lee, J.-S., & Min, K. (2021). Recent progress and challenges in microbial polyhydroxybutyrate (PHB) production from CO2 as sustainable feedstock: a state-
of-the-art review. Bioresource Technology, 339, 125616 http:// doi.org/10.1016/j.biortech.2021.125616 PMid:34304096.
9 Kasavan, S., Yusoff, S., Fakri, M. F. R., & Siron, R. (2021). Plastic pollution in water ecosystems: a bibliometric analysis from 2000 to 2020. Journal of Cleaner Production, 313, 127946. http://doi.org/10.1016/j.jclepro.2021.127946
10 Khatun, R., Xiang, H., Yang, Y., Wang, J., & Yildiz, G. (2021). Bibliometric analysis of research trends on the thermochemical conversion of plastics during 1990–2020. Journal of Cleaner Production, 317, 128373 http://doi.org/10.1016/j. jclepro.2021.128373
11 Armenise, S., SyieLuing, W., Ramírez-Velásquez, J. M., Launay, F., Wuebben, D., Ngadi, N., Rams, J., & Muñoz, M. (2021). Plastic waste recycling via pyrolysis: A bibliometric survey and literature review. Journal of Analytical and Applied Pyrolysis, 158(2), 105265 http://doi.org/10.1016/j.jaap.2021.105265
12 Akinpelu, E. A., & Nchu, F. (2022). A bibliometric analysis of research trends in biodegradation of plastics. Polymers, 14(13), 2642 http://doi.org/10.3390/polym14132642 PMid:35808687.
13 Yang, S.-S., Wu, W.-M., Pang, J.-W., He, L., Ding, M.-Q., Li, M.-X., Zhao, Y.-L., Sun, H.-J., Xing, D.-F., Ren, N.-Q., Yang, J., Criddle, C. S., & Ding, J. (2023). Bibliometric analysis of publications on biodegradation of plastics: Explosively emerging research over 70 years. Journal of Cleaner Production, 428, 139423 http://doi.org/10.1016/j.jclepro.2023.139423
14 Nabgan, W., Ikram, M., Alhassan, M., Owgi, A. H. K., Van Tran, T., Parashuram, L., Nordin, A. H., Djellabi, R., Jalil, A. A., Medina, F., & Nordin, M. L. (2023). Bibliometric analysis and an overview of the application of non-precious materials for pyrolysis reaction of plastic waste. Arabian Journal of Chemistry, 16(6), 104717 http://doi.org/10.1016/j. arabjc.2023.104717
15. Japri, N. F., Majid, Z. A., Ghoshal, S. K., Danial, W. H., See, H. H., & Othman, M. Z. (2024). On the versatility of graphene-cellulose composites: An overview and bibliometric assessment. Carbohydrate Polymers, 337(1), 121969 http:// doi.org/10.1016/j.carbpol.2024.121969 PMid:38710542.
16 Buele, I., & Guerra, T. (2021). Bibliometric analysis of scientific production on tax evasion in sciencedirect, years 2010 to 2019. Journal of Legal, Ethical and Regulatory, 24(2), 627 Retrieved in 2024, October 12, from https://www.abacademies. org/articles/bibliometric-analysis-of-scientific-production-ontax-evasion-in-sciencedirect-years-2010-to-2019-10427.html
17 Lim, W. M., Kumar, S., & Donthu, N. (2024). How to combine and clean bibliometric data and use bibliometric tools synergistically: guidelines using metaverse research. Journal of Business Research, 182, 114760 http://doi.org/10.1016/j. jbusres.2024.114760
18 Van Eck, N. J. (2023). Methodological advances in bibliometric mapping and science (Doctoral thesis). Erasmus Universiteit Rotterdam, Rotterdam, The Netherlands
19 Van Eck, N. J., & Waltman, L. (2007). Bibliometric mapping of the computational intelligence field. International Journal of Uncertainty, Fuzziness and Knowledge-based Systems, 15(5), 625-645 http://doi.org/10.1142/S0218488507004911
20 Van Eck, N. J., Waltman, L., Noyons, E. C. M., & Buter, R. K. (2010). Automatic term identification for bibliometric mapping. Scientometrics, 82(3), 581-596 http://doi.org/10.1007/s11192010-0173-0 PMid:20234767.
21. Van Eck, N. J., & Waltman, L. (2013). Manual for VOSviewer version 1.5.4 Leiden: Univeristeit Leiden, Erasmus Universiteit Rotterdam. Retrieved in 2024, March 22, from https://www. vosviewer.com/documentation/Manual_VOSviewer_1.5.4.pdf
22 Waaijer, C. J. F., Van Bochove, C. A., & Van Eck, N. J. (2011). On the map: Nature and Science editorials. Scientometrics,
Abidin, K. Y., Abdullah, Nurhamiyah, Y., Nandyawati, D., Hadiyanto, & Istadi
86(1), 99-112 http://doi.org/10.1007/s11192-010-0205-9 PMid:21212822.
23 Luing, W. S., Ren, M. G., Nyakuma, B. B., Ngadi, N., Yinn, W. K., Muñoz Hernández, M., Armenise, S., & Tung, C. C. (2022). Upcycling plastic waste to carbon nanomaterials: a bibliometric analysis (2000-2019). Clean Technologies and Environmental Policy, 24(3), 739-759 http://doi.org/10.1007/ s10098-021-02267-w
24 Arruda, H., Silva, E. R., Lessa, M., Proença, D., Jr., & Bartholo, R. (2022). VOSviewer and Bibliometrix. Journal of the Medical Library Association: JMLA, 110(3), 392-395 http://doi.org/10.5195/jmla.2022.1434 PMid:36589296.
25. Kirby, A. (2023). Exploratory bibliometrics: Using VOSviewer as a preliminary research tool. Publications, 11(1), 10 http:// doi.org/10.3390/publications11010010
26 Yudhanto, S., & Asmiyanto, T. (2021). Metadata research development: a bibliometric study on Science Direct. Library Philosophy and Practice, 5059, 1-11. Retrieved in 2024, October 12, from https://digitalcommons.unl.edu/libphilprac/5059
27. Jaffur, B. N., Kumar, G., & Khadoo, P. (2024). Production and functionalization strategies for superior polyhydroxybutyrate blend performance. International Journal of Biological Macromolecules, 278(Pt 3), 134907 http://doi.org/10.1016/j. ijbiomac.2024.134907. PMid:39173809.
28 Yeo, J. C. C., Muiruri, J. K., Thitsartarn, W., Li, Z., & He, C. (2018). Recent advances in developing biodegradable PHB-based toughening materials: approaches, advantages, and applications. Materials Science and Engineering C, 92, 1092-1116 http://doi.org/10.1016/j.msec.2017.11.006 PMid:30184731.
29. Jiang, X.-R., Yao, Z.-H., & Chen, G.-Q. (2017). Controlling cell volume for efficient PHB production by Halomonas. Metabolic Engineering, 44, 30-37 http://doi.org/10.1016/j. ymben.2017.09.004 PMid:28918285.
30 Chang, K., Tao, J., Fang, C., Li, J., Zhou, W., Wang, X., Yan, B., Zeng, D., & Chen, G. (2022). Evolution of research topics on the Tibetan Plateau environment and ecology from 2000 to 2020: a paper mining. Environmental Science and Pollution Research International, 29(9), 12933-12947 http:// doi.org/10.1007/s11356-021-17149-3 PMid:35034301.
31 Rochman, S., Rustaman, N., Ramalis, T. R., Amri, K., Zukmadini, A. Y., Ismail, I., & Putra, A. H. (2024). How bibliometric analysis using VOSviewer based on artificial intelligence data (using ResearchRabbit Data): Explore research trends in hydrology content. ASEAN Journal of Science and Engineering, 4(2), 251-294. http://doi.org/10.17509/ajse.v4i2.71567.
32 Marzi, G., Balzano, M., Caputo, A., & Pellegrini, M. M. (2024). Guidelines for bibliometric-systematic literature reviews: 10 steps to combine analysis, synthesis, and theory development. International Journal of Management Reviews, 27(1), 81-103 http://doi.org/10.1111/ijmr.12381
33 Swain, D. K. (2013). Journal bibliometric analysis: a case study on Internet Research. Library Philosophy and Practice, 985, 1-22. Retrieved in 2024, October 12, from https://digitalcommons. unl.edu/libphilprac/985
34 Lee, S. Y., Lee, J. S., & Sim, S. J. (2024). Cost-effective production of bioplastic polyhydroxybutyrate via introducing heterogeneous constitutive promoter and elevating acetyl-Coenzyme A pool of rapidly growing cyanobacteria. Bioresource Technology, 394, 130297 http://doi.org/10.1016/j.biortech.2023.130297 PMid:38185449.
35 Kusmayadi, A., Huang, C.-Y., Leong, Y. K., Yen, H.-W., Lee, D.-J., & Chang, J.-S. (2023). Utilizing microalgal hydrolysate from dairy wastewater-grown Chlorella sorokiniana SU-1 as a sustainable feedstock for polyhydroxybutyrate and β-carotene production by engineered Rhodotorula glutinis #100-29.
Bioresource Technology, 384, 129277 http://doi.org/10.1016/j. biortech.2023.129277 PMid:37290703.
36 Franco-León, J. J., Arriola-Guevara, E., Suárez-Hernández, L. A., Toriz, G., Guatemala-Morales, G., & Corona-González, R. I. (2021). Influence of supplemented nutrients in tequila vinasses for hydrogen and polyhydroxybutyrate production by photofermentation with Rhodopseudomonas pseudopalustris. Bioresource Technology, 329, 124865 http://doi.org/10.1016/j. biortech.2021.124865 PMid:33639381.
37. Manikandan, N. A., Pakshirajan, K., & Pugazhenthi, G. (2020). A closed-loop biorefinery approach for polyhydroxybutyrate (PHB) production using sugars from carob pods as the sole raw material and downstream processing using the co-product lignin. Bioresource Technology, 307, 123247. http://doi. org/10.1016/j.biortech.2020.123247 PMid:32234592.
38 McAllister, J. T., III, Lennertz, L. L., & Mojica, Z. A. (2021). Mapping a discipline: a guide to using VOSviewer for bibliometric and visual analysis. Science & Technology Libraries, 41(3), 319-348 http://doi.org/10.1080/0194262X.2021.1991547
39 Hou, J., Gao, C., Guo, L., Nielsen, J., Ding, Q., Tang, W., Hu, G., Chen, X., & Liu, L. (2020). Rewiring carbon flux in Escherichia coli using a bifunctional molecular switch. Metabolic Engineering, 61, 47-57 http://doi.org/10.1016/j. ymben.2020.05.004 PMid:32416271.
40 Wang, L.-J., Jiang, X.-R., Hou, J., Wang, C.-H., & Chen, G.Q. (2022). Engineering Halomonas bluephagenesis via small regulatory RNAs. Metabolic Engineering, 73, 58-69 http:// doi.org/10.1016/j.ymben.2022.06.005. PMid:35738548.
41 Wang, Y., Dao, J., & Chen, G.-Q. (2019). Polyhydroxyalkanoate/ polyhydroxybutyrate. In M. Moo-Young (Ed.), Comprehensive biotechnology (3rd ed., Vol. 3, pp. 244-257). Amsterdam: Elsevier http://doi.org/10.1016/B978-0-444-64046-8.00163-4
42 Tan, D., Xue, Y.-S., Aibaidula, G., & Chen, G.-Q. (2011). Unsterile and continuous production of polyhydroxybutyrate by Halomonas TD01. Bioresource Technology, 102(17), 8130-8136 http://doi.org/10.1016/j.biortech.2011.05.068 PMid:21680179.
43 Nayanathara Thathsarani Pilapitiya, P. G. C., & Ratnayake, A. S. (2024). The world of plastic waste: a review. Cleaner Materials, 11, 100220 http://doi.org/10.1016/j.clema.2024.100220
44 Preethi, B., Rajesh Banu, J., & Gunasekaran, M. (2023). Simultaneous production of polyhydroxybutyrate and biogas from paper mill sludge through sodium citrate-mediated disperser-induced phase-separated pretreatment. Journal of Water Process Engineering, 56, 104544 http://doi.org/10.1016/j. jwpe.2023.104544.
45 Preethi, Rajesh Banu, J., Kumar, G., & Gunasekaran, M. (2023). Augmentation in polyhydroxybutyrate and biogas production from waste-activated sludge through mild sonication-induced thermo-Fenton disintegration. Bioresource Technology, 369, 128376 http://doi.org/10.1016/j.biortech.2022.128376 PMid:36414138.
46. Liu, J., Zhang, H., Jiang, X., Tremblay, P.-L., & Zhang, T. (2023). An efficient and reusable N-dimethylacetamide/LiCl solvent system for extracting high-purity polyhydroxybutyrate from bacterial biomass. Biochemical Engineering Journal, 192, 108812. http://doi.org/10.1016/j.bej.2023.108812.
47 Feng, L., Yan, J., Jiang, Z., Chen, X., Li, Z., Liu, J., Qian, X., Liu, Z., Liu, G., Liu, C., Wang, Y., Hu, G., Dong, W., & Cui, Z. (2023). Characterization of polyhydroxybutyrate (PHB) synthesized by newly isolated rare actinomycetes Aquabacterium sp. A7-Y. International Journal of Biological Macromolecules, 232, 123366 http://doi.org/10.1016/j.ijbiomac.2023.123366 PMid:36693609.
48 Ren, D., Marusich, L. R., O’Donovan, J., Bakdash, J. Z., Schaffer, J. A., Cassenti, D. N., Kase, S. E., Roy, H. E., Lin,
Development of Polyhydroxybutyrate (PHB) production articles: a bibliometric analysis (1990-2023)
W., & Höllerer, T. (2019). Understanding node-link and matrix visualizations of networks: a large-scale online experiment. Network Science, 7(2), 242-264 http://doi.org/10.1017/ nws.2019.6.
49 Nygaard, D., Yashchuk, O., & Hermida, É. B. (2021). PHA granule formation and degradation by Cupriavidus necator under different nutritional conditions. Journal of Basic Microbiology, 61(9), 825-834 http://doi.org/10.1002/jobm.202100184 PMid:34342882.
50 Dalton, B., Bhagabati, P., De Micco, J., Padamati, R. B., & O’Connor, K. (2022). A review on biological synthesis of the biodegradable polymers polyhydroxyalkanoates and the development of multiple applications. Catalysts, 12(3), 319 http://doi.org/10.3390/catal12030319.
51 Sirohi, R., Pandey, J. P., Gaur, V. K., Gnansounou, E., & Sindhu, R. (2020). Critical overview of biomass feedstocks as sustainable substrates for the production of polyhydroxybutyrate (PHB). Bioresource Technology, 311, 123536 http://doi.org/10.1016/j. biortech.2020.123536. PMid:32448640.
52 Nath, S. (2024). Biotechnology and biofuels: paving the way towards a sustainable and equitable energy for the future. Discovery Energy, 4(1), 8 http://doi.org/10.1007/s43937-02400032-w
53 Sharma, K., Malik, K., Chaudhary, S., Kumar, S., Dhull, N., & Sujeeta. (2022). Polyhydroxybutyrates (PHBs): an eco-friendly alternative to petroleum-based plastics for diminution of their detrimental effects on the environment. International Journal of Agricultural and Applied Sciences, 3(2), 8-18 http://doi. org/10.52804/ijaas2022.322.
54 Miao, C., Humphrey, R. H., & Qian, S. (2017). A meta-analysis of emotional intelligence effects on job satisfaction mediated by job resources and a test of moderators. Personality and Individual Differences, 116, 281-288 http://doi.org/10.1016/j. paid.2017.04.031.
55 Zheng, K., & Wang, X. (2019). Publications on the association between cognitive function and pain from 2000 to 2018: A bibliometric analysis using Citespace. Medical Science Monitor, 25, 8940-8951 http://doi.org/10.12659/MSM.917742 PMid:31762442.
56 Meng, D., Miao, C., Liu, Y., Wang, F., Chen, L., Huang, Z., Fan, X., Gu, P., & Li, Q. (2022). Metabolic engineering for the biosynthesis of poly(3-hydroxybutyrate-co-3-hydroxyvalerate) from glucose and propionic acid in recombinant Escherichia coli. Bioresource Technology, 348, 126786. http://doi.org/10.1016/j. biortech.2022.126786 PMid:35114368.
57 Lin, Z., Zhang, Y., Yuan, Q., Liu, Q., Li, Y., Wang, Z., Ma, H., Chen, T., & Zhao, X. (2015). Metabolic engineering of Escherichia coli for poly(3-hydroxybutyrate) production via threonine bypass. Microbial Cell Factories, 14(1), 185 http:// doi.org/10.1186/s12934-015-0369-3 PMid:26589676.
58 Aristya, G. R., Lin, Y.-J., Chang, J.-S., Chang, J.-J., & Yen, H.-W. (2022). Polyhydroxybutyrate (PHB) production from crude glycerol by genetic engineering of Rhodotorula glutinis. Bioresource Technology Reports , 18, 101048 http://doi. org/10.1016/j.biteb.2022.101048
59 Jung, H. J., Kim, S. H., Shin, N., Oh, S.-J., Hwang, J. H., Kim, H. J., Kim, Y.-H., Bhatia, S. K., Jeon, J.-M., Yoon, J.-J., & Yang, Y.-H. (2023). Polyhydroxybutyrate (PHB) production from sugar cane molasses and tap water without sterilization using novel strain, Priestia sp. YH4. International Journal of Biological Macromolecules , 250 , 126152 http://doi. org/10.1016/j.ijbiomac.2023.126152 PMid:37558031.
60 Sooksawat, T., Attapong, M., Saengsakun, W., Siripornadulsil, S., & Siripornadulsil, W. (2023). Optimization of polyhydroxybutyrate (PHB) production by Priestia megaterium ASL11 and glycerol and thermoplastic properties of PHB-based films. Biocatalysis and Agricultural Biotechnology, 54, 102951 http://doi. org/10.1016/j.bcab.2023.102951
61 Zhou, W., Colpa, D. I., Geurkink, B., Euverink, G.-J. W., & Krooneman, J. (2022). The impact of carbon to nitrogen ratios and pH on the microbial prevalence and polyhydroxybutyrate production levels using a mixed microbial starter culture. The Science of the Total Environment, 811, 152341 http://doi. org/10.1016/j.scitotenv.2021.152341. PMid:34921889.
62 Myshkina, V. L., Nikolaeva, D. A., Makhina, T. K., Bonartsev, A. P., & Bonartseva, G. A. (2008). Effect of growth conditions on the molecular weight of Poly-3-hydroxybutyrate produced by Azotobacter chroococcum 7B. Applied Biochemistry and Microbiology, 44(5), 482-486 http://doi.org/10.1134/ S0003683808050050 PMid:18822772.
63. Costa, J. A. V., Moreira, J. B., Lucas, B. F., Braga, V. S., Cassuriaga, A. P. A., & Morais, M. G. (2018). Recent advances and future perspectives of PHB production by cyanobacteria. Industrial Biotechnology, 14(5), 240-256 http://doi.org/10.1089/ind.2018.0017
Received: Oct. 12, 2024
Revised: Feb. 03, 2025
Accepted: Mar. 16, 2025
Editor-in-Chief: Sebastião V. Canevarolo
Lucas Pacanaro de Lima1,2 , André Petraconi1,2 , Natália Ferreira Braga1,2 , Lidiane Cristina Costa3 , Ricardo Jorge Espanhol Andrade1,2 and Guilhermino José Macêdo Fechine1,2*
1Escola de Engenharia, Universidade Presbiteriana Mackenzie, São Paulo, SP, Brasil
2Instituto Mackenzie de Pesquisa em Grafeno e Nanotecnologias - MackGraphe, Universidade Presbiteriana Mackenzie, São Paulo, SP, Brasil
3Departamento de Engenharia de Materiais, Universidade Federal de São Carlos – UFSCar, São Carlos, SP, Brasil
*guilherminojmf@mackenzie.br
Obstract
The post-industrial recycled ABS (ABSpost) was used to produce a new material based on graphene oxide (GO), aimed at high-quality products again, as households and electronic applications. The GO was prepared from the oxidation of graphite, and the influence of the different amounts of filler on the mechanical, rheological, and thermal properties of ABSpost was investigated. The X-ray microtomography showed a uniform dispersion of GO fillers in the ABSpost matrix in small amounts (0.05 and 0.1 wt%), improving some properties, such as elongation at break, toughness, and impact strength. The thermal conductivity of the ABSpost also increases by 30% with the addition of only 0.1 wt% of GO. Adding a small amount of GO in a recycled ABS is a strategy to deal with the current problem of electronic housing waste and use this material to minimize its environmental impact.
Keywords: post-consumer ABS, graphene oxide, polymer nanocomposites.
How to cite: Lima, L. P., Petraconi, A., Braga, N. F., Costa, L. C., Andrade, R. J. E., & Fechine, G. J. M. (2025). Recovery of the post-industrial recycled ABS thermomechanical properties by adding graphene oxide. Polímeros: Ciência e Tecnologia, 35(2), e20250013. https://doi.org/10.1590/0104-1428.20240075
The concern about environmental impact related to the wrong waste and disposal of polymer materials leads to a necessity of reusing these materials until, ultimately, the life cycle considering the circular economy: production, use, recycling, and reuse[1]. In the last decade, electronic product consumption increased, and consequently, a similar growth in waste from electrical and electronic equipment (WEEE) was noted[2]. Acrylonitrile butadiene styrene (ABS) is an engineering thermoplastic mainly used in electrical and electronic equipment, such as cell phones, laptops, computers, TVs, and so on, due to its characteristics, such as mechanical strength, toughness and rigidity, and relatively low-cost processing[3]. One problem is that this material takes time to degrade after its use, causing its reuse and recycling as a tool to be sought. In addition, chemicals hazardous to the environment are produced when these materials are incorrectly disposed of in nature, making their reuse a vital necessity[4].
Reintroducing a recycled polymer into the market requires some modification once the recycling process can alter the overall properties of those materials. Several strategies have been used for ABS recycling to reduce
their environmental impact, for example, creating polymer blends[3-6], aiming to reuse this polymer without much decrease in its properties compared to virgin ABS. Brennan et al.[5] studied the mechanical properties of ABS and high-impact polystyrene (HIPS) blends from computer equipment waste. The presence of 10% ABS in HIPS or 10% of HIPS in ABS had a favorable effect on the strains to failure, indicating a recovery of mechanical properties, such as ductility, that is commonly lost in each independent polymer during the recycling process due to degradation. In another study, Saxena and Maiti[4] prepared a blend of ABS from electronic waste with low-density polyethylene (LDPE) with maleic anhydride (MA) as a compatibilizing agent via reactive extrusion in a twin-screw extruder. The blends presented enhancement in mechanical properties, for example, an increase of up to 246% in Young´s modulus compared to the neat HDPE due to MA, which created a crosslink structure in the system. Scaffaro et al.[3] made a polymer blend mixing post-consumed ABS with virgin ABS resin in different proportions and studied their properties after different recycling cycles. The rheological measurements showed no change in the viscosity of the ABS blends up to two recycling cycle steps compared to virgin ABS.
Lima, L. P., Petraconi, A., Braga, N. F., Costa, L. C., Andrade, R. J. E., & Fechine, G. J. M.
Besides the use of polymer blends, another approach is using nanofillers as reinforcement for recycled ABS. As reported in the study made by Mao et al.[7], the authors verified the effect of adding montmorillonite and nitrile rubber in recycled ABS: results showed an improvement in the mechanical properties (impact strength, tensile strength, and tensile modulus) of recycled ABS when adding 1 phr of montmorillonite in re-ABS/NBR (90/10).
Here, the study aims to develop a strategy to use PostIndustrial Recycled ABS as a raw material for producing plastic parts. This strategy is by inserting a nanometric filler, graphene oxide (GO), in the polymer matrix. Graphenereinforced polymer nanocomposites have attracted attention due to their excellent properties and multifunctionalities, which are widely applied in many fields[8,9]. Some studies have shown that inserting graphene and its derivatives in an ABS matrix increases the mechanical and thermal properties and rheological measurements[10–13]. Compared to other fillers, graphene stands out due to its large specific area and high aspect ratio, and using only small amounts of this filler, it is possible to enhance the electrical, mechanical, and barrier characteristics of the polymer[8,14]. Moreover, the functional groups present on the surface of the GO, such as epoxy, hydroxyl, carbonyl, and carboxyl groups, can improve the interaction within the matrix, enhancing the dispersion[15,16].
In this context, this study aimed to evaluate the effect of adding different amounts of GO on post-industrial recycled ABS (ABSpost) properties to recover some specific properties that allow it to be used again in non-commodity items. Adding GO to ABSpost attempts to overcome the barriers to recycling electronic equipment and reusing polymers to minimize their environmental impact.
The Post-Industrial Recycled ABS (ABSpost) was obtained from AKG Reciclagem de Plásticos Company in Brazil. Sigma Aldrich supplied the powdered graphite (99% purity). Sulfuric acid, potassium permanganate, hydroxyl peroxide, hydrochloric acid, and ethanol were used in GO synthesis.
The GO was synthesized by Hummer’s method modified, as described by Pinto et al.[17] In the first step, the oxidation of graphite prepared the graphite oxide (GrO): slowly added 60 ml of sulfuric acid in 1g of graphite in an ice bath and stirred for 15 min, followed by the addition of 100 ml of a solution of KMnO4 (35 mg/ml) with the aid of a peristaltic pump using a flow rate of 6.8 ml/min. After adding the KMnO4 solution, the system was stirred in ice for 5 minutes. The ice bath was removed, and the system was stirred for 2 hours. Then, the system was diluted in 100 mL of distilled water, followed by a hydroxyl peroxide 30% addition until bubble formation ceased. After 24h rest, the GrO was precipitated and washed with 500 ml of water, 250 mL of 10% hydrochloric acid, 250 ml of ethanol, and 200 ml of water. Then, the GrO was filtered and dried in a vacuum oven for 12h at 60°C.
In the second step, the GrO was dispersed in distilled water at a 1 mg/ml concentration to exfoliate using an
ultrasonic bath (Elma—P30H) for 2 hours, obtaining the GO suspension.
Thermo-gravimetric analysis (TGA) for the pristine graphite and GrO was made using a TA instrument (DSC/ TGA Q600) at a nitrogen atmosphere between 30 and 1000°C at a rate of 10°C/min using an alumina crucible. The graphite and GrO were characterized by X-ray diffraction (XRD) in a Rigaku MiniFlex II with incident radiation of 1.42 Angstroms of wavelength number. The scanning angle was 3° to 60° at a 2°/min rate. The Raman Spectroscopy of graphite and GrO was made in a Witec model Alpha 300R operating at a 532 nm wavelength incident laser. The GO was characterized using atomic force microscopy (AFM) in an Icon Dimension (Bruker) equipped with RTESPA. The GO suspension was dropped in a mica substrate to be analyzed.
The ABS post was grounded using a milling knife (SL 31—Solab Científica) to increase the surficial area of the polymer grains. The polymer powder was mixed with the GO suspension to produce ABSpost/GO systems with different concentrations of filler: 0.05 wt.%, 0.1 wt. %, and 0.3 wt. %. The solid-solid deposition (SSD) technique18 was used, in which the components were mixed and heated until complete solvent evaporation, obtaining polymer grains covered with GO particles.
The ABS post and the nanocomposites were then mixed by melting using a twin-screw extruder model Process 11 of ThermoScientific (L/D = 40). The screw speed used was 150 rpm, and a feeder of 4g/min. The temperature in each extruder section was 180, 190, 200, 210, 220, 220, 215, and 210°C from the first zone to die. The extrudate filament was cooled in water and cut up to obtain pellets.
Specimens for the tensile and impact tests of the ABSpost and the nanocomposites were molded using an injection molding machine, the Haake Minijet Pro from Thermo Scientific. The cylinder and mold temperatures were 230°C and 90°C, respectively. The injection pressure was 250 bar for 25 seconds, and the post pressure was 120 bar for 10 seconds.
The mechanical properties of the nanocomposites were analyzed using a Zwick/Roell Z100 according to ASTM D638-14 at room temperature, 5 mm/min speed, and load cell 10 kN. The parameters, such as Young´s modulus, tensile strength, tensile at break, elongation at break, and toughness (area below the stress x strain curve), were obtained.
The impact resistance test was performed according to Izod ISO 180 using a Tinius Olsen model IT 504. Before the test, the specimens were notched using a Tinius Olsen (model 899).
The fracture surface morphology of the notched impact specimens was analyzed by Scanning electron microscopy (SEM) using a Hitachi TM 3000, with an accelerating voltage of 15 kV. The specimens were covered with a thin
Recovery of the post-industrial recycled ABS thermomechanical properties by adding graphene oxide
layer of gold using a Sputter Coater Bal-tec SCD 050, 40 mA for 30 seconds.
Dynamic Mechanical Analysis (DMA) was performed using PerkinElmer 8000 from 25°C to 150°C under air at a temperature increase rate of 3 °C/min applying a 0.05% strain with 1 Hz frequency, using two points bending mode.
Rheological tests were obtained using a rheometer Anton Paar (MCR 702) equipped with 25 mm parallel plate geometry with a gap of 1 mm at a temperature of 220ºC in a compressed air environment. Steady-state rheological measurements were performed to analyze the viscosity in the function of the shear rate ranging from 0.01 s-1 to 100 s-1. Dynamic tests were also executed to investigate the viscoelastic properties of the material. Time sweep (120 min) and angular frequency sweep measurements ranging from 0.01-100 rad/s were conducted within the linear viscoelastic regime (LVR).
The thermal conductivity of the nanocomposites was measured using Trident thermal conductivity equipment from C-Therm with MTPS (modified transient plane source). It was tested at four temperatures (25, 40, 60, and 80 °C).
X-ray microtomography (XR-MT) analyzed the dispersion and distribution of the fillers within the matrix. It was performed using a Rigaku Nano 3DX, an X-ray source with a 1200W power supply, Mo radiation, 17 keV, and a 10x lens.
3.1 Graphite and GrO characterization
TGA analyzed the thermal stability of the pristine graphite and GrO (Figure 1). The pristine graphite is thermal stable in the temperature range studied, presenting no loss mass (the percentage maintains close to 100%), indicating the material’s high crystallinity and purity[18]. The insertion of functionalized groups on GrO changes the material’s thermal stability. It was possible to observe two steps of mass loss: the first at ~100 °C, due to the water elimination present between the GrO layers, and the other significant mass loss (~26.15%) between 170°C and 320°C, which refers to
the loss of oxygen-containing groups[19,20], confirming that the oxidation process occurred.
The diffractograms obtained for graphite and GrO are presented in Figure 2. It was possible to verify that the graphite presents a sharp peak at 2θ = 26.5° related to the plane (002) and another small peak at 54 ° related to the (004) plane[20], confirming the high crystalline nature of graphite. There is a displacement of the atomic plane (002) for 2θ = 11.12° after oxidation in GrO. Peak enlargement is also notable due to the introduction of functional groups into the layers[21]. Using Bragg’s equation (Equation 1): 2 ndsinλθ = , where n is an integer number, λ is the X-ray wavelength, d is the interlayer space and θ is the incident angle; the distance of the lattice planes is 0.33 nm for graphite and 0.77 nm for GrO implies that the carbon layers were expanded due to the oxygen groups insertion on basal plane and bords[20]
Figure 3 shows the Raman spectra for the graphite and GrO. The G band presented in graphite and GrO at ~ 1570 cm-1 is related to the sp2 hybridization of carbonic structure. In the GrO spectra is visible a peak at ~1350 cm-1, related to the D band, and it is associated with defects in the graphitic structure, such as the presence of vacancies and functional groups, which lead to a disruption of the hexagonal graphitic lattice, being another indication of the graphite oxidation[22]. Finally, the 2D band ~ 2690 cm-1 can be related to the number of graphene layers; when the G band is intense and the 2D band less intense, it is assumed that the number of layers is high[23,24]. The reason for this is that GrO is still unexfoliated material.
The ratio between the D and G band intensities (ID/IG) allowed the number of defects in the material’s structure to be estimated. The ID/IG was 0.97, indicating a low level of structural defects and oxidation[23].
The AFM analysis of GO was carried out to verify its flake thickness and lateral size, generating frequency histograms of lateral size and height of the GO sheets, presented in Figures 4a and b, respectively. The GO majority sheets present a height between 4 and 10 nm and an equivalent lateral size between 300 and 600 nm. Through the AFM images in Figure 4c, it was possible to verify that the particle size is not homogeneous; it can be inferred that

Lima, L. P., Petraconi, A., Braga, N. F., Costa, L. C., Andrade, R. J. E., & Fechine, G. J. M.


Recovery of the post-industrial recycled ABS thermomechanical properties by adding graphene oxide
the exfoliation process of GrO originated GO with different heights and lateral sizes. Graphene-like materials’ size and thickness can largely influence the properties of the final nanocomposites: larger sheets, that is, larger lateral size, are suitable for improving the interaction with the polymer matrix, leading to better properties of the nanocomposite[25] Kaczmarek et al.[26] “large” GO are those with lateral size exceeding 10 µm, “medium” flakes are between 3 and 10 µm, and “small” flakes have dimensions less than 3 µm. Small flakes present lower aspect ratio values, leading to difficulty transferring their properties to the matrix and, consequently, a slight improvement in nanocomposite properties.
3.2. ABS/GO nanocomposites characterization
3.2.1 X-Ray Microtomography
The homogeneous dispersion of GO in ABSpost is the most crucial criterion for successfully improving the properties of the nanocomposites. The XR-MT was carried out to investigate the filler dispersion and distribution within the matrix in 3D. Some characteristics of the particles were obtained, such as surface area and volume, which are listed in Table 1
Sample Surface area (µm2) Volume (µm3)
ABS post /GO 0.05 4470045 6202577
ABS post /GO 0.1 3638786 4042292
ABS post /GO 0.3 2482784 4159074
Figure 5 shows the 3D images and the volume and surface area histogram of the ABSpost/GO nanocomposites. In the images, the red spots represent the filler, and as the filler volume/surface area decreases, the color becomes darker. The ABSpost/GO 0.05 presented the most homogeneous filler distribution pattern and the higher surface area and volume. The higher the surface area, the more efficient the interaction between filler and matrix is, which influences the property’s transference from one to another. On the other hand, the nanocomposite with 0.3% GO has the smallest volume and surface area, weakening the material.
3.2.2
The stress-strain curves for the ABS post and ABS post /GO nanocomposites are presented in Figure 6. Through those curves, it was possible to obtain parameters such as Young’s modulus (E), yield tensile strength (ys), tensile (σb) elongation (εb) at break, and toughness, which are summarized in Table 2
The ABS post shows a ductile material behavior with elastic deformation, yield point, and plastic deformation until the fracture. Usually, the mechanical properties of recycled and neat polymer materials are quite different. The neat ABS resin generally presents a tensile strength of around 40-48 MPa, Young´s modulus ~ 1.5-2.3 GPa, and strain at a break between 7 and 38%[27-30]. The processing of polymer and the recycling process can lead to losses in mechanical properties, mainly due to thermal degradation due to a decrease in molecular weight[31,32]. Here, it is possible to observe that the ABSpost presents values similar to Young´s modulus and maximum stress (yield point) compared to a neat ABS. Therefore, the strain at break data

Lima, L. P., Petraconi, A., Braga, N. F., Costa, L. C., Andrade, R. J. E., & Fechine, G. J. M.

6. Stress-strain curves for ABS post and ABS/GO nanocomposites.
Table 2. Mechanical properties of ABSpost and ABSpost/GO nanocomposites.
present results close to low values of the range found in the literature. The polymer processing undergone by the ABS resin in the company probably did not lead to a significant degradation process.
Using a nanofiller may improve some of the ABSpost’s mechanical properties in this context. However, results showed no significant variation in Young’s modulus with GO incorporation. In fact, it was expected that Young´s Modulus would increase with the GO content, as can be calculated using the modified rule mixing equation[33]. A possible explanation is GO multilayers and agglomerates that could induce the superlubricity phenomenon[34], decreasing the value of Young´s modulus.
However, yield strength tends to decrease with the increasing amount of GO, from 44 MPa in ABSpost to approximately 39 MPa in all nanocomposites. One hypothesis that sustains this change is the superlubricity phenomenon that could occur between the GO layers and the polymer chains, where the nanolayers act as lubricants “sliding” between themselves, decreasing the tensile strength and increasing the elongation of the nanocomposites[35]
The tensile and elongation at break values also tend to increase until the 0.1% GO composition, which led to a rise in the toughness of ~ 125% for this composition compared to the ABSpost. This indicates excellent interfacial adhesion between filler and matrix and bonding between the functional
groups of GO and the polymer[36]. A nanofiller aggregation may occur at 0.3% of the GO amount, as shown in the XRMT analysis, thus decreasing the mechanical properties.
Figure 7 shows the impact strength of the ABSpost and the ABSpost/GO nanocomposites. ABS is known for its high impact resistance, which depends on the polybutadiene phase (PB) percentage on the terpolymer; this monomer contributes to the toughness and impact resistance[37]. Generally, the neat ABS resin presents high impact strength, around 260 J/m[38,39], or 25 kJ/m2[40]. Here, it was used a post-industrial recycled ABS (ABSpost), which may have arisen from the waste of electronic products, which may contain many impurities and traces of other materials; besides that, the material already passed a cycle of processing parameters, which may have lost some properties due to thermal degradation[32]. So, the impact strength value for ABSpost was around 18 J/m. The necessary energy to break the specimen slightly increased as the amount of GO increased until 0.1 wt.% of the filler, reaching 20 J/m, indicating very well-dispersed fillers; consequently, the stress distribution occurred more uniformly. Figure 8 shows a surface fracture image of the ABSpost/GO 0.1 nanocomposite impact sample. As can be seen, the GO particle is very well attached to the ABS matrix, confirming the supposition made. Another exciting factor is that the thin sheet of GO shape can limit the development of cracks in the matrix in the V-notched specimen[41]. Further increasing
Recovery of the post-industrial recycled ABS thermomechanical properties by adding graphene oxide


the filler content to 0.3 wt.%, the impact strength decreased probably at this higher concentration, it is more difficult to disperse the filler, and the formation of agglomerates occurs, as shown in XR-MT, causing stress concentrations areas, which reduces the impact strength. The nanocomposite gets brittle as the percentage of GO increases, and the reduction in the impact strength of polymers with the addition of GO was also reported in another research[42,43]
3.2.3 Dynamic mechanical analysis
Figure 9 shows the DMA results of ABS post and the ABS post/GO nanocomposites. From DMA, it was possible to obtain parameters such as storage modulus (E’), loss modulus (E”), and tan delta. E’ decreases for all samples as the temperature increases due to a decreased stiffness resulting
from increased mobility chains. Adding 0.05 or 0.1 wt.% of GO did not alter the E’. However, the composite with 0.3 wt.% of GO slightly increased the E’ when compared with the other compositions in temperatures from approximately 60 to 100 °C, indicating that the energy absorbed by the material is higher, increasing stiffness and preventing chains from moving. Excess GO can maintain a plateau of E’ for longer before reaching Tg. This was also verified for the composition with 0.1% GO but less intense. In other words, the formation of agglomerates (as seen in XR-MT images) hinders the mobility of the chains at higher temperatures. This mobility is only overcome when approaching Tg; all materials behave similarly.
The E” means the amount of energy the polymer dissipates, and for ABSpost/GO with 0.1 or 0.3 wt%. the E”
Lima, L. P., Petraconi, A., Braga, N. F., Costa, L. C., Andrade, R. J. E., & Fechine, G. J. M.

is similar to ABS. The E” of ABSpost/GO 0.05% slightly decreased compared to the ABS, indicating a decrease in energy dissipation. ABSpost/GO 0.05% presents a better filler dispersion level (as seen on XR-MT images), hindering the chain mobility and energy dissipation mechanism.
The tan delta (damping factor) is the relation between loss and storage modulus (tan delta = E”/E’), and the peak of tan delta in the graph, at approximately 115 °C, corresponds to the glass transition temperature (Tg) related to the SAN phase of ABS, where the material changes from rigid to elastic behavior, due to increase in mobility. The tan delta peak is the same for all compositions; the GO particles are probably not close to the SAN phase, or the filler content is not high enough to impact this polymer property. The GO incorporation does not show any variation in the tan delta peak height; only 0.3% of GO composition increases the damping factor of the ABSpost matrix. The increase in the tan delta peak suggests that GO fortified the energy dissipation process. The presence of agglomerates in this composition (as seen on XR-MT images) leads to vacant spaces, and the chain polymer moves or rotates freely.
The coefficient of effectiveness, the C-factor, of the filler in the polymer matrix was calculated using the Equation 2:
nanocomposites are shown in Table 3. The composite containing 0.1% of GO showed the lower value of the C parameter, indicating that the effectiveness of GO was maximum in ABSpost/GO 0.1, confirming again that this composition presents the best dispersion and polymerparticle largest contact area.
3.2.4
Figure 10 shows the viscosity as a function of the shear rate for steady-state measurements. It is possible to see that the filler has no significant influence on the matrix in the melted state since there is no substantial change in the shear viscosity behavior in the shear range studied. These results could indicate that the concentration used in this work does not influence the shear viscosity behavior at a steady state regime. This result suggests that the processability of the ABS/GO composite will not change compared to ABS without the filler.
E’g and E’r are the values of E’ in the glassy region (80°C) and the rubbery region (120°C), respectively. The effectiveness of the filler in the polymer decreases as the C value increases[44]. The values obtained for ABS post /GO
Figure 11 shows the viscoelastic behavior of the polymer and the nanocomposites. In this work, it was possible to observe, within the displayed frequency range, that ABSpost and nanocomposites with GO indicate that a plateau for the storage modulus (G’) at low frequencies was approached, with G’ > G”, suggesting a nonterminal behavior. This elastic behavior for the ABS post can be attributed to the butadiene phase in the ABSpost formulation[45,46]. The nonterminal behavior means that the long-range motion of the macromolecules is hindered, resulting in incomplete relaxation of polymer chains. At intermediate frequencies, G’’ is higher than G’ due to the dissipative response observed due to the interplay of both phases, the butadiene phase and styrene-acrylonitrile phase, within the polymer structure. At higher frequencies
Recovery of the post-industrial recycled ABS thermomechanical properties by adding graphene oxide
Table 3. C-factor obtained by DMA for ABSpost and ABSpost/GO nanocomposites. Sample

Figure 10. Viscosity as a function of shear rate of ABSpost and ABSpost/GO nanocomposites.

Figure 11. Storage and loss modulus of ABSpost and ABSpost/GO nanocomposites.
G’ is higher than G’’ again, indicating that the rubbery phase dominates the viscoelastic behavior at these frequencies[47] Regarding the viscoelastic behavior of the nanocomposites, the materials follow the ABSpost matrix itself, mostly due to the low content of the filler, besides 0.3% of GO.
Different behavior is observed at this concentration, with the G’ and the G” showing an enhancement, suggesting a mechanical reinforcement via modulus increase for the frequencies range analyzed. This result indicates that at a concentration of 0.3%, the GO can engage and interfere
Lima, L. P., Petraconi, A., Braga, N. F., Costa, L. C., Andrade, R. J. E., & Fechine, G. J. M.
in the polymer chain motion, as previously observed for dynamic mechanic analyses.
The thermal conductivity analysis was carried out to verify the influence of different amounts of GO on the thermal properties of ABSpost. The low thermal conductivity of polymers is a barrier that prevents their application in electronics due to their limited capability of spreading the heat. Adding a conductivity filler, such as graphene, to a thermally insulating matrix is a strategy to improve this property and is possibly applicable in the electronics and energy industry[48]. Nonetheless, some factors affect the thermal conductivity in polymer nanocomposites, including the properties of the graphene sheets, such as defect, lateral size, and surface chemistry; the dispersion/distribution of the filler within the matrix; and the filler content[49]. The GO has chemical functional groups, and the degree of oxidation can significantly affect the thermal conductivity of GO once the oxygen groups minimize the ability of phonon transport[50]
Phonons, like the heat conduction mechanism of crystalline materials, principally accomplish the thermal conductivity of graphene. The heat transfers from one layer of an atom to another in the form of vibrations, and due to the dense packing of atoms in the lattice and the strong chemical bonds between them, the heat transfer propagates as a wave and occurs rapidly. On the other hand, the heat transfer in the polymer is relatively more complicated and depends on various factors, such as the crystallinity and orientation of the chain. Still, it is known that the diffusion occurs slowly and causes disordered vibrations and rotation of the atoms, which reduces the thermal conductivity of the polymer. Considering the graphene polymer nanocomposites, the graphene creates interfaces within the matrix due to the
large specific area, which will lead to phonon scattering and introduce high thermal resistance[51]
Figure 12 shows the thermal conductivity values of the ABS post and ABSpost/GO systems with GO at four different temperatures (25, 40, 60, and 80°C). The thermal conductivity of ABSpost is very low, around 0.16 W/m.K at room temperature, and it increases as the temperature rises, reaching 0.27 W/m.K at 60 °C, and at 80°C, it turns to decrease. The temperature is very significant in the thermal conductivity of the nanocomposites. With the increase in the temperature (T > 300 K), the thermal conductivity of the monolayer graphene decreases because of the Umklapp scattering, and the interfacial thermal conductivity between GO and the polymer moderately increases, resulting from the weakening of the interfacial thermal barrier for heat transport[52]
The addition of GO in any filler content studied did not affect the thermal conductivity of ABS at 25 °C or 40 °C. However, in higher test temperatures (60°C and 80°C), it is possible to observe some changes: for the compositions with 0.1 and 0.3 wt.%, the thermal conductivity was 0.35 w/m.K, an increase of 30%, compared to ABSpost at the same temperature. This happens since GO tends to form a thermal conductivity network inside the polymer matrix and acts as a thermal conductivity channel. If the amount of graphene is below the percolation threshold, the fillers do not connect one to another and do not create a thermal conduction pathway. On the other hand, above the percolation threshold, heat transfer can occur through the thermal conduction pathway[51]. Another important observation is that Tg strongly influences polymer thermal conductivity variations. The decrease in the phonon velocity close to or above Tg is easily noticeable. So, the tendency for thermal conductivity to increase is stopped by the approach of the glass transition temperature[53].

Recovery of the post-industrial recycled ABS thermomechanical properties by adding
It was investigated the effect of the addition of GO on the properties of post-consumer ABS, aiming to apply this polymer back to the consumer, minimizing the impact of wrong disposal and pollution on the environment. The thermal conductivity increased by 30% with the addition of 0.1 and 0.3 wt% of GO compared to the ABSpost; efficient heat management is crucial to dissipate excessive heat, improving the efficiency of electronic devices; with the increase in thermal conductivity; these materials are attractive for applications involving electronic circuit parts where heat dissipation is required. The mechanical properties of ABSpost also improved with the insertion of a small concentration of GO, as well as the toughness and impact strength. The XR-MT showed the best distribution and dispersion of the nanocomposites’ fillers with smaller amounts of GO, corroborating the results of mechanical properties.
In short, this paper contributes to developing a new material that recovers the properties of post-consumer ABS from electronic product waste, a strategy to reduce pollution and be environmentally friendly.
• Conceptualization – Lucas Pacanaro de Lima; Natália Ferreira Braga.
• Data curation – Lucas Pacanaro de Lima; André Petraconi.
• Formal analysis – Lucas Pacanaro de Lima; Natália Ferreira Braga; André Petraconi.
• Funding acquisition – Guilhermino José Macêdo Fechine.
• Investigation – Lucas Pacanaro de Lima; André Petraconi.
• Methodology – Lucas Pacanaro de Lima; André Petraconi.
• Project administration – Guilhermino José Macêdo Fechine.
• Resources – Lidiane Cristina Costa; Ricardo Jorge Espanhol Andrade; Guilhermino José Macêdo Fechine.
• Software – NA.
• Supervision – Guilhermino José Macêdo Fechine.
• Validation – Lidiane Cristina Costa; Ricardo Jorge Espanhol Andrade; Guilhermino José Macêdo Fechine.
• Visualization – Natália Ferreira Braga; Lidiane Cristina Costa; Ricardo Jorge Espanhol Andrade; Guilhermino José Macêdo Fechine.
• Writing – original draft – Lucas Pacanaro de Lima; Natália Ferreira Braga.
• Writing – review & editing – Lidiane Cristina Costa; Ricardo Jorge Espanhol Andrade; Guilhermino José Macêdo Fechine.
6. Acknowledgements
1 Oliveira, I. M., Gimenez, J. C. F., Xavier, G. T. M., Ferreira, M. A. B., Silva, C. M. P., Camargo, E. R., & Cruz, S. A. (2024). Recycling ABS from WEEE with peroxo-modified surface of titanium dioxide particles: alteration on antistatic and degradation properties. Journal of Polymers and the Environment, 32(3), 1122-1134 http://doi.org/10.1007/s10924-023-03021-7
2 Vazquez, Y. V., & Barbosa, S. E. (2017). Process window for direct recycling of acrylonitrile-butadiene-styrene and highimpact polystyrene from electrical and electronic equipment waste. Waste Management (New York, N.Y.), 59, 403-408. http:// doi.org/10.1016/j.wasman.2016.10.021. PMid:27769650.
3. Scaffaro, R., Botta, L., & Di Benedetto, G. (2012). Physical properties of virgin-recycled ABS blends: effect of postconsumer content and of reprocessing cycles. European Polymer Journal, 48(3), 637-648 http://doi.org/10.1016/j. eurpolymj.2011.12.018
4 Saxena, D., & Maiti, P. (2021). Utilization of ABS from plastic waste through single-step reactive extrusion of LDPE/ABS blends of improved properties. Polymer, 221, 123626 http:// doi.org/10.1016/j.polymer.2021.123626
5 Brennan, L. B., Isaac, D. H., & Arnold, J. C. (2002). Recycling of acrylonitrile-butadiene-styrene and high-impact polystyrene from waste computer equipment. Journal of Applied Polymer Science, 86(3), 572-578 http://doi.org/10.1002/app.10833
6 Wang, J., Li, Y., Song, J., He, M., Song, J., & Xia, K. (2015). Recycling of acrylonitrile-butadiene-styrene (ABS) copolymers from waste electrical and electronic equipment (WEEE), through using an epoxy-based chain extender. Polymer Degradation & Stability, 112, 167-174 http://doi.org/10.1016/j. polymdegradstab.2014.12.025
7 Mao, N. D., Thanh, T. D., Thuong, N. T., Grillet, A.-C., Kim, N. H., & Lee, J. H. (2016). Enhanced mechanical and thermal properties of recycled ABS/nitrile rubber/nanofil N15 nanocomposites. Composites. Part B, Engineering, 93, 280-288 http://doi.org/10.1016/j.compositesb.2016.03.039
8 Lee, S. J., Yoon, S. J., & Jeon, I.-Y. (2022). Graphene/polymer nanocomposites: Preparation, mechanical properties, and application. Polymers, 14(21), 4733. http://doi.org/10.3390/ polym14214733. PMid:36365726.
9. Trivedi, D. N., & Rachchh, N. V. (2022). Graphene and its application in thermoplastic polymers as nano-filler: A review. Polymer, 240, 124486 http://doi.org/10.1016/j. polymer.2021.124486
10 Aumnate, C., Pongwisuthiruchte, A., Pattananuwat, P., & Potiyaraj, P. (2018). Fabrication of ABS/graphene oxide composite filament for fused filament fabrication (FFF) 3D printing. Advances in Materials Science and Engineering, 2830437(1), 2830437 http://doi.org/10.1155/2018/2830437
11 Dul, S., Fambri, L., & Pegoretti, A. (2016). Fused deposition modelling with ABS-graphene nanocomposites. Composites. Part A, Applied Science and Manufacturing, 85, 181-191 http:// doi.org/10.1016/j.compositesa.2016.03.013
The authors would like to acknowledge FAPESP –Fundação de Amparo à Pesquisa do Estado de São Paulo (2020/14302-2 and 2019/06620-7). The support provided by Conselho Nacional de Desenvolvimento Científico e Tecnológico (CNPq, Project Number: 305109/20227), CNPq National Institute of Science and Technology of Carbon Nanomaterials (INCT-Nanocarbono), CNPq National Institute of Science and Technology for Rheology of Complex Materials Applied to Advanced Technologies (INCT-Rhe9) grant 406765/2022-7. We also acknowledge the Rigaku for the X-ray Microtomography analysis.
Lima, L. P., Petraconi, A., Braga, N. F., Costa, L. C., Andrade, R. J. E., & Fechine, G. J. M.
12 Waheed, Q., Khan, A. N., & Jan, R. (2016). Investigating the reinforcement effect of few layer graphene and multi-walled carbon nanotubes in acrylonitrile-butadiene-styrene. Polymer, 97, 496-503 http://doi.org/10.1016/j.polymer.2016.05.070
13 Lee, S. J., Baek, J., & Jeon, I.-Y. (2024). Preparation and characteristics of decene-functionalized graphitic nanoplatelets/ acrylonitrile butadiene styrene hybrid nanocomposites. Polymer, 294, 126727 http://doi.org/10.1016/j.polymer.2024.126727
14. Du, J., & Cheng, H.-M. (2012). The fabrication, properties, and uses of graphene/polymer composites. Macromolecular Chemistry and Physics, 213(10-11), 1060-1077 http://doi. org/10.1002/macp.201200029
15 Fu, X., Lin, J., Liang, Z., Yao, R., Wu, W., Fang, Z., Zou, W., Wu, Z., Ning, H., & Peng, J. (2023). Graphene oxide as a promising nanofiller for polymer composite. Surfaces and Interfaces, 37, 102747 http://doi.org/10.1016/j.surfin.2023.102747
16 Shah, R., Kausar, A., Muhammad, B., & Shah, S. (2015). Progression from graphene and graphene oxide to high performance polymer-based nanocomposite: a review. PolymerPlastics Technology and Engineering, 54(2), 173-183 http:// doi.org/10.1080/03602559.2014.955202
17. Pinto, G. M., Silva, G. C., & Fechine, G. J. M. (2020). Effect of exfoliation medium on the morphology of multi-layer graphene oxide and its importance for poly(ethylene terephthalate)based nanocomposites. Polymer Testing, 90, 106742 http:// doi.org/10.1016/j.polymertesting.2020.106742
18 Farivar, F., Lay Yap, P., Karunagaran, R. U., & Losic, D. (2021). Thermogravimetric analysis (TGA) of graphene materials: effect of particle size of graphene, graphene oxide and graphite on thermal parameters. Journal of Carbon Research, 7(2), 41 http://doi.org/10.3390/c7020041
19 Zhang, Z., Schniepp, H. C., & Adamson, D. H. (2019). Characterization of graphene oxide: variations in reported approaches. Carbon, 154, 510-521 http://doi.org/10.1016/j. carbon.2019.07.103.
20 Vorrada, L., Krit, T., Passakorn, E., Wanchai, B., & Achanai, B. (2013). Preparation and characterization of reduced graphene oxide sheets via water-based exfoliation and reduction methods. Advances in Materials Science and Engineering, 2013(1), 923403 http://doi.org/10.1155/2013/923403
21 Stobinski, L., Lesiak, B., Malolepszy, A., Mazurkiewicz, M., Mierzwa, B., Zemek, J., Jiricek, P., & Bieloshapka, I. (2014). Graphene oxide and reduced graphene oxide studied by the XRD, TEM and electron spectroscopy methods. Journal of Electron Spectroscopy and Related Phenomena, 195, 145-154. http://doi.org/10.1016/j.elspec.2014.07.003
22 Kudin, K. N., Ozbas, B., Schniepp, H. C., Prud’homme, R. K., Aksay, I. A., & Car, R. (2008). Raman spectra of graphite oxide and functionalized graphene sheets. Nano Letters, 8(1), 36-41 http://doi.org/10.1021/nl071822y PMid:18154315.
23. Muzyka, R., Drewniak, S., Pustelny, T., Chrubasik, M., & Gryglewicz, G. (2018). Characterization of graphite oxide and reduced graphene oxide obtained from different graphite precursors and oxidized by different methods using Raman spectroscopy. Materials (Basel), 11(7), 1050 http://doi. org/10.3390/ma11071050 PMid:29933564.
24 Kaniyoor, A., & Ramaprabhu, S. (2012). A Raman spectroscopic investigation of graphite oxide derived graphene. AIP Advances, 2(3), 032183 http://doi.org/10.1063/1.4756995
25 Prolongo, S. G., Jiménez-Suárez, A., Moriche, R., & Ureña, A. (2014). Graphene nanoplatelets thickness and lateral size influence on the morphology and behavior of epoxy composites. European Polymer Journal, 53, 292-301 http:// doi.org/10.1016/j.eurpolymj.2014.01.019
26 Kaczmarek, Ł., Warga, T., Makowicz, M., Kyzioł, K., Bucholc, B., & Majchrzycki, Ł. (2020). The influence of the size and
oxidation degree of graphene flakes on the process of creating 3D structures during its cross-linking. Materials (Basel), 13(3), 681. http://doi.org/10.3390/ma13030681. PMid:32028708.
27 Ramaraj, B. (2006). Mechanical and thermal properties of ABS and leather waste composites. Journal of Applied Polymer Science, 101(5), 3062-3066. http://doi.org/10.1002/app.24113.
28 Song, P., Cao, Z., Meng, Q., Fu, S., Fang, Z., Wu, Q., & Ye, J. (2012). Effect of lignin incorporation and reactive compatibilization on the morphological, rheological, and mechanical properties of ABS resin. Journal of Macromolecular Science, Part B: Physics, 51(4), 720-735 http://doi.org/10.10 80/00222348.2011.609794
29. Abdelhaleem, A. M. M., Abdellah, M. Y., Fathi, H. I., & Dewidar, M. (2016). Mechanical properties of ABS embedded with basalt fiber fillers. Journal for Manufacturing Science and Production, 16(2), 69-74 http://doi.org/10.1515/jmsp2016-0006.
30 Khan, M. M. K., Liang, R. F., Gupta, R., & Agarwal, S. (2005). Rheological and mechanical properties of ABS/ PC blends. Korea-Australia Rheology Journal, 17(1), 1-7 Retrieved in 2024, July 31, from https://www.researchgate. net/publication/268432181
31 Budin, S., Hyie, K. M., Yussof, H., Ishak, A., & Ginting, R. (2020). Investigation on mechanical properties of blend virgin and recycled acrylonitrile-butadiene-styrene (ABS) in injection molding. Key Engineering Materials, 833, 8-12 http://doi. org/10.4028/www.scientific.net/KEM.833.8
32 Teixeira, F. S. M., Peres, A. C. C., Gomes, T. S., Visconte, L. L. Y., & Pacheco, E. B. A. V. (2021). A review on the applicability of life cycle assessment to evaluate the technical and environmental properties of waste electrical and electronic equipment. Journal of Polymer Environmental Science, 29(5), 1333-1349 http://doi.org/10.1007/s10924-020-01966-7
33 Cremonezzi, J. M. O., Pinto, G. M., Mincheva, R., Andrade, R. J. E., Raquez, J.-M., & Fechine, G. J. M. (2023). The micromechanics of graphene oxide and molybdenum disulfide in thermoplastic nanocomposites and the impact to the polymerfiller interphase. Composites Science and Technology, 243, 110236. http://doi.org/10.1016/j.compscitech.2023.110236.
34 Ferreira, E. H. C., Lima, L. P., & Fechine, G. J. M. (2020). The “superlubricity state” of carbonaceous fillers on polymer composites. Macromolecular Chemistry and Physics, 221(16), 2000192 http://doi.org/10.1002/macp.202000192
35 Ferreira, E. H. C., Andrade, R. J. E., & Fechine, G. J. M. (2019). The “superlubricity state” of carbonaceous fillers on polyethylenebased composites in a molten state. Macromolecules, 52(24), 9620-9631 http://doi.org/10.1021/acs.macromol.9b01746
36 Joynal Abedin, F. N., Hamid, H. A., Alkarkhi, A. F. M., Amr, S. S. A., Khalil, N. A., Ahmad Yahaya, A. N., Hossain, M. S., Hassan, A., & Zulkifli, M. (2021). The effect of graphene oxide and SEBS-g-MAH compatibilizer on mechanical and thermal properties of acrylonitrile-butadiene-styrene/talc composite. Polymers, 13(18), 3180 http://doi.org/10.3390/ polym13183180 PMid:34578081.
37 Campo, E. A. (2008). Polymeric materials and properties. In E. A. Campo (Ed.), Selection of polymeric materials: How to select design properties from different standards (pp. 1-39). USA: William Andrew http://doi.org/10.1016/B978-0815515517.50003-6
38 Hwang, D., Lee, S. G., & Cho, D. (2021). Dual-sizing effects of carbon fiber on the thermal, mechanical, and impact properties of carbon fiber/ABS composites. Polymers, 13(14), 2298 http://doi.org/10.3390/polym13142298 PMid:34301055.
39. Mazzucco, M. L. C., Marchesin, M. S., Fernandes, E. G., Costa, R. A., Marini, J., Bretas, R. E. S., & Bartoli, J. R. (2016). Nanocomposites of acrylonitrile-butadiene-styrene/
Polímeros, 35(2), e20250013, 2025
Recovery of the post-industrial recycled ABS thermomechanical properties by adding graphene oxide
montmorillonite/styrene block copolymers: structural, rheological, mechanical and flammability studies on the effect of organoclays and compatibilizers using statistically designed experiments. Journal of Composite Materials, 50(6), 771-782 http://doi.org/10.1177/0021998315581509
40 Braga, N. F., Passador, F. R., Saito, E., & Cristovan, F. H. (2019). Effect of graphite content on the mechanical properties of acrylonitrile-butadiene-styrene (ABS). Macromolecular Symposia, 383(1), 1800018 http://doi.org/10.1002/masy.201800018
41 Liang, J.-Z. (2019). Impact fracture behavior and morphology of polypropylene/graphene nanoplatelets composites. Polymer Composites, 40(S1), E511-E516 http://doi.org/10.1002/ pc.24826
42 Morales-Zamudio, L., Lozano, T., Caballero-Briones, F., Zamudio, M. A. M., Angeles-San Martin, M. E., de Lira-Gomez, P., Martinez-Colunga, G., Rodriguez-Gonzalez, F., Neira, G., & Sanchez-Valdes, S. (2021). Structure and mechanical properties of graphene oxide-reinforced polycarbonate. Materials Chemistry and Physics, 261, 124180. http://doi.org/10.1016/j. matchemphys.2020.124180
43 Sabet, M. (2023). The impact of graphene oxide on the mechanical and thermal strength properties of polycarbonate. Journal of Elastomers and Plastics, 55(4), 511-525 http://doi. org/10.1177/00952443231160236
44 Jyoti, J., Singh, B. P., Arya, A. K., & Dhakate, S. R. (2016). Dynamic mechanical properties of multiwall carbon nanotube reinforced ABS composites and their correlation with entanglement density, adhesion, reinforcement and C factor. RSC Advances, 6(5), 3997-4006 http://doi.org/10.1039/C5RA25561A
45. Münstedt, H. (1981). Rheology of rubber‐modified polymer melts. Polymer Engineering and Science, 21(5), 259-270 http://doi.org/10.1002/pen.760210503
46 Sanchez, L. C., Beatrice, C. A. G., Lotti, C., Marini, J., Bettini, S. H. P., & Costa, L. C. (2019). Rheological approach for an additive manufacturing printer based on material extrusion.
International Journal of Advanced Manufacturing Technology, 105(5), 2403-2414 http://doi.org/10.1007/s00170-019-04376-9
47 Münstedt, H. (2021). Rheological measurements and structural analysis of polymeric materials. Polymers, 13(7), 1123 http:// doi.org/10.3390/polym13071123 PMid:33915989.
48 Huang, C., Qian, X., & Yang, R. (2018). Thermal conductivity of polymers and polymer nanocomposites. Materials Science and Engineering R Reports, 132, 1-22 http://doi.org/10.1016/j. mser.2018.06.002
49 Zhao, H.-Y., Yu, M.-Y., Liu, J., Li, X., Min, P., & Yu, Z.-Z. (2022). Efficient preconstruction of three-dimensional graphene networks for thermally conductive polymer composites. Nanomicro Letters, 14, 129 http://doi.org/10.1007/s40820022-00878-6
50 Chen, J., & Li, L. (2020). Effect of oxidation degree on the thermal properties of graphene oxide. Journal of Materials Research and Technology, 9(6), 13740-13748 http://doi. org/10.1016/j.jmrt.2020.09.092
51 Li, A., Zhang, C., & Zhang, Y.-F. (2017). Thermal conductivity of graphene-polymer composites: mechanisms, properties, and applications. Polymers, 9(9), 437 http://doi.org/10.3390/ polym9090437 PMid:30965752.
52 Wang, J., Li, C., Li, J., Weng, G. J., & Su, Y. (2021). A multiscale study of the filler-size and temperature dependence of the thermal conductivity of graphene-polymer nanocomposites. Carbon, 175, 259-270 http://doi.org/10.1016/j.carbon.2020.12.086
53 Santos, W. N., Sousa, J. A., & Gregorio, R., Jr. (2013). Thermal conductivity behaviour of polymers around glass transition and crystalline melting temperatures. Polymer Testing, 32(5), 987-994 http://doi.org/10.1016/j.polymertesting.2013.05.007
Received: July 31, 2024
Revised: Nov. 20, 2024 Accepted: Jan. 07, 2025
Renata Zorzetto1* , Flávia Pires Peña2 , Aline Cláudio de Oliveira1 , Jayme de Castilhos Ferreira Neto1 , Gabriel Tardin Mota Hilario1 , Fernanda Teresa Bovi Frozza3 , Marvin Paulo Lins3 , Fernanda Poletto4 ,
Marcelo Jung Eberhardt4 , Pedro Roosevelt Torres Romão5 , Tanira Alessandra Silveira Aguirre2 and Luiz Carlos Rodrigues Junior1
1Laboratório de Imunovirologia, Universidade Federal de Ciências da Saúde de Porto Alegre – UFCSPA, Porto Alegre, RS, Brasil
2Laboratório de Farmacociências, Universidade Federal de Ciências da Saúde de Porto Alegre – UFCSPA, Porto Alegre, RS, Brasil
3Laboratório de Imunoterapia, Universidade Federal de Ciências da Saúde de Porto Alegre – UFCSPA, Porto Alegre, RS, Brasil
4Programa de Pós-graduação em Química, Instituto de Química, Universidade Federal do Rio Grande do Sul – UFRGS, Porto Alegre, RS, Brasil
5Laboratório de Imunologia Celular, Universidade Federal de Ciências da Saúde de Porto Alegre – UFCSPA, Porto Alegre, RS, Brasil *renata.zorzetto90@gmail.com
Obstract
This study aimed to investigate the therapeutic potential of a nanoparticle formulation containing the immunodominant peptide SSIEFARL from Herpes simplex virus 2 glycoprotein B A against genital herpes. A nanoparticle formulation (NanoSSIEFARL) was engineered and characterized for its physicochemical and immunomodulatory properties. NanoSSIEFARL displayed mean particle size of 212 ± 5 nm, polydispersity index of 0.12 ± 0.01 and zeta potential of -7.4 ± 2.5 mV, exhibiting spherical morphology. pH stability remained consistent over 30 days (day 0: 4.5 ± 0.5; day 30: 5.0 ± 0.5). A novel high-performance liquid chromatography method was validated for SSIEFARL quantification. Peptide association efficiency reached 98.3% ± 2.1, with 41.6% ± 4.4 peptide release from nanoparticles after 4 hours. Cytotoxicity assessment revealed cellular viability exceeding 90%, with macrophage uptake observed after 4 hours. Altogether, these results suggest that NanoSSIEFARL is a promising candidate for effective immunotherapy against genital herpes.
Keywords: babassu oil, genital herpes, HPLC, polymeric nanoparticle.
How to cite: Zorzetto, R., Peña, F. P., Oliveira, A. C., Ferreira Neto, J. C., Hilario, G. T. M., Frozza, F. T. B., Lins, M. P., Poletto, F., Eberhardt, M. J., Romão, P. R. T., Aguirre, T. A. S., & Rodrigues Junior, L. C. (2025). NanoSSIEFARL polymeric nanoparticles-based immunotherapeutic for the treatment of genital herpes. Polímeros: Ciência e Tecnologia, 35(2), e20250014. https://doi.org/10.1590/0104-1428.20240042.
Herpes simplex virus types 1 and 2 (HSV-1, HSV-2) cause oral and genital herpes, respectively[1,2], yet both types can infect both regions. According to the World Health Organization (WHO), it is estimated that 3.7 billion people under the age of 50 are infected with HSV-1 (67%), and 491 million between the ages of 15 and 49 are infected with HSV-2 (13%)[3]. HSVs can establish a latent infection in neural ganglia and, upon reactivation, can cause recurrent episodes of oral and/or genital ulcers called cold sores. According to WHO, recurrence of genital herpes affects millions worldwide, causing ongoing discomfort and emotional distress while posing significant challenges for both individuals and public health systems. Latency is controlled
by CD4+ helper T lymphocytes and CD8+ cytotoxic T lymphocytes that keep juxtaposed to the nerve sheath[4-6] In mice, most of these HSV-specific CD8+ T lymphocytes are against the immunodominant peptide SSIEFARL in the viral glycoprotein B[7]. The immunodominant peptide SSIEFARL shows great potential for herpes treatment, as demonstrated by its influence on the repertoire of virus-specific CD8+ T cells[7,8]. Studies reveal that the presence of this immunodominant epitope not only shapes the CD8+ T cell repertoire in murine models but also affects the hierarchy and functionality of subdominant cells, enhancing the efficacy of the immune response against the virus. Additionally, the priming dynamics of virus-specific CD8+ T cells and
Zorzetto, R., Peña, F. P., Oliveira, A. C., Ferreira Neto, J. C., Hilario, G. T. M., Frozza, F. T. B., Lins, M. P., Poletto, F., Eberhardt, M. J., Romão, P. R. T., Aguirre, T. A. S., & Rodrigues Junior, L. C.
latent retention in ganglia are modulated by this epitope, suggesting that manipulating the immune response around SSIEFARL could provide a promising strategy for controlling and potentially eradicating herpes simplex infection[8,9]. Therefore, SSIEFARL could be a promising candidate for vaccines or immunotherapy against HSVs[9,10], since there are no approved vaccines, and the treatment against HSVs includes antiviral drugs such as Aciclovir™, which has been widely associated with drug resistance[11-13]
Although SSIEFARL is a potent peptide for the induction of specific CD8+ T response[14] and protection in a herpes murine model[15], it is a small biomolecule, and it cannot be applied freely to the genital mucosa due to possible degradation. Thus, developing a nanoparticle containing SSIEFARL may be crucial for a safe and efficient release of the peptide into the mucosa for studies of immunogenicity/ vaccination-challenge and evaluation of protection.
Polymeric nanoparticles are colloidal systems that include nanospheres and nanocapsules, depending on their structure and organization. Nanocapsules are composed of an oily core surrounded by a polymeric envelope, in which drugs or molecules can be dissolved inside the core or entrapped in the polymeric membrane[16,17]. Poly(ε-caprolactone) (PCL) is a biodegradable polymer hydrolyzed in physiological conditions in the human body and has called the attention of drug delivery since it can modulate degradation kinetics and release profiles[18]. Besides the polymer, the core of some nanoparticles are formed by lipophilic substances chosen following criteria such as drug solubility, absence of toxicity, low risk of polymer degradation, and low oil solubility within the polymer or vice-versa[19]. Medium-chain triglycerides (MCT), such as capric/caprylic triglycerides, are commonly used as lipophilic cores of nanocapsules[20]
Nanoparticles with a babassu oil core (BBS) are relatively novel. While BBS-based microemulsions have been tested as a delivery system, our group pioneered the development of polymeric nanoparticles containing poly (ε-caprolactone) and babassu oil for hydrophilic molecule delivery[21]. Babassu belongs to the family Arecaceae (Palmae) and genera Orbignya and Attalea, most commonly found in northern and northeastern Brazil. It is extracted from babassu coconuts, offers various medical benefits and is rich in fatty acids[22]. It has been traditionally used for skin care and has shown antitumor and anti-inflammatory properties[22-24], and babassu extraction is a significant income source in Maranhão, promoting sustainable livelihoods[25]. A recent study showed that the HLB of BBS is 11.5[26]. This high HLB value facilitates interactions with polar molecules. Considering its physicochemical properties, as well as its natural, renewable, and sustainable characteristics, BBS was selected as the core material for nanoparticles designed to incorporate hydrophilic drugs[21], therefore we aim to demonstrate its capability to encapsulate smaller polar biomolecules like the HSV peptide SSIEFARL.
Nanoparticles offer tailored delivery for antigens and immunomodulatory agents in mucosal immunotherapy[27], showing effectiveness in experimental models, suggesting potential for preventive and therapeutic strategies against genital infections[28]. For effective local delivery to oral and/or genital mucosa, nanoparticles should ideally be in the 100-500
nm size range, exhibit positive or neutral surface charges to improve adhesion while avoiding excessive irritation, and possess surface characteristics that enhance mucoadhesion and drug release. Even though PCL nanoparticles have a negative surface charge, they have already been widely described for mucosal application[28]. Careful optimization of these parameters is essential to maximize the therapeutic efficacy and safety of nanoparticle-based delivery systems. However, to ensure feasibility, the nanocarrier must be noncytotoxic, have reasonable pharmaceutical loading capability and targeting, and feature controlled release[29,30]. This study aims to develop and characterize a nanostructured system containing the peptide SSIEFARL, alongside validating a specific HPLC methodology for peptide quantification. This is the first attempt to describe a polymeric nanoparticle delivery system using babassu oil to encapsulate a peptide for use in murine models genital mucosa and validate a quantification methodology for SSIEFARL using HPLC.
2.1 Materials
Babassu oil (Orbignya oleifera, Mundo dos Óleos™, Brasília, Brazil), poly(ε-caprolactone) (Sigma-Aldrich™, São Paulo, Brazil), SSIEFARL (MW: 922.03 g/mol) (GenScript™, New Jersey, USA), medium-chain triglycerides (capric and caprylic acids, Delaware™, Porto Alegre, Brazil), polysorbate 80 (Tween™ 80, Sigma-Aldrich, São Paulo, Brazil), acetone (Neon™, Suzano, Brazil), ethanol (Dinâmica™, Indaiatuba, Brazil), acetonitrile (ACN) (Neon™, Suzano, Brazil) and trifluoracetic acid (TFA) (Sigma-Aldrich™, São Paulo, Brazil). Babassu oil study was registered at SisGen (identification ABCECDB) and its composition was described by Oliveira et al.[21] SSIEFARL’s degree of purification was 97.43%, and the other reagents used were of analytical grade, while the ACN and TFA were of HPLC grade.
2.2.1 Development and validation of a high-performance liquid chromatography methodology
The experiments were performed on a Prominence UFLC chromatographic system (Shimadzu™, Barueri, Brazil) consisting of a binary pump (model: LC-20AT), online degasser (model: DGU-20A5), ALS autosampler (model: SIL-20A), column oven (model: CTO-20A), PDA detector (model: SPD-M20A) and communication module (model: CBM-20A). Shimadzu LC-Solution™ software was used for data collection. All spectra were collected for peak identification and peak purity calculations. Analysis was carried out at 214 nm with a Phenomenex Luna™ C18 (2), 3 μm, 250 mm × 4.6 mm, 100 Å column (Torrance, USA), and the column heater temperature was set to 40 ᵒC. The injection volume was 50 μL for each sample. Solvent A was formulated with ACN 0,1% (v/v) TFA, and Solvent B was prepared with ultrapure water (Milli-Q™) 0,1% (v/v) TFA. Both phases were degassed by sonication for 20 min. The solvent program was a gradient starting with 21% solvent A for at least 45 min to stabilize the equipment. The gradient program was 0.01-1 min = 21% A and 79%
NanoSSIEFARL polymeric nanoparticles-based immunotherapeutic for the treatment of genital herpes
B; 1-15 min = 45% A and 55% B; 15-17 min = 45% A and 55% B; 17-19 min = 21% A and 79% B; and 19-29 min = 21% A and 79% B. The last 10 min of each run were set for column stabilization before the following sample. The flow rate was set at 0.7 mL min-1
The method was subjected to partial validation to ensure the analytical procedure’s capability to quantify SSIEFARL. All stock solutions were freshly prepared by diluting SSIEFARL in ultrapure water at a concentration of 10 µg mL-1 at the test day. Working solutions were prepared using water as a diluent, unless otherwise stated. For the specificity test, 1 mL of nanoparticles without SSIEFARL (Blank NPs) was transferred to a volumetric flask of 5 mL and completed with the diluent. The sample was filtered using a 0.45 μm syringe filter (FILTRILO™, Colombo, Brazil), and then transferred to a vial. A comparison among chromatograms of Blank NPs and NanoSSIEFARL was performed. For linearity assessment, dilutions were prepared in different concentrations (0.25, 0.50, 1.0, 2.5, and 5.0 µg mL-1) from a stock solution. A second linearity test was performed at the same concentrations using the release buffer (acetate buffer pH 4.5) as the diluent.
Intra-day precision (repeatability) was evaluated at a concentration of 1 µg mL-1 of SSIEFARL from six samples prepared by the same analyst on the same day. Inter-day precision (intermediate precision) was evaluated by comparing six determinations of SSIEFARL in two consecutive days. Precision was given as the relative standard deviation (RSD %). To assess robustness, the peptide SSIEFARL was diluted in ultrapure water at a final concentration of 1 µg mL-1 and analyzed by HPLC using mobile phases at a deliberated modified acid concentration (0.08% TFA). The detection limit (DL) and the quantitation limit (QL) were calculated using the standard deviation of y-intercepts of regression lines obtained for SSIEFARL in water multiplied by 3.3 and by 10, respectively and divided by the slope estimated from the calibration curve. SSIEFARL solution stability was investigated after a month of storage at -80 ± 1 °C. Every experiment was performed in triplicate.
The preparation of nanoparticles containing babassu oil was carried out according to Oliveira et al.[21] through interfacial polymer deposition. Briefly, to obtain the organic phase, the following reagents were dissolved in 2.5 mL of acetone and 6.75 mL of ethanol at 40 °C: 18 mg of BBS, 50 mg of PCL (14 kDa MW), and 80 μL of MCT. At the last minute of solubilization, 200 μL of an aqueous solution of SSIEFARL at a concentration of 1 mg mL-1 was injected into the stirring organic phase. The aqueous phase comprised 32.6 mg of polysorbate 80 in 26.2 mL ultrapure water. The procedure for obtaining the nanoparticles was conducted in a water bath at 40 °C by injecting the organic phase into the aqueous phase under magnetic stirring for 10 min. The ethanol and acetone were then evaporated under rotary evaporation, and the final volume was adjusted to 10 mL at a final peptide concentration of 20 μg mL-1. This concentration was based on previous tests, which were performed to establish the optimal peptide quantity to be encapsulated. The same protocol was carried out without adding the peptide SSIEFARL to produce the Blank NPs as a control vehicle. Fluorescent-
labeled polymeric nanocapsules (NanoSSIEFARLRh) at a final peptide concentration of 20 µg mL-1 were prepared in the same way; however, the total amount of PCL was replaced by PCL marked with rhodamine B, which was obtained as described by Poletto et al[29].
2.2.3 Physicochemical characterization of the polymeric nanoparticles
For each batch, the volume-weighted mean diameter (d4,3) and the polydispersity index (Span) were assessed using laser diffraction (Mastersizer™ 2000, Malvern, UK). Formulations were diluted using 20 µL of nanoparticles and 10 mL of ultrapure water, and the minimal obscuration index used was 1%. The same dilution was used to verify the z-average (mean diameters), polydispersity index (PDI) by dynamic light scattering using backscatter detection at 173º, and to obtain the zeta potential by electrophoretic mobility using Zetasizer™ nano-ZS ZEN 3600 (Nanoseries™, Malvern, UK), 20 µL of nanoparticles were diluted with 10 mL of NaCl 10 mM. The pH was determined by a potentiometer PH2600 (Instrutherm™, São Paulo, Brazil). To determine the association efficiency (AE %) of the peptide SSIEFARL into the nanoparticles, the ultrafiltrationcentrifugation method was carried out using centrifugal filter units of 10 kDa (Millipore™, Cork, Ireland). Three hundred and fifty microliters (350 μL) of the nanoparticles were centrifuged at 3000 rpm for 10 min twice and then at 3500 rpm for another 10 min. The ultrafiltrate was diluted in ultrapure water (1:20) and then transferred into inserts to be analyzed by HPLC. The association efficiency percentage was determined by dividing the difference between the total added peptide concentration (20 µg mL-1) and the concentration of free peptide in the ultrafiltrate for the total added peptide concentration and multiplying this result by 100. Regarding stability, both NanoSSIEFARL and Blank NPs were maintained at 2-8 °C for 30 days to compare the pH, association efficiency, particle size, polydispersity index, and zeta potential with day 0. Transmission electron microscopy (TEM) (Tecnai™ G2-12, SpiritBiotwin FEI, 120 kV operating at 80 kV, Jülich, Germany) of NanoSSIEFARL was used to evaluate nanoparticle morphology. The formulations were diluted in ultrapure water (5x), deposited on a 400-mesh Formvar carbon film-coated copper grid, and stained with 2% (w/v) uranyl acetate aqueous solution. Measurements were performed using three different batches for each formulation.
2.2.4 Release profile of SSIEFARL from polymeric nanoparticles
The release profile experiments were conducted using acetate buffer pH 4.5 (2.26 g of sodium acetate trihydrate + 1.91 mL acetic acid diluted in 1 L of ultrapure water). Controls were carried out by diluting the peptide SSIEFARL in ultrapure water at a final concentration of 20 μg mL-1 . For the experiment, each beaker contained 51 mL of buffer and 3 mL of NanoSSIEFARL (n = 4 different batches) or control (n = 5 different dilutions) inside a modified cellulose membrane (average flat width of 25 mm and 14 kDa cut-off, Sigma-Aldrich™, Darmstadt, Germany), which was closed with magnetic closures (Spectra/Por™ Closures, Spectrum Laboratories, Inc., New Jersey, USA). The system was placed under stirring at 37 °C and, at specific time points (0.33, 0.5, 0.75, 1, 2, 4, 6, 8, and 24 h), 1 mL of samples were
Zorzetto, R., Peña, F. P., Oliveira, A. C., Ferreira Neto, J. C., Hilario, G. T. M., Frozza, F. T. B., Lins, M. P., Poletto, F., Eberhardt, M. J., Romão, P. R. T., Aguirre, T. A. S., & Rodrigues Junior, L. C.
collected and filtered using 0.45 μm filters. Free media was replaced at the same volume each time. All the samples were then analyzed by HPLC using the validated methodology.
2.2.5 Cell viability assay
Cell viability was assessed by flow cytometry using a viability dye. Briefly, 96-well plates were incubated with 1x10⁵ J774.A1 macrophages in Dulbecco’s Modified Eagle Medium (DMEM, Sigma-Aldrich™, Darmstadt, Germany) low supplemented with 10% fetal bovine serum (FBS, SigmaAldrich™, Darmstadt, Germany). The next day, different percentages of SSIEFARL 20 μg mL-1, NanoSSIEFARL 20 μg mL-1 and, Blank NPs were added into the wells (15, 30, and 60%) in triplicate for each batch and concentration, as well as 60% of ethanol 70% as death control; negative control was set by cells in culture medium, only. After 24 h of incubation at 37º C, cells were transferred to a cytometry tube, rinsed with 200 μL of phosphate-buffered saline (PBS), centrifuged at 1500 rpm for 5 min, and then marked with 200 μL of viability dye and incubated for 20 min at room temperature, protected from light. After, cells were centrifuged for 5 min at 1500 rpm, washed twice with 200 μL of PBS, and analyzed by flow cytometry on FACSCanto™ II (BD Biosciences, Franklin Lakes, USA).
2.2.6 Phagocytosis assay
J774.A1 macrophages were seeded at a density of 5x10⁵ cells/well in a 24-well plate with 500 µL of DMEM low culture medium containing Penicillin-Streptomycin (Sigma-Aldrich™, Darmstadt, Germany), Amphotericin B (Sigma-Aldrich™, Darmstadt, Germany), and supplemented with 10% FBS. After 24 h, cells were incubated with DMEM without PenicillinStreptomycin, Amphotericin B, and FBS, in which cells in DMEM (negative control); DMEM with SSIEFARL 60% (v/v); DMEM with Blank NPs 60% (v/v) or DMEM with NanoSSIEFARLRh 60% (v/v) for 4 h at 37 °C. Cell fixation was performed with 300 µL of PBS 1% paraformaldehyde for 10 min at room temperature. Cells were then washed with PBS and incubated with 300 µL of PBS 0.5% Triton™ X-100 (Neon™, Suzano, Brazil) for 20 min at room temperature. After, cells were incubated with Phalloidin Alexa Fluor 488 (Sigma-Aldrich™, Darmstadt, Germany) diluted in PBS 0.5% Triton™ X-100 for 30 min at room temperature. Nuclei staining was performed by adding 200 µL of DAPI (4’, 6-diamidino-2’phenylindole, dihydrochloride) (Sigma-Aldrich™, Darmstadt, Germany) diluted with PBS at a final concentration of 1 µg mL-1 for 10 min at room temperature. The samples were washed thoroughly with PBS twice for 5 min to remove all excess dye. The images were analyzed on EVOS FL Auto 2 Imaging Microscope (Invitrogen™, Carlsbad, USA).
2.2.7 Statistical analysis
Data were analyzed by GraphPad™ Prism version 9.0.0 (La Jolla, USA), and FlowJo™ Software (BD Biosciences, Franklin Lakes, USA). The results are presented as the mean ± standard error of the mean (SEM) or mean ± standard deviation (SD). Student’s t-test and ANOVA were also performed.
3.1 Development and validation of a high-performance liquid chromatography methodology
Our group has already developed a specific HPLC methodology with fluorescent quantification of SSIEFARL (MW: 922.03 g/mol)[30]. However, here we have described a novel nanoparticle that is constituted by different raw materials, including a different polymer. Therefore, we developed and partially validated a methodology according to the International Conference on Harmonization of Technical Requirements for Pharmaceuticals for Human Use (ICH) [31] and RDC Nº 166/ 2017 from ANVISA[32]considering the following parameters: selectivity, linearity, precision, robustness, limit of detection, and limit of quantification. The first step was to select and optimize the chromatographic conditions to quantify SSIEFARL by HPLC-DAD. We initiated with traditional parameters for peptide analysis testing C18 reverse phase columns, different gradient programs using ACN plus TFA and water plus TFA as mobile phases, and wavelengths at which the peptide showed absorption. The final methodology results showed no interference at SSIEFARL’s retention time (14.0 ± 0.5 min) from the other formulation components. Therefore, it was possible to confirm the selectivity of the HPLC methodology. The linearity of our HPLC methodology was performed for three individual curves using water or acetate buffer pH 4.5 as diluent. A linear relationship between peak area and concentration of SSIEFARL was observed between 0.25 and 5.0 µg mL-1 A 2D graph where y is the peak area and x is the standard solution concentration at μg mL-1 was plotted for each curve, and the linear equation obtained by the least square method for SSIEFARL in water was y = 17792x - 403.69 and for SSIEFARL in pH 4.5 buffer was y = 19379x - 1139.10. The coefficient of determination obtained (r2) was 0.9997 and 0.9999, respectively, for water and buffer, which makes it possible to conclude that the proposed method is linear. In general, r2 values near 1 indicate linearity[33]
Regarding precision, repeatability (intra-day), and intermediate precision (inter-day), the results are shown in Table 1. Accuracy may be inferred, since the method showed precision, linearity, and specificity[31]
NanoSSIEFARL polymeric nanoparticles-based immunotherapeutic for the treatment of genital herpes
The influence of variations in mobile phase composition was used as a parameter to investigate robustness[34]. After some tests, the RSD (%) determined for samples at a concentration of 1 µg mL-1 on the same day with the correct mobile phase (0.1% TFA) and modified mobile phase (0.08%) was 4.7%. Since the RSD values did not exceed 5%, the proposed HPLC methodology can be considered robust for SSIEFARL[35]
The detection limit of the method was calculated as 0.063 ± 0.008 µg mL-1, and the quantitation limit was calculated as 0.190 ± 0.020 µg mL-1. Therefore, the range at which the developed HPLC methodology provides an acceptable degree of linearity, accuracy and precision was determined as 0.2 to 5.0 µg mL-1
The nanoparticle formulations were prepared as previously described[21]. The average particle size of NanoSSIEFARL and Blank NPs obtained with laser diffraction (Figure 1a) and DLS (Figure 1b), the polydispersity indexes, zeta potential and pH values are discriminated in Table 2. The image obtained with transmission electron microscopy (Figure 1c) showed a spherical nanoparticle with approximately 200 nm for NanoSSIEFARL, similar to nanoparticles without peptide. The evaluated parameters did not show significant changes after 30 days at 2-8 °C, indicating that the nanoparticles have good stability and can be used in in vitro experiments. Nanoparticles produced using the polymer’s interfacial deposition method have a mean diameter of 200-300 nm[36], consistent with the size of NanoSSIEFARL. Blank nanoparticles have a mean diameter of 179-190 nm, with no significant statistical difference observed when comparing them to NanoSSIEFARL. Overall, statistical analysis indicates similarities in mean diameters, PDI and Span values, zeta potentials, and pH values between formulations with or without SSIEFARL (p > 0.05), therefore concluding that NanoSSIEFARL showed all the characteristics of a polymeric nanoparticle.
Regarding the nanoparticle nucleus, we have previously shown that babassu oil allows the encapsulation of substances with hydrophilic characteristics[21], but these particles were used here for the first time to associate a biomolecule. A novel HPLC methodology was also used to determine the association efficiency of the peptide SSIEFARL to the nanoparticles following centrifugation-ultrafiltration, which showed the % AE of 98.3 ± 2.1%. Usually, the lipid core in polymeric nanoparticles plays a crucial role in delivering therapeutic agents, providing a conducive environment for the efficient encapsulation of hydrophobic drugs. Nevertheless, using this same principle, but employing an oil with elevated required HLB, we were able to associate SSIEFARL with polymeric nanoparticles.
Advances in peptide encapsulation show promise, yet challenges remain in optimizing formulations for different peptides and ensuring stability. Nanoparticles protect peptides, enhance absorption, and improve therapeutic efficacy[37-39] Various polymeric nanosystems serve as effective peptide carriers, including chitosan- and dextran-based nanoparticles, PLGA nanocarriers, and PCL-based nanoparticles[37,40-44]

Figure 1. (a) Typical particle size distribution of NanoSSIEFARL and Blank NPs obtained with laser diffraction; (b) Typical particle size distribution of NanoSSIEFARL and Blank NPs using the CONTIN algorithm from DLS measurements; (c) Transmission electron microscopy image of a NanoSSIEFARL particle stained with uranyl acetate (magnification = 100.000x, scale bar = 200nm).
3.3 SSIEFARL’s release profile in the nanoparticle system
The release was carried at pH 4.5 to mimic the infected HSV genital mucosa. The amount of SSIEFARL released from the nanoparticles was 41.6% ± 4.4 at 4 hours and 63.0% ± 6.9 at 24 hours of the theoretical amount incorporated (20 μg mL-1). In contrast, the control (SSIEFARL in ultrapure water) exhibited a faster release rate, with 57.6% ± 3.3 released at 4 hours and 84.7% ± 1.8 at 24 hours (Figure 2). This difference may be attributed to the presence of SSIEFARL still within the nanoparticles or at the interface between the particles and the dispersant medium inside the cellulose bag. As a result, diffusion processes are required to release SSIEFARL into the medium, making the release from the nanoparticles slower compared to the control.
Zorzetto, R.,
Peña,
F. P.,
Oliveira, A. C., Ferreira Neto, J. C., Hilario, G. T. M., Frozza, F. T. B., Lins, M. P., Poletto, F., Eberhardt, M. J., Romão, P. R. T., Aguirre, T. A. S., & Rodrigues Junior, L. C.
Table 2. Mean size (d[4,3]; z-average), polydispersity (Span), polydispersity index (PDI) and zeta potential of Blank NPs and NanoSSIEFARL.
Results expressed as mean ± standard deviation (n = 3).

Figure 2. Cumulative release percentage of NanoSSIEFARL in comparison to control (SSIEFARL in ultrapure water) throughout time. Data are expressed as mean ± SD (n = 4-5).
Our group was the first to study the association of the immunodominant peptide SSIEFARL, derived from viral glycoprotein B of HSV2, to polymeric nanoparticles[30] However, this earlier system showed only 4.9% SSIEFARL association with the nanoparticle and 25% drug release after 24 h[30]. Here, our data showed that the release of the peptide from the nanoparticle formulation (NanoSSIEFARL) was found to be lower in comparison to the control solution, indicating that the nanoparticles effectively function as a protective carrier. This mechanism allows for the intact delivery of the peptide, thereby enhancing its therapeutic efficacy. While the release profile can be characterized as both controlled and prolonged, it is crucial to highlight that the primary role of the nanoparticle system is to safeguard the peptide. The controlled release is driven by the diffusion processes of the peptide through the nanoparticle matrix, while the prolonged release minimizes the risk of a burst effect - a phenomenon often observed with conventional dosage forms, such as tablets, where the drug is released in a single rapid discharge. Additionally, the observed similarity in release profiles between the nanoparticle formulation and the control solution suggests that the peptide undergoes no significant chemical alterations during the release process, thereby ensuring the retention of its therapeutic properties. This dual function of protection and sustained release positions NanoSSIEFARL as a promising candidate for enhancing the delivery and efficacy of therapeutic peptides. Furthermore, this finding is relevant considering that dendritic cells and macrophages are expected to take up nanoparticles, which usually need 3 to 4 h to occur[45,46], and that the peptide antigenic presentation can induce a specific immune response.
3.4 NanoSSIEFARL is non-cytotoxic and efficiently phagocytosed by macrophages in vitro
Before testing whether macrophages phagocytize NanoSSIEFARL, cytotoxicity was evaluated by flow cytometry. Cells were incubated with alcohol (negative control), medium, and different concentrations of SSIEFARL, Blank NPs, or NanoSSIEFARL, and the viability was evaluated by AmCyan A staining as illustrated in Figure 3a It was observed that the macrophages viability was not inhibited by the treatments with Blank NPs, SSIEFARL or NanoSSIEFARL (Figure 3b). To evaluate the nanoparticle effect on cells of interest, cytotoxicity must be assessed with cells representing the exposure route[47]. Thus, we used J774.A1 macrophages since macrophages are one of the first cells to recognize and uptake nanoparticles after topical application, and because it is an important antigenpresenting cell (APC) for T cell activation[47]
NanoSSIEFARL Rhodamine B (NanoSSIEFARLRh) was used at a final concentration of 12 μg mL-1 (60% v/v) per well to perform the phagocytosis assay. This formulation was characterized in terms of size and presented no statistical difference to NanoSSIEFARL particles. Figure 3c shows macrophages without any treatment (negative control) or treated with SSIEFARL Rhodamine B (SSIEFARLRh). As can be observed, SSIEFARL itself, marked with Rhodamine B, was not uptaken. Since it is a small peptide, it probably suffered degradation without nanoencapsulation and, therefore, does not show fluorescence. Figure 3d shows macrophages incubated with NanoSSIEFARLRh, and red arrows indicate the phagocytosis of NanoSSIEFARLRh.
NanoSSIEFARL polymeric nanoparticles-based immunotherapeutic for the treatment of genital herpes

Figure 3. Cell viability and phagocytosis of NanoSSIEFARLRh by J774.A1 macrophages: (a) Gating strategy with AmCyan A to characterize live and dead cells; (b) Percentage of viable cells in all groups. Data shown are for mean ± SD (n=3); (c) J774.A1 macrophages untreated and treated with SSIEFARLRh; (d) J774.A1 macrophages treated with NanoSSIEFARLRh. Groups were marked with DAPI (blue, nuclei dye), Phalloidin Alexa Fluor 488 (green, cytoskeleton dye), Rhodamine B (red), and MERGE. Red arrows indicate nanoparticle uptake by macrophages. (Magnification 200x).
Here, we showed the production and characterization of a polymeric nanoparticle containing babassu oil with a high association efficiency of SSIEFARL. NanoSSIEFARL exhibited spherical morphology with a diameter of approximately 200 nm. pH stability was maintained over a month. Nanoparticles presented adequate characteristics in terms of size, homogeneity, and stability, and a specific HPLC methodology to quantify the peptide was developed, showing parameters according to the required legislation. Nanoparticles were safe to J774.A1 macrophages and were phagocytosed by them after 4 hours. In conclusion, NanoSSIEFARL showed promising results, suggesting that it may be a strong candidate for further research into new treatments for genital herpes.
5. Author’s Contribution
• Conceptualization – Renata Zorzetto; Tanira Alessandra Silveira Aguirre; Luiz Carlos Rodrigues Junior.
• Data curation – Renata Zorzetto; Tanira Alessandra Silveira Aguirre; Luiz Carlos Rodrigues Junior.
• Formal analysis – Renata Zorzetto; Flávia Pires Peña; Gabriel Tardin Mota Hilario; Aline Cláudio de Oliveira; Jayme de Castilhos Ferreira Neto.
• Funding acquisition – NA.
• Investigation – Renata Zorzetto; Flávia Pires Peña; Gabriel Tardin Mota Hilario; Aline Cláudio de Oliveira; Jayme de Castilhos Ferreira Neto.
• Methodology – Renata Zorzetto; Flávia Pires Peña; Gabriel Tardin Mota Hilario; Aline Cláudio de Oliveira; Fernanda Teresa Bovi Frozza; Marvin Paulo Lins; Fernanda Poletto; Marcelo Jung Eberhardt; Tanira Alessandra Silveira Aguirre; Luiz Carlos Rodrigues Junior.
• Project administration – Renata Zorzetto; Tanira Alessandra Silveira Aguirre; Luiz Carlos Rodrigues Junior.
Zorzetto, R., Peña, F. P., Oliveira, A. C., Ferreira Neto, J. C., Hilario, G. T. M., Frozza, F. T. B., Lins, M. P., Poletto, F., Eberhardt, M. J., Romão, P. R. T., Aguirre, T. A. S., & Rodrigues Junior, L. C.
• Resources – Fernanda Poletto; Pedro Roosevelt Torres Romão; Tanira Alessandra Silveira Aguirre; Luiz Carlos Rodrigues Junior.
• Software – NA.
• Supervision – Renata Zorzetto; Tanira Alessandra Silveira Aguirre; Luiz Carlos Rodrigues Junior.
• Validation – Renata Zorzetto; Flávia Pires Peña; Tanira Alessandra Silveira Aguirre; Luiz Carlos Rodrigues Junior.
• Visualization – Renata Zorzetto; Tanira Alessandra Silveira Aguirre; Luiz Carlos Rodrigues Junior.
• Writing – original draft – Renata Zorzetto; Fernanda Poletto; Pedro Roosevelt Torres Romão; Tanira Alessandra Silveira Aguirre; Luiz Carlos Rodrigues Junior.
• Writing – review & editing – Renata Zorzetto; Tanira Alessandra Silveira Aguirre; Luiz Carlos Rodrigues Junior.
6. Acknowledgements
The authors are grateful to Coordenação de Aperfeiçoamento de Pessoal de Nível Superior (CAPES), Universidade Federal de Ciências da Saúde de Porto Alegre (UFCSPA), and Fundação de Amparo a Pesquisa no Rio Grande do Sul (FAPERGS).
7. References
1 Gupta, R., Warren, T., & Wald, A. (2007). Genital herpes. Lancet, 370(9605), 2127-2137 http://doi.org/10.1016/S01406736(07)61908-4. PMid:18156035.
2 Looker, K. J., & Garnett, G. P. (2005). A systematic review of the epidemiology and interaction of herpes simplex virus types 1 and 2. Sexually Transmitted Infections, 81(2), 103-107 http://doi.org/10.1136/sti.2004.012039 PMid:15800084.
3 Looker, K. J., Magaret, A. S., May, M. T., Turner, K. M. E., Vickerman, P., Gottlieb, S. L., & Newman, L. M. (2015). Global and regional estimates of prevalent and incident herpes simplex virus type 1 infections in 2012. PLoS One, 10(10), e0140765 http://doi.org/10.1371/journal.pone.0140765 PMid:26510007.
4 Perng, G. C., & Jones, C. (2010). Towards an understanding of the herpes simplex virus type 1 latency-reactivation cycle. Interdisciplinary Perspectives on Infectious Diseases, 2010, 262415 http://doi.org/10.1155/2010/262415 PMid:20169002.
5 Garner, J. A. (2003). Herpes simplex virion entry into and intracellular transport within mammalian cells. Advanced Drug Delivery Reviews, 55(11), 1497-1513 http://doi.org/10.1016/j. addr.2003.07.006 PMid:14597143.
6 Frank, G. M., Lepisto, A. J., Freeman, M. L., Sheridan, B. S., Cherpes, T. L., & Hendricks, R. L. (2010). Early CD4 + T cell help prevents partial CD8 + T cell exhaustion and promotes maintenance of herpes simplex virus 1 latency. Journal of Immunology, 184(1), 277-286. http://doi.org/10.4049/ jimmunol.0902373 PMid:19949087.
7 St. Leger, A. J., Peters, B., Sidney, J., Sette, A., & Hendricks, R. L. (2011). Defining the herpes simplex virus-specific CD8 + T cell repertoire in C57BL/6 mice. Journal of Immunology, 186(7), 3927-3933 http://doi.org/10.4049/jimmunol.1003735 PMid:21357536.
8 Treat, B. R., Bidula, S. M., Ramachandran, S., St Leger, A. J., Hendricks, R. L., & Kinchington, P. R. (2017). Influence of an immunodominant herpes simplex virus type 1 CD8+ T cell epitope on the target hierarchy and function of subdominant
CD8+ T cells. PLoS Pathogens, 13(12), e1006732 http://doi. org/10.1371/journal.ppat.1006732 PMid:29206240.
9 Treat, B. R., Bidula, S. M., St. Leger, A. J., Hendricks, R. L., & Kinchington, P. R. (2020). Herpes simplex virus 1-specific CD8+ T cell priming and latent ganglionic retention are shaped by viral epitope promoter kinetics. Journal of Virology, 94(5), e01193-19. http://doi.org/10.1128/JVI.01193-19. PMid:31826989.
10 Koelle, D. M., Dong, L., Jing, L., Laing, K. J., Zhu, J., Jin, L., Selke, S., Wald, A., Varon, D., Huang, M.-L., Johnston, C., Corey, L., & Posavad, C. (2022). HSV-2-specific human female reproductive tract tissue resident memory t cells recognize diverse HSV antigens. Frontiers in Immunology, 13, 867962 http://doi.org/10.3389/fimmu.2022.867962 PMid:35432373.
11 Reardon, J. E., & Spector, T. (1989). Herpes simplex virus type 1 DNA polymerase: mechanism of inhibition by acyclovir triphosphate. The Journal of Biological Chemistry, 264(13), 7405-7411 http://doi.org/10.1016/S0021-9258(18)83248-3 PMid:2540193.
12. Kost, R. G., Hill, E. L., Tigges, M., & Straus, S. E. (1993). Recurrent acyclovir-resistant genital herpes in an immunocompetent patient. The New England Journal of Medicine, 329(24), 1777-1782 http://doi.org/10.1056/NEJM199312093292405 PMid:8232486.
13 Kimberlin, D. W., Crumpacker, C. S., Straus, S. E., Biron, K. K., Drew, W. L., Hayden, F. G., McKinlay, M., Richman, D. D., & Whitley, R. J. (1995). Antiviral resistance in clinical practice. Antiviral Research, 26(4), 423-438. http://doi. org/10.1016/0166-3542(95)00031-G PMid:7574544.
14 Hanke, T., Graham, F. L., Rosenthal, K. L., & Johnson, D. C. (1991). Identification of an immunodominant cytotoxic T-lymphocyte recognition site gB of herpes simplex virus by using recombnant adenovirus vectors. Journal of Virology, 65(3), 1177-1186 http://doi.org/10.1128/jvi.65.3.1177-1186.1991 PMid:1847447.
15. Çuburu, N., Kim, R., Guittard, G. C., Thompson, C. D., Day, P. M., Hamm, D. E., Pang, Y.-Y. S., Graham, B. S., Lowy, D. R., & Schiller, J. T. (2019). A prime-pull-amplify vaccination strategy to maximize induction of circulating and genital-resident intraepithelial CD8 + memory T cells. Journal of Immunology, 202(4), 1250-1264 http://doi.org/10.4049/jimmunol.1800219 PMid:30635393.
16 Schaffazick, S. R., Guterres, S. S., Freitas, L. L., & Pohlmann, A. R. (2003). Caracterização e estabilidade físico-química de sistemas poliméricos nanoparticulados para administração de fármacos. Química Nova, 26(5), 726-737 http://doi.org/10.1590/ S0100-40422003000500017
17. Kumari, A., Yadav, S. K., & Yadav, S. C. (2010). Biodegradable polymeric nanoparticles based drug delivery systems. Colloids and Surfaces. B, Biointerfaces, 75(1), 1-18 http:// doi.org/10.1016/j.colsurfb.2009.09.001 PMid:19782542.
18. Woodruff, M. A., & Hutmacher, D. W. (2010). The return of a forgotten polymer: polycaprolactone in the 21st century. Progress in Polymer Science, 35(10), 1217-1256 http://doi. org/10.1016/j.progpolymsci.2010.04.002
19. Limayem Blouza, I., Charcosset, C., Sfar, S., & Fessi, H. (2006). Preparation and characterization of spironolactoneloaded nanocapsules for paediatric use. International Journal of Pharmaceutics, 325(1-2), 124-131 http://doi.org/10.1016/j. ijpharm.2006.06.022 PMid:16872764.
20 Fiel, L. A., Contri, R. V., Bica, J. F., Figueiró, F., Battastini, A. M. O., Guterres, S. S., & Pohlmann, A. R. (2014). Labeling the oily core of nanocapsules and lipid-core nanocapsules with a triglyceride conjugated to a fluorescent dye as a strategy to particle tracking in biological studies. Nanoscale Research Letters, 9(1), 233 http://doi.org/10.1186/1556-276X-9-233 PMid:24936156.
NanoSSIEFARL polymeric nanoparticles-based immunotherapeutic for the treatment of genital herpes
21 Oliveira, J. V. R., Silveira, P. L., Spingolon, G., Alves, G. A. L., Peña, F. P., & Aguirre, T. A. S. (2023). Polymeric nanoparticles containing babassu oil: a proposed drug delivery system for controlled release of hydrophilic compounds. Chemistry and Physics of Lipids, 253, 105304 http://doi.org/10.1016/j. chemphyslip.2023.105304 PMid:37080377.
22 Reis, M. Y. F. A., Santos, S. M., Silva, D. R., Silva, M. V., Correia, M. T. S., Ferraz Navarro, D. M. A., Santos, G. K. N., Hallwass, F., Bianchi, O., Silva, A. G., Melo, J. V., Mattos, A. B., Ximenes, R. M., Machado, G., & Saraiva, K. L. A. (2017). Anti-inflammatory activity of babassu oil and development of a microemulsion system for topical delivery. Evidence-Based Complementary and Alternative Medicine, 2017(1), 3647801. http://doi.org/10.1155/2017/3647801 PMid:29430254.
23 Intahphuak, S., Khonsung, P., & Panthong, A. (2010). Antiinflammatory, analgesic, and antipyretic activities of virgin coconut oil. Pharmaceutical Biology, 48(2), 151-157 http:// doi.org/10.3109/13880200903062614 PMid:20645831.
24 Campos, J. L. A., Silva, T. L. L., Albuquerque, U. P., Peroni, N., & Araújo, E. L. (2015). Knowledge, use, and management of the Babassu Palm (Attalea speciosa Mart. ex Spreng) in the Araripe Region (Northeastern Brazil). Economic Botany, 69(3), 240-250 http://doi.org/10.1007/s12231-015-9315-x
25 Santos, L., & Loschi, M. (2019). Quebradeiras de coco babaçu preservam tradição no interior do Maranhão. Revista Retratos, 15, 1-28. Retrieved in 2024, April 21, from https:// agenciadenoticias.ibge.gov.br/agencia-noticias/2012-agenciade-noticias/noticias/23624-quebradeiras-de-coco-babacupreservam-tradicao-no-interior-do-maranhao
26 Rodrigues, E. C. R., Ferreira, A. M., Vilhena, J. C. E., Almeida, F. B., Cruz, R. A. S., Amado, J. R. R., Florentino, A. C., Carvalho, J. C. T., & Fernandes, C. P. (2014). Development of babassu oil based nanoemulsions. Latin American Journal of Pharmacy, 34(2), 338-343. Retrieved in 2024, April 21, from http://www. latamjpharm.org/resumenes/34/2/LAJOP_34_2_1_20.pdf
27 Plaza-Oliver, M., Santander-Ortega, M. J., & Lozano, M. V. (2021). Current approaches in lipid-based nanocarriers for oral drug delivery. Drug Delivery and Translational Research, 11(2), 471-497 http://doi.org/10.1007/s13346-021-00908-7 PMid:33528830.
28 Leyva-Gómez, G., Piñón-Segundo, E., Mendoza-Muñoz, N., Zambrano-Zaragoza, M. L., Mendoza-Elvira, S., & QuintanarGuerrero, D. (2018). Approaches in polymeric nanoparticles for vaginal drug delivery: A review of the state of the art. International Journal of Molecular Sciences, 19(6), 1549. http://doi.org/10.3390/ijms19061549 PMid:29882846.
29 Poletto, F. S., Fiel, L. A., Lopes, M. V., Schaab, G., Gomes, A., Guterres, S. S., Rossi-Bergmann, B., & Pohlmann, A. R. (2012). Fluorescent-labeled poly(ε-caprolactone) lipid-core nanocapsules: synthesis, physicochemical properties and macrophage uptake. Journal of Colloid Science and Biotechnology, 1(1), 89-98 http://doi.org/10.1166/jcsb.2012.1015
30 Hilario, G. M., Sulczewski, F. B., Liszbinski, R., Mello, L. D., Hagen, G., Fazolo, T., Neto, J., Dallegrave, E., Romão, P., Aguirre, T., & Rodrigues, L. C., Jr. (2021). Development and immunobiological evaluation of nanoparticles containing an immunodominant epitope of herpes simplex virus. IET Nanobiotechnology/IET, 15(6), 532-544 http://doi.org/10.1049/ nbt2.12043. PMid:34694744.
31 International Council on Harmonisation of Technical Requirements for Registration of Pharmaceuticals for Human Use. (2005). ICH harmonised tripartite guideline: validation of analytical procedures: text and methodology Q2(R1). Geneva: ICH
32 Brasil Ministério da Saúde. Agência Nacional de Vigilância Sanitária. Diretoria Colegiada. (2017, 25 de julho). Resolução RDC nº 166, de 24 de julho de 2017. Dispõe sobre a validação
de métodos analíticos e dá outras providências. Diário Oficial da República Federativa do Brasil, Brasília
33 Justus, B., Kanunfre, C. C., Budel, J. M., Faria, M. F., Raman, V., Paula, J. P., & Farago, P. V. (2019). New insights into the mechanisms of French lavender essential oil on non-small-cell lung cancer cell growth. Industrial Crops and Products, 136, 28-36. http://doi.org/10.1016/j.indcrop.2019.04.051.
34 Lopes, C. E., Langoski, G., Klein, T., Ferrari, P. C., & Farago, P. V. (2017). A simple hplc method for the determination of halcinonide in lipid nanoparticles: development, validation, encapsulation efficiency, and in vitro drug permeation. Brazilian Journal of Pharmaceutical Sciences, 53(2), e15250 http://doi. org/10.1590/s2175-97902017000215250
35 Sutariya, V., Wehrung, D., & Geldenhuys, W. J. (2012). Development and validation of a novel RP-HPLC method for the analysis of reduced glutathione. Journal of Chromatographic Science, 50(3), 271-276 http://doi.org/10.1093/chromsci/ bmr055 PMid:22337804.
36. Chaudhari, S. P., & Dugar, R. P. (2017). Application of surfactants in solid dispersion technology for improving solubility of poorly water soluble drugs. Journal of Drug Delivery Science and Technology, 41, 68-77 http://doi.org/10.1016/j. jddst.2017.06.010.
37 Patel, A., Patel, M., Yang, X., & Mitra, A. (2014). Recent advances in protein and peptide drug delivery: a special emphasis on polymeric nanoparticles. Protein and Peptide Letters, 21(11), 1102-1120. http://doi.org/10.2174/0929866 521666140807114240 PMid:25106908.
38 Kim, M. R., Feng, T., Zhang, Q., Chan, H. Y. E., & Chau, Y. (2019). Co-encapsulation and co-delivery of peptide drugs via polymeric nanoparticles. Polymers, 11(2), 288. http://doi. org/10.3390/polym11020288 PMid:30960272.
39 McClements, D. J. (2018). Encapsulation, protection, and delivery of bioactive proteins and peptides using nanoparticle and microparticle systems: a review. Advances in Colloid and Interface Science, 253, 1-22 http://doi.org/10.1016/j. cis.2018.02.002 PMid:29478671.
40 Falciani, C., Zevolini, F., Brunetti, J., Riolo, G., Gracia, R., Marradi, M., Loinaz, I., Ziemann, C., Cossío, U., Llop, J., Bracci, L., & Pini, A. (2020). Antimicrobial peptide-loaded nanoparticles as inhalation therapy for Pseudomonas aeruginosa infections. International Journal of Nanomedicine, 15, 11171128 http://doi.org/10.2147/IJN.S218966 PMid:32110011.
41 Casciaro, B., d’Angelo, I., Zhang, X., Loffredo, M. R., Conte, G., Cappiello, F., Quaglia, F., Di, Y.-P. P., Ungaro, F., & Mangoni, M. L. (2019). Poly(lactide- co-glycolide) nanoparticles for prolonged therapeutic efficacy of esculentin-1a-derived antimicrobial peptides against Pseudomonas aeruginosa lung infection: in vitro and in vivo studies. Biomacromolecules, 20(5), 1876-1888 http://doi.org/10.1021/acs.biomac.8b01829 PMid:31013061.
42 Frank, L. A., Contri, R. V., Beck, R. C. R., Pohlmann, A. R., & Guterres, S. S. (2015). Improving drug biological effects by encapsulation into polymeric nanocapsules. Wiley Interdisciplinary Reviews. Nanomedicine and Nanobiotechnology, 7(5), 623-639 http://doi.org/10.1002/wnan.1334. PMid:25641603.
43 Frank, L. A., Sandri, G., D’Autilia, F., Contri, R. V., Bonferoni, M. C., Caramella, C., Frank, A. G., Pohlmann, A. R., & Guterres, S. S. (2014). Chitosan gel containing polymeric nanocapsules: a new formulation for vaginal drug delivery. International Journal of Nanomedicine, 9(1), 3151-3161 http:// doi.org/10.2147/IJN.S62599 PMid:25061292.
44 Frank, L. A., Chaves, P. S., D’Amore, C. M., Contri, R. V., Frank, A. G., Beck, R. C. R., Pohlmann, A. R., Buffon, A., & Guterres, S. S. (2017). The use of chitosan as cationic coating or gel vehicle for polymeric nanocapsules: increasing penetration
Zorzetto, R., Peña, F. P., Oliveira, A. C., Ferreira Neto, J. C., Hilario, G. T. M., Frozza, F. T. B., Lins, M. P., Poletto, F., Eberhardt, M. J., Romão, P. R. T., Aguirre, T. A. S., & Rodrigues Junior, L. C.
and adhesion of imiquimod in vaginal tissue. European Journal of Pharmaceutics and Biopharmaceutics, 114, 202-212 http:// doi.org/10.1016/j.ejpb.2017.01.021 PMid:28161547.
45. Harshyne, L. A., Watkins, S. C., Gambotto, A., & Barratt-Boyes, S. M. (2001). Dendritic cells acquire antigens from live cells for cross-presentation to CTL. Journal of Immunology, 166(6), 3717-3723 http://doi.org/10.4049/jimmunol.166.6.3717 PMid:11238612.
46. Nayak, J. V., Hokey, D. A., Larregina, A., He, Y., Salter, R. D., Watkins, S. C., & Falo, L. D., Jr. (2006). Phagocytosis induces lysosome remodeling and regulated presentation of
particulate antigens by activated dendritic cells. Journal of Immunology, 177(12), 8493-8503 http://doi.org/10.4049/ jimmunol.177.12.8493 PMid:17142747.
47 Kong, B., Seog, J. H., Graham, L. M., & Lee, S. B. (2011). Experimental considerations on the cytotoxicity of nanoparticles. Nanomedicine, 6(5), 929-941 http://doi.org/10.2217/nnm.11.77 PMid:21793681.
Received: Apr. 21, 2024
Revised: Oct. 08, 2024
Accepted: Dec. 18, 2024
João D’Anuzio Lima de Azevedo1* , Virgínia Mansanares Giacon2 and José Roberto Ribeiro Bortoleto1
1Laboratório Multiusuário de Caracterização de Materiais – LMCMat, Universidade Estadual Paulista “Júlio de Mesquita Filho” – UNESP, Sorocaba, SP, Brasil
2Laboratório de Materiais Compósitos – LAMAC, Universidade Federal do Amazonas – UFAM, Manaus, AM, Brasil
*jdlazevedo@uea.edu.br
Obstract
This paper analyzed the thermal and mechanical properties of natural rubber/curaua fiber composite with different weight contents (2.5% to 15%). Alkali treatment was used to modify the surface of curaua fiber and improve interfacial bonding. Results showed that alkali treatment did not affect the dispersion pattern of composites. TGA revealed that both fiber content and treatment minimally influenced the thermal stability of composites. However, thermal conductivity showed up to 34,2% reductions compared to the matrix for low fiber contents, with an increased tendency for higher contents. The tensile strength of composites showed improvements up to 161% for 2.5% loads, but there was a decreasing tendency when filler load increased, indicating problems with dispersed phase distribution. Overall, composites made with treated fibers exhibited better mechanical properties than those without treatment, showing better interfacial adhesion, and the 2.5% fiber content presented the best combination of thermal and mechanical properties.
Keywords: curaua fiber, natural rubber, composite, lignocellulosic.
Data Ovailability: Research data is available upon request from the corresponding author.
How to cite: Azevedo, J. D. L., Giacon, V. M., & Bortoleto, J. R. R. (2025). Composites of natural rubber with curaua fibers. Polímeros: Ciência e Tecnologia, 35(2), e20250015. https://doi.org/10.1590/0104-1428.20240111
The demand for environmentally friendly and low-cost materials has increased over the past decades. This is partly due to society’s growing awareness of the environmental impacts of human activities, driving the use of materials mostly derived from renewable or natural sources. Brazil has a high potential for contribution in this context, as it is a major producer of lignocellulosic fibers, with various species cultivated within its territory[1].
Among the many natural fibers, curaua fiber (Ananas erectifolius), a bromeliad from the pineapple family (Ananas comosus), stands out, being typically found in the Amazon region[2]. The plant was already known to pre-Columbian peoples, who used the fiber to make ropes and fabrics[3] In Brazil, rational planting began in the early 20th century along the Amazon River, mainly in Pará, with the peak of cultivation occurring in the municipality of Santarém (PA)[4]
Typically, curaua leaves can reach up to 1.50 m in height and 4.00 cm in width and are rigid, upright, and flat[5]. The plant also produces a fruit similar to the common pineapple but smaller and unsuitable for human consumption[5]. The fiber chemical composition comprises 73.6% cellulose, 9.9% hemicellulose, 7.5% lignin, 0.9% ash, and 7.9% moisture[4,6]. Its density ranges from 0.57 to 1.43 g/cm3, and it can withstand tensile stresses from 500 to 1150 MPa, placing it among the strongest lignocellulosic fibers[7-9] Combining these factors results in a highly resistant, low-
density, renewable, biodegradable, and low-cost fiber with the potential to replace glass fiber in certain applications[10,11]
Several researchers have used curaua fiber in polymer matrix composites such as EPS (expanded polystyrene), PP (polypropylene), epoxy, or PLA (polylactic acid)[11-15] and cementitious matrices[16,17]. In these composites, the fibrous structure of the vegetal fiber tends to improve mechanical performance[13] and, in some cases, thermal stability[12,14]
Another abundant natural material with potential for polymer composite fabrication is natural rubber (NR), a completely natural elastomer produced from latex (a milky and viscous fluid) extracted from the rubber tree (Hevea brasiliensis), as well as from other species[18,19]. NR consists of large hydrocarbon chains with a cis-1,4-polyisoprene structural unit, which, due to its high molecular weight, is elastic, has good impact and abrasion resistance, is resilient, and remains flexible at low temperatures, making it a good alternative for use in composites with natural fibers[19]. Several researchers evaluated NR composites reinforced with lignocellulosic fibers such as jute, sisal, coconut, and bamboo (among others) and observed improvements in properties such as Young’s modulus and hardness[19,20]. Moreover, some authors point out that natural latex rubber holds strategic relevance because it cannot be fully replaced by synthetic materials in most applications[19,21]. Due to the widespread use of NR, new combinations of this elastomer with various fillers are being explored, aiming at producing new composites, particularly in efforts to reduce the use of synthetic rubbers[18].
Azevedo, J. D. L., Giacon, V. M., & Bortoleto, J. R. R.
The major drawback of polymer composites reinforced with lignocellulosic materials lies in the natural fibers’ hydrophilic nature, which hinders adhesion between the surfaces of their components. However, the literature indicates that surface treatments can be applied to vegetal fibers to improve bonding between matrix and reinforcement. In this regard, alkali treatment with sodium hydroxide (NaOH), or mercerization, of natural fibers is widely recognized as an easy, practical, and inexpensive method for treating them, potentially improving the mechanical properties of polymer matrix composites[3,6,8,11,14,19-23]. It’s because alkali treatment removes some of the fiber components such as lignin, hemicellulose, pectin, fats, and surface impurities, exposing cellulose and increasing fiber roughness, which can enhance interfacial adhesion[6,8,24]. Moreover, removing amorphous components in lignin and hemicellulose also improves vegetal fibers’ crystallinity index and stiffness[25-27] However, alkali treatment with high NaOH concentrations or excessive exposure time (immersion) can cause severe fiber degradation, deteriorating its physical and mechanical properties[25,28]
A study on curaua fiber and epoxy resin biocomposite evaluated the effects of reinforcement loading and alkali treatment with different immersion times and NaOH concentrations. The results showed a strong influence on the tensile properties of the composite, where higher concentrations require less immersion time, or vice versa, to achieve the ideal roughness capable of promoting strong matrix/reinforcement adhesion[14].
Although there are currently numerous studies interested in the properties of NR/natural fiber biocomposites and their potential applications[19,23], to date, no research has been identified addressing the interaction between natural rubber and curaua fiber. Therefore, this paper aims to prepare NR composites filled with curaua fiber to analyze the effects of reinforcement loading and alkali treatment with NaOH on selected physical, thermal, and mechanical properties.
2.1 Materials
Curaua fiber samples, used as filler, were obtained at Novo Airão city (Amazonas - Brazil), produced by hand in riverside communities, without chemical treatment, and sold in local craft centers as rolls of thread for knitting and ropes.
NR used as a matrix was obtained from pre-vulcanized latex supplied by Bassan Indústria e Comércio de Látex Ltda, located in São Paulo (Brazil), which kindly provided the chemical composition shown in Table 1. The product is composed of centrifuged natural latex, additives, and stabilizers. This composition allows the latex compound to vulcanize at room temperature. The pre-vulcanized latex was used without changes in the present study.
2.2 Sample preparation
To improve adhesion at the matrix/fiber interface, alkaline treatment was applied to part of the curauá fibers, using 5% aqueous sodium hydroxide (NaOH) solution to the curaua fibers for 2 hours, producing samples with treated and untreated fibers. The fibers were washed with distilled
Table 1. Chemical formulation of natural rubber, in phr (parts per hundred of rubber).
Component
Concentration
Natural rubber (NR) 100 phr
Sulfur 3,0 phr
ZBEC (Zinc dibenzyldithiocarbamate) 1,2 phr
ZnO (zinc oxide) 1,8 phr
Antioxidant (SKF) 1,2 phr
KOH (Potassium hydroxide) 1,5 phr
Potassium laurate (C12H23KO2) 1,0 phr
water to remove impurities from the process until the pH was fully neutralized. The treated fibers were left to rest for 48 hours at room temperature and dried for 24 hours in an air-circulating oven[29-31]
The production of the composite samples involved manual mixing of pre-vulcanized latex with varying amounts of ground curaua fibers, both treated and untreated, using a knife mill (Marconi, MA048, mesh 32). The biocomposites were prepared with fiber contents by weight, ranging from 2.5% to 15%, with increments of 2.5% (Table 2). An aircirculating oven at 70 °C accelerated the curing process[29-31]
Bulk density tests of the curaua fiber were performed using a graduated cylinder[32], where the graduated cylinder’s volume variation containing distilled water and fiber was measured. The test used a pycnometer following ASTM D297-21 for natural rubber and its composites.
Functional groups on sample surfaces were analyzed using Fourier Transform Infrared Spectroscopy with Attenuated Total Reflectance (FTIR-ATR) with a Shimadzu Spectrometer, model ‘IRAffinity-1S and IV. Curaua fiber and composites underwent microscopic analysis to evaluate the surface morphology and adhesion between the matrix and the fiber. A high-resolution scanning electron microscope (SEM) (Jeol, JSM IT500 HR) was employed. Samples’ crystallinity indexes were determined using a Shimadzu X-ray diffractometer (Maxima XRD 7000) with a Cu-Kα wavelength (1.541874 Å), a voltage of 40.0 kV, and a current of 30.0 mA. The scan range was from 5° to 100° (2θ), with a size of 0.02°/step. The empirical Segal method was used for lignocellulosic fibers crystallinity index calculation[33]
Thermal analyses were performed using an SDT Q600 analyzer (TA Instruments) with samples of approximately 10 mg. The heating rate was 10 °C/min up to a final temperature of 800 °C, with a 30 mL/min nitrogen gas flow.
The samples’ thermal conductivities were determined using the Modified Transient Plane Source (MTPS) method and the TCi sensor from C-Therm, following ASTM D7984-21.
Shore A hardness, suitable for soft materials such as rubbers and foams, was measured using a digital durometer (Kaptron, FE-0063). The tests were conducted according to ASTM D2240-05.
Tensile strength tests were conducted according to ISO 37. A universal testing machine (INSTRON 5984) with integrated BLUEHILL 3 software was used. It was equipped with a 15.0 kN load cell at an ambient temperature of 24 °C and a 200 mm/min testing speed.
Curaua Fiber Fiber content
Untreated (UT)
Treated (T)
2.5 to 15%w
The spectra of treated and untreated fibers were similar to those observed in the literature, with notable cellulose, hemicellulose, and lignin bands, as seen in Figure 1a[4,6,8,12]. The decrease in the intensity of the 3341 cm−1 band after alkaline treatment suggests the removal of hydroxyl groups because NaOH trends to break hydrogen bonds of OH groups present on the fiber surface, forming fiber-O-Na groups and softening the initial hydrophilic characteristic[12]. The reduction of the 2905 cm−1, 1732 cm−1, and 1040 cm−1 bands indicates a decrease in cellulose and hemicellulose. The absence of the 1514 cm−1 and 1240 cm−1 bands in the treated spectrum suggests the dissolution of lignin. The 1370 cm−1 band increase indicates that the cellulose structure is more exposed[4,18]. The changes in the fiber spectrum shown in Figure 1a demonstrate that alkalization effectively modifies the fiber surface.
The spectra of composites with different fiber loads (2.5%, 10%, and 15%) were compared with those of NR (Figure 1b). The results show characteristic peaks of poly(cis-1,4-isoprene) and bands for sulfonates (SO2), indicating vulcanization. Increases in the bands at 3341 cm−1 , 1040 cm−1, and 670 cm−1 are associated with hydroxyl groups and components from the curaua fiber[34]. The spectra of the composites indicated the predominance of NR, with no significant shifts in peaks, suggesting the absence of chemical reactions between the matrix and the dispersed phase, indicating only physical interaction[35].
Figure 2 presents the X-ray diffraction (XRD) patterns of curaua fibers, NR and composites with 2.5%, 10%, and 15% w/w fiber loadings. Untreated fibers exhibited a crystallinity index of 59.9%, while those treated with NaOH increased to 71.3%, indicating a 19.2% increase due to the removal of amorphous phases (lignin, hemicellulose, and semi-crystalline cellulose). This increase in the crystalline phase corroborates the hypothesis that alkali treatment may have altered the surface of the treated fibers, in agreement with the FTIR.. The NR XRD pattern shows a scattering around 2θ=18º, typical of amorphous materials. All composite samples maintained the same amorphous pattern as NR, indicating that the introduction of curaua fibers did not significantly change the matrix structure, independently of the fiber concentration or alkali treatment.
Figures 3a and 3b show the TGA and DTG curves for NR and composite samples. These curves allow one to analyze the effects of fiber loading and alkaline treatment on the thermal stability of composites relative to the matrix.
Sample Code
C2.5-UT, C5-UT, C7.5-UT, C10-UT, C12.5-UT, C15-UT
C2.5-T, C5-T, C7.5-T, C10-T, C12.5-T, C15-T
Three events can be noted. The first is a subtle mass loss from 60 °C to 150 °C due to volatiles on the material’s surface and moisture in the natural fiber loads, which are naturally hydrophilic[30]. The second one occurs between 300 °C and 450 °C, where a pronounced mass loss is observed, likely due to the degradation of holocellulose (hemicellulose and cellulose) and hydrocarbons. The third one is a more gradual mass loss observed between 480 °C and 550 °C, resulting from the matrix’s lignin decomposition and extractives[31] Overall, the thermogravimetric behavior observed in the TG and DTG curves was similar between the composites and NR. Nevertheless, previous research has indicated slight reductions in the thermal stability of NR composites filled with natural fibers, mainly due to the early degradation of the dispersed phase in these materials[36,37]
However, small increases in the onset degradation temperature were observed in samples C2.5-UT and C2.5-T, reaching 354 °C and 347 °C, respectively, less than 2% higher than NR. The other composite samples (5% to 15%w) showed a moderate reduction in thermal stability, with sample C5-UT being the smallest, with a Tonset equal to 326 °C (<6.3%). Considering the initial degradation temperature, it can be inferred that the composites are thermally stable up to 300 °C, similar to what was found by Masłowski et al.[18] for NR composites filled with nettle fiber (Urtica dioica L.). Karim et al.[38] also reported a thermal stability reduction in NR eco-composites, where kenaf fiber (Hibiscus cannabinus L. ) was reinforced. According to the authors, the decrease in thermal stability is due to the low degradation temperature of lignocellulosic materials, which typically begin to degrade from 200 °C. On the other hand, the final degradation temperature (endset) showed more significant variations compared to NR, with an increase from 566 °C to 646 °C (14.3%) for the C7.5%UT sample. The minor variation in the thermogravimetric test parameters indicates that the increase in curaua fiber loading has few influence on the thermal behavior of the matrix. No significant discrepancies were observed between the treated (T) and untreated (UT) fibers samples. Moonart and Urata[39] also reported no significant difference in thermal stability regarding the chemical treatment of hemp fiber as reinforcement in NR.
The apparent density found for curaua fiber without alkaline treatment was 1.250 ± 0.001 g/cm3, close to values reported in previous studies[4,7,32]. After alkaline treatment, the density increased to 1.43 ± 0.04 g/cm3, representing a 14.4% increase. This change can be attributed to removing amorphous components such as hemicellulose and lignin, resulting in a more efficient packing of the fibers[28,40] Tukey’s test confirmed the significance of this difference (P ≤ 5%), as listed in Table 3, where means with different letters are statistically distinct. This indicates that this
Azevedo, J. D. L., Giacon, V. M., & Bortoleto, J. R. R.


property was influenced by mercerization. Curaua fiber is still lighter than other synthetic fibers, such as E-glass (2.5 g/cm3)[22]. The composites showed average densities
lower than NR (1.03 g/cm3), and the C5-T sample is the lowest one (0.78 g/cm3), representing a 24.3% reduction compared to the matrix. Tukey’s test revealed that only the
Polímeros, 35(2), e20250015, 2025
Table 3. Properties (mean ± standard deviation) of the samples produced.
C12.5
C2.5 5.32 ± 0.59b,c 7.39 ± 1.23a
± 22d,e C10 3.36 ± 0.59d,e 5.56 ± 0.4b,c 2.48 ± 0.12c 3.72 ± 0.23b
C12.5 4.63 ± 0.13b-d 5.96 ± 0.26a,b 2.32 ± 0.27c,d 4.95 ± 0.31a
C15 3.3 ± 0.2d,e 5.51 ± 0.79b,c 1.67 ± 0.03c-e 4.97 ± 0.79a 311 ± 33e
Means for the same property with different letters differ significantly (P ≤ 0.05) by Tukey’s test.
composites C2.5-UT/T, C15-UT/T, and C2.5-T did not differ significantly from the density of NR, indicating a relevant influence of fiber loading on the density of the composites. Additionally, no statistical difference was noted between the densities of composite pairs produced with treated and untreated fibers, showing that alkaline treatment did not affect this composite property.
The average thermal conductivity determined for curaua fiber, without alkaline treatment, was 0.0559 ± 0.0001 W/m-K, consistent with the typical value of 0.055 W/m-K found for lignocellulosic fibers[41]. According to Asdrubali et al.[42], curaua fiber would be classified among materials with intermediate insulating performance (0.05 ≤ k ≤ 0.08 W/m-K). However, this value is close to those observed in commercial insulating materials such as glass and rock wool (0.04 and 0.045 W/m-K, respectively)[42,43] Influenced by alkaline treatment, the thermal conductivity increased to 0.0596 ± 0.0002 W/m-K (6.6%), as shown in Table 3
The thermal conductivity of composites with untreated fibers ranged from 0.250 ± 0.002 W/m-K to 1.049 ± 0.007 W/m-K, while for composites with treated fibers, it ranged from 0.290 ± 0.046 W/m-K to 1.253 ± 0.002 W/m-K (Table 3). The C2.5-UT composite showed 0.25 W/mK of thermal conductivity, the lowest among the samples. This result is 24% lower than that obtained for the NR/PALF (pineapple leaf fiber) composite, which was considered a promising thermal insulator[44].
From 5% fiber content, thermal conductivity tends to increase, reaching maximum values in composites C12.5-UT and C10-T, respectively, 1.049 W/m-K and 1.253 W/m-K. The crystalline phase of curaua fiber may play a significant role in the observed thermal conductivity behavior, as such structures can facilitate thermal conduction and diffusion in the composites[45]. This is evidenced by the fact that most
± 49e
composites with treated curaua fiber exhibit higher thermal conductivity than those with untreated fiber. As predicted in the literature, a consequence of alkali treatment is the improvement in fiber-matrix adhesion, which implies an increased contact area, which in turn can maximize thermal conductivity[46]. Tukey’s tests indicate that thermal conductivity is strongly influenced by fiber content. However, between pairs of composites with treated and untreated fibers, it’s noted that mercerization is more effective in samples with high fiber content (10-15%).
The hardness tests on composites with untreated fibers showed values ranging from 43.7 ShA to 62.5 ShA, while those with treated fibers varied from 25.4 ShA to 60.1 ShA, presenting an increasing trend depending on the filling load. The highest hardness values were observed in samples C15UT and C15-T, respectively, 62.5 ShA and 60.1 ShA, which is an interesting characteristic for the footwear industry, such as the NR/Sugarcane bagasse fiber composite, proposed by Paiva et al.[47]. (>55 ShA). The data in Table 3 reveal that hardness of untreated fiber composites significantly increases starting at 2.5% fiber content but stabilizes from 5% onwards. In contrast, for composites with treated fibers, hardness is notably affected from 5%, with stabilization occurring from 10% fiber content.
A tensile strength test was conducted on the composites, varying the content of treated and untreated fibers to evaluate their maximum stresses and strains. NR exhibited an average tensile strength of 2.83 MPa. Composites with untreated fibers ranged from 2.85 MPa to 5.32 MPa, while those with treated fibers ranged from 4.07 MPa to 7.39 MPa. The highest values were observed in composites with 2.5% fiber (UT/T), increasing to 161% compared to NR. Beyond 5% fiber loading, there was a decrease in tensile strength followed by an increasing trend up to 12.5% fiber content; at this point, another reduction was observed. This
Azevedo, J. D. L., Giacon, V. M., & Bortoleto, J. R. R.
behavior indicates a fiber loading limit for positive effects on tensile strength, similar to that observed by Ubi et al.[48]. The alkaline treatment of curaua fibers improved the mechanical properties of composites, increasing tensile strength and the elastic modulus due to better adhesion between the matrix and mercerized fibers[47]. Despite this, the tensile strength results for NR/Curaua fiber composites were superior to those obtained for NR/Luffa fiber (Luffa cylindrica) composites (0.315 to 0.788 MPa)[49], where the authors indicated them for energy-absorption applications. The modulus of elasticity at 100% elongation showed maximum values of 2.5 MPa (C7.5-UT) and 4.95 MPa (C12.5-T), with additional increases leading to a deterioration in stiffness. Elongation at break decreased with increasing fiber content as the filler reduced the deformable phase of the rubber, stiffening the
composites[50]. However, composites with 12.5% and 15% untreated fiber showed greater elongations, in contrast to the trend observed in treated fibers. The Tukey test groupings (Table 3) indicate that mechanical properties are significantly affected by fiber content and alkaline treatment, especially in composites with high fiber content (10 to 15%), where sodium hydroxide treatment had a greater influence.
Scanning electron microscopy (SEM) was performed on the composites C2.5-UT/T, C10-UT/T, and C15-UT/T to assess the interaction between matrix and fiber load, as shown in tensile fracture images from Figure 4a to 4f, respectively. The images in Figures 4a and 4b show randomly oriented

fibers within the elastomeric matrix and pores caused by bubbles, indicating failures due to manual material processing without compaction or pressurization. These bubbles and fiber agglomerations in the matrix, observed in Figures 4c to 4f, act as stress concentrators, compromising the mechanical properties of the composites.
Samples with 2.5% fiber loads exhibited better dispersion and less agglomerations than those with 10% and 15% fiber, which explains their better performance in the tensile test (Table 1). The C2.5-UT sample showed a rough surface and fractured layers (Figure 4a), indicating weak adhesion between the matrix and fiber. In contrast, the C2.5-T sample showed good matrix-fiber bonding and broken fibers (Figure 4h), evidencing strong adhesion and justifying its greater tensile strength.
There was few evidence of fiber pull-out in the samples with 2.5% filler content. The C2.5-UT composite presented a rough surface and fractured layers (Figure 4g), indicating weak adhesion between the matrix and fiber load[37]. On the other hand, Figure 4h shows that the C2.5-T sample appears to have good adhesion at the matrix/filler interface (yellow arrow), presenting broken fibers (yellow circle) and evidencing strong adhesion[39]. Such considerations may justify the high tensile strength in composites with 2.5% treated fiber load compared to untreated ones.
The fiber dispersion and matrix/fiber adhesion observed in SEM can also significantly affect thermal conductivity. Composites with poorly distributed fibers and agglomerations, as seen in samples with higher fiber content (10% and 15%w), show increased thermal conductivity since fiber agglomerations may be acting as a preferential path for thermal conduction, which is even more evident in samples with treated fibers[44]. On the other hand, samples with 2.5%w fiber presented low thermal conductivities, probably due to the good fiber dispersion and pores, which can hinder heat transmission in the material, making them more suitable for thermal insulation applications.
Natural rubber composites reinforced with curaua fibers were produced and thermally and mechanically characterized. FTIR and XRD analyses indicated that the interaction between the NR matrix and the fibers is predominantly physical, with no significant chemical changes in the composites. From a thermal point of view, thermogravimetric analyses revealed that the composites maintain thermal stability up to approximately 300°C, with minimal variations in the initial degradation temperature, and the lowest thermal conductivity was observed in samples with 2.5% treated fibers, representing a reduction of up to 34.2% in relation to the matrix.
In addition, composites with 2.5% treated fibers achieved a 161% increase in tensile strength, compared to NR, although higher fiber contents resulted in a decrease in this property due to inadequate dispersion of the reinforcing phase. In general, composites produced with treated fibers presented better interfacial adhesion and superior mechanical properties compared to those with untreated fibers. Thus, the results suggest that composites with 2.5% treated fibers offer the
best combination of thermal and mechanical properties, being the most promising for commercial and engineering applications.
5. Author’s Contribution
• Conceptualization – João D’Anuzio Lima de Azevedo.
• Data curation – João D’Anuzio Lima de Azevedo.
• Formal analysis – João D’Anuzio Lima de Azevedo.
• Funding acquisition – NA.
• Investigation – João D’Anuzio Lima de Azevedo.
• Methodology – João D’Anuzio Lima de Azevedo; Virgínia Mansanares Giacon; José Roberto Ribeiro Bortoleto.
• Project administration – João D’Anuzio Lima de Azevedo.
• Resources – João D’Anuzio Lima de Azevedo; Virgínia Mansanares Giacon.
• Software – NA.
• Supervision – Virgínia Mansanares Giacon; José Roberto Ribeiro Bortoleto.
• Validation – Virgínia Mansanares Giacon; José Roberto Ribeiro Bortoleto.
• Visualization – João D’Anuzio Lima de Azevedo.
• Writing – original draft – João D’Anuzio Lima de Azevedo.
• Writing – review & editing – Virgínia Mansanares Giacon; José Roberto Ribeiro Bortoleto.
The authors would like to thank the Laboratory of Amazonian Materials and Composites (LaMAC/ UFAM), the Multiuser Center for Analysis of Biomedical Phenomena (CMABio/UEA), and the Analytical Center of the Federal Institute of Education, Science and Technology of Amazonas, Campus Manaus Centro (CA-IFAM-CMC) for technical support. Among the authors, Azevedo specifically thanks the Federal University of Amazonas (UFAM) and the São Paulo State University (UNESP) for the opportunity to join and study the Interinstitutional Doctorate Program (DINTER) offered by the Postgraduate Program in Materials Science and Technology (POSMAT).
1 Azevedo, A. R. G., Amin, M., Hadzima-Nyarko, M., Agwa, I. S., Zeyad, A. M., Tayeh, B. A., & Adesina, A. (2022). Possibilities for the application of agro-industrial wastes in cementitious materials: a brief review of the Brazilian perspective. Cleaner Materials, 3, 100040 http://doi.org/10.1016/j.clema.2021.100040
2 Souza, F. G., Jr., Oliveira, G. E., Rodrigues, C. H. M., Soares, B. G., Nele, M., & Pinto, J. C. (2009). Natural Brazilian Amazonic (Curaua) fibers modified with polyaniline nanoparticles. Macromolecular Materials and Engineering, 294(8), 484-491 http://doi.org/10.1002/mame.200900033
3. Colorado, H. A., Monteiro, S. N., Delaqua, G. C. G., & Vieira, C. M. (2023). Natural vegetable fibers used from Colombia and their use as potential reinforcement for composite materials. In TMS 2023 152nd Annual Meeting & Exhibition (pp. 1263-
Azevedo, J. D. L., Giacon, V. M., & Bortoleto, J. R. R.
1270). Cham: Springer Nature http://doi.org/10.1007/978-3031-22524-6_122
4 Satyanarayana, K. G., Guimarães, J. L., & Wypych, F. (2007). Studies on lignocellulosic fibers of Brazil. Part I: Source, production, morphology, properties, and applications. Composites. Part A, Applied Science and Manufacturing, 38(7), 1694-1709 http://doi.org/10.1016/j.compositesa.2007.02.006
5 Silva, R. L. (2014). Influência dos agentes de acoplamento na degradação ambiental de compósitos de polipropileno-fibra de curauá (Master’s dissertation). Universidade Federal do ABC, Santo André
6. Spinacé, M. A. S., Lambert, C. S., Fermoselli, K. K. G., & De Paoli, M.-A. (2009). Characterization of lignocellulosic curaua fibers. Carbohydrate Polymers, 77(1), 47-53 http:// doi.org/10.1016/j.carbpol.2008.12.005
7 Caraschi, J. C., & Leão, A. L. (2000). Characterization of curaua fiber Molecular Crystals and Liquid Crystals Science and Technology. Section A. Molecular Crystals and Liquid Crystals, 353(1), 149-152 http://doi.org/10.1080/10587250008025655
8 Zwawi, M. (2021). A review on natural fiber bio-composites, surface modifications and applications. Molecules, 26(2), 404 http://doi.org/10.3390/molecules26020404. PMid:33466725.
9 Członka, S., Kerche, E. F., Neves, R. M., Strąkowska, A., & Strzelec, K. (2021). Bio-based rigid polyurethane foam composites reinforced with bleached Curauá fiber. International Journal of Molecular Sciences, 22(20), 11203 http://doi.org/10.3390/ ijms222011203 PMid:34681863.
10. Zah, R., Hischier, R., Leão, A. L., & Braun, I. (2007). Curaua fibers in the automobile industry–a sustainability assessment. Journal of Cleaner Production, 15(11-12), 1032-1040 http:// doi.org/10.1016/j.jclepro.2006.05.036
11 Gonçalves, F. A. C., Amaral, E. L. S., Lopes, J. L., Jr., Lopes, B. L. S., Ribeiro, L. S., Jr., Brabo, D. R., & Amarante, C. B. (2018). Plant fibers: general aspects, utilization, technological innovation and use in composites. Revista Espacios, 39(6), 12 Retrieved in 2024, December 3, from https://www.revistaespacios. com/a18v39n06/18390612.html
12. Libera, V. D., Jr., Teixeira, L. A., Leão, R. M., & Luz, S. M. (2019). Evaluation of thermal behavior and cure kinetics of a curauá fiber prepreg by the non-isothermal method. Materials Today: Proceedings, 8(Part 3), 839-846 http://doi.org/10.1016/j. matpr.2019.02.026
13 Delgado-Aguilar, M., Tarrés, Q., Marques, M. F. V., Espinach, F. X., Julián, F., Mutjé, P., & Vilaseca, F. (2019). Explorative study on the use of Curauá reinforced polypropylene composites for the automotive industry. Materials, 12(24), 4185 http:// doi.org/10.3390/ma12244185 PMid:31842484.
14 del Pino, G. G., Bezazi, A., Boumediri, H., Kieling, A. C., Garcia, S. D., Torres, A. R., Soares, R. S., Macêdo, J. C., No., Dehaini, J., & Panzera, T. H. (2021). Optimal tensile properties of biocomposites made of treated amazonian Curaua fibres using Taguchi method. Materials Research, 24(Suppl. 2), e20210326 http://doi.org/10.1590/1980-5373-mr-2021-0326
15. Jesus, L. C. C., Oliveira, J. M., Leão, R. M., Beltrami, L. R., Zattera, A. J., Anflor, C. T. M., Doca, T. C. R., & Luz, S. M. (2022). Tensile behavior analysis combined with digital image correlation and mechanical and thermal properties of microfibrillated cellulose fiber/polylactic acid composites. Polymer Testing, 113 , 107665 http://doi.org/10.1016/j. polymertesting.2022.107665
16. Teixeira, F. P., & Silva, F. A. (2020). On the use of natural curaua reinforced cement based composites for structural applications. Cement and Concrete Composites, 114, 103775 http://doi.org/10.1016/j.cemconcomp.2020.103775
17 Salgado, I. P., & Silva, F. A. (2021). Flexural behavior of sandwich panels combining curaua fiber-reinforced composite
layers and autoclaved aerated concrete core. Construction & Building Materials, 286, 122890 http://doi.org/10.1016/j. conbuildmat.2021.122890
18 Masłowski, M., Aleksieiev, A., Miedzianowska, J., & Strzelec, K. (2021). Common nettle (Urtica dioica L.) as an active filler of natural rubber biocomposites. Materials, 14(7), 1616 http:// doi.org/10.3390/ma14071616 PMid:33810368.
19 Lozada, E. R., Aguilar, C. M. G., Carvalho, J. A. J., Sánchez, J. C., & Torres, G. B. (2023). Vegetable cellulose fibers in natural rubber composites. Polymers, 15(13), 2914 http:// doi.org/10.3390/polym15132914 PMid:37447558.
20 Zhou, Y., Fan, M., & Chen, L. (2016). Interface and bonding mechanisms of plant fiber composites: an overview. Composites. Part B, Engineering, 101, 31-45. http://doi.org/10.1016/j. compositesb.2016.06.055.
21 van Beilen, J. B., & Poirier, Y. (2007). Establishment of new crops for the production of natural rubber. Trends in Biotechnology, 25(11), 522-529 http://doi.org/10.1016/j.tibtech.2007.08.009 PMid:17936926.
22 Khan, M. Z. R., & Srivastava, S. K. (2018). Development, characterization and application potential of bio-composites: a review. IOP Conference Series. Materials Science and Engineering, 404, 012028. http://doi.org/10.1088/1757899X/404/1/012028.
23 Rybiński, P., Syrek, B., Masłowski, M., Miedzianowska, J., Strzelec, K., Żukowski, W., & Bradło, D. (2018). Influence of lignocellulose fillers on properties natural rubber composites. Journal of Polymers and the Environment, 26(6), 2489-2501 http://doi.org/10.1007/s10924-017-1144-9
24 Pickering, K. L., Efendy, M. G. A., & Le, T. M. (2016). A review of recent developments in natural fiber composites and their mechanical performance. Composites. Part A, Applied Science and Manufacturing, 83, 98-112. http://doi.org/10.1016/j. compositesa.2015.08.038
25 Mouhoubi, S., Bourahli, M. E. H., Osmani, H., & Abdeslam, S. (2017). Effect of alkali treatment on alfa fibers behavior. Journal of Natural Fibers, 14(2), 239-249 http://doi.org/10. 1080/15440478.2016.1193088
26 Oliveira, P. F., & Marques, M. F. V. (2014). Comparison between coconut and curaua fibers chemically treated for compatibility with PP matrixes. Journal of Reinforced Plastics and Composites, 33(5), 430-439. http://doi.org/10.1177/0731684413516392.
27 Xiong, X., Bao, Y., Liu, H., Zhu, Q., Lu, R., & Miyakoshi, T. (2019). Study on mechanical and electrical properties of cellulose nanofibrils/graphene-modified natural rubber. Materials Chemistry and Physics, 223, 535-541 http://doi. org/10.1016/j.matchemphys.2018.11.041
28 Tenazoa, C., Savastano, H., Charca, S., Quintana, M., & Flores, E. (2021). The effect of alkali treatment on chemical and physical properties of ichu and cabuya fibers. Journal of Natural Fibers, 18(7), 923-936. http://doi.org/10.1080/1544 0478.2019.1675211
29 Prasanna, G. V., Srilekha, R., Sri Harsha, A. V. N., Sai Abhi Chandan, V., & Sunil Kumar, V. (2021). Hybridization and influence of chemical treatment on the morphology and optimization of composites. Materials Today: Proceedings, 44(Part 6), 4833-4837 http://doi.org/10.1016/j.matpr.2020.11.695
30 Santos, L. M. P. (2015). Development and characterization of latex (natural rubber) and carnauba fiber biocomposite (Master’s dissertation). Universidade Federal do Rio Grande do Norte, Natal
31 Souza, J. R., Fo. (2015). Obtaining and characterizing an eco-composite based on latex and coconut straw sheath for thermal and acoustic insulation (Doctoral thesis). Universidade Federal do Rio Grande do Norte, Natal
32 Sales, C. G. (2015). Curaua fiber as reinforcement in cement matrix for the manufacture of roof tiles and fiber cement boards (Master’s dissertation). Universidade Federal do Pará, Belém
33 Segal, L., Creely, J. J., Martin, A. E., Jr., & Conrad, C. M. (1959). An empirical method for estimating the degree of crystallinity of native cellulose using the X-ray diffractometer. Textile Research Journal , 29 ( 10 ), 786 - 794 http://doi. org/10.1177/004051755902901003
34 Vaccioli, K. B. (2022). Effect of addition of silica, graphene oxide and organosulfur agents on vulcanization and properties of compounds based on natural rubber (Doctoral thesis). Universidade de São Paulo, São Paulo
35 Cerna Ñahuis , L. E. (2021). Incorporation of hydrogel particles into natural rubber microfibers obtained by solution blow spinning (Master’s dissertation). Universidade Estadual Paulista, Ilha Solteira
36 Azwa, Z. N., Yousif, B. F., Manalo, A. C., & Karunasena, W. (2013). A review on the degradability of polymeric composites based on natural fibers. Materials & Design, 47, 424-442 http://doi.org/10.1016/j.matdes.2012.11.025.
37 Miedzianowska, J., Masłowski, M., Rybiński, P., & Strzelec, K. (2020). Properties of chemically modified (selected silanes) lignocellulosic filler and its application in natural rubber biocomposites. Materials, 13(18), 4163 http://doi.org/10.3390/ ma13184163 PMid:32962174.
38 Karim, A. F. A., Ismail, H., & Ariff, Z. M. (2015). Properties and characterization of kenaf-filled natural rubber latex foam. BioResources, 11(1), 1080-1091 http://doi.org/10.15376/ biores.11.1.1080-1091
39 Moonart, U., & Utara, S. (2019). Effect of surface treatments and filler loading on the properties of hemp fiber/natural rubber composites. Cellulose, 26(12), 7271-7295 http://doi. org/10.1007/s10570-019-02611-w
40. Hasan, A., Rabbi, M. S., & Billah, M. M. (2022). Making the lignocellulosic fibers chemically compatible for composite: a comprehensive review. Cleaner Materials, 4, 100078 http:// doi.org/10.1016/j.clema.2022.100078.
41 Sekino, N. (2016). Density dependence in the thermal conductivity of cellulose fiber mats and wood shavings mats: investigation of the apparent thermal conductivity of coarse pores. Journal of Wood Science, 62(1), 20-26 http://doi.org/10.1007/s10086015-1523-6
42 Asdrubali, F., D’Alessandro, F., & Schiavoni, S. (2015). A review of unconventional sustainable building insulation materials. Sustainable Materials and Technologies, 4, 1-17 http://doi.org/10.1016/j.susmat.2015.05.002
43 Dikmen, N., & Ozkan, S. T. E. (2016). Unconventional insulation materials. In A. Almusaed & A. Almssad (Eds.), Insulation materials in context of sustainability (pp. 3-23). Rijeka: IntechOpen http://doi.org/10.5772/63311
44 Satish, P., Kumar, M. D. S., Prasanna, A. B., & Prakash, C. D. S. (2020). Investigation on behavioural aspects of pine apple leaf fiber-latex composites used for transformer applications. Materials Today: Proceedings, 28(Part 2), 1039-1043. http:// doi.org/10.1016/j.matpr.2019.12.348
45 Saffian, H. A., Talib, M. A., Lee, S. H., Md Tahir, P., Lee, C. H., Ariffin, H., & Mohamed Asa’ari, A. Z. (2020). Mechanical strength, thermal conductivity, and electrical breakdown of kenaf core fiber/lignin/polypropylene biocomposite. Polymers, 12(8), 1833 http://doi.org/10.3390/polym12081833 PMid:32824275.
46 Agus Suryawan, I. G. P., Suardana, N. P. G., Winaya, I. N. S., & Budiarsa Suyasa, I. W. (2020). Study on correlation between hardness and thermal conductivity of polymer composites reinforced with stinging nettle fiber. International Journal of Civil Engineering and Technology, 11(1), 94-104 http://doi. org/10.34218/IJCIET.11.1.2020.010.
47 Paiva, F. F. G., Maria, V. P. K., Barrera Torres, G., Dognani, G., Santos, R. J., Cabrera, F. C., & Job, A. E. (2019). Sugarcane bagasse fiber as semi-reinforcement filler in natural rubber composite sandals. Journal of Material Cycles and Waste Management, 21(2), 326-335 http://doi.org/10.1007/s10163-018-0801-y
48 Ubi, P. A., Adah, P. U., Ademoh, N. A., Salawu, A. A., Hassan, A. B., Dashe, J. D., & Oyeyemi, S. W. (2022). Rice husk ash reinforced natural rubber composites: effect of benzene diazonium salt treatment. Nigerian Journal of Technology, 41(5), 879-886 http://doi.org/10.4314/njt.v41i5.8
49 Gurjar, A. K., Kulkarni, S. M., Joladarashi, S., & Doddamani, S. (2024). Investigation of mechanical properties of luffa fibre reinforced natural rubber composites: implications of process parameters. Journal of Materials Research and Technology, 29, 4232-4244 http://doi.org/10.1016/j.jmrt.2024.02.133
50 Sareena, C., Ramesan, M. T., & Purushothaman, E. (2012). Utilization of coconut shell powder as a novel filler in natural rubber. Journal of Reinforced Plastics and Composites, 31(8), 533-547 http://doi.org/10.1177/0731684412439116
Received: Dec. 03, 2024
Revised: Feb. 11, 2025
Accepted: Feb. 13, 2025
Associate Editor: José A. C. G. Covas
Febriani Purba1* , Arief Rahmad Maulana Akbar1 , Agung Cahyo Legowo1 , Alan Dwi Wibowo1 , Agung Nugroho1 , Hairu Suparto2 and Raihan Sari Afifah1
1Teknologi Industri Pertanian, Universitas Lambung Mangkurat, Banjarbaru, Indonesia
2Agroekoteknologi, Universitas Lambung Mangkurat, Banjarbaru, Indonesia
*febriani.purba@ulm.ac.id
bstract
Superabsorbent hydrogels were produced using a graft copolymerization technique, utilizing hydrolyzed collagen obtained from hide trimming waste and acrylic acid as the monomer. Methylenebisacrylamide (MBA) was employed as a crosslinker. The concentrations of acrylic acid and MBA were systematically optimized to obtain maximum swelling capacity. The maximum swelling capacity was 156 g/g in distilled water. The structure of the superabsorbent was verified using FTIR spectroscopy, and the morphology was identified using SEM. Various salt solutions (NaCl, KCl, MgCl2, and CaCl2) and solutions with pH levels spanning from 1 to 13 were also utilized to evaluate the swelling capacity of hydrogels.
Keywords: hydrogels, swelling, graft copolymers, biopolymers, hide trimming waste.
Data vailability: Research data is available upon request from the corresponding author.
How to cite: Purba, F., Akbar, A. R. M., Legowo, A. C., Wibowo, A. D., Nugroho, A., Suparto, H., & Afifah, R. S. (2025). Superabsorbent hydrogel derived from hide trimming waste. Polímeros: Ciência e Tecnologia, 35(2), e20250016. https://doi.org/10.1590/0104-1428.20240098
Hydrogel, also known as a superabsorbent polymer, is a network of hydrophilic cross-linked molecules that can absorb, expand, and retain liquid several times its dry weight without dissolving[1-3]. Superabsorbent hydrogels have been employed in diverse sectors, including hygienic and agricultural product applications[1,4,5], coal dewatering[6], sealing[7,8], controlled drug delivery systems[9,10], and as additives for concrete[11]. The hydrophilic functional groups that attach to the polymer backbone of hydrogels are responsible for their water-absorbing properties. The presence of interconnections between network structures is the reason for their resistance to dissolution. When exposed to specific external factors, including temperature, solvent, pH, and electric field, hydrogels can undergo significant volume changes[12,13]. The hydrogel matrix can undergo volume changes either gradually throughout a range of stimulus levels or suddenly at certain stimulus levels.
Hydrogel structure and properties are influenced by various parameters, such as crosslinking agents, monomers, and the network chemical composition. The hydrogel exhibits great hydrophilicity, biocompatibility, and similarity to natural tissues due to hydrophilic functional groups (hydroxyl, amide, carboxylic), sulfonate groups, and polymer chains[14]
Concerns over hydrogels arise over their potential environmental impact and limitations due to their prolonged usage, toxicity, and inability to biodegrade. Today, hydrogel production focuses mainly on utilizing natural polymers due to their non-toxic nature, excellent biocompatibility, and
inherent ability to undergo natural degradation. Hydrogels can be synthesized via graft copolymerization to combine synthetic monomers with natural polymers. Some of the most widely studied natural polymers are cellulose[15], starch[16,17], gelatin[18], chitosan[19], carrageenan[20] and protein[21].
Hydrolyzed collagen (h-collagen) is a natural polymer that can be derived from the hydrolysis of solid-tanned leather waste[22]. Several previous studies have shown that h-collagen can be developed into hydrogels. Pourjavadi et al.[23] produced hydrogels by graft copolymerization of h-collagen with AA; Pourjavadi and Kurdtabar[24] made hydrogels using graft copolymerization techniques using h-collagen, AA and Aam. Marandi et al.[25] obtained hydrogels from the graft copolymerization process of h-collagen with 2-acrylamido-2-methylpropane sulfonic acid and acrylamide. Graft copolymerization was chosen as the preferred method because it can modify the chemical and physical characteristic of natural polymers[26,27]. Hide trimming waste, a by-product of the tannery process, constitutes over 75% of the solid waste produced by tanneries. The utilization of hydrolyzed collagen derived from hide trimming waste may reduce the solid waste produced by this industry.
To our knowledge, research on the utilization of h-collagen derived from hide trimming waste has not been reported in the literature except by Purba et al.[22], who discovered that h-collagen derived from hide trimming waste has significant promise as a polymer for development in Indonesia. Therefore, this study aimed to synthesize a superabsorbent hydrogel
Purba, F., Akbar, A. R. M., Legowo, A. C., Wibowo, A. D., Nugroho, A., Suparto, H., & Afifah, R. S.
from hydrolyzed collagen protein. In addition, this study also examined the impact of various reaction variables on the hydrogel’s ability to absorb water and its swelling behavior in different salt solutions and pH levels.
2.1 Tools and material
H-collagen was synthesized following the method described by Purba et al.[22]. Acrylic acid (AA), 96% ethanol, potassium persulfate (KPS), NaCl, KCl, MgCl2, CaCl2, BaCl2, NaOH, methylene bisacrylamide (MBA), HCl, and distilled water were purchas from Merck Co., Germany, and were utilized without undergoing additional purification. The tools used were a three-neck reactor, magnetic stirrer, thermostatic water bath, vacuum machine, oven, nylon cloth, Scanning Electron Microscopy (FEI Inspect S50), pH meter, and Fourier-transform Infrared Spectroscopy (Shimadzu IR Prestige-21).
2.2 Hydrogel preparation
H-collagen (1.33 g) was dissolved in 40 mL of distilled water, put into a three-neck reactor with a mechanical stirrer (300 rpm), and submerged in a thermostatic water bath at 80 °C. Next, a specific quantity of 70% neutralized AA (1.5 - 8.0 g in 5 mL of H2O) was introduced and agitated for 10 minutes. Subsequently, the crosslinker solution, consisting of 0.1 - 0.2 g of MBA dissolved in 5 mL of H2O, and the initiator solution, including 0.01-0.35 g of KPS dissolved in 5 mL of H2O, were sequentially introduced. The reaction occurred for 60 minutes and a speed of 300 rpm at 80 °C. All reactions were carried out under vacuum. The formed superabsorbent was submerged in 200 mL ethanol and left overnight. The product was then reduced in size using scissors and washed using fresh ethanol. The superabsorbent was dried at 50 °C for 12 hours in a drying oven. Once the sample was dried, it was ground to obtain a powdered product and kept in a location shielded from moisture, high temperatures, and light.
2.3 Swelling capacity in distilled water
A total of 0.2 g superabsorbent was put in a tea bag constructed from nylon fabric with a mesh size of 100. The tea bag was fully submerged in distilled water (200 mL) for 12 hours at ambient temperature. After that, the tea bag was suspended in air for 15 minutes to remove the excess solution. The formula in Equation 1 was utilized to measure equilibrium swelling (ES).
( ) / WeightofexpandedgelWeightofdrygel ESgg Weightofdrygel = (1)
2.4 Swelling capacity in various salt solutions
The impact of charge screening and ionic crosslinking on the disappearance of intense swelling in various salts has been investigated[24]. Hydrogel’s capacity to expand in KCl, NaCl, CaCl2, and MgCl2 solutions at a concentration of 0.15 mol/L was calculated using Equation 1.
2.5 Swelling capacity in various pH
Solutions with pH values of 1 to 13 were achieved by diluting NaOH (pH 13) and HCl (pH 0.1) solutions to obtain pH values of 6.0 or lower. The pH value’s precision was assessed using a pH meter. A total of 0.1 g of dry sample was utilized to assess swelling capacity using Equation 1.
2.6 Instrumental analysis
Fourier Transform Infrared Spectroscopy (FTIR) was employed to ascertain the existence of cross-linking between monomers in the superabsorbent. Observations of the superabsorbent morphology were also conducted using SEM. A coating of gold-palladium alloy was applied to the dry hydrogel powder and then examined using an SEM instrument.
2.7
Various variables influenced hydrogel’s swelling capacity. The variables in question pertain to the crosslinker (MBA) and the monomer (AA) concentration. Optimizing each of these variables is necessary to obtain a hydrogel with maximum water absorption capacity. First, a search was conducted for the best MBA crosslinker concentration with a fixed monomer variable value. Second, a search for the best AA monomer concentration with a value for the crosslinker concentration variable derived from the optimal value in the first stage. Once the ideal value for each variable had been determined, the hydrogel product was produced and analyzed.
3.1
The extraction process of h-collagen from hide trimming waste has been published in previous studies[22] The h-collagen used has a molecular weight ranging from 23-26 kDa and consists of various types of amino acids with the largest concentrations of glycine (30.01%), proline (15.26%), arginine (10.19%), and glutamic acid (8.96%). The IC50 value of h-collagen was 238.5 ppm.
The superabsorbent was produced by grafting copolymerization of AA monomer onto the hydrolyzed collagen backbone. KPS was used as an initiator and MBA as a crosslinking agent. KPS is a thermal dissociation initiator that converts to sulfate anion radicals at 80°C[28] Subsequently, the anion radical removes a hydrogen atom from one of the functional groups (COOH, NH2, OH, and SH) present on the substrate side chain, forming the corresponding radical. The macro-radical initiates the grafting process of 70% neutralized acrylic acid onto the h-collagen backbone. Furthermore, MBA facilitates a crosslinking reaction, forming a three-dimensional network, i.e. a crosslinked hydrogel copolymer.
FTIR was utilized to verify the chemical structure of the h-collagen and superabsorbent (Figure 1). The stretching of the hydroxyl groups in h-collagen results in the wide peak observed in a wavelength range of 3200-3600 cm-1

The presence of these absorption bands at 1320-1210 cm-1 for C-O, 1760-1690 cm-1 for C=O, and 3300-2500 cm-1 for OH. confirm that AA monomer grafting has occurred on h-collagen.
FTIR spectra show a wide peak in the 3200-3600 cm−1 band, indicating O–H stretching vibrations from hydroxyl groups generating hydrogen bonds. These groups are mostly hydroxyproline residues and water molecules intercalated in the triple-helix structure. Hydroxyl groups affect collagen’s solubility, viscoelasticity, and biomolecule interactions. Shoulders and Raines (2009) showed that hydroxyprolinemediated hydrogen bonding increases collagen heat stability[29] Knot and Bailey (1998) found that hydroxylation levels affect collagen crosslinking density and mechanical strength[30]
3.3
The effect of the crosslinker concentration on the ability of the hydrogel to swell is presented in Figure 2. The highest absorption capacity of 156 g/g was attained at a crosslinker concentration of 0.14 g. MBA serves primarily as a crosslinking agent, facilitating the formation of covalent bonds between polymer chains to establish a three-dimensional network. An increase in MBA concentration enhances crosslinking density, resulting in improved mechanical strength and elasticity[31] A higher crosslinking density diminishes polymer chain mobility, leading to the formation of stronger hydrogels that exhibit increased resistance to deformation. In this study swelling capacity and MBA concentration have a negative

Figure 2. The effect of crosslinking concentration on the swelling capacity of superabsorbent hydrogel. Reaction conditions: h-collagen 1.33 g, AA 4.7 g, KPS 0.15 g, 80 °C for 60 minutes.
correlation. A higher concentration of crosslinker increased the crosslink density making the rigid crosslinked structure inextensible and retaining significant water. Furthermore, enhanced crosslinking imposes further limitations within the polymer network, diminishing the capacity of hydrophilic groups to engage with water. This phenomenon has been reported by several researchers[2,32,33]
The concentration of MBA directly impacts the porosity of the hydrogel matrix, thereby influencing its diffusion characteristics. Lower MBA concentrations lead to increased pore sizes, facilitating the diffusion of molecules such as nutrients or drugs, whereas higher concentrations yield smaller
Purba, F., Akbar, A. R. M., Legowo, A. C., Wibowo, A. D., Nugroho, A., Suparto, H., & Afifah, R. S.
pores, limiting diffusion[34]. Over-crosslinking with agents like methylene bisacrylamide (MBA) restricts hydrogel expansion, reducing swelling, while under-crosslinking affects mechanical stability[35-37]
Table 1 shows the swelling capacity of several hydrogels produced from natural materials. Compared to other study the swelling capacity of our hydrogel is lower. It is believed to be attributed to disparities in the animal species and tissues employed. Furthermore, these variations may result from varying levels of partial neutralization of AA. Neutralizing carboxylic groups prior to grafting enhances swelling capacity by improving ionic interactions and osmotic pressure[36,46,47]. Various crosslinking compositions and monomer ratios. The optimal concentrations of crosslinker and acrylic acid ensure a balance between network flexibility and structural integrity[35,46]. Varied reaction conditions. The polymer uniformity is significantly influenced by temperature, initiator concentration, and reaction time, which help to prevent undesirable side reactions like phase separation[35,43,44] Other researchers utilized co-monomers like AMPS. The application of IA and AMPS enhanced salt tolerance and water absorption[42,46,48]
Figure 2 shows a power law link between ES capacity and MBA concentration. K and n represent constants specific to each superabsorbent hydrogel. The n shows the hydrogel’s sensitivity to crosslinker concentration. The K value functions as a standard for assessing the extent of swelling at a constant level of crosslinker concentration. In other words, a higher K value corresponds to a greater capacity for swelling. The curve fit to Equation 2 yielded the values of K = 80.621 and n = 4.2.
increased hydrophilicity of the superabsorbent and the AA molecules around the h-collagen macro-radicals. There is a decrease in the water absorption capacity after the maximum point. This is thought to occur due to: (a) increased chain transfer to the AA molecule, (b) increased viscosity, which causes limited movement of the reactants and deactivates the growing macro-radical chains immediately after their formation, and (c) increased graft copolymerization reactions. Other researchers have also reported similar conclusions[49,50] High grafting introduces rigid structures, limiting network expansion and water uptake[41,43]
Understanding the swelling behavior of hydrogels in salt solutions is crucial, particularly in relation to their uses in agriculture and horticulture. The properties of the external solution, specifically its charge and ionic strength, primarily influence the swelling ratio. The polymer’s inherent characteristics, such as its ability to form a flexible network, hydrophilic functional groups, and cross-linking density, also influence it. There is a negative correlation between the water absorption capacity and the ionic strength of a salt solution.
3.4 Effect of monomer concentration
The correlation between the monomer and swelling capacity was examined by altering the concentration of AA (Figure 3). The findings indicated a significant rise in absorption as the concentration of AA increased, followed by a subsequent decline. There was an increase in water absorption capacity in the first half of the experiment. This may be due to the

Figure 3. Effect of monomer concentration on swelling capacity of superabsorbent hydrogel. Reaction conditions: h-collagen 1.33 g, MBA 0.14 g, KPS 0.15 g, 80 °C for 60 minutes.
Wu et al.[38]
Yoshimura et al.[39] Chitin
Pourjavadi et al.[23] H-collagen AA
Zhang et al.[40] Chitosan AA
Pourjavadi et al.[41] H-collagen AMPS
Pourjavadi et al.[42] H-collagen AA, AMPS ~500 g/g
Pourjavadi & Salimi[43] H-collagen AA, HEMA 364 g/g
Sadeghi & Hosseinzadeh[44] Kappa carrageenan HEMA Not tested
Marandi et al.[25] H-collagen AMPS, AM ~650 g/g
Saarai et al.[45] Sodium alginate, gelatin - Swelling capacity ~400%
Sadeghi et al.[20] Carrageenan AA 370 g/g
Ibrahim et al.[18] Gelatin AM Swelling capacity >800%
This research H-collagen AA 156 g/g
Higher levels of ions in a solution reduce the osmotic pressure between the hydrogel and the salt solution. Hydrolyzed collagen possesses charged functional groups, such as carboxyl and amine, which are essential for ionic interactions in the hydrogel matrix. Salt solutions introduce cations and anions that interact with charged groups, thereby altering electrostatic interactions and the organization of the matrix. Furthermore, the extra cation screening effect on the anionic group results in poor electrostatic repulsion of anions and lowers water absorption[51]. In addition, ionic cross-linking formed when the hydrogel is in a solution containing multivalent cations causes a decrease in water absorption capacity.
Various chloride salt solutions have different ionic strengths. Figures 4 and 5 present their effects on the hydrogel swelling capacity. An elevated cation charge leads to a higher level of cross-linking. Consequently, the ability to swell reduces. Hydrogels have a higher capacity to absorb monovalent cations than divalent cations in salt solutions. Consequently, the absorption in salt solutions is greater for K+ and Na+ than Ca2+ and Mg2+. Monovalent ions primarily influence swelling by disrupting hydrogen bonding, whereas divalent ions enhance the matrix through ionic bridging. Monovalent salts decrease swelling via charge screening, while multivalent ions (Ca2+, Al3+) cause ionic crosslinking, leading to significant swelling reductions[36,41,46,51,52]
A dimensionless salt sensitivity factor (f) was also calculated for a salt solution at a concentration of 0.15 mol/L using Equation 3[53]. In this equation, Sg represents the swelling in a specific fluid, while Sd represents the swelling in deionized water. Table 2 displays the results. The f factor illustrates that the salt sensitivity is greatly influenced by the charge and radius of the cations added into the medium. The degree of cross-linking is directly proportional to the charge and radius of the cation, thus increasing the f factor. This experiment demonstrates that a hydrogel’s ability to expand in a salt solution is consistent with its ability to expand in distilled water.
Figure 6 displays the equilibrium swelling behavior of the superabsorbent material when subjected to different pH levels. The swelling capacity of the anionic superabsorbent exhibited a decrease in the presence of cations in the medium. Consequently, buffer solutions were not employed. The desired basic and acidic pH levels were achieved by diluting stock solutions of NaOH (pH 13.0) and HCl (pH 1.0).
The highest degree of swelling was achieved at a pH of 7. At pH levels below acidity, most carboxylate anions become protonated, causing the elimination of the principal repulsive forces between anions. Consequently, the superabsorbent’s ability to swell is reduced. Some carboxylate groups are ionized at pH levels between 5 and 7. This results in the electrostatic repulsion of the COO- groups, which in turn enhances their swelling capacity. Cations’ presence restricts the material’s expansion when the pH is over seven due to the charge-screening phenomenon. Comparable findings have been documented in other alternative hydrogel systems[23,54-56]


solutions with different concentrations.

6. Effect of pH on the swelling capacity of superabsorbent hydrogels.
Table 2. Swelling capacity in distilled water and various salt solutions (0.15 mol/L) and salt sensitivity factor (f).
Purba, F., Akbar, A. R. M., Legowo, A. C., Wibowo, A. D., Nugroho, A., Suparto, H., & Afifah, R. S.

Microstructural morphology is a crucial property that must be considered when evaluating hydrogels. SEM identifies pore size, surface roughness, and network uniformity as critical structural parameters that influence water and nutrient retention and release rates[57]. Research indicates that smaller, denser pores are associated with a slower release rate but enhanced encapsulation, whereas porous networks promote a more rapid swelling-mediated release[57]
Figure 7 depicts the SEM results of h-collagen and optimized hydrogel. The h-collagen and hydrogel that were evaluated were in dry preparations. This study examined hydrogel specimens in their dry state before any expansion or swelling. The drying process of the swollen hydrogel influences the results of the SEM test. Freezedrying effectively maintains the porous microstructures in hydrolyzed collagen-derived or similar protein-based superabsorbent materials, yielding superior water retention properties relative to air-drying or vacuum-drying, which lead to pore collapse and diminished swelling capacity[58]
Despite the absence of commonly employed drying procedures such as lyophilization or vacuum drying, SEM analysis confirms that the superabsorbent has a porous structure. These pores were most likely produced during the ethanol dewatering step and subsequent evaporation of ethanol from the hydrogel matrix during the drying process[59]. They are thought to be regions of water permeation and points of contact between environmental stimuli and the graft copolymer’s hydrophilic groups.
A new superabsorbent hydrogel has been successfully manufactured via graft copolymerization of AA to h-collagen obtained from hide trimming waste. The optimal reaction conditions for achieving maximum swelling capacity of 156 g/g were a dosage of 0.14 g of MBA and 4.7 g of AA. The hydrogel’s swelling capacity was found to be maximum
in the KCl solution, as observed by measuring hydrogel swelling in various salt solutions. The hydrogel displayed significant pH sensitivity, leading to observable changes in swelling across a broad pH spectrum (1-13). The study using the FTIR instrument confirmed that the grafting of AA monomer had taken place on the h-collagen backbone. Simultaneously, SEM verified that the hydrogel produced had a porous architecture.
5.
• Conceptualization – Febriani Purba.
• Data curation – Febriani Purba.
• Formal analysis – Alan Dwi Wibowo.
• Funding acquisition – Arief Rahmad Maulana Akbar.
• Investigation – Febriani Purba; Raihan Sari Afifah.
• Methodology – Febriani Purba.
• Project administration – Agung Cahyo Legowo.
• Resources – Hairu Suparto.
• Software – NA.
• Supervision – Agung Nugroho.
• Validation – Agung Nugroho.
• Visualization – Hairu Suparto.
• Writing – original draft – Febriani Purba.
• Writing – review & editing – Arief Rahmad Maulana Akbar; Agung Cahyo Legowo; Alan Dwi Wibowo; Agung Nugroho; Hairu Suparto; Raihan Sari Afifah.
6. Acknowledgements
The authors acknowledge the University of Lambung Mangkurat, Banjarmasin, Indonesia, for providing financial support for this research through the Program Dosen Wajib Meneliti (PDWM) with contract number 1293/UN8/ PG/2024 on behalf of Dr. Febriani Purba, S.T.P., M.Si.
Superabsorbent hydrogel derived from hide trimming waste
1. Buchholz, F. L., & Graham, A. T. (Eds.). (1998). Modern superabsorbentt polymer technology. New York: Wiley-VCH
2 Peppas, L. B., & Harland, R. S. (Eds.). (1990). Absorbent polymer technology Amsterdam: Elsevier
3 Dimitrov, M., Lambov, N., Shenkov, S., Dosseva, V., & Baranovski, V. Y. (2003). Hydrogels based on the chemically crosslinked polyacrylic acid: biopharmaceutical characterization. Acta Pharmaceutica, 53(1), 25-31 PMid:14769249.
4 Elbarbary, A. M., El-Rehim, H. A. A., El-Sawy, N. M., Hegazy, E.-S. A., & Soliman, E.-S. A. (2017). Radiation induced crosslinking of polyacrylamide incorporated low molecular weights natural polymers for possible use in the agricultural applications. Carbohydrate Polymers, 176, 19-28 http://doi. org/10.1016/j.carbpol.2017.08.050 PMid:28927598.
5 Deenavarman, M., Lourdusamy, D. K., Thangaselvaba, T., & Venkatesan, K. (2018). Effect of different media incorporated with Pusa hydrogel on growth and watering frequency of potted foliage plant, Arrowhead (Syngonium podophyllum Schott.). Journal of Agricultural Economics, 6(2), 71-76 http://doi. org/10.53911/JAE.2018.6209
6 Dzinomwa, G. P. T., Wood, C. J., & Hill, D. J. T. (1997). Fine coal dewatering using pH- and temperature-sensitive superabsorbent polymers. Polymers for Advanced Technologies, 8(12), 767-772 http://doi.org/10.1002/(SICI)1099-1581(199712)8:12<767::AIDPAT717>3.0.CO;2-G
7. Sun, X., Zhang, G., Shi, Q., Tang, B., & Wu, Z. (2002). Study on foaming water-swellable EPDM rubber. Journal of Applied Polymer Science, 86(14), 3712-3717 http://doi.org/10.1002/ app.11381
8 Park, J. H., & Kim, D. (2001). Preparation and characterization of water-swellable natural rubbers. Journal of Applied Polymer Science, 80(1), 115-121 http://doi.org/10.1002/10974628(20010404)80:1<115::AID-APP1079>3.0.CO;2-K
9 Dorkoosh, F. A., Brussee, J., Verhoef, J. C., Borchard, G., Rafiee-Tehrani, M., & Junginger, H. E. (2000). Preparation and NMR characterization of superporous hydrogels (SPH) and SPH composites. Polymer, 41(23), 8213-8220 http://doi. org/10.1016/S0032-3861(00)00200-7
10 Chen, J., & Park, K. (2000). Synthesis and characterization of superporous hydrogel composites. Journal of Controlled Release, 65(1-2), 73-82 http://doi.org/10.1016/S0168-3659(99)00238-2 PMid:10699272.
11. Jensen, O. M., & Hansen, P. F. (2002). Water-entrained cement-based materials. Cement and Concrete Research, 32(6), 973-978 http://doi.org/10.1016/S0008-8846(02)00737-8
12 Dušek, K., & Patterson, D. (1968). Transition in swollen polymer networks induced by intramolecular condensation. Journal of Polymer Science. Part A-2, Polymer Physics, 6(7), 1209-1216 http://doi.org/10.1002/pol.1968.160060701
13 Tanaka, T. (1978). Collapse of gels and the critical end point. Physical Review Letters, 40(12), 820-823. http://doi.org/10.1103/ PhysRevLett.40.820
14 Savaş, H., & Güven, O. (2001). Investigation of active substance release from poly(ethylene oxide) hydrogels. International Journal of Pharmaceutics, 224(1-2), 151-158 http://doi. org/10.1016/S0378-5173(01)00745-1 PMid:11472824.
15 Lionetto, F., Sannino, A., Mensitieri, G., & Maffezzoli, A. (2003). Evaluation of the degree of cross-linking of cellulose-based superabsorbentt hydrogels: a comparison between different techniques. Macromolecular Symposia, 200(1), 199-208 http:// doi.org/10.1002/masy.200351020
16 Guo, M., Liu, M., Zhan, F., & Wu, L. (2005). Preparation and properties of a slow-release membrane-encapsulated urea fertilizer with superabsorbent and moisture preservation. Industrial & Engineering Chemistry Research, 44(12), 42064211 http://doi.org/10.1021/ie0489406
17 Han, X., Chen, S., & Hu, X. (2009). Controlled-release fertilizer encapsulated by starch/polyvinyl alcohol coating. Desalination, 240(1-3), 21-26 http://doi.org/10.1016/j.desal.2008.01.047
18 Ibrahim, S., Nawwar, G. A. M., & Sultan, M. (2016). Development of bio-based polymeric hydrogel: green, sustainable and low cost plant fertilizer packaging material. Journal of Environmental Chemical Engineering, 4(1), 203-210 http://doi.org/10.1016/j. jece.2015.10.028
19 Wu, L., & Liu, M. (2008). Preparation and properties of chitosan-coated NPK compound fertilizer with controlledrelease and water-retention. Carbohydrate Polymers, 72(2), 240-247 http://doi.org/10.1016/j.carbpol.2007.08.020
20 Sadeghi, M., Ghasemi, N., & Kazemi, M. (2012). Synthesis and swelling behavior of carrageenans-graft-poly(sodium acrylate)/kaolin superabsorbent hydrogel composites. World Applied Sciences Journal, 16(1), 113-118. Retrieved in 2024, October 11, from https://www.idosi.org/wasj/wasj16(1)12/17. pdf
21 Rathna, G. V. N., & Damodaran, S. (2001). Swelling behavior of protein-based superabsorbentt hydrogels treated with ethanol. Journal of Applied Polymer Science, 81(9), 2190-2196 http:// doi.org/10.1002/app.1655
22 Purba, F., Suparno, O., Rusli, M. S., & Fatimah, I. (2023). Novel method of hydrolysed collagen extraction from hide trimming waste. International Food Research Journal, 30(2), 365-374 http://doi.org/10.47836/ifrj.30.2.08
23 Pourjavadi, A., Kurdtabar, M., Mahdavinia, G. R., & Hosseinzadeh, H. (2006). Synthesis and super-swelling behavior of a novel protein-based superabsorbentt hydrogel. Polymer Bulletin, 57(6), 813-824 http://doi.org/10.1007/s00289-006-0649-5
24 Pourjavadi, A., & Kurdtabar, M. (2007). Collagen-based highly porous hydrogel without any porogen: sytnthesis and characteristic. European Polymer Journal, 43(3), 877-889 http://doi.org/10.1016/j.eurpolymj.2006.12.020
25 Marandi, G. B., Mahdavinia, G. R., & Ghafary, S. (2011). Swelling behavior of novel protein-based superabsorbentt nanocomposite. Journal of Applied Polymer Science, 120(2), 1170-1179 http://doi.org/10.1002/app.33016
26 Okieimen, F. E. (2003). Preparation, characterization and properties of cellulose-polyacrylamide graft copolymers. Journal of Applied Polymer Science, 89(4), 913-923 http:// doi.org/10.1002/app.12014
27 Sadeghi , M. , Soleimani , F. , & Yarahmadi , M. ( 2011 ). Chemical modification of carboxymethyl cellulose via graft copolymerization and determination of the grafting parameters. Oriental Journal of Chemistry, 27(3), 967-972. Retrieved in 2024, October 11, from http://www.orientjchem.org/vol27no3/ chemical-modification-of-carboxymethyl-cellulose-via-graftcopolymerization-and-determination-of-the-grafting-parameters/
28 House, D. A. (1962). Kinetics and mechanism of oxidations by peroxydisulfate. Chemical Reviews, 62(3), 185-203. http:// doi.org/10.1021/cr60217a001
29 Shoulders, M. D., & Raines, R. T. (2009). Collagen structure and stability. Annual Review of Biochemistry, 78(1), 929-958 http://doi.org/10.1146/annurev.biochem.77.032207.120833. PMid:19344236.
30 Knott, L., & Bailey, A. J. (1998). Collagen cross-link in mineralizing tissues: a review of their chemistry, function, and clinical relevance. Bone, 22(3), 181-187 http://doi.org/10.1016/ S8756-3282(97)00279-2 PMid:9514209.
31 Arunbabu, D., Shahsavan, H., Zhang, W., & Zhao, B. (2013). Poly(AAc-co-MBA) hydrogel films; adhesive and mechanical properties in aqueous medium. The Journal of Physical Chemistry B, 117(1), 441-449 http://doi.org/10.1021/jp3101688
32 Peppas, N. A. (Ed.). (1986). Hydrogels in medicine and pharmacy. Boca Raton: CRC Press.
33 Flory, P. J. (1953). Principles of polymer chemistry New York: Cornell University Press
Purba, F., Akbar, A. R. M., Legowo, A. C., Wibowo, A. D., Nugroho, A., Suparto, H., & Afifah, R. S.
34 Lanzalaco, S., Del Valle, L. J., Turon, P., Weis, C., Estrany, F., Aleman, C., & Armelin, E. (2020). Polypropylene mesh for hernia repair with controllable cell adhesion/de-adhesion properties. Journal of Materials Chemistry. B, Materials for Biology and Medicine, 8(5), 1049-1059 http://doi.org/10.1039/ C9TB02537E PMid:31939983.
35 Sadeghi, M., & Hosseinzadeh, H. (2013). Synthesis and properties of collagen-g-poly(sodium acrylate-co-2-hydroxyethylacrylate) superabsorbent hydrogels. Brazilian Journal of Chemical Engineering, 30(2), 379-389. http://doi.org/10.1590/S010466322013000200015
36 Sadeghi, M., & Yarahmadi, M. (2011). Synthesis of a novel pH- and salt-responsive super absorbent hydrogel based on collagen-g-poly(AA-co-IA). Oriental Journal of Chemistry, 27(2), 453-460. Retrieved in 2024, October 11, from https://www. orientjchem.org/pdf/vol27no2/OJC_Vol27_No2_p_453-460.pdf
37 Pourjavadi, A., Hosseinzadeh, H., & Sadeghi, M. (2007). Synthesis, characterization and swelling behavior of gelating-poly(sodium acrylate)/kaolin superabsorbent hydrogel composites. Journal of Composite Materials, 41(17), 20572069 http://doi.org/10.1177/0021998307074125
38 Wu, J., Wei, Y., Lin, J., & Lin, S. (2003). Study on starchgraft-acrylamide/mineral powder superabsorbent composite. Polymer, 44(21), 6513-6520 http://doi.org/10.1016/S00323861(03)00728-6.
39 Yoshimura, T., Uchikoshi, I., Yoshiura, Y., & Fujioka, R. (2005). Synthesis and characterization of novel biodegradable superabsorbent hydrogels based on chitin and succinic anhydride. Carbohydrate Polymers, 61(3), 322-326. http:// doi.org/10.1016/j.carbpol.2005.06.014
40 Zhang, J., Wang, Q., & Wang, A. (2007). Synthesis and characterization of chitosan-g-poly(acrylic acid)/attapulgite superabsorbent composites. Carbohydrate Polymers, 68(2), 367-374 http://doi.org/10.1016/j.carbpol.2006.11.018
41 Pourjavadi, A., Salimi, H., & Kurdtabar, M. (2007). Hydrolyzed collagen-based hydrogel with salt and pH-responsiveness properties. Journal of Applied Polymer Science, 106(4), 23712379 http://doi.org/10.1002/app.26682
42 Pourjavadi, A., Kurdtabar, M., & Ghasemzadeh, H. (2008). Saltand pH-resisting collagen-based highly porous hydrogel. Polymer Journal, 40(2), 94-103 http://doi.org/10.1295/polymj.PJ2007042
43 Pourjavadi, A., & Salimi, H. (2008). New protein-based hydrogel with superabsorbing properties: effect of monomer ratio on swelling behavior and kinetics. Industrial & Engineering Chemistry Research, 47(23), 9206-9213 http://doi.org/10.1021/ ie8002478
44 Sadeghi, M., & Hosseinzadeh, H. (2010). Synthesis and superswelling behavior of a novel low salt-sensitive protein-based superabsorbentt hydrogel: collagen-g-poly(AMPS). Turkish Journal of Chemistry, 34(5), 5
45. Saarai, A., Kasparkova, V., Sedlacek, T., & Saha, P. (2011). A comparative study of crosslinked sodium alginate/gelatin hydrogels for wound dressing. In Proceedings of the 4th WSEAS international conference on Energy and development - environment - biomedicine (GEMESED’11) (pp. 384-389). Stevens Point, Wisconsin, USA: World Scientific and Engineering Academy and Society (WSEAS)
46 Sadeghi, M., & Ghasemi, N. (2012). Synthesis and study on effect of various chemical conditions on the swelling property of collagen- g -poly(AA- co -IA) superabsorbent hydrogel. Indian Journal of Science and Technology, 5(1), 1-6 http:// doi.org/10.17485/ijst/2012/v5i1.11.
47 Pourjavadi, A., Salimi, H., Amini-Fazl, M. S., Kurdtabar, M., & Amini-Fazl, A. R. (2006). Optimization of synthetic conditions of a novel collagen-based superabsorbent hydrogel by Taguchi method and investigation of its metal ions adsorption. Journal of Applied Polymer Science, 102(5), 4878-4885 http://doi. org/10.1002/app.24860
48 Wang, Y., Shi, X., Wang, W., & Wang, A. (2013). Synthesis, characterization, and swelling behaviors of a pH-responsive CMC-g-poly(AA-co-AMPS) superabsorbent hydrogel. Turkish Journal of Chemistry, 37(1), 11. .
49 Lee, W.-F., & Yuan, W.-Y. (2000). Thermoreversible hydrogels X: synthesis and swelling behavior of the (N-isopropylacrylamideco-sodium 2-acrylamido-2-methylpropyl sulfonate) copolymeric hydrogels. Journal of Applied Polymer Science, 77(8), 1760-1768 http://doi.org/10.1002/1097-4628(20000822)77:8<1760::AIDAPP13>3.0.CO;2-J
50. Athawale, V. D., & Vidyagauri, V. L. (1998). Graft copolymerization onto starch. 3: grafting of acrylamide using ceric ion initiation and preparation of its hydrogels. Stärke, 50(10), 426-431 http:// doi.org/10.1002/(SICI)1521-379X(199810)50:10<426::AIDSTAR426>3.0.CO;2-#
51 Sadeghi, M., Hamzeh, A., D’Amore, A., Acierno, D., & Grassia, L. (2008). Novel crosslinked graft copolymer of methacrylic acid and collagen as a protein‐based superabsorbent hydrogel with salt and ph‐responsiveness properties. AIP Conference Proceedings, 1042(1), 348-350 http://doi.org/10.1063/1.2989060
52 Lee, W.-F., & Wu, R.-J. (1996). Superabsorbent polymeric materials. I. Swelling behaviors of crosslinked poly(sodium acrylate-co-hydroxyethyl methacrylate) in aqueous salt solution. Journal of Applied Polymer Science, 62(7), 1099-1114. http:// doi.org/10.1002/(SICI)1097-4628(19961114)62:7<1099::AIDAPP16>3.0.CO;2-1
53 Marandi, G. B., Hariri, S., & Mahdavinia, G. R. (2009). Effect of hydrophobic monomer on the synthesis and swelling behaviour of a collagen-graft-poly[(acrylic acid)-co-(sodium acrylate)] hydrogel. Polymer International, 58(2), 227-235. http://doi.org/10.1002/pi.2520
54 Park, S.-E., Nho, Y.-C., Lim, Y.-M., & Kim, H.-I. (2004). Preparation of pH-sensitive poly(vinyl alcohol-g-methacrylic acid) and poly(vinyl alcohol-g-acrylic acid) hydrogels by gamma ray irradiation and their insulin release behavior. Journal of Applied Polymer Science, 91(1), 636-643 http:// doi.org/10.1002/app.13211.
55 Pourjavadi, A., Sadeghi, M., & Hosseinzadeh, H. (2004). Modified carrageenan. 5. Preparation, swelling behavior, salt- and pH-sensitivity of partially hydrolyzed crosslinked carrageenan-graft-polymethacrylamide superabsorbent hydrogel. Polymers for Advanced Technologies, 15(11), 645-653 http:// doi.org/10.1002/pat.524.
56 Pourjavadi, A., Amini-Fazl, M. S., & Hosseinzadeh, H. (2005). Partially hydrolyzed crosslinked alginate-graft-polymethacrylamide as a novel biopolymer-based superabsorbent hydrogel having pH-responsive Properties. Macromolecular Research, 13(1), 45-53 http://doi.org/10.1007/BF03219014
57 Xu, S., Li, X., Wang, Y., Hu, Z., & Wang, R. (2019). Characterization of slow-release collagen-g-poly(acrylic acid-co-2-acrylamido2-methyl-1-propane sulfonic acid)–iron(III) superabsorbent polymer containing fertilizer. Journal of Applied Polymer Science, 136(11), 47178 http://doi.org/10.1002/app.47178
58 Álvarez-Castillo, E., Bengoechea, C., Felix, M., & Guerrero, A. (2021). Freeze-drying versus heat-drying: effect on proteinbased superabsorbent material. Processes, 9(6), 1076 http:// doi.org/10.3390/pr9061076.
59 Kabiri, K., Omidian, H., & Zohuriaan-Mehr, M. (2003). Novel approach to highly porous superabsorbent hydrogels: synergistic effect of porogens on porosity and swelling rate. Polymer International, 52(7), 1158-1164 http://doi.org/10.1002/pi.1218
Received: Oct. 11, 2024
Revised: Jan. 14, 2025
Accepted: Feb. 24, 2025
Editor-in-Chief: Sebastião V. Canevarolo
Viviane Silva Valladão1 , Fernando Gomes de Souza Júnior1,2,3* , Sérgio Thode Filho4 , Fabíola da Silveira Maranhão1 , Letícia de Souza Ribeiro4 , Maria Eduarda da Silva Carneiro4 and Raynara Kelly da Silva dos Santos4
1Instituto de Macromoléculas Professora Eloisa Mano, Universidade Federal do Rio de Janeiro, Rio de Janeiro, RJ, Brasil
2Programa de Engenharia da Nanotecnologia, Coordenação dos Programas de Pós-Graduação e Pesquisa de Engenharia – COPPE, Universidade Federal do Rio de Janeiro, Rio de Janeiro, RJ, Brasil
3College of Engineering and Computing, Florida International University, Miami, FL, United States of America
4Instituto Federal de Educação Tecnológica do Rio de Janeiro – IFRJ, Duque de Caxias, RJ, Brasil
*fernando_gomes@ima.ufrj.br
Obstract
Microplastic pollution poses a significant environmental and health challenge due to its persistence and pervasive distribution across ecosystems. This study investigates public perceptions of microplastics, focusing on their environmental and health impacts, through semi-structured interviews with 96 participants from diverse educational backgrounds in Rio de Janeiro, Brazil. Sentiment analysis, hierarchical clustering, and machine learning techniques were employed to analyze the data. Participants ‘ educational levels and interview locations influenced substantial variability in awareness and attitudes towards microplastics. Academic groups, particularly those specialized in environmental sciences, expressed higher concerns than less specialized or non-academic groups. Sentiment analysis indicated a predominance of neutral to mildly positive sentiments, with 36 distinct clusters identified. The study highlights the need for targeted educational interventions to bridge knowledge gaps and promote pro-environmental behaviors. The results underscore the role of academic background in shaping public perceptions, suggesting tailored communication strategies to mitigate microplastic pollution.
Keywords: education, environmental perception, microplastics, sentiment analysis.
Data Ovailability: Research data is available upon request from the corresponding author.
How to cite: Valladão, V. S., Souza Júnior, F. G., Thode Filho, S., Maranhão, F. S., Ribeiro, L. S., Carneiro, M. E. S., & Santos, R. K. S. (2025). Sentiment mapping of microplastic awareness in educational environments. Polímeros: Ciência e Tecnologia, 35(2), e20250017. https://doi.org/10.1590/0104-1428.20240119
1. Introduction
Plastics are instrumental in modern society, permeating nearly every culture and social class today[1-12]. From the advent of the first synthetic plastic, Bakelite, in 1907, it has been preserving its dominance till now by serving humanity for countless purposes[13]. It can be utilized in several modern-day industries, such as electronics, construction, packaging, and medicine[14-17]. They have become indispensable, improving lives in countless ways, such as enabling the production of medical devices used in critical care[18,19]. Also, the food industry relies heavily on plastic for packaging, promoting food safety and waste reduction[20-22]
However, despite these advantages, inadequate plastic waste management has escalated in the past decades, becoming a significant global problem. The United Nations Educational, Scientific, and Cultural Organization’s (UNESCO) Intergovernmental Oceanographic Commission
(IOC) estimated that 8-10 million metric tons of plastic waste end up in the oceans annually[23]. Marine pollution has severe consequences for the environment and economics worldwide[24], inflicting global damages on human health, biodiversity loss, and others, with an estimated cost of over $2.2 trillion annually[25]. Besides all efforts, only 9% of the plastic waste discontinued into the ocean is being recycled, while the largest portion persists in the ocean. The rest of the plastic either remains in landfills or is incinerated, releasing harmful chemicals into the atmosphere[23-25]
Once in the environment, all this plastic waste exposed to weathering degrades into smaller particles, also known as plastic debris. These fragments, which range in size to the micrometric level, dismantle in the ocean and permeate all sorts of life forms, from the smallest invertebrates to the largest species of whales[26,27]. The persistence of microplastics
Valladão, V. S., Souza Júnior, F. G., Thode Filho, S., Maranhão, F. S., Ribeiro, L. S., Carneiro, M. E. S., & Santos, R. K. S.
in the environment has sparked growing concern among environmentalists, scientists, and the general public in the twenty-first century[28]
Defined as plastic particles smaller than 5 mm, microplastics originate either from the direct release of primary microplastics, such as microbeads found in cosmetics and industrial cleaners or are the product from the degradation of larger plastic parts through natural processes including ultraviolet light, wearing or biotic activity[29-31]. Microplastics’ ability to persist in marine ecosystems and be transported through the atmosphere makes them capable of being present in the planet’s most far-flung regions. Recent research revealed microplastic presence even in the most remote areas of our planet, such as Antarctica and the Himalayas[32,33].
Microplastics are a growing concern due to their potential impacts. Their ability to persist in the environment and their potential to bioaccumulate in organisms pose significant risks to ecosystems and human health[34]. The literature review for this article reveals that some of the existing studies have implications of microplastics breaking food chains, accumulating in living species, and even passing the placenta barrier[31,35-37] Consequently, the World Health Organization (WHO) has raised concerns through its unveiled report regarding the threats of health impacts of microplastic consumption via food items, air, and water. Although scientific data is insufficient to infer health effects, its known that their deposition in the alveolar regions of the lungs, where their biopersistence can have adverse effects, such as asthma and other respiratory disorders[38]. Recent scientific literature points to the need for a more indepth investigation of the reasons for cultural differences in perceptions and behavior concerning microplastics[39]
Therefore, this research aimed to explore citizens’ perceptions of microplastics’ impacts on the environment and human health through qualitative methodologies, specifically semi-structured interviews. Understanding these perceptions has significant implications for shaping environmental and public health policies, as public awareness and attitudes are critical drivers of policy effectiveness. Additionally, the influence of the media in shaping public understanding of microplastics must be considered. The literature underscores the media’s role in amplifying or distorting environmental issues, highlighting the need for well-crafted communication strategies that raise awareness and encourage behavioral change[40].
This research underscores the importance of targeted educational interventions to promote pro-environmental behaviors, with environmental values mediating in shaping these behaviors. By applying advanced analytical techniques such as sentiment analysis, hierarchical clustering, and machine learning, this study provides a nuanced understanding of the public’s perceptions, offering valuable insights for policymakers and educators to develop more effective strategies for addressing microplastic pollution[41,42]
The research team designed a 12-question, open-ended questionnaire to assess the public’s perception of microplastics
and their associated risks. The sample group consisted of individuals in Rio de Janeiro and its metropolitan region. The questionnaire was administered orally by research team members over two days in October 2023, and 96 participants from diverse educational backgrounds participated.
The questionnaire was structured into three sections. The first section gathered demographic information, such as educational level, gender, and age. The second section explored participants’ awareness of microplastics, covering such issues as the sources of microplastic pollution, particle size, and the environmental and health risks posed by microplastics. The third section focused on participants’ opinions on potential actions to address microplastic pollution, including views on recycling, government regulations, and the role of industries in mitigating the issue.
Participants were categorized into five groups based on their educational backgrounds and locations:
● Control group: Citizens in public spaces with varying levels of academic education.
● Academic group from Literacy Courses: Participants from the Federal University of Rio de Janeiro (UFRJ) literacy programs.
● The non-specialized academic group from UFRJ’s Technological Center (CT) consists of university students who do not specialize in plastics or related fields.
● Secondary technical students from IFRJ/CDUC: Students with a background in chemistry.
● The postgraduate group from the Institute of Macromolecules Professor Eloisa Mano (IMA/ UFRJ): Professors, Master’s, and Ph.D. students specializing in macromolecular sciences.
This comprehensive grouping allowed for a nuanced analysis of perceptions based on educational background, providing insight into how knowledge and academic exposure influence awareness and attitudes toward microplastic pollution.
After the interviews, the audio recordings were transcribed using Take a Blip - Viratexto (blib.ai), integrated with the WhatsApp platform. This tool allows for easy transcription by sending the audio file via chat after accepting the terms of use. The transcriptions were reviewed manually to correct spelling errors or misinterpretations, ensuring accuracy in capturing the participants’ responses. Once the necessary corrections were made, the transcripts were saved as plain text files (*.txt) for further analysis. These text files were then processed using a sentiment analysis system to categorize and evaluate the emotional tone of the responses. The study employed hierarchical clustering and connection mapping techniques to identify groups and individuals with varying interest levels or concerns regarding microplastics.
Applying Artificial Intelligence (AI) in the data analysis allowed for a deeper, more structured interpretation of the
Sentiment mapping of microplastic awareness in educational environments
participants’ sentiments. By leveraging advanced AI tools, the research achieved a higher level of precision in identifying patterns, thus contributing to the robustness and scientific rigor of the study.
Sentiment analysis was performed using a systematic and structured approach with Python, a machine learning and data mining tool, to analyze the corpus of texts obtained from interviews with students and teachers. The methodological process consisted of several sequential steps designed to prepare and analyze the data effectively.
Data Import and Preparation: Textual documents were initially imported from a folder labeled “TXTs”, with the software configured to process the Portuguese language. This phase involved applying lemmatization, part-ofspeech tagging (POS), and named entity recognition (NER) to normalize and enrich the linguistic data.
Corpus Construction: The data was consolidated into a corpus, and each document was assigned a unique identifier based on the ‘name’ variable. The primary focus of the analysis was on the textual content, ensuring a structured approach to managing the information.
Text Pre-processing: The texts were cleaned and structured, including converting all characters to lowercase and removing accents, URLs, and unnecessary common words (stopwords) in Portuguese. Tokenization was performed using regular expressions to identify words and separate them from punctuation, further refining the text for analysis.
Bag of Words (BoW) Modeling: A Bag of Words model was employed to transform the textual data into a quantitative representation. This involved counting term frequency and applying the smoothed Inverse Document Frequency (IDF) to weigh the importance of each term in the corpus. L2 regularization was used to prevent overfitting and ensure a balanced distribution of term weights across the dataset.
Distance Calculation: The similarity between the documents was quantified by calculating the distances between feature vectors. While the specific metric was not explicitly defined, the software offered a range of distance measures such as Euclidean, Manhattan, and Mahalanobis, allowing for flexibility in measuring document proximity.
Sentiment Analysis: Sentiment classification was conducted using a multilingual algorithm compatible with Portuguese. This algorithm categorized the sentiments expressed in the text as positive, negative, or neutral. This approach efficiently interpreted the emotional valence of the content without requiring customized sentiment dictionaries.
The combination of natural language processing (NLP) and machine learning (ML) techniques enabled a detailed and nuanced analysis of the sentiments expressed by the participants. The methodology provided qualitative and quantitative insights, comprehensively understanding public attitudes toward microplastics.
This study analyzed interviews with participants in the academic community, school environments, and the general public (control group) to assess awareness and attitudes toward microplastic pollution. The primary goal was to understand how these perceptions influence sustainable behaviors and identify directions for effective educational and policy interventions. Machine learning methodologies were employed to reveal patterns within the collected data.
The hierarchical clustering process identified an intricate structure in the responses, with the average-link configuration displaying groupings based on the similarity of textual responses. The analysis revealed 36 distinct clusters where proximity patterns suggested content and emotional response affinities. Demographic factors, such as educational background and prior knowledge, were significant in shaping these groupings, emphasizing the role of education in determining awareness and attitudes toward microplastics. After processing through sentiment analysis, lemmatization, and Bag of Words modeling, the data allowed for more unambiguous identification of perception patterns. Distance metrics further facilitated the understanding of how different participant groups related to the issue based on their educational levels and other demographic factors. The sentiment analysis revealed varying degrees of concern, with academic groups, especially those specialized in environmental fields, expressing higher concerns than the control group. The MDS process provided a spatial representation of the data, with a Kruskal stress metric of 0.389, indicating good preservation of the original distances after reducing the data to two dimensions. This spatial representation allowed for a clear visualization of the semantic relationships between participants’ responses without imposing a fixed number of clusters, offering a fluid observation of group dynamics and interactions.
Figure 1 illustrates the sentiment analysis results using a color gradient ranging from -4 (most negative) to 5 (most optimistic). Blue represents the most negative sentiments, yellow is the most positive, and green is neutral. The sentiment gradient indicates that most responses fell within the neutral to mildly positive range, with a higher occurrence of positive attitudes towards potential solutions for microplastic pollution.
Figure 1 also differentiates respondents by gender and educational level. Circles represent female respondents from secondary-technical education at IFRJ/CDUC, while triangles represent male respondents from superior education at IFRJ/CDUC. The X denotes female respondents from UFRJ literature courses, while crosses and lozenges indicate male and female respondents from superior education backgrounds in public spaces like the Shopping Center. The stars represent participants with diverse educational backgrounds.
The sentiment analysis revealed that respondents from academic environments, particularly those with a background in chemistry or environmental sciences, displayed more positive attitudes (green to yellow) compared to the general public, whose sentiments leaned more neutral. This suggests that educational context and proximity to scientific knowledge are crucial in shaping attitudes toward microplastic pollution.
V. S., Souza Júnior, F. G., Thode Filho, S., Maranhão, F. S., Ribeiro, L. S., Carneiro, M. E. S., & Santos, R. K. S.

Figure 2 illustrates the sentiment distribution across different locations where interviews were conducted, including the Technological Center of UFRJ (CT), IFRJ/ CDUC, the Macromolecular Institute (IMA), Literacy Courses (L), and the Shopping Center (S). This graphical representation shows a clear differentiation in sentiment across these locations.
Interviewees from the Technological Center (CT) and IFRJ/CDUC displayed a stronger awareness of the impacts of microplastics, with a more varied emotional response compared to participants from the Literacy Courses (L) and the Shopping Center (S). This indicates that the location and educational environment significantly influenced the participants’ perceptions.
While CT and IFRJ/CDUC respondents demonstrated heightened concern and a broader range of emotional responses, participants from Literacy Courses, showed limited interest in the subject. Similarly, respondents from the Shopping Center displayed a nearly equal balance between positive and negative sentiments, suggesting that public spaces may host a more indifferent or less informed demographic regarding environmental issues.
Participants from the Macromolecular Institute (IMA), a specialized academic group, exhibited the least diversity in sentiment. The responses leaned slightly positive, reflecting a more optimistic outlook towards potential solutions for addressing microplastic pollution, possibly due to their advanced understanding of the subject matter and prospects in microplastic mitigation.
Figure 3 illustrates the sentiment distribution based on the participants’ education levels, categorized as primary

education (EF), secondary education (EM), and higher education (ES). The figure highlights the variation in emotional responses towards microplastics among individuals from different educational backgrounds.
Participants with secondary (EM) and higher education (ES) exhibited a broader range of sentiments towards microplastic pollution, showing more awareness and sensitivity to the issue. Those currently enrolled in educational institutions, particularly at CT and IFRJ, demonstrated a heightened sensitivity to the topic. This indicates that formal education, especially in scientific or technological fields, is pivotal in shaping attitudes toward environmental concerns.
In contrast, participants from Literacy Courses demonstrated limited knowledge and concern regarding microplastics despite their educational engagement. The lack of strong sentiment in these groups suggests that more than mere academic involvement is required to foster awareness of environmental issues without targeted education.

At the Shopping Center (S), where respondents came from diverse educational backgrounds, there was no clear or consistent stance on microplastics, indicating that public spaces may harbor a more indifferent or less engaged demographic.
The most striking result is from participants with only primary education (EF), who showed little concern or opinion about microplastics. This lack of awareness underscores the need for early-stage educational interventions to address environmental knowledge gaps and encourage pro-environmental behaviors. These findings confirm that educational background significantly influences perceptions and attitudes toward microplastics, with higher education levels correlating with increased awareness and concern.
Figure 4 illustrates the sentiment distribution across gender categories, including female (Fem), male (Mas), and non-binary/indeterminate (Ind) participants. The graphical representation shows distinct differences in how participants of different genders perceive the issue of microplastic pollution.
Both men and women demonstrated concern about the issue, with noticeable variations in the intensity and polarity of their sentiments. Male respondents exhibited a broader range of emotions, including higher positive sentiments, indicating a more vital interest in the microplastics issue than female respondents. This suggests that male participants engage more actively with the topic or potentially have greater exposure to information related to microplastic pollution.
While still concerned, female respondents displayed a more neutral to mildly positive sentiment, with fewer extreme responses than their male counterparts. This may indicate a moderate level of awareness but less pronounced emotional engagement with the issue.
Regarding non-binary/indeterminate (Ind) participants, the sentiment distribution was relatively narrow, with responses concentrated around neutral. No significant trend or behavioral pattern was observed within this group, and it was impossible to ascertain a clear position on the issue of microplastics. This could suggest a need for more awareness or a more cautious approach.
Overall, the data indicates that gender plays a role in shaping attitudes toward microplastic pollution, with men showing a slight tendency toward stronger opinions and engagement. However, the differences between male and female participants are not stark, suggesting that awareness campaigns and educational interventions can be broadly applied across genders to address the issue effectively.
Figure 5 presents a general overview of the sentiment analysis, showing the density distribution of responses across the sentiment spectrum. The graph illustrates that most responses clustered around neutral sentiment, followed by moderately negative and moderately positive sentiments.
The density plot reveals that many participants expressed neutral or slightly concerned views on microplastic pollution. This suggests that, while many individuals are aware of the issue, it does not provoke strong emotional reactions. These neutral responses may reflect a limited understanding of microplastics’ environmental and health impacts or a lack of exposure to comprehensive information on the subject.
Moderately negative sentiments were the next most common. These responses likely stem from participants with a greater awareness of the harmful effects of microplastics, particularly those concerned about environmental degradation and health risks. The concern is especially evident among those with higher levels of education or specialized academic backgrounds, as seen in other sections of the analysis.
Positive sentiments, while present, were less frequent. These optimistic responses reflect confidence in mitigation strategies, such as recycling programs or future technological solutions to microplastic pollution. However, the lower occurrence of positive responses indicates a general skepticism or lack of trust in current efforts to combat the problem.
The analysis underscores that most participants hold neutral or mildly concerned views, with only a minority expressing strong positive or negative opinions. This sentiment landscape highlights the need for enhanced public awareness campaigns and educational efforts to foster deeper engagement with environmental issues like microplastic pollution.
V. S., Souza Júnior, F. G., Thode Filho, S., Maranhão, F. S., Ribeiro, L. S., Carneiro, M. E. S., & Santos, R. K. S.


A significant innovation of this study lies in its application of advanced analytical techniques, such as sentiment analysis, hierarchical clustering, and machine learning. Incorporating Multidimensional Scaling (MDS) further enhanced the analysis by visually representing the semantic relationships between participant responses, uncovering subtle patterns those traditional qualitative methods might overlook.
The findings emphasize the need for targeted educational efforts to address the public’s knowledge gaps, especially among individuals with lower levels of formal education or those outside specialized academic fields. Tailored educational programs that effectively communicate microplastics’ environmental and health impacts can promote proenvironmental behavior across various demographic groups.
From a policy perspective, the study suggests that public sentiment should inform the design of regulations and initiatives to mitigate microplastic pollution. Incorporating diverse perceptions into policy frameworks ensures that interventions are more attuned to public attitudes, leading
to more sustainable practices. Additionally, it underscores the importance of media and communication strategies in shaping public perceptions, highlighting the need for welldesigned campaigns to engage broader audiences and foster informed public action.
While the study acknowledges certain limitations, these challenges reflect the broader research context in this emerging field. The sample size, though limited to 96 participants, provides valuable insights into the variability of perceptions within a diverse urban population. Although localized to Rio de Janeiro, the study offers a meaningful case study that serves as a foundation for future research in different cultural and regional contexts. The predominance of neutral sentiments underscores the complexity of public understanding of microplastics and indicates that the topic still requires greater public engagement. The absence of notable trends among non-binary participants suggests an opportunity for future studies to adopt a more inclusive approach, expanding the scope of research to underrepresented groups.
This study applied machine learning methodologies to analyze perceptions and attitudes toward microplastics among individuals in academic settings and the broader educational environment. The clustering process highlights how educational background and prior knowledge shape attitudes toward microplastics, with academics, particularly in environmental sciences, exhibiting higher concern and requiring advanced, technical discussions rather than introductory materials. In contrast, the general public (control group) showed lower concern levels, necessitating more engaging and accessible communication strategies such as interactive media, infographics, and social campaigns.
The sentiment analysis, presented via a color gradient, quantified participants’ emotional responses, revealing a wide range of feelings towards microplastics. Some responses displayed positive sentiments, potentially linked to confidence in mitigation efforts or advancements in recycling technologies. Conversely, negative responses likely reflected deep concerns about environmental degradation and the health risks posed by microplastics. The spectrum of responses highlights the complexity of public engagement with the issue.
In conclusion, this study confirms a tangible level of awareness among participants regarding microplastics, though their sentiments reflect a mix of concerns, knowledge, and misconceptions. The data gathered is valuable for designing educational interventions and shaping public policies that deepen understanding and foster greater engagement with environmental strategies to combat microplastic contamination. Future efforts should address the identified knowledge gaps and promote informed, pro-environmental behavior, particularly within educational contexts.
• Conceptualization – Fernando Gomes de Souza Júnior; Viviane Silva Valladão; Sérgio Thode Filho.
• Data curation – Viviane Silva Valladão.
• Formal analysis – Viviane Silva Valladão; Letícia de Souza Ribeiro; Maria Eduarda da Silva Carneiro; Raynara Kelly da Silva dos Santos.
• Funding acquisition - Fernando Gomes de Souza Júnior
• Investigation – Viviane Silva Valladão; Letícia de Souza Ribeiro; Maria Eduarda da Silva Carneiro; Raynara Kelly da Silva dos Santos.
• Methodology – Fernando Gomes de Souza Júnior; Viviane Silva Valladão; Sérgio Thode Filho.
• Project administration – Fernando Gomes de Souza Júnior; Viviane Silva Valladão.
• Resources – Fernando Gomes de Souza Júnior.
• Software – Fernando Gomes de Souza Júnior.
• Supervision – Fernando Gomes de Souza Júnior.
• Validation – Fabíola da Silveira Maranhão; Sérgio Thode Filho.
• Visualization – Sérgio Thode Filho; Fabíola da Silveira Maranhão.
• Writing – original draft – Viviane Silva Valladão.
• Writing – review & editing – Fernando Gomes de Souza Júnior; Sérgio Thode Filho; Fabíola da Silveira Maranhão.
The authors would like to express their gratitude to the following funding agencies for their generous support and scholarships: Agência Nacional de Petróleo (PRH 16.1), Conselho Nacional de Desenvolvimento Científico e Tecnológico (CNPq - BRICS 440090/2022-9, PQ1D 302508/2022-8, SiBEN 446377/2023-6, Universal 402901/2023-1, CoopInternacional 441135/2023-4 & 201304/2024-4), Coordenação de Aperfeiçoamento de Pessoal de Nível Superior (CAPES - Finance Code 001), Fundação Carlos Chagas Filho de Amparo à Pesquisa do Estado do Rio de Janeiro (FAPERJ - E-26/210.800/2021 Energy, E-26/211.122/2021 COVID, E-26/210.511/2021 ConBraPA2022, E-26/201.154/2021&E-26/204.115/2024 CNE, E-26/210.080/2023 Thematic, E-26/210.806/2023 ConBraPA2024, E-26/210.267/2023 SiBEN, E-26/210.080/2023 Microplastics), and REPSOL IMA 25485.
7. References
1 Bouchoul, B., & Benaniba, M. T. (2021). Assessment of derived sunflower oil as environmentally friendly plasticizers in poly vinyl chloride. Polímeros: Ciência e Tecnologia, 31(3), e2021025 http://doi.org/10.1590/0104-1428.20210015
2 Rendón-Villalobos, R., Lorenzo-Santiago, M. A., OlveraGuerra, R., & Trujillo-Hernández, C. A. (2022). Bioplastic composed of starch and micro-cellulose from waste mango: mechanical properties and biodegradation. Polímeros: Ciência e Tecnologia, 32(3), e2022026 http://doi.org/10.1590/01041428.20210031
3. Flores, M. F., Cordeiro, L., & Curvelo, A. A. S. (2023). Cellulose fiber network as reinforcement of thermoplastic paraffin films. Polímeros: Ciência e Tecnologia, 33(2), e20230023 http://doi. org/10.1590/0104-1428.20230022
4 França, R. A., Rosa, A. C. F. S., Braz, C. J. F., Barbosa, R., & Alves, T. S. (2024). Development of mulch films from biodegradable polymer and agro-industrial waste. Polímeros: Ciência e Tecnologia, 34(1), e20230042 http:// doi.org/10.1590/0104-1428.20230043
5 Puca Pacheco, M., Tinoco Gómez, O. R., Canché Escamilla, G., Duarte Aranda, S., & Neira Velázquez, M. G. (2022). Obtaining and characterization of bioplastics based on potato starch, aloe, and graphene. Polímeros: Ciência e Tecnologia, 32(4), e2022037 http://doi.org/10.1590/0104-1428.20220084
6 Silva, S. C., Carvalho, F. A., & Yamashita, F. (2024). Potential biodegradable materials containing oat hulls, TPS, and PBS by thermoplastic injection. Polímeros: Ciência e Tecnologia, 34(3), e20240026 http://doi.org/10.1590/0104-1428.20240019
7 Valente Morales, Y., Montoya-Ballesteros, L. C., Robles-Ozuna, L. E., Martínez Núñez, Y. Y., Fortiz Hernández, J., EncinasEncinas, J. C., & Madera-Santana, T. J. (2024). Processing and characterization of biocomposites based on polylactic acid and coconut by-products. Polímeros: Ciência e Tecnologia, 34(2), e20240020 http://doi.org/10.1590/0104-1428.20240032
8. Kataoka, L. F. M. S., Falla, M. D. P. H., & Luz, S. M. (2024). Properties of regenerated cellulose films with silver nanoparticles and plasticizers. Polímeros: Ciência e Tecnologia, 34(3), e20240028 http://doi.org/10.1590/0104-1428.20240025
Valladão, V. S., Souza Júnior, F. G., Thode Filho, S., Maranhão, F. S., Ribeiro, L. S., Carneiro, M. E. S., & Santos, R. K. S.
9 Souza, L. A., Francisquetti, E. L., Dalagnol, R. D., Roman, C., Jr., Schanz, M. T. G., Maier, M. E., & Petzhold, C. L. (2021). PVC plasticizer from trimethylolpropane trioleate: synthesis, properties, and application. Polímeros: Ciência e Tecnologia, 31(2), e2021020 http://doi.org/10.1590/0104-1428.20200102
10 Pita, F. (2023). Separation of plastic mixtures by sink-float combined with froth flotation. Polímeros: Ciência e Tecnologia, 33(3), e20230025 http://doi.org/10.1590/0104-1428.20220094
11 Viet, C. X., Ismail, H., Masa, A., & Hayeemasae, N. (2021). Silane-coupled kenaf fiber filled thermoplastic elastomer based on recycled high density polyethylene/natural rubber blends. Polímeros: Ciência e Tecnologia, 31(2), e2021023 http://doi. org/10.1590/0104-1428.20210039
12. Cuebas, L., Bertolini Neto, J. A., Barros, R. T. P. D., Cordeiro, A. O. T., Rosa, D. D. S., & Martins, C. R. (2020). The Incorporation of untreated and alkali-treated banana fiber in SEBS composites. Polímeros: Ciência e Tecnologia, 30(4), e2020040 http://doi.org/10.1590/0104-1428.07520
13 Anderson, E. H., & Thompson, W. C. (1950). Plastics: a debutante industry. Southern Economic Journal, 17(2), 174186 http://doi.org/10.2307/1053674
14 Goosey, M. T. (1985). Introduction to plastics and their important properties for electronic applications. In M. T. Goosey (Ed.), Plastics for electronics (pp. 1-24). Dordrecht: Springer http:// doi.org/10.1007/978-94-009-4942-3_1
15. Rao, M. N., Sultana, R., & Kota, S. H. (2017). Plastic waste. In M.N. Rao, R. Sultana & S. H. Kota (Eds.), Solid and hazardous waste management (pp. 121-126). New Delhi: Elsevier http:// doi.org/10.1016/B978-0-12-809734-2.00003-1.
16 Rosato, D. V. (2011). Plastics end use application fundamentals. In D. V. Rosato (Ed.), Plastics end use applications (pp. 11-18). New York: Springer. http://doi.org/10.1007/978-1-4614-02459_2
17 Thompson, R. C., Moore, C. J., vom Saal, F. S., & Swan, S. H. (2009). Plastics, the environment and human health: current consensus and future trends. Philosophical Transactions of the Royal Society of London. Series B, Biological Sciences, 364(1526), 2153-2166. http://doi.org/10.1098/rstb.2009.0053. PMid:19528062.
18 Lantos, P. R. (1988). Plastics in medical applications. Journal of Biomaterials Applications, 2 (3), 358-371. http://doi. org/10.1177/088532828700200305 PMid:3230510.
19 McKeen, L. W. (2014). Plastics used in medical devices. In K. Modjarrad & S. Ebnesajjad (Eds.), Handbook of polymer applications in medicine and medical devices (pp. 21-53). New York: Elsevier http://doi.org/10.1016/B978-0-323-228053.00003-7.
20 Mahesh Kumar, G., Irshad, A., Raghunath, B. V., & Rajarajan, G. (2016). Waste management in food packaging industry. In M. Prashanthi, & R. Sundaram (Eds.), Integrated waste management in India (pp. 265-277). Cham: Springer International Publishing http://doi.org/10.1007/978-3-319-27228-3_24
21 Altenburger, L. M., Yerokhin, S. M., Mayer, L. & DijkstraSilva, S. (2024). Innovations to overcome the current waste problem caused by single-use plastics in the pursuit of a circular economy. Sustainability Nexus Forum, 32, 11 https:// doi.org/10.1007/s00550-024-00547-9
22 Rossi, J., & Bianchini, A. (2022). “Plastic Waste Free” – a new circular model for the management of plastic packaging in food value chain. Transportation Research Procedia, 67, 153-162 http://doi.org/10.1016/j.trpro.2022.12.046
23 Ocean Literacy Portal. (2022). Ocean plastic pollution. An overview: data and statistics. Retrieved in 2024, December 8, from https://oceanliteracy.unesco.org/plastic-pollution-ocean/
24 Murphy, E. L., Bernard, M., Iacona, G., Borrelle, S. B., Barnes, M., McGivern, A., Emmanuel, J., & Gerber, L. R. (2022). A
decision framework for estimating the cost of marine plastic pollution interventions. Conservation Biology, 36(2), e13827 http://doi.org/10.1111/cobi.13827 PMid:34467557.
25 Forrest, A., Giacovazzi, L., Dunlop, S., Reisser, J., Tickler, D., Jamieson, A., & Meeuwig, J. J. (2019). Eliminating plastic pollution: how a voluntary contribution from industry will drive the circular plastics economy. Frontiers in Marine Science, 6, 627. http://doi.org/10.3389/fmars.2019.00627.
26 Andrady, A. L. (2011). Microplastics in the marine environment. Marine Pollution Bulletin, 62(8), 1596-1605 http://doi. org/10.1016/j.marpolbul.2011.05.030 PMid:21742351.
27 Cózar, A., Echevarría, F., González-Gordillo, J. I., Irigoien, X., Úbeda, B., Hernández-León, S., Palma, Á. T., Navarro, S., García-de-Lomas, J., Ruiz, A., Fernández-de-Puelles, M. L., & Duarte, C. M. (2014). Plastic debris in the open ocean. Proceedings of the National Academy of Sciences of the United States of America, 111(28), 10239-10244 http://doi.org/10.1073/ pnas.1314705111 PMid:24982135.
28. Hale, R. C., Seeley, M. E., La Guardia, M. J., Mai, L., & Zeng, E. Y. (2020). A global perspective on microplastics. Journal of Geophysical Research: Oceans, 125(1), e2018JC014719
29 Frias, J. P. G. L., & Nash, R. (2019). Microplastics: finding a consensus on the definition. Marine Pollution Bulletin, 138, 145-147 http://doi.org/10.1016/j.marpolbul.2018.11.022 PMid:30660255.
30 Wu, P., Huang, J., Zheng, Y., Yang, Y., Zhang, Y., He, F., Chen, H., Quan, G., Yan, J., Li, T., & Gao, B. (2019). Environmental occurrences, fate, and impacts of microplastics. Ecotoxicology and Environmental Safety, 184, 109612 http://doi.org/10.1016/j. ecoenv.2019.109612 PMid:31476450.
31. Xu, S., Ma, J., Ji, R., Pan, K., & Miao, A.-J. (2020). Microplastics in aquatic environments: occurrence, accumulation, and biological effects. The Science of the Total Environment, 703, 134699 http://doi.org/10.1016/j.scitotenv.2019.134699 PMid:31726297.
32 Aves, A. R., Revell, L. E., Gaw, S., Ruffell, H., Schuddeboom, A., Wotherspoon, N. E., LaRue, M., & McDonald, A. J. (2022). First evidence of microplastics in antarctic snow. The Cryosphere, 16(6), 2127-2145 http://doi.org/10.5194/ tc-16-2127-2022
33 Talukdar, A., Bhattacharya, S., Bandyopadhyay, A., & Dey, A. (2023). Microplastic pollution in the himalayas: occurrence, distribution, accumulation and environmental impacts. The Science of the Total Environment, 874, 162495. http://doi. org/10.1016/j.scitotenv.2023.162495. PMid:36868287.
34 Tran, T. V., Jalil, A. A., Nguyen, T. M., Nguyen, T. T. T., Nabgan, W., & Nguyen, D. T. C. (2023). A review on the occurrence, analytical methods, and impact of microplastics in the environment. Environmental Toxicology and Pharmacology, 102, 104248 http://doi.org/10.1016/j.etap.2023.104248 PMid:37598982.
35 Mammo, F. K., Amoah, I. D., Gani, K. M., Pillay, L., Ratha, S. K., Bux, F., & Kumari, S. (2020). Microplastics in the environment: interactions with microbes and chemical contaminants. The Science of the Total Environment, 743, 140518 http://doi. org/10.1016/j.scitotenv.2020.140518 PMid:32653705.
36 . Miller, M. E., Hamann, M., & Kroon, F. J. (2020). Bioaccumulation and biomagnification of microplastics in marine organisms: a review and meta-analysis of current data. PLoS One, 15(10), e0240792 http://doi.org/10.1371/journal.pone.0240792 PMid:33064755.
37 Ragusa, A., Svelato, A., Santacroce, C., Catalano, P., Notarstefano, V., Carnevali, O., Papa, F., Rongioletti, M. C. A., Baiocco, F., Draghi, S., D’Amore, E., Rinaldo, D., Matta, M., & Giorgini, E. (2021). Plasticenta: first evidence of microplastics in human
Polímeros, 35(2), e20250017, 2025
Sentiment mapping of microplastic awareness in educational environments
placenta. Environment International, 146, 106274 http://doi. org/10.1016/j.envint.2020.106274 PMid:33395930.
38 World Health Organization – WHO. (2022). Dietary and inhalation exposure to nano- and microplastic particles and potential implications for human health. Geneva. Retrieved in 2024, December 8, from https://www.who.int/publications/i/ item/9789240054608
39 Janzik, R., Koch, S., Zamariola, G., Vrbos, D., White, M. P., Pahl, S., & Berger, N. (2024). Exploring public risk perceptions of microplastics: findings from a cross-national qualitative interview study among German and Italian citizens. Risk Analysis, 44(3), 521-535 http://doi.org/10.1111/risa.14184 PMid:37350030.
40 Pop, V., Ozunu, A., Petrescu, D. C., Stan, A.-D., & PetrescuMag, R. M. (2023). The influence of media narratives on
microplastics risk perception. PeerJ, 11, e16338 http://doi. org/10.7717/peerj.16338 PMid:37933256.
41 Garcia-Segura, S. (2023). (Invited) Insights on decentralized electrochemical reduction of nitrate. ECS Meeting Abstracts, MA2023-01 (1 ), 2302. http://doi.org/10.1149/MA202301392302mtgabs
42 Henderson , L. , & Green , C. ( 2020 ). Making sense of microplastics? Public understandings of plastic pollution. Marine Pollution Bulletin, 152, 110908 http://doi.org/10.1016/j. marpolbul.2020.110908 PMid:32479284.
Received: Dec. 08, 2024 Revised: Feb. 12, 2025 Accepted: Feb. 25, 2025
Associate Editor: Artur J. M. Valente
Tomás Jesús Madera-Santana1 , Anabell Espinoza Verdugo2 , Víctor Rejón-Moo3 and Judith Fortiz Hernández1*
1Coordinación de Alimentos de Origen Vegetal, Centro de Investigación en Alimentación y Desarrollo A.C., Hermosillo, Sonora, México
2División Académica, Universidad Tecnológica de Etchojoa, Etchojoa, Sonora, México
3Laboratorio Nacional de Nano y Biomateriales, Centro de Investigación y de Estudios Avanzados del IPN, Mérida, Yucatán, México
*jfortiz@ciad.mx
Obstract
Starch is a biopolymer that is abundant in nature, low-cost, biodegradable, and can be transformed into a thermoplastic material. This work evaluates the films’ physicochemical, thermal, and mechanical properties based on low-density polyethylene (LDPE) and thermoplastic starch (TPS) from beans. Films of four formulations of LDPE with TPS (0, 5, 10, and 15%) were formulated by the extrusion process. The films were evaluated for thickness, color, mechanical properties (tensile strength, Young’s modulus, elongation at break), barrier, and morphological properties. The barrier properties (WVTR and WVP) significantly increased when TPS was incorporated into the films. While the tensile strength and Young’s modulus did not present changes with the addition of TPS, the elongation at break increased from 204.14 to 343.81% with the addition of TPS. Adding TPS to an LDPE matrix modifies its physico-mechanical properties favorably so that it can be applied as a material for flexible packaging.
Keywords: thermoplastic starch, LDPE, blown-extrusion, films, physicochemical properties.
How to cite: Madera-Santana, T. J., Verdugo, A. E., Rejón-Moo, V., & Hernández, J. F. (2025). Physico-mechanical and structural characterization of polyethylene films and thermoplastic pinto bean starch. Polímeros: Ciência e Tecnologia, 35(2), e20250018. https://doi.org/10.1590/0104-1428.20240103
Petroleum-based packaging materials are non-degradable and affect the environment. Biopolymers are considered the solution for replacing synthetic plastics, although they have similar characteristics; they possess a short biodegradation time, good biocompatibility with other materials, and high availability[1,2]. Starch is a natural, inexpensive, and abundantly obtained polymer with a good cost-benefit ratio and film-forming properties[3]. Starch is composed of amylose units (̴~25%) and amylopectin (̴~75%). The shape and size of the starch granule, and the amylose/amylopectin content and ratio vary according to botanical origin and species. Starch contents have been reported for sorghum (61 to 71%), sweet potato (45 to 67%), common bean (22 to 45%), and maize (70 to 75%)[4]. However, the use of native starch in film formation has some disadvantages, such as low hydrophobicity and mechanical and barrier properties, with limited applications[5]. Developing and producing thermoplastic starch (TPS) could be an alternative for developing new materials of biodegradable products. Developing biodegradable thermoplastic starch (TPS) is considered important in reducing the total amount of synthetic plastic waste in the world. TPS has several attributes; in addition to its biodegradability, it is a renewable
and flexible material and can be conditioned to different thermoplasticization processes using standard equipment in the manufacture, such as injection molding, blow extrusion, and 3D-printing[6]. TPS research in the development of biodegradable bioplastics is focused on the origin of starch, characteristics, and uses of starches, the plasticization process and properties, and mixtures for developing of new materials. TPS is a material obtained from structural modification (disruption) that occurs in starch granules processed with low water content and when thermal and mechanical forces are applied in the presence of plasticizers[2,6]. The possibility of transforming native starch into thermoplastic starch (TPS) has shown considerable interest[7]. The properties of starch-based bioplastics are directly a result of the amylose–amylopectin ratio within the total starch content of a starch material. Thus, one of the most viable strategies for improving starch-based bioplastics’ properties is altering the molecular structure, ratio, and interactions of amylose and amylopectin within the polymeric matrix. Thermoplastic extrusion is a high-temperature, high-pressure, and highshear process[5]. However, it is a material with hydrophilic characteristics, and its mechanical properties vary as a function of moisture. The inherent hydrophilicity and high
T. J., Verdugo, A. E., Rejón-Moo, V., & Hernández, J. F.
starch density (1400 kg/m3) lead to quite hygroscopic and brittle materials, thus limiting their application range[8] TPS has good oxygen barrier properties but is susceptible to humidity, exhibiting rapid biodegradation and sticky behavior during blown film extrusion[9]. One strategy to improve TPS’s properties is using plasticizers and making blends with other polymers[10]. Plasticizers are generally small molecules of polyols (sorbitol and glycerol) that are cross-linked and inserted between polymer chains[11] They are added to the polymers to improve the flexibility and extensibility of the film. Glycerol is one of the most effective plasticizers because it has certain advantages, such as being low-cost and a compound recognized as safe for health (GRAS). TPS has several attributes besides being a biodegradable, renewable, and flexible material that can be thermoplasticized using standard equipment for synthetic polymer processing[6]. Prachayawarakorn et al.[7] reported the fabrication of composite films of mung bean starch, cotton fiber, and low-density polyethylene; they observed an increase in maximum stress, Young’s modulus, and water absorption. García-Guzmán et al.[2] reported that the incorporation of glycerol improves the flexibility of the edible coating and reduces film puncture resistance, elasticity, and water vapor barrier properties in films made with wheat gluten. Hydrophobic functional groups in modified starch increase compatibility between TPS and low-density polyethylene (LDPE), leading to a more homogeneous starch in the LDPE matrix[9]. Starch from various sources has been studied as TPS, including corn, potato, wheat, and rice[7]. The films cast from cereal and root starches have been broadly developed and studied for their properties. Nonetheless, the studies on films produced from legume starches are uncommonly limited. Thermoplastic starch prepared from pinto bean starch has not yet been reported. This study aimed to investigate the optical, mechanical, barrier, and thermal properties of films made from bean starch. TPS formulations (0, 5, 10, and 15% by weight) and polyethylene (LDPE) were processed by blown film extrusion. To evaluate if adding TPS in an LDPE matrix modifies its physico-mechanical properties favorably to provide a feasible application as a material for flexible packaging.
2.1 Materials
Native pinto bean (Phaseolus vulgaris) starch (moisture content 8%, fat 0.112%, protein 0.84%, and ash 0.26%) was obtained by an aqueous extraction process. Glycerol and acetic acid (98%) were obtained at Laboratory Reasol (Mexico City, Mexico). Low-density polyethylene (LDPE) Certene grade 4 resin was used (Houston, TX, USA).
2.2 Methods
2.2.1 Starch characterization
Proximal analysis of pinto bean starch included moisture, ash, protein, ethereal extract, and nitrogen-free extract. The proximate composition was performed using the methods of the AOAC International[12]. The starch characterization was measured in three samples prepared at the same conditions.
Apparent amylose. The apparent amylose content of starch was determined by McGrance et al. methodology[13] in combination with the technique of Barraza-Jauregui et al. [14], with slight modifications. The absorbance of the blue color produced in amylose solutions of the tri-iodide ion was measured as an indicator of the linear fraction present in the solution. 25 mg of the starch sample was dissolved in 10 mL of 6 M urea (JT Baker, Mexico), 2 mL of 90% dimethyl sulfoxide (DMSO) (Sigma-Aldrich, USA) was added, and the mixture was stirred for 20 min. The absorbance was read at 635 nm in a Varian UV-visible spectrophotometer model Cary 50Bio (New London, USA). Quantification was measured with an amylose curve (Sigma-Aldrich, USA). Amylose content was expressed as a percentage.
Water absorption capacity (WAC). The WAC of bean starch was determined using the methodology of Sindhu et al.[15]. Suspensions of 5% starch in 40 mL of distilled water were prepared, left to stand for 40 min with shaking every 10 min, and centrifuged (Thermo Scientific™ ST) for 25 min at 3250 rpm. The supernatant was discarded, and the sediment was weighted to determine the WAC using Equation 1. The test was performed in triplicate:
Solubility index and swelling power. The starch solubility index (SI) and swelling power (SP) were determined using the method of Martinez et al.[16] with some modifications. Specifically, 1% starch suspensions were prepared in 40 mL of distilled water and heated in a water bath (Ecoline Staredit. LAUDA® E100) at 60 °C, 70 °C, and 80 °C for 30 min. Then, it was cooled to 25 °C and centrifuged (Thermo Scientific™ Sorvall ST 8) at 4000 rpm for 50 min. The supernatant was discarded, while the gel formed was recovered and dried at 60 °C for 20 h to determine the SI (Equation 2) and SP (Equation 3):
The whiteness index (IB*) of starch was calculated according to Sindhu et al.[15], and was calculated using Equation 4:
The preparation of thermoplastic starch (TPS) was produced by the addition of bean starch (70%) and glycerol (30%); it was also produced by extrusion. The TPS filament was processed in a Beutelespacher (Mexico City, Mexico) 25:1 l/d single-screw extruder, which was subsequently cut in a Beutelespacher Pelletizer (Mexico City, Mexico). To produce the TPS the extrusion conditions of the equipment were zone 1: 80 °C, zone 2: 100 °C, die zone 120 °C, screw speed 50 rpm, and torque of 5 Nm.
Physico-mechanical and structural characterization of polyethylene films and thermoplastic pinto bean starch
2.2.3 Processing of LDPE-TPS films
The blown film extrusion was used to produce the LDPETPS; for this purpose, several TPS formulations were made with 0% TPS (TPS0 or LDPE), 5% (TPS5), 10% (TPS10), and 15% (TPS15) by weight and mixed with LDPE resin. The extrusion conditions were temperature zone 1: 100 °C, zone 2: 120 °C, zone 3: 140 °C, die zone 150 °C, screw speed 50 rpm, and torque of 4 Nm.
2.2.4 Characterization of the films
The thickness, optical, barrier, mechanical, thermal, and properties of the films were measured to evaluate the effect of the addition of TPS on the properties of LDPE films.
Films thickness. The thickness of the films was measured using a micrometer (Mitutoyo MDC-1 SB, Japan) at five different points, and their average value was calculated.
Optical properties of films. The color determination of the films was determined using a colorimeter, the Chroma Meter (Minolta CR300, Japan), calibrated to a standard (Y: 94.1, X: 0.3155, y: 0.3319). From the parameters L*, a*, and b*, the parameters of hue angle (°Hue), chromaticity (C*), and color difference (ΔE*) were evaluated. Measurements were recorded at three specific points on the film, and an average of the measurements was reported for each formulation. The equation for calculating hue angle (°Hue) was Equation 5:
arctan b Hue
Equation 6 was used to determine the chromaticity (C*):
deionized water (30 mL) was sealed with a lid containing the sample firmly fixed on its top. The container was stored at 25 °C and 30% RH in a desiccator with dry silica. The assay was performed in triplicate for each sample, and the container weight was recorded periodically for 30 h. WVTR was calculated from the slope of the straight line, where time (h) vs. weight difference (g) was plotted using Equation 9.
The color difference (ΔE) of each film was compared between the TPS0 formulation and other formulations (515%) and calculated using Equation 7:
where w is the weight loss of the container in g, t is the time in h, and A corresponds to the permeation area in m2
Water Vapor Permeability (WVP). The determination of WVP was calculated from the WVTR and using Equation 10. * WVP WVTRI P = (10)
where l is the average thickness of the film in m and ∆P corresponds to the difference in water vapor pressure on the internal and external sides of the container where the film sample is located.
Mechanical properties. The mechanical properties of the films were measured using the texture analyzer TA-XT plus texture (Surrey, UK) according to the ASTM D88202 procedure[19]. Rectangular samples (10x60 mm) were obtained, and the thickness of each film was measured in triplicate. The separation distance of 30 mm was set, and a 10 mm/min crosshead speed was programmed. The tensile strength (σ), elongation at break, and Young’s modulus (E) were calculated. The tensile parameters were reported on an average of six replicates per film.
Structural properties. The films were characterized by infrared (IR) spectroscopy using a spectrometer Thermo ScientificTM Nicolet iS-50 FT-IR (Madison, WI, USA.) coupled to a universal crystal diamond of attenuated total reflectance (ATR) attachment. Spectra were recorded from 4000 to 650 cm-1 with a resolution of 4 cm-1, a scan rate of 0.475 cm-1/s, and 100 scans.
where ΔL = L-L0, Δa= a-a0, Δb = b-b0. The L*, a*, and b* parameters are the chromatic values of the simple, and L0, a0, and b0 represent the control chromatic values (TPS0).
Transparency. The transparency measurement was performed according to the methodology established by Escárcega-Galaz et al.[17]. Rectangular samples (3x1 cm) were made and placed inside a spectrophotometric cell. The absorbance readings were determined at 600 nm in a UV-Vis spectrophotometer Varian Cary 50 Bio. Transparency was calculated using the following Equation 8:
600A
Transparency T = (8)
where A600 is the recorded absorbance value at 600 nm, and T represents the average thickness of the film in mm. The transparency of the films was analyzed, and the average value of two replicates was reported for each formulation.
Barrier properties. Water vapor transmission rate (WVTR) was performed according to the ASTM E96 method[18] with slight modifications. For this purpose, a plastic container with
Thermal properties. Thermogravimetric analysis (TGA) of the films was performed using Perkin Elmer’s TGA-8000 equipment (Boston, MA, USA). The temperature range was from room temperature (25 °C) to 700 °C, at a heating rate of 10 °C/min under a nitrogen atmosphere.
Morphological analysis. A Field Emission Scanning Electron Microscope (FE-SEM) JEOL JSM-7600F (Peabody, MA, USA) was used to examine the films’ surface morphology. The samples were previously fixed in aluminum tubular cells using double-sided carbon adhesive tape. A thin Au/ Pd composite layer was applied to them using a Quorum model QI5OR-EN sputtering device (Sussex, UK). The surface section micrographs were taken at 200 μm scales and 150X magnification.
2.2.5
Data were analyzed by one-way analysis of variance (ANOVA). When there was significance, Tukey’s multiple range test compared means with a significance level of p≤0.05. All data were processed in NCSS-9 Statistical Software 2017 (Kaysville, UT, USA).
The characterization of native bean starch was carried out to determine the characteristics of the raw material. This starch presented 7.92% moisture, 0.11% fat, 0.84% protein, 0.26% ash, and 23.87% apparent amylose (Table 1). It has been reported that the type of starch (wheat, corn, potato, etc.) influences the physical and chemical properties of the processed films. In addition, their amylose/amylopectin ratio can influence their thickness, color, moisture, thermal, and mechanical properties[4]. Starches with higher amylose content have lower wettability properties and better mechanical strength, which is highly dependent on water content due to the hydrophilic nature of starch films. The linear structure of amylose promotes the formation of hydrogen bridges between the chains of the structure compared to the branched structure of amylopectin. In this work, the amylose content of bean starch was 23.87%, which indicates a normal value (20-35%) according to its amylose content (waxy (<15%), normal (20-35%) and high (>40%) reported by Goncalves et al.[8] Similar values have been reported by Basiak et al.[5] have reported the 27, 25, and 20% amylose values for corn, wheat, and potato starch, respectively. However, this value was lower than that reported by Hoover et al.[20] for mung bean starch with an apparent amylose content of 39.8%.
Starch color. Starch color is an important parameter in determining the application of food starches because it can give brightness or opacity to the final product. Starch color had an average brightness (L*) of 46.73 (Table 2). BarrazaJauregui et al.[14] reported higher luminosity values with values of 90 in potato starches. The °Hue value was 76.37, and the Chroma value was 29.57 since it presented a slightly yellow tone. While the whiteness index had a value of 71.30, higher values were reported by Sindhu et al.[15] in wheat starch (buckwheat), with a value of 97.8. Whiteness index values greater than 90 have been reported in potato starch[12]
Solubility index and swelling power. The solubility index and swelling power of bean starch were shown to be directly related to the increasing temperature of gel preparation, as reported by Martinez et al.[16] in 9 potato starch varieties. Table 3 shows the highest solubility index at 80 °C and the highest swelling power. Solubility increased its values from 13.34 to 16.80 (g water/g starch) when the heating temperature increased from 60 °C to 80 °C. The same behavior was observed in the swelling power of starch, where an increase from 1.35 to 5.60 (g water/g starch), respectively, was presented when it was from 60 °C to 80 °C. Barraza-Jauregui et al.[14] mentioned that the higher starch solubility can be attributed to a higher solubilization of starch granules with weaker rigidity when heated at high temperatures.
On the other hand, water absorption capacity is a property that indicates the starch’s ability to interact with water and form pastes and gels, which is an important use in the food industry. It has been reported that starches that have high water absorption capacity are used as thickening agents. A water absorption capacity of 102.38% (1.0238 g/g) was presented for bean starch (Table 3). Montoya-Anaya et al. [21] reported similar values for potato starch (101.63%). In this sense, this property is influenced by starch type
Table 1. Physicochemical characteristics of native beans starch. Parameters
± 0.3
± 0.04 Ether
± 0.17
± 0.02 Protein
d.b. = dry basis. Average ± standard deviation, n = 3.
Table 2. Color parameters ( L* , °Hue, and Chroma ) of native beans starch.
± 2.17
± 0.90
± 2.54
± 3.50
Average ± standard deviation, n = 3.
Table 3. Solubility index (SI), swelling power (SP), and water absorption capacity (WAC) of native beans starch.
Temperature (°C) SI SP (g water/g starch) (g water/g starch)
60 13.34 ± 1.82a 1.35 ± 0.09a
70 12.54 ± 1.32a 1.40 ± 0.29a
80 16.80 ± 0.44b 5.60 ± 0.18b
WAC (%) 102.38 ± 4.08
Mean values ± standard deviation are reported for each treatment. Different letters in the same column indicate a signific ant difference (p<0.05).
and granule size (small granules require more water than large granules). Martinez et al.[16] reported that the water absorption capacity is due to the presence of hydrophilic groups that retain water.
An increase in the thickness of the films was observed as the TPS0 to TPS15 content increased, with values ranging from 1.62 to 3.76 mils (Table 4); this behavior was also reported for LDPE and TPS from potato starch films[21] Basiak et al.[5] mentioned that the type of starch influences the optical properties and thickness of the films, i.e., potato starch films are more transparent than corn and wheat starch films; they are opalescent. Also, the color parameter values are dependent on the film thickness. The greater the thickness, the opaquer the films appear. They mentioned that the films were more opalescent and had a higher thickness. In contrast, the films were more transparent and thinner with lower starch content. They also reported 2.18, 2.91, and 4.41 mils thickness for potato, wheat, and corn starch films. The color of the formulated films presented similar values in luminosity (L*), as shown in Table 4. Likewise, they presented differences in the values of a* and b* concerning the control film (TPS0) or LDPE. An increase in the color difference (ΔE*) from 1.31 to 4.83 was also observed when increasing the content of TPS (5 to 15%) with respect to the TPS0 film. Another optical property is transparency (Table 4). The TPS0 y TPS5 films were more transparent than the films that were added to the TPS. Meanwhile, the films
Physico-mechanical and structural characterization of polyethylene films and thermoplastic pinto bean starch
Table 4. Color parameters (L*, °Hue, and ΔE) and transparency of LDPE-TPS films.
Different letters in the same column indicate a significant difference (p<0.05).
with thermoplastic starch were less transparent and slightly yellow. It coincides with what Basiak et al. reported[5], who mentioned that the films’ color depends on their thickness; the thinner the films, the more transparent, and the thicker films are more opaque.
Mechanical properties. The mechanical properties of the formulated films did not show significant changes (p>0.05) with the addition of TPS in the tensile strength and Young’s modulus (E) concerning the TPS0 or LDPE film. However, there was an increase in elongation at break, with values ranging from 204 to 343% (Table 5). These values agree with those of other authors, who report values for tensile strength from 3 to 10 MPa, Young’s modulus from 5 to 106 MPa, and elongation at break for wheat, corn, and potato starch films[4]. These results indicate that the TPS15 film increased tensile strength, which could indicate a good interaction between the polymeric matrix chains and thermoplastic starch. On the other hand, the TPS15 film showed a significant increase in the average elongation at break value (p<0.05), showing greater flexibility in the film of this formulation. This result is corroborated by the decrease in the average value of Young’s modulus presented by this film, although it was not significant (p>0.05). These values indicate that the TPS15 film presented good mechanical properties and could be used as a container and biodegradable agent. The incorporation of 7:3 cotton fiber/LDPE improves the mechanical properties (Young’s modulus and tensile strength) of thermoplastic starch from mug beans (TPMBS) [7]. According to Ballesteros-Martínez et al.[11], an increase in the concentration of plasticizers, such as glycerol or sorbitol, provide an increase in water solubility, elongation, and water permeability from tested films. Moreover, starch with high amylose content is responsible for the film forming and produce stiff and strong films[10]
Water vapor transmission rate (WVTR) and water vapor permeability (WVP). The WVTR, permeance, and WVP of the films showed a significant increase (p<0.05) with the addition of TPS from 5 to 15%, with respect to the TPS0 film (Table 6). The WVTR rose from 4.21 to 10.17 g/m2·h, and the permeance rose from 0.273 to 0.517 g/m2·h·mm·Hg. WVP increased from 0.00027 to 0.00099 g/m·d·mm·Hg. Similar WVTR values were reported by Montoya-Anaya et al.[21] in potato starch films with TPS (0 to 20%) and polyethylene formulations, there was an increase in WVTR from 4.21 to 10.64 g/h·m2. Basiak et al.[5] reported that potato starch films constitute a high barrier to oxygen and water vapor; however, they have lower mechanical properties than wheat and corn starch films. Panrong et al.[9] reported that the WVP of the films increased with higher TPS content due to the increased hydrophilicity of starch-glycerol components and the non-homogeneous structure of these matrices. The WVP of films is influenced by the diffusivity and solubility of
Table 5. Mechanical properties of LDPE-TPS films.
Mean values ± standard deviation are reported for each treatment. Different letters in the same column indicate a significant difference (p<0.05).
Table 6. WVTR, permeance, and WVP of LDPE-TPS films.
Formulation
TPS0 4.21 ± 0.3 a 0.273 ± 0.2 a 0.00027 a TPS5 8.42 ± 1.0 b 0.556 ± 0.5 b 0.00097 b TPS10 8.07 ± 0.6 b 0.501 ± 0.5 b 0.00092 b
TPS15 10.17 ± 2.7 b 0.517 ± 0.5 b 0.00099 b
Mean values ± standard deviation are reported for each treatment. Different letters in the same column indicate a significant difference (p<0.05).

Figure 1. Infrared spectroscopy of LDPE-TPS films.
water molecules in the polymer matrix[6]. In films without plasticizers, microcracks or porosities may form that facilitate the release of water vapor, allowing it to equalize or even exceed the WVP values of plasticized films[10]
Infrared spectroscopy (FTIR). FTIR analysis shows bands of glucose rings and their bonds, one of the main components of amylose and amylopectin of starch (Figure 1). There are slight differences in the spectra of the TPS5, TPS10, and
Madera-Santana, T. J., Verdugo, A. E., Rejón-Moo, V., & Hernández, J. F.
TPS15 films compared to the spectrum of the TPS0 film. TPS5, TPS10, and TPS15 films showed absorption bands between 3000 and 2750 cm-1 related to the stretching bonds of methyl groups (C-H). In addition, a signal is observed at 2910 cm-1, corresponding to the asymmetric stretching of methylene groups (-CH2). The incorporation of thermoplastic starch into the film shows an increase in the intensity of the absorption band at 1019 cm-1. This change in intensity is related to the interactions that develop and the miscibility of the mixture of this biopolymer into the LDPE matrix. The band between 990 and 1082 cm-1 could be attributed to C-O stretching and vibration of a functional of C-C and C-O-H. These absorption bands are more similar to those reported by other researchers[7]. Finally, the 760 cm-1 bands may be related to the C-O-C stretching of the glucose ring, as reported by Montoya-Anaya et al.[21]. Basiak et al.[5] mentioned that the addition of LDPE in the films with a TPS content between 0 to 20%, reduced the interactions with the O-H groups of the starch matrix.
Thermogravimetric analysis. In the thermogravimetric analysis of TPS films, decomposition occurs in the thermal stages of the samples (Figure 2). The sample presents three significant weight losses. The first stage corresponds to the loss of moisture present in the sample (5.5-10%) occurring at a temperature around 100 °C. The second phase corresponds to the decomposition of carbohydrates, which is when these compounds decompose between 300 °C and 445 °C, corresponding to 80% of the total weight of the sample. Other authors say the thermal degradation of the starch is at 260 °C[7]. Basiak et al.[5] reported for wheat, corn, and potato starch that the second stage ranges from 120 °C to 270 °C,

which is related to the depolymerization and evaporation of glycerol (boiling point 180 °C). The volatile products of decomposition in this stage would be mainly water, CO, and CO2. The third stage ranges from 400 °C to 525 °C, corresponding to the thermal degradation of the starch structure, such as the glycosidic ring. Prachayawarakorn et al. [7] reported four stages of degradation of thermoplastic rice starch (LDPE:starch) and a weight loss of 52%, while for the rice starch-glycerol mixture, they only reported two stages of degradation.
The thermogravimetric analysis establishes possible applications and provides information on the materials’ thermal behavior (stability) and composition. Villada et al.[22] mentioned that one problem with using TPS in addition to bioplastics is its brittle nature, which is caused by starch’s relatively low glass transition temperature (Tg).
Morphological analysis. Figure 3 shows the micrographs of the surface morphology of LDPE-TPS films obtained by scanning electron microscopy (SEM). The pure LDPE matrix (TPS0) presents a smooth and homogeneous surface (Figure 3a). The micrographs shown in Figures 3b, 3c, and 3d correspond to the surface morphology of the films corresponding to formulations TPS5, TPS10, and TPS15, respectively. It can be observed that as the TPS content of the LDPE matrix increases, an increase in the amount of TPS particles is observed, which are uniformly and homogeneously distributed in films. It is important to note that the LDPE matrix coats the TPS5 and TPS 10 formulations present TPS particles, but these. The micrograph of the TPS15 formulation shows a more significant number of particles on the film’s surface, and it can be seen that these only adhere to the matrix.
Adding TPS from pinto beans into LDPE films was possible to formulate and obtain by extrusion-blowing. The solubility and swelling power of bean starch showed an increase with the increasing temperature of gel preparation when the heating temperature increased from 60 °C to 80 °C. The color of TPS films with bean starch was transparent with a slight yellow coloration. The films made with TPS (5, 10, and 15%) presented the highest WTVR, permeance, and WVP values. The mechanical properties of the formulated films did not show significant changes when TPS was added; the tensile strength and Young´s modulus were similar to the control film (TPS0). However, films with TPS showed an increase in elongation at break, indicating that the film became flexible, a characteristic corroborated by the average value of the modulus of elasticity. FTIR analysis shows bands of glucose rings and their bonds, one of the main components of amylose and amylopectin of starch. Several authors have reported the addition of TPS from different resources (potato, wheat, rice, etc.) into the LDPE matrix to produce blow films. The morphological analysis allowed us to observe the uniform and homogeneous distributions of the TPS in the LDPE matrix. The above results suggest that adding TPS from pinto beans into LDPE films could be used as a material for flexible packaging (bioplastic films). In addition, it could be considered that starch extracted from pinto beans could be a source for TPS elaboration.
Physico-mechanical and structural characterization of polyethylene films and thermoplastic pinto bean starch

5. Author’s Contribution
● Conceptualization – Tomás Jesús Madera-Santana.
● Data curation – Judith Fortiz Hernández.
● Formal analysis – Tomás Jesús Madera-Santana; Judith Fortiz Hernández.
● Funding acquisition – Tomás Jesús Madera-Santana.
● Investigation – Judith Fortiz Hernández; Anabell Espinoza Verdugo.
● Methodology – NA.
● Project administration – Tomás Jesús Madera-Santana.
● Resources – Tomás Jesús Madera-Santana; Judith Fortiz Hernández.
● Software – NA.
● Supervision – Tomás Jesús Madera-Santana; Víctor Rejón-Moo.
● Validation – NA.
● Visualization – Tomás Jesús Madera-Santana.
● Writing – original draft – Judith Fortiz Hernández; Tomás Jesús Madera-Santana.
● Writing – review & editing – Tomás Jesús MaderaSantana; Víctor Rejón-Moo.
The authors want to thank the Laboratorio Nacional Nano Biomateriales (LANNBIO). CONAHCYT CINVESTAV del IPN. Unidad Mérida Proy. No. 321119 to provide the facilities to perform this research. We are also grateful for the support provided by Ruth Melisa Felix Poqui in this work.
7. References
1 Samir, A., Ashour, F. H., Abdel Hakim, A. A., & Bassyouni, M. (2022). Recent advances in biodegradable polymers for sustainable applications. npj Material Degradations, 6(1), 68 http://doi.org/10.1038/s41529-022-00277-7
2 García-Guzmán, L., Cabrera-Barjas, G., Soria-Hernández, C. G., Castaño, J., Guadarrama-Lezama, A. Y., & Llamazares, S. R. (2022). Review progress in starch-based materials for food packaging applications. Polysaccharides, 3(1), 136-177 http://doi.org/10.3390/polysaccharides3010007
3 Apriyanto, A., Compart, J., & Fettke, J. (2022). A review of starch, a unique biopolymer-structure, metabolism, and inplant modifications. Plant Science, 318, 111223 http://doi. org/10.1016/j.plantsci.2022.111223 PMid:35351303.
4 Kupervaser, M. G., Traffano-Schiffo, M. V., Dellamea, M. L., Flores, S. K., & Sosa, C. A. (2023). Trends in starch-based edible films and coatings enriched with tropical fruits extracts: a review. Food Hydrocolloids for Health, 4, 100138 http:// doi.org/10.1016/j.fhfh.2023.100138
5. Basiak, E., Lenart, A., & Debeaufort, F. (2017). Effect of starch type on the physico-chemical properties of edible films. International Journal of Biological Macromolecules, 98, 348-356 http://doi.org/10.1016/j.ijbiomac.2017.01.122 PMid:28137462.
6. Rahardiyan, D., Mauren Moko, E., Tan, J. S., & Lee, C. K. (2023). Thermoplastic starch (TPS) bioplastic, the green solution for single-use petroleum plastic food packaging: a review. Enzyme and Microbial Technology, 168, 110260 http:// doi.org/10.1016/j.enzmictec.2023.110260 PMid:37224591.
7 Prachayawarakorn, J., Hommanee, L., Phose, D., & Chairapaksatien, P. (2010). Property improvement of thermoplastic mung bean starch using cotton and low-density polyethylene. Stärke, 62(8), 435-443 http://doi.org/10.1002/star.201000002
8 Gonçalves, I., Lopes, J., Barra, A., Hernández, D., Nunes, C., Kapusniak, K., Kapusniak, J., Evtyugin, D. V., Silva, J. A. L., Ferreira, P., & Coimbra, M. A. (2020). Tailoring the surface
Madera-Santana, T. J., Verdugo, A. E., Rejón-Moo, V., & Hernández, J. F.
properties and flexibility of starch-based films using oil and waxes recovered from potato chips byproducts. International Journal of Biological Macromolecules, 163, 251-259 http:// doi.org/10.1016/j.ijbiomac.2020.06.231 PMid:32615230.
9 Panrong, T., Karbowiak, T., & Harnkarnsujarit, N. (2019). Thermoplastic starch and green tea blends with LLDPE films for active packaging of meat and oil-based products. Food Packaging and Shelf Life, 21, 100331 http://doi.org/10.1016/j. fpsl.2019.100331.
10 Bangar, S. P., Whiteside, W. S., Ashogbon, A. O., & Kumar, M. (2021). Recent advances in thermoplastic starches for food packaging: a review. Food Packaging and Shelf Life, 30, 100743 http://doi.org/10.1016/j.fpsl.2021.100743
11 Ballesteros-Martínez, L., Pérez-Cervera, C., & Andrade-Pizarro, R. (2020). Effect of glycerol and sorbitol concentrations on mechanical, optical, and barrier properties of sweet potato starch film. NFS Journal, 20, 1-9 http://doi.org/10.1016/j. nfs.2020.06.002
12 Association of Official Agricultural Chemists – AOAC. (2005). Official methods of analysis of AOAC International Rockville: AOAC International
13 McGrance, S. J., Cornell, H. J., & Rix, C. J. (1998). A simple and rapid colorimetric method for the determination of amylose in starch products. Stärke, 50(4), 158-163. http:// doi.org/10.1002/(SICI)1521-379X(199804)50:4<158::AIDSTAR158>3.0.CO;2-7.
14 Barraza-Jauregui, G., Soriana-Colchado, J., Obregon, J., Martinez, P., Peña, F., Velezmoro, C., Siche, R., & Miano, A. C. (2020). Physicochemical, functional and structural properties of starches obtained from five varieties of native potatoes (Solanum tuberosum L.). In Proceedings of the 18th LACCEI International Multi-Conference for Engineering, Education, and Technology: “Engineering, Integration, and Alliances for a Sustainable Development” “Hemispheric Cooperation for Competitiveness and Prosperity on a Knowledge-Based Economy (pp. 1-10). Boca Raton: LACCEI http://doi.org/10.18687/ LACCEI2020.1.1.623
15 Sindhu, R., Devi, A., & Khatkar, B. S. (2019). Physicochemical, thermal and structural properties of heat moisture treated
common buckwheat starches. Journal of Food Science and Technology, 56(5), 2480-2489 http://doi.org/10.1007/s13197019-03725-6 PMid:31168130.
16 Martinez, P., Malaga, A., Betalleluz, I., Ibarz, A., & Velezmoro, C. (2015). Caracterización funcional de almidones nativos obtenidos de papas (Solanum phureja) nativas peruanas. Scientia Agropecuaria, 6(4), 291-301 http://doi.org/10.17268/ sci.agropecu.2015.04.06
17. Escárcega-Galaz, A. A., Sánchez-Machado, D. I., LópezCervantes, J., Sanches-Silva, A., Madera-Santana, T. J., & Paseiro-Losada, P. (2018). Mechanical, structural and physical aspects of chitosan-based films as antimicrobial dressings. International Journal of Biological Macromolecules, 116, 472-481 http://doi.org/10.1016/j.ijbiomac.2018.04.149 PMid:29727650.
18 American Society for Testing and Materials – ASTM. (2010). ASTM E96/E96M-10: standard test methods for water vapor transmission of materials West Conshohocken: ASTM
19 American Society for Testing and Materials – ASTM. (2002). ASTM D882-02: standard test method for tensile properties of thin plastic sheeting West Conshohocken: ASTM
20 Hoover, R., Li, Y. X., Hynes, G., & Senanayake, N. (1997). Physicochemical characterization of mung bean starch. Food Hydrocolloids, 11(4), 401-408 http://doi.org/10.1016/S0268005X(97)80037-9
21 Montoya-Anaya, D. G., Rodriguez-Nuñez, J. R., AguirreMancilla, C. L., Grijalva-Verdugo, C., Quitana-Owen, P., & Madera-Santana, T. (2023). Films made of potato starch from industrial potato straggles and polyethylene: physicochemical, thermal, and mechanical properties. Iranian Polymer Journal, 32(10), 1321-1333 http://doi.org/10.1007/s13726-023-01215-3
22 Villada , H. S., Acosta, H. A., & Velasco , R. J. (2008 ). Investigación de almidones termoplástico, precursores de productos biodegradables. Información Tecnológica, 19(2), 3-14 http://doi.org/10.4067/S0718-07642008000200002
Received: Dec. 08, 2024
Revised: Mar. 13, 2025
Accepted: Mar. 19, 2025
Marcos Rodrigues Oliveira1 , Lauriene Gonçalves da Luz Silva2* , Brenda Jakellinny de Sousa Nolêto2 , Gabriely Gonçalves Lima2 , Renan Matos Monção2 , Marcos Cristino de Sousa Brito2 , Lucas Pereira da Silva2 , Ediones Maciel de Sousa3 , Thercio Henrique de Carvalho Costa4 , Fernanda Roberta Marciano2 and Rômulo Ribeiro Magalhães de Sousa1,2
1Departamento de Engenharia Mecânica, Universidade Federal do Piauí, Teresina, PI, Brasil
2Programa de Pós-graduação em Engenharia e Ciência dos Materiais, Universidade Federal do Piauí, Teresina, PI, Brasil
3Programa de Pós-graduação em Física, Universidade Federal do Piauí, Teresina, PI, Brasil
4Departamento de Engenharia Mecânica, Universidade Federal do Rio Grande do Norte, Natal, RN, Brasil
*lauriene@ufpi.edu.br
Obstract
Poly(ε-caprolactone) (PCL) is a biodegradable polyester with promising properties in tissue engineering, particularly in the creation of living structures for regenerative medicine. This study focused on the surface properties of electrospun PCL membranes combined with bone powder, treated using Dielectric Barrier Discharge (DBD) plasma in argon and atmospheric air environments. The electrospinning technique was employed for its ability to produce fibrous scaffolds that mimic the extracellular matrix, enhancing cell adhesion and proliferation. Scanning Electron Microscopy (SEM) results indicated that the morphology of the electrospun samples remained unchanged, exhibiting random fiber orientation and the presence of hydroxyapatite, although it was not fully incorporated. Infrared spectroscopy confirmed the characteristic polymer groups, and contact angle measurements demonstrated the hydrophobic nature of the films. However, increasing the plasma exposure did not entirely convert the surface to a hydrophilic state.
Keywords: biological, plasma, poly(ε-caprolactone), surface modification.
Data Ovailability: Research data is available upon request from the corresponding author.
How to cite: Oliveira, M. R., Silva, L. G. L, Nolêto, B. J. S., Lima, G. G., Monção, R. M., Brito, M. C. S., Silva, L. P., Sousa, E. M., Costa, T. H. C., Marciano, F. R., & Sousa, R. R. M. (2025). Surface modification of poly(ε-caprolactone) electrospun fibers with bone powder by DBD. Polímeros: Ciência e Tecnologia, 35(2), e20250019. https://doi. org/10.1590/0104-1428.20240091
1. Introduction
Tissue engineering is emerging as a promising field of research, paving the way for the creation of living structures capable of transforming regenerative medicine. Its central aim is to build functional substitutes for damaged tissues or organs, restoring health and well-being to patients[1-3]
The biodegradable aliphatic polyester, poly(ε-caprolactone) (PCL), has promising potential in tissue engineering and drug delivery applications, thanks to its remarkable mechanical and structural properties. The surface property of the material is a crucial factor in cell adhesion, influencing the behavior of cells during seeding and growth. Understanding the different properties and their effects is fundamental to the development of biocompatible and effective materials for various applications in tissue engineering and regenerative medicine[4]
However, their low wettability and surface energy characteristics have an adverse impact on cell attachment and proliferation[5,6]. It is therefore imperative to modify
the surface properties of PCL by introducing additional functional groups onto its surface. Surface modification by atmospheric pressure plasma has emerged as an innovative technique in recent years. Its ability to create and/or improve topographical and functional characteristics of surfaces makes it ideal for improving the biocompatibility of biomaterials[7,8]
The treatment with DBD plasma is widely used to modify the surface properties of scaffolds, providing specific functionalities such as increased hydrophilicity and enhanced adhesion of bioactive molecules to the surface. PCL is recognized for its biocompatibility with various types of drugs, enabling uniform drug distribution, while its long-term degradation allows controlled drug release over several months, especially in applications focused on bone tissue engineering (BTE)[9,10]
Therefore, to produce scaffolds that mimic the extracellular matrix, the electrospinning technique was employed. Additionally, it is important to note that the
Oliveira, M. R., Silva, L. G. L, Nolêto, B. J. S., Lima, G. G., Monção, R. M., Brito, M. C. S., Silva, L. P., Sousa, E. M., Costa, T. H. C., Marciano, F. R., & Sousa, R. R. M.
objective of the work is to use PCL as a support for the release of bovine bone powder, which simulates synthetic hydroxyapatite and exhibits a biological composition similar to that of natural bone.
The electrospinning technique also known as electrostatic spinning, is widely used in the production of scaffolds that form mats and membranes with large surface area and high porosity. These are often employed as structural supports for tissue fixation and regeneration, owing 3D dimensional structure that mimics the extracellular matrix, facilitating cell adhesion, migration, and proliferation[10,11]
In this work, the electrospinning technique was used due to its simplicity and effectiveness in manufacturing nanofibers. The aim of this study was to produce fibrous membranes using the electrospinning technique, with PCL and demineralized bone powder, and to treat them by plasma at medium pressure, using a dielectric barrier discharge (DBD) with varying treatment times and discharge gases (argon and atmospheric air). Changes in surface properties were studied using scanning electron microscopy, energy dispersive spectroscopy, Fourier transform infrared spectroscopy and water contact angle analysis.
2. Materials and Methods
2.1 Materials
Polycaprolactone (PCL, Mn 80,000) from SIGMAAldrich, Dichloromethane (DCM) Dimethylformamide (DMF), Acetone, Absolute alcohol (NEON Inc. São Paulo). Bovine bone pieces obtained commercially.
2.2 Synthesis of bovine bone matrix
Pieces of bovine bone were purchased commercially and taken to the laboratory for a cleaning procedure using a scalpel to remove meat and fat from the bone. The bone was then boiled for 1 hour in water and salt (NaCl), and this process was repeated until no fat or impurities remained in the water. The bone was dried in an oven at 100 °C. With the aid of a toothed saw, the material was sanded to obtain the bone in powder form and then separated into particle sizes smaller than 400 mesh using an analytical sieve.
To avoid contamination, the bone powder obtained was added to absolute alcohol under heating in a chapel to speed up the evaporation process of the solution (absolute alcohol). The material was subjected to a solution based on acetone and distilled water (1:1 solution ratio v:v), stirred vigorously for 2 hours and filtered to remove the organic part of the bovine matrix. The powder was placed in a Petri dish and dried in an oven at 100 °C or on a hot plate at 80 °C. Finally, it was sieved through a 200 mesh sieve[9].
The polymer solution of poly (ε-caprolactone) 15 wt% and bone powder was prepared using the solvents dichloromethane and N, N-Dimethylformamide (DMF), in proportions of 5:6 and 1:6 (w:v), respectively. The PCL was dissolved at room temperature and under controlled magnetic stirring in dichloromethane for 2 hours until the polymer
was completely dissolved. Then 3% bone powder and the DMF solvent were added to the polymer solution, followed by magnetic stirring for 2 hours, for incorporation into the polymer. For the electrospinning process, the distance from the tip of the nozzle to the collector static was 100 mm and the variation in electrical potential between the nozzle and the collector was 12.5-13 kV. Finally, the flow rate of the solution was controlled by an infusion pump (kdScientific, Model KDS-100) at a flow rate of 1 mL h-1. The PCL fibers/ bone powder were collected in a grounded collector at 22 ± 1 °C, 48-50% relative humidity.
2.4 Dielectric barrier discharge configuration
It consists of a quartz tube (110 mm long, with an internal diameter of 75 mm and a wall thickness of 2.5 mm) sealed by two PTFE (polytetrafluoroethylene) flanges in which two electrodes are housed. The upper electrode (40 mm in diameter) is anodically polarized and the lower electrode (30 mm in diameter) is cathodically polarized. The cathode is immediately above an alumina 56 mm in diameter and 2 mm thick, which acts as the dielectric in which the samples are placed. The tube is inserted 5 mm deep into the PTFE pieces. The anode is moved by a 0.1 mm precision ratchet that varies the distance between the electrodes by up to 100 mm. In addition to the reactor, a power supply was used, allowing the applied voltage to be varied from 0 to 20 kV and frequency from 200 Hz to 1.0 kHz, and an oscilloscope to monitor the treatments. The treatment conditions and sample nomenclature are shown in Table 1
2.5
The surface topography of the PCL electrospun materials was analyzed before and after exposure to plasma using a scanning electron microscope (FEI COMPANY, model QUANTA FEG 250) with an acceleration voltage of 1 to 30 kV and corresponding elemental analysis by energy dispersive spectroscopy (Bruker, model Quantax EDS).
The samples were characterized in order to identify the characteristic bands of each group using Fourier Transform Infrared Spectroscopy by ATR (VERTEX 70 BRUKER). The FTIR spectrometer, equipped with a germanium prism, performs 128 scans with a resolution of 4 cm−1. The spectra were obtained in the 600-3250 cm-1 range.
The contact angle of the samples was analyzed at room temperature using a drop of 2 μL of distilled water placed on the reference and treated substrates. The image of the drop was stored using a camera. Surftens software was used to measure the contact angles of each slide. Three measurements were taken to obtain the mean and standard deviation.
Table 1. Treatment conditions.
The effect of DBD plasma treatment of atmospheric air and argon on surface morphology is examined and analyzed using scanning electron micrographs (Figure 1).
The morphology of the samples indicates interconnected and randomly oriented fibers. The resulting fibrous structures consist of distinct cylindrical fibers that are entangled with each other, the electrospinning of PCL resulted in continuous and smooth fibers, with the presence of some granules. The SEM images showed no noticeable differences. These images clearly reveal that the surface topographies are maintained on the plasma-treated samples, as there is no obvious surface damage visible.
EDS measurements were carried out on untreated and plasma-treated samples to determine the effect that plasma treatment had on the chemical composition of the surface of the PCL/bone powder samples. The results are summarized in Table 2
The bone powder has the elemental formula Ca10(PO4)6(OH)2, and it is possible to observe the presence of the elements calcium and phosphorus, which indicates that the points with the highest light intensity in the backscattered electron micrographs are hydroxyapatite crystals that have not been fully incorporated into the material.
From Table 1, it can be inferred that after plasma treatment in both atmospheres, there is an increase in the oxygen content of the samples, due to the incorporation
Samples
Base
22.85±0.00 1.54±0.00 0.79±0.00
79.00±8.38 20.84±3.53 0.12±0.04 0.04±0.03 Atm30 77.13±8.19 22.74±3.80 0.08±0.04 0.05±0.03 Atm45 75.88±8.03 23.75±3.94 0.34±0.07 0.02±0.00 Ar15 76.32±7.97 23.63±3.79 0.03±0.03 0.03±0.03
Ar30 76.64±8.09 23.22±3.83 0.10±0.04 0.05±0.03
Ar45 77.10±8.12 22.82±3.75 0.06±0.04 0.03±0.03
of oxygen, the relative carbon content also decreases with plasma treatment[10]
The FTIR spectra obtained made it possible to determine the molecular composition of the PCL fibers with bone powder and of the samples after dielectric barrier discharge. The results are shown in Figure 2
The presence of carbonyl groups (C=O) is an indicator of the presence of PCL in the sample. The C=O stretching peak is a strong, well-defined peak that occurs at 1726 and 2359 cm-1. The presence of methyl groups (CH3) at 2947 cm-1 and methylene (CH2) at 1049, 2873 cm-1 indicates the presence of ethylene glycol side chains in the PCL molecule. The COC crystalline elongation peaks occur at 1365 and 1469 cm-1, the intensity of these peaks is a measure of the crystallinity of poly (ε-caprolactone) and vibration bands at 1296, 1244, 1176, 1106, 959, 731, 658 referring to the asymmetric elongation of the COC group[11-13].
Plasma treatment is a versatile technique that can significantly modify the surface properties of materials. One of the effects observed is an increase in the intensity of the oxygen-related peaks (O-H and C-O)[14], another factor is that treatment in inert gases, such as argon, introduces oxygen to the polymer surface due to the post-plasma exposure of the samples to atmospheric oxygen[15].
The contact angle values of the samples are shown in Figure 3. The results show the hydrophobicity of the surface of the samples. The small difference in values between the samples can be attributed to variations in the morphology and diameter of the electrospun fibers, factors that have a significant influence on surface roughness[16]
Depending on the intended purpose, plasma treatments can impart hydrophobicity to the surface, evidenced by contact angles equal to or higher than 90 °, as appropriate for the application[17]
With increased exposure to plasma, the contact angle results increased significantly compared to the control. Since the treatment was not as effective, it showed low capacity to increase wettability even at high treatment durations, a

Oliveira, M. R., Silva, L. G. L, Nolêto, B. J. S., Lima, G. G., Monção, R. M., Brito, M. C. S., Silva, L. P., Sousa, E. M., Costa, T. H. C., Marciano, F. R., & Sousa, R. R. M.


result also found by Ozkan and Turkoglu Sasmazel[8] . This means that, under the conditions studied, plasma treatment did not completely alter the hydrophilic nature of the films.
4. Conclusions
This study explored the application of the electrospinning technique in the production of fibrous membranes using polycaprolactone (PCL) and demineralized bone powder, followed by medium-pressure plasma treatment using a dielectric barrier discharge (DBD).
The results of the morphology of the samples showed the formation of interconnected, randomly oriented fibers, with the electrospinning of the PCL resulting in continuous, smooth fibers. Plasma treatment caused no noticeable damage to the surface topography, indicating the robustness of this approach. The presence of not fully incorporated hydroxyapatite, as evidenced by elemental analysis, highlights the need to optimize the integration of demineralized bone powder into the membranes.
Analysis of the chemical composition revealed an increase in the oxygen content of the samples after plasma treatment,
Surface modification of poly(ε-caprolactone) electrospun fibers with bone powder by DBD
indicating the incorporation of oxygenated groups. Infrared spectra confirmed the presence of groups characteristic of PCL, with plasma treatment increasing the intensity of the oxygen-related peaks.
The results of the contact angles indicated the hydrophobicity of the surface of the samples, with a significant increase after exposure to plasma. However, even at high treatment durations, the hydrophilic character was not completely altered, suggesting the need to optimize the treatment conditions.
5. Author’s Contribution
• Conceptualization – Rômulo Ribeiro Magalhães de Sousa.
• Data curation – NA.
• Formal analysis – NA.
• Funding acquisition – NA.
• Investigation – Renan Matos Monção; Ediones Maciel de Sousa; Brenda Jakellinny de Sousa Nolêto.
• Methodology – Marcos Rodrigues Oliveira; Brenda Jakellinny de Sousa Nolêto; Gabriely Gonçalves Lima; Lucas Pereira da Silva.
• Project administration – NA.
• Resources – NA.
• Software – NA.
• Supervision – Rômulo Ribeiro Magalhães de Sousa; Fernanda Roberta Marciano; Thercio Henrique de Carvalho Costa.
• Validation – NA.
• Visualization – NA.
• Writing – original draft – Lauriene Gonçalves da Luz Silva.
• Writing – review & editing – Marcos Cristino de Sousa Brito.
6. Acknowledgements
The authors gratefully acknowledge support from the Coordenação de Aperfeiçoamento de Pessoal de Nível Superior (CAPES), Conselho Nacional de Desenvolvimento Científico e Tecnológico (CNPq) and Universidade Federal do Piauí (UFPI).
7. References
1 De Geyter, N., Sarani, A., Jacobs, T., Nikiforov, A. Y., Desmet, T., & Dubruel, P. (2013). Surface modification of poly-εcaprolactone with an atmospheric pressure plasma jet. Plasma Chemistry and Plasma Processing, 33(1), 165-175. http://doi. org/10.1007/s11090-012-9419-3
2 Langer, R., & Vacanti, J. P. (1993). Tissue engineering. Science, 260(5110), 920-926 http://doi.org/10.1126/science.8493529 PMid:8493529.
3 Wang, Y., Lu, L., Zheng, Y., & Chen, X. (2006). Improvement in hydrophilicity of PHBV films by plasma treatment. Journal of Biomedical Materials Research. Part A, 76(3), 589-595 http://doi.org/10.1002/jbm.a.30575 PMid:16278866.
4 Yildirim, E. D., Ayan, H., Vasilets, V. N., Fridman, A., Guceri, S., & Sun, W. (2008). Effect of dielectric barrier discharge plasma
on the attachment and proliferation of osteoblasts cultured over poly(ε-caprolactone) scaffolds. Plasma Processes and Polymers, 5(1), 58-66. http://doi.org/10.1002/ppap.200700041.
5 Lee, H.-U., Jeong, Y.-S., Jeong, S.-Y., Park, S.-Y., Bae, J.-S., Kim, H.-G., & Cho, C.-R. (2008). Role of reactive gas in atmospheric plasma for cell attachment and proliferation on biocompatible poly ε-caprolactone film. Applied Surface Science, 254(18), 5700-5705. http://doi.org/10.1016/j.apsusc.2008.03.049.
6 Desmet, T., Morent, R., De Geyter, N., Leys, C., Schacht, E., & Dubruel, P. (2009). Nonthermal plasma technology as a versatile strategy for polymeric biomaterials surface modification: A review. Biomacromolecules, 10(9), 2351-2378. http://doi. org/10.1021/bm900186s PMid:19655722.
7 Surucu, S., Masur, K., Turkoglu Sasmazel, H., Von Woedtke, T., & Weltmann, K. D. (2016). Atmospheric plasma surface modifications of electrospun PCL/chitosan/PCL hybrid scaffolds by nozzle type plasma jets for usage of cell cultivation. Applied Surface Science, 385, 400-409 http://doi.org/10.1016/j.apsusc.2016.05.123
8 Ozkan, O., & Turkoglu Sasmazel, H. (2018). Dielectric barrier discharge and jet type plasma surface modifications of hybrid polymeric poly (ε-caprolactone)/chitosan scaffolds. Journal of Biomaterials Applications, 32(9), 1300-1313 http://doi. org/10.1177/0885328218755571 PMid:29388455.
9 Lukmanul Hakim, S., Kusumasari, F. C., & Budianto, E. (2020). Optimization of biodegradable PLA/PCL microspheres preparation as controlled drug delivery carrier. Materials Today: Proceedings, 22(Pt 2), 306-313 http://doi.org/10.1016/j. matpr.2019.08.156
10 Can-Herrera, L. A., Ávila-Ortega, A., de la Rosa-García, S., Oliva, A. I., Cauich-Rodríguez, J. V., & Cervantes-Uc, J. M. (2016). Surface modification of electrospun polycaprolactone microfibers by air plasma treatment: effect of plasma power and treatment time. European Polymer Journal, 84, 502-513 http://doi.org/10.1016/j.eurpolymj.2016.09.060
11. Zakeri, Z., Salehi, R., Mahkam, M., Siahpoush, V., Rahbarghazi, R., Sokullu, E., & Abbasi, F. (2023). Optimization of argon-air DBD plasma-assisted grafting of polyacrylic acid on electrospun POSS-PCUU. Journal of Physics and Chemistry of Solids, 178, 111311 http://doi.org/10.1016/j.jpcs.2023.111311
12 Das, P., Ojah, N., Kandimalla, R., Mohan, K., Gogoi, D., Dolui, S. K., & Choudhury, A. J. (2018). Surface modification of electrospun PVA/chitosan nanofibers by dielectric barrier discharge plasma at atmospheric pressure and studies of their mechanical properties and biocompatibility. International Journal of Biological Macromolecules, 114, 1026-1032 http:// doi.org/10.1016/j.ijbiomac.2018.03.115 PMid:29578008.
13 Kim, D., Thangavelu, M., Cheolui, S., Kim, H. S., Choi, M. J., Song, J. E., & Khang, G. (2019). Effect of different concentration of demineralized bone powder with gellan gum porous scaffold for the application of bone tissue regeneration. International Journal of Biological Macromolecules, 134, 749-758 http:// doi.org/10.1016/j.ijbiomac.2019.04.184 PMid:31054303.
14 Sivan, M., Madheswaran, D., Asadian, M., Cools, P., Thukkaram, M., Van Der Voort, P., Morent, R., De Geyter, N., & Lukas, D. (2020). Plasma treatment effects on bulk properties of polycaprolactone nanofibrous mats fabricated by uncommon AC electrospinning: A comparative study. Surface and Coatings Technology, 399, 126203 http://doi.org/10.1016/j. surfcoat.2020.126203.
15 Choi, E., Bae, S., Kim, D., Yang, G. H., Lee, K., You, H.-J., Kang, H. J., Gwak, S.-J., An, S., & Jeon, H. (2021). Characterization and intracellular mechanism of electrospun poly (ε-caprolactone) (PCL) fibers incorporated with bone-dECM powder as a potential membrane for guided bone regeneration. Journal of Industrial and Engineering Chemistry, 94, 282-291 http:// doi.org/10.1016/j.jiec.2020.11.001
Oliveira, M. R., Silva, L. G. L, Nolêto, B. J. S., Lima, G. G., Monção, R. M., Brito, M. C. S., Silva, L. P., Sousa, E. M., Costa, T. H. C., Marciano, F. R., & Sousa, R. R. M.
16 Grande, S., Cools, P., Asadian, M., Van Guyse, J., Onyshchenko, I. , Declercq , H. , Morent , R. , Hoogenboom , R. , & De Geyte, N. (2018). Fabrication of PEOT/PBT nanofibers by atmospheric pressure plasma jet treatment of electrospinning solutions for tissue engineering. Macromolecular Bioscience, 18(12), e1800309 http://doi.org/10.1002/mabi.201800309 PMid:30353664.
17 Monrreal-Rodríguez , A. K. , Garibay-Alvarado , J. A. , Vargas-Requena , C. L., & Reyes-López, S. Y. (2020). In vitro evaluation of poly-ε-caprolactone-hydroxypatite-
alumina electrospun fibers on the fibroblast’s proliferation. Results in Materials , 6 , 100091 http://doi.org/10.1016/j. rinma.2020.100091
Received: Sept. 09, 2024
Revised: Dec. 18, 2024
Accepted: Mar. 07, 2025
Editor-in-Chief: Sebastião V. Canevarolo
Thiago Torres Matta Neves1* , Simone Taguchi Borges1 , Luiz Antonio Borges Junior1 , Edla Maria Bezerra Lima2 , Cristiane Hess de Azevedo Meleiro1 , Ana Paula Duarte Moreira3 , Antonieta Middea4 and Renata Nunes Oliveira1
1Programa de Pós-Graduação em Engenharia Química, Universidade Federal Rural do Rio de Janeiro –UFRRJ, Rio de Janeiro, RJ, Brasil
2Embrapa Agroindústria de Alimentos, Empresa Brasileira de Pesquisa Agropecuária – EMBRAPA, Rio de Janeiro, RJ, Brasil
3Laboratório de Propriedades Mecânicas, Universidade Federal do Rio de Janeiro – UFRJ, Rio de Janeiro, RJ, Brasil
4Departamento de Caracterização Tecnológica, Centro de Tecnologia Mineral – CETEM, Rio de Janeiro, RJ, Brasil
*thiagotmneves@metalmat.ufrj.br
bstract
This study developed biocomposite films from poly(vinyl alcohol) (PVA), sugar cane bagasse (SCB), and banana peel fibers (BF) or starch-rich banana flour (BS). Morphological analysis revealed filler distribution and fluid percolation within the polymer matrix. Physicochemical analysis indicated stronger interactions between components in BF-containing films. Mechanical strength decreased significantly in SCB-containing films, while biodegradation increased, particularly with banana waste. Water absorption was higher in PVA-BF-SCB and PVA-BS-CSB biocomposites. Incorporating SCB and banana waste into PVA films presents a promising approach for developing biodegradable composite packaging materials, potentially replacing low-density polyethylene in applications like seedling production. This biodegradable material can be applied directly to the environment.
Keywords: degradation, PVA, sugar cane bagasse, banana, hydrogel.
How to cite: Neves, T. T. M., Borges, S. T., Borges Junior, L. A., Lima, E. M. B., Meleiro, C. H. A., Moreira, A. P. D., Middea, A., & Oliveira, R. N. (2025). Biocomposite films utilizing sugar cane bagasse and banana peel aiming seedling applications. Polímeros: Ciência e Tecnologia, 35(2), e20250021. https://doi.org/10.1590/0104-1428.20240108
Polymeric packaging contributes significantly to worldwide waste. Polymers are used as packaging due to critical properties such as resistance to permeation, physical integrity, and economic imperatives[1]. However, the current usage levels of such packaging are creating serious and urgent sustainability concerns. These impacts include accumulating polymeric waste in landfills and, notably, in oceanic environments. Biodegradable polymers continue to be investigated as potential alternatives for packaging with a short shelf life or single-use[2].
Traditionally, in producing seedlings or as soil cover for growing vegetables and certain fruits (such as strawberries), low-density polyethylene (LDPE) is used to suppress weeds and maintain humidity and soil heating to favor plant growth[3]. To reduce the use of these polymers with a limited period of use in the agroindustry, studies have been carried out to develop biodegradable packaging for producing and planting seedlings[4]
Poly (vinyl alcohol) (PVA) is a non-toxic, hydrophilic, biodegradable biopolymer. It is classically used as a base material to produce hydrogels with high water uptake properties[5]. PVA films can be classified according to their cross-linking process as physical or chemical. In physical cross-linking, the cryogelation process promotes, in a milder and more environmentally friendly way, the formation of a physical network of cross-links and secondary bonds, such as hydrogen or ionic bonds, which are reversible and facilitate the degradation process. This process also causes phase separation during freezing, forming a water-rich phase, which upon thawing forms small pores, and another phase rich in polymer. In contrast, chemical cross-linking forms covalent bonds, which hinder the degradation process. Furthermore, cross-linking agents, typically toxic, can impart toxicity to the soil when degraded[6-8]. Films produced from ternary mixtures of PVA/polysaccharides/water, for example, through the cryogelation process, can transform the waterrich phase into a phase composed of the biopolymer, while the PVA-rich phase becomes composed of a phase of both
Neves, T. T. M., Borges, S. T., Borges Junior, L. A., Lima, E. M. B., Meleiro, C. H. A., Moreira, A. P. D., Middea, A., & Oliveira, R. N.
polymers. In this case, the crystalline phase is formed by the approximation of the macromolecular chains that interact through hydrogen bonding via the cryostructuring process[7]
PVA’s hydrolytic degradability is related to the proportion of its acetate groups remaining unsubstituted by hydroxyl groups following manufacture. 12% is viewed as being sufficient to contribute to degradability in water[9]. Hydrolytic degradation is considered advantageous in some applications, such as soluble packaging ready for consumption, or aiming to introduce fertilizers and moisture regulators into the soil, without increasing pollution[10]. PVA also slowly degrades in soil[11] with some microorganisms able to consume PVA[12]
The main disadvantage in replacing single-use plastic packaging with this material is related to its high cost. One alternative is to mix this polymer with natural products, biofillers (starches or fibers), which can be derived from abundant agro-industrial waste, helping to reduce production costs. The use of these biofillers can increase or decrease the mechanical strength of the material, depending on the granulometry, proportion used, and whether or not chemical treatment of the fibers is performed. Additionally, it favors the biodegradation of these materials due to their hydrophilic nature[8,13-15]. It is essential that the plant-based materials used in biocomposites are not intended for human consumption.
Natural fibers stand out due to their notable properties, such as low density, low cost, easy availability, biodegradability, and ease of processing, as well as their good thermal stability[13]
SCB is a considerable source of waste in Brazil, where 174 million tons of bagasse residues (from sugar cane juice extraction) were generated in 2012. SCB is a degradable lignocellulosic material rich in carbohydrates[16]. Among the microorganisms that decompose/consume sugar cane bagasse are bacteria and fungi, but SCB can be a substrate for the growth of earthworms[17]. PVA has previously been combined with lignocellulosic natural material, such as biodegradable nanofibers of purified coir cellulose (from coconut waste husks)[18]. Cellulose nanocrystals and chitin nanofibers loaded to PVA increased the samples’ mechanical properties and thermal resistance to degradation[19]
Brazil is an important producer of bananas, where the banana industry produces over 57.6 million metric tons of banana peels per year. Banana flour is rich in starch[20], while banana peel flour is rich in carbohydrates and hemicelluloses[21] . Banana peels are used as a culture medium for microorganisms[22]. Chitosan mixed with banana flour led to biodegradable films, where starch makes the films water soluble, and chitosan adds a bactericidal characteristic[23].
PVA-starch films degraded considerably (~70%) in 30 days when exposed to fungi compared to the films in contact with compost (~60%)[24]. In addition, PVA-starch samples are susceptible to enzymatic degradation[25].
PVA/starch or PVA/hydroxypropylmethylcellulose films have been proposed as an alternative to replace traditional mulching films in agriculture, helping to control soil temperature and retain moisture. Additionally, these materials do not require removal after serving their purpose, as they can naturally deteriorate, releasing nitrogen-rich elements/ions that act as fertilizers, influencing plant growth[26,27]. Due to their hydrophilic nature, the presence of starch and/or cellulose and their derivatives as added components to PVA tends to increase
water solubility, facilitating bacterial diffusion through the material and, consequently, accelerating the biodegradation process of these materials in soil[26]. On the other hand, this addition can also promote a reduction in mechanical properties compared to pure PVA, due to the increase in amorphous regions and weak intermolecular bonds[26]
The present study aims to develop, manufacture and characterize low-cost biodegradable samples based on PVA mixed with SCB and/or banana parts (banana peel flour (BF) and banana flour (BS)), As a sustainable alternative to PE, particularly in agricultural applications with single-use packaging and low mechanical stress, various formulations were tested intending to evaluate its physical-chemical characteristics, mechanical behavior, and degradation properties.
2.1 Materials
Poly (vinyl alcohol) (PVA) (Mw 85.000-124.000 Da, 99% hydrolyzed) was purchased from SIGMA-ALDRICH, Germany; Food Engineering Department / UFRRJ donated 24 bananas (Musa spp.); sugar cane bagasse was collected from a local market (Seropédica / RJ / Brazil) as waste material.
The bananas were cut and dried in an oven (FABBE – PRIMAR, Brazil) at 52°C for 48h, as was the SCB. Both bananas and SCB were ground using a PERTEN LABORATORY MILL 3600 from Sweden. The ground banana was washed several times with distilled water using a sieve (aperture of 106μm). The retained material (banana fibers - BF) was dried in the oven as described. The washing fluid presented sedimentation, and after 2h, it was centrifuged using a HETTICH ZENTRIFUGEN, 320 R model, Germany, at 9000 RPM for 15 min, obtaining a solid fraction of banana starch (BS). The different granulometries used in organic loads have the function of assisting in the biodegradability process, creating preferential pathways that facilitate the entry of microorganisms, passing through the PVA and reaching the interior of the composite, favoring the proliferation of colonies of these microorganisms and accelerating the biodegradation process.
2.1.1 Samples manufacturing
The samples were prepared using a casting method according to the compositions described in Table 1, with the added fillers always corresponding to 20% of the mass value (g) in the loaded films. The PVA was poured into 100 mL of distilled water under mechanical stirring (equipment FISATOM 710, Brazil) and kept at ~80°C for 4h to achieve a homogeneous polymeric solution. The
Table 1. Composition of Samples.
Biocomposite films utilizing sugar cane bagasse and banana peel aiming seedling applications
loaded material (e.g., banana peel, SCB) was added when the solutions reached room temperature while stirring was maintained. At room temperature, 20 mL of each solution was poured into Petri dishes (φ 150 mm). It was followed by freeze-thawing cycles, where the samples were kept at -16°C for 18h, followed by 2 cycles of 40 min at room temperature and 1h at -16°C before final thawing and drying in an oven (NOVA INSTRUMENTS, NI 1512 model, from Brazil) at 50ºC for 24h.
2.2.1 X-ray Diffraction (XRD)
The mineralogical analysis of the materials were carried out by XRD. The samples were back-loaded to avoid the preferred orientation, and the XRD patterns were obtained with a Bruker- AXS D8 Advance Eco (Germany) operating at a tube voltage and current of 40 kV and 25 mA, respectively, using Cu kα radiation. Diffraction patterns were recorded between 2θ=5º and 80º with a 0.02◦ step and a positionsensitive LynxEye detector (Germany).
2.2.2 Fourier Transformed Infrared Spectroscopy (FTIR)
The physicochemical analysis of the samples was performed by FTIR, Perkin-Elmer Spectrum 100, from USA, ATR mode, wavenumber between 4000 cm-1 and 600 cm-1, 16 scans/sample, spectral resolution of 4 cm-1
2.2.3 Stereoscopic Photographs
Non-degraded samples were photographed using a Sony Cyber-Shot DSC-HX200V (Brazil) camera. Macrographs of the samples produced were then obtained on a black background using the Zeiss Stemi 508 stereoscope (Germany) with the Zeiss Axiocam 208 color camera (Germany) attached, with 1x magnification eyepieces, showing an accurate magnification of 6.3x.
2.2.4 Scanning Electron Microscope with Energy-Dispersive Spectroscopy (SEM/EDS)
The materials’ morphology and elemental composition (coated with Ag) were identified using two scanning electron microscopes. The first one observed the samples by backscattered electron mode in an FEI Quanta 400 scanning electron microscope (USA) operating at 20 kV and small spot size with an EDS coupled using a Quantax Esprit XFlash 6160, Bruker, from Germany, for SEM. The second was a Hitachi TM3030Plus (Japan) scanning electron microscope with an integrated EDS (Bruker Quantax 70 from Germany). This SEM was operated at 15 kV, a small spot size, while images were also acquired in backscattered electron mode (BSE) for elemental contrast, and EDS maps were used to identify the elements of interest accumulated during 200s.
2.2.5 Mechanical analysis
A texture analyzer TA.XT Plus, from England, (P5S, diameter of 4.85 mm, EMBRAPA Agroindustry) was used with a load cell of 0.05N and speed of 1 mm/s. Three samples of each composition were tested, with a sample size of (2.5 x 2.5) cm2. The results were analyzed using ANOVA to verify whether the films presented significant
variations, applying the Scott-Knot test (p < 0.05) to detect differences between the average results.
The samples of 2.5x2.5 cm2 were cut and weighed to perform the hydrolytic degradation and biodegradation tests. Triplicates with similar weights were tested for each composition. Samples were immersed in a constant volume of sterile saline solution (20 mL) at room temperature for 50 days, after the first 30 days, the solution was changed weekly. The samples were then dried in an oven (50°C, 24h) and weighed. The samples’ weight loss (WL) was calculated according to Equation 1[28], where WD is the samples’ original dry weight and WDS is the samples’ dry weight after 50 days of immersion in media/water. ( ) %100 DDS D WW WL
For biodegradation tests[29], the triplicates were weighed and buried in humus from southeast Brazil. The samples were placed on humus soil with a height of 5 cm and covered with humus soil to a depth of 5 cm. The soil was hydrated weekly with ~75mL/sample of rainwater (450mL). After 50 days, the samples were removed from the soil, washed with running water, dried in the oven as described, and weighed. The weight loss of the samples was calculated according to Equation 1. Once more, the results were analyzed using ANOVA to verify whether the loss of mass observed after the degradation tests was significant between the films by applying the Scott-Knot test (p < 0.05).
The samples used in the hydrolytic degradation tests were also used for the water absorption test. Before undergoing the drying process, with the aid of paper towels, the samples were lightly dried to remove excess water and then weighed to obtain the wet mass of the samples. Subsequently, the percentage of water absorption was calculated as a function of the wet mass gain and in relation to the dry mass of the samples, following the equation 1.
The XRD patterns of six biocomposites (PVA, PVA/ Banana starch-BS, PVA/SCB, PVA/Banana Fiber-BF, PVA/ BS/SCB, PVA/BF/SCB) are shown in Figure 1(1) and their respective crystallinities in Table 2. The diffractogram of the pure PVA film was used as a reference to investigate the behavior of the other five different compositions. The maximum intensity diffraction of the PVA peak observed was at 2θ =19.8º corresponding to d-spacing 4.4801Å and indicated the presence of a typical semicrystalline structure, exhibiting a low degree of crystallinity[30]
The biocomposite fillers present two compositions in their majority: Starch is found in higher concentration in banana starch (BS) and SCB fillers, and cellulose is representative in banana fiber (BF). Both starch, cellulose, and PVA separately present semicrystalline structures[31]
Neves, T. T. M., Borges, S. T., Borges Junior, L. A., Lima, E. M. B., Meleiro, C. H. A., Moreira, A.
P.
D., Middea, A., & Oliveira, R. N.

Figure 1. (1) X-ray diffraction patterns of six biocomposites. (2) FTIR spectra of: (a) PVA; (b) sugar cane bagasse (SCB) and (c) banana fibers (BF) and starch (BS). (3) FTIR spectra of: (a) PVA-SCB sample compared to PVA and SCB spectra; (b) PVA-BF and (c) PVA-BS compared to PVA and BF or BS spectra, respectively; (d) PVA-SCB-BF and PVA-SCB-BS spectra compared to PVA-SCB spectrum.
Table 2. Cristallinities of six biocomposites: PVA, PVA/Banana starch-BS, PVA/SCB, PVA/Banana Fiber-BF, PVA/BS/SCB and PVA/BF/SCB.
Biocomposites
An attempt to improve the degree of crystallinity of these films and, possibly, their mechanical strength, can be made by optimizing the starch (BS) content added to the mixture, since at high concentrations, the presence of the polysaccharide can disrupt the crystalline nature of the film instead of increasing this phase[7]. Another factor is the chemical treatment performed on the fibers, which removes the amorphous part of the fibers, increasing the crystalline phase and improving the molecular ordering in the amorphous phase of PVA. The larger the crystal size, the more hydrophobic the fiber becomes, influencing the mechanical and physical properties of the composite[13,15]
From the XRD analysis, it is essential to highlight that the amount of vegetal filler in the biocomposite represents 20%; thus, the well-defined structure of these fillers will influence the intensity of the X-ray peaks without highly varying the crystallinity x amorphous ratio. The variation in granulometry between the fillers can also affect the response, considering whether the point where the analysis was performed had a higher or lower agglomeration of fillers, thus allowing the matrix (PVA) to influence more the degree of crystallinity compared to other components.
3.2.1
FTIR data regarding the individual raw materials are displayed in Figure 1(2), and their vibration modes are in
Table 3. SCB[32], and PVA[33] exhibit their characteristic bands, as do banana-sourced samples[34], although there are some differences in the intensity of bands for fibers and starch. Starch and banana bagasse/fibers usually present bands of 300-2800 cm-1 with varied intensity due to different amylose and amylopectin contents. The banana fibers and banana starch spectra are similar, where the presence of fibers and starch in both banana samples indicates incomplete separation. The band at 996 cm-1 can be referred to as the starch and fibers spectra, where it can be not only related to Starch’s δ(C-O-C) of the α-(1–4) glycosidic bonds[35], but also to the amount of amorphous phase, where the amount of water interacting with intramolecular hydrogen bonds vary according to the crystallinity of the samples. Differences in the position of the band around 929 cm-1 in fibers and starch could be due to varied amounts of amylopectin α-1,6 bonds[36] .
3.2.2
The blended samples present most bands usually associated with PVA (Figure 1(3)), besides slight contribution of the other added materials. By evaluating composites of PVAnanocellulose (obtained from sugar cane bagasse), they presented bands of both components, suggesting that only physical interactions took place[48]. Physical interactions were observed in the composite samples and humidity in the samples containing banana parts.
3.3.1 PVA blended films
The films produced appear to show homogeneous dispersion of the incorporated natural materials, as seen in the photographs in Figure 2(1) since no phase separation is apparent. Although the matrix remains relatively transparent in the films, the addition of banana compounds (BF and BS) rendered the films slightly opaque compared to the pure PVA film. The addition of SCB resulted in a rougher surface due to the large particle size of the component used, on a millimetric and centimetric scale[49,50] Figure 2(2) shows macrographs with 6.3x magnification of biocomposites.
Biocomposite films utilizing sugar cane bagasse and banana peel aiming seedling applications
Table 3. FTIR wavenumbers and respective vibration modes of PVA, SCB, and banana (fibers and starch) samples.
PVA bands vibrations SCB bands vibrations Banana bands vibrations (cm-1) Mode (cm-1) Mode (cm-1) Mode
3263 ν(-OH) of hydrogen bonds[37]
3344 ν(OH) of lignin, carbohydrates, phenols[32] 3299 ν(O-H) bonds; hydrogen bond between OH groups[45]
2921 ν(C-H)[38] 2899 C-H n (aliphatic, aromatic)[44] 2926 ν(C-H) of CH, CH2 groups in cellulose, hemicelluloses[34]
2850 νS(C–H) from alkyl groups[39] 1727 ν(CO) (ketone, carbonyl)[44] 1734 C=O of ketone, carbonyl groups, mainly related to lignin, but also waxes, pectins;[46] or of ester, anhydride[34]
1744 C=O from remaining acetate groups[40] 1684 ν(C=O) of carbonyl groups[32] 1626 Related mainly to banana fibres: ν(C=O) of amide I of proteins;[36] δ(N–H) of –NH2 [34]
1653 δ(HOH)[41] 1654 νAS(C=O) of carboxylic groups[32] 1412 δ(OH)[34]
1560 ν(C=C)[33] 1633 ν(C=C) (benzene ring of lignin)[44] 1372 Starch’s flexion and torsional of C-O-H and C-H groups[35] and fibers C-H[34]
1414
δ(CH2)[38] 1603 aromatic skeletal modes of lignin[44] 1241 Fibers’ amide III of proteins[36] 1376 ω(-CH2-)[42] 1559 CO + aromatic of carbohydrates and lignin[44] 1148 Starch’s ν(C-O-H)[35,36]
1325 δ(-C-H-), δ(-O-H-)[42] 1516 skeletal modes of carbohydrates and lignin[44] 1077 Starch’s ν(C-C);[35] fibres’ ν(C–O) of ester or ether[34] 1236 ν(C-C)[43] 1508 ν(C=C) of aromatic rings[32] 996 Starch’s δ(C-O-C) of the α-(1–4) glycosidic bonds[35] 1143 PVA crystallites[36], ν(C-C) and ν(C-O-C)[38] 1426 ν(C-O) of carboxylic groups[32] 929 Starch’s α-(1–6) bond of amylopectin,[35] glycosidic bonds;[36] amorphous phase of fibres and starch[36]
1089 out of plane C-O vibration[43] 1372 C-H deformation of -CH3, -CH2- [32] 860 Amine groups of proteins[47] 916 ρ(CH2)[38] 1318 ν(C-O) of carboxylate groups[32] 760 δ(C=C); [34] phenols’ aromatic structures[36] 835 ν(C-C)[38] 1240 C=O deformation of carboxylic acids[32] 706 Phenols’ aromatic structures[36]
11161105 O-H ass., CO def. (lignin)[44] 1034 ν(C-O-C, O-H) of polysaccharides[32]
988 C-H aromatic of carbohydrates and lignin[44] 898 833

Figure 2. (1) Samples morphology: a) PVA; b) PVA-BF; c) PVA-BS; d) PVA-SCB; e) PVA-SCB-BS; and f) PVA-SCB-BF. (2) Macrographs with 6.3x magnification of biocomposites: (a) PVA; (b) PVA/BS; (c) PVA/SCB; (d) PVA/BF; (e) PVA/SCB/BS and (f) PVA/SCB/BF.
3.3.2 SEM - microtexture studies
The SEM images of the six biocomposites obtained in this study presented characteristic morphology and can be observed in Figure 3. The BSE images reveal that small
PVA particles were not dissolved during the casting process. Starch’s presence is evident in the PVA-BS sample (Figure 3b) by its characteristic circular geometry. Despite the washing and starch extraction procedures applied to the green banana
T.

peels, significant amounts of starch are still visible in the samples loaded with banana fiber. Furthermore, the banana fibers are not evenly distributed, resulting in concentrated fiber veins within the film.
Through SEM, it is possible to observe spaces between the filler and the matrix. The dispersion of the fillers on a micrometric scale (BF and BS) favored the encapsulation of these fillers by the polymeric matrix (Figures 3b and 3d). Compared to the samples containing SCB with a centimetric particle size, a decrease in the specific surface area is observed in relation to the other samples, where the interaction with the polymeric matrix occurs through anchoring (Figures 3c and 3f).
The low adhesion between the organic components (BS, BF, and SCB) with the PVA film can also be observed by FTIR (Figure 4).
3.4 Mechanical properties
The PVA and PVA composite films presented similar Young’s modulus (p>0.05). However, there is a significant difference between the failure strengths (σ), where ⌠ PVA (2.34 ± 0.93 MPa) is higher than the failure strength of all samples containing sugar cane bagasse, PVA-SCB (0.64 ± 0.15 MPa), PVA-SCB-BS (0.55 ± 0.10 MPa) and PVA-SCB-BF (0.81 ± 0.21 MPa), p<0.05 (Figure 4(1)). In addition, there is a difference (p<0.05) between the strength of ⌠ PVA-BF (1.43 ± 0.07 MPa) >⌠ PVA-SCB and ⌠ PVA-BS (1.86 ± 0.36 MPa) >⌠ PVA-SCB-BS. The addition of fibers disrupts the intermolecular interactions, mainly hydrogen bonds, between PVA and amylose/amylopectin. Some researchers[10,50], also observed a reduction in mechanical properties when adding fruit flour as fillers to PVA films, due to the low compatibility of the flours with PVA.
When the cellulose fibers and starch in a film present low water content, this can be expected to increase sample strength[51]. However, adding oil and cassava bagasse rich in starch has lowered PVA water resistance[52]. In this case, it can be observed that the addition of sugar cane bagasse reduced the samples’ strength, possibly due to SCB hydration.
It is worth noting that the variations observed in the tensile strength among the different combinations highlight the complex interactions between the various components within the biocomposite system. These interactions can be
influenced by factors such as filler-matrix compatibility, filler particle size, dispersion, and interfacial adhesion, which ultimately affect the overall mechanical performance of the developed sheets[53]
The biocomposites with higher mechanical strengths are associated with smaller granulometric-sized fillers obtained through grinding, which indicates that the semicrystalline regions present show a lower intensity of XRD signals due to the breakage of the amylopectin chains present in the starches. Samples incorporating BF and BS display micrometric granulometry, demonstrating enhanced mechanical strength as a result of the effective dispersion of fillers within the polymeric matrix. Notably, the addition of nanometric fillers derived from the seed coat of Putranjiva roxburghii yielded a significant 32.94% improvement in tensile strength[15]. A comparative analysis with SCB samples possessing centimetric granulometry reveals a lower specific surface area for equivalent mass loadings (g), leading to an anchoring effect with the matrix that compromises mechanical strength (Figure 4-1).
These results may be primarily related to the reduction in the % crystallinity observed in the XRD characterization of the composite films concerning the PVA film (Table 2 and Figure 1(1)) and the low adhesion between the organic components (BS, BF, and SCB), as can be observed in the microscopy images obtained by SEM (Figure 3).
One approach to enhancing the mechanical resistance of natural fibers is through chemical modification[8,13,15,53,54] For use in composites, natural fibers like cellulose must be separated from other components, such as lignin, hemicelluloses, wax, and proteins, in the initial stage[53] Chemical treatments can reduce the amorphous part of the fibers, increasing cellulose content and consequently improving mechanical resistance and crystallinity degree[13]
The addition of a chemical crosslinking agent increased the resistance to 13.38 MPa, while the addition of 1% (m/m) modified fiber further increased the resistance to 18.54 MPa. Alkaline treatment stabilizes the cellulose present in the fiber, removes non-cellulosic elements from the surface, and promotes better adhesion between the fibers and the matrix. Moreover, the greater comminution of SCB would also contribute to increasing the contact area with the PVA matrix[8,15,53]
Biocomposite films utilizing sugar cane bagasse and banana peel aiming seedling applications

Figure 4. (1) Mechanical properties of: (a) PVA and (b) PVA-based composite films. (2) Degradation of six biocomposite samples (hydrolytic - water and biodegradation - soil). (3) Water absorption of six biocomposite films and (4) FTIR spectra of the samples after 50 days degradation in the w – water and s – soil: (a) PVA; (b) PVA-SCB; (c) PVA-BF; (d) PVA-BS; (e) PVA-SCB-BF and (f) PVA-SCB-BS.
The pure PVA samples showed low biodegradation, with soil degradation of 8.65 ± 4.35% mass loss, compared to hydrolytic degradation, with water degradation of 14.58 ± 1.88% mass loss (p < 0.05). Hydrolytic degradation is considered advantageous in some applications, such as soluble packaging ready for consumption, which can also act as fertilizers without increasing pollution[10]. The characteristic behavior of PVA samples may be attributed to the leaching of chains by the media, caused by water absorption and the breakage of hydrogen bonds associated with OH groups[55]
The films containing natural fillers (BF, BS, SCB) exhibited higher degradation in soil (biodegradation, above 23% in all samples) than in water (hydrolytic degradation, where the
greatest mass loss was observed in the PVA-BS-SCB sample with 16.03 ± 0.23%), p < 0.05, measured in terms of mass loss after 50 days (Figure 4(2)). The films containing natural materials (SCB and banana) exhibited higher biodegradation than pure PVA (8.65 ± 4.35%), indicating a significant increase in the biodegradation of composite films compared to PVA film (p < 0.05)[8]. The highest biodegradation rates were observed in the PVA-SCB-BF (27.72 ± 0.53%) and PVA-SCB-BS (27.48 ± 0.50%) films. Since starch and PVA are biodegradable materials, their blends are considered potential sustainable materials for packaging and agriculture. The chemical treatment performed on the fibers, as well as the use of chemical crosslinkers, decreases biodegradation. SCB is a material that stimulates biodegrading biota, as do
Neves, T. T. M., Borges, S. T., Borges Junior, L. A., Lima, E. M. B., Meleiro, C. H. A., Moreira, A. P. D., Middea, A., & Oliveira, R. N.
banana constituents. The combination of these materials is expected to support biodegradation. Water absorption is an important property, especially for the development of biodegradable materials[50,56]. Soil moisture is absorbed by the films, promoting their swelling, which, associated with the lack of chemical interaction between the filler and the matrix, promotes the development of preferred pathways for the passage of fluids (air, water, microorganisms, and organic waste) and natural materials increase the activity of microorganisms towards these samples[8,29,50,54,57].
All loaded samples exhibited higher absorption than pure PVA (97.70 ± 14.30%), while all other samples showed absorption above 121%, Figure 4(3). This value is lower than that observed some works[7,8]. This occurs because the absorption measurement was performed on the samples after 50 days of hydrolytic degradation. The highest absorption rates were observed in the PVA-BF-SCB and PVA-BS-SCB composites, with 146.72 ± 2.95% and 140.63 ± 5.29%, respectively. The addition of crosslinkers and modified fibers can reduced water absorption, due to the increased crystallinity of PVA and the hydrophobicity conferred to the fiber by the treatment[8,15].
The increased absorption of the composite films is due to the greater affinity of water with the O-H groups present in these films, either by the addition of starch (BS) or by the contamination observed in BF[7]. The poor chemical compatibility observed between PVA and banana flour increased the free volume and, consequently, the water absorption[50]. Additionally, the coarser granulometry of
SCB, which also showed a lack of chemical interactions with the matrix, creates pathways for water percolation, also aiding the degradation process[29]
The samples were also evaluated by FTIR (Figure 4(4)) after 50 days in the two media. The hydrolytically degraded samples presented the absence or the shift of the band at ~1560 cm-1 (related to the PVA ν(C=C)[58] vibration due to residual acetate groups[59]) and the absence of the band at ~1744cm-1 (C=O vibration of PVA residual acetate[60]). The residual acetate groups in PVA play an essential role in promoting degradation[61]. The absence of the bands associated with residual acetate groups is also observed in biodegradation, where the acetate groups enhance degradation in soil[61]. In addition, it was observed that the biodegraded samples presented some soil bands, e.g., bands at 3695 cm−1 (vibration of OH groups from the AlOH and Si-OH surfaces), and at 3620 cm−1 (ν(O-H) of clay minerals)[62]. Most samples degraded in soil presented an additional band at (1030-1040) cm-1, related to ν(Si-O) of soil silicates[63]. The bands at 1650 cm-1 and 835 cm-1 are present in all samples, while in some samples, they are more intense due to hydro- and biodegradation. The high intensity of the last band (~835 cm-1) would be related to the biotransformation of polysaccharides from starch and cellulose in low-molecular-weight sugars by microorganisms and due to their presence in the samples[64]
The degraded samples presented a variety of morphologies according to the media to which they were exposed (Figures 5(1), 5(2) and 5(3)). The sample containing SCB

Biocomposite films utilizing sugar cane bagasse and banana peel aiming seedling applications
and banana starch became porous when degraded in water or soil (Figure 5(1)). Porosity and cracks all over the sample are evidence of degradation[65,66], and this was also apparent in the weight loss measurements. The samples degraded in soil presented soil residues, as identified by FTIR, which could also be evaluated by EDX (Figure 5(2)). The Si and Al maps (Figure 5(3)) presented more evidence of siliconbased material on the PVA-SCB-BS sample immersed in soil. Silicon and aluminum are abundant elements in soil[67], and are also present in sugar cane bagasse, which justifies the presence of Si in the hydrolytically degraded PVA-SCB-BS sample and the higher amount of Si in the same sample degraded in soil.
The combination of banana and SCB filler in the PVA formulation increases the amorphous phase when banana fibers are present (PVA/BF/SCB) by about 17.48% and by 16.51% when starch is present (PVA/BS/SCB) compared to the pure PVA film. FTIR analysis revealed no chemical interactions between the fillers and the matrix. Physical anchoring interactions are observed in the biocomposites and there is an indication of water content in the samples containing banana parts. The addition of sugar cane bagasse reduced the mechanical strength compared to pure PVA, possibly due to hydration of the bagasse. Although the tensile strength of films containing SCB decreased by up to 76.55% in the PVA-BS-SCB film compared to pure PVA, the PVA-SCB-BF and PVA-SCB-BS biocomposites exhibited higher biodegradation rates, approximately 27.72% and 27.48%, respectively, in mass loss after 50 days in soil, suggesting that the addition of natural materials as filler stimulates the local biota. Biodegradation (in soil) led to the absence of acetate groups, the presence of soil, and indications of degradation of the samples by microorganisms (biotransformation of polysaccharides into low molecular weight sugars). And water absorption increased significantly in these biocomposites by 146.72±2.95% and 140.63±5.29%, respectively, in mass gain. The data gathered highlight the potential of PVA composites with SCB and/or banana waste to be used as biodegradable and sustainable alternatives to current packaging materials.
5. Author’s Contribution
• Conceptualization – Thiago Tôrres Matta Neves; Simone Taguchi Borges; Edla Maria Bezerra Lima; Cristiane Hess de Azevedo Meleiro; Antonieta Middea; Renata Nunes Oliveira.
• Data curation – Ana Paula Duarte Moreira.
• Formal analysis – Thiago Tôrres Matta Neves; Ana Paula Duarte Moreira; Antonieta Middea.
• Funding acquisition – Renata Nunes Oliveira.
• Investigation – Thiago Tôrres Matta Neves.
• Methodology – Thiago Tôrres Matta Neves; Cristiane Hess de Azevedo Meleiro; Antonieta Middea.
• Project administration – NA.
• Resources – Renata Nunes Oliveira.
• Software – NA.
• Supervision – Simone Taguchi Borges; Edla Maria Bezerra Lima; Renata Nunes Oliveira.
• Validation – Simone Taguchi Borges; Luiz Antonio Borges Junior; Edla Maria Bezerra Lima; Renata Nunes Oliveira.
• Visualization – Luiz Antonio Borges Junior; Edla Maria Bezerra Lima; Antonieta Middea; Renata Nunes Oliveira.
• Writing – original draft – Thiago Tôrres Matta Neves.
• Writing – review & editing – Thiago Tôrres Matta Neves; Ana Paula Duarte Moreira; Renata Nunes Oliveira.
This work was carried out with the support of CAPES and FAPERJ Process SEI E-26/201.381/2021 (260532)- SEI - 260003/004641/2021. To CETEM-UFRJ and EMBRAPA Food Technology for the partnership and analyzes made.
1 Lima, E. M. B., Middea, A., Reis, F. S., Mateus, D. N., Amorim, R. G., Pereira, I. C. S., Santos, N. R. R., Mattos, M. C., Minguita, A. P. S., Anjos, M. R., Neumann, R., Oliveira, R. N., & Tavares, M. I. B. (2024). Influence of the microstructure in the biodegradability process of eco-friendly materials based on polylactic acid and mango seed for food packaging to minimize microplastic generation. Journal of Applied Polymer Science, 141(22), e55449 http://doi.org/10.1002/app.55449
2 Cazón, P., Velazquez, G., & Vázquez, M. (2019). Novel composite films from regenerated cellulose-glycerol-polyvinyl alcohol: mechanical and barrier properties. Food Hydrocolloids, 89, 481-491 http://doi.org/10.1016/j.foodhyd.2018.11.012
3 Kasirajan, S., & Ngouajio, M. (2012). Polyethylene and biodegradable mulches for agricultural applications: a review. Agronomy for Sustainable Development, 32(2), 501-529 http:// doi.org/10.1007/s13593-011-0068-3
4 Nascimento, J., Leite, K., & Gomes, K. (2024). Biodegradable containers made from mesquite pods Prosopis juliflora (Sw.) DC for the production of plant seedlings. Concilium, 24(10), 409-428 http://doi.org/10.53660/CLM-3470-24I74
5 Dilkushi, H. A. S., Jayarathna, S., Manipura, A., Chamara, H. K. B. S., Edirisinghe, D., Vidanarachchi, J. K., & Priyashantha, H. (2024). Development and characterization of biocomposite films using banana pseudostem, cassava starch and poly(vinyl alcohol): A sustainable packaging alternative. Carbohydrate Polymer Technologies and Applications, 7, 100472 http://doi. org/10.1016/j.carpta.2024.100472.
6 Duquette, D., & Dumont, M.-J. (2019). Comparative studies of chemical crosslinking reactions and applications of biobased hydrogels. Polymer Bulletin, 76(5), 2683-2710. http:// doi.org/10.1007/s00289-018-2516-6
7 Croitoru, C., Pop, M. A., Bedo, T., Cosnita, M., Roata, I. C., & Hulka, I. (2020). Physically Crosslinked Poly (Vinyl Alcohol)/ Kappa-Carrageenan Hydrogels: structure and applications. Polymers, 12(3), 560 http://doi.org/10.3390/polym12030560 PMid:32138357.
8 Mittal, A., Garg, S., & Bajpai, S. (2020). Fabrication and characteristics of poly (vinyl alcohol)-starch-cellulosic material based biodegradable composite film for packaging application.
Neves, T. T. M., Borges, S. T., Borges Junior, L. A., Lima, E. M. B., Meleiro, C. H. A., Moreira, A. P. D., Middea, A., & Oliveira, R. N.
Materials Today: Proceedings, 21(Part 3), 1577-1582 http:// doi.org/10.1016/j.matpr.2019.11.210
9 Julinová, M., Vaňharová, L., & Jurča, M. (2018). Watersoluble polymeric xenobiotics – Polyvinyl alcohol and polyvinylpyrrolidon – And potential solutions to environmental issues: a brief review. Journal of Environmental Management, 228, 213-222 http://doi.org/10.1016/j.jenvman.2018.09.010 PMid:30223180.
10. Sarebanha, S., & Farhan, A. (2018). Eco-friendly composite films based on polyvinyl alcohol and jackfruit waste flour. Journal of Packaging Technology and Research, 2(3), 181-190. http://doi.org/10.1007/s41783-018-0043-4.
11 Chiellini, E., Corti, A., & Solaro, R. (1999). Biodegradation of poly(vinyl alcohol) based blown films under different environmental conditions. Polymer Degradation & Stability, 64(2), 305-312 http://doi.org/10.1016/S0141-3910(98)00206-7
12 Chiellini, E., Corti, A., D’Antone, S., & Solaro, R. (2003). Biodegradation of poly (vinyl alcohol) based materials. Progress in Polymer Science, 28(6), 963-1014 http://doi.org/10.1016/ S0079-6700(02)00149-1
13 Vinod, A., Sanjay, M. R., Suchart, S., & Jyotishkumar, P. (2020). Renewable and sustainable biobased materials: an assessment on biofibers, biofilms, biopolymers and biocomposites. Journal of Cleaner Production, 258, 120978 http://doi.org/10.1016/j. jclepro.2020.120978
14 Varghese, S. A., Pulikkalparambil, H., Rangappa, S. M., Siengchin , S., & Parameswaranpillai , J. (2020). Novel biodegradable polymer films based on poly(3hydroxybutyrateco-3-hydroxyvalerate) and Ceiba pentandra natural fibers for packaging applications. Food Packaging and Shelf Life, 25, 100538. http://doi.org/10.1016/j.fpsl.2020.100538.
15 Moorthy, M. K. M., Gurusamy, S., Pandiarajan, B., Balasubramanian, B., Pandiarajan, N., Suyambulingam, I., Rangappa, S. M., & Siengchin, S. (2024). Effect of alkali-treated Putranjiva roxburghii seed shell filler on physico-chemical, thermal, mechanical, and barrier properties of polyvinyl alcohol-based biofilms. Journal of Vinyl and Additive Technology, 30(4), 1010-1024 http://doi.org/10.1002/vnl.22101
16 Moretti, M. M. S., Bocchini-Martins, D. A., Nunes, C. C. C., Villena, M. A., Perrone, O. M., Silva, R., Boscolo, M., & Gomes, E. (2014). Pretreatment of sugarcane bagasse with microwaves irradiation and its effects on the structure and on enzymatic hydrolysis. Applied Energy, 122, 189-195 http:// doi.org/10.1016/j.apenergy.2014.02.020
17 Kumar, R., Verma, D., Singh, B. L., Kumar, U., & Shweta, K. M. (2010). Composting of sugar-cane waste by-products through treatment with microorganisms and subsequent vermicomposting. Bioresource Technology, 101(17), 6707-6711 http://doi.org/10.1016/j.biortech.2010.03.111 PMid:20403689.
18. Wu, J., Du, X., Yin, Z., Xu, S., Xu, S., & Zhang, Y. (2019). Preparation and characterization of cellulose nanofibrils from coconut coir fibers and their reinforcements in biodegradable composite films. Carbohydrate Polymers, 211, 49-56. http:// doi.org/10.1016/j.carbpol.2019.01.093. PMid:30824103.
19 Irvin, C. W., Satam, C. C., Meredith, J. C., & Shofner, M. L. (2019). Mechanical reinforcement and thermal properties of PVA tricomponent nanocomposites with chitin nanofibers and cellulose nanocrystals. Composites. Part A, Applied Science and Manufacturing, 116, 147-157 http://doi.org/10.1016/j. compositesa.2018.10.028
20 Andrade, B. A., Perius, D. B., Mattos, N. V., Luvielmo, M. M., & Mellado, M. S. (2018). Production of unripe banana flour ( Musa spp) for application in whole wheat bread. Brazilian Journal of Food Technology, 21, e2016055 http:// doi.org/10.1590/1981-6723.5516
21 Castelo-Branco, V. N., Guimarães, J. N., Souza, L., Guedes, M. R., Silva, P. M., Ferrão, L. L., Miyahira, R. F., Guimarães, R. R., Freitas, S. M. L., Reis, M. C., & Zago, L. (2017). The use of green banana (Musa balbisiana) pulp and peel flour as an ingredient for tagliatelle pasta. Brazilian Journal of Food Technology, 20, e2016119 http://doi.org/10.1590/19816723.11916
22 Arquelau, P. B. F., Silva, V. D. M., Garcia, M. A. V. T., Araújo, R. L. B., & Fante, C. A. (2019). Characterization of edible coatings based on ripe “Prata” banana peel flour. Food Hydrocolloids, 89, 570-578 http://doi.org/10.1016/j.foodhyd.2018.11.029
23. Pitak, N., & Rakshit, S. K. (2011). Physical and antimicrobial properties of banana flour/chitosan biodegradable and self sealing films used for preserving Fresh-cut vegetables. Lebensmittel-Wissenschaft + Technologie, 44(10), 2310-2315 http://doi.org/10.1016/j.lwt.2011.05.024
24 Maiti, S., Ray, D., Mitra, D., & Mukhopadhyay, A. (2013). Isolation and characterisation of starch/polyvinyl alcohol degrading fungi from aerobic compost environment. International Biodeterioration & Biodegradation, 82, 9-12 http://doi.org/10.1016/j.ibiod.2013.01.018
25 Bhargava, N., Sharanagat, V. S., Mor, R. S., & Kumar, K. (2020). Active and intelligent biodegradable packaging films using food and food waste-derived bioactive compounds: A review. Trends in Food Science & Technology, 105, 385-401 http://doi.org/10.1016/j.tifs.2020.09.015
26 Elgharbawy, A. S., El Demerdash, A.-G. M., Sadik, W. A., Kasaby, M. A., Lotfy, A. H., & Osman, A. I. (2024). Synthetic degradable polyvinyl alcohol polymer and its blends with starch and cellulose - A comprehensive overview. Polymers, 16(10), 1356 http://doi.org/10.3390/polym16101356 PMid:38794547.
27. Yue, H., Li, X., Mai, L., Wu, Q., He, M., Yin, G., Peng, J., Yang, C., & Guo, J. (2024). Sustainable cottonseed protein bioplastics: physical and chemical reinforcement, and plant seedling growth application. Chemical Engineering Journal, 497, 154794 http://doi.org/10.1016/j.cej.2024.154794
28 Spiridon, I., Popescu, M. C., Bodârlău, R., & Vasile, C. (2008). Enzymatic degradation of some nanocomposites of poly(vinyl alcohol) with starch. Polymer Degradation & Stability, 93(10), 1884-1890 http://doi.org/10.1016/j.polymdegradstab.2008.07.017
29 Ayyubi, S. N., Purbasari, A., & Kusmiyati, (2022). The effect of composition on mechanical properties of biodegradable plastic based on chitosan/cassava starch/PVA/crude glycerol: optimization of the composition using box behnken design. Materials Today: Proceedings, 63(Suppl. 1), S78-S83 http:// doi.org/10.1016/j.matpr.2022.01.294
30 Hu, Y., Wang, Q., & Tang, M. (2013). Preparation and properties of Starch-g-PLA/poly(vinyl alcohol) composite film. Carbohydrate Polymers, 96(2), 384-388 http://doi. org/10.1016/j.carbpol.2013.04.011 PMid:23768577.
31. Santos, L. A., Jr, Thiré, R. M. S. M., Lima, E. M. B., Racca, L. M., & Silva, A. L. N. (2018). Mechanical and thermal properties of environment friendly composite based on mango’s seed shell and high-density polyethylene. Macromolecular Symposia, 381(1), 1800125. http://doi.org/10.1002/masy.201800125.
32 Moubarik, A., & Grimi, N. (2015). Valorization of olive stone and sugar cane bagasse by-products as biosorbents for the removal of cadmium from aqueous solution. Food Research International, 73, 169-175 http://doi.org/10.1016/j. foodres.2014.07.050
33 Choo, K., Ching, Y. C., Chuah, C. H., Julai, S., & Liou, N.-S. (2016). Preparation and characterization of polyvinyl alcoholchitosan composite films reinforced with cellulose nanofiber. Materials, 9(8), 644 http://doi.org/10.3390/ma9080644 PMid:28773763.
Polímeros, 35(2), e20250021, 2025
Biocomposite films utilizing sugar cane bagasse and banana peel aiming seedling applications
34 Mahindrakar, K. V., & Rathod, V. K. (2018). Utilization of banana peels for removal of strontium (II) from water. Environmental Technology & Innovation, 11, 371-383. http:// doi.org/10.1016/j.eti.2018.06.015
35 Ramírez-Hernández, A., Aparicio-Saguilán, A., ReynosoMeza, G., & Carrillo-Ahumada, J. (2017). Multi-objective optimization of process conditions in the manufacturing of banana (Musa paradisiaca L.) starch/natural rubber films. Carbohydrate Polymers, 157, 1125-1133 http://doi.org/10.1016/j. carbpol.2016.10.083. PMid:27987814.
36 Pelissari, F. M., Andrade-Mahecha, M. M., Sobral, P. J. A., & Menegalli, F. C. (2013). Comparative study on the properties of flour and starch films of plantain bananas (Musa paradisiaca). Food Hydrocolloids, 30(2), 681-690 http://doi.org/10.1016/j. foodhyd.2012.08.007
37 Reis, E. F., Campos, F. S., Lage, A. P., Leite, R. C., Heneine, L. G., Vasconcelos, W. L., Lobato, Z. I. P., & Mansur, H. S. (2006). Synthesis and characterization of poly (vinyl alcohol) hydrogels and hybrids for rMPB70 protein adsorption. Materials Research, 9(2), 185-191 http://doi.org/10.1590/ S1516-14392006000200014.
38 Gaidukov, S. , Danilenko , I. , & Gaidukova, G. (2015 ). Characterization of strong and crystalline polyvinyl alcohol/ montmorillonite films prepared by layer-by-layer deposition method. International Journal of Polymer Science, 2015(1), 123469 http://doi.org/10.1155/2015/123469
39 Awada, H., & Daneault, C. (2015). Chemical modification of poly(vinyl alcohol) in water. Applied Sciences, 5(4), 840-850. http://doi.org/10.3390/app5040840
40 Alhosseini, S. N., Moztarzadeh, F., Mozafari, M., Asgari, S., Dodel, M., Samadikuchaksaraei, A., Kargozar, S., & Jalali, N. (2012). Synthesis and characterization of electrospun polyvinyl alcohol nanofibrous scaffolds modified by blending with chitosan for neural tissue engineering. International Journal of Nanomedicine, 7, 25-34 http://doi.org/10.2147/IJN.S25376 PMid:22275820.
41 Daniliuc, L., & David, C. (1996). Intermolecular interactions in blends of poly(vinyl alcohol) with poly(acrylic acid): 2. Correlation between the states of sorbed water and the interactions in homopolymers and their blends. Polymer, 37(23), 5219-5227 http://doi.org/10.1016/0032-3861(96)00328-X
42 Gohil, J. M., Bhattacharya, A., & Ray, P. (2006). Studies on the crosslinking of poly (vinyl alcohol). Journal of Polymer Research, 13(2), 161-169 http://doi.org/10.1007/s10965-0059023-9
43. Bhargav, P. B., Mohan, V. M., Sharma, A. K., & Rao, V. V. R. N. (2008). Characterization of poly(vinyl alcohol)/sodium bromide polymer electrolytes for electrochemical cell applications. Journal of Applied Polymer Science, 108(1), 510-517 http:// doi.org/10.1002/app.27566.
44 Bilba, K., & Ouensanga, A. (1996). Fourier transform infrared spectroscopic study of thermal degradation of sugar cane bagasse. Journal of Analytical and Applied Pyrolysis, 38(1-2), 61-73 http://doi.org/10.1016/S0165-2370(96)00952-7
45 Bagali, S. S., Gowrishankar, B. S., & Roy, A. S. (2017). Optimization, kinetics, and equilibrium studies on the removal of lead(II) from an aqueous solution using banana pseudostem as an adsorbent. Engineering, 3(3), 409-415 http://doi. org/10.1016/J.ENG.2017.03.024
46 Benítez, A. N., Monzón, M. D., Angulo, I., Ortega, Z., Hernández, P. M., & Marrero, M. D. (2013). Treatment of banana fiber for use in the reinforcement of polymeric matrices. Measurement, 46(3), 1065-1073 http://doi.org/10.1016/j. measurement.2012.11.021.
47 Vilardi, G., Di Palma, L., & Verdone, N. (2018). Heavy metals adsorption by banana peels micro-powder: equilibrium modeling
by non-linear models. Chinese Journal of Chemical Engineering, 26(3), 455-464 http://doi.org/10.1016/j.cjche.2017.06.026
48 Kumar, A., Negi, Y. S., Bhardwaj, N. K., & Choudhary, V. (2013). Synthesis and characterization of cellulose nanocrystals/ PVA based bionanocomposite. Advanced Materials Letters, 4(8), 626-631 http://doi.org/10.5185/amlett.2012.12482
49 Aarstad, O., Heggset, E. B., Pedersen, I. S., Bjørnøy, S. H., Syverud, K., & Strand, B. L. (2017). Mechanical properties of composite hydrogels of alginate and cellulose nanofibrils. Polymers, 9(8), 378. http://doi.org/10.3390/polym9080378. PMid:30971055.
50 Ooi, Z. X., Ismail, H., & Teoh, Y. P. (2018). Characterization and properties of biodegradable polymer film composites based on polyvinyl alcohol and tropical fruit waste flour. In S.M. Sapuan, H. Ismail, & E.S. Zainudin (Eds.), Natural fibre reinforced vinyl ester and vinyl polymer composites, development, characterization and applications (pp.313-332). Cambridge, UK: Woodhead Publishing http://doi.org/10.1016/ B978-0-08-102160-6.00016-0
51 Mali, S., Debiagi, F., Grossmann, M. V. E., & Yamashita, F. (2010). Starch, sugarcane bagasse fibre, and polyvinyl alcohol effects on extruded foam properties: a mixture design approach. Industrial Crops and Products, 32(3), 353-359 http://doi. org/10.1016/j.indcrop.2010.05.014
52 Debiagi, F., Kobayashi, R. K. T., Nakazato, G., Panagio, L. A., & Mali, S. (2014). Biodegradable active packaging based on cassava bagasse, polyvinyl alcohol and essential oils. Industrial Crops and Products, 52, 664-670 http://doi.org/10.1016/j. indcrop.2013.11.032
53. Sruthimol, J. J., Haritha, K., Warrier, A. S., Nandhu Lal, A. M., Harikrishnan, M. P., Rahul, C. J., & Kothakota, A. (2025). Tailoring the properties of natural fibre biocomposite using chitosan and silk fibroin coatings for eco-friendly packaging. Industrial Crops and Products , 225, 120465. http://doi. org/10.1016/j.indcrop.2025.120465
54 Lani, N. S., Ngadi, N., Johari, A., & Jusoh, M. (2014). Isolation, characterization, and application of nanocellulose from oil palm empty fruit bunch fiber as nanocomposites. Journal of Nanomaterials, 2014 (1), 702538 http://doi. org/10.1155/2014/702538
55 Kenawy, E.-R., Kamoun, E. A., Mohy Eldin, M. S., & El-Meligy, M. A. (2014). Physically crosslinked poly(vinyl alcohol)hydroxyethyl starch blend hydrogel membranes: synthesis and characterization for biomedical applications. Arabian Journal of Chemistry, 7(3), 372-380 http://doi.org/10.1016/j. arabjc.2013.05.026
56 Montes, L. F. S., Melaj, M. A., Lorenzo, M. C., Ribba, L., & Garcia, M. A. (2024). Biodegradable composite materials based on cassava starch and reinforced with topinambur (Helianthus tuberosus) aerial part fiber. Sustainable Polymer & Energy, 2(2), 10004 http://doi.org/10.35534/spe.2024.10004
57. Sasimowski, E., Grochowicz, M., Janczak, K., Nurzyńska, A., & Belcarz-Romaniuk, A. (2025). Investigation of biodegradation, artificial aging and antibacterial properties of poly(butylene succinate) biocomposites with onion peels and wheat bran. Materials, 18(2), 293 http://doi.org/10.3390/ma18020293 PMid:39859764.
58 Zobel, H. F. (1988). Molecules to granules: a comprehensive starch review. Stärke, 40(2), 44-50 http://doi.org/10.1002/ star.19880400203
59 Rogojanu, A., Rusu, E., Olaru, N., Dobromir, M., & Dorohoi, D. O. (2011). Development and characterization of poly(vinyl alcohol) matrix for drug release. Digest Journal of Nanomaterials and Biostructures, 6(2), 809-818. Retrieved in 2024, December 24, from https://www.researchgate.net/publication/330542815
60 Chen, M.-J., Zhang, X.-Q., Matharu, A., Melo, E., Li, R.-M., Liu, C.-F., & Shi, Q.-S. (2017). Monitoring the crystalline structure of sugar cane bagasse in aqueous ionic liquids. ACS Sustainable Chemistry & Engineering, 5(8), 7278-7283 http:// doi.org/10.1021/acssuschemeng.7b01526.
61 Pająk, J., Ziemski, M., & Nowak, B. (2010). Poly(vinyl alcohol): biodegradable vinyl material. Chemik, 64(7-8), 523-530 Retrieved in 2024, December 24, from https://bibliotekanauki. pl/articles/1287265
62. Xing, Z., Tian, K., Du, C., Li, C., Zhou, J., & Chen, Z. (2019). Agricultural soil characterization by FTIR spectroscopy at micrometer scales: depth profiling by photoacoustic spectroscopy. Geoderma, 335, 94-103. http://doi.org/10.1016/j. geoderma.2018.08.003
63 Margenot, A. J., Calderón, F. J., Goyne, K. W., Mukome, F. N. D., & Parikh, S. J. (2017). IR spectroscopy, soil analysis applications. In J. C. Lindon, G. E. Tranter, & D. W. Koppenaal (Eds.), Encyclopedia of Spectroscopy and Spectrometry (pp. 448-454). Amsterdam: Academic Press http://doi.org/10.1016/ B978-0-12-409547-2.12170-5
64. Arancibia, M. Y., López-Caballero, M. E., Gómez-Guillén, M. C., & Montero, P. (2014). Release of volatile compounds and
biodegradability of active soy protein lignin blend films with added citronella essential oil. Food Control, 44, 7-15 http:// doi.org/10.1016/j.foodcont.2014.03.025.
65 Duarte, M. A. T., Duek, E. A. R., & Motta, A. C. (2014). In vitro degradation of poly (L-co-D,L lactic acid) containing PCL-T. Polímeros: Ciência e Tecnologia, 24(1), 1-8 http:// doi.org/10.4322/polimeros.2014.056.
66 Borrelli, N., Alvarez, M. F., Osterrieth, M. L., & Marcovecchio, J. E. (2010). Silica content in soil solution and its relation with phytolith weathering and silica biogeochemical cycle in Typical Argiudolls of the Pampean Plain, Argentina: a preliminary study. Journal of Soils and Sediments, 10(6), 983-994 http:// doi.org/10.1007/s11368-010-0205-7
67. Norsuraya, S., Fazlena, H., & Norhasyimi, R. (2016). Sugarcane bagasse as a renewable source of silica to synthesize Santa Barbara amorphous-15 (SBA-15). Procedia Engineering, 148, 839-846 http://doi.org/10.1016/j.proeng.2016.06.627
Received: Dec. 08, 2024
Revised: Mar. 13, 2025
Accepted: Mar. 19, 2025
Neves, T. T. M., Borges, S. T., Borges Junior, L. A., Lima, E. M. B., Meleiro, C. H. A., Moreira, A. P. D., Middea, A., & Oliveira, R. N. Polímeros, 35(2), e20250021, 2025
Andrii Bieliatynskyi1 , Olena Bakulich2 , Viacheslav Trachevskyi3* and Mingyang Ta1
1School of Civil Engineering, North Minzu University, Yinchuan, NingXia, P.R. China
2Faculty of Management, Logistic and Tourism, National Transport University, Kyiv, Ukraine
3Institute of Chemistry of High-Molecular Compounds, National Academy of Sciences of Ukraine, Kyiv, Ukraine
*viacheslav.trachevskyi@edu-knu.com; meches49@ukr.net
Obstract
Composite materials have emerged as a viable alternative to metals due to their lighter weight and superior mechanical properties; however, due to the trade-off between performance and cost, they have yet to gain widespread adoption. Despite environmental legislation constantly being updated, producers of various equipment and structures are hesitant to incorporate composite technologies into standard constructions and products, primarily for economic reasons. As a consequence, recent advancements in composite-producing processes have focused on the usage of carbon composites and automated robotics incorporation for ecologically conscious, stable, and affordable production. Therefore, it is essential to investigate current methodologies for industrial carbon composite material production and manufacturing processes to determine the most optimal composite production and implementation criteria.
Keywords: binders, composite materials, fibrous filler, carbon nanotubes.
How to cite: Bieliatynskyi, A., Bakulich, O., Trachevskyi, V., & Ta, M. (2025). Contemporary methods of industrial composite material production technology. Polímeros: Ciência e Tecnologia , 35 (2), e20250022. https://doi.org/10.1590/0104-1428.20240089
Matrix and filler materials can be of the most diverse nature and origin. The filler serves as a reinforcing element in composite materials and has significantly higher physical and mechanical properties than the matrix. The composites’ specific mechanical properties are noticeably higher than the initial components. Composites differ from filled polymer systems in that the role of the filler is reduced to lowering the price of the final product while the mechanical properties of the material are noticeably increased[1,2]. Despite public distrust of ultra-light modern composites, carbon and other fibrous composites are becoming commonplace when structural materials require high stiffness and low weight, along with corrosion resistance and impact and fatigue resistance[3]
Fiber composites are the most famous examples of modern composites, characterized by high strength, high stiffness, and low weight. A high melting point, coefficient of thermal expansion, and low density also characterize these materials, which are desirable technical properties. In construction, structure weight is crucial since it should support a given load and do so with a minimum of elastic deflection. Thus, strength fibers are compared based on specific modulus and specific strength, i.e., modulus or strength divided by density, respectively. In this case, plastics (polyethylene, aramid fiber) and glass are the stiffest materials, while metals show low indicators of specific stiffness and specific strength. However, using fibers directly
is impossible; they should be bonded with a matrix[4,5]. Fibers can be randomly arranged in a plane or in three dimensions, but such an arrangement reduces the possible density of the fiber structure. Fibers are also woven into mats before being incorporated into the composite because this makes it easier to work with fiber arrays[6].
The anisotropy of properties of fiber composites is design engineering using advanced composites. Anisotropy can vary; fibers can be placed exactly where they are needed in a structure to support loads. It is also possible, for example, to vary the amount and orientation of fibers along the length of the beam to vary the stiffness and torsional stiffness of the material[7]. If computer techniques had not been invented, it would be impossible to exploit the advantages of anisotropic materials, such as carbon fiber-reinforced plastics. Due to the complexities and large number of variables involved, computer programs are required to relate the characteristics of individual lamellae to the properties of the fibers and to account for interactions in terms of bending-torsion coupling between different lamellae. Originally, engineers were dissatisfied with the anisotropy of the material, so these complexities were viewed as a significant disadvantage, but this issue found its solution[8]
The unique properties of carbon structural modifications discovered in the second half of the 20th century have captivated researchers. The unique structure and quantum size
Bieliatynskyi, A., Bakulich, O., Trachevskyi, V., & Ta, M.
effects of nanoscale carbon materials (graphene, fullerenes, single-walled carbon nanotubes, nanoscale diamond, etc.) define their exceptional properties, including a large specific surface area, high strength, electrical conductivity, and the ability to incorporate diverse functional groups[9]. The listed factors open up possibilities for using carbon nanomaterials to modify and create new composites with reinforced properties.
Currently, one of the primary applications of carbon nanoscale fillers is the development of composite materials, including next-generation polymer composite materials (hereafter – PCM) with enhanced physical, mechanical, operational, and functional properties[10-18]. The ability to reduce weight while maintaining high operational characteristics is a critical factor influencing technology’s competitiveness. In this regard, there are many opportunities for using PCMs made primarily of carbon fibers. As a result, the challenge of imbuing PCMs with the functional physical and mechanical properties of nanoscale fillers while retaining the matrix’s operational characteristics is highly relevant.
Based on a brief examination of the problems associated with the production of modern composite materials, the aim of this research is to develop a modern method of producing industrial composite materials.
The development and study of composites, which are polymers filled with nanoscale particles such as carbon nanotubes (hereafter – CNTs), is one of the most rapidly developing areas of nanomaterial technology. Polypropylene (hereafter – PP), polyethene (hereafter – PE), and epoxy resins (hereafter – ER) are some of the most common environmentally friendly polymers and form a significant class of universal thermoplastics[10]. Recently, there has been increased interest in the potential of regulating the structure and properties of ER, PP, and PE with nanofillers of various natures and organizations, which determine the interaction between them and the polymer. This has resulted in the ability of composites to acquire high operational characteristics. Multi-walled carbon nanotubes (hereafter – MWCNTs) have become increasingly popular as fillers for a wide range of polymers, including ER, PP, and PE, due to their unique mechanical, electrical, and thermal properties at a low cost[19] CNTs tend to aggregate into bundles and clumps, making uniform distribution in polymer matrices challenging. The uneven distribution of CNTs and their limited interaction with the matrix, the mechanical and kinetic properties of polymer-CNT composites are lower than expected[20]
A melt of isotactic PP from CNTs (21060 TU 05-1756-78 grade), the weight percent of which varied from 0.05 to 5.0 wt%, was stirred using the LGP-25 extruder at a speed of 50 rpm. Primary specimens were in the form of granules, which were then crushed, pressed at a temperature of 180 °C and under a pressure of 5 MPa, and extracted into fibers. The viscosity (η) of the melts of the original PP and the PP-CNT system was determined by MV-2 micro viscometer in the range of shear stresses τ = (0.1-5.7)×104 Pa at temperatures of 190, 210, and 220 °C. Elastic properties were assessed by the extrudates’ swell value (B). The assigned experimental error in determining η and B constituted ±(2÷5)%. The flow
mode “n” was equal to the slope of the flow curve touching the abscissa at a given point.
The longitudinal deformation of the melt was assessed by the value of the maximum jet drawing (Fmax), where the assigned error was ±7%. The differential thermal and gravimetric analyses helped to study the crystallization behavior of PP in CNT composites (derivatograph Q 1500, heating rate 10 degrees per minute). The dependence of the specific thermal conductivity of the specimens on temperature was measured by the dynamic heating method using an IT-400 industrial device equipped with an analogdigital device for recording data on a personal computer. The specimens were coated with a thin layer of graphite lubricant to improve thermal contact with the measuring plates. During measurements, the temperature varied from 40 to 170 °С, and the heating rate was 5 °С/min. The relative error of the method was ±5%. The specimens had a cylindrical shape with a diameter of 15 mm and a height of 1.3-1.7 mm.
E7-14 LCR meter was used to examine electrical conductivity at low frequencies at room temperature by the two-contact method. Compression or rupture of fibers was tested using a 2167-P50 tensile testing machine in the repeated-static compression mode; a strain diagram was recorded until the final destruction of the specimen. The fibers were fixed by winding on cylindrical clamps, where the loading speed was 10 mm/min.
CNTs were produced by the catalytic chemical vapour deposition (CCVD) through ethylene, propylene or propane butane pyrolysis on complex metal oxide catalysts. These catalysts were obtained by precipitation or aerosol evaporation of water-soluble salts of iron or nickel, aluminium, and molybdenum. The CNT synthesis was carried out using the equipment with a reactor of 30 dm3 and an output of about 1.5kg of product per day. According to the standard of Ukraine, the average diameter of CNTs was 10-20nm, while the specific surface defined by the argon desorption was 200-400m2/g, and the bulk density was within 20-40 g/dm3. According to the data of the transmission electron microscopy (TEM), X-ray diffraction, combined scattering spectroscopy, and differential thermal and gravimetric analyses, no amorphous carbon was found.
CNTs were introduced into the epoxy resin by mixing in a three-roll viscous liquid mixer. Three types of influence of curing conditions were established, including curing without external influence, curing under pressure, and curing with vacuum pumping.
The structural properties and crystallization reactions of composites, as well as their dependence on carbon nanotube concentration, were studied using differential thermal analysis (hereafter – DTA), differential thermogravimetric analysis, and X-ray diffraction methods. The DTA analysis results of samples that differed only in filler concentration are presented in Table 1, which includes the temperatures at the beginning and end of the melting and crystallization processes, the temperature range of these processes, and the temperature of the DTA peak extremum.
Table 1. Characteristic temperatures of melting, crystallization processes, and degree of crystallinity determined for the PP-CNT system with varying filler concentrations.
Table 1 shows that the melting process’s characteristic temperatures depend on the presence of CNTs and change non-monotonically as their concentration in the composite increases. For example, the lowest temperature at the start and the highest temperature range of the melting process are observed in the PP-CNT system with a CNT content of 0.5% (by weight). The limited mobility of the polymer chains, possibly due to interactions between the polymer and the filler’s surface, is the cause of the increase in melting and crystallization temperatures with increasing CNT content in the polymer.
Within the investigated concentration range, there is a monotonic but nonlinear increase in characteristic temperatures as CNT concentration increases. It is important to note that the minimum crystallization temperature at a concentration of 0.5% (by weight) CNTs is 120 °C.
The obtained data for the PP-1.0 wt% composite with CNTs is in good agreement with the results for the PP composite containing 0.8 wt% single-walled CNTs (hereafter – SWCNTs): the crystallization temperature in the PP-SWCNT system increases, and the temperature interval (ΔT) for melting and crystallization is smaller compared to pure PP. This suggests that single-walled and multi-walled CNTs have a similar influence on the structural formation processes of composites.
The X-ray diffraction patterns of samples from the core and edge of PP-CNT composites with CNT concentrations of 0.5, 1.0, 3.0, and 5.0 wt% are shown in Figure 1. It should be noted that the X-ray diffraction pattern is devoid of prominent reflections corresponding to CNTs’ graphite-like structure. The overall appearance of the X-ray diffraction indicates that the polymer in the composite, like the pristine PP, has a typical -form of crystals, which is supported by DTA melting temperature data.
Figure 2 depicts the decomposition of the X-ray diffraction spectrum into components. It is attributed to both crystalline and amorphous phases, indicating nonmonotonic changes in the concentration of the topologically ordered phase with increasing CNT content. At the lowest CNT concentration (0.05% by weight), there is a slight increase in crystallinity (71.8%) compared to the original PP, which has a crystallinity of 71%. However, at a CNT content of 0.1% by weight, the crystallinity drops to 61%.

1. X-ray diffraction of PP-CNT samples with different CNT concentrations.

Figure 2. Dependence of the degree of crystallinity determined from X-ray structural data on the CNT concentration in the PPCNT system.
Furthermore, as CNT concentration increases to 3%, the degree of crystallinity increases to 64.4%, and at 5% concentration, it reaches 68.2% (Figure 2). This qualitatively correlates with changes in the onset of crystallization temperature (Table 1) and the dependence of the half-width of the X-ray reflexes on CNT concentration in the PP-CNT system (Figure 3), where they decrease or remain unchanged at a concentration of 0.05% by weight, then increase in the concentration range of 0.1% to 0.5% by weight of CNTs.
The specified concentration range, as demonstrated by DTA and electron X-ray diffraction methods, is characterized by a reduced degree of crystallinity compared to the original polymer, resulting in a significant amount of unordered phase and the presence of nanopores, which contribute to a decrease in the composite’s thermal conductivity by reducing the polymer’s thermal conductivity and additional energy scattering. The additive contribution of a more thermally conductive component of the composite compensates for the increase in thermal conductivity with an increase in filler content. The presence of the polymerCNT interphase boundary impedes the achievement of thermal conductivity values comparable to CNT with the energy loss of phonons due to the low conductivity of the contacts being the determining factor[13,19-22]
An inverse relation between the amount of nanomodifier absorbed and cone slump is observed when introducing CNTs into a concrete mixture. Increasing the amount of CNTs absorbed decreases this relation but increases the loss of mobility. When polyelectrolyte molecules are rapidly absorbed by positively charged minerals of Portland cement clinker and hydration products, an amount of nanomodifier in the

liquid phase of the concrete mixture remains insufficient to maintain mobility at a given level. The amount of the nanomodifier absorbed by various monominerals of Portland cement clinker and mineral additives was determined to examine the mobility properties of cement pastes after the introduction of CNTs. The following materials were used: monominerals of Portland cement clinker, Portland cement (activity 525 kgf/cm2), and CNT nanomodifier.
The authors studied how the type of dispersion medium affects the efficiency of uniform CNT distribution in a laboratory disperser (dispersion duration was 60 minutes). The medium dispersity was assessed on the kinetics of CNT sedimentation prepared in a disperser. The highest sedimentation rate was observed when tap water was used as a liquid medium. The sedimentation rate decreased in a superplasticizer solution, indicating a more homogeneous dispersion composition. The lowest sedimentation rate was observed in the polymer solution with highly concentrated alkaline agents; thus, this medium provided for the most uniform nanomodifier distribution and the formation of stable colloidal particles. When the amount of alkali is minimal, CNTs can polymerize, and a suspension should be used as a precursor. The degree of CNT distribution is exclusively influenced by suspension self-heating temperature during dispersion, which is achieved mainly through friction work. An increase in temperature intensifies the distribution process, primarily due to a decrease in the suspension’s viscosity.
After examining the chemical changes in composites, the mechanical properties of the PP-CNT system were investigated. The presence of CNTs in the composite has no effect on the stress-strain curve, as shown in Figures 4a and 4b, which show compression curves for PP and the PP-5% CNT composite; it only changes the quantitative values of the characteristics. The curves display typical rigid polymer behaviour. However, adding 5% CNTs to PP significantly increases tensile strength (by 55%) while decreasing fracture

strain by about 40%. When CNTs are added, the fracture strain decreases during compression, indicating that the polymer’s brittleness increases.
Figures 5 and 6 show how deformation and compressive stress are affected by the concentration of CNTs in the composite.
The compressive strain appears to decrease sharply at a concentration of 0.5% mass (material becomes more brittle) and then gradually increases with increasing CNT concentration but remains lower than that of pure PP. As a result, in terms of character, the dependence of compressive strain on CNT concentration is similar to the dependence of kinetic characteristics on CNT concentration and correlates with the dependency of the degree of crystallinity in the PP-CNT system on CNT concentration. The compressive


strain is reduced by amorphization of the polymer structure, and its value gradually increases after the emergence of a continuous CNT network.
The compressive strength decreases slightly at 0.5% mass CNT concentration and then increases significantly after passing a certain threshold, surpassing the value for pure PP.
The increase in deformation is associated with a decrease in the frequency of chemical cross-linking within the network. However, the decrease in modulus is compensated for by an increase in modulus due to improved bonding between the surface of functionalized CNTs and the polymer matrix, which involves the formation of covalent bonds between functional groups and epoxy cycles. Data from studies of various researchers[7,20-27] reveals that compared the efficiency of modification using different types of nanotubes (Table 2) provide support for this hypothesis.
The analysis of the presented findings demonstrates that modification with the original nanotubes results in an increase in modulus and a decrease in relative elongation. Non-functionalized nanotubes thus serve as a typical highmodulus filler. When epoxy systems are modified with nanotubes functionalized with amino groups, the modulus of elasticity and the elongation of the epoxy composites increase simultaneously. Based on the data presented, it is possible to conclude that carbon nanotubes, in addition to reinforcing the oligomer, can influence the change in physical and mechanical properties by participating in the curing process and forming the structure of the polymer matrix.
The development of high-temperature binders for structural polymer composite materials (hereafter – PCMs) is one of the current challenges in materials science. The traditional method of creating binders with the highest density of chemical crosslinks does not always produce the desired results. The glass transition temperature increases as the crosslink density rises, but this results in decreased tensile strain and impact resistance of the polymer matrix, which has a negative impact on the properties of PCMs[27]. The strength of the bonded polymers is determined by the balance between the frequency of crosslinks, which increases the elastic modulus and glass transition temperature, and the number of physical network nodes providing one-dimensional stress redistribution due to relaxation processes. As a result, with the same number of physical network nodes, increasing the frequency of crosslinks increases strength; however, once the frequency of crosslinks is high enough to freeze relaxation processes, the strength decreases. Several examples of developments are provided below to demonstrate a potential solution to this problem. Based on the assumptions about the carbon composites (hereafter – CNCs) modification mechanism described above, a strategy for using carbon nanotubes to modify high-temperature binders based on epoxy matrices
Bieliatynskyi, A., Bakulich, O., Trachevskyi, V., & Ta, M.
was developed. The binder was first synthesized as a precursor using ED-20 resin, 4,4-diaminodiphenylsulfone hardener, and multi-walled functionalized carbon nanotubes (hereafter – FWCNTs). FWCNTs were ultrasonically dispersed in acetone to prepare the precursor. The resin and hardener were then added to the dispersion in a stoichiometric ratio and stirred for 40 minutes. Vacuum was used to remove the remaining solvent. The obtained precursor was added to the standard binder at a rate of 25 parts by weight per 100 parts by weight of the binder in terms of the dry residue, stirred with a magnetic stirrer, and the viscosity of the modified system was adjusted to the required technological level[21] The binder-modified impregnated carbon tape was dried for 5 days. The PCM was pressed in step mode (temperature 120 °C, 30 minutes soaking, temperature 180 °C, 25 atm pressure, 4 hours soaking). As can be seen from the data, as the concentration of FWCNTs increases, so do the glass transition temperature and dynamic modulus of elasticity, reaching a maximum at a concentration of CNCs ≈ 0.13 mass% and monotonically decreasing beyond this concentration.
Table 3 demonstrates the dependencies of glass transition temperatures and dynamic elastic moduli of unidirectional polymer composite materials (PCMs) based on ENFB-2M and VS-2526K binders with the addition of a modified
precursor ED-20/4,4-diaminodiphenylsulfone, modified with 0.13 wt.% FMWNT (Functionalized Multi-Walled Carbon Nanotubes). PCMs based on these binders containing no carbon nanotubes (CNTs) were used as reference samples. The addition of the modified precursor FBWNT to the composite allows for an increase in the glass transition temperature of PCMs of 14 and 8 °C, respectively, as well as an increase in the elastic modulus of the ENFB-2M and VS-2526K binders of 23 and 11%. The formation of more frequent and regular cross-linking networks in the presence of CNTs is likely to be associated with improved thermomechanical properties.
Presumably, the increase in the frequency and regularity of chemical cross-linking networks explains the overall improvement in the properties of PMC (polymer matrix composites) reported by abovementioned authors[7,22-28] The astralen modifiers were used in this study.
The corrosion resistance of CNT-modified concretes was determined on 0.04×0.04×0.16 m prism specimens. The results of these studies are presented in Table 4
The analysis of the results of specimen frost resistance showed that nanomodified concretes have high corrosion resistance to various aggressive media, including acids. CNT-modified concrete specimens of composition No. 1 (separate preparation technology), aging for six months in
Table 4. Change in mass and strength of nanomodified concrete specimens under alternate freezing and thawing.
Frost resistance criteria
No.
No.
Increase (+) and decrease (-) in ultimate compressive strength under alternate freezing and thawing, %
Number of cycles
Frost resistance criteria Visual signs of failure (cracking, scaling, cleaving)
Composition No. 1 no
Composition No. 2 no no
an aggressive medium (a solution of magnesium sulfate and sodium sulfate with a 5% concentration) showed a slight decrease in the corrosion resistance coefficient, respectively, to values of 0.89 and 0.90. The destruction of specimens aging in a hydrochloric acid solution was less intensive; the corrosion resistance coefficient decreased to 0.87. Traditionally prepared concretes also showed resistance to the development of type 3 corrosion. There was virtually no reduction in the tensile strength of concrete when aging concrete specimens in a hydrochloric acid solution (Figures 7 and 8).
CNT-modified concrete also showed higher indicators for electrocorrosion and thermal conductivity. Furthermore, the modulus of elasticity and shrinkage of concrete increased during curing.
It has been demonstrated that incorporating carbon nanotubes into a polymer matrix improves the physicochemical, physicomechanical, and operational properties of composite nanopolymer materials. The physicomechanical properties of polymer composites reinforced with carbon nanotubes improve by 30-40%. When creating structural polymer composite materials, functionalized carbon-containing nanoparticles can be used as modifiers to control the curing process and elasticity of epoxy materials.
The investigated possibility of using nanoparticle self-organization to impart functional properties to composite materials and to obtain 3-D reinforced hybrid nanocomposites has shown its effectiveness. The diversity of allotropic forms and unique geometric carbon nanosized

Figure 7. Dependence of the corrosion resistance coefficient of concrete (composition No. 1) on aging in an aggressive medium.

Figure 8. Dependence of the corrosion resistance coefficient of concrete (composition No. 2) on aging in an aggressive medium.
objects provide for designing radio-absorbing fillers with the necessary ratio between the real and imaginary parts of the permittivity.
Based on the research and the experimental results obtained, prototypes of the elements of an unmanned aerial vehicle (“engine cowlings”) were manufactured using improved technology that involved introducing CNTs in an optimal amount to the epoxy matrix. Nanotubes give the element a black color, while the black element does not allow determining the distance to it using a Laser rangefinder monocular LRM1500M at a range of over 100 m. This laser rangefinder can determine the distance to an object within 10-1500 m.
Contemporary advancements in the field of composites are devoted to the creation of materials based on both carbon fillers and carbon nanotubes. However, due to the specifics of the source materials and the properties of carbon nanotubes, as well as the need for cost-effective production, modern processes are receiving the most attention. As a result, scientists and engineers are expected to devote significant attention to the development of new binders for the production of composites. Innovative construction materials open up new prospects for sustainable development of the industry. The use of CNT nanomaterials helps to create durable, energy-efficient, and environmentally friendly structures. The development and implementation of these innovations is an important step towards sustainable development of economic activity, which will help ensure a comfortable life for future generations.
• Conceptualization – Olena Bakulich.
• Data curation – Andrii Bieliatynskyi.
• Formal analysis – Mingyang Ta.
• Funding acquisition - Andrii Bieliatynskyi.
• Investigation – Mingyang Ta.
• Methodology – Viacheslav Trachevskyi.
• Project administration – Andrii Bieliatynskyi.
• Resources – Olena Bakulich.
• Software – Mingyang Ta.
• Supervision – Viacheslav Trachevskyi.
• Validation – Andrii Bieliatynskyi.
• Visualization – Mingyang Ta.
• Writing – original draft – Olena Bakulich.
• Writing – review & editing – Viacheslav Trachevskyi.
The authors gratefully acknowledge the financial support from the Science and Technology Department of Ningxia, the Scientific Research Fund of North Minzu University (No. 2020KYQD40).
8. References
1 Restuccia, K. L., Hobisch, G., Jacobs, V., & Ponsolle, D. (2020). US Patent No 10,655,006. Washington: U.S. Patent
Bieliatynskyi, A., Bakulich, O., Trachevskyi, V., & Ta, M.
and Trademark Office. Retrieved in 2024, October 28, from https://patentimages.storage.googleapis.com/de/1a/82/ cf74605bde8653/US10655006.pdf
2 Bieliatynskyi, A., Yang, S., Pershakov, V., Shao, M., & Ta, M. (2023). Study of concrete properties based on crushed stone sand mixture and fibre of fly ash of thermal power plants. Science and Engineering of Composite Materials , 29(1), 412-426 http://doi.org/10.1515/secm-2022-0167
3. Grand View Research. (2023). Composites market size, share & trends analysis report by product type (carbon fiber, glass fiber), by manufacturing process (layup, filament, injection molding, pultrusion), by end-use, by region and segment forecasts, 2023-2030. San Francisco, CA: Grand View Research. Retrieved in 2024, October 28, from https://www. grandviewresearch.com/industry-analysis/composites-market
4 Yang, S., Bieliatynskyi, A., Trachevskyi, V., Shao, M., & Ta, M. (2022). Technological aspects of the preparation of polymer composites of building materials and coatings. Polymers & Polymer Composites, 30 http://doi.org/10.1177/09673911221135690
5 Murray, R. E., Beach, R., Barnes, D., Snowberg, D., Berry, D., Rooney, S., Jenks, M., Gage, B., Boro, T., Wallen, S., & Hughes, S. (2021). Structural validation of a thermoplastic composite wind turbine blade with comparison to a thermoset composite blade. Renewable Energy, 164, 1100-1107 http:// doi.org/10.1016/j.renene.2020.10.040
6 Wu , W. , Jiang , B. , Xie , L. , Klunker, F. , Aranda , S. , & Ziegmann, G. (2013). Effect of compaction and preforming parameters on the compaction behavior of bindered textile preforms for automated composite manufacturing. Applied Composite Materials, 20(5), 907-926 http://doi.org/10.1007/ s10443-012-9308-1
7. Fan, Z., Tang, W., Hsiao, K.-T., & Advani, S. G. (2004). Flow and dispersion of multi-walled carbon nanotubes in polymer and fiberglass reinforced polymer composites. In Proceedings of the NSF Design, Service and Manufacturing Grantees and Research Conference. Dallas, TX: National Science Foundation
8 Ponsolle, D., Restuccia, K. L., Jacobs, W., Blackburn, R., LoFaro, C., Price, R., Doyle, M., Smith, M., & Roman, M. (2013). WO 2013/096377 A2. Geneva: World Intellectual Property Organization . Retrieved in 2024, October 28, from https://patentimages.storage.googleapis.com/ c8/50/0a/0cb4772a1fb96c/WO2013096377A2.pdf
9 Kim , C. , Yun , M.-G. , Kim , S. , & Jeon , G.-W. ( 2022 ). Mathematical model to predict the moduli of wet-laid pulp/ fibre/resin composite materials. International Journal of Precision Engineering and Manufacturing, 23(11), 13151324 http://doi.org/10.1007/s12541-022-00700-8
10 Biron, M. (2018). Thermoplastics and thermoplastic composites Norwich, UK : William Andrew http://doi.org/10.1016/ C2017-0-01099-6
11. Bongiorno, F., Militello, C., & Zuccarello, B. (2022). Mode I translaminar fracture toughness of high-performance laminated biocomposites reinforced by sisal fibres: accurate measurement approach and lay-up effects. Composites Science and Technology , 217 , 109089 http://doi.org/10.1016/j. compscitech.2021.109089
12 Giuliani , P. M. , Giannini , O. , & Panciroli , R. ( 2022 ). Characterizing flax fibre-reinforced bio-composites under monotonic and cyclic tensile loading. Composite Structures, 280, 114803 http://doi.org/10.1016/j.compstruct.2021.114803
13 Inam, F., Wong, D. W. Y., Kuwata, M., & Peijs, T. (2010). Multiscale hybrid micronanocomposites based on carbon nanotubes and carbon fibres. Journal of Nanomaterials , 2010(1), 453420 http://doi.org/10.1155/2010/453420
14 Kochi, S., Yoshio, K., & Miyoshi, M. (2015). US Patent No 9,062,203. Washington: U.S. Patent and Trademark Office Retrieved in 2024, October 28, from https://pubchem.ncbi. nlm.nih.gov/patent/US-9062203-B2
15 Liu, Y.-N., Yuan, C., Liu, C., Pan, J., & Dong, Q. (2019). Investigation of the resin infusion process based on automated fiber placement preform. Scientific Reports, 9(1), 7440. http:// doi.org/10.1038/s41598-019-43982-1 PMid:31092893.
16 Loeliger, A., Yang, E., & Bomphray, I. (2021). An overview of automated manufacturing for composite materials. In Proceedings of the 26th International Conference on Automation and Computing (ICAC) (pp. 1-6), Portsmouth, UK New York: IEEE http://doi.org/10.23919/ICAC50006.2021.9594159
17 Mei, M., Sun, L., He, Y., Li, M., Duan, S., Wei, K., & Yang, X. (2021). Preforming characteristics in the compaction process for fabric with binder under elevated temperature. Composites Communications , 23 , 100545 http://doi. org/10.1016/j.coco.2020.100545
18. Zhao, X., Copenhaver, K., Wang, L., Korey, M., Gardner, D. J., Li, K., Lamm, M. E., Kishore, V., Bhagia, S., Tajvidi, M., Tekinalp, H., Oyedeji, O., Wasti, S., Webb, E., Ragauskas, A. J., Zhu, H., Peter, W. H., & Ozcan, S. (2022). Recycling of natural fiber composites: challenges and opportunities. Resources, Conservation and Recycling, 177, 105962 http:// doi.org/10.1016/j.resconrec.2021.105962
19 Huang, Y., Li, N., Ma, Y., Du, F., Li, F., He, X., Lin, X., Gao, H., & Chen, Y. (2007). The influence of single-walled carbon nanotube structure on the electromagnetic interference shielding efficiency of its epoxy composites. Carbon, 45(8), 1614-1621 http://doi.org/10.1016/j.carbon.2007.04.016
20. Bieliatynskyi, A., Yang, S., Pershakov, V., Shao, M., & Ta, M. (2023). Exploring the use of modern fly ash materials from Chinese power plants in road and airfield infrastructure. Environmental Engineering and Management Journal, 22(3), 527-537 http://doi.org/10.30638/eemj.2023.041
21 Chandrasekaran, V. C. S., Advani, S. G., & Santare, M. H. (2010). Role of processing on interlaminar shear strength enhancement of epoxy/glass fibre/multi-walled carbon nanotube hybrid composites. Carbon, 48(13), 3692-3699 http://doi.org/10.1016/j.carbon.2010.06.010
22 Fan, Z., Hsiao, K.-T., & Advani, S. G. (2004a). Experimental investigation of dispersion during the flow of multi-walled carbon nanotube/polymer suspension in fibrous porous media. Carbon , 42 (4), 871-876 http://doi.org/10.1016/j. carbon.2004.01.067
23 Qiu, J., Zhang, C., Wang, B., & Liang, R. (2007). Carbon nanotube integrated multifunctional multiscale composites. Nanotechnology, 18(27), 275708 http://doi.org/10.1088/09574484/18/27/275708
24 Challa , R. K. , Kajfez , D. , Demir, V., Gladden , J. R. , & Elsherbeni, A. Z. (2008). Characterization of multi-walled carbon nanotube (MWCNT) composites in a waveguide of square cross-section. IEEE Microwave and Wireless Components Letters, 18(3), 161-163 http://doi.org/10.1109/ LMWC.2008.916776
25 Huang, Q., Holland, T. B., Mukherjee, A. K., Chojnacki, E., Liepe, M., Mallory, M., & Tigner, M. (2009). Carbon nanotube RF absorbing materials. In Proceedings of the 14th International Conference on RF Superconductivity (SRF2009) (pp. 648-651). Berlin: Helmholtz-Zentrum Berlin für Materialien und Energie
26 Lubineau, G., & Rahaman, A. (2012). A review of strategies for improving the degradation properties of laminated continuous-fibre/epoxy composites with carbon-based nanoreinforcements. Carbon, 50(7), 2377-2395 http://doi. org/10.1016/j.carbon.2012.01.059
27 Li, N., Huang, Y., Du, F., He, X., Lin, X., Gao, H., Ma, Y., Li, F., Chen, Y., & Eklund, P. C. (2006). Electromagnetic interference (EMI) shielding of single-walled carbon nanotube epoxy composites. Nano Letters, 6(6), 1141-1145 http://doi. org/10.1021/nl0602589 PMid:16771569.
28 De Vivo, B., Guadagno, L., Lamberti, P. R. R., Sarto, M. S., Tamburrano, A., Tucci, V., & Vertuccio, L. (2009, June 11-12). Electromagnetic properties of carbon nanotube/
epoxy nanocomposites. In Proceedings of the EMC Europe 2009 Workshop: Materials in EMC Applications (pp. 9-12), Athens, Greece New York: IEEE http://doi.org/10.23919/ EMC.2009.10814044
Received: Oct. 28, 2024
Revised: Jan. 31, 2025
Accepted: Apr. 17, 2025
Alexandra Helena de Barros1 , Rachel Farias Magalhães1 , Lídia Mattos Silva Murakami1 , Milton Faria Diniz2 , Natália Beck Sanches3,4 , Taynara Alves de Carvalho1 , Jorge Carlos Narciso Dutra1 and Rita de Cássia Lazzarini Dutra1*
1Departamento de Química, Instituto Tecnológico da Aeronáutica – ITA, São José dos Campos, SP, Brasil
2Divisão de Propulsão, Instituto de Aeronáutica e Espaço – IAE, São José dos Campos, SP, Brasil
3Centro Universitário Sant’Anna – UNISANT’ANNA, São Paulo, SP, Brasil
4Centro de Tecnologia da Informação Renato Archer – CTI Renato Archer, Campinas, SP, Brasil
*ritacld@ita.br
Obstract
Determining elastomer content in ternary rubbers via infrared (IR) spectroscopy presents challenges due to spectral band overlap.Coupled techniques could be a solution, but in certain cases it can also involve overlapping events resulting in greater errors. The best option is to use an instrumental technique with appropriate conditions that avoid overlapping. This paper presents the development of transmission/reflection IR methodologies for the content determination of a blend with natural rubber, styrene-butadiene copolymer, and polybutadiene (NR/SBR/BR), with A887 and A1375 bands for NR and A699 for SBR. The BR content, which was calculated by subtraction of the NR and SBR results from the IR methodology, is confirmed by acid-resistance quantitative data. The methodologies errors (2 to 6%), with nonoverlapping bands, encompass what is found in the literature (5%). Such development ensures the determination of elastomer content in ternary rubbers with fast and accurate methodologies.
Keywords: acid-resistance, IR, reflection, ternary rubber, transmission.
Data Availability: Research data is available upon request from the corresponding author.
How to cite: Barros, A. H., Magalhães, R. F., Murakami, L. M. S., Diniz, M. F., Sanches, N. B., Carvalho, T. A., Dutra, J. C. N., & Dutra, R. C. L. (2025). Determination of elastomer content in NR/SBR/BR blends. Polímeros: Ciência e Tecnologia, 35(2), e20250023. https://doi.org/10.1590/0104-1428.20240110
Rubbers are materials extremely important used in the aerospace sector in thermal protections and flexible joints of rocket engines, and in the aeronautical and automotive sectors in tires[1-9]. However, especially in the automotive industry, one single type of rubber does not provide all the desired properties in a product. The blending of different types of rubber offers specific performance results for new technological solutions[10,11]. Optimum properties can be achieved by controlling morphology, composition, and processing conditions[12,13].
The NR/SBR/BR ternary rubber blend (natural rubber/ styrene-butadiene copolymer/polybutadiene) is considered unique, as it has three different binary pairs (NR/SBR, NR/ BR and SBR/BR), and that SBR contains BR as a constituent. Consequently, the determination of their rubber content may be complex because infrared (IR) spectra present bands overlapped[14,15]. The SBR rubber is the synthetic elastomer with the largest production in the world. BR, with the second largest volume of synthetic rubber produced, is generally mixed with other elastomers such as NR or SBR, and is often the main component in synthetic rubbers[16-19]. Recent studies of the NR/SBR/BR blend have focused on analyzing tires, checking their morphology, thermal degradation, and their effect on the environment[20-22]. Stoček et al.[23] investigated
the cut and chip (CC) resistant of NR/SBR blend (50:50), NR and SBR. The results explained the empirical preference for blends containing NR for improving CC strength.
Adding fillers to a rubber compound modifies its properties[24,25]. In relation to this, Chen et al.[26] evaluated the addition of nanometer silica and micron kaolin in NR/ SBR/BR using IR spectroscopy (qualitatively) by diffuse reflectance (DRIFT) and attenuated total reflection (ATR). The structure and interfacial interactions of the composites were investigated. The study concluded that the coupling agents were mainly coated on silica particles rather than kaolinite surface due to the latter reactive sites being limited and covered by silica particles.
Transmission electron microscopy (TEM) and scanning electron microscopy (SEM) are useful for studying the morphological phases and filler dispersion of rubber blends[27] Jovanović et al.[13] analyzed the NR/BR/SBR blend to synthesize and characterize the blend (25/25/50) reinforced with different silica nanoparticles levels (0-100 phr). The IR/ATR analysis was applied qualitatively, and the band shifting from 1450 cm-1 to 1480 cm-1 confirmed the interaction between the blend and the nano-silica. A good interaction between the polymeric
Barros, A. H., Magalhães, R. F., Murakami, L. M. S., Diniz, M. F., Sanches, N. B., Carvalho, T. A., Dutra, J. C. N., & Dutra, R. C. L.
matrix and silica nanoparticles was also demonstrated. In a subsequent study, Jovanović et al.[28] employed the same methodology with the addition of carbon black (60 phr) instead of silica. The blend components influence the physical and chemical stability of the final material.
As can be seen in the previously discussed studies, IR spectroscopy has been used mainly qualitatively. Comparatively, quantitative IR studies are fewer in number. although binary blends quantification has been successful investigated in the last decade[29-40]. In most cases coupling techniques are used for evaluating ternary rubbers, as IR spectra can display overlapping of elastomers characteristics bands[14]. Nevertheless, if the mixture components are known, a model with a calibration curve can be developed for content determination.
For many years, the IR/transmission/controlled pyrolysis methodology[41-43] has stood out as the only available approach for the analysis of many types of rubber. Harms[43] evaluated quantitative composition of diverse elastomers by using calibration curves obtained from thermogravimetric peak heights and from IR bands. Results showed that, as long as the pyrolysis process is controlled, IR data are similar to those obtained by TGA. Pyrolysis techniques[44,45] have also been used in IR reflection analysis by different numbers of reflections (multiple reflection-ATR and by universal attenuated total reflectance-UATR). Reflection techniques are useful in cases in which occur polymer and additives bands overlap.
Ghebremeskel and Shield[46] applied IR analysis to investigate the composition of SBR, acrylonitrile-butadiene rubber (NBR) and polyvinyl chloride (PVC) ternary blends. IR spectroscopy was used qualitatively and quantitatively for the composition determination of binary and ternary blends. Blends were characterized by ATR without sample preparation. SBR (styrene at 1602 cm-1) and NBR (acrylonitrile at 2237 cm-1) compositions were independently determined by MIR analysis with the use of two calibration curves. These curves were normalized to predict the SBR/NBR blend ratio. Results evidenced that the PVC presence in the mixture did not interfere with the blend characterization. Test samples were used to determine the methodology accuracy (error ~ 6%).
The NR/SBR/BR content determination is conducted by applying IR/ATR (germanium crystal) and TGA. Bands at 1375 cm-1 (NR - methyl group), 699 cm-1 (SBR - aromatic CH group), and 738 cm-1 (BR - cis C=C group) are selected, along with their intensity ratios. Band height correction is performed using an algorithm[47]. The authors conclude that a combined methodology (FT-IR/TGA) is sufficient to quantify polymer compositions of ternary blends of NR/SBR/BR.
Even though the investigation by Datta et al.[47] has shown adequate results for the determination of NR/SBR/BR, it utilized two instrumental techniques, which increases complexity, time of analysis and costs. This fact opens a window of opportunity for the development of new methodologies that use solely one instrumental technique, or a simple laboratory test to validate results, such as the methodology presented in this current study. Furthermore, conditions can be modified in the same instrumental technique to obtain different results. In the case of FT-IR, the way of obtaining spectra can be varied, as there are differences in optical path between reflection and transmission spectra[48]. This may interfere with the height
measurement of the analyzed band. The use of band intensity ratio has been a solution for correcting intensity variation[34] Band height correction via algorithm used by Datta et al.[47] may also have introduced a complex step to the analysis. The vinylidene band at 885 cm-1 is characteristic only of NR and have also been tested in this study, which was not accomplished in the aforementioned investigation.
NR/SBR/BR contents determination is performed in the MIR region by transmission/controlled pyrolysis without extraction[14] between 450 and 400 °C. The pyrolyzed sample is analyzed as a liquid film. The bands are measured by intensity/height choosing appropriate baselines. SBR content is determined through the calibration curve involving the band intensity ratio (A699/A1375) versus SBR concentration. BR content is determined through the calibration curve involving the band intensity ratio (A967/A1375) versus BR concentration. In addition to IR analysis, TGA, differential scanning calorimetry (DSC) and gas chromatography (GC) coupled with pyrolysis mass spectrometry (Py-GC/MS) are also applied. Among them, the quantitative analysis using Py-GC/MS is considered the most precise of others techniques. Py-GC/MS provided more precise results, as the others techniques were affected by the elastomers interference. A considerable variation in content determination was observed, particularly with TGA and IR analyses. The analytical bands used (cm-1) are: 1375 (NR), 699 (SBR), and 967 (BR - trans C=C).
Although the research by Lee et al.[14] also showed adequate results for the determination of NR/SBR/BR, more than one instrumental technique was used. Although the Py-GC/MS have demonstrated greater precision, employing coupling techniques requires specialists in both areas, adding complexity to the methodology. The vinylidene band at 885 cm-1, characteristic of NR, also was not tested. Additionally, the BR band at 967 cm-1 overlaps with the band of the same group in SBR. Moreover, the appropriate use of band intensity ratio could have reduced the IR methodology error. The lowest error found in the methodology was 5%. Consequently, this scenario motivates the development of IR methodologies applying transmission and reflection (UATR) modes, with samples prepared by pyrolysis in a Bunsen burner and the selection of non-overlapping bands for the NR/SBR/ BR content determination. Calibration curves are created with the median IR absorbance values from the analytical bands chosen for each elastomer versus its content in the blend. The errors involved are assessed, in accordance with a specific statistical treatment for IR spectroscopy[49], as used in recent studies[29,33,34]. Acid-resistance tests[50] are able to differentiate saturated from unsaturated rubbers and are typically used in qualitative investigations, therefore were employed in this paper quantitatively to demonstrate the effectiveness of the developed IR methodology. This test is used as a quantitative indicator, as an original contribution. So, this investigation contributes to the state of the art in quantitative elastomer research by FT-IR techniques and simple laboratory tests.
2.1 Materials
NR/SBR/BR samples were prepared by Tenneco Automotive Brazil: 10NR/70SBR/20BR, 20NR/10SBR/70BR,
Determination of elastomer content in NR/SBR/BR blends
25NR/25SBR/50BR, 50NR/25SBR/25BR, and 70NR/20SBR/10BR. The numbers cited in the sample coding are associated with the weight content (%) of each elastomer in the ternary blend. These samples were used to construct the calibration curves for the FT-IR methodology. For the acid-resistance methodology, in addition to these samples, the one containing 25NR/50SBR/25BR was also used to evaluate the BR content.
The data regarding the rubber’s formulation, including their additives, were encoded by the supplier. Therefore, it was not provided in this work, nor were the processing details sent due to internal company policies. However, the data relevant to the methodology development are only the contents of each elastomeric component, which have already been reported. Regarding the additives, as they are extracted with solvent, they do not interfere in the NR/SBR/ BR determination.
2.2 IR Methodologies (transmission and reflection/UATR and acid-resistance) for NR/SBR/BR
The conditions for the IR analyses were: PERKINELMER IR spectrometer Frontier, 4000 to 400 cm-1, resolution 4 cm-1, gain 1, and 20 scans by transmission and reflection (UATR). In both methodologies, the samples were pyrolyzed in a Bunsen burner, after solvent extraction in acetone, and then analyzed as liquid films. The analytical bands used in both methodologies were selected at the following wavenumbers (cm-1)[42]: A887 (vinylidene) for NR and A699 (aromatic C-H) for SBR. The A1375 band (methyl) for NR, used by Datta et al.[47] and Lee et al.[14], was also tested. The BR band at 743 cm-1 (cis C=C) was not used because of its low intensity, even though it would have been the typical choice due to its absence of overlapping with the SBR absorptions. The low intensity did not allow a proper height measurement, especially in sample with low BR content. The BR content was determined by subtraction using the obtained content of NR and SBR. The baseline ranges (cm-1) selected were: 930 to 852 for the 887 band; 712 to 680 for 699; and 1380 to 1350 for 1375. Analyses were performed in quintuplicate. The calibration curves were constructed with the median[49] values of absorbance versus the elastomer content. The accuracy estimation is in accordance with the nonparametric statistical method used for spectroscopic data[49], successfully used for IR spectroscopic data in different studies[4,24,29,30,32,36,51,52]. The error of the developed methodology is estimated by the median of the relative errors[52]
The following set of results were used for selecting the best analytical band or the best band intensity ratio: the highest linearity of the calibration curve (R2) and the lowest methodology error.
To verify the effectiveness of the FT-IR developed methodologies, three samples with similar content of NR/ SBR/BR to those employed to construct the calibration curves were coded as samples A1, A2 e A3 and sent to the laboratory. The analyst was unaware of their nominal contents. To facilitate data evaluation, the tables with the results show the nominal contents of the test samples. The analysis conditions were the same as those used to construct the calibration curves.
The acid-resistance test was also used for the IR data validation in this study. It was performed according to the methodology described in a previous investigation[50]. For the acid-resistance test[50], which is an additional method for IR data validation, small sample fragments were extracted using acetone and subsequently dried in an oven. A mixture of concentrated H2SO4 and concentrated HNO3 in a 1:1 volume ratio was introduced into a test tube immersed in water at 70 °C. Once the test tube mixture reached 70 °C, dried sample fragments were added. The time taken for the initiation of material degradation was then measured, observable when sample particles start to disperse. Since immediate degradation occurred at 70 °C, the test was repeated at 40 °C. Tests were conducted in triplicate, and the mean value was used to obtain a correlation between the degradation onset time and the BR content.
The acid-resistance test was conducted in triplicate. The mean time was used for evaluating the relation between the onset time of degradation and the BR content. The obtained acid-resistance data were also used to validate the BR contents in test samples, calculated by the IR methodology. To verify the effectiveness of the developed FT-IR or acidresistance methodologies, the NR/SBR/BR samples coded “A1” (UATR and transmission FT-IR acid-resistance test) and “A3” (acid-resistance methodology) were analyzed by the same analysis conditions of samples used. In FT-IR methodologies, the median absorbance value of the analytical band was applied to the equation of the plotted calibration curve, corresponding.
3.1 Qualitative analysis (IR/UATR and IR/transmission) of the pyrolysed NR/SBR/BR blend
Figure 1 showed the spectra of IR/transmission/Bunsen burner pyrolysis of some NR/SBR/BR samples. The spectra were arranged according to the increase in the NR content to

Figure 1. IR/transmission/pyrolysis spectra of NR/SBR/BR samples.
Barros, A. H., Magalhães, R. F., Murakami, L. M. S., Diniz, M. F., Sanches, N. B., Carvalho, T. A., Dutra, J. C. N., & Dutra, R. C. L.
demonstrate that as the content of this elastomer increases, the intensity of the band increases at 887 cm-1 (indicated by the acronym NR).
Although the nominal SBR content does not increase in a regular way in the samples, it is also possible to observe that there is a variation in the intensity of the band at 699 cm-1 (indicated by the acronym SBR) according to the content of this elastomer. Therefore, both bands at 887 cm-1 and at 699 cm-1 obey the Lambert-Beer law[42] and can be considered analytical, which means that they can be associated with the elastomer content and be considered suitable for the determination of the elastomers content in the blend.
The ternary blend NR/SBR/BR is considered a somewhat complex system[14], as overlapping IR absorptions may occur, such as those of the C=C vinyl and trans groups of BR and SBR, which can be observed in the IR spectra of the pyrolyzed blends compared to the spectra of their elastomers (Figure 2). Bands of C=C vinyl and trans[42] groups (1000-900 cm-1) are present in SBR and BR. The band of the C=C cis group[42], around 740 cm-1, which does not present any overlap, is of low intensity. Therefore, it was chosen, in this study, to calculate the NR and SBR contents and obtain the BR content by subtraction, as shown in the discussion of the quantitative analysis.
NR/SBR/ BR
The IR/UATR results of the NR/SBR/BR blend pyrolysed in the Bunsen burner were plotted in a calibration curve for the A887/A698 relative band (NR and SBR) versus the NR content. The band intensity ratio was used to reduce the effect of the variation in band thickness and height measurements. The methodology error was around 4%, lower than the reported in the literature (5%)[14] (Table 1). Then, the accuracy is considered satisfactory when comparing with the literature and under the conditions used. In addition, this

methodology error could be acceptable in the industry, from a technological perspective, where a specification range is routinely adopted for material acceptance. Although it is above the reference value for the equipment precision limit[49] (≤ 2%), this reference error is more commonly found in transmission analyses with thickness control. Even though the methodology showed some limitation, having only responded to four samples, a tendency in linearity was observed in Figure 3A (Equation 1), with 79% of the data explained by the developed methodology (R2).
0.00850.1932yx=+ (1)
where y is the median absorbance value of the analytical band intensity or of the band ratio and x is the elastomer content corresponding for all calibration curves.
Another calibration curve with the SBR analytical band 699 cm-1 versus the SBR content was plotted. See details in
Table 1. IR(A887/A699)/UATR/pyrolysis results for the determination of NR in NR/SBR/BR.
NR/SBR/BR (relative content) A887/A698 Parameters
10NR/70SBR/20BR
20NR/10SBR/70BR
70NR/20SBR/10BR

Figure 3. Calibration Curves: (A) IR(A887/A698)/UATR versus NR content; (B) IR (A699)/UATR versus SBR content; (C) IR(A1375)/UATR versus NR content; (D) IR(A887)/transmission versus NR content; (E) IR(A699)/transmission versus SBR content; and (F) Acid-resistance test - initial degradation time (min) at 40 °C versus BR content (%).
Table S1 of the Supplementary Material. The BR content was calculated by subtraction (Equation 2):
100% NRSBRBR++= (2)
This step of the study was developed differently from the methodologies found in the literature to lessen measurement errors, including the validation of the obtained BR content by acid resistance. Even though Datta et al.[47] used the 738 cm-1 band, which does not present overlap, for the BR estimation, the band height measurement was corrected by an algorithm, which introduces a complex step in the analysis. The methodology error of Datta et al. [47] was not discussed. Lee et al.[14] used the band at 967 cm-1 (trans C=C) for the BR determination, however this band overlaps with the absorption of the same functional group present in SBR. They reported that the lowest error for the IR methodology was 5%. The Py-GC/MS methodology, which involves coupling techniques, presented the highest precision. The band at 1375 cm-1, which is also present in other elastomers, and was investigated by Datta et al.[47] and Lee et al.[14] for NR, was also tested in this study (results in Table S2 of the Supplementary Material). For the SBR content determination, the height measurements for the band at 699 cm-1 and the calculation of the methodology error were performed in the same way of those in Table 1. The median values of A699 versus the SBR content in NR/SBR/ BR were plotted (Figure 3B, Equation 3). For the remainder of this study, the same type of calculation was adopted and, therefore, only the calibration curves are shown.
0.00160.0196yx=+ (3)
An adequate data correlation was observed (R2 = 99%), which combined with an error of 1.67% (within the equipment precision limit[49]) indicates that the developed methodology can be used for the SBR determination in NR/SBR/BR.
To evaluate the NR band A1375, used by Datta et al.[47] and Lee et al.[14], a calibration curve was also plotted (Figure 3C, Equation 4). The adequate linearity of the calibration curve (R2 = 96%) combined with an error of 3.57% indicated that the band A1375 can be used for the NR determination.
0.00020.0199yx=+ (4)
The comparison of the UATR calibration curves (Figure 3A and 3C) indicates that the curve plotted with the band A1375 incorporated a higher number of points and showed a superior linearity (R2 = 96%). Consequently, it is more suitable for the NR determination in NR/SBR/BR using UATR/pyrolysis in a Bunsen burner. The methodology was evaluated by testing samples.
Table 2 shows the results of sample A1 for the determination of NR and SBR content using the band intensity ratio A887/ A699 and the absorption A699. The calculated value for NR was relatively close the nominal value. This is especially useful from a technological perspective, as previously discussed, for rubber companies that work with specification ranges. The calculated SBR content is very close to its nominal value because its analytical band at 699 cm-1 is strong, therefore it is more suitable for the height measuring[42], even for low content of SBR, indicating suitable precision. The calculated BR content (by Equation 2) was 30.5% (nominal, 25%), which according to technological aspects is considered satisfactory.
Table 3 presents the results obtained for the NR and the SBR content determination in sample A2 using the A1375 band for NR and the A699 band for SBR. The calculated NR content is close to the nominal value.
Barros, A. H., Magalhães, R. F., Murakami, L. M. S., Diniz, M. F., Sanches, N. B., Carvalho, T. A., Dutra, J. C. N., & Dutra, R. C. L.
Table 2. Results of sample A1 for the IR/UATR (A887/A 699) determination of the NR content.
Sample
0.061 0.062
0.063 0.058
Table 3. Results of sample A2 for the IR/UATR (A1375)/ determination of the NR content.
Sample A1375 A1375 NR calculated content (%) Equation 4 NR nominal content (%) (NR) (median)
0.026 0.025
0.025 0.025
Sample A699 A699 SBR calculated content (%) Equation 3 SBR nominal content (%) (SBR) (median)
The calculated content for the BR rubber was 64.25%, close to the nominal value of 70%, according to a technological point of view. In addition, the results suggest that the bands A887/A699 and A1375 can be used for the determination of the NR content in NR/SBR/BR. In this study, the same NR/SBR/ BR blend was also investigated by transmission/pyrolysis. The difference in the optical path in transmission (optical path constant) and reflection (optical path variable) modes may influence the precision of results.
3.4 Quantitative IR/transmission/pyrolysis analysis of NR/SBR/BR
For the transmission analysis, it was decided to evaluate only the band at 887 cm-1 for NR, without overlap, since similar results were observed for the band at 1375 cm-1 in the reflection methodology (UATR). An adequate linearity was observed (calibration curves - Figure 3D – NR, Equation 5, R2= 99% and Figure 3E – SBR, Equation 6, R2 = 91%).
Refer to Tables S3 and S4 in the Supplementary Material for detailed results.
0.00160.0472=+yx (5)
0.00490.0721yx=+ (6)
The error for the methodology involving bands A887 and A699 was approximately 6%. It is similar to the one reported in the literature[14], 5%, which was obtained using controlled pyrolysis that involves the use of additional accessories, thereby increasing the time and cost of analysis. Thus, considering the conditions of analysis used in this study, i.e., sample pyrolyzed in a Bunsen burner without control of temperature and the comparative error (5% - controlled pyrolysis[14] and 6% - pyrolysis in a Bunsen burner), these results are assessed as satisfactory.
3.5 Effectiveness of the IR/transmission/Bunsen Burner pyrolysis methodology
Another test sample (A3) was analyzed under the same conditions as the calibration curves. Table 4 presents the results regarding the determination of the NR and SBR content using the bands A887 and A699. The calculated NR and SBR contents were close to the nominal value, with the SBR determination showing higher precision. The calculated BR content was 28.61%, close to the nominal value of 25%.
The acid-resistance test[50] was conducted to verify the quantitative relation between the increase in BR content and the degradation onset time of the NR/SBR/BR blend, as this evaluation might help validating the IR methodology in which the BR content was obtained by subtraction. According to Dutra and Diniz[50], the unsaturated rubbers NR, SBR, and BR degrade within ≤ 1 minute at 70 °C. Therefore, the NR/ SBR/BR blend is expected to have a quick degradation at 70 °C, making it impossible to establish any relation between the BR content and the degradation time. For this reason, the test was conducted at 40 °C (Table 5). At 40 °C, the longer time required to start the degradation of each rubber in the blend permits a proper individual visualization. Moreover, according to the literature, the elastomers combined in the blend have different degradation onset time at 40 °C. NR rubber degrades in less than 3 minutes, while BR and SBR degrade between 10 and 30 minutes. Results were used to plot a calibration curve that establishes a relation between the BR content in the ternary rubber and the average time required for the onset of degradation at 40 °C (Figure 3F). It was observed a correlation (Equation 7) with an adequate linearity (R=0.946 and R2 = 90%) between the data obtained through the acid-resistance tests and the BR content in the sample.
0.279210.029=+yx
where, y is the degradation onset average time at 40 °C and x is the BR content in NR/SBR/BR.
The acid resistance analysis of BR at 40 °C showed a longer degradation onset time compared to NR[50] Figure 3F
demonstrated that the higher the BR content in the blend, the longer the material degradation onset time. To further validate the developed IR methodology and emphasize its effectiveness, acid-resistance tests were conducted at 40 °C in two blend test samples containing 25% of BR (25NR/50SBR/25BR – A3 and 50NR/25SBR/25BR – A1). The latter was also analyzed as a test sample for the IR methodologies (transmission and reflection). Both samples exhibited the same degradation onset time: approximately 19 minutes at 40 °C. Therefore, these acid-resistance results can be related to those obtained by the IR methodologies, where the BR content was calculated by subtraction and presented values relatively close to the nominal 25% (28.61% by transmission/pyrolysis, 30.50% by UATR/pyrolysis and 32% by acid-resistance). Although, as expected, the results of the acid-resistance test are less accurate than those of instrumental techniques, the results are considered satisfactory for sectors that work with a material specification range, as already explained.
3.7 NR/SBR/BR FT-IR data validation–MIR/reflection (UATR) and MIR/transmission
In this study, two spectra obtaining modes - transmission and reflection - were used. For data validation, a sample (A1) containing the same nominal content (50NR/25SBR/25BR) was analyzed using both methodologies, with NR band at 887 cm-1 and SBR at 699 cm-1 (Table 6).
In both methodologies, the calculated results for the SBR content were the closest to the nominal value, probably due to the intense absorption of the band at 699 cm-1, which facilitates the measurement of the analytical band height. The values obtained in both analyses were close to each other and to the nominal content, especially in the
5. Results of acid-resistance (40 °C) for the NR/SBR/BR blend.
18/18/19 18 25NR/50SBR/25BR 15/19/21 18
50NR/25SBR/25BR 17/18/21 19
25NR/25SBR/50BR 20/22/23 22
20NR/10SBR/70BR 28/31/32 30
A. H., Magalhães, R. F., Murakami, L. M. S., Diniz, M. F., Sanches, N. B., Carvalho, T. A., Dutra, J. C. N., &
Table 6. UATR and transmission methodologies for the
determination.
transmission methodology. Nevertheless, the reflection/ UATR methodology showed a better precision in terms of data repeatability, with a lower error of 4%, compared to the transmission with 6% error, and also according to the findings of Lee et al.[14], that reported 5% error.
The comparison of the methodology error by Lee et al. [14] (5%), with the lowest value found by IR/UATR in this study (4%), although similar, shows that the objective of finding a most appropriate error was achieved, as it was not necessary to use an accessory for controlled pyrolysis, a technique that had been used in the literature[14]. The methodology developed in this investigation demonstrates that a simple Bunsen burner, found in all laboratories, is enough to achieve good results, reducing costs and also providing a slight improvement in precision with the use of relative band. This study also presents an alternative to using the analytical band with overlap to estimate the BR content, which is the calculation by subtraction in relation to the NR and SBR content. The IR results were validated by acid resistance, the use of which as quantitative data is presented in this study as a novel approach.
This investigation goal was to develop a simple and precise IR methodology for the quantitative IR analysis of the NR/SBR/BR rubber blend, based on different spectra obtaining modes (transmission and UATR reflection), and also to introduce the undemanding acid-resistance test for routine quantitative analysis. The samples were prepared for IR analysis using the same technique: pyrolysis in the Bunsen burner. Non-overlapping bands were selected to calculate the content of each elastomer, achieving better results. Both methodologies can be rapidly applied for elastomer content determination, with a slight advantage in terms of precision for the reflection/UATR methodology compared to literature data. The methodologies were validated through test samples and quantitative acid-resistance tests. The error of the developed methodology could be acceptable in the industry, from a technological perspective, where a specification range is routinely adopted for material acceptance. Hence, the objective of this study was achieved, as an alternative methodology to that found in the literature was presented, with more accessible conditions, lower cost, and with more precise results. In addition, it was presented for the first time the validation of IR data with the use of quantitative acid-resistance analysis of a ternary rubber. These findings contribute to the state of the art in the determination of elastomers content.
• Conceptualization – Alexandra Helena de Barros; Rachel Farias Magalhães; Rita de Cássia Lazzarini Dutra.
• Data curation – NA.
• Formal analysis – NA.
• Funding acquisition - Rita de Cássia Lazzarini Dutra.
• Investigation - Milton Faria Diniz; Alexandra Helena de Barros; Rachel Farias Magalhães.
• Methodology – Alexandra Helena de Barros; Rachel Farias Magalhães; Milton Faria Diniz; Rita de Cássia Lazzarini Dutra.
• Project administration – Rita de Cássia Lazzarini Dutra.
• Resources –Lídia Mattos Silva Murakami.
• Software – NA.
• Supervision – Natália Beck Sanches; Jorge Carlos Narciso Dutra; Rita de Cássia Lazzarini Dutra.
• Validation – Alexandra Helena de Barros; Rachel Farias Magalhães; Taynara Alves de Carvalho; Rita de Cássia Lazzarini Dutra.
• Visualization – Natália Beck Sanches; Rita de Cássia Lazzarini Dutra.
• Writing – original draft – Alexandra Helena de Barros; Rachel Farias Magalhães; Rita de Cássia Lazzarini Dutra.
• Writing – review & editing – Alexandra Helena de Barros; Rachel Farias Magalhães; Taynara Alves de Carvalho; Rita de Cássia Lazzarini Dutra.
The authors disclosed receipt of the following financial support for the research, authorship, and/or publication of this article. This paper was supported by the Conselho Nacional de Desenvolvimento Científico e Tecnológico (CNPQ) - Finance Code 301626/2022-7.
7. References
1 bin Salim, M. A., binti Sheikh Md. Fadzullah, S. H., bin Omar, G., bin Akop, M. Z., bin Abdul Hamid, N., & bin Tamaldin, N. (2018). Challenges and developments of rubber materials as vibration isolator. In S. Hashmi, & A. Choudhury (Eds.), Encyclopedia of renewable and sustainable materials (pp. 64-88). Amsterdam: Elsevier http://doi.org/10.1016/B9780-12-803581-8.10365-0
Determination of elastomer content in NR/SBR/BR blends
2 Rubio-Mateos, A., Casuso, M., Rivero, A., Ukar, E., & Lamikiz, A. (2021). Vibrations characterization in milling of low stiffness parts with a rubber-based vacuum fixture. Chinese Journal of Aeronautics, 34(6), 54-66 http://doi.org/10.1016/j. cja.2020.04.002
3 Zhang, C., Wu, J., Teng, F., Su, B., Wang, Y., & Ao, H. (2021). Theoretical and experimental characterization for macro-micro friction behaviors of EPDM rubber. Polymer Testing, 99, 107213 http://doi.org/10.1016/j.polymertesting.2021.107213
4. Rigoli, P. S., Murakami, L. M. S., Diniz, M. F., Azevedo, M. F. P., Cassu, S. N., Mattos, E. C., & Dutra, R. C. L. (2019). Quantification of aerospace polymer blends by thermogravimetric analysis and infrared spectrometry. Journal of Aerospace Technology and Management, 11, e0619 http://doi.org/10.5028/ jatm.v11.986
5 Rippel, M. M., & Bragança, F. C. (2009). Borracha natural e nanocompósitos com argila. Química Nova, 32(3), 818-826 http://doi.org/10.1590/S0100-40422009000300024
6 Muniz, A. M. S., Sizenando, D., Lobo, G., Neves, E. B., Gonçalves, M., Marson, R., Palhano, R., Menegaldo, L., & Bini, R. R. (2021). Effects from loaded walking with polyurethane and styrene-butadiene rubber midsole military boots on kinematics and external forces: a statistical parametric mapping analysis. Applied Ergonomics, 94, 103429 http://doi. org/10.1016/j.apergo.2021.103429 PMid:33862308.
7 Yick, K.-K., & Tse, C.-Y. (2021). The use of textiles and materials for orthopedic footwear insoles. In A. Luximon (Ed.), Handbook of footwear design and manufacture (pp. 361-388). Cambridge: Woodhead Publishing http://doi.org/10.1016/ B978-0-12-821606-4.00012-0
8. Ye, W., Xu, X., Zhan, M., Huang, Q., Li, X., Jiao, W., & Yin, Y. (2022). Formation behavior of PAHs during pyrolysis of waste tires. Journal of Hazardous Materials, 435, 128997. http://doi.org/10.1016/j.jhazmat.2022.128997 PMid:35490634.
9 Kaewsakul, W., Noordermeer, J. W. M., Sahakaro, K., Sengloyluan, K., Saramolee, P., Dierkes, W. K., & Blume, A. (2021). Natural rubber and epoxidized natural rubber in combination with silica fillers for low rolling resistance tires. In S. Kohjiya, & Y. Ikeda (Eds.), Chemistry, manufacture, and application of natural rubber (pp. 247-316). Cambridge: Woodhead Publishing http://doi.org/10.1016/B978-0-12818843-9.00009-6
10 Yoon, B., Kim, J. Y., Hong, U., Oh, M. K., Kim, M., Han, S. B., Nam, J.-D., & Suhr, J. (2020). Dynamic viscoelasticity of silica-filled styrene-butadiene rubber/polybutadiene rubber (SBR/ BR) elastomer composites. Composites. Part B, Engineering, 187, 107865 http://doi.org/10.1016/j.compositesb.2020.107865
11 Malas, A., Pal, P., & Das, C. K. (2014). Effect of expanded graphite and modified graphite flakes on the physical and thermo-mechanical properties of styrene butadiene rubber/ polybutadiene rubber (SBR/BR) blends. Materials & Design, 55, 664-673 http://doi.org/10.1016/j.matdes.2013.10.038
12. Nawawi, M. A., Har, S. L., & Han, C. C. (2012). Miscibility of polymer blends comprising poly (ethylene oxide)-epoxidized natural rubber. International Journal of Chemical Engineering and Applications, 3(6), 410-412 http://doi.org/10.7763/ IJCEA.2012.V3.230
13 Jovanović , S. , Samaržija-Jovanović , S. , Marković , G. , Jovanović, V., Adamović, T., & Marinović-Cincović, M. (2018). Ternary NR/BR/SBR rubber blend nanocomposites. Journal of Thermoplastic Composite Materials, 31(2), 265-287 http:// doi.org/10.1177/0892705717697778
15 Sanches, N. B., Diniz, M. F., Reis, T. B., Cassu, S. N., & Dutra, R. C. L. (2006). Evaluation of PIR-G/FT-IR techniques for characterization of elastomers. Polímeros: Ciência e Tecnologia, 16(3), 211-216 http://doi.org/10.1590/S010414282006000300010
16 Puskas, J. E., Chiang, K., & Barkakaty, B. (2014). Natural rubber (NR) biosynthesis: perspectives from polymer chemistry. In S. Kohjiya, & Y. Ikeda (Eds.), Chemistry, manufacture and applications of natural rubber (pp. 30-67). Cambridge: Woodhead Publishing http://doi.org/10.1533/9780857096913.1.30
17. Youn, J.-S., Kim, Y.-M., Siddiqui, M. Z., Watanabe, A., Han, S., Jeong, S., Jung, Y.-W., & Jeon, K.-J. (2021). Quantification of tire wear particles in road dust from industrial and residential areas in Seoul, Korea. The Science of the Total Environment, 784, 147177. http://doi.org/10.1016/j.scitotenv.2021.147177. PMid:33895514.
18 Shahi, A., Dwivedi, C., & Manjare, S. (2022). Experimental and theoretical investigation on pyrolysis of various sections of the waste tire and its components. Chemical Engineering Research & Design, 179, 66-76 http://doi.org/10.1016/j. cherd.2021.12.022
19. Mattonai, M., Nacci, T., & Modugno, F. (2022). Analytical strategies for the quali-quantitation of tire and road wear particles: a critical review. Trends in Analytical Chemistry, 154, 116650 http://doi.org/10.1016/j.trac.2022.116650
20 Yu, S., Yang, Q., Li, Z., Liu, T., Tao, L., Yao, E., & Zhang, Y. (2022). Mechanism analysis of gas products from catalytic pyrolysis of tire rubber based on reaction thermodynamics and kinetics. Fuel Processing Technology, 227, 107134 http:// doi.org/10.1016/j.fuproc.2021.107134
21 Kubota, R., Obama, T., Kawakami, T., Sakai, S., Inoue, K., & Ikarashi, Y. (2022). Characterization of synthetic turf rubber granule infill in Japan: total content and migration of metals. The Science of the Total Environment, 842, 156705 http://doi. org/10.1016/j.scitotenv.2022.156705 PMid:35716741.
22 Sakai, S., Tahara, M., Kubota, R., Kawakami, T., Inoue, K., & Ikarashi, Y. (2022). Characterization of synthetic turf rubber granule infill in Japan: volatile organic compounds. The Science of the Total Environment, 838(Pt 3), 156400 http:// doi.org/10.1016/j.scitotenv.2022.156400 PMid:35660619.
23 Stoček, R., Heinrich, G., Kipscholl, R., & Kratina, O. (2021). Cut & chip wear of rubbers in a range from low up to high severity conditions. Applied Surface Science Advances, 6, 100152. http://doi.org/10.1016/j.apsadv.2021.100152.
24 Magalhães, R. F., Barros, A. H., Takematsu, M. M., Passero, A., Diniz, M. F., Sciamareli, J., & Dutra, R. C. L. (2022). Infrared reflectance techniques applied to silica particles diameter determination - theoretical and experimental data. Anais da Academia Brasileira de Ciências, 94(3), e20210545 PMid:36259823.
25. Espósito, L. H., & Marzocca, A. J. (2020). Effect of electron beam irradiation on aging time, thermal vulcanization kinetic and mechanical properties of SSBR/NR/BR compounds filled with silica. Radiation Physics and Chemistry, 170, 108651 http://doi.org/10.1016/j.radphyschem.2019.108651.
26 Chen, Y., Guan, J., Hu, H., Gao, H., & Zhang, L. (2016). Structural change and interfacial interaction in blended rubber composites filled with silica-kaolin hybrid fillers: a Fourier transform infrared spectroscopic study. Spectroscopy Letters, 49(2), 118-127 http:// doi.org/10.1080/00387010.2015.1104696
27 Shao, H., Guo, Q., & He, A. (2021). Strategy for the NR/BR blends with improved thermo-oxidative resistance. Polymer Degradation & Stability, 191, 109665 http://doi.org/10.1016/j. polymdegradstab.2021.109665
14 Lee, Y. S., Lee, W.-K., Cho, S.-G., Kim, I., & Ha, C.-S. (2007). Quantitative analysis of unknown compositions in ternary polymer blends: a model study on NR/SBR/BR system. Journal of Analytical and Applied Pyrolysis, 78(1), 85-94 http://doi. org/10.1016/j.jaap.2006.05.001
28 Jovanović, S., Jovanović, V., Marković, G., Samaržija-Jovanović, S., Milićević, Z., Marinović-Cincović, M., & Budinski-Simendić, J. (2019). Elastomers based on NR/BR/SBR ternary rubber blend: morphological, mechanical and thermal properties. Chemical Industry & Chemical Engineering Quarterly, 25(1), 31-38 http://doi.org/10.2298/CICEQ171106016J
29 Barros, A. H., Murakami, L. M. S., Magalhães, R. F., Takematsu, M. M., Diniz, M. F., Sanches, N. B., Dutra, J. C. N., & Dutra, R. C. L. (2023). Infrared quantification of binary rubber blends with overlapping bands. Anais da Academia Brasileira de Ciências, 95(1), e20220289 http://doi.org/10.1590/00013765202320220289.
30 Rigoli, P. S., Barros, A. H., Magalhães, R. F., Murakami, L. M. S., Carrara, A. E., Dutra, J. C. N., Mattos, E. C., & Dutra, R. C. L. (2021). Determination of polychloroprene content in Rubber blend containing ethylene propylene diene monomer by infrared techniques. Journal of Aerospace Technology and Management, 13, e0821 http://doi.org/10.1590/jatm.v13.1197
31 Riba, J.-R., Mansilla, M. Á., Canals, T., & Cantero, R. (2019). Composition determination of rubber blends by applying differential scanning calorimetry and spa-pls treatment. Materials Research, 22(1), e20180415 http://doi.org/10.1590/19805373-mr-2018-0415
32 Azevedo, J. B., Murakami, L. M. S., Ferreira, A. C., Diniz, M. F., Silva, L. M., & Dutra, R. C. L. (2018). Quantification by FT-IR (UATR/NIRA) of NBR/SBR blends. Polímeros: Ciência e Tecnologia, 28(5), 440-449 http://doi.org/10.1590/01041428.00918
33 Takematsu, M. M., Baruel, A. F., Cassu, S. N., Diniz, M. F., Graves, D. A., & Dutra, R. C. L. (2023). Development and characterization of sodium polyacrylate/bentonite hydrogel with epoxy resin coating. Polímeros: Ciência e Tecnologia, 33(2), e20230021 http://doi.org/10.1590/01041428.20230029.
34 Carvalho, T. A., Gama, A. C., Magalhães, R. F., Diniz, M. F., Sanches, N. B., & Dutra, R. C. L. (2021). Determination of nitrogen and acrylic / styrene components in nitrocellulose systems by UATR and NIRA infrared techniques. Polymer Testing , 93 , 106962 http://doi.org/10.1016/j. polymertesting.2020.106962
35 Magalhães, R. F., Barros, A. H., Takematsu, M. M., Sanches, N. B., Quagliano, J. C. A., & Dutra, R. C. L. (2020). FT-IR surface analysis of poly[(4-hydroxybenzoic)-ran-(2-hydroxy6-naphthoic acid)] fiber – a short review. Polymer Testing, 90, 106750 http://doi.org/10.1016/j.polymertesting.2020.106750
36 Mello, T. S. D., Diniz, M. F., & Dutra, R. C. L. (2018). UATR and NIRA evaluation in the quantification of ATBC in NC blends. Polímeros: Ciência e Tecnologia, 28(3), 239-245 http://doi.org/10.1590/0104-1428.16816
37 Fahelelbom, K. M., Saleh, A., Al-Tabakha, M. M. A., & Ashames, A. A. (2022). Recent applications of quantitative analytical FTIR spectroscopy in pharmaceutical, biomedical, and clinical fields: a brief review. Reviews in Analytical Chemistry, 41(1), 21-33 http://doi.org/10.1515/revac-2022-0030
38 Diez, C., Rojo, M. Á., Martín-Gil, J., Martín-Ramos, P., Garrosa, M., & Córdoba-Diaz, D. (2022). Infrared spectroscopic analysis of the inorganic components from teeth exposed to psychotherapeutic drugs. Minerals (Basel), 12(1), 28 http:// doi.org/10.3390/min12010028
39. Shimadzu Corporation. (2020, April 14). Raw materials identification testing by NIR spectroscopy and Raman spectroscopy. Shimadzu. Retrieved in 2024, November 26, from https:// www.shimadzu.com/an/service-support/technical-support/ analysis-basics/tips-ftir/raman.html
40 Campos, E. A., Dutra, R. C. L., Rezende, L. C., Diniz, M. F., Nawa, W. M. D., & Iha, K. (2010). Performance evaluation of commercial copper chromites as burning rate catalyst for solid propellants. Journal of Aerospace Technology and Management, 2(3), 323-330. http://doi.org/10.5028/jatm.2010.02038010.
41 Silverstein, R. M., Webster, F. X., & Kiemle, D. J. (2005). Spectrometric identification of organic compounds New York: John Wiley & Sons
42 Smith, A. L. (1979). Applied infrared spectroscopy: fundamentals techniques and analytical problem-solving. New York: John Wiley & Sons
43 Harms, D. L. (1953). Identification of complex organic materials: by infrared spectra of their pyrolysis products. Analytical Chemistry, 25(8), 1140-1155 http://doi.org/10.1021/ac60080a002
44. Sanches, N. B., Pedro, R., Diniz, M. F., Mattos, E. C., Cassu, S. N., & Dutra, R. C. L. (2013). Infrared spectroscopy applied to materials used as thermal insulation and coatings. Journal of Aerospace Technology and Management, 5(4), 421-430. http://doi.org/10.5028/jatm.v5i4.265
45 Fernández-Berridi, M. J., González, N., Mugica, N., & Bernicot, C. (2006). Pyrolysis-FTIR and TGA techniques as tools in the characterization of blends of natural rubber and SBR. Thermochimica Acta, 444(1), 65-70 http://doi.org/10.1016/j. tca.2006.02.027
46 Ghebremeskel, G., & Shield, S. R. (2003). Characterization of binary/tertiary blends of SBR, NBR and PVC by IR spectroscopy. Rubber World , 227 (4 ), 26 -30 . Retrieved in 2024, November 26, from https://www.thefreelibrary. com/Characterization+of+binary%2Ftertiary+blends+of+ SBR%2C+NBR+and+PVC+by+IR...-a097726744
47. Datta, S., Antos, J., & Stocek, R. (2017). Characterisation of ground tyre rubber by using combination of FT-IR numerical parameter and DTG analysis to determine the composition of ternary rubber blend. Polymer Testing, 59, 308-315. http://doi. org/10.1016/j.polymertesting.2017.02.019
48 Ferrão, M. F. (2001). Técnicas de reflexão no infravermelho aplicadas na análise de alimentos. Tecnologica, 5, 65-85 Retrieved in 2024, November 26, from https://www.researchgate. net/publication/281653266_TECNICAS_DE_REFLEXAO_ NO_INFRAVERMELHO_APLICADAS_NA_ANALISE_ DE_ALIMENTOS
49. Hórak, M., & Vítek, A. (1978). Interpretation and processing of vibrational spectra. New York: John Wiley & Sons
50 Dutra, R. C. L., & Diniz, M. F. (1993). Resistência à degradação oxidativa e comportamento aos solventes como indicadores da composição de sistemas elastoméricos vulcanizados mistos. Polímeros: Ciência e Tecnologia, 3(3), 25-28. Retrieved in 2024, November 26, from https://revistapolimeros.org.br/ar ticle/588371347f8c9d0a0c8b47a4
51 Ferreira, A. C., Diniz, M. F., Ferreira, A. C. B., Sanches, N. B., & Mattos, E. C. (2020). FT-IR/UATR and FT-IR transmission quantitative analysis of PBT/PC blends. Polymer Testing, 85, 106447 http://doi.org/10.1016/j.polymertesting.2020.106447
52 Dutra, R. C. L., & Soares, B. G. (1998). Determination of the vinyl mercaptoacetate content in poly (ethylene-co-vinyl acetate-co-vinyl mercaptoacetate) (EVASH) by TGA analysis and FTIR spectroscopy. Polymer Bulletin, 41(1), 61-67 http:// doi.org/10.1007/s002890050333.
Received: Nov. 26, 2024
Revised: Feb. 23, 2025
Accepted: Apr. 17, 2025
Editor-in-Chief: Sebastião V. Canevarolo
Barros, A. H., Magalhães, R. F., Murakami, L. M. S., Diniz, M. F., Sanches, N. B., Carvalho, T. A., Dutra, J. C. N., & Dutra, R. C. L. Polímeros, 35(2), e20250023, 2025
Determination of elastomer content in NR/SBR/BR blends
Supplementary material accompanies this paper.
Table S1. FT-IR/UATR(A699) data/Bunsen Burner pyrolysis for SBR determination in NR/SBR/BR.
Table S2. FT-IR (A1375) data/UATR/Bunsen Burner pyrolysis for NR determination in NR/SBR/BR.
Table S3. FT-IR data/transmission/Bunsen Burner pyrolysis/film with cover slip aid for NR determination in NR/ SBR/BR - band A887.
Table S4. FT-IR data/transmission/Bunsen Burner pyrolysis/film with cover slip aid for SBR determination in NR/ SBR/BR - band A699.
This material is available as part of the online article from https://doi.org/10.1590/0104-1428.20240110
José William de Lima Souza1 , Lucas Cordeiro de Oliveira1 , Taynah Pereira Galdino1* , Marcus Vinicius Lia Fook1 and Rômulo Feitosa Navarro1*
1Laboratório de Avaliação e Desenvolvimento de Biomateriais do Nordeste, Unidade Acadêmica de Engenharia de Materiais – UAEMa, Universidade Federal de Campina Grande – UFCG, Campina Grande, PB, Brasil
*taynah.galdino@certbio.ufcg.edu.br; romulonavarro13@gmail.com
Obstract
This research paper is about the calculation of the diffusion coefficient and the oxygen concentration profile along polypropylene samples exposed to photooxidation in a dry environment. In this degradation process, oxygen diffusion is anomalous, as it is affected by structural modifications that occur over the exposure time. Thus, the diffusion coefficient starts to depend on time and the common solutions for Fick’s 2nd Law for diffusion become inoperative for importante time intervals. In this work, a modification is proposed in the calculation of the diffusivity and, consequently, of the solution for the oxygen concentration profile in diffusion.
Keywords: anomalous diffusion, diffusion coefficient, oxygen diffusivity, photooxidation, time dependent.
Data Ovailability: Research data is available upon request from the corresponding author.
How to cite: Souza, J. W. L., Oliveira, L. C., Galdino, T. P., Fook, M. V. L., & Navarro, R. F. (2025). Oxygen anomalous diffusion during photooxidation of polypropylene. Polímeros: Ciência e Tecnologia, 35(2), e20250024. https://doi. org/10.1590/0104-1428.20240082
In the process of photooxidation of polyolefins, the radiation source, atmospheric oxygen and temperature act together in the accelerated degradation of the exposed sample. The photodegradation of polypropylene in a dry environment involves the breakdown of the polymer chains due to exposure to ultraviolet (UV) radiation. PP absorbs UV radiation, which initiates the photodegradation process[1]. The absorbed UV energy causes the breaking of the polymer chains, leading to the formation of free radicals. These free radicals react with oxygen in the air, leading to the formation of oxidative products[2]. Over time, the oxidation process results in the formation of carbonyl groups (such as aldehydes and ketones) on the polymer chains[3]. The photodegradation process can also affect the crystalline structure of PP, leading to changes in its physical properties[1]. Some products are formed during photodegration of PP as those cited below:
• Carbonyl Compounds: the formation of carbonyl groups is a primary product of PP photodegradation[3];
• Volatile Organic Compounds (VOCs): small molecules such as alkenes and aldehydes can be released as volatile products[3];
• Microplastics: the breakdown of PP can result in the formation of microplastic particles, which are small plastic fragments[2];
• Gaseous Products: some degradation products can be in the form of gases, which can be released into the atmosphere[3]
Since the present work does not focus primarily on the photodegradation process of PP, but rather on the dependence of the oxygen diffusion coefficient on time and position, as well as its own concentration, the photodegradation process of PP will not be discussed in detail, for which we strongly recommend other papers in the literature[4]
Under constant temperature, irradiance and surface concentration, atmospheric oxygen, diffuses across the exposed surface in a process in which the concentration profile varies with time. In this case, diffusion obeys Fick’s second law (Equation 1).
where C is the concentration, D is the diffusion coefficient, x the direction of diffusion and t is the time.
For the case where D is constant, Equation 1 becomes
For semi-infinite solids immersed in a gaseous atmosphere with surface concentration, ��, constant,
Souza, J. W. L., Oliveira, L. C., Galdino, T. P., Fook, M. V. L., & Navarro, R. F.
( ) , * 1 erf 2 exps exp x CxtC Dt
with �� ������ being the exposure time and measured after the formation of the first oxidation products, the so-called induction time, ����. That is, Equation 4 is valid for �� ������ > ����
Since oxygen diffusion during photooxidation may depend on structural changes during exposure time, the diffusion process may become anomalous due to a possible dependence of the diffusion coefficient on time. In this case, Equation 2 ceases to be valid as well as its particular solutions for all x and t. If �� = �� (��), Costa et al.[5] and Navarro et al.[6] propose that
( ) ( ) ( ) 2 , , ² CxtCxt Dt tx ∂∂ =
Equation 5 can be solved by the method of fractional differential equations (FDE).
If (��) = ����−��, with �� ∈ ℝ and �� > 0, the solution of (4) is:
( ) 1² , exp 4 2 X Cxt Kt Kt π
The fact that D decreases with time is due to some structural modification that hinders the diffusion process[5,7,8]. In this case, there is a simpler solution[9] in which
( ) 1 , * 1 erf 2 1 s n i x CxtC D t n
Equation 7 is a variation of Equation 3 which takes into account the time-dependent �� �� �� is the diffusivity at each time, ��
There are cases where �� increases with time according to the relation �� = �� 0����, with �� 0 being a reference diffusivity. According to Mangat and Molloy[7], Takewaka and Mastumoto[8] and Hirstov[9], in this case the FDE is also applied, as the case is similar to subdiffusion and super-diffusion in nonhomogeneous porous media. However, the solution requires laborious numerical experiments since a simple analytical solution for Equation 5 is not possible.
During the photooxidation process of polypropylene, for instance, after a certain exposure time �� ������ ≥ ����, the formation of carbonyl groups, CO, occurs from the reaction of diffused oxygen with free carbons. Other modifications also occur, as the crystallinity index, ����, increases. According to Rabello and White[4], the diffusion impedance factor, ��, increases with crystallinity, but at higher crystallinities it decreases, due to formation of defects in the crystallites with large thickness. The factor �� affects �� according to[4]:
* * D D τβ = (8)
where �� ∗ is the diffusion constant for a completely amorphous polymer, for completely amorphous PP, �� ∗(300��) = 4.04 x 10⁻¹⁰ m2/s[4], and �� is a chain immobilisation factor that
increases with crystallinity. The estimate activation energy, Q, is taken as 32,000 J/mol and �� 0 = 8.3 x 10⁻⁸ m2/s[10], so, as �� (��) = �� 0��−��/���� that D(50°C) =5.5545 x 10⁻¹³ m2/s.
Although only a fraction of the diffused oxygen reacts with carbon, with the remainder remaining distributed throughout the sample volume where diffusion occurred, the oxygen present in the CO molecule carried out the same diffusion process. In this work, the use of the carbonyl index, ����, which measures the intensity of the chemical degradation of the exposed sample, is used as prove of diffusion impedance modification with exposure time, as it changes during photooxidation.
The polymer used was an injection-moulded grade of isotatic polypropylene (Prolen KM 6100, manufactured by Polibrasil) with MFI 3.5 g/10 min. This is a general purpose grade used for injection moulding and does not contain additives to protect against ultravioleta radiation but we suppose it has termal stabilizers to avoid extensive degradation during processing. Test bars were produced with dimensions in accordance to ASTM D-638 standard using a MG 80/150 injection moulding machine operating at 180 °C (barrel temperature) and with na injection pressure of 32 MPa. The sample thickness was approximately 3 mm. The exposures were carried out in a Comexim (C-UV type) weathering chamber using two fluorescent ultraviolet lamps. The chamber was programmed to operate at two cycles defined as follows: 4 h at 50°C with the UV lights on and absence of moisture. The ultraviolet source was lamps FS-40 UVB, produced by Phillips with intensity of 12.4 W/m2 in the same range of wavelength. The emission spectra for the lamps are given in[12]
The extent of chemical degradation was evaluated by the carbonyl index (CI), the most used parameter to estimate chemical degradation of polypropylene[6]. Samples were collected at a depth of 0.2 mm from the exposed surface using a custom-designed slicer developed by our team. The thickness of each slice was measured at 10 different positions along its length using a micrometer to ensure accuracy. The samples were then cold pressed and analysed in transmission mode using a NICOLET 360 FTIR Spectrophotometer, operating within therange of 400–4,000 cm–1 at resolution of 2 cm–1. The spectra obtained are averages of 20 scans. The CI of the samples was determined from relative areas under the carbonyl peak (at ~1,600–1,800 cm–1) and a reference peak (centred at 2,721 cm–1). A typical FTIR-spectrum of an exposed polypropylene sample is given in Figure 1 showing the two peaks cited above.
The fractional crystallinity, XC, was calculated from X-ray diffractograms obtained from a D-5000 SIE- MENS diffractometer, in the range of 2h = 5–35°, operating at 40 kW and using the KαCu radiation. Crystallinity was determined by averaging the values obtained from integrating the diffractogram curves of each of the five samples at each exposure time, following the method described by[6]
35(2), e20250024, 2025


For �� → 0 and �� → ∞, the local concentration is practically constant and approaches ����. In this case, one can use Equation 3 to estimate the local oxygen concentration.
Figure 2 shows the values of (0.2, ��) over the exposure time, taking D=5.5545x10⁻¹³m2/s. Although the values are around an average value of 10.476, the shape of the curve indicates growth according to a power law. This indicates that there is an increase in the facility for the diffusion process, that is, a decrease in the impedance factor for diffusion, ��, which is expected given the increase in crystallinity in the same time interval, as shown in Figure 3
In Figure 4, the data for ��(0.2, ��) are plotted. The ��(0.2, ��) behaviour indicates an increase in the reacted oxygen content with the exposure time. Even though if the carbonyl index is contested as an indication of the degree of degradation of polypropylene exposed to photooxidation[6], it indicates the amount of diffused oxygen that reacted with the carbon, and its variation with time also indicates how the diffusion impedance factor, ��, varied with exposure time.
According to[13], crystallinity could have little effect on diffusion, since this mass transport predominantly occurs in the amorphous phase of the material. This may be true if comparing two unexposed samples with different degrees of crystallinity. However, during the photooxidation process of polypropylene, there is an increase in crystallinity (see
Figure 3), which implies that fewer amorphous regions are available for oxygen diffusion. Thus, the accumulation predicted by Fick’s 2nd Law becomes greater between layers along the thickness of the exposed polypropylene and, therefore, will hinder the diffusion process. So it is possible to correlate ��(��, ��) with the �� factor as ����~��−1, since the impedance decreases with increasing crystallinity for ���� > 50%[6]. On the other hand, ��~��. Thus, it is proposed that, for ���� > 50%, as ���� increases with exposure time, the product ��∗ �� will also increase with exposure time, since �� decreases with exposure time (see Figure 5) due to structural modification at PP exposed samples. So the Equation 8 may be modified to take the following form:
( ) * , C D Dxt X = (9) and �� (��, ��) will decrease with the exposure time. In Figure 5, is shown the sharp drop in diffusivity with exposure time.
Introducing Equation 9 in Equation 4 we get:
( ) * ÿ ,*1 2 S c x CxtCerf D t X
(10)
In Figure 6, the values for the concentration profile at 0.2 mm depth obtained by Equation 4 and by Equation
Souza, J. W. L., Oliveira, L. C., Galdino, T. P., Fook, M. V. L., & Navarro, R. F.

samples with exposure time.


samples with exposure time.

calculed by Equations 4 and 12 versus theoretical value ���� for PP exposed samples.
Oxygen anomalous diffusion during photooxidation of polypropylene

Figure 7. Variation of the diffusion coefficient (calculed by Equation 8) with the crystallinity index measured at 0.2mm from the exposed surface of polypropylene samples.
10 are presented versus ���� value. For very thin layers, is expected that ∀�� > ����, (��, ��) → ����. Although the values obtained by Equation 4 are very close to ����, even after 37h there was still no convergence to this value. On the other hand, Equation 10 produces data that very quickly converge to ����, showing the importance of crystallinity on the diffusion coefficient as can be seen in Figure 7. The data shown in Figure 7 is in agreement with Mucha[12], since the oxidation rate is inversely proportional to the degree of crystallinity, as oxygen attacks only the amorphous fractions of semicrystalline polymers.
The variation in carbonyl index and crystallinity of polypropylene samples exposed to accelerated degradation by photooxidation in a dry environment at 50°C prove that the process of oxygen diffusion during photooxidation is na anomalous process. This process imposes a timeand positiondependent diffusion coefficient, (��, ��). This prevents the use of simple solutions to Fick’s 2nd Law for diffusion, requiring the use of fractional differential equations to obtain analytical solutions for (��, ��), when diffusivity decreases with time. However, these solutions imply a large number of variables to be statistically obtained. In the present work, an equation for the calculation of diffusivity as a function of the degree of crystallinity was proposed and its substitution in the solution for Fick’s 2nd Law for diffusion in a semi-infinite solid. The results obtained showed excellent equivalence with the theoretically predicted values for the oxygen concentration profile during photooxidation of layers of exposed polypropylene samples with thickness of 2x10⁻⁴ m. Discussions on the influence of surface microcracks on oxygen permeation and diffusion during photooxidation should be made in future papers.
5. Author’s Contribution
• Conceptualization – Rômulo Feitosa Navarro.
• Data curation – Rômulo Feitosa Navarro; José William de Lima Souza Oliveira; Lucas Cordeiro de Oliveira; Taynah Pereira Galdino; Marcus Vinicius Lia Fook.
• Formal analysis – Rômulo Feitosa Navarro; José William de Lima Souza Oliveira; Lucas Cordeiro de Oliveira; Taynah Pereira Galdino; Marcus Vinicius Lia Fook.
• Funding acquisition – NA.
• Investigation – Rômulo Feitosa Navarro; José William de Lima Souza Oliveira; Lucas Cordeiro de Oliveira; Taynah Pereira Galdino; Marcus Vinicius Lia Fook.
• Methodology – Rômulo Feitosa Navarro.
• Project administration – Rômulo Feitosa Navarro; Marcus Vinicius Lia Fook.
• Resources – Rômulo Feitosa Navarro; José William de Lima Souza Oliveira; Lucas Cordeiro de Oliveira; Taynah Pereira Galdino; Marcus Vinicius Lia Fook.
• Software – José William de Lima Souza Oliveira; Lucas Cordeiro de Oliveira; Taynah Pereira Galdino.
• Supervision – Rômulo Feitosa Navarro; Marcus Vinicius Lia Fook.
• Validation – Rômulo Feitosa Navarro; Marcus Vinicius Lia Fook.
• Visualization – Rômulo Feitosa Navarro; José William de Lima Souza Oliveira; Lucas Cordeiro de Oliveira; Taynah Pereira Galdino; Marcus Vinicius Lia Fook.
• Writing - original draft – Rômulo Feitosa Navarro; José William de Lima Souza Oliveira; Lucas Cordeiro de Oliveira; Taynah Pereira Galdino.
• Writing – review & editing– Rômulo Feitosa Navarro; José William de Lima Souza Oliveira; Lucas Cordeiro de Oliveira; Taynah Pereira Galdino.
The authors would like to thank the Coordination for the Improvement of Higher Education Personnel (CAPESBrazil) and the National Research Council (CNPq—Brazil) for their financial support.
1 Rajakumar, K., Sarasvathy, V., Chelvan, A. T., Chitra, R., & Vijayakumar, C. T. (2009). Natural weathering studies of
Souza, J. W. L., Oliveira, L. C., Galdino, T. P., Fook, M. V. L., & Navarro, R. F.
polypropylene. Journal of Polymers and the Environment, 17(3), 191-202 http://doi.org/10.1007/s10924-009-0138-7
2 Ibrahim, A. M. (2024). Plastics: photodegradations and mechanisms. In V. Sivasankar & T. G. Sunitha (Eds.), Microplastics and pollutants (pp. 25-49). Cham: Springer http://doi.org/10.1007/978-3-031-54565-8_2.
3 Liu, X., & Yang, R. (2020). Conversion among photo-oxidative products of polypropylene in solid, liquid and gaseous states. BMC Chemistry, 14(1), 44 http://doi.org/10.1186/s13065-02000698-y PMid:32696017.
4 Rabello, M. S., & White, J. R. (1997). The role of physical structure and morphology in the photodegradation behaviour of polypropylene. Polymer Degradation & Stability, 56(1), 55-73 http://doi.org/10.1016/S0141-3910(96)00202-9
5 Costa, F. S., Oliveira, E. C., & Plata, A. R. G. (2021). Fractional diffusion with time-dependent diffusion coefficient. Reports on Mathematical Physics, 87(1), 59-79 http://doi.org/10.1016/ S0034-4877(21)00011-2
6 Navarro, R. F., d’Almeida, J. R. M., & Rabello, M. S. (2007). Elastic properties of degraded polypropylene. Journal of Materials Science, 42(6), 2167-2174 http://doi.org/10.1007/ s10853-006-1387-7
7 Mangat, P. S., & Molloy, B. T. (1994). Prediction of long term chloride concentration in concrete. Materials and Structures, 27(6), 338-346 http://doi.org/10.1007/BF02473426
8 Takewaka, K., & Mastumoto, S. (1988). Quality and cover thickness of concrete based on the estimation of chloride penetration in marine environments. ACI Symposium Publication, 109, 381-400 http://doi.org/10.14359/2124
9. Hristov, J. (2017). Subdiffusion model with time-dependent diffusion coefficient: integral-balance solution and analysis. Thermal Science , 21 (1 ), 69 -80 http://doi.org/10.2298/ TSCI160427247H
10 Müller‐Plathe, F. (1992). Molecular dynamics simulation of gas transport in amorphous polypropylene. The Journal of Chemical Physics, 96(4), 3200-3205 http://doi.org/10.1063/1.461963
12 Mucha, M. (1986). Oxygen uptake by isotactic polypropylene of different morphological structure. Colloid & Polymer Science, 264(2), 113-116 http://doi.org/10.1007/BF01414835
13. Rouillon, C., Bussiere, P.-O., Desnoux, E., Collin, S., Vial, C., Therias, S., & Gardette, J.-L. (2016). Is carbonyl index a quantitative probe to monitor polypropylene photodegradation? Polymer Degradation & Stability, 128, 200-208. http://doi. org/10.1016/j.polymdegradstab.2015.12.011
Received: Aug. 28, 2024
Revised: Nov. 26, 2024
Accepted: Jan. 29, 2025
Editor-in-Chief: Sebastião V. Canevarolo
https://doi.org/10.1590/0104-1428.20240064er
The authors of the original article “Recycled PVC to eco-friendly materials for footwear industry: process and mechanical properties” with DOI: https://doi.org/10.1590/0104-1428.20240064 published by Polimeros, 34(4), e20240040, 2024, have requested the following change in their text:
Original paragraph to be excluded:
This research utilized pure polyvinyl chloride pellets (PVC) 60A (Braskem Co, Brazil, CAS number 9002-86-2, hardness 50–65 Shore A) and pure thermoplastic polyurethane pellets (TPU) Desmopan 3972AW (NeoRez® R-3972, Covestro Polymer Industry and Trade Ltda., Brazil, hardness 71–75 Shore A).
…. to be replaced by:
This research utilized polyvinyl chloride crystal pellets (PVC), a rigid PVC phthalate-free (030065 D-110/63 FPHMF, Shore 65A) (DACARTO Ind. Ltda.,) and pure thermoplastic polyurethane pellets (TPU) Desmopan 3972AW (NeoRez® R-3972, Covestro Polymer Industry and Trade Ltda., Brazil, hardness 71–75 Shore A).
The XIX Latin American Symposium on Polymers
The XIX Latin American Symposium on Polymers (SLAP) will be organized by the Brazilian (SLAP) will be organized by the Brazilian Polymer Association (ABPol) in 2026 and will Polymer Association (ABPol) in 2026 and will also host the XVII Ibero-American Congress on also host the XVII Ibero-American Congress on Polymers. Held biennially since 1988, SLAP Polymers. Held biennially since 1988, SLAP brings together approximately 500 participants brings together approximately 500 participants and is one of the most important scientif ic and is one of the most important scientif ic events in Latin America focused on polymers. events in Latin America focused on polymers. The symposium aims to foster discussions on The symposium aims to foster discussions on current and highly relevant topics in polymer current and highly relevant topics in polymer science, technology, and innovation, promoting science, technology, and innovation, promoting interaction between academia and industry interaction between academia and industry f rom across the region and beyond. f rom across the region and beyond.
The 2026 edition will take place in Salvador, The 2026 edition will take place in Salvador, Bahia, a historic and mul ticul tural coastal city Bahia, a historic and mul ticul tural coastal city that offers an inspiring setting for knowledge that offers an inspiring setting for knowledge exchange and collaboration. exchange and collaboration.
Registration opens on Registration opens on February 2, 2026 February 2, 2026
Visit the website to learn more: Visit the website learn more: slap2026.com.br slap2026.com.br

sslap2026.com.br lap2026 com br

abpol.org.br abpol org br


São Paulo 994 St. São Carlos, SP, Brazil, 13560-340
Phone: +55 16 3374-3949
Email: abpol@abpol.org.br
2021