Polímeros: Ciência e Tecnologia (Polimeros) 3rd. issue, vol. 32, 2022

Page 1

16th CBPol,2021 OuroPreto Volume XXXII - Issue III - July./ Sep, 2022 A schematic depiction of the indicator label’s application as smart packaging and the chemical reactions that occur. Shrimp paste Sodium metabisulphite 
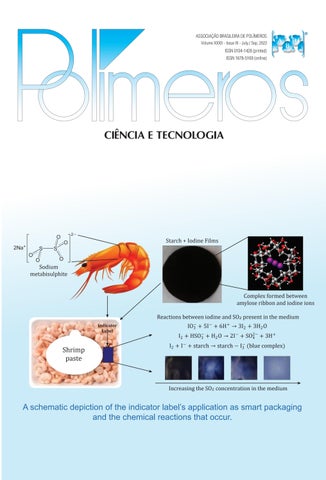
Starch + Iodine Films Complex formed between amylose ribbon and iodine ions Increasing the SO2 concentration in the medium Reactions between iodine and SO2 present in the medium IO3 + 5I + 6H+ → 3I2 + 3H2 O I2 + HSO3 + H2 O → 2I + SO4 2 + 3H+ I2 + I + starch → starch I3 (blue complex) Indicator Label PO-2022-0033
Prof. Ailton de Souza Gomez Emeritus Professor, IMA/UFRJ

Conheça mais sobre o nosso Programa de Reciclagem de Plásticos.

Solução de Economia Circular da Flex é o 1º ecossistema integrado e closed-loop no mercado de eletrônicos no Brasil.

O programa tem como propósito transformar plásticos de engenharia, como PSAI e ABS de produtos do pós-industrial e do pós-consumo, como impressoras e notebooks, em novos produtos eletrônicos.

Os materiais são submetidos à uma rigorosa triagem e reformulação, acompanhados por testes em laboratório e reprocessamento do plástico.

Ao aderir ao nosso programa, além de fechar o ciclo para plásticos de engenharia, você se torna um parceiro SINCTRONICS nesta jornada.

Entre em contato via sinctronics@sinctronics.com.br ou ligue
!
para (15) 4009-6685

olímero

-

olume

P olímero S

e d I tor I al C ou NCI l

Antonio Aprigio S. Curvelo (USP/IQSC) - President m ember S

Ailton S. Gomes (UFRJ/IMA), Rio de Janeiro, RJ (in memoriam)

Alain Dufresne (Grenoble INP/Pagora)

Bluma G. Soares (UFRJ/IMA)

César Liberato Petzhold (UFRGS/IQ)

Cristina T. Andrade (UFRJ/IQ)

Edson R. Simielli (Simielli - Soluções em Polímeros)

Edvani Curti Muniz (UEM/DQI)

Elias Hage Jr. (UFSCar/DEMa)

José Alexandrino de Sousa (UFSCar/DEMa)

José António C. Gomes Covas (UMinho/IPC)

José Carlos C. S. Pinto (UFRJ/COPPE)

Júlio Harada (Harada Hajime Machado Consutoria Ltda)

Luiz Antonio Pessan (UFSCar/DEMa)

Luiz Henrique C. Mattoso (EMBRAPA)

Marcelo Silveira Rabello (UFCG/UAEMa)

Marco Aurelio De Paoli (UNICAMP/IQ)

Osvaldo N. Oliveira Jr. (USP/IFSC)

Paula Moldenaers (KU Leuven/CIT)

Raquel S. Mauler (UFRGS/IQ)

Regina Célia R. Nunes (UFRJ/IMA)

Richard G. Weiss (GU/DeptChemistry)

Rodrigo Lambert Oréfice (UFMG/DEMET)

Sebastião V. Canevarolo Jr. (UFSCar/DEMa)

Silvio Manrich (UFSCar/DEMa)

Financial support:

ISSN 0104-1428 (printed)

1678-5169

e d I tor I al C omm I ttee

Sebastião V. Canevarolo Jr. – Editor-in-Chief a SS o CI ate e d I tor S

Alain Dufresne Bluma G. Soares César Liberato Petzhold

José António C. Gomes Covas José Carlos C. S. Pinto

Paula Moldenaers

Richard G. Weiss Rodrigo Lambert Oréfice

d e S kto P P ubl IS h IN g

www.editoracubo.com.br

“Polímeros” is a publication of the Associação Brasileira de Polímeros São Paulo 994 St. São Carlos, SP, Brazil, 13560-340 Phone: +55 16 3374-3949 emails: abpol@abpol.org.br / revista@abpol.org.br http://www.abpol.org.br

Date of publication: July 2022

Available online at: www.scielo.br

Polímeros / Associação Brasileira de Polímeros. vol. 1, nº 1 (1991) -.- São Carlos: ABPol, 1991-

Quarterly v. 32, nº 3 (July/Sep 2022) ISSN 0104-1428 ISSN 1678-5169 (electronic version)

1. Polímeros. l. Associação Brasileira de Polímeros.

Website of the “Polímeros”: www.revistapolimeros.org.br

ISSN
(online) P
S
I SS ue III - V
XXXII - 2022 I ndexed I n : “C hem IC al a bstra C ts ” — “ ra P ra a bstra C ts ” — “a ll - r uss I an I nst I tute of s CI en C e and t e C hn IC al I nformat I on ” — “ l at I ndex ” — “W eb of s CI en C e ”
Polímeros, 32(3), 2022 E1 E E E E E E E E E E E E E E

o r I g IN al a rt IC le

Tailoring sustainable compounds using eggshell membrane as biobased epoxy catalyst Janetty Jany Pereira Barros, Nichollas Guimarães Jaques, Ingridy Dayane dos Santos Silva, Ananda Karoline Camelo de Albuquerque, Amanda Meneses Araújo and Renate Maria Ramos Wellen ..................................................................................................................e2022025

Bioplastic composed of starch and micro-cellulose from waste mango: mechanical properties and biodegradation Rodolfo Rendón-Villalobos, Miguel Angel Lorenzo-Santiago, Roberto Olvera-Guerra and César Arnulfo Trujillo-Hernández e2022026

Polyurethane/single wall carbon nanotube/polymethylmethacrylate nanocomposite: PM3 semi-empirical method, Monte Carlo applied Juan Ramon Campos-Cruz, Norma Aurea Rangel-Vázquez, Rosa Elvira Zavala-Arce and Edgar Márquez-Brazon e2022027

Release of oregano essential oil from PHBV films in simulated food conditionsa Renata Cerruti da Costa, Ana Paula Ineichen, Cristiano da Silva Teixeira, Ismael Casagrande Bellettini and Larissa Nardini Carli e2022028

Influence of carbon black trimodal mixture on LDPE films properties: Part1 – DOE Juliano Martins Barbosa,, Cesar Augusto Gonçalves Beatrice and Luiz Antonio Pessan e2022029

Influence of carbon black trimodal mixture on LDPE films properties: Part2 – SME

Juliano Martins Barbosa , Cesar Augusto Gonçalves Beatrice and Luiz Antonio Pessan e2022030

Poly(methyl methacrylate) and silica nanocomposites as new materials for polymeric optical devices

Rafael Affonso Netto, Fabrícia Faria de Menezes, Rubens Maciel Filho and Julio Roberto Bartoli e2022031 Interactions of PP-PET blends modified by montmorillonite with different polarities Ariane Sarzi Porto, Jefferson Lopes Alves and Ana Rita Morales e2022032

Influence of processing parameters on mechanical and thermal behavior of PLA/PBAT blenda Virnna Cristhielle Santana Barbosa, Ana Maria Furtado de Sousa and Ana Lúcia Nazareth da Silva, e2022033 Poly(vinyl alcohol)/poly(glycerol) dendrimer hydrogel mediated green synthesis of silver nanoparticles Pollyana Marcondes, Gisela Helou Rosas, Maria Elena Leyva González, Alvaro Antonio Alencar de Queiroz and Paulo Sergio Marques e2022034

Development of an SO2 indicator label applied to shrimp Gleyca de Jesus Costa Fernandes, Karoline Ferreira Silva, Clara Suprani Marques, Luiza Zazini Benedito, Beatriz Ribeiro Cabral, Pedro Henrique Campelo, Soraia Vilela Borges, José Manoel Marconcini, Zuy Maria Magriotis, Pedro Ivo Cunha Claro and Marali Vilela Dias e2022035

Evaluation of lignin as stabilizer in vulcanized natural rubber formulations Gelsa Adriana Carpenedo , Nayrim Brizuela Guerra, Marcelo Giovanela, Marco Aurelio De Paoli and Janaina da Silva Crespo e2022036

e d I tor I al S e C t I o N News E4 Agenda ................................................................................................................................................................................................ E5
Institutions E6
Funding
E2 Polímeros, 32(3), 2022 E I E E I
tainstruments.com
Do DESENVOLVIMENTO ao PROCESSAMENTO e ao PRODUTO FINAL DESCUBRA o conjunto de instrumentos que conduzem a percepções mais profundas sobre as PROPRIEDADES e ESTRUTURA DO POLÍMERO em cada etapa

RUGGED GRENADIER 4X4 FEATURES TOUGH ASA POLYMER

FROM INEOS

Luran S polymer offers UV, heat, and chemical resistance coupled with durability.

Ineos Styrolution’s acrylonitrile styrene acrylate (ASA) polymer Luran S has been selected by sister company Ineos Automotive as the material of choice for the front grille of its upcoming Grenadier 4X4.

Ineos Automotive was established to meet demand for a rugged and uncompromising off-roader. The Ineos Grenadier, which is on track to begin series production in the fall, is designed to be a capable, durable, and reliable working tool, while also offering the comfort, refinement, and reliability expected of a modern vehicle, said Ineos Automotive. Luran S reportedly is up to the challenge. It offers superior UV, heat, and chemical resistance, according to the company. In addition, Luran S provides appropriate impact strength and dimensional stability to make it the best material for the job.

Donna Falconer, Head of Product at Ineos Automotive, said: “We have the highest expectations of the materials we use for the Grenadier. Luran S fulfills them all. Not only does it deliver superior performance in the harshest of environments, it also enables a high-quality finish and appearance.”

In a separate announcement, group company Ineos O&P Europe said it planned to invest €30 million in the conversion of its Lillo, Belgium, plant at the Port of Antwerp to enable capacity to produce either monomodal or bimodal grades of high-density polyethylene (HDPE). This will allow Ineos to meet strong demand for durable high-end applications such as cable ducts and pipes used to transport renewable power and hydrogen, while enabling the business to follow market trends as society turns away from single-use packaging.

Specific target applications include: Pressure pipe grids for transporting hydrogen; long-distance underground cable duct networks for wind farms and transportation of other forms of renewable power; electrification infrastructure; CO2 capture, transport, and storage processes.

Source: Plastic Today – plasticstoday.com

Eco Flexibles creates new mono-polymer packs for Lovimals

Flexible packaging business Eco Flexibles has worked with pet treat brand Lovimals to switch to new monopolymer packs.

The brand opted for a new digitally printed EcoFlow pouch with PE zipper. The move is designed to reduce overall production waste.

Simon Buswell, director at Eco Flexibles, said: “The pouch format has really taken off over the last couple of years due to its convenience-driven design, and that looks set to continue. Mordor Intelligence estimates a compound annual growth rate of over 5% to 2027, so we are expecting to see its popularity continue alongside the surging demand for sustainable, recyclable, and low carbon mono-polymer packaging designs.”

David Ryder, Company Director at Lovimals, added: “We were delighted to work with the Eco Flexibles team on this project, switching our pouch packaging designs to recyclable mono-polymer. Our subscription product range centres around pet health, and now with our redesigned packaging, we are playing our role in supporting the wellbeing of the planet too.

“By applying their expertise from the outset, the Eco Flexibles team made it simple, and the result speaks for itself. The reclose zipper and fantastic barrier strength gives practicality and performance for our customers and their four-legged friends, and the pack is now easily recyclable.”

Source: Packaging News –packagingnews.co.uk/news

N N N N E4 Polímeros, 32(3), 2022

January

POLY-CHAR 2023

Date: January 22-27, 2023

Location: Auckland, New Zealand Website: www.poly-char2023.org/ Polyethylene Films North America – 2023 Date: January 31 - February 2, 2023

Location: Orlando, United State of America Website: www.ami-events.com/o7ezmL?RefId=AMI+Website

February

Reinforced Thermoplastics - 2023

Date: February 7-8, 2023

Location: Cologne, Germany Website: www.ami-events.com/event/2e77454c-ae7f-43e7-bf4c108f6a44c89d/summary?RefId=Website_AMI

4th International Conference on Polymers and Plastics, Artificial Intelligence. Robotics, Smart Materials, Engineering & Information Technology (ICPPAI-FEB-2023) Date: February 18-19, 2023

Location: Shanghai, China Website: irnest.org/icppai-feb-2023/

March

Macrostruct23 — Macromolecular Structures – Interactive Meeting on Crystallisation, Fibrillation and Beyond

Date: March 1-3, 2023

Location: Leipzig, Germany Website: macrostruct23.de/ 4th World Expo on Biopolymers and Bioplastics

Date: March 6-7, 2023

Location: Berlin, Germany Website: biopolymers.materialsconferences.com/ 18th International Plastics and Petrochemicals Trade Exhibitions

Date: March 21-24, 2023 Location: Riyadh, Saudi Arabia Website: saudi-pppp.com/saudi-plastics-petrochem Plástico Brasil — International Plastic Exhibition Date: March 27-31, 2023

Location: São Paulo, São Paulo, Brazil Website: www.plasticobrasil.com.br/en

April

24th International Conference on Wear of Materials Date: April 16-20, 2023 Location: Banff, Alberta, Canada. Website: www.wearofmaterialsconference.com/ Polymers in Flooring Europe – 2023 Date: April 18-19, 2023

Location: Berlin, Germany Website: www.ami-events.com/N3NmxB?RefId=AMI_Website

May

38th International Conference of the Polymer Processing Society

Date: May 22-26, 2023

Location: St. Gallen, Switzerland Website: www.pps-38.org/ Polymer Sourcing & Distribution – 2023 Date: May 23-25, 2023

Location: Hamburg, Germany Website: www.ami-events.com/event/7e7d5b18-b87b-4167bbbe-ed4142955f44/summary

Frontiers in Polymer Science 2023 — Seventh International Symposium Frontiers in Polymer Science Date: May 30 – June 1, 2023

Location: Gothenburg, Sweden

Website: www.elsevier.com/events/conferences/frontiers-inpolymer-science June

Gordon Research Seminar — Polymers

Date: June 3-4, 2023

Location: South Hadley, Massachusetts, United State of America Website: www.grc.org/polymers-grs-conference/2023/ Gordon Research Conference — Polymers Date: June 4-9, 2023

Location: South Hadley, Massachusetts, United State of America Website: www.grc.org/polymers-conference/2023/ Polymer Testing World Expo Europe – 2023 Date: June 14-15, 2023

Location: Messe Essen, Germany Website: eu.polymertestingexpo.com/ Fluoropolymer 2023 Date: June 18-21, 2023

Location: Denver, Colorado, United State of America Website: www.polyacs.net/23fluoropolymer

Chemical Recycling - 2023

Date: June 26-28, 2023

Location: Frankfurt, Germany Website: www.ami-events.com/event/7aa8d789-efda-4178-bf363321aa5caca1/summary?RefId=AMI%20Website

MACRO2024 — 50th World Polymer Congress

Date: June 30 – July 4, 2023

Location: Coventry, United Kingdom Website: iupac.org/event/50th-world-polymer-congressmacro2024/

September

14th International Workshop on Polymer Reaction Engineering

Date: September 5-8, 2023

Location: Fraunhofer-IAP, Potsdam, Germany Website: dechema.de/en/PRE2023.html

Performance Polyamides Europe - 2023 Date: September 12-13, 2023

Location: Cologne, Germany Website: go.ami.international/pa-register-interest-2023/?_ ga=2.161659068.1873836536.16697322131689573348.1669732213

October

Polyolefin Additives - 2023 Date: October 3-4, 2023

Location: Barcelona, Spain Website: www.ami-events.com/event/3217a2fe-22bf-4751-b2415e15ad488df5/summary?RefId=Website_AMI

Plastics Recycling Technology

Date: October 10-12, 2023

Location: Vienna, Austria Website: www.ami-events.com/event/04194add-97e5-4a3b-a5a410e937775a9f/summary?RefId=Website_AMI

Sustainable Polymers

Date: October 15-18, 2023

Location: Safety Harbor, Florida, United State of America Website: www.polyacs.net/23sustainablepolymers

17th Brazilian Polymer Congress Date: October 29 - November 2, 2023

Location: Joinville, Brazil Website: www.cbpol.com.br/

November

Controlled Radical Polymerization Date: November 12-15, 2023

Location: Charleston, SC, United States Website: www.polyacs.net/crp2023

A A A A A A Polímeros, 32(3), 2022 E5

Sponsoring Partners

Polímeros, 32(3), 2022 ABPol Associates
E6
17° Congresso Brasileiro de Polímeros 29 de Out a 02 de Nov de 2023 Joinviille - SC INSCRIÇÕES ABERTAS! Para se inscrever acesse: www.cbpol.com.br/ 17cbpol@abpol.org.br cbpol.com.br @cbpol_2023 16 3374 3949 16 99777 0774

Tailoring sustainable compounds using eggshell membrane as biobased epoxy catalyst

Obstract

In this work eggshell membrane was added as biobased curing catalyst to epoxy (DGEBA), for comparison purposes the synthetic catalyst DEH 35 data was reported, the curing of compounds was followed through differential scanning calorimetry (DSC) under dynamic conditions and their kinetics were modeled using Kissinger, Friedman, Friedman model based and Málek approaches. From evaluated EA and lnA two steps of curing were verified, for the synthetic catalyst compound (S5) EA abruptly increased for the degree of conversion 0.7 α > the opposite trend was observed for the eggshell membrane compound (M10). It is supposed for S5 EA increases due to the competitive reactions leading to viscosity increase until reach the solid phase with decrease of the reactive groups availability, hampering the crosslinking, whereas for M10 EA decreases at 0.7 α > , hence invalidating the Kissinger model which assumes constant EA

Keywords: curing, eggshell membrane, epoxy, kinetics.

How to cite: Barros, J. J. P., Jaques, N. G., Silva, I. D. S, Albuquerque, A. K. C., Araújo, A. M., & Wellen, R. M. R. (2022). Tailoring sustainable compounds using eggshell membrane as biobased epoxy catalyst. Polímeros: Ciência e Tecnologia, 32(3), e2022025. https://doi.org/10.1590/0104-1428.20210088

1. Introduction

Epoxy resins are thermosets and represent polymers whose properties are considered superior to the conventional ones, which provide them extensive applications, ranging from coatings, adhesives to composites for electronics, sporting goods, aerospace, for instance[1,2]. Epoxies properties are achieved through the cross-linking reactions, which occur between epoxy resin and hardening agent, promoting the reticulated network.

In resins which high performance is needed such as higher operating temperatures and greater mechanical strength, anhydrides as hardeners are conventionally added. However, the reactivity between epoxy and anhydride is low, resulting in longer times and temperatures for the curing end[3]; and as a result it may initiate the degradation processes, impairing the epoxy polymerization as well as its final properties, hence catalysts addition are commonly used to accelerate the cure making the process feasible[4,5]

The reaction of epoxides with cyclic anhydrides as the case of this paper, initiated by Lewis bases, proceeds through a chain wise polymerization, which comprises initiation, propagation, and termination or chain transfer steps[6]

Searching sustainable alternatives for epoxy curing, the eggshell membrane is a natural by-product, considered a waste with low commercial value, however it has great

potential to act as an catalyst, due to its biologically active compounds; chemically it has 90% protein, 2% glucose and 2% mineral phases[7]. Currently the membrane is used as biodiesel[8,9] and bio compounds catalyst[10,11]. Its potential to act in the curing is linked to its constituents, since the carboxylic functional groups, amino acids and sulfur present in structural proteins may act as curing catalysts[12]

Epoxy/eggshell biocomposites have already been produced with the purpose of mechanical and thermal properties optimization[13-15]. Saeb et al.[16] carried out a comparative study between the non-isothermal curing kinetics of epoxy/CaCO3 and epoxy/eggshell. The curing kinetics was investigated using Friedman, Ozawa, Kissinger - Akahira - Sunose and Málek models. Ozawa and KAS showed better agreement with the experimental data in relation to the Málek and Friedman ones. Nevertheless, using membrane as a catalyst is still scarcely explored. Jaques et al.[17] investigated the curing kinetics of epoxies adding eggshell (E) or membrane (M) as curing catalysts, it was applied Ozawa, Kissinger, Friedman isoconversional, Friedman model based and Málek to model the curing. The results showed that only the membrane presented potential application as cross-linking performer. Related to the kinetic models, Málek and Friedman presented the

https://doi.org/10.1590/0104-1428.20210088 O O O O O O O O O O O O O O O Polímeros,
ISSN 1678-5169 (Online) 1/12
32(3), e2022025, 2022
Janetty Jany Pereira Barros1 , Nichollas Guimarães Jaques1 , Ingridy Dayane dos Santos Silva1 , Ananda Karoline Camelo de Albuquerque1 , Amanda Meneses Araújo2  and Renate Maria Ramos Wellen1,2*
1Unidade Acadêmica de Engenharia de Materiais, Universidade Federal de Campina Grande – UFCG, Campina Grande, PB, Brasil
2Departamento de Engenharia de Materiais, Universidade Federal da Paraíba – UFPB, João Pessoa, PB, Brasil *janetty_b@hotmail.com

best adjustments to describe the curing of synthetic and bio-based compounds.

Eggshell and eggshell membranes as potential enhancers for epoxy systems were previously investigated by our research group, the results showed that the membrane increased the curing rate, and may be used as a low-cost substitute for synthetic catalysts. Regarding the thermal properties, composites with natural catalysts showed less stability[18] Aware that the final properties of epoxies depend on their cross-linking process, and this process is influenced by the cross-linkers, the processing variables (time, temperature, pressure), and knowing the influence that using a natural catalyst may provide in the epoxy curing, it is essential to investigate their curing kinetics.

Applying mathematical models to evaluate the curing kinetics helps to quantify the degree of conversion of epoxy compounds, in addition to providing reliable information such as identification of the curing mechanism, the activation energy (EA), collision rate among molecules (ln A). Additionally, from the comparison between theoretical and experimental data it is affordable to estimate the predictive power of the employed model, and afterwards its application in an industrial scale. Isoconversional models afford EA variable along with the curing progress whereas the conventional ones assume it constant[19-21]

Based on the above mentioned, this work aimed elucidating the curing kinetics of epoxy compounds (DGEBA)/eggshell membrane. The topic assumes great importance at both technological and scientific aspects since seldom works are focused on the membrane’s abilities into thermosetting compounds, as further presented a costless crosslinker. Additionally, the kinetics investigation was conducted using differential scanning calorimeter (DSC) under dynamic conditions and the curing modeling was performed applying Kissinger, Friedman, Friedman model based and Málek models which parameters may be used as control tools to reach the desired conversion for specific property and application.

2. Materials and Methods

2.1 Materials

Diglycidyl ether of bisphenol A (DER 383) with epoxide equivalent weight of 176–186 g/eq, anhydride methyl tetrahydrophthalic (MTHPA) and 2,4,6-tris (dimethylaminomethyl) phenol (DEH 35) were supplied by Olin Corporation (São Paulo, Brazil). Chicken eggshell was supplied by a local farm (Campina Grande-PB, Brazil).

2.2 Eggshell membrane processing

Processing of membrane (M) was performed as an adapted methodology elsewhere proposed[22]. Eggshell was washed in sodium hypochlorite (NaClO) and afterwards immersed in water for 2 h to remove the membrane. M was oven dried at 100 °C for 24 h. Afterwards, M was ground in a coffee mill B55 Botini (Bilac, SP, Brazil) and sieved through #200 mesh.

2.2.1 Compounding

Epoxy compounding at 100:87 (DER 383/MTHPAresin/hardener) with DEH 35 at concentrations 0 and 5 phr (parts per hundred) were mixed in a magnetic stirrer for 5 min at 800 rpm.

M in content of 10 phr was added into 100:87 (DER 383/ MTHPA). Afterwards, these compounds were mixed in a magnetic stirrer from Corning (Reynosa, Mexico) for 5 min at 800 rpm at ambient temperature (~23 °C). Compounds produced in this work are coded as presented in Table 1

2.2.2 DSC measurements

The curing was followed up through differential scanning calorimetry (DSC) using a DSC Q20 from TA Instruments (New Castle, DE, USA). Samples of approximately 5 mg were tested in a standard closed aluminum pan, under a nitrogen gas flow of 50 mL/min. The samples were heated from 30 °C to 400 °C, at heating rates of 1, 2, 5, 10, and 20 °C/min. The theoretical background with the curing kinetics modeling information is presented in the Supplementary Material.

3. Results and Discussions

Figure 1 shows the DSC scans as time and temperature function for S0, S5 and M10 for the applied heating rates. During heating, an exothermic peak characteristic of the epoxy curing is observed. For S0, Figure 1a, at heating rates higher than 2 °C/min, the exothermic peak is verified on the half-way due to unfinished curing. Reports mention that the curing of DGEBA/Anhydride without catalysts takes place together with degradation reactions, usually at temperatures above 300 °C[5,23].

Additionally, to afore mentioned for the heating rates 5, 10 and 20 °C/min an endothermic peak is observed previously to the curing one (exothermic peak), which may be associated with the hardener (MTHPA) decomposition which starts at Ti = 120 °C and finishes at Tf = 275 °C, assuming nitrogen atmosphere and 10 °C/min as the heating rate, as reported elsewhere[18]. For S5 (synthetic catalyst added), Figure 1b, the curing presented a bell shape without discontinuities, indicating that for this system the reaction occurs through one mechanism, despite presenting lower time and temperature curing ranges[24-26]

Upon eggshell membrane addition as the catalyst, the epoxy curing proceeded at intermediate times and temperatures related to S0 and S5, Figure 1c-1d. Quantitatively in M10, there

Polímeros, 32(3), e2022025,

Barros, J. J. P., Jaques, N. G., Silva, I. D. S., Albuquerque, A. K. C., Araújo, A. M., & Wellen, R. M. R.
2022 2/12
Table 1. Epoxy compounds and their component contents. *Compositions Epoxy Resin Hardener Catalyst DER 383 MTHPA DEH 35 Membrane S0 100 87 0 0 S5 100 87 5 0 M10 100 87 0 10 *S: synthetic compounds; M: compounds with eggshell membrane powder.

is an increase of 65 °C of T0.01 related to S5 for the heating rate 10 °C/min (please see Table S1 of the Supplementary Material). Nevertheless, it is worth of mention adding the eggshell membrane the epoxy curing develops completely, occurs below 300 °C, and no degradation phenomena due to the MTHPA decomposition are verified. Therefore, may be assumed that the eggshell membrane properly acted as epoxy catalyst, as well as suggested that the curing initiation occurs through the amines and carboxyl present in the membrane proteins, as illustrated in Figure 2[17].

Figure 3a shows the relative degree of conversion as temperature function and Figure 3b the conversion rate as the degree of conversion function for S5 and M10 compositions.

Figure 3a illustrates epoxy compounds’ sigmoid as verified discontinuities are absents indicating that a sole process took place, this trend is typical of DGEBA curing under non-isothermal conditions, it may be suggested the curing occurred through the autocatalytic mechanism.

In general, the acquired sigmoid may be analyzed into three stages:

• In the first stage, 05% α ≤≤ , the curing rate is slow and gradually increases. In this stage the curing initiation through catalysis and formation of the first active centers take place, for the epoxy compounds produced in the

Polímeros, 32(3), e2022025, 2022

present work these phenomena may proceed by two mechanisms:

i) Esterification between the anhydride and the epoxy, whereas initially, the anhydride reacts with the epoxy’s hydroxyls and afterwards the produced carboxyl reacts with the epoxide ring. In S0 these processes would occur without initiator thus at longer times;

ii) Anhydride activation through the synthetic (DEH 35) or natural (membrane) initiator, followed by the oxirane ring opening.

• In the second stage, 590% α ≤≤ , the curing rate increases due to the reactive functional groups availability and easier molecular movement;

• In the third stage, 90100% α ≤≤ , the curing rate decreases due to the lower functional groups availability together with the viscosity increase resulted from the crosslinking[25-28]

Comparing Figure 3a-3b it may be observed that for S5 the curing proceeded at lower temperatures and higher rates than M10, which is resulted from the higher reactivity of synthetic catalyst (DEH 35). Nevertheless the membrane

Tailoring sustainable compounds using eggshell membrane as biobased epoxy catalyst
3/12
Figure 1. DSC scans of (a) S0; (b) S5; (c) M10; and (d) All compositions. Heating rates indicated.

Figure 2. Proposed reactions. (a) Oxirane ring opening by DEH35; (b) Oxirane ring opening by the eggshell membrane.

Figure 3. Degree of conversion (a); and Conversion rate (b) as temperature function. Heating rate 10 °C/min.

also promoted the curing through its main constituents such as glycine, alanine and uronic acid, once the amine and carbonyl groups in these constituents are potential catalysts[12,29]; the catalysis process occurs similarly to the synthetic one but slower. Figure 2 illustrates the proposed scheme for the epoxy curing under addition of synthetic (S5) and natural (M10) catalysts. The amino acid molecules attack the anhydride. Nevertheless, it must be considered that both the secondary amine and the hydroxyl group can also react with the oxirane ring.

Both curing reagents and process variables are the key controllers, aiming to understand and define the rational parameters the kinetic modeling is indispensable as bellow discussed.

3.1 Kissinger’s model

Plots in Figure 4 compare the experimental and theoretical degree of conversion as temperature function, and Figure S4 displays the discrepancy between these data estimated using the Kissinger model, which did not result in proper fits, being more evident for 00.5 α ≤≤ with

Polímeros, 32(3), e2022025,

Barros, J. J. P., Jaques, N. G., Silva, I. D. S., Albuquerque, A. K. C., Araújo, A. M., & Wellen, R. M. R.
2022 4/12

discrepancies higher than 10% for S5; whereas for M10 it was approximately 17% at 2 °C/min.

The Kissinger model estimates the global activation energy evaluated from the slope of linear regression ( ) 2 / p lnT β versus 1000/ p T (see Supplementary Material, Figure S9). However, it is feasible to consider E A as variable and increasing along with the curing, because upon higher α the reagents content and the active centers decrease, while the viscosity increases, translating in higher energy expenses to promote the curing.

Additionally, in Kissinger model p T is adopted to calculate the kinetics parameters; however E A in p T very likely differs between the initial and final stages[30]. It is believed, E A is function not only of temperature, but also of α, thus contributing to the discrepancy above verified and explaining the Kissinger inadequacy[26,27,31,32].

Alternatively, the Friedman Isoconversional model was applied aiming to evaluate EA along with α

3.2 Friedman’s isoconversional model

Figure 5 displays the plots of E A and lnA as ( ) α function. Analyzing EA in the range 0.7 α > , S5 and M10 presented distinct trends while for S5 EA abruptly increases the reverse occurs with M10, the same trend is verified for lnA

It is suggested for S5 in the range 0.7 α > E A increases due to the competitive reactions leading to viscosity increase until reach the solid phase with decrease of the reactive groups availability, hampering the cross-linking.

Since, curing is followed by physical change of reaction medium. Initially, medium is a liquid composed of comonomers and newly formed oligomers. As the reaction progress, the oligomer/polymer’s molecular weight increases, as does the viscosity and glass transition temperature. Molecular mobility decreases. The most dramatic decrease in mobility is associated to the polymer chains crosslinking, whereas the medium changes from flowing liquid to solid that can be rubbery or glassy (gelling and vitrification). Cross-linked

Figure 4. Comparison between the experimental (lines) and theoretical (symbols) ,α, estimated using Kissinger model at indicated rates. (a) S5; and (b) M10.

Figure 5. Kinetics parameters of Friedman Isoconversional model. (a) E A versus α; and (b) lnA versus α

Polímeros, 32(3), e2022025, 2022

Tailoring sustainable compounds using eggshell membrane as biobased epoxy catalyst
5/12

chains lose the ability to move over each other, providing greater molecular collision as seen in lnA[25-27,33]. Formation of glassy solid (i.e., vitrification) occurs when the glass transition temperature rises above the actual curing temperature. In both cases, dramatic decrease in molecular mobility affects the curing kinetics which becomes controlled by the reagents diffusion. This curing complexity leads to complex kinetic behavior that can be detected in EA changes with the curing progress. Free volume allowing only local movements of chain segments providing an increase in the overall EA[33-37]

For M10 EA increases in the range 0.10.7 α << due to reticulations processes as above mentioned. Nevertheless, for the range 0.7 α > it decreases, from literature database it is suggested, this fact implied the rate-determining step of the reaction generally changed from the reaction control to the diffusion limitation. The reason lied in that molecular chains mobility of reactive species became more limited due to the increased junction points and gradually elevated glass temperature, which greatly restricted configuration rearrangements and cooperative motions of the network chains, especially as the reaction system approached its glassy state[34,38]

Figure 6 illustrates the theoretical and experimental plots of ( ) α as temperature function for S5 and M10, and Figure S5 (Supplementary Material) its discrepancies. Reasonable fits were gathered for both compounds with mean errors lower than 5%, exception is valid for M10 at 2 °C/min with deviation 13% that does not disqualify the model.

3.3 Friedman’s model based

Investigation of the curing mechanisms was also performed through the linear regression of ( ) lnAf α   versus ( ) 1 ln α , Equation 9, these plots are displayed in Figure 7. S5 and M10 presented an inflexion point on the conversion range of 0.4 and 0.23, respectively, this profile suggests compounds have similar curing mechanism, i.e., autocatalytic[16,24,25].

According to the literature, the autocatalytic mechanism best describes the curing of epoxy/anhydride due to OH formation that catalyzes the curing; these reactive functional

groups are generated by esterification, corroborating the sigmoid profiles as shown in Figure 4[39-41]

Aiming to effectively confirming the autocatalytic mechanism through the curing of S5 e M10 the kinetics parameters Ea, lnA and n were evaluated from the linear and angular coefficients of ( ) lnAf α   versus ( ) 1 ln α , (linear zone) which range from -6 to 0.4. Based on these parameters theoretical plots were built for the autocatalytic Friedman model which are compared with the experimental ones in Figure 8 and their discrepancy is showed in Figure S6. Plots presented quite reasonable fits with errors lower than 10%, exception is valid for S5 and M10 at 1 °C/min with errors of 12% and 23%, respectively, due to higher deviation as verified at lower heating rates.

3.4 Malek’s model

The functions of the Málek model ( ) y α and ( ) Z α as well as their maximum mα and pα were measured for S5 and M10 at the rate 20°C/min and are illustrated in Figure 9, (the other data are presented in Supplementary Material) both plots presented concave profile and agree with the criterion 0 0.632 mpαα <<≠ , indicating the curing is autocatalytic, as previously verified by autocatalytic Friedman model. From the parameter mα the linear regression ( ) / / . a ERT lndadte   versus ( ) 1 p lnaa  , Equation 14 was plotted afterwards the kinetics parameters lnA and nm + were estimated and are presented in Figure 10. As well as the autocatalytic Friedman linear regression the Málek regression displayed a roll with an inflection point indicating that the curing of S5 and M10 follows the autocatalytic mechanism, corroborating results already presented in Figure 9. Additionally, linear deviation was verified for the heating rates 1 °C/min and 2 °C/min, as also observed for the autocatalytic Friedman model.

As Málek model is unable to provide Ea the average EA evaluated based on the isoconversional Friedman model was applied to determine the kinetics parameters lnA, n and m through Equation 14. Afterwards, theoretical plots

Polímeros, 32(3), e2022025,

Barros, J. J. P., Jaques, N. G., Silva, I. D. S., Albuquerque, A. K. C., Araújo, A. M., & Wellen, R. M. R.
2022 6/12
Figure 6. Comparison between theoretical (symbol) and experimental (lines) α computed using the Friedman Isoconversional model at indicated heating rates. (a) S5; and (b) M10

Figure 7. Linear regression of Friedman ( ) lnAf α   versus ( ) 1 ln α , Equation 9. (a) S5; and (b) M10

Figure 8. Experimental (lines) and theoretical (symbols) α evaluated using the autocatalytic Friedman model at the indicated heating rates. (a) S5; and (b) M10

Figure 9. Málek functions y (α) and Z (α) computed at 20 °C/min. (a) S5; and (b) M10

Polímeros, 32(3), e2022025, 2022

Tailoring sustainable compounds using eggshell membrane as biobased epoxy catalyst
7/12

were built compared with the experimental ones as shown in Figure 11, their deviations are displayed in Figure S7. From Figure 11 proper correlation is verified for the Málek model in all applied heating rates for S5 and M10, which is corroborated by a maximum error of approximately 12%.

3.5 Comparative

The kinetic parameters EA, lnA and nm + evaluated using the applied models in this work for S5 and M10 are shown in Table 2. Summing up EA displays distinct profile for S5 and M10 with a maximum difference of 29.85 kJ/mol through Friedman model based on the autocatalytic mechanism. Related to lnA, with exception of autocatalytic Friedman model, S5 resulted in higher values with maximum difference of 4.9 for Málek model when compared to M10, which suggests in S5 there are much molecular collision. These results indicate the curing reaction is more favorable for S5 than

for M10, corroborating the results of Figure 1 and Figure 3, confirming the greater reactivity of the synthetic initiator.

Regarding the parameter nm + for both compositions, it is higher than 1 confirming the complex curing profile and following the autocatalytic mechanism, which justifies EA variation along with the whole reaction, as also discussed in Figure 5. Additionally, these results are on line with those previously reported for curing in epoxy/anhydride resins[16,42].

In order to select the most appropriate model to describe the curing the theoretical and experimental plots of / ddt α are compared in Figure 12, and their discrepancies are in Figure S8. Applied models displayed proper fits with discrepancies lower than 5%, the exception was verified for Kissinger which was approximately 15%.

Isoconversion models by integration such as Kissinger are limited to determine Ea, since affords an overall Ea, which adds errors to the evaluation. However, it was observed for

Figure 11. Comparison between experimental (lines) and theoretical (symbols) α estimated using Málek model at indicated heating rates. (a) S5; and (b) M10

Polímeros, 32(3), e2022025,

Barros, J. J. P., Jaques, N. G., Silva, I. D. S., Albuquerque, A. K. C., Araújo, A. M., & Wellen, R. M. R.
2022 8/12
Figure 10. Linear regression of Málek ( ) / / . a ERT lndadte   versus ( ) 1 p lnaa  , Equation 13. (a) S5; and (b) M10

Table 2. Kinetics parameters of S5 and M10

Compounds

Kissinger Friedman Isoconversional Friedman Model Based* Málek

E a (kJ/mol) 69.9 ± 1.1 77.0 ± 3.81 66.7 77.0 ± 3.82 ln A (ln (1/s)) 15.6 ± 0.3 18.1 ± 0.31 15.7 15.0 ± 0.8 n+m - - 1.6 3.0 ± 1.1 R2 0.8716 0.9955 0.9979M10 E a (kJ/mol) 76.9 ± 20.3 96.6 ± 11.31 96.6 96.6 ± 11.32 ln A ln (1/s)) 13.2 ± 5.0 18.1 ± 2.81 18.9 10.1 ± 0.6 n+m - - 1.8 1.1 ± 0.4 R2 0.9329 0.9937 0.9928 -

S5

1Average EA and ln A based on Friedman Isoconversional model. 2Average EA based on Friedman Isoconversional for Málek model. *Presented data are without error/uncertainty range once the used software does not provide them.

Figure 12. Comparison between experimental and theoretical / ddt α for applied models at the heating rate of 5 °C/min (a) S5; and (b) M10

Friedman Isoconversional, as shown in Figure 5, for S5 curing, Ea developed in two stages, in the almost constant followed by the second with an ascending profile at the curing end, such variation invalidates the curing assessment by Kissinger.

For M10 Ea also changed along with the curing, hence invalidating Kissinger model. Summing up, the isoconversional Friedman, Friedman model based and Málek models are suitable for describing the curing of S5 and M10 resins.

4. Conclusion

Epoxy compounds with eggshell membrane and DEH 35 were kinetically investigated in this work and their parameters were evaluated using Kissinger, Friedman, Friedman model based and Málek models. From the DSC scans in M10 the curing occurs through one mechanism, despite presenting higher time and temperature related to S5. Nevertheless, it is worth of mention adding the eggshell membrane the epoxy curing develops completely as verified on DSC scans. Therefore, may be assumed that the eggshell membrane properly acted as epoxy curing catalyst. Applied models displayed proper fits with discrepancies lower than 5%, the exception was verified for Kissinger which

Polímeros, 32(3), e2022025, 2022

was approximately 15% most due to the activation energy changes along with the curing.

5. Author’s Contribution

• Conceptualization – Janetty Jany Pereira Barros; Nichollas Guimarães Jaques.

• Data curation – Janetty Jany Pereira Barros; Nichollas Guimarães Jaques; Ingridy Dayane dos Santos Silva; Ananda Karoline Camelo de Albuquerque; Amanda Meneses Araújo.

• Formal analysis – Janetty Jany Pereira Barros; Nichollas Guimarães Jaques.

• Investigation – Janetty Jany Pereira Barros; Nichollas Guimarães Jaques.

• Methodology – Nichollas Guimarães Jaques; Renate Maria Ramos Wellen.

• Project administration – Renate Maria Ramos Wellen.

• Resources – Renate Maria Ramos Wellen.

• Software – Nichollas Guimarães Jaques; Janetty Jany Pereira Barros.

• Supervision – Renate Maria Ramos Wellen.

Tailoring sustainable compounds using eggshell membrane as biobased epoxy catalyst
9/12

Barros, J. J. P., Jaques, N. G., Silva, I. D. S., Albuquerque, A. K. C., Araújo, A. M., & Wellen, R. M. R.

• Validation – Nichollas Guimarães Jaques; Janetty Jany Pereira Barros; Renate Maria Ramos Wellen.

• Visualization – Nichollas Guimarães Jaques; Janetty Jany Pereira Barros; Renate Maria Ramos Wellen.

• Writing – original draft – Janetty Jany Pereira Barros; Nichollas Guimarães Jaques; Ingridy Dayane dos Santos Silva; Renate Maria Ramos Wellen.

• Writing – review & editing – Janetty Jany Pereira Barros; Nichollas Guimarães Jaques; Renate Maria Ramos Wellen.

6. Acknowledgements

The authors would like to acknowledge the financial support from the Coordenação de Aperfeiçoamento de Pessoal de Nível Superior (CAPES), from Conselho Nacional de Desenvolvimento Científico e Tecnológico (CNPq) and Fundação de Apoio à Pesquisa do Estado da Paraíba (FAPESQ) (Concession term: 017/2019). Professor Renate Wellen is CNPq fellow (Number: 307488/2018-7). The authors would like to thank Olin Corporation (Brazil) for kindly supplying the reactants.

7. References

1 Qi, B., Zhang, Q. X., Bannister, M., & Mai, Y.-W. (2006). Investigation of the mechanical properties of DGEBA-based epoxy resin with nanoclay additives. Composite Structures, 75(1-4), 514-519. http://dx.doi.org/10.1016/j.compstruct.2006.04.032.

2 Tang, L., & Weder, C. (2010). Cellulose whisker/epoxy resin nanocomposites. ACS Applied Materials & Interfaces, 2(4), 10731080. http://dx.doi.org/10.1021/am900830h. PMid:20423128.

3. Uglea, C. V. (1998). Oligomer technology and applications. Boca Ratton: CRC Press http://dx.doi.org/10.1201/9780585392233

4. Criado, J. M., Málek, J., & Ortega, A. (1989). Applicability of the master plots in kinetic analysis of non-isothermal data. Thermochimica Acta, 147(2), 377-385 http://dx.doi. org/10.1016/0040-6031(89)85192-5

5 Montserrat, S., Flaqué, C., Calafell, M., Andreu, G., & Málek, J. (1995). Influence of the accelerator concentration on the curing reaction of an epoxy-anhydride system. Thermochimica Acta, 269-270, 213-229 http://dx.doi.org/10.1016/00406031(95)02362-3

6 Pascault, J.-P., Sautereau, H., Verdu, J., & Williams, R. J. J. (2002). Thermosetting polymers Boca Raton: CRC Press http://dx.doi.org/10.1201/9780203908402

7 Mine, Y. (2008). Egg bioscience and biotechnology New York: John Wiley & Sons http://dx.doi.org/10.1002/9780470181249

8 Sharma, Y. C., Singh, B., & Korstad, J. (2010). A application of an efficient nonconventional heterogeneous catalyst for biodiesel synthesis from Pongamia pinnata Oil. Energy & Fuels, 24(5), 3223-3231. http://dx.doi.org/10.1021/ef901514a.

9 Wei, Z., Xu, C., & Li, B. (2009). Application of waste eggshell as low-cost solid catalyst for biodiesel production. Bioresource Technology, 100(11), 2883-2885. http://dx.doi.org/10.1016/j. biortech.2008.12.039 PMid:19201602.

10 Mosaddegh, E. (2013). Ultrasonic-assisted preparation of nano eggshell powder: a novel catalyst in green and high efficient synthesis of 2-aminochromenes. Ultrasonics Sonochemistry, 20(6), 1436-1441 http://dx.doi.org/10.1016/j.ultsonch.2013.04.008 PMid:23684545.

11 Laca, A., Laca, A., & Díaz, M. (2017). Eggshell waste as catalyst: a review. Journal of Environmental Management, 197,

351-359 http://dx.doi.org/10.1016/j.jenvman.2017.03.088 PMid:28407598.

12 Ji, G., Zhu, H., Qi, C., & Zeng, M. (2009). Mechanism of interactions of eggshell microparticles with epoxy resins. Polymer Engineering and Science, 49(7), 1383-1388 http:// dx.doi.org/10.1002/pen.21339.

13 Xu, Z., Chu, Z., Yan, L., Chen, H., Jia, H., & Tang, W. (2019). Effect of chicken eggshell on the flame‐retardant and smoke suppression properties of an epoxy‐based traditional APP‐PER‐MEL system. Polymer Composites, 40(7), 2712-2723 http://dx.doi.org/10.1002/pc.25077

14. Hamdi, W. J., & Habubi, N. F. (2018). Preparation of epoxy chicken eggshell composite as thermal insulation. Journal of the Australian Ceramic Society, 54(2), 231-235 http://dx.doi. org/10.1007/s41779-017-0145-4

15 Azman, N. A. N., Islam, M. R., Parimalam, M., Rashidi, N. M., & Mupit, M. (2020). Mechanical, structural, thermal and morphological properties of epoxy composites filled with chicken eggshell and inorganic CaCO3 particles. Polymer Bulletin, 77(2), 805-821 http://dx.doi.org/10.1007/s00289019-02779-y

16. Saeb, M. R., Ghaffari, M., Rastin, H., Khonakdar, H. A., Simon, F., Najafi, F., Goodarzi, V., Vijayan, P. P., Puglia, D., Asl, F. H., & Formela, K. (2017). Biowaste chicken eggshell powder as a potential cure modifier for epoxy/anhydride systems: competitiveness with terpolymer-modified calcium carbonate at low loading levels. RSC Advances, 7(4), 2218-2230 http:// dx.doi.org/10.1039/C6RA24772E

17 Jaques, N. G., Souza, J. W. L., Popp, M., Kolbe, J., Fook, M. V. L., & Wellen, R. M. R. (2020). Kinetic investigation of eggshell powders as biobased epoxy catalyzer. Composites. Part B, Engineering, 183, 107651. http://dx.doi.org/10.1016/j. compositesb.2019.107651

18 Jaques, N. G., Barros, J. J. P., Silva, I. D. S., Popp, M., Kolbe, J., & Wellen, R. M. R. (2020). New approaches of curing and degradation on epoxy/eggshell composites. Composites. Part B, Engineering, 196, 108125 http://dx.doi.org/10.1016/j. compositesb.2020.108125

19 Vyazovkin, S. (2017). Isoconversional kinetics of polymers: the decade past. Macromolecular Rapid Communications, 38(3), 1600615 http://dx.doi.org/10.1002/marc.201600615 PMid:28009078.

20 Vyazovkin, S. (1997). Evaluation of activation energy of thermally stimulated solid‐state reactions under arbitrary variation of temperature. Journal of Computational Chemistry, 18 (3 ), 393 -402 http://dx.doi.org/10.1002/(SICI)1096987X(199702)18:3<393::AID-JCC9>3.0.CO;2-P

21. Ton‐That, M.-T., Ngo, T.-D., Ding, P., Fang, G., Cole, K. C., & Hoa, S. V. (2004). Epoxy nanocomposites: analysis and kinetics of cure. Polymer Engineering and Science, 44(6), 1132-1141 http://dx.doi.org/10.1002/pen.20106

22 Souza, J. W. L., Jaques, N. G., Popp, M., Kolbe, J., Fook, M. V. L., & Wellen, R. M. R. (2019). Optimization of epoxy resin: an investigation of eggshell as a synergic filler. Materials, 12(9), 1489 http://dx.doi.org/10.3390/ma12091489 PMid:31071924.

23 Galy, J., Sabra, A., & Pascault, J.-P. (1986). Characterization of epoxy thermosetting systems by differential scanning calorimetry. Polymer Engineering and Science, 26(21), 15141523 http://dx.doi.org/10.1002/pen.760262108

24 Shanmugharaj, A. M., & Ryu, S. H. (2012). Study on the effect of aminosilane functionalized nanoclay on the curing kinetics of epoxy nanocomposites. Thermochimica Acta, 546, 16-23 http://dx.doi.org/10.1016/j.tca.2012.07.026

25. Nonahal, M., Rastin, H., Saeb, M. R., Sari, M. G., Moghadam, M. H., Zarrintaj, P., & Ramezanzadeh, B. (2018). Epoxy/PAMAM dendrimer-modified graphene oxide nanocomposite coatings:

Polímeros, 32(3), e2022025,

2022 10/12

nonisothermal cure kinetics study. Progress in Organic Coatings, 114, 233-243 http://dx.doi.org/10.1016/j.porgcoat.2017.10.023

26 Zhou, T., Gu, M., Jin, Y., & Wang, J. (2005). Studying on the curing kinetics of a DGEBA/EMI-2, 4/nano-sized carborundum system with two curing kinetic methods. Polymer, 46(16), 6174-6181 http://dx.doi.org/10.1016/j.polymer.2005.03.114

27 Li , L. , Zeng , Z. , Zou , H. , & Liang , M. (2015). Curing characteristics of an epoxy resin in the presence of functional graphite oxide with amine-rich surface. Thermochimica Acta, 614, 76-84 http://dx.doi.org/10.1016/j.tca.2015.06.006

28 Barros, J. J. P., Silva, I. D. S., Jaques, N. G., Fook, M. V. L., & Wellen, R. M. R. (2020). Influence of PCL on the epoxy workability, insights from thermal and spectroscopic analyses. Polymer Testing, 89, 106679 http://dx.doi.org/10.1016/j. polymertesting.2020.106679

29 Nakano, T., Ikawa, N., & Ozimek, L. (2003). Chemical composition of chicken eggshell and shell membranes. Poultry Science, 82(3), 510-514 http://dx.doi.org/10.1093/ps/82.3.510 PMid:12705414.

30 Blaine, R. L., & Kissinger, H. E. (2012). Homer Kissinger and the Kissinger equation. Thermochimica Acta, 540, 1-6 http:// dx.doi.org/10.1016/j.tca.2012.04.008

31 Criado, J. M., Sánchez-Jiménez, P. E., & Pérez-Maqueda, L. A. (2008). Critical study of the isoconversional methods of kinetic analysis. Journal of Thermal Analysis and Calorimetry, 92(1), 199-203. http://dx.doi.org/10.1007/s10973-007-8763-7.

32 Šimon, P. (2004). Isoconversional methods. Journal of Thermal Analysis and Calorimetry, 76(1), 123-132 http://dx.doi. org/10.1023/B:JTAN.0000027811.80036.6c.

33 Vyazovkin, S., & Sbirrazzuoli, N. (2006). Isoconversional kinetic analysis of thermally stimulated processes in polymers. Macromolecular Rapid Communications, 27(18), 1515-1532. http://dx.doi.org/10.1002/marc.200600404

34 Wu, F., Zhou, X., & Yu, X. (2018). Reaction mechanism, cure behavior and properties of a multifunctional epoxy resin, TGDDM, with latent curing agent dicyandiamide. RSC Advances, 8(15), 8248-8258 http://dx.doi.org/10.1039/ C7RA13233F PMid:35542009.

35 Kamran-Pirzaman, A., Rostamian, Y., & Babatabar, S. (2020). Surface improvement effect of silica nanoparticles on epoxy

nanocomposites mechanical and physical properties, and curing kinetic. Journal of Polymer Research, 27(1), 13 http://dx.doi. org/10.1007/s10965-019-1918-y.

36 Achilias, D. S., Karabela, M. M., Varkopoulou, E. A., & Sideridou, I. D. (2012). Cure kinetics study of two epoxy systems with Fourier Tranform Infrared Spectroscopy (FTIR) and Differential Scanning Calorimetry (DSC). Journal of Macromolecular Science, Part A, 49(8), 630-638 http://dx.doi. org/10.1080/10601325.2012.696995

37 Li, C., Bu, Z., Sun, J., Fan, H., Wan, J., & Li, B. (2013). New insights into high-ortho phenolic novolac: elucidating dependence between molecular structure, curing kinetics and thermal stability. Thermochimica Acta, 557, 77-86 http:// dx.doi.org/10.1016/j.tca.2013.01.004

38 Roudsari, G. M., Mohanty, A. K., & Misra, M. (2014). Study of the curing kinetics of epoxy resins with biobased hardener and epoxidized soybean oil. ACS Sustainable Chemistry & Engineering, 2(9), 2111-2116 http://dx.doi.org/10.1021/ sc500176z

39 Erdoğan, B., Seyhan, A. T., Ocak, Y., Tanoğlu, M., Balköse, D., & Ülkü, S. (2008). Cure kinetics of epoxy resin-natural zeolite composites. Journal of Thermal Analysis and Calorimetry, 94(3), 743-747 http://dx.doi.org/10.1007/s10973-008-9366-7

40. Paramarta, A., & Webster, D. C. (2017). Curing kinetics of bio-based epoxy-anhydride thermosets with zinc catalyst. Journal of Thermal Analysis and Calorimetry, 130(3), 21332144 http://dx.doi.org/10.1007/s10973-017-6704-7

41 Montserrat, S., Flaqué, C., Pagès, P., & Málek, J. (1995). Effect of the crosslinking degree on curing kinetics of an epoxy–anhydride system. Journal of Applied Polymer Science, 56(11), 1413-1421. http://dx.doi.org/10.1002/app.1995.070561104.

42 Sun, G., Sun, H., Liu, Y., Zhao, B., Zhu, N., & Hu, K. (2007). Comparative study on the curing kinetics and mechanism of a lignin-based-epoxy/anhydride resin system. Polymer, 48(1), 330-337 http://dx.doi.org/10.1016/j.polymer.2006.10.047

Received: Dec. 09, 2021

Revised: July 16, 2022

Accepted: Aug. 01, 2022

Polímeros, 32(3), e2022025, 2022

Tailoring sustainable compounds using eggshell membrane as biobased epoxy catalyst
11/12

Supplementary Material

Supplementary material accompanies this paper.

Table S1. Curing parameters computed from DSC scans.

Figure S1. DSC scans for the investigated compounds at indicated heating rates. Effect of DEH 35 and eggshell membrane content.

Figure S2. Degree of conversion for S5 and M10 at indicated heating rates.

Figure S3. Curing rate (min -1) for S5 and M10 at indicated heating rates.

Figure S4. Discrepancy between theoretical and experimental α using the Kissinger model at indicated heating rates. (a) S5; and (b) M10

Figure S5. Discrepancy between theoretical and experimental α for Friedman isoconversional model at indicated heating rates. (a) S5; and (b) M10

Figure S6. Discrepancy between theoretical and experimental α computed using the autocatalytic Friedman model. (a) S5; and (b) M10

Figure S7. Discrepancy between theoretical and experimental α estimated using Málek model (a) S5; and (b) M10

Figure S8. Discrepancy between theoretical and experimental α at 5 °C/min. Applied models indicated. (a) S5; and (b) M10

Figure S9. Kissinger linear regression ( ) 2 / p lnT β versus 1000/ p T for S5 and M10 compounds.

Figure S10. Comparison between experimental and theoretical / ddt α estimated using Kissinger model at indicated rates. (a) S5; and (b) M10

Figure S11. Friedman isoconversional linear regression ( ) / lnddt α versus 1000/ p T for S5 and M10 compounds.

Figure S12. Comparison between experimental and theoretical / ddt α estimated using Friedman isoconversional model at indicated rates. (a) S5; and (b) M10.

Figure S13. Comparison between experimental and theoretical / ddt α estimated using Friedman model based model at indicated rates. (a) S5; and (b) M10

Figure S14. Málek functions y (α) e Z (α) for S5 at indicated heating rates.

Figure S15. Málek functions y (α) e Z (α) for M10 at indicated heating rates.

Figure S16. Comparison between experimental and theoretical / ddt α estimated using Málek model at indicated rates. (a) S5; and (b) M10.

This material is available as part of the online article from https://doi.org/10.1590/0104-1428.20210088

Polímeros, 32(3), e2022025,

Barros, J. J. P., Jaques, N. G., Silva, I. D. S., Albuquerque, A. K. C., Araújo, A. M., & Wellen, R. M. R.
2022 12/12

Bioplastic composed of starch and micro-cellulose from waste mango: mechanical properties and biodegradation

Rodolfo Rendón-Villalobos1* , Miguel Angel Lorenzo-Santiago2 , Roberto Olvera-Guerra1  and César Arnulfo Trujillo-Hernández2 

1Centro de Desarrollo de Productos Bióticos, Instituto Politécnico Nacional, Yautepec, Morelos, México 2Centro de Ciencias de Desarrollo Regional, Universidad Autónoma de Guerrero, Acapulco, Guerrero, México *rrendon@ipn.mx

Obstract

Waste mango was used to obtain starch and micro-cellulose for the production of bioplastic. Three different formulations were made: positive control or cotyledon starch/glycerol; SC1 or cotyledon starch/glycerol and cellulose at 0.1% and SC5 or cotyledon starch/glycerol and cellulose at 0.5% w/w. The bioplastics were mechanically analyzed (tensile strength, elongation and Young´s modulus) and, aerobic biodegradation analysis was realized with a standard test method based on the amount of material carbon converted to CO2. The mechanical tests indicated that with the addition of cellulose, the bioplastics improved their mechanical properties. The biodegradation at 30 days showed 93 and 94% for SC1 and SC5. Therefore, the biodegradation of bioplastics depends on both, the addition of cellulose and the environment where they are placed (e.g., soil characteristics: pH level, C:N ratio, moisture). These bioplastics offer new opportunities for fast degrading biomaterials in agricultural applications (padding and protection bags).

Keywords: bioplastic, cellulose, cotyledon starch, biodegradation, mechanical tests.

How to cite: Rendón-Villalobos, R., Lorenzo-Santiago, M. A., Olvera-Guerra, R., & Trujillo-Hernández, C. A. (2022). Bioplastic composed of starch and micro-cellulose from waste mango: mechanical properties and biodegradation. Polímeros: Ciência e Tecnologia, 32(3), e2022026. https://doi.org/10.1590/0104-1428.20210031

1. Introduction

Since the appearance of synthetic plastics in the past century from the refining of petroleum, synthetic plastics have become the most commonly used materials in different industrial sectors, mainly due to their low cost, lightweight and durable materials with adequate mechanical and chemical properties[1,2]. The heterogeneity of synthetic polymers as well as the variability in their properties have allowed for their use in generating a wide range of products that have several benefits in the medical and technological sectors[2,3] However, pollution from plastic waste has developed to become a great threat to ecosystems, especially aquifers with the oceans been the most affected[4,5]. An estimated 8.3 billion metric tons of plastic are produced worldwide, and only 9% of used plastic has been recycled, 12% are incinerated and 79% accumulated in landfills or natural environment as litter[6,7]. In recent years, interest in the development and applications of degradable plastic (i.e., plastics produced from fossil materials) or bio-based plastics and fillers (i.e., plastics synthesized from biomass or polymers from renewable resources) with functionalities and processabilities comparable to traditional petrochemical-based plastic has attracted increasing attention[8].

Biodegradable polymers based on natural polysaccharides, such as starch and cellulose, are used as raw material to develop biodegradable films since they have the capability

of forming a continuous matrix and they are a renewable and abundant resource[9-12]. Starch is one of the most promising natural polymers because of its inherent biodegradability, overwhelming abundance and annual renewability[12-14] In addition to its status as a renewable resource, starches offer very attractive features: its low energy consumption involved in its production, its potential to add value to by-products from other industries, its characteristic biodegradability, among others[14,15]. Starch is essentially composed of a mixture of polysaccharides: amylose, amylopectin and a minor fraction (1% to 2%) of non-glycosidic conformation[16]. Amylose is avowed as linear polymer (poly-α-1,4-D-glucopyranoside) mainly distributed in the starch granule amorphous part and, a branched polymer amylopectin (poly-��-1,4-Dglucopyranoside and ��-1,6-D-glucopyranoside), that gives place to the crystalline domains[17]. In many native or normal starches, around 70 – 80% of the mass of starch granule contains amylopectin and about 20 - 30% amylose[16,17]. The studies of Mali et al.[18] and Bae et al.[19] reported that starches with high amylose content (~30%) have great filmforming properties in comparison with other starches with lower amylose content. Taking into consideration mango starch which can be used as raw material for the manufacture of biodegradable films, since the concentration of mango starch amylose is high enough (31.4%)[20], and is assumed

https://doi.org/10.1590/0104-1428.20210031 O O O O O O O O O O O O O O O
ISSN 1678-5169 (Online) 1/12
Polímeros, 32(3), e2022026, 2022

to be the basis for good biodegradable films. In this sense, it is important to point out that in Mexico the mango is one of the fruit crops with the highest production, reporting in 2019 a production of 2 089 000 tons[21], however, the low opening in the national and international markets have generated an increase in the generation of post-harvest waste. The waste mango currently it is not widely used and which represents an environmental problem due to the followings: lack of distribution channels of mango, inadequate management of the large volumes of residues that are generated, and environmental policies that regulate the deposition of post-harvest mango residues. Therefore, this waste mango can be used as raw material to obtain starch to develop bioplastic film.

Biodegradable plastic can be degraded by naturally occurring microorganisms such as bacteria, fungi, and algae to yield water (H2O), carbon dioxide (CO2) and/or methane (CH4), biomass, and inorganic compounds[22,23]. Therefore, the study of the biodegradability of biodegradable plastic plays a significant role in the development of biopolymers. For a bioplastic to be considered biodegradable, there must be a significant change in the chemical structure and also 90% of the substance is converted to carbon dioxide in less than six months[24]

As for cellulose, this polysaccharide is considered the most abundant natural polymer in the world with the characteristic of being renewable and biodegradable. In the same way it has also been a classic example of a biopolymer used as matrix[25,26]. Cellulose is commonly found in the primary cell wall of green plants; however, it is also produced by some bacteria[27]. It is completely a linear polymer whose basic unit is D-glucose which is successively linked through a glycosidic bond in configuration β (1-4) to form cellobiose molecules. Cellulose chains are arranged in microfibrils of polysaccharides which aids in the stability of plant structures which also suggests that cellulose is a biomaterial with high strength and other superior mechanical properties[23,24]. However, the native fibers of cellulose are rigid mainly due to the components that form them (Lignin, cellulose and hemicellulose), being lignin, the only component made up by aromatic organic units which gives it a high rigidity that allows it act as adhesive of the other two. Therefore, it became necessary to carry out series of chemical and thermal treatments to remove them from the fibers without damaging the structure of the cellulose microfibers[28]

For all of the above, many researchers have seen the development of biodegradable plastic as a promising solution in reducing the negative influence of plastic waste on the environment since they are environmentally-friendly and are also made from renewable resources and not from fossil fuels.

Regarding these concepts, the work aimed to evaluate the effect of the incorporation of micro-cellulose in the mechanical properties and biodegradation in soil of bioplastics prepared from cotyledon starch/glycerol/micro-cellulose.

2. Materials and Methods

2.1 Materials

Ataulfo mango waste (Mangifera caesia Jack ex Wall) were supplied by a regional mango producer in El Arenal,

Guerrero, Mexico. Sodium hydroxide, sulfuric acid, hydrogen peroxide, citric acid, ethanol, sodium chlorite, hydrochloric acid, glycerol, phenolphthalein and distilled water were supplied by Merck-Millipore™. Benzene, acetylacetone, dioxane and potassium hydroxide were purchased from Sigma-Aldrich™. All chemicals were used as supplied by the manufacturer.

2.2 Starch extraction

The mango cotyledons were cut into 2 cm pieces and placed in a container kept in a continuous flow oven for 24 h at 40 °C. The cotyledons were ground for 5 min using a semi-industrial mixer with distilled water and citric acid 3% (w/v) solution[29]. The material obtained was passed through 60, 80 and 100 mesh sieves respectively, and the resulting mixture was centrifuged at 7000 x g for 5 min at 4 °C. Finally, the starch obtained was kept in a continuous airflow oven at 40 °C for 24 h, pulverized in a mortar, passed through 100 mesh sieve and stored in double click bags[30].

2.2.1 Amylose content

The apparent amylose content was determined according to the method suggested by Gilbert and Spragg[31], potato starch was used as standard. 0.1 g dry starch sample was weighed and 1 mL ethanol (95%) was added followed by 9 mL of 1 M NaOH solution. The sample was kept for 10 min in a shaking water bath at 85 ± 0.2 °C. The starch solution was cooled and transferred into a volumetric flask and the volume made up to 100 mL mark with distilled water. 2.5 mL of starch solution was taken into 50 mL standard flask; 0.5 mL of 1 M acetic acid was added followed by 1 mL of stock iodine (0.2 g I2 / 2.0 g KI/ 100 mL) and the solution made up to the 50 mL mark with distilled water. A sample was taken from this solution and transferred to a Perkin-Elmer Lambda 3B double beam UV/ visible spectrophotometer to obtain the absorbance of the sample at a wavelength of 600 nm. The blue value was calculated using the formula[31]:

2.3 Extraction of micro-cellulose fibers

The fibrous endocarp was cut and sieved with a 100mesh sieve. The bagasse was washed with distilled water for 20 min with stirring and at room temperature. It was filtered using filter paper, and the samples were dried in a continuous flow oven at 40 °C for 24 h[32]

2.3.1 Alkaline and bleached treatment

The dried fibrous endocarp was subjected to alkaline treatment[30] using a 2% (w/v) sodium hydroxide solution in a ratio of 1:20 (fiber: solution), keeping it stirred for 2 hours at 80 °C (Figure 1a). The samples were oven-dried in continuous flow oven at 40 °C for 24 h, and ground using an E3303.00 mini cutting mill (Eberbach Corp.) The fibers were bleached (Figure 1a) in a 1:20 ratio (fiber: solution) in a solution composed of H2O2 (v/v) and 4% NaOH (w/v),

Polímeros, 32(3), e2022026,

Rendón-Villalobos, R., Lorenzo-Santiago, M. A., Olvera-Guerra, R., & Trujillo-Hernández, C. A.
2022 2/12
mg
dl × =    (1)
Absorbance at 620 nm 4 Blue value
Concentration

Figure 1. Illustrate kind steps of: (a) chemical (alkaline, bleached and acid hydrolysis) and thermal treatments (sonication) applied to cellulose to obtain micro-cellulose and (b) bioplastic preparation (from cotyledon starch and micro-cellulose).

stirred for 2 h at 50 °C and washed with distilled water and dried at 40 °C for 24 h[33]

2.3.2.

Acid hydrolysis

Cellulose fibers were prepared by acid hydrolysis (Figure 1a), using the method proposed by Cordeiro et al. [30] with some adaptations. Acid hydrolysis was carried out using H2SO4 solutions at 52% (w/w) in a 1:20 ratio (fiber: solution), with hydrolysis time of 2 h at 45 °C. The sample was centrifuged at 6300 x g for 10 min at 10 °C and, the

Polímeros, 32(3), e2022026, 2022

resulting suspension was sonicated for 5 min at a power of 99 W using a Branson™ 2510MT ultrasonic cleaner, according to the modified techniques of Szymańska-Chargot et al.[34] and Kasuga et al.[35]

2.3.3 Chemical analyses

The lignin content was determined using ethanolbenzene solvent for 5 h[36]. The mixture was washed with distilled water and dried in an oven at 103 °C for 1 h, then treated with 72% H2SO4 for 2 h while stirring at 37 °C.

Bioplastic composed of starch and micro-cellulose from waste mango: mechanical properties and biodegradation
3/12

The material was diluted to 3% H2SO4 and stirred at 80 °C for 4 h; finally, the sample was dried at 105 °C for 1 h and placed in a desiccator for cooling until a constant weight was obtained. The lignin content was calculated using Equation 1, where: A is the weight of lignin and W is the oven-dry weight of the test specimen[37]

A100 Lignin % W = (2)

Holocellulose was measured by treating dry fibers with an acidified aqueous sodium chlorite solution in an acid medium at 75 °C for 1 h[38] until the fibres were bleached. The determination of cellulose in fiber was carried out employing a process with aqueous solutions of acetylacetone, dioxane, and hydrochloric acid[39]. The hemicellulose content was theoretically calculated from the difference in the holocellulose and cellulose contents.

2.4 Bioplastic preparation

Bioplastic were prepared from cotyledon starch and micro-cellulose using the method described by Pranoto et al. [40] (Figure 1b). The solution was prepared from cotyledon starch (4% starch, w/v) with the addition of micro-cellulose (0.1 and 0.5%, w/v) and glycerol (0.9%, w/v) used as a plasticizer. The solution was prepared in a beaker with 95 mL distilled water at ambient temperature, then the cotyledon starch was added and stirred for 10 min at 30 °C. Thereafter, the solutions were kept at 60 °C for 10 min. Glycerol and micro-cellulose were then added and the solutions were made up to 100 mL with distilled water and heating was applied until it reaches 75 °C. The filmogenic solution was cast onto the glass plates (30 cm x 20 cm) and dried at 40 °C for 12 h in a continuous airflow oven (Barnstead International™, Model Imperial V). The films obtained were peeled off and stored in a desiccator at 25 °C with relative humidity (RH) of 57% provided by a saturated solution of NaBr.

2.4.1 Biodegradation test

The test was carried out based on the ASTM D598812 standard[41]; which establishes the test method to determine the degree and rate of aerobic biodegradation of materials in contact with soil. The soil had the following characteristics: pH 8.1, carbon 9.64%, nitrogen 0.19%, humidity 6.80%, C:N ratio (16:1). The desiccator was conditioned with layers of soil on the bottom on which were placed the bioplastics and polymer plastic. Inside the desiccator, 20 mL of 0.5 N potassium hydroxide (KOH) solution were placed in a 100 mL beaker, as well as another beaker with 50 mL of distilled water. The desiccator was sealed, and placed in a dark place at 21 ± 2 °C with a humidity of 50%. The carbon dioxide (CO2) produced was trapped by the KOH solution. In addition, a positive control desiccator was included; no biodegradable film sample. Periodically, the amount of CO2 produced by the microorganisms present in the soil was determined. The CO2 released from the system was fixed in the 0.5 N KOH solution and titrated with 0.25 N HCl, using phenolphthalein as an indicator. The percentage of biodegradation was calculated according to the following equation[41]:

mg of CO produced % Biodegradation 100 mg of theoretical CO = × ₂ ₂ (3)

2.4.2 Weight loss from samples

The samples were cut obtaining an area of 4 cm2 and placed on the surface of the Petri dish containing the soil. The weight loss evaluation was determined gravimetrically, the samples were weighed before and after 5, 10, 15, 20 and 30 days of degradation. A polymer plastic bag (Low-density polyethylene, LDPE) was used as a reference[42]. The samples were carefully cleaned, then washed with distilled water, until all traces of soil were removed. Then, the samples were dried for 24 h at 60 °C. Finally, the films were weighed and the final weight was recorded. The calculation of the loss in weight was carried out using Equation 4 and photographic monitoring and analysis by SEM were carried out.

starting weightfinal weight % weight loss 100 starting weight = × (4)

2.5 Structural characterization

To detect changes in the structure of fibers with alkaline treatment as well as chemical and structural analysis of starch, Fourier-transform infrared (FT-IR) spectra were performed on a Perkin Elmer Spectrum (100/100 N model, Shelton, CT, USA) in the range of 4000-650 cm-1 in the transmittance mode, with a resolution of 16 cm-1 and 8 scans[43]. Scanning electron microscopy (Carl Zeiss EVO LS 10) was used to observe the morphology of the samples at an accelerating voltage of 25 kV, with a resolution of 3-10 nm; spot size of 2 was used to image the samples[44].

2.6 Mechanical properties

The mechanical properties of the bioplastics were determined using TAXT2i texturing equipment (Stable Micro Systems™, Surrey, UK), equipped with a 25 Kg load cell. The bioplastics were studied following the ASTM method D-882-02[45]; the bioplastic samples were cut into rectangles that were 10.0 cm long and 1.0 cm wide. The tensile strength (TS), elongation (%E) and Young´s modulus, were determined using a deformation rate of 1 mm/min.

3. Results and Discussions

3.1

3.1.1

Raw material

Starch, amylose and amylopectin content

Cotyledon starch granules presented an oval and elliptical morphology, a size from 2 to 17 μm, with an average of 9.2 μm. This size is similar to that reported by cotyledon starch of five mango varieties grown in India, where the granules presented intervals of 1.5 to 28 μm in diameter[46] . The resulting starch composition showed a significant amylose content of 29.19%; nevertheless, it was lower than the amylose content of 30.45% and 32.0% found in seeds from Tommy Atkins an Alphonso varieties mango[47,48] Morrison and Azudin[49] and Gao et al.[50] have reported that the amylose content may vary due to environmental effects and cultural conditions. In general, it has been reported that

Polímeros, 32(3), e2022026,

Rendón-Villalobos, R., Lorenzo-Santiago, M. A., Olvera-Guerra, R., & Trujillo-Hernández, C. A.
2022 4/12

the amylose content present in native starches is between the values of 18 and 30% and 70 to 82% for amylopectin content, in addition to the presence of other constituents such as lipids, proteins and minerals[51,52]. The lower the amount of these other constituents and the higher the amount of amylose, the better the film and coating formation as amylose is directly linked to the chemical and physical characteristics of the film[53]

3.1.2 Chemical analyses of the fibers

On the other hand, since what is sought in a fiber with hydrophobic properties, that can help and avoid deterioration due to high humidity conditions, it is necessary to perform a chemical and thermal treatment, that can help to remove glue from the fibers without damaging the structure of the micro-cellulose fibers.After chemical and thermal treatment the fibers showed a uniform surface and rectangular shape with sizes ranging from 40 to 400 μm in length, in comparison with the values of 200 to 250 μm that presents the native fiber (without chemical and thermal treatment). Likewise, the application of the fibers is desired for reinforcement in polymer blends, it is desirable to remove amorphous constituents (hemicellulose and lignin) and increase the content of cellulose, which is the crystalline phase of the fiber[32,34]. The decrease in contents of lignin and hemicelluloses was recorded for sample modified in NaOH and H2SO4 solutions. The results of lignin were 10.03 wt % for native fiber and 0.72 wt % for fiber subjected to a modified acid-alkaline treatment; this result showed that the lignin determined by the Klason method, was partially removed in cellulose fibers. The calculated hemicellulose decreased from 28.63 wt % to 1.49 wt % for native and modified fiber, respectively. Based on the results, the lignin content from this study (10.03 wt %) is close to the value of 9.0 wt % reported by Guzmán et al.[53]. However, different values are obtained given that the food-processing industry method was employed which is similar to the Klason lignin extraction process, with the variant that a final step of 1 h calcination at 550 ° C is done. A major difference was observed in the lignin results in relation to the values of 5.76 wt % and 6.97 wt % of lignin in mango peel and mango by-products, respectively[54,55]. On the other hand, the hemicellulose content of 29.75 wt % obtained in this study was lower than those of mango peel (32.5 wt %) and mango by-products (31.75 wt %)[53,56]. A possible explanation is the fact that hemicellulose was not completely removed by the neutral detergent solution used for determining the Neutral Detergent Fibre in the food-processing industry method, as such this method was not used for this study. In addition, the acid concentration (52% w/w) used in the hydrolysis process allowed the destruction of both the amorphous and crystalline regions of cellulose and the decrease in contents of lignin and hemicelluloses[57-59].

3.1.3 Fourier transform infrared spectroscopy (FTIR)

Through acid-alkaline treatments, hemicellulose and lignin were removed, as this also improves the thermal stability and tensile strength of the fibers, an essential property necessary for the elaboration of bioplastics. Typical bands assigned to cellulose were observed in the region of 1745 - 900 cm−1 , where the signal at 1635 cm−1 correspond to vibration of water

Polímeros, 32(3), e2022026, 2022

molecules absorbed in cellulose and starch. The absorption bands at 1420, 1366, 1334, 1027 cm−1 and 896 cm−1 belong to stretching and bending vibrations of CH2 and CH, OH and C-O bonds in cellulose. The native and micro cellulose fibre infrared spectrum subjected to chemical treatment showed a peak at 894 cm-1 (Figure 2), signal was found in the polysaccharide absorbing region (950-700 cm-1) which is associated with the anomeric carbon present in cellulose and which also reveals the component structures of ß-glucans[60]. The stretching of C-O-C bonds of the alkyl-aryl ether (at 1232 cm-1), a compound that belongs to the structure of lignin can be observed only in the native sample since this signal disappears after chemical treatments confirming lignin removal. The 1745 cm-1 peak corresponds to the stretching of the C=O groups linked to aliphatic carboxylic acid and ketone and the residue of hemicellulose or the ester links of the carboxyl group in the ferulic and p-coumaric acids of lignin and hemicellulose[61,62]. This signal decreased when the sample is subjected to acid treatment, which made it possible to verify the removal of lignin and hemicellulose. The bands within 2922-2854 cm-1 are ascribed to the aliphatic materials such as cutin, waxes and cutan present in hemicellulose and lignin[63].

The band at 2876 cm−1 is attributed to CH stretching vibration of all hydrocarbon constituent in polysaccharides. The FTIR spectra of the fibre samples under study provided evidence that the fibers subjected to a chemical treatment has featured the removal of lignin and hemicellulose. A significant decrease is noted in the infrared spectrum when the sample was subjected to an acid-base treatment due to the removal of these components[64]

In the case of native cotyledon starch, the FTIR spectra provided information about the presence or absence of specific functional groups and can give an even deeper insight into the granule starch structure. In the region within the spectrum of 1700 – 800 cm-1 the fingerprint was found, the region where the characteristic peaks in polysaccharides occur. In the region between 3000-2800 cm-1 the C-H stretching was found and finally the region between 3600-3000 cm-1 the O-H stretch region was found. The band in 930 cm-1 is attributed to the α-1,4 glycosidic bonds, (C-O-C) in starches. The peak at 1163 cm-1 is attributed to C-O coupling modes and C-C stretching of the polysaccharide structure[65]. A signal was observed at 2920 cm-1 which is related to the amount of amylose and amylopectin present in the starch granules. A peak appears at 2850 cm-1 which is related to the alkyl

Bioplastic composed of starch and micro-cellulose from waste mango: mechanical properties and biodegradation
5/12
Figure 2. FTIR espectra of cotyledon starch (CS), native fibre (NF) and modified fibre (MF) subjected to a chemical treatment.

and aliphatic groups (H-C-H) present in hemicelluloses and lignin[64]. The presence of this peak is attributed to a thin filament composed of fiber that covers the cotyledon. The maximum absorption was found at 3280 cm-1, which is considered due to the vibrational tension stresses associated with the free, intermolecular and intramolecular bonds of the hydroxyl groups of starch[66]. Infrared spectroscopy showed direct information on chemical changes that occur during chemical and thermal treatments applied to cellulose, in the same way FTIR allowed to observe the presence of different functional groups in the isolated samples (e. g. starch).

3.2 Bioplastics

3.2.1 Mechanical properties

Mechanical properties of starch/micro-cellulose-based bioplastics and conventional plastic (low-density polyethylene, LDPE) are shown in Table 1

The tensile strength (TS), Elongation (%E) and Young´s modulus of the starch bioplastic sample (positive control) was lower when compared with other samples. However, samples with cellulose presented higher values. These results suggest that at higher cellulose content, mechanical properties of the material tends to increase, since the interaction between the reinforcing material and the polymeric matrix determines the mechanical properties, in terms of stress, elongation and Young’s modulus[67]

The use of cellulose in the preparation of the bioplastic makes them more flexible and elastic compared to the positive control sample made of starch without cellulose, thus its mechanical properties were improved. According to Müller et al.[68], the addition of 3 and 5% cellulose fibers from various sources considerably increases the tensile strength and reduces its elongation capacity. These results agree with the findings of Prachayawarakorn et al.[69] in a matrix of starch extracted from rice and reinforced with 5 and 10% cotton cellulose, and also with the findings of Sudharsan et al.[70], in a matrix of tamarind seed starch and 4% sugarcane bagasse cellulose, where TS increased due to the addition of cellulose. On the other hand, with regard to the polymer plastic which exhibits a typical behavior of a flexible polymer due to its excellent mechanical resistance, with a TS value of 12.582 MPa, close to that presented by other studies[71,72] in relation to the force supported before breaking. The value of %E was higher, 41.492 MPa; the higher this value, the more the material will be able to stretch before breaking. Nevertheless, SC1 and SC5 still exhibited good strengths and flexibilities compared to the polymer plastic, which is attributed to the increased concentrations of cellulose. Cellulose acts as a reinforcing material which causes the value of the tensile strength of bioplastics to increase and

making it have a behavior so close to conventional plastic. This, in addition to the amylose content (29.19%) found in this type of starch, with a higher amylose content could have bigger crystalline regions have lower tensile strength and Young’s modulus, and higher elongation at break because of their greater mobility[73-75]. In general, inproving the mechanical properties of the bioplastics depended on the amount of cellulose used to prepare these bioplastics. The film positive control is more brittle than SC1 and SC5 and, these are both strong and flexibles. The bioplastics that added cellulose can absorb more energy than the others, since they undergo higher strains before breaking. These resuls showed that the mango cotyledon starch can be considered suitable for manufacturing resistant and flexible bioplastics with similar properties to those of synthetic low-density polyethylene (LDPE), and which can be used to develop environmentally friendly materials.

3.2.2 Biodegradation

The biodegradation process of the different bioplastics can be seen in the photographic analysis shown in Figure 3 and also by measuring weight loss (Table 2), which is also considered as an indicator of degradation.

LDPE sample weight was constant and there were no observed changes in its surface, color or cracks which is an indicator for its biodegradation (Figure 3d). Exposure in soil is not enough to start the biodegradation process, giving indications that these materials remain longer in the ecosystem[76]

It was observed that the positive control films had a greater loss of material on the 30 days, this loss of material was longer observed (Table 2). However, although it can be seen that showed the highest weight loss, the strong hydrophilicity and poor mechanical properties of the material based on starch prevent its application in the bioplastic products[29]. As a result, it is logical to improve its properties for certain applications using cellulose as a reinforcing material.

3.2.2.1 Surface morphology by Scanning Electron Microscopy (SEM)

Only bioplastics were analyzed at different degradation times to determine a superficial analysis of the films with the aid of scanning electron microscopy since the LDPE sample did not record any changes in the percentage of biodegradation. The positive control sample showed some pores on its surface and some irregularities associated with processing operations (Figure 4a). SC1 and SC5 samples presented a smooth, compact, orderly surface, without the presence of pores, which indicates that starch and cellulose tend to form a homogeneous structure (Figures 4b and 4c).

Table 1. Mechanical properties of the bioplastics elaborated with starch/micro-cellulose from waste mango and polymer plastic (LDPE, negative control).

Polímeros, 32(3), e2022026,

Rendón-Villalobos, R., Lorenzo-Santiago, M. A., Olvera-Guerra, R., & Trujillo-Hernández, C. A.
2022 6/12
Sample Tensile strength (MPa) Elongation (%) Young´s modulus (MPa) Positive control 1.465 5.667 4.655 SC1 4.674 24.507 11.445 SC5 4.961 27.950 14.350 Polymer plastic (negative control) 12.582 41.492 37.251

SC1; (c) SC5; and (d) LDPE (negative control).

Figure 4. Surface SEM images (x 200) of bioplastics samples: (a) Positive control; (b) SC 1; and (c) SC5 at the beginning of the biodegradation test.

Table 2. Weight (g) record of the bioplastic and LDPE samples (Negative control).

Sample Time (days)

0 10 20 25 30

Positive control 0.0354 0.0230 0.0082 -SC1 0.0362 0.0270 0.0095 0.0054SC5 0.0325 0.0231 0.0093 0.0068 -

Polymer plastic (Negative control) 0.0044 0.0044 0.0044 0.0044 0.0044

The observation of homogeneous and compact matrices is an indication of structural integrity and consequently is expected

Polímeros, 32(3), e2022026, 2022

to have good mechanical properties[77] in comparison with positive control sample, as presented in Table 1. Besides, the porosity and irregularities structure predicted the lower tensile strength of bioplastics[77]

After 10 days of degradation, the bioplastics began to show the presence of fungal growth on the surface (Figure 5). In the positive control sample, mycelial growth was evident, the surface was completely covered and pores appear on the bioplastic (image a).

In Figure 5b the presence of mycelia can be observed as well as an increased presence of pores on the surface, being larger in the SC5 sample (Figure 5c). Filamentous

Bioplastic composed of starch and micro-cellulose from waste mango: mechanical properties and biodegradation
7/12
Figure 3. Photographs of samples under laboratory conditions to observe biodegradation of bioplastics samples: (a) Positive control; (b)

microorganisms develop their mycelium within and/or on the surface of the material, causing damage to the surface of the film[78], as revealed by the SEM images (Figure 5), also weight loss occurring in the bioplastics due to the presence of soil microorganisms is shown in Table 2 in the soil.

After 20 days of degradation, the samples showed a great impact on their structure, the positive control sample showed the presence of spores and mycelia throughout the sample and the fungal impact was also evident throughout the sample (Figure 6a).

This can be attributed to the action of starch and its high water absorption, generating a greater proliferation of microorganisms. Then, the water associated to the polymers, as observed in FTIR (Figure 2), has a significant effect which can contribute biodegradation[79] and which is related to the predisposition to the chemical structure of the bioplastics to attack by microorganisms. Polymers like starch and cellulose are biologically synthesized and can be completely and rapidly biodegraded, either as surface erosion and bulk erosion, by heterotrophic microorganisms in a wide range of natural environment[80]. The SC1 and SC5 sample, in addition, were covered by mycelia and spores, the pores are more evident at the time of biodegradation (Figure 6b and 6c) and may be due to the presence of glycerol in the polymeric matrix whose trend is to form hydrogen bonds, trap water and bond with it[75], thus increasing soil water bioavailability which attracts microorganisms to attack the bioplastic. In the other hand, also the presence of microorganisms in the soil, responsible for carrying out microbial attack to polymer carbon backbone. As can be seen, cellulose matrices can be affected by various parameters, such as the existence and diversity of microorganisms in the soil, glycerol and microcellulose concentrations, the carbon source availability and degradation time[75,81]

According SEM micrographs of the surface of the bioplastics was observed the biodegradation behavior and how its microstructure was mainly affected by the presence of microorganisms[82]

3.2.2.2 Percentage of biodegradation

The percentage of biodegradation was determined by the ratio of the carbon dioxide generated from the test material and the maximum theoretical amount of carbon dioxide that can be produced from the test sample[83]. Carbon dioxide was produced by the decomposition of the bioplastics from the action of microorganisms present in the soil as well as the enzymatic attack which degrade the glucose units that made up the structure of starch and is used as a carbon source as products of microbial metabolism for the generation of CO2, H2O and biomass[83-85]. Bacterias such as: Pseudomonnas sp., Streptococcus sp., Staphylococcus sp., Bacillus sp., and Moraxella sp.; as well as some fungi (Aspergillus sp. and Penicillium sp.) have been reported and associated with the degradation of starch-based films under soil conditions[86]

By applying Equation 3 the percentage of biodegradation of bioplastics was obtained (Figure 7). 90% biodegradation means that 90% of the carbon atoms present in the film were converted to carbon dioxide (CO2).

After five days, biodegradation close to 20% was observed for all starch samples; with the positive control sample having the highest value (~18%) compared to the other samples (SC1 and SC5). All the bioplastics tested displayed a similar biodegradation behavior; the curves in Figure 7 show the progressive increase in percentage of biodegradation as a consequence of microbial attack to polymer. This is in agreement with the photographic analysis (Figure 3) and observation of weight loss (Table 1), e.g., after 10 days the weight of the bioplastics decreased,

Polímeros, 32(3), e2022026,

Rendón-Villalobos, R., Lorenzo-Santiago, M. A., Olvera-Guerra, R., & Trujillo-Hernández, C. A.
2022 8/12
Figure 6. Surface SEM images (x 500) of bioplastics samples: (a) Positive control; (b) SC1; and (c) SC5: 20 days of biodegradation test. Figure 5. Surface SEM images (x 500) of bioplastics samples: (a) Control; (b) SC1; and (c) SC5: 10 days of biodegradation test.

Figure 7. Biodegradation (%) of bioplastics and LDPE samples.

reaching percentage of 35, 25 and 28%, for positive control, SC1 and SC5, respectively. The difference in weight loss is attributed to the fact that α-1,4-glycosidic bond in starch are more easily broken down than β-1,4-glycosidic bond in cellulose[87], regardless of what the cellulose have weak hydrogen bonds easily degraded[88]

This behavior was constant throughout the test, reaching a maximum percentage of biodegradation of 96, 93 and 94% for positive control, SC1 and SC5, respectively at the end of the test (30 days). This could be attributed to the hydrophilicity of starch and glycerol, favoring the absorption and increase in water activity which promotes the growth of microorganisms[75,81]. The value obtained after 30 days of biodegradation, possibly corresponds to the mineralization stage of the bioplastic, that is, carbon that has not been transformed into inorganic carbon, as well as to the biological activity present in the soil[89,90]. The behavior of the other samples was consistent with the analysis presented in Figure 7 with respect to the percentages of biodegradation that can be attributed to the microorganisms. The first degradation mechanism is associated with the leaching of glycerol, which is eventually absorbed by the soil or cross the cell membrane of microorganisms, initiating the metabolism of microorganisms and increasing the biodegradation[87,88]. It’s worthy of note that the LDPE sample (negative control) did not show any change over time of the biodegradation test. These results of biodegradation of bioplastics are presented as evidence of rapid disintegration of bio-based materials and as a partial solution to the environmental problems derived from plastic waste.

4. Conclusions

Bioplastics are gaining popularity mainly due to the presentation of studies that reveal that are potentially biodegradable. In this work, the bioplastics based on cotyledon starch incorporated with micro-cellulose were developed, and the effect of cellulose on the mechanical properties and biodegradation of bioplastics were studied. The results showed that the use of micro-cellulose as a reinforcement had a positive effect on the elastic modulus and the tensile strength of the bioplastics. The biodegradation analysis showed a higher degree of disintegration of the samples in laboratory conditions as well as that this biodegradation process is very fast. The addition of cellulose increased the biodegradation time for both formulations, lasting 10 -

20 days at maximum. Once the microorganisms assimilate the biopolymer, they can degrade its structure and use it as a carbon source. Although the average degradation time was 30 days, it is necessary to carry out a greater number of variables that help us determine the capacity of microcellulose in other polyblends. The experiment carried out suggests that bioplastics based on biopolymers should also be tested in real conditions. Based on these findings, the waste mango can be a good choice for the low-cost obtaining biopolymers such as starch and cellulose, which are very useful for the production of plastic biodegradable. A relevant characteristic of biobased material is the biodegradation rate because this is a parameter that is necessary to try to predict the environmental fate.

5. Author’s Contribution

• Conceptualization – Rodolfo Rendón-Villalobos.

• Data curation – NA.

• Formal analysis – Miguel Angel Lorenzo-Santiago; Roberto Olvera-Guerra; César Arnulfo Trujillo-Hernández.

• Funding acquisition – Rodolfo Rendón-Villalobos.

• Investigation – Miguel Angel Lorenzo-Santiago; Roberto Olvera-Guerra; César Arnulfo Trujillo-Hernández.

• Methodology – Miguel Angel Lorenzo-Santiago; Roberto Olvera-Guerra; César Arnulfo Trujillo-Hernández.

• Project administration – Rodolfo Rendón-Villalobos.

• Resources – NA.

• Software – NA.

• Supervision – Rodolfo Rendón-Villalobos.

• Validation – NA.

• Visualization – NA.

• Writing – original draft – Rodolfo Rendón-Villalobos; Miguel Angel Lorenzo-Santiago.

• Writing – review & editing – Rodolfo Rendón-Villalobos; Roberto Olvera-Guerra; César Arnulfo Trujillo-Hernández.

6. References

1 Andrady, A. L., & Neal, M. A. (2009). Applications and societal benefits of plastics. Philosophical Transactions of the Royal Society of London. Series B, Biological Sciences, 364(1526), 1977-1984 http://dx.doi.org/10.1098/rstb.2008.0304. PMid:19528050.

2 Thompson, R. C., Moore, C. J., vom Saal, F. S., & Swan, S. H. (2009). Plastics, the environment and human health: current consensus and future trends. Philosophical Transactions of the Royal Society of London. Series B, Biological Sciences, 364(1526), 2153-2166 http://dx.doi.org/10.1098/rstb.2009.0053. PMid:19528062.

3 Chasib, K. F., & Kadhim, B. M. (2019). Prediction of the behavior for polymer blends using thermodynamic model. Recent Advances in Petrochemical Science, 6(5), 555699

4 O’Brine, T., & Thompson, R. C. (2010). Degradation of plastic carrier bags in the marine environment. Marine Pollution Bulletin, 60(12), 2279-2283 http://dx.doi.org/10.1016/j. marpolbul.2010.08.005 PMid:20961585.

5. Webb, H. K., Arnott, J., Crawford, R. J., & Ivanova, E. P. (2012). Plastic degradation and its environmental implications with special reference to poly (ethylene terephthalate). Polymers, 5(1), 1-18 http://dx.doi.org/10.3390/polym5010001

9/12
Bioplastic composed of starch and micro-cellulose from waste mango: mechanical properties and biodegradation
Polímeros, 32(3), e2022026, 2022

Rendón-Villalobos, R., Lorenzo-Santiago, M. A., Olvera-Guerra, R., & Trujillo-Hernández, C. A.

6 Das, O., Sarmah, A. K., & Bhattacharyya, D. A. (2015). A sustainable and resilient approach through biochar addition in wood polymer composites. The Science of the Total Environment, 512-513, 326-336 http://dx.doi.org/10.1016/j. scitotenv.2015.01.063 PMid:25634737.

7 Geyer, R., Jambeck, J. R., & Law, K. L. (2017). Production, use and fate of all plastics ever made. Science Advances, 3(7), e1700782 http://dx.doi.org/10.1126/sciadv.1700782 PMid:28776036.

8 Brebu, M. (2020). Environmental degradation of plastics composites with natural fillers: a review. Polymers, 12(1), 166 http://dx.doi.org/10.3390/polym12010166 PMid:31936374.

9 Jiang, T., Duan, Q., Zhu, J., Liu, H., & Yu, L. (2020). Starchbased biodegradable materials: challenges and opportunities. Advanced Industrial and Engineering Polymer Research, 3(1), 8-18 http://dx.doi.org/10.1016/j.aiepr.2019.11.003

10 Brandelero, R. P. H., Grossmann, M. V. E., & Yamashita, F. (2011). Effect of the method of production of the blends on mechanical and structural properties of biodegradable starch films produced by blown extrusion. Carbohydrate Polymers, 86(3), 1344-1350 http://dx.doi.org/10.1016/j.carbpol.2011.06.045

11. Polnaya, F. J., Talahatu, J., Haryadi, & Marseno, D. W. (2012). Properties of biodegradable films from hydroxypropyl sago starches. Asian Journal of Food and Agro-Industry, 5(3), 183192. Retrieved in 2021, April 23, from https://www.ajofai.info/ Abstract/Properties%20of%20biodegradable%20films%20 from%20hydroxypropyl%20sago%20starches.pdf

12 Jiménez, A., Fabra, M. J., Talens, P., & Chiralt, A. (2012). Edible and biodegradable starch films: a review. Food and Bioprocess Technology , 5 (6), 2058 -2076 http://dx.doi. org/10.1007/s11947-012-0835-4

13 Yu, L., & Christie, G. (2005). Microstructure and mechanical properties of orientated thermoplastic starches. Journal of Materials Science, 40(1), 111-116 http://dx.doi.org/10.1007/ s10853-005-5694-1.

14 Yu, L., Dean, K., & Li, L. (2006). Polymer blends and composites from renewable resources. Progress in Polymer Science, 31(6), 576-602. http://dx.doi.org/10.1016/j.progpolymsci.2006.03.002.

15 Adamcová, D., Zloch, J., Brtnický, M., & Vaverková, M. D. (2019). Biodegradation/desintegration of selected range of polymers: impact on the compost quality. Journal of Polymers and the Environment, 27(4), 892-899 http://dx.doi.org/10.1007/ s10924-019-01393-3

16 Seung, D. (2020). Amylose in starch: towards an understanding of biosynthesis, structure and function. The New Phytologist, 228(5), 1490-1504 http://dx.doi.org/10.1111/nph.16858 PMid:32767769.

17 Bertoft, E. (2017). Understanding starch structure: recent progress. Agronomy, 7(3), 56 http://dx.doi.org/10.3390/ agronomy7030056

18 Mali, S., Grossmann, M. V. E., García, M. A., Martino, M. N., & Zaritzky, N. E. (2005). Mechanical and thermal properties of yam starch films. Food Hydrocolloids, 19(1), 157-164 http:// dx.doi.org/10.1016/j.foodhyd.2004.05.002.

19 Bae, H. J., Cha, D. S., Whiteside, W. S., & Park, H. J. (2008). Film and pharmaceutical hard capsule formation properties of mungbean, waterchestnut and sweet potato starches. Food Chemistry, 106(1), 96-105 http://dx.doi.org/10.1016/j. foodchem.2007.05.070

20 Lopez-Flores, Y. A., Ramirez-Balboa, G., Balois-Morales, R., Bautista-Rosales, P. U., Lopez-Guzmán, G., & Bello-Lara, J. E. (2020). Caracterización fisicoquímica y funcional de almidón extraídos de frutos de mango ‘Tommy atkins’ del estado de Nayarit. Investigación y Desarrollo en Ciencia y Tecnología de Alimentos, 5, 694-699. Retrieved in 2021, April 23, from http://www.fcb.uanl.mx/IDCyTA/files/volume5/5/10/136.pdf

21 Mexico Servicio de Información Agroalimentaria y Pesquera –SIAP. (2020). Panorama agroalimentario 2020. Mexico: SIAP Retrieved in 2021, April 23, from https://nube.siap.gob.mx/ gobmx_publicaciones_siap/pag/2020/Atlas-Agroalimentario-2020

22 Bubpachat, T., Sombatsompop, N., & Prapagdee, B. (2018). Isolation and role of polylactic acid-degrading bacteria on degrading enzymes productions and PLA biodegradability at mesophilic conditions. Polymer Degradation & Stability, 152, 75-85 http://dx.doi.org/10.1016/j.polymdegradstab.2018.03.023

23. Szumigaj, J., Żakowska, Z., Klimek, L., Rosicka-Kaczmarek, J., & Bartkowiak, A. (2008). Assessment of polylactide foil degradation as a result of filamentous fungi activity. Polish Journal of Environmental Studies, 17(3), 335-341 Retrieved in 2021, April 23, from pjoes.com/pdf-8811221970?filename=Assessment%20of%20Polylactide.pdf

24 International Organization for Standardization – ISO. (2012). ISO 17088:2012: specifications for compostable plastics. Switzerland: ISO

25 Béguin, P., & Aubert, J.-P. (1994). The biological degradation of cellulose. FEMS Microbiology Reviews, 13(1), 25-58 http:// dx.doi.org/10.1111/j.1574-6976.1994.tb00033.x PMid:8117466.

26 Samir, M. A. S. A., Alloin, F., & Dufresne, A. (2005). Review of recent research into cellulosic whiskers, their properties and their application in nanocomposite field. Biomacromolecules, 6 ( 2 ), 612 - 626 http://dx.doi.org/10.1021/bm0493685 PMid:15762621.

27 Brigham, C. (2018). Biopolymers: biodegradable alternatives to traditional plastics. In B. Török, & T. Dransfield (Eds.), Green chemistry: an inclusive approach (pp. 753-770). USA: Elsevier Inc http://dx.doi.org/10.1016/B978-0-12-809270-5.00027-3

28. Kabir, M. M., Wang, H., Lau, K. T., & Cardona, F. (2012). Chemical treatments on plant-based natural fibre reinforced polymer composites: an overview. Composites. Part B, Engineering, 43(7), 2883-2892 http://dx.doi.org/10.1016/j. compositesb.2012.04.053.

29 Argüello-García, E., Solorza-Feria, J., Rendón-Villalobos, J. R., Rodríguez-González, F., Jiménez-Pérez, A., & FloresHuicochea, E. (2014). Properties of edible films based on oxidized starch and zein. International Journal of Polymer Science, 2014, 292404 http://dx.doi.org/10.1155/2014/292404

30 Cordeiro, E. M. S., Nunes, Y. L., Mattos, A. L., Rosa, M. F., Sousa, M. S. M., Fo., & Ito, E. N. (2014). Polymer biocomposites and nanobiocomposites obtained from mango seeds. Macromolecular Symposia, 344(1), 39-54 http://dx.doi. org/10.1002/masy.201300217

31 Gilbert, G. A., & Spragg, S. P. (1964). Iodometric determination of amylose. In R. I. Whistler (Ed.), Methods in carbohydrate chemistry (pp. 168-169). USA: Academic Press

32. Salgado-Delgado, R., Coria-Cortés, L., García-Hernández, E., Galarza, Z. V., Rubio-Rosas, E., & Crispín-Espino, I. (2010). Elaboración de materiales reforzados con carácter biodegradable a partir de polietileno de baja densidad y bagazo de caña modificado. Revista Iberoamericana de Polímeros, 11(7), 520-531. Retrieved in 2021, April 23, from https:// reviberpol.files.wordpress.com/2019/07/2010-salgado.pdf

33 Orts, W. J., Shey, J., Imam, S. H., Glenn, G. M., Guttman, M. E., & Revol, J.-F. (2005). Application of cellulose microfibrils in polymer nanocomposites. Journal of Polymers and the Environment, 13(4), 301-306 http://dx.doi.org/10.1007/ s10924-005-5514-3

34 Szymańska-Chargot, M., Cieśla, J., Chylińska, M., Gdula, K., Pieczywek, P. M., Koziol, A., Cieślak, K. J., & Zdunek, A. (2018). Effect of ultrasonication on physicochemical properties of apple based nanocellulose-calcium carbonate composites. Cellulose, 25(8), 4603-4621 http://dx.doi.org/10.1007/s10570018-1900-6

Polímeros, 32(3), e2022026,

2022 10/12

Bioplastic composed of starch and micro-cellulose from waste mango: mechanical properties and biodegradation

35 Kasuga, T., Isobe, N., Yagyu, H., Koga, H., & Nogi, M. (2018). Clearly transparent nanopaper from highly concentrated cellulose nanofiber dispersion using dilution and sonication. Nanomaterials, 8(2), 104 http://dx.doi.org/10.3390/nano8020104 PMid:29439544.

36 Technical Association of the Pulp and Paper Industry –TAPP. (2007). T 204 cm-97: solvent extractives of wood and pulp (Proposed revision of T 204 cm-97) (Underscores and strikethroughs indicate changes from Draft 1). Atlanta: TAPPI.

37 Technical Association of the Pulp and Paper Industry – TAPP (2006). T 222 om-06: acid-insoluble lignin in wood and pulp (Reaffirmation of T 222 om-02). Atlanta: TAPPI

38 Haykiri-Acma, H., Yaman, S., Alkan, M., & Kucukbayrak, S. (2014). Mineralogical characterization of chemically isolated ingredients from biomass. Energy Conversion and Management, 77, 221-226 http://dx.doi.org/10.1016/j.enconman.2013.09.024

39 Waliszewska, B., Mleczek, M., Zborowska, M., Goliński, P., Rutkowski, P., & Szentner, K. (2019). Changes in the chemical composition and the structure of cellulose and lignin in elm wood exposed to various forms of arsenic. Cellulose (London, England), 26(10), 6303-6315 http://dx.doi.org/10.1007/ s10570-019-02511-z.

40 Pranoto, Y., Lee, C. M., & Park, H. J. (2007). Characterizations of fish gelatin films added with gellan and κ- carrageenan. Lebensmittel-Wissenschaft + Technologie, 40(5), 766-774 http://dx.doi.org/10.1016/j.lwt.2006.04.005

41 American Society for Testing and Materials – ASTM. (2012). ASTM D5988-12: standard test method for determining aerobic biodegradation of plastic materials in soil. West Conshohocken: ASTM International. doi:http://dx.doi.org/10.1520/D5988-12

42 Rudnik, E., & Briassoulis, D. (2011). Degradation behavior of poly (lactic acid) films and fibers in soil under Mediterranean field conditions and laboratory simulations testing. Industrial Crops and Products, 33(3), 648-658 http://dx.doi.org/10.1016/j. indcrop.2010.12.031.

43 Xu, Y., Miladinov, V., & Hanna, M. A. (2004). Synthesis and characterization of starch acetates with high substitution. Cereal Chemistry, 81(6), 735-740. http://dx.doi.org/10.1094/ CCHEM.2004.81.6.735

44 Rendón-Villalobos, R., García-Hernández, E., Güizado-Rodríguez, M., Salgado Delgado, R., & Rangel-Vázquez, N. A. (2010). Obtención y caracterización de almidón de plátano (Musa paradisiaca L.) acetilado a diferentes grados de sustitución. Afinidad, 67(548), 294-300. Retrieved in 2021, April 23, from https://raco.cat/index.php/afinidad/article/view/269205/356773

45 American Society for Testing and Materials – ASTM. (2002). ASTM D882-02: standard test method for tensile properties of thin plastic sheeting. West Conshohocken: ASTM International. http://dx.doi.org/10.1520/D0882-02

46 Kaur, M., Singh, N., Sandhu, K. S., & Guraya, H. S. (2004). Physicochemical, morphological, thermal and rheological properties of starches separated from kernels of some Indian mango cultivars (Mangifera indica L.). Food Chemistry, 85(1), 131-140 http://dx.doi.org/10.1016/j.foodchem.2003.06.013

47 Rodrigues, A. A. M., Santos, L. F., Costa, R. R., Félix, D. T., Nascimento, J. H. B., & Lima, M. A. C. (2020). Characterization of starch from different non-traditional sources and its application as coating in ‘Palmer’ mango fruit. Ciência e Agrotecnologia, 44, e011220 http://dx.doi.org/10.1590/1413-7054202044011220

48 Gutiérrez, C., Rivera, Y., Gómez, R., Bastidas, V., & Izaguirre, C. (2015). Extraction and characterization of fat and starch kernel mango variety Alphonso (Mangifera indica L). Revista de la Facultad de Farmacia, 57(2), 33-42. Retrieved in 2021, April 23, from http://www.saber.ula.ve/handle/123456789/42003

49 Morrison, W. R., & Azudin, M. N. (1987). Variation in the amylose and lipid contents and some physical properties of

Polímeros, 32(3), e2022026, 2022

rice starches. Journal of Cereal Science, 5(1), 35-44 http:// dx.doi.org/10.1016/S0733-5210(87)80007-3

50 Gao, H., Cai, J., Han, W., Huai, H., Chen, Y., & Wei, C. (2014). Comparison of starches isolated from three different Trapa species. Food Hydrocolloids, 37, 174-181 http://dx.doi. org/10.1016/j.foodhyd.2013.11.001

51 Pérez, S., & Bertoft, E. (2010). The molecular structures of starch components and their contribution to the architecture of starch granules: a comprehensive review. Stärke, 62(8), 389-420 http://dx.doi.org/10.1002/star.201000013

52. Zhu, F. (2016). Structure, properties, and applications of aroid starch. Food Hydrocolloids, 52, 378-392 http://dx.doi. org/10.1016/j.foodhyd.2015.06.023

53 Guzmán, O., Lemus, C., Burgarin, J., Bonilla, J., & Ly, J. (2013). Composition and chemical characteristics of mangoes (Mangifera indica L.) for animal feeding in Nayarit, Mexico. Canadian Journal of Agricultural Science, 47(3), 273-277 Retrieved in 2021, April 23, from https://www.cjascience. com/index.php/CJAS/article/view/353

54 Couto, C. C. C., Fo., Silva, J. C., Fo., Neiva, A. P., Jr., Souza, R. M., Nunes, J. A. R., & Coelho, J. V. (2010). Fibrous fractions of mango residue silage with additives. Ciência e Agrotecnologia, 34(3), 751-757 http://dx.doi.org/10.1590/ S1413-70542010000300031

55. Cock, L. S., & León, C. T. (2010). Agro industrial potential of peels of mango (Mangifera indica) Keitt and Tommy Atkins. Acta Agronomica, 64(2), 110-115 http://dx.doi.org/10.15446/ acag.v64n2.43579

56 Balza, M., Garrido, E., García, M., Martínez, J., & García, A. (2017). Chemical characterization of the cellular wall of mango bocado pulp. Revista Agrollanía, 14, 7-13

57. Duan, W., Liu, Z., Liu, P., & Hui, L. (2018). Estimation of acidhydrolyzed cellulose fiber size distribution with exponential and Rosin-Rammler (R-R) laws. BioResources, 13(4), 77927804 http://dx.doi.org/10.15376/biores.13.4.7792-7804

58 Summerscales, J., Dissanayake, N. P. J., Virk, A. S., & Hall, W. (2010). A review of bast fibres and their composition. Part 1. Fibres as reinforcements. Composites. Part A, Applied Science and Manufacturing, 41(10), 1329-1335 http://dx.doi. org/10.1016/j.compositesa.2010.06.001.

59 Musa, A., Ahmad, M. B., Hussein, M. Z., & Izham, S. M. (2017). Acid hydrolysis-mediated preparation of nanocrystalline cellulose from rice straw. International Journal of Nanomaterials, Nanotechnology and Nanomedicine, 3(2), 51-56

60 Sun, J. X., Xu, F., Sun, X. F., Xiao, B., & Sun, R. C. (2005). Physico-chemical and thermal characterization of cellulose from barley straw. Polymer Degradation & Stability, 88(3), 521-531. http://dx.doi.org/10.1016/j.polymdegradstab.2004.12.013

61 Sain, M., & Panthapulakkal, S. (2006). Bioprocess preparation of wheat straw fibres and their characterization. Industrial Crops and Products, 23(1), 1-8 http://dx.doi.org/10.1016/j. indcrop.2005.01.006

62 . Sgriccia, N., Hawley, M. C., & Misra, M. (2008). Characterization of natural fiber surfaces and natural fiber composites. Composites. Part A, Applied Science and Manufacturing, 39(10), 1632-1637 http://dx.doi.org/10.1016/j.compositesa.2008.07.007

63 Heredia-Guerrero, J. A., Benítez, J. J., Domínguez, E., Bayer, I. S., Cingolani, R., Athanassiou, A., & Heredia, A. (2014). Infrared and Raman spectroscopic features of plant cuticles: a review. Frontiers in Plant Science, 5, 305 http://dx.doi. org/10.3389/fpls.2014.00305. PMid:25009549.

64 Yang, H., Yan, R., Chen, H., Lee, D. H., & Zheng, C. (2007). Characteristics of hemicellulose, cellulose and lignin pyrolysis. Fuel, 86(12-13), 1781-1788 http://dx.doi.org/10.1016/j. fuel.2006.12.013

11/12

Rendón-Villalobos, R., Lorenzo-Santiago, M. A., Olvera-Guerra, R., & Trujillo-Hernández, C. A.

65 Cael, J. J., Koenig, J. L., & Blackwell, J. (1973). Infrared and raman spectroscopy of carbohydrates: Part III: raman spectra of the polymorphic forms of amylose. Carbohydrate Research, 29(1), 123-134 http://dx.doi.org/10.1016/S00086215(00)82075-3 PMid:4751262.

66 Kizil , R. , Irudayaraj , J. , & Seetharaman , K. ( 2002 ). Characterization of irradiated starches by using FT-Raman and FTIR spectroscopy. Journal of Agricultural and Food Chemistry, 50(14), 3912-3918 http://dx.doi.org/10.1021/ jf011652p PMid:12083858.

67 Jordan, J., Jacob, K. I., Tannenbaum, R., Sharaf, M. A., & Jasiuk, I. (2005). Experimental trends in polymer nanocomposites: a review. Materials Science and Engineering A, 393(1-2), 1-11 http://dx.doi.org/10.1016/j.msea.2004.09.044.

68 Müller, C. M. O., Laurindo, J. B., & Yamashita, F. (2009). Effect of cellulose fibers on the crystallinity and mechanical properties of starch-based films at different relative humidity values. Carbohydrate Polymers, 77(2), 293-299 http://dx.doi. org/10.1016/j.carbpol.2008.12.030

69. Prachayawarakorn, J., Sangnitidej, P., & Boonpasith, P. (2010). Properties of thermoplastic rice starch composites reinforced by cotton fiber or low-density polyethylene. Carbohydrate Polymers , 81 (2 ), 425 -433 . http://dx.doi.org/10.1016/j. carbpol.2010.02.041

70 Sudharsan, K., Mohan, C. C., Babu, P. A. S., Archana, G., Sabina, K., Sivarajan, M., & Sukumar, M. (2016). Production and characterization of cellulose reinforced starch (CRT) films. International Journal of Biological Macromolecules, 83, 385-395 http://dx.doi.org/10.1016/j.ijbiomac.2015.11.037 PMid:26592701.

71 Nikmatin, S., Syafiuddin, A., Hong Kueh, A. B., & Maddu, A. (2017). Physical, thermal, and mechanical properties of polypropylene composites filled with rattan nanoparticles. Journal of Applied Research and Technology, 15(4), 386-395 http://dx.doi.org/10.1016/j.jart.2017.03.008

72 Chee, C. Y., Song, N. L., Abdullah, L. C., Choong, T. S. Y., Ibrahim, A., & Chantara, T. R. (2012). Characterization of mechanical properties: low-density polyethylene nanocomposite using nanoalumina particle as filler. Journal of Nanomaterials, 2012, 215978 http://dx.doi.org/10.1155/2012/215978

73 Hornung, P. S., Ávila, S., Masisi, K., Malunga, L. N., Lazzarotto, M., Schnitzler, E., Ribani, R. H., & Beta, T. (2018). Green development of biodegradable films based on native yam (Dioscoreaceae) starch mixtures. Stärke, 70(5-6), 1700234 http://dx.doi.org/10.1002/star.201700234

74 Velasquez, D., Pavon-Djavid, G., Chaunier, L., Meddahi-Pellé, A., & Lourdin, D. (2015). Effect of crystallinity and plasticizer on mechanical properties and tissue integration of starch-based materials from two botanical origins. Carbohydrate Polymers, 124, 180-187 http://dx.doi.org/10.1016/j.carbpol.2015.02.006 PMid:25839809.

75. Hirpara, N. J., & Dabhi, M. N. (2021). A review on effect of amylose/amylopectin, lipid and relative humidity on starch based biodegradable films. International Journal of Current Microbiology and Applied Sciences, 10(4), 500-531. http:// dx.doi.org/10.20546/ijcmas.2021.1004.051

76 Ostadi, H., Hakimabadi, S. G., Nabavi, F., Vossoughi, M., & Alemzadeh, I. (2020). Enzymatic and soil burial degradation of corn starch/glycerol/sodium montmorillonite nanocpmposites. Polymers from Renewable Resources, 11(1-2), 15-29 http:// dx.doi.org/10.1177/2041247920952649

77 Zuo, G., Song, X., Chen, F., & Shen, Z. (2019). Physical and structural characterization of edible bilayer films made with zein and corn-wheat starch. Journal of the Saudi Society of Agricultural Sciences, 18(3), 324-331 http://dx.doi.org/10.1016/j. jssas.2017.09.005

78 Kalka, S., Huber, T., Steinberg, J., Baronian, K., Müssig, J., & Staiger, M. P. (2014). Biodegradability of all-cellulose

composite laminates. Composites. Part A, Applied Science and Manufacturing, 59, 37-44 http://dx.doi.org/10.1016/j. compositesa.2013.12.012

79 Arias-Villamizar, C. A., & Vázquez-Morillas, A. (2018). Degradation of conventional and oxodegradable high density polyethylene in tropical aqueous and outdoor environments. Revista Internacional de Contaminación Ambiental, 34(1), 137-147 http://dx.doi.org/10.20937/RICA.2018.34.01.12

80 Meereboer, K. W., Misra, M., & Mohanty, A. K. (2020). Review of recent advances in the biodegradability of polyhydroxyalkanoate (PHA) bioplastic and their composites. Green Chemistry, 22(17), 5519-5558 http://dx.doi.org/10.1039/D0GC01647K

81 Gu, J.-D. (2003). Microbiological deterioration and degradation of synthetic polymeric materials: recent research advances. International Biodeterioration & Biodegradation, 52(2), 69-91 http://dx.doi.org/10.1016/S0964-8305(02)00177-4

82. Ruggero, F., Onderwater, R. C. A., Carretti, E., Roosa, S., Benali, S., Raquez, J.-M., Gori, R., Lubello, C., & Wattiez, R. (2021). Degradation of film and rigid bioplastics during the thermophilic phase and the maturation phase of simulated composting. Journal of Polymers and the Environment, 29(9), 3015-3028 http://dx.doi.org/10.1007/s10924-021-02098-2

83. Folino, A., Karageorgiou, A., Calabrò, P. S., & Komilis, D. (2020). Biodegradation of wasted bioplastics in natural and industrial environments: a review. Sustainability, 12(15), 6030 http://dx.doi.org/10.3390/su12156030.

84 Merchán, J. P., Ballesteros, D., Jiménez, I. C., Medina, J. A., & Álvarez, O. (2009). Estudio de la biodegradación aerobia de almidón termoplástico (TPS). Suplemento de la Revista Latinoamericana de Metalurgia y Materiales , S1(1), 39-44. Retrieved in 2021, April 23, from https://www. researchgate.net/publication/265980575_ESTUDIO_DE_ LA_BIODEGRADACION_AEROBIA_DE_ALMIDON_ TERMOPLASTICO_TPS

85 Chandra, R., & Rustgi, R. (1998). Biodegradable polymers. Progress in Polymer Science, 23(7), 1273-1335 http://dx.doi. org/10.1016/S0079-6700(97)00039-7

86 Maran, J. P., Sivakumar, V., Thirugnanasambandham, K., & Sridhar, R. (2014). Degradation behavior of biocomposites based on cassava starch buried under indoor soil conditions. Carbohydrate Polymers, 101, 20-28 http://dx.doi.org/10.1016/j. carbpol.2013.08.080 PMid:24299744.

87 Torres, F. G., Troncoso, O. P., Torres, C., Díaz, D. A., & Amaya, E. (2011). Biodegradability and mechanical properties of starch films from Andean crops. International Journal of Biological Macromolecules, 48(4), 603-606 http://dx.doi.org/10.1016/j. ijbiomac.2011.01.026 PMid:21300087.

88 Arief, M. D., Mubarak, A. S., & Pujiastuti, D. Y. (2021). The concentration of sorbitol on bioplastic cellulose based carrageenan waste on biodegradability and mechanical properties bioplastic. IOP Conference Series. Earth and Environmental Science, 679(1), 012013 http://dx.doi.org/10.1088/17551315/679/1/012013

89 Jayasekara, R., Harding, I., Bowater, I., Christie, G. B. Y., & Lonergan, G. T. (2003). Biodegradation by composting of surface modified starch and PVA blended films. Journal of Polymers and the Environment, 11(2), 49-56 http://dx.doi. org/10.1023/A:1024219821633

90 Tosin, M., Pischedda, A., & Degli-Innocenti, F. (2019). Biodegradation kinetics in soil of a multi-constituent biodegradable plastic. Polymer Degradation & Stability, 166, 213-218 http:// dx.doi.org/10.1016/j.polymdegradstab.2019.05.034

Received: Apr. 23, 2021

Revised: Mar. 28, 2022

Accepted: Aug. 01, 2022

Polímeros, 32(3), e2022026,

2022 12/12

Polyurethane/single wall carbon nanotube/ polymethylmethacrylate nanocomposite: PM3 semi-empirical method, Monte Carlo applied

Juan Ramon Campos-Cruz1, Norma Aurea Rangel-Vázquez1* , Rosa Elvira Zavala-Arce2  and Edgar Márquez-Brazon3 

1División de Estudios de Posgrado e Investigación, Instituto Tecnológico de Aguascalientes, Aguascalientes, Aguascalientes, México

2División de Estudios de Posgrado e Investigación, Instituto Tecnológico de Toluca, Metepec, Estado do México, México

3Departamento de Química y Biología, Universidad del Norte, Barranquilla, Colombia *norma.rv@aguascalientes.tecnm.mx

Obstract

Firstly, this work shows the crosslinking of the Polyurethane/Single Wall Carbon Nanotube/ Polymethyl Methacrylate (PU/ SWCNT/PMMA) nanocomposite at 298.15K using the PM3 semi-empirical method (Parameterized Model number 3), where the reaction was spontaneous and endothermic. The log P indicated a hydrophobic character. Subsequently, the Monte Carlo simulation was carried out at 303.15, 313.15 and 323.15K, where the Gibbs free energy and the dipole moment increased. However, the reactions were spontaneous and endothermic. The log P had hydrophobic character. Additionally, the entropy decreased due to the increase in intermolecular forces in the nanocomposite. Furthermore, FTIR analysis had similar vibrational frequencies, which was verified with the electronic distribution. Thus, this nanocomposite would have excellent physical and thermal stability, and it does not have reactions to polar solvents such as water so that it could be used in the human body.

Keywords: PU, SWCNT, PMMA, PM3, Monte Carlo.

How to cite: Campos-Cruz, J. R., Rangel-Vázquez, N. A., Zavala-Arce, R. E., & Márquez-Brazon, E. (2022). Polyurethane/single wall carbon nanotube/polymethylmethacrylate nanocomposite: PM3 semi-empirical method, Monte Carlo applied. Polímeros: Ciência e Tecnologia, 32(3), e2022027. https://doi.org/10.1590/0104-1428.20220050

1. Introduction

Carbon nanotubes (CNTs) were discovered in 1991. Structurally, CNTs are graphene sheet rolled, formed by a cylinder of hexagonal rings of carbon atoms[1-2]. There are three types of nanotubes, (1) single wall (SWCNT), these are a graphite sheet rolled like a cylinder and a diameter between 0.5 and 3 nm, (2) double layer (DWCNT), which are constituted by a double layer of graphene sheets with diameters between 1 and 4 nm and, (3) multiple walls (MWCNT), which are concentric cylinders with diameters of 3 to 40 nm[3-5]

CNTs represent one of the most important materials in nanotechnology due to their excellent thermal, physical, chemical, electronic, and mechanical properties[4,6]. Being used for drug delivery systems, biosensors, additives for materials in electronics, optics, the polymer processing industry[7], lithium batteries, cathodes in X-ray equipment, artificial muscles and detection of cancer cells[8]. The various applications of CNTs are attributed to the combination with other materials such as alloys, polymers, fibers or hybrid materials[9]. The introduction of CNTs as reinforcement in a polymer increases the mechanical, electrical, or thermal

properties of the polymer in orders of magnitude well above the efficiency of traditional reinforcements due to a homogeneous dispersion of the CNT and an interfacial adhesion with the polymer[10-12]. Some organic polymers that have been reinforced with nanotubes are polyurethane, polyethylene, polypropylene, poly (methyl methacrylate) and polystyrene[13]

In addition, the SWCNT have been used in adsorption processes for the removal of different contaminants due to the size, diameter and distribution in the structure [14-15]

Polyurethane (PU’s) represent one of the most versatile materials in the world[16]. They are synthesized by polyaddition polymerization through the interaction between polyols and polyisocyanate[17-18]. PU’s contain many urethane groups (–HN–COO–), regardless of the molecular structure[16,19]. An essential characteristic of the PU structure is the microphase separation that arises from the thermodynamic incompatibility between hard and soft segments, so the modification of the PU allows increasing the mechanical properties and thermal stability through the

https://doi.org/10.1590/0104-1428.20220050 O O O O O O O O O O O O O O O
ISSN 1678-5169 (Online) 1/8
Polímeros, 32(3), e2022027, 2022

introduction of an inorganic reinforcement in the PU matrix generating a composite[20]

Composite materials are a combination of specific properties, where the effect of temperature on the diffusion of humidity and environmental ageing represents the main practical repercussion and the influence on solubility, which has established thermodynamic theories.

In recent years, computational simulations using quantum mechanics, molecular dynamics, DFT, and Monte Carlo have been used to analyze the nucleation and growth of SWCNT[21-23]. Computational simulation is an effective area in the energy analysis of small molecules in the gas phase, however, is complicated to determine the mass-energy changes related to infinite structures. Using the technique of grouping the thermochemical properties of various configurations of finite size and extrapolated to an endless length, obtaining global values, for example, that is, there is a comparison of the volume of a specific SWCNT with equal and different chiral vector indices. Therefore, the thermodynamic potentials are obtained. Due to the training of molecular properties at 298K, the PM3 method is helpful in calculating quantities for the important structures[3]

On the other hand, quantitative structure-activity relationships (QSAR) determine the possibility of a relationship between a set of descriptors derived from molecular structure and molecular response; thus, QSAR properties can be considered as a computer-derived rule that describes quantitatively biological activity of chemical descriptors[24]

Monte Carlo simulation allows quantitative study of the effect of temperature on CNT dispersion in a composite material[25-26]. Due to the analysis of the movement of the electron in a random way, where, once an interaction is finished, it is selected by means of another random sample. However, interactions can cause changes in direction, decrease in energy, among others[27]. Although a higher computational cost is required to obtain greater precision in the results[28]

So, the objective was to study, using the PM3 method, the crosslinking of the PU/SWCNT/PMMA nanocomposite. Subsequently, Monte Carlo simulation was used to identify possible changes in the PU/SWCNT/PMMA nanocomposite structure at different temperatures for identifying its possible applications.

2. Materials and Methods

2.1 Computational details

In this study, semi-empirical methods were used to describe the potential energy function of the system. Optimization geometry was calculated using the Hyperchem 8v software on a DELL computer with i7 processor.

PM3 semi-empirical method (Parameterized Model number 3) of quantum mechanics was used applying the conjugate gradient method with the Polak-Ribiere algorithm, 19,000 processing cycles, and an RMS (Root mean square) of 0.001 kcal/(Å-mol) as convergence criteria to obtain the minimum of the potential energy surface (PES) according to the Born-Oppenheimer approximation and the Schrodinger equation[29]

HyperChem software allows to analyze the CNTs[30], and the main physical properties of the PU/SWCNT/PMMA nanocomposite are calculated after Monte Carlo simulation at different temperatures. Thus, the energetic and structural properties were obtained in 20 steps in vacuum mode and varying the temperature.

2.2 Analysis of individual molecules

Geometry optimization is an essential part of computational chemistry. Theoretical research involves calculations of transition structures, heats of formation or vibrational spectra that require searching for one or more minima on a potential energy surface[31]. Figure 1 shows the optimization geometry that determined the location of the atoms in the different molecules[32]

Table 1 shows the energetic properties, where it was observed that the molecules are thermodynamically stable due to a negative Gibbs free energy (ΔG); besides, the SWCNT presented higher ΔG due to the covalent bonds of the sp2 hybridizations[3] Table 1 shows that SWCNT, PU and PMMA presented a slight change in entropy, related to a slight change in the degree of molecular disorder. Besides was related to the reversibility of the processes because when there is a large molecular disorder passing from one state to another, its reversibility decreases due to heat losses towards the surroundings[33]. Moreover, the dipole moment is a fundamental property of molecules due to the formation of covalent bonds[34]. Thus, the dipole moment values for the SWCNT, PU and PMMA were 3.583, 6.308 and 1.649 Debyes, respectively. This difference in values directly depends on the quantity, type of elements and spatial distribution of the bonds.

Figure 1. Optimization geometries of individual molecules where (a) SWCNT; (b) PMMA; and (c) PU, where black color: carbon, red color: oxygen, white color: hydrogen, and blue color: nitrogen atoms, respectively.

Table 1. Energetic properties of individual molecules.

Molecule Gibbs free energy (kcal/mol) Entropy (kcal/mol) Dipolar moment (Debyes-D)

Heat of formation (kcal/mol)

SWCNT – 175599 0.1498 3.583 1822

PU – 95012 0.1631 6.308 – 115

PMMA – 32739 0.0919 1.649 – 106

Polímeros, 32(3), e2022027,

Campos-Cruz, J. R., Rangel-Vázquez, N. A., Zavala-Arce, R. E., & Márquez-Brazon, E.
2022 2/8

PU has electronegative elements such as oxygen and nitrogen; an irregular and asymmetric geometry was obtained, which produced a higher dipole moment. PMMA showed geometry more compact and regular; however, the electronic distribution presented charges smaller partials. Finally, the SWCNT offered a static dipole moment through the structure of the SWCNT; this dipole moment is inversely proportional to the radius of curvature of the SWCNT and is oriented towards the axis of the tube[35]. The partition coefficient (Log P) is a fundamental molecular descriptor that relates to the bioactivity of compounds or substances[36]; a molecule presents hydrophilic character when Log P<0 and is hydrophobic if Log P>0[37]

Table 2 shows that the three molecules presented hydrophobic character, that is, they are not soluble in water or any polar solvent. Table 2 shows the calculated polarizability values, which indicated that the SWCNT presented higher polarizability due to its molecular structure, and therefore, its dipoles are easily distorted due to the charge transport of its structure[38]. Furthermore, highly polarizable molecules have strong attractions with other molecules[24]. Finally, the surface area and volume calculated for the SWCNT indicated the formation of molecular interactions between the SWCNT with the PU and PMMA, due to the presence of active centers that can react and form a crosslinked.

Figure 2 shows the electronic distribution maps of SWCNT, PU and PMMA, respectively. The distribution of molecular charge obtained from the interaction energy between a unit of positive charge and the distribution of molecular- charge was observed without disturbance[39] Figure 2a indicated that the SWCNT presented nucleophilic areas (blue color) at the ends of the molecule, and its electrophilic areas (red color) were located in the central part of the tube, which was obtained due to an asymmetry in the superposition of the p orbital, that is, what brings the p-orbital segments located inside the cavity closer together and separates the outer ones.

Therefore, the Coulomb repulsion within the cavity increased with curvature and generated a redistribution of the p orbitals to orbitals intermediate between sp2 and sp3, resulting in an electronic charge transfer from the concave to the convex region[40-41] Figure 2b-2c show the electrophilic areas around the oxygen atoms, due to tends to gain higher electronic density, mainly a double bond, and nucleophilic zones, which presented a lower electron density around the hydrogen atoms[42].

Table 3 shows the main FTIR vibrations of the SWCNT, PU and PMMA using the PM3method applying a frequency analysis based on the time-independent Schrödinger equation for the stochastic description of the nuclei within the BornOppenheimer approximation[43]. The characteristic vibrations of the SWCNT molecule were found to be in the region of 1827 to 1028 cm–1 due to symmetric and asymmetric stress[44]

Table 3 shows the FTIR vibrations of the PU where, from 3465 to 3491 cm–1 was attributed to the symmetric stretching of the hydroxyl and amino group. A symmetric stretching of the O–H bond was observed at 3491 cm–1, the symmetric stretching of the N–H bond was located in a range of 3465-3449 cm–1, the symmetric stretching of the C–H bond was observed in the range of 3192–2999 and 2926 to 2856 cm–1, from 2035 to 1996 cm–1 corresponded

Polímeros, 32(3), e2022027, 2022

to the symmetric stretching of the carbonyl group (C=O), from 1534 to 1378 cm–1 was attributed to the symmetric stretching of the C-O bond[45]

Finally, Table 3 (the last column) shows the FTIR vibrations of PMMA where the symmetric stretching of the C–H bond was observed from 3155 to 3022 cm–1, the symmetric stretching of the carbonyl group corresponded of 1527 to 1301 cm–1. Finally, the C-O bond was identified from 1365 to 1301 cm–1[46].

Table 2. QSAR properties of individual molecules.

Molecule Log P Polarizability (Å3) Surface area (Å2) Volume (Å3)

SWCNT 9.51 107.63 630.94 1308.53 PU 1.80 33.42 574.71 937.27 PMMA 1.05 10.67 286.91 408.67

Table 3. FTIR vibrations of SWCNT, PU and PMMA, respectively.

Bond Vibration Wavelength (cm-1) SWCNT PU PMMA

O–H Symmetric stretching 3491 N–H Symmetric stretching 3465–3449 C–H Symmetric stretching 3192–2999 C–H Asymmetric stretching 3177–3003 3091–3063 C–H Symmetric stretching 3104–3074 3155–3022 C=O Symmetric stretching 2035–1996 2076 C–C Symmetric stretching 1827–1028 1786–1463 1527–1029 C–C Asymmetric stretching 1792–1749 C–N Symmetric stretching 1704–1615 C–C Asymmetric stretching 1690–1199 1617–1576 1440–1215 C–C Asymmetric stretching 1576–1492 C–O Symmetric stretching 1534–1378 1365–1301

Figure 2. Electronic distribution maps of, (a) SWCNT; (b) PU; and (c) PMMA, where black color: carbon, red color: oxygen, white color: hydrogen and purple color: nitrogen, respectively.

3/8
Polyurethane/single wall carbon nanotube/polymethylmethacrylate nanocomposite: PM3 semi-empirical method, Monte Carlo applied

3. Results and Discussions

3.1 Properties of the PU/SWCNT/PMMA nanocomposite

Figure 3 shows the optimized geometry of the PU/ SWCNT/PMMA nanocomposite where a crosslinking was observed between the carbonyl groups (PU and PMMA) and the carbon atoms of the central part of the SWCNT. The incorporation of SWCNT in polymers allow the manufacture of polymeric matrix compounds, which are characterized by high mechanical performance and excellent functionality[47-48]. Gibbs free energy obtained for the PU/ SWCNT/PMMA nanocomposite was –303323 kcal/mol, that is, there is a spontaneous reaction for the formation of the nanocomposite.

On the other hand, the entropy determined was 0.2826 kcal/ mol, that is, greater than that determined for each molecule; besides, this property indicated a decreased reversibility of the nanocomposite formation process, that is, the more energy is lost with the surroundings, the more difficult it is to return to the initial state. Additionally, the nanocomposite presented a dipole moment of 3.9 D, being lower than the individual molecules; that is, the nanocomposite showed more minor asymmetry of electrical charges in chemical bonds due to the best homogeneous distribution of electronic charges. Finally, the heat of formation of the nanocomposite was 1626 kcal/mol; that is, it is an endothermic reaction.

Liao et al applied molecular simulation determinated that in the absence of the atomic bond between the SWCNTs and the polymeric matrix, then electrostatic forces, van der Waals forces or a change in the coefficient of thermal expansion between the SWCNT and the matrix were present, in addition to the groups functional of the SWCNT increased the compatibility with the polymeric matrix

Table 4 shows the calculated results of the QSAR properties of the nanocomposite. It was observed that the positive Log P indicated a hydrophobic character; that is, there will be no tendency to solubility or miscibility in contact with polar substances. The polarizability obtained for the nanocomposite was 147.6 Å3; this indicated an increase in intermolecular attraction, which influenced in the formation of crosslinking through intermolecular forces such as van der Waals attraction forces.

Figure 4 shows the MESP of the PU/SWCNT/PMMA nanocomposite, where the electron density distribution can be seen. Besides, the crosslinks between PU/SWCNT and SWCNT/PMMA did not present the formation of molecular orbitals that indicated the presence of any chemical type bond (covalent or ionic bond); therefore the union (crosslinking) between these molecules is the physical type, in addition, when the molecules approach each other, the initial contact produces long-range electrostatic forces[41].

Table 5 shows the FTIR vibrations of the PU/SWCNT/ PMMA nanocomposite where, at 1849-1760 and 2058–1755 cm-1, the symmetric stretching of the carbonyl groups were appreciated, the symmetric stretching of the carbonyl groups was appreciated of PU and PMMA, respectively. The symmetric stretching of the C–C bond was observed in the ranges of 1836–1110 and 1673–1019 cm-1. The asymmetric stretching of the C–C bonds corresponded at1729–1130, 1640–1536 and 1367–1023 cm-1. Finally, PU/SWCNT and SWCNT/PMMA crosslinks were observed in the ranges of 1504-1480, 1069-981 and 1069-1043 cm-1 which corresponded to the C-O stretching.

3.2 Analysis of the effect of temperature by Monte Carlo simulation

Monte Carlo simulation is a statistical method used to solve mathematical problems through the generation of random variables. Its main objective is to imitate the behavior of real variables to, as far as possible, analyze or predict how they will evolve. This modeling was used to determine the optimized geometries of the PU/SWCNT/ PMMA nanocomposite at different temperatures (308.15, 310.15 and 313.15K, respectively) as shown in Figure 5 However, there were no significant changes observed in the nanocomposite’s molecular structure, due to the spatial orientation of the atoms and bonds that form the nanocomposite.

Table 6 shows that the Gibbs free energy and heat of formation presented a slight variation concerning the room

Table 4. QSAR properties of PU/SWCNT/PMMA nanocomposite. Log P Polarizability (Å3) Surface area (Å2) Volume (Å3) 12.14 147.6 1018 2229

Figure 3. Optimized PU/SWCNT/PMMA composite geometry where: white color: hydrogen, black color: carbon, red color: oxygen and blue color: nitrogen atoms.

Figure 4. MESP of the PU/SWCNT/PMMA nanocomposite where, white color: hydrogen, black color: carbon, red color: oxygen and blue color: nitrogen atoms. MESP = molecular electrical potential surfaces.

Polímeros, 32(3), e2022027,

Campos-Cruz, J. R., Rangel-Vázquez, N. A., Zavala-Arce, R. E., & Márquez-Brazon, E.
2022 4/8

Table 5. FTIR of PU/SWCNT/PMMA nanocomposite.

Wavelength (cm-1) Vibration Bond (Molecule)

3411

Symmetric stretching O–H (PU)

3440–3400 Symmetric stretching N–H (PU) 3191–3164 Symmetric stretching C–H (PU)

3081–3052, 3042–3009

Asymmetric stretching C–H (PU, PMMA)

temperature (298.15K), being spontaneous and endothermic reactions at these temperatures. On the other hand, the entropy decreased because the structures presented thermodynamic stability attributed to the increase in intermolecular forces by reducing the molecular disorder. Likewise, the dipole moment increased slightly because the electric charge of the dipole moments of the nanocomposites was reorganized due to the orienting effect of the field and temperature.

3157–2976, 3106–3067

Symmetric stretching C–H (PU, PMMA) 2058–1755 Symmetric stretching C=O (PU, PMMA)

1836–1110, 1673–1019

Symmetric stretching C–C (PU, SWCNT, PMMA)

1745–1387 Asymmetric stretching C–C (PU) 1819–1673 Symmetric stretching C–N (PU)

1729–1130, 1640–1536, 1367–1023

Asymmetric stretching C–C (PU, SWCNT, PMMA)

1784–1579 Symmetric stretching C–C (PU) 1675, 1446–1316 Symmetric stretching C–O (PU, PMMA) 1504–1480, 1069–981 Symmetric stretching C–O (PU/SWCNT) 1069–1043 Symmetric stretching C–O (PMMA/ SWCNT)

Table 6. Energetic properties of PU/SWCNT/PMMA nanocomposite determinate by Monte Carlo simulation.

T (K) Gibbs free energy (kcal/mol) Entropy (kcal/mol) Dipolar moment (Debyes)

Table 7 shows the QSAR properties t different temperatures where it was appreciated that there are no noticeable changes in the properties; that is, the difference in temperature will not affect the structure and biological activity of the composite; therefore, the composite will be insoluble in the polar solvent.

Figure 6 shows the electronic and nuclear distribution of the PU/SWCNT/PMMA nanocomposite determined by Monte Carlo simulation at 298.15, 308.15, 310.15 and 313.15K, respectively. Figure 6 showed no changes in the electronic distribution even with the electronic excitation produced by the temperatures; therefore, the PU/SWCNT/PMMA nanocomposite was not affected due to the intermolecular forces of the electrostatic and dipole-dipole type present.

The vibrational frequencies of FTIR at different temperatures are seen in Table 8. After the Monte Carlo simulation, the vibrational and rotational analysis of the nanocomposite was carried out at each of the analysis temperatures to determine if there is any change in absorption frequencies, which would indicate a change in the molecular structure of the nanocomposite since the formation of new bonds caused the displacement towards higher frequency bands

Heat of formation (kcal/mol)

298.15 – 303324 0.2868 3.657 1625 308.15 – 303221 0.0947 5.893 1728 310.15 – 303215 0.0968 5.741 1734 313.15 – 303212 0.0972 5.127 1737

Table 7. QSAR properties of PU/SWCNT/PMMA nanocomposite determinate by Monte Carlo simulation.

T (K) Log P Polarizability (Å3) Surface area (Å2) Volume (Å3)

298.15 12.14 147.51 1017.81 2228.95 308.15 12.14 147.51 1019.61 2239.35 310.15 12.14 147.51 1018.27 2237.64 313.15 12.14 147.51 1018.07 2233.28

Figure 5. Optimized geometry of the PU/SWCNT/PMMA nanocomposite where: white color: hydrogen, black color: carbon, red color: oxygen and blue color: nitrogen atoms.

Polímeros, 32(3), e2022027, 2022

Figure 6. MESP’s of the PU/SWCNT/PMMA nanocomposite: (a) 298.15; (b) 308.15; (c) 310.15; and (d) 313.15K. Where: white: H, black: C, red: O and blue: N atoms.

5/8
Polyurethane/single wall carbon nanotube/polymethylmethacrylate nanocomposite: PM3 semi-empirical method, Monte Carlo applied

Campos-Cruz, J. R., Rangel-Vázquez, N. A., Zavala-Arce, R. E., & Márquez-Brazon, E.

Table 8. Assignment of the FTIR analysis of PU/SWCNT/PMMA nanocomposite by Monte Carlo simulation.

Bond Vibration

O–H

Molecule

Wavelength (cm-1) Temperature (K) 308.15 310.15 313.15

Symmetric stretching PU 3424 3416 3429

N–H Symmetric stretching PU 3432–3394 3427–3408 3436–3391

C–H Symmetric stretching PU 3183–3158 3177–3149 3032–2997

C–H Symmetric and asymmetric stretching PU 3118–3014 3111–3006 3124–2997

C–H Symmetric and asymmetric stretching PMMA 3178–2856 3215–2791 3153–2840

C=O Symmetric stretching PMMA 2066–1724 2047–1653 2061–1748

C=O Symmetric stretching PU 1843–1739 1824–1720 1832–1731

C–C Symmetric stretching PU 1819–1156 1779–1184 1803–1239

C–C Asymmetric stretching PU 1693–1341 1724–1273 1736–1328

C–C Symmetric stretching PMMA 1583–1194 1470–1087 1486–1132

C–N Symmetric stretching PU 1835–1745 1816–1658 1844–1663

C–C

C–C

Asymmetric stretching PU 1664–1489 1538–1463 1632–1443

Asymmetric stretching SWCNT 1707–1218 1739–1263 1725–1246

C–C Asymmetric stretching PMMA 1428–1045 1367–1103 1379–1031

C–C

Symmetric stretching PU 1761–1483 1820–1517 1753–1456

C–O Symmetric stretching PU 1410–1368 1439–1319 1446–1277

C–O

Symmetric stretching PMMA 1612 1634 1618

C–O Symmetric stretching PU/SWCNT 1146–967 1128–1042 1084–976

C–O Symmetric stretching PMMA/SWCNT 1083–1010 1114–972 1073–986

as well as the weakening of present bonds to produce band displacements towards lower frequencies[46-48].

4. Conclusions

The SWCNT surface allowed the PU/SWCNT/PMMA crosslinking due to an increase of Van der Waals forces and pi-pi interactions; besides, the adsorption processes were spontaneous and endothermic. QSAR properties indicated a hydrophobic PU/SWCNT/PMMA nanocomposite. FTIR analysis determinate that the crosslink PU/SWCNT and SWCNT/PMMA was due to symmetric stretching of the carboxylic group of the PU and PMMA, respectively.

Monte Carlo simulation indicated that the optimized PU/SWCNT/PMMA nanocomposite geometry was very similar at several temperatures due to the Gibbs free energy had a slight variation, but the reaction was spontaneous and endothermic. Dipole moment increased due to a new orientation of bonds.

Log P showed that the nanocomposite was insoluble in a polar solvent. Finally, FTIR analysis didn’t show changes in the absorption frequencies.

5. Author’s Contribution

• Conceptualization – Juan Ramon Campos-Cruz; Norma Aurea Rangel-Vázquez; Rosa Elvira Zavala-Arce.

• Data curation – Juan Ramon Campos-Cruz; Norma Aurea Rangel-Vázquez; Rosa Elvira Zavala-Arce.

• Formal analysis – Juan Ramon Campos-Cruz; Norma Aurea Rangel-Vázquez; Rosa Elvira Zavala-Arce.

• Funding acquisition – Juan Ramon Campos-Cruz; Norma Aurea Rangel-Vázquez; Rosa Elvira Zavala-Arce.

• Investigation – Juan Ramon Campos-Cruz; Norma Aurea Rangel-Vázquez; Rosa Elvira Zavala-Arce.

• Methodology – Juan Ramon Campos-Cruz; Norma Aurea Rangel-Vázquez; Rosa Elvira Zavala-Arce; Edgar Marquez-Brazón.

• Project administration – Juan Ramon Campos-Cruz; Norma Aurea Rangel-Vázquez; Rosa Elvira Zavala-Arce.

• Resources – Juan Ramon Campos-Cruz; Norma Aurea Rangel-Vázquez; Rosa Elvira Zavala-Arce.

• Software – Juan Ramon Campos-Cruz; Norma Aurea Rangel-Vázquez; Rosa Elvira Zavala-Arce; Edgar MarquezBrazón.

• Supervision – Juan Ramon Campos-Cruz; Norma Aurea Rangel-Vázquez; Rosa Elvira Zavala-Arce.

• Validation – Juan Ramon Campos-Cruz; Norma Aurea Rangel-Vázquez; Rosa Elvira Zavala-Arce.

• Visualization – Juan Ramon Campos-Cruz; Norma Aurea Rangel-Vázquez; Rosa Elvira Zavala-Arce; Edgar Marquez-Brazón.

• Writing – original draft – Juan Ramon Campos-Cruz; Norma Aurea Rangel-Vázquez; Rosa Elvira Zavala-Arce; Edgar Marquez-Brazón.

• Writing – review & editing – Juan Ramon Campos-Cruz; Norma Aurea Rangel-Vázquez; Rosa Elvira Zavala-Arce.

6. Acknowledgements

The authors declare that we have no known competing financial interests or personal relationships that could have appeared to influence the work reported in this paper.

7. References

1 Page, A. J., Ohta, Y., Irle, S., & Morokuma, K. (2010).

Mechanisms of single-walled carbon nanotube nucleation, growth, and healing determined using QM/MD methods.

Polímeros, 32(3), e2022027,

2022 6/8

Polyurethane/single wall carbon nanotube/polymethylmethacrylate nanocomposite: PM3 semi-empirical method, Monte Carlo applied

Accounts of Chemical Research, 43(10), 1375-1385 http:// dx.doi.org/10.1021/ar100064g PMid:20954752.

2 Padilla-Espinosa, I. M., Espinosa-Durán, J. M., & VelascoMedina, J. (2012). Mecánica molecular estructural para el cálculo del módulo de Young y los modos de vibración de nanotubos de carbono. Ingeniería y Competitividad, 14(1), 91-105 http://dx.doi.org/10.25100/iyc.v14i1.2641

3 Rodriguez, K. R., Malone, M. A., Nanney, W. A., Maddux, C. J. A., Coe, J. V., & Martínez, H. L. (2014). Generalizing thermodynamic properties of bulk single-walled carbon nanotubes. AIP Advances , 4 (12), 127149 http://dx.doi. org/10.1063/1.4905263 PMid:25874156.

4 Díez-Pascual, A. M. (2021). Chemical functionalization of carbon nanotubes with polymers: a brief overview. Macromol, 1(2), 64-83. http://dx.doi.org/10.3390/macromol1020006.

5 Mallakpour, S., & Rashidimoghadam, S. (2019). Carbon nanotubes for dyes removal. In G. Z. Kyzas & A. C. Mitropoulos (Eds.), Composite nanoadsorbents (pp. 211-243). Amsterdam: Elsevier http://dx.doi.org/10.1016/B978-0-12-814132-8.000101

6 Lima, A. M. F., Castro, V. G., Borges, R. S., & Silva, G. G. (2012). Electrical conductivity and thermal properties of functionalized carbon nanotubes/polyurethane composites. Polímeros: Ciência e Tecnologia, 22(2), 117-124. http://dx.doi. org/10.1590/S0104-14282012005000017

7 He, H., Pham-Huy, L. A., Dramou, P., Xiao, D., Zuo, P., & PhamHuy, C. (2013). Carbon nanotubes: applications in pharmacy and medicine. BioMed Research International, 2013, 578290 http://dx.doi.org/10.1155/2013/578290 PMid:24195076.

8 Reilly, R. M. (2007). Carbon nanotubes: potential benefits and risks of nanotechnology in nuclear medicine. Journal of Nuclear Medicine, 48(7), 1039-1042. http://dx.doi.org/10.2967/ jnumed.107.041723. PMid:17607037.

9 Khan, W., Sharma, R., & Saini, P. (2016). Carbon nanotube-based polymer composites: synthesis, properties and applications. In M. Berber & I. H. Hafez (Eds.), Carbon nanotubes - current progress of their polymer composites (pp. 1-47). London: IntechOpen http://dx.doi.org/10.5772/62497

10 Wang, T.-L., Yu, C.-C., Yang, C.-H., Shieh, Y.-T., Tsai, Y.-Z., & Wang, N.-F. (2011). Preparation, characterization, and properties of polyurethane-grafted multiwalled carbon nanotubes and derived polyurethane nanocomposites. Journal of Nanomaterials, 2011, 814903 http://dx.doi.org/10.1155/2011/814903

11 Chen, W., Tao, X., & Liu, Y. (2006). Carbon nanotube-reinforced polyurethane composite fibers. Composites Science and Technology, 66(15), 3029-3034 http://dx.doi.org/10.1016/j. compscitech.2006.01.024

12 Sattar, R., Kausar, A., & Siddiq, M. (2015). Advances in thermoplastic polyurethane composites reinforced with carbon nanotubes and carbon nanofibers: a review. Journal of Plastic Film & Sheeting, 31(2), 186-224. http://dx.doi. org/10.1177/8756087914535126

13 Kalakonda, P., & Banne, S. (2017). Thermomechanical properties of PMMA and modified SWCNT composites. Nanotechnology, Science and Applications, 10, 45-52 http:// dx.doi.org/10.2147/NSA.S123734 PMid:28223784.

14 Mykhailenko, O. V., Hui, D., Strzhemechny, Y. M., Matsui, D., Prylutskyy, Y. I., & Eklund, P. (2007). Monte Carlo simulations for carbon nanotubes intercalated with different atomic species. Journal of Computational and Theoretical Nanoscience, 4(6), 1140-1143 http://dx.doi.org/10.1166/jctn.2007.2389

15 Darkrim, F., & Levesque, D. (1998). Monte Carlo simulations of hydrogen adsorption in single-walled carbon nanotubes. The Journal of Chemical Physics, 109(12), 4981-4984 http:// dx.doi.org/10.1063/1.477109

Polímeros, 32(3), e2022027, 2022

16 Zia, K. M., Bhatti, H. N., & Bhatti, I. A. (2007). Methods for polyurethane and polyurethane composites, recycling and recovery: a review. Reactive & Functional Polymers, 67(8), 675692 http://dx.doi.org/10.1016/j.reactfunctpolym.2007.05.004

17 Alma, M. H., Basturk, M. A., & Digrak, M. (2003). New polyurethane-type rigid foams from liquified wood powders. Journal of Materials Science Letters, 22(17), 1225-1228. http:// dx.doi.org/10.1023/A:1025356702660.

18 Wohlleben, W., Meier, M. W., Vogel, S., Landsiedel, R., Cox, G., Hirth, S., & Tomović, Ž. (2013). Elastic CNT–polyurethane nanocomposite: synthesis, performance and assessment of fragments released during use. Nanoscale, 5(1), 369-380 http://dx.doi.org/10.1039/C2NR32711B PMid:23172121.

19 Xia, H., & Song, M. (2005). Preparation and characterization of polyurethane–carbon nanotube composites. Soft Matter, 1(5), 386-394 http://dx.doi.org/10.1039/b509038e PMid:32646106.

20 Ali, A., Yusoh, K., & Hasany, S. F. (2014). Synthesis and physicochemical behaviour of polyurethane-multiwalled carbon nanotubes nanocomposites based on renewable castor oil polyols. Journal of Nanomaterials, 2014, 564384. http:// dx.doi.org/10.1155/2014/564384

21 Lobo, L. S., & Carabineiro, S. A. C. (2020). Mechanisms of carbon nanotubes and graphene growth: kinetics versus thermodynamics. C Journal of Carbon Research, 6(4), 67 http://dx.doi.org/10.3390/c6040067

22 Kato, Y., Inoue, A., Niidome, Y., & Nakashima, N. (2012). Thermodynamics on soluble carbon nanotubes: how do DNA molecules replace surfactants on carbon nanotubes? Scientific Reports, 2(1), 733 http://dx.doi.org/10.1038/srep00733 PMid:23066502.

23. Sankar, R. M., Meera, K. S., Mandal, A. B., & Jaisankar, S. N. (2013). Thermoplastic polyurethane/single-walled carbon nanotube composites with low electrical resistance surfaces. High Performance Polymers, 25(2), 135-146 http://dx.doi. org/10.1177/0954008312459545

24 Melkemi , N. , & Belaidi , S. (2014 ). Structure-property relationships and quantitative structure-activity relationship modeling of detoxication properties of some 1,2-dithiole-3thione derivatives. Journal of Computational and Theoretical Nanoscience, 11(3), 801-806 http://dx.doi.org/10.1166/ jctn.2014.3431

25 Haghgoo, M., Ansari, R., Hassanzadeh-Aghdam, M. K., & Nankali, M. (2022). A novel temperature-dependent percolation model for the electrical conductivity and piezoresistive sensitivity of carbon nanotube-filled nanocomposites. Acta Materialia, 230, 117870. http://dx.doi.org/10.1016/j.actamat.2022.117870.

26 Zhu, W., Börjesson, A., & Bolton, K. (2010). DFT and tight binding Monte Carlo calculations related to single-walled carbon nanotube nucleation and growth. Carbon, 48(2), 470478 http://dx.doi.org/10.1016/j.carbon.2009.09.064

27 Paro, A. D., Hossain, M., Webster, T. J., & Su, M. (2016). Monte Carlo and analytic simulations in nanoparticle-enhanced radiation therapy. International Journal of Nanomedicine, 11 , 4735-4741 http://dx.doi.org/10.2147/IJN.S114025 PMid:27695329.

28. Hasan, S., Guo, J., Vaidyanathan, M., Alam, M. A., & Lundstrom, M. (2004). Monte Carlo simulation of carbono nanotube devices. Journal of Computational Electronics, 3(3-4), 333-336. http:// dx.doi.org/10.1007/s10825-004-7071-8

29 Souza, E. S., Zaramello, L., Kuhnen, C. A., Junkes, B. S., Yunes, R. A., & Heinzen, V. E. F. (2011). Estimating the octanol/ water partition coefficient for aliphatic organic compounds using semi-empirical electrotopological index. International Journal of Molecular Sciences, 12(10), 7250-7264 http:// dx.doi.org/10.3390/ijms12107250 PMid:22072945.

7/8

Campos-Cruz, J. R., Rangel-Vázquez, N. A., Zavala-Arce, R. E., & Márquez-Brazon, E.

30 Monajjemi , M., Falahati , M., & Mollaamin , F. (2013 ). Computational investigation on alcohol nanosensors in combination with carbon nanotube: a Monte Carlo and ab initio simulation. Ionics, 19(1), 155-164 http://dx.doi.org/10.1007/ s11581-012-0708-x

31 . Li, X., & Frisch, M. J. (2006). Energy-represented direct inversion in the iterative subspace within a hybrid geometry optimization method. Journal of Chemical Theory and Computation, 2(3), 835-839 http://dx.doi.org/10.1021/ct050275a PMid:26626690.

32 Schlegel, H. B. (2011). Geometry optimization. WIREs Computational Molecular Science, 1(5), 790-809 http://dx.doi. org/10.1002/wcms.34

33 Smith, J. M., Van Ness, H. C., & Abbott, M. M. (1997). Introducción a la termodinamica en ingeniería química Ciudad de México: McGraw-Hill Interamericana Editores, S.A. de C.V.

34 Gubskaya, A. V., & Kusalik, P. G. (2002). The total molecular dipole moment for liquid water. The Journal of Chemical Physics, 117(11), 5290-5302 http://dx.doi.org/10.1063/1.1501122

35 Zimmerli, U., Gonnet, P. G., Walther, J. H., & Koumoutsakos, P. (2005). Curvature induced L-defects in water conduction in carbon nanotubes. Nano Letters, 5(6), 1017-1022 http:// dx.doi.org/10.1021/nl0503126. PMid:15943435.

36 Benfenati, E., Gini, G., Piclin, N., Roncaglioni, A., & Vari, M. R. (2003). Predicting logP of pesticides using different software. Chemosphere, 53(9), 1155-1164. http://dx.doi. org/10.1016/S0045-6535(03)00609-X PMid:14512120.

37 Sawant, P. D., Luu, D., Ye, R., & Buchta, R. (2010). Drug release from hydroethanolic gels. Effect of drug’s lipophilicity (log P), polymer–drug interactions and solvent lipophilicity. International Journal of Pharmaceutics, 396(1-2), 45-52 http:// dx.doi.org/10.1016/j.ijpharm.2010.06.008 PMid:20540996.

38 Torrens , F. ( 2004 ). Effect of size and deformation on polarizabilities of carbon nanotubes from atomic increments. Future Generation Computer Systems, 20(5), 763-772 http:// dx.doi.org/10.1016/j.future.2003.11.017.

39 Cruciani, G., Crivori, P., Carrupt, P.-A., & Testa, B. (2000). Molecular fields in quantitative structure–permeation relationships: The VolSurf approach. Journal of Molecular Structure: THEOCHEM , 503(1-2), 17-30 http://dx.doi. org/10.1016/S0166-1280(99)00360-7

40 Dumitrică, T., Landis, C. M., & Yakobson, B. I. (2002). Curvature-induced polarization in carbon nanoshells. Chemical

Physics Letters, 360(1-2), 182-188 http://dx.doi.org/10.1016/ S0009-2614(02)00820-5

41 Chen, S.-Y., Hui, Y., & Yang, Y.-B. (2020). Monte Carlo simulations of adsorption and separation of binary mixtures of CO2, SO2, and H2S by charged single-walled carbon nanotubes. Soft Materials, 18(2-3), 262-273 http://dx.doi.org/10.1080/1 539445X.2020.1729806

42 Cong, Y., & Yang, Z.-Z. (2000). General atom-bond electronegativity equalization method and its application in prediction of charge distributions in polypeptide. Chemical Physics Letters, 316(3-4), 324-329 http://dx.doi.org/10.1016/S0009-2614(99)01289-0

43 Neugebauer, J., Reiher, M., Kind, C., & Hess, B. A. (2002). Quantum chemical calculation of vibrational spectra of large molecules: raman and IR Spectra for buckminster fullerene. Journal of Computational Chemistry, 23(9), 895-910 http:// dx.doi.org/10.1002/jcc.10089 PMid:11984851.

44 Branca, C., Frusteri, F., Magazù, V., & Mangione, A. (2004). Characterization of carbon nanotubes by TEM and infrared spectroscopy. The Journal of Physical Chemistry B, 108(11), 3469-3473 http://dx.doi.org/10.1021/jp0372183

45 Mondal, S., Memmott, P., Wallis, L., & Martin, D. (2012). Physico-thermal properties of spinifex resin bio-polymer. Materials Chemistry and Physics, 133(2-3), 692-699 http:// dx.doi.org/10.1016/j.matchemphys.2012.01.058.

46 Ramesh, S., Leen, K. H., Kumutha, K., & Arof, A. K. (2007). FTIR studies of PVC/PMMA blend based polymer electrolytes. Spectrochimica Acta. Part A: Molecular and Biomolecular Spectroscopy, 66(4-5), 1237-1242 http://dx.doi.org/10.1016/j. saa.2006.06.012 PMid:16919998.

47 Wang, X., Jiang, M., Zhou, Z., Gou, J., & Hui, D. (2017). 3D printing of polymer matrix composites: a review and prospective. Composites. Part B, Engineering, 110, 442-458 http://dx.doi.org/10.1016/j.compositesb.2016.11.034.

48 Cesteros-Iturbe, L. C. (2004). Aplicaciones de la FTIR al estudio de las interacciones polímero-polímero. Revista Iberoamericana de Polímeros, 5(3), 111-132. Retrieved in 2022, September 25, from https://reviberpol.files.wordpress. com/2019/08/2004-cesteros.pdf

Received: May 16, 2022

Revised: Aug. 29, 2022

Accepted: Sept. 25, 2022

Polímeros, 32(3), e2022027,

2022 8/8

Release of oregano essential oil from PHBV films in simulated food conditionsa

Renata Cerruti da Costa1 , Ana Paula Ineichen2 , Cristiano da Silva Teixeira2 , Ismael Casagrande Bellettini2  and Larissa Nardini Carli2* 

1Centro Tecnológico, Universidade Federal de Santa Catarina, Florianópolis, SC, Brasil

2Centro Tecnológico, de Ciências Exatas e Educação, Universidade Federal de Santa Catarina, Blumenau, SC, Brasil

aThis paper has been partially presented at the 16th Brazilian Polymer Congress, held on-line, 24-28/Oct/2021. *larissa.carli@ufsc.br

Obstract

Poly(hydroxybutyrate-co-hydroxyvalerate) – PHBV plays an important role in sustainability and food safety. In this work, active packaging with antimicrobial properties was analyzed for the controlled release of active compound in three environments (acidic aqueous foods, fresh foods, and fatty foods). The compositions were produced with the addition of sepiolite nanoparticles (Sep) and oregano essential oil (OEO). The GC-MS analysis detected the presence of 3-methyl4-isopropyl phenol as the primary constituent of the OEO (71.7%). The characterization of the films by FTIR and SEM confirmed the presence of additives, and the quantification of OEO and thermal stability of the nanocomposites was verified by TGA. Four kinetic models were used to analyze the release profile. Our findings indicate that it is possible to adjust the kinetic release of the OEO by varying the composition of the films, which is a promising alternative for producing an antibacterial biomaterial for application in food packaging.

Keywords: biodegradable polymer, controlled release, food packaging, polymer nanocomposites, oregano essential oil.

How to cite: Costa, R. C., Ineichen, A. P., Teixeira, C. S., Bellettini, I. C., & Carli, L. N. (2022). Release of oregano essential oil from PHBV films in simulated food conditions. Polímeros: Ciência e Tecnologia, 32(3), e2022028. https://doi.org/10.1590/0104-1428.20220060

1. Introduction

The demand for plastic packaging has been increasing considerably in the last few years, aiming at the food security associated with epidemiological outbreaks and the control of the internal environment of packaging material, thus increasing the shelf life of food. In this scenario, active and biodegradable packaging development arises as a promising strategy for application in ready-to-eat and fresh foods[1] These packages have as their main characteristics the use of an antimicrobial agent in the packaging material, as well as excellent degradation capacity under proper disposal[2-4]

Essential oils (EO) are highlighted in several active packaging researches due to their plasticizing effect[2] and excellent antimicrobial properties[5]. Regarding the degradation capacity, poly(hydroxybutyrate-co-hydroxyvalerate) – PHBV is a bacterial polyester from the polyhydroxyalkanoates family, known to be 100% biodegradable. This biopolymer has physical properties comparable to other thermoplastic materials, which allows its use in several areas, such as biomedical[6,7] and industrial applications[2,4,8]. Some drawbacks such as thermal stability, gas permeability, and brittleness might be overcome by incorporating additives[9,10] One strategy might be the incorporation of clay nanoparticles, which results in the formation of a barrier to the permeation of gaseous molecules responsible for the loss of texture,

color, and odor of food[2], besides being an alternative to control the release of antimicrobial agents.

The development of films for application in food packaging must strongly consider the type of food with which the polymeric material will come into contact since each food has specific polarity, acidity, and humidity conditions. Commission Regulation (EU) No. 10/2011[11] establishes normative conditions for simulation studies for application in food. For example, the food simulator based on 10% ethanol (v/v) should be used for hydrophilic foods. A 3% acetic acid (w/v) medium is used for food with a hydrophilic nature and a pH below 4.5, while a vegetable oil medium such as isooctane may be used for greasy foods[4]. Thus, the application of this normative allows the evaluation of the release of active compounds over time and the combined effect of the antimicrobial with nanoparticles, which might act as a barrier in PHBV films.

The diffusion kinetics of an active compound to a medium might be affected by the type and thickness of the polymer, as well as by the nature and initial concentration of additives in it, the type of surrounding medium, the time-temperature conditions of contact[7], and, particularly in the case of food packaging, by the method of food processing and preservation. As a low molecular weight

https://doi.org/10.1590/0104-1428.20220060 O O O O O O O O O O O O O O O Polímeros, 32(3),
2022 ISSN 1678-5169 (Online) 1/8
e2022028,

Costa, R. C., Ineichen, A. P., Teixeira, C. S., Bellettini, I. C., & Carli, L. N.

compound of lipophilic nature, essential oils tend to migrate into packaged foods, mainly those with high fat content[12] Therefore, the release kinetics of active compounds into the food throughout its storage time is a decisive factor in guaranteeing antimicrobial effectiveness and food safety[13]

In this context, this work investigates the release of the active antimicrobial compound in different food simulating media of PHBV films modified with sepiolite nanoparticles and oregano essential oil. Developing these systems is a promising way to produce functional biodegradable materials for application in active packaging.

2. Materials and Methods

2.1 Materials

The PHBV was supplied by Ningbo Tianan Biologic Material Co., Ltd. (ENMAT Y 1000) with a viscosimetric molecular weight of 450,000 g mol-1 and a valerate content of 3.4 mol%[2]. The oregano essential oil (OEO) and sepiolite clay (Sep) were obtained from Sigma Aldrich. The acetic acid, ethanol, and isooctane (Vetec) were of analytical grade.

2.2 Melt processing and film production

The polymer and clay were previously dried in an air circulation oven at 80 ºC for 4 h. The PHBV, PHBV/Sep, PHBV/OEO, and PHBV/Sep/OEO compositions were prepared. For each formulation, 3 wt% of clay and 8 wt% of OEO were used. The PHBV nanocomposite films were prepared by melt processing using a Roller-Rotors R600, Rheomix 6002C mixer at 170 ºC and 165 ºC (for the compositions without and with OEO, respectively) at 100 rpm for 6 min[2]. The obtained compounds were then milled in a knife mill (SL-32 Solab Equipamentos) and compression molded at 190 ºC for 2 min and 1 ton in an electrically-heated hydraulic press (SL-11 Solab Equipamentos). All compression molded films showed a homogeneous surface, with an average diameter of 15 cm ± 1 cm and an average thickness of 0.23 mm ± 0.03 mm.

2.3 Characterization of the OEO and PHBV compositions

The OEO composition was evaluated by gas chromatographymass spectrometry (GC-MS) in Agilent CG 7890A/Agilent 5975C equipment. An ionization voltage of 70 eV and mass ranging from 50 m/z to 300 m/z were used. Helium was used as the carrier gas at a flow rate of 1.0 mL min-1 The injector temperature was adjusted from 40 ºC to 145 ºC at 3 °C min-1, then heated again to 280 ºC at 10 ºC min-1

The morphology of the nanocomposites was examined by scanning electron microscopy (SEM) using JEOL JSM6390LV equipment at 15 kV. The samples were fractured by immersion in liquid nitrogen and covered by a thin layer of gold. The thermal stability of the films was analyzed by thermogravimetric analysis (TGA) in PerkinElmer TGA 8000 equipment, in the range from 30 °C to 700 ºC at a heating rate of 20 ºC min-1 under an argon atmosphere (20 mL min-1). The incorporation efficiency (IE) of OEO in the films after processing was determined by Equation 1, where VO is the volatilized oil up to 270 °C and TO is the theoretical oil content.

( ) %100 O O

V IE T = (1)

2.4 OEO release tests and kinetic studies

In order to study different food simulation environments, three immersion solutions were used: (a) 10% ethanol (v/v), (b) 3% acetic acid (w/v), and (c) isooctane. For the OEO release tests, 150 mg of each film composition were immersed in 30 mL of each medium. The system was maintained under continuous stirring in a MK1210 – TR orbital shaker at 24 ºC for 72 h, and aliquots of 2 mL were collected periodically. The amount of OEO released was analyzed by UV spectrophotometry in Shimadzu UV-1800 equipment at 272 nm. For the determination of the OEO release (%), the measured OEO concentration in each formulation from the results obtained in the TGA analysis was considered (Table 1). The experiments were performed in triplicate, and the average and standard deviation were calculated.

The OEO release data in the different food simulating media were computed using DDSolver, a MS-Excel extension plug-in written in Visual Basic for Applications, and the resulting data were fitted to different kinetic models[14] The models available in DDSolver and applied to the experimental data were the first-order, Higuchi, KorsmeyerPeppas, and Peppas-Sahlin models[15]

3. Results and Discussions

3.1 Chemical composition of the OEO

The OEO was analyzed according to GC-MS to verify the chemical structures of the major components of the oil. The chromatogram indicated that 71.7% of the composition refers to 3-methyl-4-isopropyl phenol. It was also possible to notice the presence of benzene (14.9%) Table 1.

PHBV/Sep/OEO 170 273 317 4.9 61 2.7 Tdoil: volatilization temperature of the oil; T5%: initial decomposition temperature (5% of degradation); Tdmax: maximum degradation rate temperature.

Polímeros, 32(3), e2022028,

2022 2/8
Degradation temperatures
incorporation efficiency of additives
T5% (ºC) Td max (ºC) OEO content (%) IE (%) Clay content (%)
and
after processing. Sample Tdoil (ºC)
PHBV - 284 307 - - -
PHBV/Sep - 297 319 - - 2.8
PHBV/OEO 159 267 311 4.9 62 -

and terpinene (6.9%) in lower quantities. Although most studies indicate the prominent presence of carvacrol or thymol in the composition of oregano oil, it depends on where the plants were cultivated, the mechanism of its extraction, and the region of extraction of the oil[16] It has been proven that 3-methyl-4-isopropyl phenol has antimicrobial characteristics, being marketed as Biosol®, an active compound with antiseptic properties used mainly in pharmaceutical and personal care products[17].

3.2 Morphology

The morphology of the clay nanoparticles was analyzed by SEM. This needle-shaped nanoparticle (as seen at 1000× magnification and made evident at higher magnifications – 5000× – Figure 1a-1b) has a high specific surface area due to the presence of longitudinal tunnels[18], allowing a small amount of Sep to alter specific properties of interest in PHBV films significantly. Although the reduced size of Sep might also result in some agglomeration in the nanocomposite formation, it was decided not to organically modify its surface to understand the behavior of the filler on the materials used and to produce a solvent-free film for application in food.

The morphology of the fractured surface of PHBV films (cross-section, 1000× magnification) and the distribution of Sep nanoparticles in the polymer matrix were also analyzed. The smooth surface of PHBV – typical of a brittle fracture – has been changed to a rougher surface due to the plasticizing effect of the essential oil. The good distribution of Sep nanoparticles in the polymer matrix is also worth noting. The presence of nanoparticles and their homogeneous distribution might influence the release characteristics of the OEO, as will be discussed. This good dispersion of Sep might be associated with the affinity between the components and the interactions between the hydroxyl groups on the Sep surface, the ester bonds of the PHBV chain, and the phenol group of 3-methyl-4-isopropyl phenol, the primary component of OEO.

3.3 Thermal properties and quantification of additives

The thermogravimetric results (Figure 2) revealed that the thermal decomposition of OEO starts at around 80 ºC, with a maximum mass loss at about 198 ºC. Above 260 ºC, all the oil present in the compositions had already been volatilized (DTG shown in the inset of Figure 2), and the degradation behavior follows the expected for PHBV films[19]. For PHBV, only one mass loss is observed in the range of 285 °C to 319 ºC associated with the degradation of the polymeric matrix.

In the TGA curve of compositions PHBV/OEO and PHBV/Sep/OEO, a mass loss was observed related to the volatilization of oregano essential oil in the initial stages of the analysis. This behavior does not compromise the application of interest, being fundamental for quantifying the OEO in the produced films.

The incorporation efficiency of the OEO was considered satisfactory, reaching 62% for the PHBV/OEO and 61% for the PHBV/Sep/OEO films (Table 1). The partial volatilization of OEO during the melt processing (165 °C) and compression molding (190 °C) of the films was expected due to the high temperature used and the time of exposure of the materials to this condition. The incorporation of Sep promoted an increase in the volatilization temperature of the oil (from 159 °C to 170 °C for PHBV/OEO and PHBV/Sep/OEO, respectively) and in the temperature of the maximum degradation rate of the polymer (from 311 °C for pure PHBV to 319 °C for PHBV/ Sep). Even in the presence of OEO, this high degradation temperature was maintained (317 °C for PHBV/Sep/OEO), indicating that the incorporation of OEO did not affect the thermal stability of the polymer. Considering the theoretical clay content (3 wt%), one may also observe that the formulations maintained approximately the same percentage of inorganic filler, indicating minimal material loss during processing.

3.4 OEO release tests

Considering a real application in food packaging, the release of OEO must occur gradually so that the antimicrobial

Release of oregano essential oil from PHBV films in simulated food conditions
3/8
Polímeros, 32(3), e2022028, 2022
Figure 1. SEM of (a); and (b) sepiolite; and the films (c) PHBV; (d) PHBV/Sep; (e) PHBV/OEO; and (f) PHBV/Sep/OEO.

Costa, R. C., Ineichen, A. P., Teixeira, C. S., Bellettini, I. C., & Carli, L. N.

Figure 2. TGA curve of pure PHBV, OEO, and PHBV nanocomposites.

additive may remain active in the food for longer, preventing the growth of pathogenic microorganisms. If the release of the active compound occurs instantly, a minimal inhibitory concentration is not sustained for long periods. If the release is tardy, a minimum concentration in the early stages may not be achieved, and food spoilage is not controlled[20]. The OEO release was evaluated in different media in the absence or presence of sepiolite, and all compositions showed a gradual release of OEO (Figure 3).

Regarding the different food simulants, a trend was observed of a more considerable release of OEO with the decrease in the hydrophilicity of the simulant medium (isooctane > 10% ethanol > 3% acetic acid). This behavior was expected since the phenolic compounds present in the essential oil have more affinity to fatty foods.

The incorporation of Sep affected the diffusion of the OEO depending on the simulant. A similar trend was observed in the isooctane and 10% ethanol media: the percentage of OEO released was higher in the presence of fillers. Although studies have reported that the presence of nanoparticles may act as a physical barrier to the release of additives[8], in our study, a synergistic effect between the components allowed the essential oil to migrate easily toward the simulants. The presence of oil improved clay dispersion while the addition of clay at low levels improved the interaction between the components and distribution of OEO within the film. The combination of both resulted in a less crystalline composition[2] with a higher diffusion rate.

The migration of a substance from the packaging into the surrounding medium is a mass transfer phenomenon that depends on thermodynamics and kinetics aspects, such as the partition of the substance between the polymer and the food phase at equilibrium (depending on the polarity and solubility of the substances), and the diffusion of the substance into the polymer and the food phase, respectively[12] The partition coefficient (KP/L) is a parameter that may be used to evaluate the essential oil distribution in the polymer or the simulant. It takes into account the Hildebrand solubility parameter (δ) of the substances and may be determined by Equation 2, where KP/L is the partition coefficient, Δδ is the difference in the solubility parameter of two compounds, a is subscribed for the oregano essential oil, P for the PHBV, and L for the food simulant. From this equation, KP/L values

Figure 3. OEO release tests in three different food simulators (points) and approximation with the Peppas-Sahlin model (dashed lines): (a) 3% acetic acid (w/v); (b) 10% ethanol (v/v); and (c) isooctane.

≤ 1 correspond to migrants more soluble in the simulant medium than in the polymer[12]

As a kinetic factor, the migration behavior of active compounds from polymer matrices depends on different factors such as i) the liquid diffusion into the polymer chains, ii) polymer solubility, and iii) the diffusion of the active

Polímeros, 32(3), e2022028,

2022 4/8
( ) , / , La PLa Pa K δ δ ∆ = ∆ (2)

Release of oregano essential oil from PHBV films in simulated food conditions

compound from the polymer matrix to the food (or simulating medium)[16]. The diffusion of low molecular weight molecules into the matrix may cause network weakening and structure changes. Therefore, the active compound diffuses through the polymer matrix towards the solvent by a concentration gradient.

In this study, two aspects might be influencing the release of the OEO to the isooctane medium: i) the swelling of the polymer matrix caused by the sorption of the organic solvent, thereby enlarging the intermolecular space between the molecules; ii) the OEO migration – confirmed by the similarity between δ values that indicates high thermodynamic compatibility between the essential oil and the solvent – associated with the lower KP/L value (0.15) in the PHBV/isooctane system, which indicates considerable movement to the simulant[12] (Table 2). In aqueous systems, the hydrophobic active compound presented a slower release, as observed when using acetic acid.

3.5 Kinetic studies

The study of the release mechanism of OEO from the PHBV matrix (with and without Sep) comprised

Table 2. Solubility parameters (δ) and partition coefficient (KP/L) of OEO, PHBV, and food simulants.

Substance Solubility parameter (δ) (MPa1/2)

Partition coefficient (KP/L)

PHBV 20.6[21]OEO 15.1[22]Isooctane 14.3[12] 0.15

10% Ethanol 45.5[12] 5.53

3% Acetic acid 47.1[12] 5.82

four different mathematical models: first-order, Higuchi, Korsmeyer-Peppas, and Peppas-Sahlin. The coefficient of determination (Rsqr), Akaike Information Criterion (AIC), and Model Selection Criteria (MSC) parameters are presented in Table 3. The highest Rsqr and MSC represent the best model, and the model is considered appropriate when the MSC value is higher than 2. The model with the smallest AIC value is the most precise[14].

The first-order model (Equation 3, where M O is the initial OEO concentration, M T is the amount of released OEO at time t, k1 is the first-order rate constant, and t is the time) is applied when the release of the active compound is proportional to the amount of OEO remaining in the interior of the matrix. In this case, the amount of OEO released reduces over time[23]. According to the results in Table 3, this model presented the worst fit to the experimental data.

1 kt to MMe = (3)

In the Higuchi model, a linear relationship is proposed between the fraction of OEO released and the square root of time, as shown in Equation 4, where M ∞ is the absolute cumulative amount of drug released at an infinite time (which should be equal to the absolute amount of drug incorporated within the system at time t = 0) and kH is a constant reflecting the design variables of the system. This model describes the OEO release as a diffusion process according to Fick’s law[23] and assumes a one-dimensional diffusion, constant diffusivity of the compound, and that the swelling or dissolution of the polymer carrier is negligible, among other factors[24]

Table 3. Release kinetic models and associated parameters for the PHBV/OEO and PHBV/Sep/OEO films in different simulants. Model Formulation Simulant Rsqr AIC MSC

First-order PHBV/OEO 3% Acid Acetic 0.7149 80.25 1.07

PHBV/Sep/OEO 0.6262 82.50 0.80 PHBV/OEO 10% Ethanol 0.7209 79.63 1.09

PHBV/Sep/OEO 0.6911 82.24 0.99

PHBV/OEO Isooctane 0.7729 78.33 1.30 PHBV/Sep/OEO 0.6203 84.19 0.79 Higuchi

Korsmeyer-Peppas

PHBV/OEO 3% Acid Acetic 0.9668 56.60 3.22

PHBV/Sep/OEO 0.9365 62.99 2.58

PHBV/OEO 10% Ethanol 0.9721 54.28 3.40

PHBV/Sep/OEO 0.9414 63.96 2.65

PHBV/OEO Isooctane 0.9863 47.43 4.11

PHBV/Sep/OEO 0.9185 67.26 2.33

PHBV/OEO 3% Acid Acetic 0.9981 20.97 5.87

PHBV/Sep/OEO 0.9984 18.52 6.06

PHBV/OEO 10% Ethanol 0.9967 26.41 5.31

PHBV/Sep/OEO 0.9963 28.85 5.20

PHBV/OEO Isooctane 0.9981 20.11 5.88

PHBV/Sep/OEO 0.9964 27.62 5.21

Peppas-Sahlin

PHBV/OEO 3% Acid Acetic 0.9990 16.54 6.31

PHBV/Sep/OEO 0.9990 15.61 6.35

PHBV/OEO 10% Ethanol 0.9984 20.93 5.85

PHBV/Sep/OEO 0.9986 20.74 6.01

PHBV/OEO Isooctane 0.9987 18.14 6.07

PHBV/Sep/OEO 0.9968 28.29 5.15

Polímeros, 32(3), e2022028, 2022

5/8

Costa, R. C., Ineichen, A. P., Teixeira, C. S., Bellettini, I. C., & Carli, L. N.

The Korsmeyer-Peppas model was used to investigate the Fickian and non-Fickian mechanisms, according to Equation 5, where MT and M ∞ are the absolute cumulative amounts of drug released at time t and at an infinite time, respectively, kKP is a constant incorporating structural and geometric characteristic of the matrix related to the diffusion process, and n is the diffusional exponent, indicative of the mechanism of the release process. n

The power law may be viewed as a generalization of the superposition of two apparently independent transport mechanisms – a Fickian diffusion and a case-II transport. It is applied to investigate the mechanisms involved in the compound release process and the possible coupling of the relaxation/swelling of the polymer in contact with the solvent and the diffusion of the active compound through the polymer matrix. If the n value is lower than 0.45 (for cylinder specimens, for instance), a quasi-Fickian diffusion of the active release may be considered; for a n value of 0.45, the release occurs through Fickian diffusion; a n value between 0.45 and 0.89 indicates a non-Fickian model known as anomalous transport, where the diffusion and the polymer relaxation rates are coupled; and n = 0.89 represents an erosion mechanism (case-II transport with zero-order release)[13,23,25].

In Equations 6-8, k1, k2, and m are the diffusion rate kinetic constant (Fickian), the erosion rate constant, and the Fickian diffusion exponent, respectively[25]. These equations, along with the Korsmeyer-Peppas model, may be used to analyze the first 60% of a release curve, regardless of the geometric shape of the specimen[26]

According to the results (Table 4), the Peppas-Sahlin model seems to be the best to describe the release kinetics of the OEO. This model decouples the Fickian diffusion and macromolecular relaxation contributions to an overall release mechanism over the process[27]. The greater value of k1 compared to k2 evinces that the Fickian behavior is the prevailing mechanism of OEO release in all media evaluated. The Korsmeyer-Peppas model also showed a very close approximation (R2 > 0.988), and n values lower than 0.5 are also indicative of a Fickian diffusion process[7]

The diffusion coefficient (m) is applied to any geometrical shape that exhibits controlled release and may be determined from the aspect ratio of the sample (2a/l), where 2a is the diameter and l is the thickness. By the results obtained, m varies from 0.40 to 0.52, with a value between 0.45 and 0.89 indicating an anomalous transport[26]

By analyzing the values of F (Fickian mechanism) and R (relaxational mechanism) of the Peppas-Sahlin model (Figure 4), one may observe that the Fickian (case-I) contribution is prominent but decreases over time, while the contribution of Table

The Peppas-Sahlin equation (Equation 6) is an expanded version of the power law and may be applied to calculating two different contributions to the anomalous release process. The first term on the right-hand side represents the Fickian diffusional contribution (F), whereas the second term is the case-II relaxation contribution (R) (Equations 7-8)[26]

PHBV/OEO

PHBV/Sep/OEO 0.03 8.98 13.39 0.39 13.40 -0.43 0.44

PHBV/OEO

0.03 8.46 10.72 0.44 10.41 -0.35 0.52

PHBV/Sep/OEO 0.03 9.62 14.07 0.40 13.81 -0.59 0.48

PHBV/OEO

0.02 8.78 11.22 0.43 11.12 -0.31 0.48

PHBV/Sep/OEO 0.03 9.93 16.06 0.36 16.23 -0.54 0.40

Polímeros, 32(3), e2022028,

2022 6/8
t H M kt M ∞ = (4)
t KP M kt M ∞ = (5)
2 12
t
M ∞ =+
2 1 1 1 m F k t k = +
2 1 m k RFt k =
mm
M ktkt
(6)
(7)
(8)
OEO release parameters from PHBV/OEO and PHBV/Sep/OEO films in different simulants.
Simulant First-order Higuchi Korsmeyer-Peppas Peppas-Sahlin k1 kH kKP n k1 k2 m
4.
Formulation
3% Acetic acid
0.03 8.83 11.75 0.43 11.56 -0.37 0.49
10%
Ethanol
Isooctane
Figure 4. Diffusion (F – closed symbols) and Relaxation (R –open symbols) contributions to the OEO release mechanism in different simulants.

the polymer relaxation is increasing (F + R = 1). However, the overall phenomenon is diffusion-dominant in an anomalous process with a non-linear relationship. This may be related to the compatibility between PHBV and the solvents, especially isooctane and 10% ethanol, thus occurring the swelling of the polymer matrix along the experiment in contact with the medium, associated with the good affinity of the OEO with the medium, with both thermodynamic and kinetic factors facilitating the diffusion process.

Therefore, it is likely that the degradation of the polymer starts at later stages than when the analysis was performed. Therefore, this characteristic becomes promising for application in food since there is no interference from the erosion of the packaging material, and the OEO release to the different media occurs solely through the diffusion process through the PHBV matrix.

The set of results highlights that the dispersion of filler in the polymer matrix and the interaction with the active compound influenced by the presence of clay might interfere with the diffusion of the oil through the polymer. In this study, the PHBV/Sep/OEO exhibited a faster release profile in the first 8 h of the test compared to the PHBV/OEO composition and a gradual and slower release for higher periods when in contact with 10% ethanol and isooctane. In acetic acid, no differences were observed between the compositions. Since the PHBV/Sep/OEO presented a good dispersion of the filler and Sep nanoparticles did not significantly affect the crystallization characteristics of the polymer[2], these results suggest that Sep, when finely dispersed in the PHBV matrix, might improve the OEO dispersion, thus facilitating its release to the medium, especially in the early stages of the process. Furthermore, the formation of some preferential pathways due to the presence of the needleshaped nanoparticles might have favored the diffusion of the solvent from the medium to the polymer and the diffusion of the OEO from the polymer to the medium.

4. Conclusions

The development of active packaging films using PHBV was successfully performed, and incorporating sepiolite and OEO rendered the material more functional, with associated antimicrobial properties. The oregano essential oil release in food simulants is a complex phenomenon that involves different factors such as film structure, simulant medium polarity, migrant solubility, and the presence of nanoparticles.

Therefore, the release of OEO is not governed only by kinetics aspects. The compatibility among all components plays an important role. While the presence of well-dispersed sepiolite influenced the diffusion of oil through the polymer matrix, the affinity of the OEO with the trapping network (PHBV) was more pronounced in hydrophilic media, thus causing a delay in the release process.

Tests in different media proved to be an important tool to fine-tune the release profile of the active compound according to the composition of the packaging material and predict its delivery to the food, thus allowing to establish the application of each film composition for a specific food. This strategy may affect the shelf life of the food, increasing the storage time and ensuring safety.

Polímeros, 32(3), e2022028, 2022

5. Author’s Contribution

• Conceptualization – Larissa Nardini Carli.

• Data curation – NA.

• Formal analysis – Renata Cerruti da Costa; Ismael Casagrande Bellettini; Larissa Nardini Carli.

• Funding acquisition – Larissa Nardini Carli.

• Investigation – Renata Cerruti da Costa; Ana Paula Ineichen; Cristiano da Silva Teixeira.

• Methodology – Renata Cerruti da Costa.

• Project administration – Larissa Nardini Carli.

• Resources – Larissa Nardini Carli.

• Software – NA.

• Supervision – Larissa Nardini Carli.

• Validation – Larissa Nardini Carli.

• Visualization – Renata Cerruti da Costa.

• Writing – original draft – Renata Cerruti da Costa; Ismael Casagrande Bellettini; Larissa Nardini Carli.

• Writing – review & editing – Cristiano da Silva Teixeira; Ismael Casagrande Bellettini; Larissa Nardini Carli.

6. Acknowledgements

The authors would like to thank the Conselho Nacional de Desenvolvimento Científico e Tecnológico (CNPq – Process No. 435650/2018-1), the Coordenação de Aperfeiçoamento de Pessoal de Nível Superior (CAPES), and the Fundação de Amparo à Pesquisa e Inovação do Estado de Santa Catarina (FAPESC) for their financial support and scholarship, and Laboratório Central de Microscopia Eletrônica (LCME) at UFSC for the SEM analyses.

7. References

1 Huang, C., Liao, Y., Zou, Z., Chen, Y., Jin, M., Zhu, J., Abdalkarim, S. Y. H., Zhou, Y., & Yu, H.-Y. (2022). Novel strategy to interpret the degradation behaviors and mechanisms of bioand non-degradable plastics. Journal of Cleaner Production, 355, 131757 http://dx.doi.org/10.1016/j.jclepro.2022.131757

2 Costa, R. C., Daitx, T. S., Mauler, R. S., Silva, N. M., Miotto, M., Crespo, J. S., & Carli, L. N. (2020). Poly(hydroxybutyrateco-hydroxyvalerate)-based nanocoposites for antimicrobial active food packaging containing oregano essential oil. Food Packaging and Shelf Life, 26, 100602. http://dx.doi. org/10.1016/j.fpsl.2020.100602

3 Torres-Giner, S., Hilliou, L., Melendez-Rodriguez, B., Figueroa-Lopez, K. J., Madalena, D., Cabedo, L., Covas, J. A., Vicente, A. A., & Lagaron, J. M. (2018). Melt processability, characterization, and antibacterial activity of compression-molded green composite sheets made of poly(3-hydroxybutyrate-co-3hydroxyvalerate) reinforced with coconut fibers impregnated with oregano essential oil. Food Packaging and Shelf Life, 17, 39-49 http://dx.doi.org/10.1016/j.fpsl.2018.05.002

4 Rhim, J.-W., Park, H.-M., & Ha, C.-S. (2013). Bio-nanocomposites for food packaging applications. Progress in Polymer Science, 38(10-11), 1629-1652. http://dx.doi.org/10.1016/j. progpolymsci.2013.05.008

5 Requena, R., Jiménez, A., Vargas, M., & Chiralt, A. (2016). Poly[(3-hydroxybutyrate)-co-(3-hydroxyvalerate)] active

Release of oregano essential oil from PHBV films in simulated food conditions
7/8

Costa, R. C., Ineichen, A. P., Teixeira, C. S., Bellettini, I. C., & Carli, L. N.

bilayer films obtained by compression moulding and applying essential oils at the interface. Polymer International, 65(8), 883-891 http://dx.doi.org/10.1002/pi.5091

6 Kamal, R., Razzaq, A., Shah, K. A., Khan, Z. U., Khan, N. U., Menaa, F., Iqbal, H., & Cui, J. (2022). Evaluation of cephalexinloaded PHBV nanofibers for MRSA-infected diabetic foot ulcers treatment. Journal of Drug Delivery Science and Technology, 71, 103349 http://dx.doi.org/10.1016/j.jddst.2022.103349

7 Chen, Y., Abdalkarim, S. Y. H., Yu, H.-Y., Li, Y., Xu, J., Marek, J., Yao, J., & Tam, K. C. (2020). Double stimuli-responsive cellulose nanocrystals reinforced electrospun PHBV composites membrane for intelligent drug release. International Journal of Biological Macromolecules, 155, 330-339 http://dx.doi. org/10.1016/j.ijbiomac.2020.03.216 PMid:32229207.

8 Li, F., Abdalkarim, S. Y. H., Yu, H.-Y., Zhu, J., Zhou, Y., & Guan, Y. (2020). Bifunctional reinforcement of green biopolymer packaging nanocomposites with natural cellulose nanocrystal–rosin hybrids. ACS Applied Bio Materials, 3(4), 1944-1954 http://dx.doi.org/10.1021/acsabm.9b01100 PMid:35025317.

9 Carli, L. N., Daitx, T. S., Guégan, R., Giovanela, M., Crespo, J. S., & Mauler, R. S. (2015). Biopolymer nanocomposites based on poly(hydroxybutyrate-co-hydroxyvalerate) reinforced by a non-ionic organoclay. Polymer International, 64(2), 235-241 http://dx.doi.org/10.1002/pi.4781.

10 Li, F., Yu, H.-Y., Li, Y., Abdalkarim, S. Y. H., Zhu, J., & Zhou, Y. (2021). “Soft-rigid” synergistic reinforcement of PHBV composites with functionalized cellulose nanocrystals and amorphous recycled polycarbonate. Composites. Part B, Engineering, 206, 108542 http://dx.doi.org/10.1016/j. compositesb.2020.108542

11 The European Commission. (2011). Commission Regulation (EU) No 10/2011 of 14 January 2011 on plastic materials and articles intended to come into contact with food. Brussels: Official Journal of the European Union.

12 Zygoura, P. D., Paleologos, E. K., & Kontominas, M. G. (2011). Changes in the specific migration characteristics of packagingfood simulant combinations caused by ionizing radiation: effect of food simulant. Radiation Physics and Chemistry, 80(8), 902-910 http://dx.doi.org/10.1016/j.radphyschem.2011.03.020

13 Requena, R., Vargas, M., & Chiralt, A. (2017). Release kinetics of carvacrol and eugenol from poly(hydroxybutyrateco-hydroxyvalerate) (PHBV) films for food packaging applications. European Polymer Journal, 92, 185-193. http:// dx.doi.org/10.1016/j.eurpolymj.2017.05.008

14 Zhang, Y., Huo, M., Zhou, J., Zou, A., Li, W., Yao, C., & Xie, S. (2010). DDSolver: an add-in program for modeling and comparison of drug dissolution profiles. The AAPS Journal, 12(3), 263-271 http://dx.doi.org/10.1208/s12248-010-9185-1 PMid:20373062.

15 Siswanto, A., Fudholi, A., Nugroho, A. K., & Martono, S. (2015). In vitro release modeling of aspirin floating tablets using DDSolver. Indonesian Journal of Pharmacy, 26(2), 94-102

16 Fernández-Pan, I., Maté, J. I., Gardrat, C., & Coma, V. (2015). Effect of chitosan molecular weight on the antimicrobial activity and release rate of carvacrol-enriched films. Food Hydrocolloids, 51, 60-68 http://dx.doi.org/10.1016/j.foodhyd.2015.04.033

17 Yu, J. T., Bouwer, E. J., & Coelhan, M. (2006). Occurrence and biodegradabilty studies of selected pharmaceuticals and personal care products in sewage effluent. Agricultural Water Management, 86(1-2), 72-80 http://dx.doi.org/10.1016/j. agwat.2006.06.015

18 Bilotti, E., Fischer, H. R., & Peijs, T. (2008). Polymer nanocomposites based on needle-like sepiolite clays: effect of functionalizes polymers on the dispersion of nanofiller, crystallinity, and mechanical properties. Journal of Applied Polymer Science, 107(2), 1116-1123 http://dx.doi.org/10.1002/app.25395

19 Liu, Q.-S., Zhu, M.-F., Wu, W.-H., & Qin, Z.-Y. (2009). Reducing the formation of six-membered ring ester during thermal degradation of biodegradable PHBV to enhance its thermal stability. Polymer Degradation & Stability, 94(1), 1824 http://dx.doi.org/10.1016/j.polymdegradstab.2008.10.016

20 Tunç, S., Duman, O., & Polat, T. G. (2016). Effects of montmorillonite on properties of methyl cellulose/carvacrol based active antimicrobial nanocomposites. Carbohydrate Polymers, 150, 259-268. http://dx.doi.org/10.1016/j.carbpol.2016.05.019. PMid:27312637.

21 Choi, J. S., & Park, W. H. (2004). Effect of biodegradable plasticizers on thermal and mechanical properties of poly(3hydroxybutyrate). Polymer Testing, 23(4), 455-460 http:// dx.doi.org/10.1016/j.polymertesting.2003.09.005

22 Zhu, P., Chen, Y., Fang, J., Wang, Z., Xie, C., Hou, B., Chen, W., & Xu, F. (2016). Solubility and solution thermodynamics of thymol in six pure organic solvents. The Journal of Chemical Thermodynamics, 92, 198-206 http://dx.doi.org/10.1016/j. jct.2015.09.010

23 Costa, P., & Lobo, J. M. S. (2001). Modeling and comparison of disolution profiles. European Journal of Pharmaceutical Sciences, 13(2), 123-133. http://dx.doi.org/10.1016/S09280987(01)00095-1 PMid:11297896.

24 Siepmann, J., & Peppas, N. A. (2001). Modeling of drug release from delivery sustems based on hydroxypropyl methylcellulose (HPMC). Advanced Drug Delivery Reviews, 48(2-3), 139157 http://dx.doi.org/10.1016/S0169-409X(01)00112-0 PMid:11369079.

25 Mehran , M. , Masoum , S. , & Memarzadeh , M. (2020 ). Microencapsulation of Mentha spicata essential oil by spray druing: optimization, characterization, release kinetics of essential oil from microcapsules in food models. Industrial Crops and Products, 154, 112694. http://dx.doi.org/10.1016/j. indcrop.2020.112694

26. Peppas, N. A., & Sahlin, J. J. (1989). A simple equation for the description of solute release. III. Coumpling of diffusion and relaxation. International Journal of Pharmaceutics, 57(2), 169-172 http://dx.doi.org/10.1016/0378-5173(89)90306-2

27 Whitehead, F. A., & Kasapis, S. (2022). Modelling the mechanism and kinetics of ascorbic acid diffusion in genipin-crosslinked gelatin and chitosan networks at distinct pH. Food Bioscience, 46, 101579 http://dx.doi.org/10.1016/j.fbio.2022.101579

Received: Aug. 03, 2022

Revised: Sept. 27, 2022

Accepted: Oct. 02, 2022

Polímeros, 32(3), e2022028,

2022 8/8

Influence of carbon black trimodal mixture on LDPE films properties: Part1 – DOE

Juliano Martins Barbosa1,2* , Cesar Augusto Gonçalves Beatrice1  and Luiz Antonio Pessan1 

1Programa

2Engenharia de Materiais, Escola de Engenharia, Universidade Presbiteriana Mackenzie, São Paulo, SP, Brasil *juliano.barbosa@mackenzie.br

Obstract

In this study, the influence of carbon black (CB) trimodal mixture, with different medium particle sizes, on the colorimetric and rheological properties of polyethylene was evaluated. Three different types of CB were selected, with particle sizes of 15nm (S), 38nm (M), and 75nm (L) and combined, generating a Design of Experiments (DOE) with 19 formulations to be dispersed at 30% in low density polyethylene (LDPE) in twin screw extruder. Such formulations were evaluated in performance and process properties, such as Tint Strength, Melt Flow Index (MFI), and Total Transmittance (TT). It was observed that the mixtures between small (S) and medium (M) particles developed greater tinting strength and lower viscosity, demonstrating the synergy of the mixture, which was superior in the performance of the mixture containing only a particular of 15nm (S) that would have greater potential for results.

Keywords: carbon black, polyethylene, tinting strength, trimodal particle size distribution, viscosity.

How to cite: Barbosa, J. M., Beatrice, C. A. G., & Pessan, L. A. (2022). Influence of carbon black trimodal mixture on LDPE films properties: Part1 – DOE. Polímeros: Ciência e Tecnlogia, 32(3), e2022029. https://doi.org/10.1590/01041428.20220039

1. Introduction

Polymers are organic macromolecules (synthetic or natural origin). Plastics and rubbers are examples of synthetic polymers, while leather, silk, horn, cotton, wool, wood and natural rubber are natural organic macromolecules. They generally have low density, electrical and thermal insulation, flexibility, good corrosion resistance and low heat resistance[1]. Synthetic polymers are produced by the polymerization of smaller molecules (monomers) in a process called polymerization, and most of their properties derive from this operation; however, they can be modified and improved by the addition of small amounts of additives or larger amounts in the case of mineral fillers[2,3].

Thus, using the Principle of Combined Action, obtaining a multiphase material that has a significant proportion of the properties of both phases that constitute it in order that a better combination of the properties of the individual materials is obtained. Furthermore, the constituent phases must be chemically distinct and separated by an interface[2].

An example of this is the addition of fillers in the polymer matrix, such as carbon black (CB) or calcium carbonate (CaCO3), which can give the polymer better mechanical properties under tensile or impact, change the optical properties and reduce the cost of the product. The CB is used to develop mainly polymer reinforcements, especially elastomers, providing substantial mechanical strength[4,5].

Although produced since remote antiquity, it only began to be manufactured industrially from 1870 onwards

to meet the needs of the paint industry. The discovery of its reinforcing properties in rubber, which took place in the early 20th century, raised this product to the current status of an essential filler for this industry, being even indispensable in many other applications.

The term reinforcement in polymer technology means an increase in mechanical performance, mainly in tear, tensile and abrasion resistance[5]. The effect on the dynamic properties of elastomers differs quantitatively from one elastomer to another. It depends on the type of processing and the state of dispersion, both concerning the size and number of agglomerates and the separation distance between them[5]. In addition to its wide use as a reinforcing agent in rubber, it can be used as a coloring agent for pigmentation, providing protection from UV radiation, increasing the electrical conductivity of the matrix but altering the rheological properties of polymers inks and coatings[6]. These properties change with the morphology of the particles and are arranged in: particles, aggregates and agglomerates, as illustrated in Figure 1a[7]. The particle is the primary spherical unit, characterized by its surface area, measured by Nitrogen Absorption (NSA) and expressed in m2/g[6,7]. The Aggregate refers to a set of primary particles covalently bonded and represents the fundamental structure of CB suspension. These aggregates are defined by their Oil Absorption value (OAN) and expressed in cm3/100g. They often assume various arrangements such as spheroid, ellipsoidal, linear and super-branched. Finally, the Agglomerate (cluster)

https://doi.org/10.1590/0104-1428.20220039 O O O O O O O O O O O O O O O Polímeros, 32(3),
2022 ISSN 1678-5169 (Online) 1/9
e2022029,
de Pós-graduação em Ciência e Engenharia de Materiais – PPGCEM, Departamento de Engenharia de Materiais – DEMa, Universidade Federal de São Carlos – UFSCar, São Carlos, SP, Brasil

Barbosa, J. M., Beatrice, C. A. G., & Pessan, L. A.

is a group of aggregates linked through secondary bonds. The magnitude of this binding force can change with the chemical properties of the particles, the suspension vehicle, and the shape and size of the agglomerates. This structural change is sensitively perceived through the rheological responses of the suspensions. In general, an increase in CB concentration and a decrease in particle size improve and even prevent the formation of agglomerates, thus increasing viscosity[6,7]

Concerning the optical properties developed by the tinting strength of the pigment, these are related to the size of the Primary Particle; that is, the smaller the particle, the greater the total surface area and the more intense the coloration developed. At this point, there is a conflict because the highest possible yield of coloring is desired. For that, a small primary particle is needed and preferably with a small aggregate structure to influence little on the viscosity of the matrix, thus enabling processing under normal conditions, i.e., the use of small particles allows for greater colorimetric yield. However, their use tends to increase the viscosity of the polymer significantly, which causes processing difficulties. Thus, the mixture of particles can be used to develop synergy between different particle sizes and minimally influence the increase in the viscosity of the matrix, using a packing with multimodal particle distribution[8], contributing to the development of information and knowledge on the CB application, mainly in polyethylene, with the objective of acting as a colorant, in order to increase this property as much as possible, without affecting the rheological characteristics of the polymer and consequently its industrial processability. This study can contribute significantly to the industry, as such research is extremely complex, as the works on particle packing are well developed in the ceramic segment, but it is not yet used in mixing different particles of CB, in order to increase the tinting strength of the formulation. So, the challenge is to enable the use of pigment concentrates (masterbatch), produced with mixtures of different CB types, using different particle sizes in order to improve

the colorimetric properties of polyethylene used for the production of different products such as films, sheets or parts, With this, an improvement in the optical properties is expected, with greater tinting strength capacity, and with little influence on the rheological properties.

2. Materials and Methods

2.1 Materials

The inorganic pigment (Carbon black - CB) was identified as Black Pearls 900 (Small - S), Regal 99I (Medium - M) and Black Pearls 120 (Large - L), all supplied by Cabot Corporation (USA), according to Table 1[9] and dispersed at 30% loading in low density polyethylene (LDPE) grade PB608[10], with MFI of 30 g/10min (2.16 kg@190 °C) or 65 g/10min (5.00 kg@190 °C) produced by Braskem (Brazil).

2.2 Carbon black concentrates preparation

The pigment concentrates were dispersed in a twin-screw extruder ZSK18 (Coperion GmbH) with L/D 48, using screw rotation of 300 rpm (N), feed rate of 20 kg/h (Q) and a thermal profile between 120 and 180 °C, according to DOE Simplex Lattice Grade 4 shown in Figure 1b. The screw extruder profile was based on the scheme shown in Figure 2, however, there was a need for small adaptation due to the difference in L/D between the extruders[11]. The pigments, supplied in the micro-pearls form, were manually homogenized with polyethylene pellets and then the mixture was dosed through the main feeder, using the flow rate previously indicated (Q).

The samples in this step, called PART 1, were identified with the following nomenclature: FXX(S/M/L), indicating the correlation between name and composition. For example, the formula F01 was identified as F01(75/25/00), with 75% of the total fraction of CB with S particle, 25% of M particle and 00% of L particle. The total CB content defined was 30%; for F01, we will have 75% x 30% and 25% x 30%, resulting in 22.5% for S and 7.5% for M, in addition to 70% of polyethylene, completing the composition.

Figure 1. (a) Carbon Black morphology; (b) design of experiment.

Table 1. Principal properties of carbon black[9]

Properties Unit Standard BP 900 (S) Regal 99I (M) BP 120 (L)

Primary particle nm ASTM D3849 15 38 75

Oil absorption (OAN) cc/100g ASTM D2414 64 63 64

Nitrogen Surface Area (NSA) m2/g ASTM D6556 230 62 25

Tinting Strength % ASTM D3265 151 97 58

Polímeros, 32(3), e2022029,

2022 2/9

2.3 Dilution of carbon black concentrates

For some tests, the measures were in a polymeric film, and the specimens were prepared by blow mold extrusion (thickness 40 μm and blowing ratio of 1:3) diluting the concentrate at 5% in LDPE (MFI of 2 g/10min) in a singlescrew, model D-85560 Ebersberg (Dr. Collin GmbH) with L/D 30 and D=25mm,

2.4 Characterizations

2.4.1 Composition characterization

The CB content in the samples was determined via gravimetric after pyrolysis at 600 °C in an inert nitrogen atmosphere and then in a regular atmosphere, following the ASTM D1603[12].

2.4.2 Rheological properties characterization of carbon black concentrates

The MFI, which is a basic determination of the rheological behavior of compositions, was determined according to ASTM D1238 (5.00 kg@190 °C)[13]. Subsequently, the rheological properties were determined at low shear rates (steady flow regime) and high shear rates. The viscosity (η) as a function of shear rate ( γ ) in steady flow regime was determined in a rheometer ARES from Rheometric Scientific (N2 atmosphere, 210 °C, parallel plates geometry with a diameter of 25 mm and 1 mm of gap) with a shear rate between 10-2 and 102 s-1. The behavior at high shear rates was obtained by capillary rheometry in an Instron rheometer, model 4467 (Lc = 24.384 mm, Dc = 1.270 mm, Lc/Dc = 20 at 210 °C) with a shear rate range between 101 and 104 s-1 which is equivalent to the values found in a twin-screw extrusion process[14]

2.4.3 Colorimetric and optical properties characterization

The Tinting Strength is a quantitative method for comparing pigment performance to a reference. Prepared by mixing one part of CB concentrate (black) with ten parts of titanium dioxide pigment (white) – 1:10, generating a gray color. The more intense this gray, the greater the tinting strength of CB, as it stands out over white. On the other hand, the less intense the gray, the lesser the tinting strength because the white pigment stands out from the CB. The quantitative determination was performed in a spectrophotometer Datacolor (SF 600), using the “Contrast Ratio” mode, calculated by the CIE LAB L*a*b system[15]. For Total Transmittance (TT), measured in a film specimen, which physically represents the total incident light and transmitted through the sample,

Polímeros, 32(3), e2022029, 2022

being reduced by the reflectance or absorption of light by the sample, measured using a BYK Gardner spectrophotometer (Haze-Gard Plus), following ASTM D1003 standard, operating in transmittance mode[16-18]

2.4.4 Dispersion and microscopy characterization

The state of the dispersion was evaluated by two techniques: the first (quantitative) via Filter Pressure Value (FPV) and the second (qualitative) by Optical Microscopy (OM), observing the agglomerates dispersed in the polymer matrix. The FPV evaluates the degree of dispersion of pigments through a standardized screen filtration mounted on an extruder; this filtration generates retention of undispersed pigment particles, and the degree of dispersion can be quantified by the pressure variation, according to EN-13900[19], using #635 mesh (15 μm), 220 °C and 200 g of concentrate. The FPV in the OM observed the CB microdispersion in the films specimen using a Leica microscope (DMRXP) and images captured with Image Pro Software at 200 or 400x magnification.

3. Results and Discussions

In PART 1 (Preliminary Formulation), the objective was to obtain the best proportion between the different CBs dispersed in a twin-screw extruder, resulting in the best dispersion with the highest possible tinting strength and maintaining the lowest viscosity. Table 2 shows the results of the characterizations, and its comprehensive evaluation indicates the most suitable combination and proportion between the pigments studied.

Table 2 shows that the CB content in the concentrates is within the expected range, which indicates that there was no significant loss or variation during the incorporation step. The nominal value of 30% ranged between 29.1% and 30.1%, with less than 3% in losses.

Assessing the properties of MFI, Tinting Strength and FPV, it is possible to observe the balance between the colorimetric properties and viscosity of the mixture, as shown in Figure 3 in the form of the Mixture Contour Graph.

The MFI showed that LDPE PB608, identified as F00 (00/00/00), initially had 65.0 g/10min (5.00 kg@190 °C), and its value was reduced to 0.80 g/10min for F06 (100/00/00) after the addition of small particles of CB, indicating a high increase in its viscosity. This behavior was already expected due to the capacity of the CB pigment to absorb the polymer and influence its viscosity, as presented by

Influence of carbon black trimodal mixture on LDPE films properties: Part1 – DOE
3/9
Figure 2. Schematic representation of the screw profile.

Barbosa, J. M., Beatrice, C. A. G., & Pessan, L. A.

Table 2. Results of the main characterization tests.

FXX (S/M/L) S (%) M (%) L (%) CB content (%) MFI (g/10min) Tinting Strength (%) Ref. (F17) Result FPV (bar) TT (%)

F00 (00/00/00) 0.00 0.00 0.00 0.00 65.0 0.00 - 0 82.7 ± 1.0

F01 (75/25/00) 22.5 7.50 0.00 29.5 5.40 113.0 68 9.7 ± 0.6

F02 (00/75/25) 0.00 22.5 7.50 29.7 26.9 109.0 21 11.3 ± 0.6

F03 (00/25/75) 0.00 7.50 22.5 28.9 28.5 96.90 33 15.5 ± 1.1

F04 (50/50/00) 15.0 15.0 0.00 29.1 12.3 114.1 8 10.8 ± 0.6

F05 (00/100/00) 0.00 30.0 0.00 29.6 26.1 109.8 1.5 9.7 ± 0.7

F06 (100/00/00) 30.0 0.00 0.00 30.0 0.80 124.5 21 6.1 ± 0.7

F07 (25/25/50) 7.50 7.50 15.0 30.1 23.1 102.7 13 13.2 ± 0.8

F08 (66/17/17) 20.0 5.00 5.00 30.2 6.80 111.1 7 11.4 ± 0.3

F09 (50/25/25) 15.0 7.50 7.50 29.7 14.2 106.4 8 12.5 ± 0.4

F10 (33/33/33) 10.0 10.0 10.0 29.6 20.9 109.2 13 15.2 ± 0.5

F11 (00/50/50) 0.00 15.0 15.0 29.7 28.6 100.6 13 18.5 ± 0.6 F12 (17/17/66) 5.00 5.00 20.0 29.8 26.6 95.30 21 18.9 ± 1.0

F13 (75/00/25) 22.5 0.00 7.50 29.7 4.60 113.9 14 12.4 ± 0.5

F14 (17/66/17) 5.00 20.0 5.00 30.0 23.3 106.6 13 16.2 ± 0.5

F15 (25/50/25) 7.50 15.0 7.50 29.9 21.8 110.5 12 15.1 ± 0.9 F16 (50/00/50) 15.0 0.00 15.0 29.9 14.2 106.6 13 16.1 ± 0.7

F17 (00/00/100) 0.00 0.00 30.0 29.9 27.9 100.0 62 17.0 ± 0.7

F18 (25/75/00) 7.50 22.5 0.00 30.0 18.8 126.7 1.2 7.2 ± 0.5 F19 (25/00/75) 7.50 0.00 22.5 29.6 26.3 97.10 26 16.8 ± 0.7

Figure 3. Mixture Contour Graph of MFI, FPV and Tinting Strength.

Zhang et al.[20]. As reported in Table 1, there is a significant difference between the surface areas of the pigments, and this directly reflects on this result. Thus, pigment S with

a surface area of 230 m2/g (NSA) was the one that most affected this property and also in its combinations with pigment M, as in F01 (75/25/00), which reduced it to 5.4 g/

Polímeros, 32(3), e2022029,

2022 4/9

10min or in F08 (66/17/17) with 6.80 g/10min pigment L, which has a smaller surface area, had less influence on this property, such as F17 (00/00/100) with 27.9 g/10min, as shown in Table 2

The Tinting Strength, which determines pigment performance as a function of its ability to impart color to the polymer, can be evaluated considering the same amount of pigment mass in the formulations. This is due to the size of the primary particle and the structure of CB, which determine this property as a function of the surface area of the pigment. However, its degree of dispersion enhances this characteristic; the better it is dispersed, the greater the surface area of the pigment obtained and, consequently, the greater tinting strength, as widely discussed by Donnet[21] and later by Spahr and Rothon[22]. As this determination is comparative, F17 (00/00/100) was adopted as a reference (100%), as it was expected to be the one with the lowest because of the largest particle size in its composition

Again, the best results were obtained in compositions with pigments S and M and their combinations, such as F06 (100/00/00) with 124.5%, F18 (25/75/00) with 126.1% and F04 (50/50/00) with 114.1%. On the other hand, F03 (00/25/75) presented only 96.9%, this behavior as reported visually in Table 2 showing different grays and illustrated in Figure 3

An important factor that influences the performance of the pigment in the polymer matrix is dispersion; in this way, the agglomerates are reduced during processing as a function of the shear, and the surface area of the pigment reaches its greatest potential; thus, the FPV provides a determination of the microdispersion of the pigment. The better its dispersion in the polymeric matrix, the lower the result because the agglomerates were reduced. The particles pass more easily through the filtering screen, not producing obstruction, consequently not increasing pressure. An important observation

is that the BP120 (L) pigment has a high level of impurities, which was not observed in the others, and this compromised the evaluation, as it was not possible to determine whether the increase in pressure was due to the poor dispersion of the pigment or the contaminants present in the raw material. Thus, the best results were obtained with pigments S and M and their combinations, as in F17 (00/00/100), which presented 62 bar while F03 (00/25/75) and F19 (00/25/75) showed 33 bar and 26 bar, respectively.

Qualitatively the dispersion was observed by Optical Microscopy (OM). The agglomerates were identified, helping to understand the higher values of FPV due to the greater clogging and accumulation in the filtering screen[19] In Figure 4, some elements can be easily seen, such as the CB particles being well dispersed and distributed throughout the polyethylene matrix and some agglomerates, indicating a less efficient dispersion. Taking as reference F17 (00/00/100), one can observe some extremes, such as F18 (25/75/00), which showed good tinting strength (126.7%) and low FPV (1.2 bar) and also F06 (100/00/00) which showed good tinting strength (124.5%), slightly higher FPV (21 bar); however its micrograph showed the presence of many agglomerates, indicating poor dispersion and that it could have been better, enhancing the tinting strength, with reduced FPV. This fact is related to its large surface area, requiring greater Specific Mechanical Energy (SME) for complete dispersion due to its high viscosity[22,23]

The formulations with pigment S showed a greater tendency to develop agglomerates, presenting points of poor dispersion, as in F06 (00/00/100), F01 (75/25/00) and F13 (75/00/25). On the other hand, the formulations containing pigment L, due to their structure, showed greater ease of dispersion and presented these poorly dispersed agglomerates in a reduced form, due to the combination with other pigments, as in F17 (00/00/100), F03 (00/25/75)

Polímeros, 32(3), e2022029, 2022

5/9
Figure 4. Micrographs of samples F06, F17 and F18 in MO (magnification: 200x).

Barbosa, J. M., Beatrice, C. A. G., & Pessan, L. A.

and F19 (00/25/75). The pigment M, which was expected to have an intermediate behavior, brought interesting results with good dispersion, as observed in F05 (00/100/00) and F18 (25/75/00); this is due to its intermediate structure, which gives good dyeing power associated with less processing difficulty, in addition to less influence on viscosity, as shown in the Mixture Contour Graph of Figure 3 correlating these properties. This balance is essential as it provides sufficient viscosity to increase shear and enhance pigment dispersion without limiting processing due to excessive viscosity increase[20]. In Figure 5, it is possible to see some of these micrographs at 400x magnification.

Correlating the Tinting Strength with the MFI, the Correlation Matrix was obtained for a preliminary and fundamental analysis of the balance between viscosity and performance, as shown in Figure 6a. It can be observed that some formulations are found in the quadrant with high tinting strength and higher MFI, such as F01 (75/25/00), F02 (00/75/25), F04 (50/50/00), F05 (00/100 /00), F08 (66/17/17), F10 (33/33/33), F13 (75/00/25), F15 (25/50/25)

and F18 (25/75/00). There is a strong tendency to reduce the MFI using S particle and its mixtures. However, this combination is the one that provided the greatest Tinting Strength; the F18 (25/75/00) presented a good balance between the properties, as demonstrated by Aghajan[8]

Complementing the colorimetric evaluation, it was evidenced that the Total Transmittance (TT) measured in films has a strong correlation with the Tinting Strength, as shown in Table 2. The greater the tinting, the lower transmittance will be due to the pigment dispersed in the matrix; in addition to conferring the color, it also reduces the passage of light on the substrate, as observed in F06 (100/00/00), F13 (75/00/25) and F18 (75/25/00) Figure 6b shows this correlation more evidently.

The rheological behavior of the formulations was evaluated to complement the primary results from the MFI. The viscosity (η) as a function of shear rate ( γ ) was measured, and some formulations presented higher viscosity than others as a function of their composition, as illustrated in Figure 7a, following the effect previously mentioned

Polímeros, 32(3), e2022029,

2022 6/9
Figure 5. Micrographs of samples F05, F06, F10, F13, F17 and F18 in MO (magnification: 400x).

Figure 6. Correlation Matrix – (a) MFI and (b) Total Transmittance versus Tinting Strength.

on MFI behavior. In addition, the evaluation of η( γ ) also considers the pseudoplasticity of the polymer matrix[14] The rheological behavior as a function of composition, as expected, was influenced by the significant difference between the surface areas of the pigments. Thus, the pigment S with a surface area of 230 m2/g was the one that most affected the viscosity and also its combinations with the pigment M, such as F06 (100/00/00), F01 (75/25/00), F04 (50/50/00) that presented viscosity values in the order of 105 Pa.s at a shear rate of 10-1 s-1. The formulation F08 (66/17/17) can be highlighted in the same order of magnitude. Pigment L, which has a smaller surface area, had less influence; for example, F17 (00/00/100) showed a viscosity value one order of magnitude lower at the same shear rate, as seen in Figure 7a. In this way, seeking the best balance between higher tinting strength with lower viscosity, the samples below were ordered from the lowest to the highest viscosity: F17 (00/00/100) < F05 (00/100/00) < F18 (25 /75/00) < F10 (33/33/33) < F13 (75/00/25) < F06 (100/00/00), such behavior observed by Chuayjuljit et al.[24]

The rheological behavior at higher shear rates is essential to evaluate the pseudoplasticity at shear rates commonly applied to the polymer during processing[14]. Thus, capillary rheometry was used to determine the viscosity as a function of shear rate, and the curves are shown in Figure 7b. Even at high rates, the rheological profile of viscosity remained close to 103 s-1, with F06 (100/00/00) being the highest viscosity and F17 (00/00/100) having the lowest values. Above this shear rate, the viscosity values are equivalent, and the curves overlap.

As determined by the previous tests, the F06 (100/00/00) showed high tinting strength; however, the viscosity also had high values. On the other hand, F17 (00/00/100) showed low viscosity values and did not develop tinting strength.

Figure 7. Viscosity as a function of shear rate for the best formulations balances measured at: (a) low shear rates (parallel plates); (b) high shear rates (capillary).

4. Conclusions

The trimodal mixture and distribution of different CB can produce an optimized combination between these pigments to improve the colorimetric properties, with less interference in the rheological and processing characteristics of the polymer, compared to using a single type of particle. The formulations containing small particle fractions ( S ) showed greater tinting strength and greater viscosity. The combinations showed superior performance than formulations containing only one type of particle. F18 (25/75/00) and F13 (75/00/25) had tinting power of 126.7% and 113.9%, respectively; the formulation F17 (00/00/100) was considered as 100%. The F06 (100/00/00), which has only particles P, obtained 124.5% of tinting power due to its great difficulty in processing (high viscosity and consequent deficient dispersion). The viscosity results evaluated by the MFI show that F00 (00/00/00) went from 65 g/10min (5.00 kg@190 °C) to 18.8 g/10min in the formulation F18 (25/75/00) and 29.7 g/10min in the formulation F13 (75/00/25) while formulation F06 (100/00/00) reached 0.80 g/10min. The same behavior was observed in the rheological measurements. A factor that affects the performance of the pigment in the polymer matrix is its dispersion. The agglomerates are broken during processing due to the Specific Mechanical Energy (SME), providing better braking and dispersion of the agglomerates; thus, the surface area of the pigment reaches its highest values.

7/9
Influence of carbon black trimodal mixture on LDPE films properties: Part1 – DOE Polímeros, 32(3), e2022029, 2022

Barbosa, J. M., Beatrice, C. A. G., & Pessan, L. A.

5. Author’s Contribution

• Conceptualization – Juliano Martins Barbosa; Luiz Antonio Pessan.

• Data curation – Juliano Martins Barbosa; Luiz Antonio Pessan.

• Formal analysis – Juliano Martins Barbosa; Cesar Augusto Gonçalves Beatrice; Luiz Antonio Pessan.

• Funding acquisition – NA.

• Investigation – Juliano Martins Barbosa; Luiz Antonio Pessan.

• Methodology – Juliano Martins Barbosa; Cesar Augusto Gonçalves Beatrice; Luiz Antonio Pessan.

• Project administration – Juliano Martins Barbosa; Luiz Antonio Pessan.

• Resources – Juliano Martins Barbosa; Cesar Augusto Gonçalves Beatrice.

• Software – NA.

• Supervision – Juliano Martins Barbosa; Luiz Antonio Pessan.

• Validation – Juliano Martins Barbosa; Luiz Antonio Pessan.

• Visualization – Juliano Martins Barbosa; Luiz Antonio Pessan.

• Writing – original draft – Juliano Martins Barbosa; Luiz Antonio Pessan .

• Writing – review & editing – Juliano Martins Barbosa; Cesar Augusto Gonçalves Beatrice; Luiz Antonio Pessan.

6. Acknowledgements

This study was financed in part by the Coordenação de Aperfeiçoamento de Pessoal de Nível Superior - Brasil (CAPES) - Finance Code 001. The authors would like to thank the Engineering School of Mackenzie Presbyterian University, Cabot Corporation, Braskem S/A, and Cromex S/A for the technical support and donation of materials.

7. References

1 Padilha, A. F. (1997). Materiais de engenharia: microestrutura e propriedades São Paulo: Hemus

2. Callister, W. D., Jr. (2002). Ciência e engenharia dos materiais: uma introdução. Rio de Janeiro: LTC.

3 Wypych, G. (1999). Handbook of fillers New York: ChemTec Publishing

4 Darold, R. D. (2011). Influência da distribuição de tamanho de partículas sobre a piroplasticidade em porcelanato técnico em função do procedimento de moagem. Cerâmica Industrial , 16 (3), 29-34. Retrieved in 2022, May 7, from https://www.ceramicaindustrial.org.br/article/587657477f 8c9d6e028b47a9

5. Martins, A. F., Napolitano, B. A., Visconte, L. L. Y., & Nunes, R. C. R. (2002). Mechanical and dynamic mechanical properties of chloroprene rubber compositions with carbon black. Polímeros: Ciência e Tecnologia, 12(3), 147-152 http:// dx.doi.org/10.1590/S0104-14282002000300006

6 Aoki, Y., Hatano, A., & Watanabe, H. (2003). Rheology of carbon black suspensions. I.Three types of viscoelastic behavior.

Rheologica Acta, 42(3), 209-216 http://dx.doi.org/10.1007/ s00397-002-0278-3

7 Carbon Black Association. (2016). Carbon black user’s guide. USA: Carbon Black Association. Retrieved in 2022, May 7, from http://www.cabotcorp.de/~/media/files/product-stewardship/ industry-user-guides/international-carbon-black-associationicba-user-guide-portuguese.pdf

8 Aghajan, M. H., Hosseini, S. M., & Razzaghi-Kashani, M. (2019). Particle packing in bimodal size carbon black mixtures and its effect on the properties of styrene-butadiene rubber compounds. Polymer Testing, 78, 106002 http://dx.doi. org/10.1016/j.polymertesting.2019.106002

9 Cabot Corporation. (2021, February 5). Retrieved in 2022, May 7, from https://www.cabotcorp.com/solutions/applications/ plastics

10 Braskem. (2021, April 19). Retrieved in 2022, May 7, from https://www.braskem.com/busca-de-produtos?p=133

11 Lotti, C., Isaac, C. S., Branciforti, M. C., Alves, R. M. V., Liberman, S., & Bretas, R. E. S. (2008). Rheological, mechanical and transport property of blow films of high density polyethylene nanocomposites. European Polymer Journal , 44 (5), 1346-1357 http://dx.doi.org/10.1016/j. eurpolymj.2008.02.014

12 American Society for Testing and Materials – ASTM. (2020). ASTM D1603-20: standard test method for carbon black content in olefin plastics. West Conshohocken: ASTM http://dx.doi. org/10.1520/D1603-20

13 American Society for Testing and Materials – ASTM. (2013). ASTM D1238-13: standard test method for melt flow rates of thermoplastics by extrusion plastometer. West Conshohocken: ASTM http://dx.doi.org/10.1520/D1238-13

14 Bretas, R. E. S., & D’Avila, M. A. (2000). Reologia de polímeros fundidos. São Carlos: EdUFSCar

15 Datacolor Color Measurement Instruments & Software. (2021, April 4). Retrieved in 2022, May 7, from https://www.datacolor. com/business-solutions/product-overview

16 Sarantópoulos, C. I. G. L., Oliveira, L. M., Padula, M., Coltro, L., & Alves, R. M. V. (2002). Embalagens plásticas flexíveis: principais polímeros e avaliação das propriedades. Campinas: CETEA/ITAL

17 Byk Instruments. (2021, May 14). Haze-gard transparency transmission haze meter. Retrieved in 2022, May 7, from https://www.byk-instruments.com/en/Appearance/haze-gardTransparency-Transmission-Haze-Meter/c/2345

18 American Society for Testing and Materials – ASTM. (2013). ASTM D1003-13: standard test method for haze and luminous transmittance of transparent plastics. West Conshohocken: ASTM. http://dx.doi.org/10.1520/D1003-13.

19 British Standards Institution – BSI. (2005). BS EN 139005:2005: pigments and extenders: methods of dispersion and assessment of dispersibility in plastics - part 5: determination by filter pressure value test. Belgium: BSI. http://dx.doi. org/10.3403/30105254U

20. Zhang, J.-F., & Yi, X.-S. (2002). Dynamic rheological behavior of high-density polyethylene filled with carbon black. Journal of Applied Polymer Science, 86(14), 3527-3531 http://dx.doi. org/10.1002/app.11101

21 Donnet, J.-B. (Ed.). (1993). Carbon black: science and technology (2nd ed.). New York: Routledge http://dx.doi. org/10.1201/9781315138763

22 Spahr, M. E., & Rothon, R. (2015). Carbon black as a polymer filler. In S. Palsule (Ed.), Encyclopedia of polymers and composites (pp. 1-24). Berlin: Springer http://dx.doi. org/10.1007/978-3-642-37179-0_36-1

Polímeros, 32(3), e2022029,

2022 8/9

Influence of carbon black trimodal mixture on LDPE films properties: Part1 – DOE

23 Domenech, T., Peuvrel-Disdier, E., & Vergnes, B. (2013). The importance of specific mechanical energy during twin screw extrusion of organoclay based polypropylene nanocomposites. Composites Science and Technology, 75, 7-14 http://dx.doi. org/10.1016/j.compscitech.2012.11.016

24 Chuayjuljit, S., Imvittaya, A., Na-Ranong, N., & Potiyaraj, P. (2002). Effects of particle size and amount of carbon black and calcium carbonate on curing characteristics and dynamic

mechanical properties of natural rubber. Journal of Metals, Materials and Minerals, 12(1), 51-57. Retrieved in 2022, May 7, from https://www.jmmm.material.chula.ac.th/index.php/ jmmm/article/view/1277/902

Received: May 07, 2022

Revised: Aug. 20, 2022

Accepted: Sept. 21, 2022

Polímeros, 32(3), e2022029, 2022

9/9

Influence of carbon black trimodal mixture on LDPE films properties: Part2 – SME

*juliano.barbosa@mackenzie.br

Obstract

In this work, the influence of Specific Mechanical Energy (SME) to disperse a trimodal distribution of carbon black (CB) by extrusion was studied to evaluating the effect on LDPE films properties (colorimetric and rheological). Three types of CB were previously evaluated (PART1) and determined that the best formulation was the combination between small (S) and medium (M) particles (F18 and F13), obtaining greater tinting strength with lower viscosity. In this work (PART2), these formulations were processed with different SME levels by varying the extrusion parameters, like screw rotation speed (N) and feed rate (Q), modulate the SME. The result of each process was evaluated by Tinting Strength, MFI, Total Transmittance and it was determined that the process with 600 rpm and 10 kg/h feed rate, generating a SME of 0.29 kWh/kg for F18-P03, developed the best results, mainly in the Tinting Strength, from 126.7% to 133.2% related to F18 (PART1).

Keywords: carbon black, specific mechanical energy, tinting strength, trimodal particle size distribution, viscosity.

How to cite: Barbosa, J. M., Beatrice, C. A. G., & Pessan, L. A. (2022). Influence of carbon black trimodal mixture on LDPE films properties: Part2 – SME. Polímeros: Ciência e Tecnlogia, 32(3), e2022030. https://doi.org/10.1590/01041428.20220053

1. Introduction

With the production of synthetic polymers on a large scale, the need for color identification was observed, and a typical example is the colors of wires and cables, selective collection bins, and safety items, among other applications. Currently, the Synthetic Coloring Industry has been growing in technologies for obtaining high-performance molecules for the plastics industry because it is desired, in addition to the aesthetic appearance and identification of the materials, a contribution to the protection of the polymer matrix, in addition to the specific additives, already traditionally used[1]

Such colorants are subdivided into dyes and pigments, the latter being classified as organic and inorganic. Dyes are soluble substances in the matrix, while pigments do not dissolve and are insoluble in the polymer matrix, remaining as a distinct phase, usually with small particle size[1,2].

Among the main pigments used in polymeric materials, Carbon black (CB) is a particulate form of elemental carbon or industrial carbon. Although composed of elemental carbon, like the two crystalline forms of carbon (diamond and graphite, found in nature), CB differs chemically and physically from these pure and more crystalline forms[3].

Chemically, CB is a colloidal form of elemental carbon produced in specially designed pyrolysis reactors, operating at internal temperatures from 1400 to 2000 °C; different grades can be produced with varying particle sizes and

aggregate structures[4]. The characteristics depend mainly on the manufacturing process or method, and their classification is based on this information. From a chemical point of view, the production processes for manufacturing CB are classified into two categories, the first being Incomplete Combustion and the second being Thermal Decomposition of hydrocarbons, depending on the presence or absence of oxygen. The process via incomplete combustion, termed thermo-oxidative decomposition, is the most important. In terms of production scale, the second process, the thermal decomposition of hydrocarbons in the absence of oxygen, is minimal[3]. The manufacturing methods include different processes, named according to the pyrolysis mechanisms or the raw material source, such as Furnace Black, Gas Black, LampBlack or Thermal Black. More than 95% of the world’s annual production of CB is carried out by the Furnace Black process[4] and this process is illustrated in Figure 1[5]

As for the morphology of this pigment, obtained by partial combustion or thermal decomposition of hydrocarbons, it appears in the form of aggregates composed of spherical primary particles that exhibit a uniformity of sizes of primary particles within a given aggregate and turbostratic layers within the primary particles[6]. It presents a characteristic morphological hierarchy: primary particles, aggregates

https://doi.org/10.1590/0104-1428.20220053 O O O O O O O O O O O O O O O Polímeros, 32(3),
2022 ISSN 1678-5169 (Online) 1/8
e2022030,
Juliano Martins Barbosa1,2* , Cesar Augusto Gonçalves Beatrice1  and Luiz Antonio Pessan1 
1Programa de Pós-graduação em Ciência e Engenharia de Materiais – PPGCEM, Departamento de Engenharia de Materiais – DEMa, Universidade Federal de São Carlos – UFSCar, São Carlos, SP, Brasil
2Engenharia de Materiais, Escola de Engenharia, Universidade Presbiteriana Mackenzie, São Paulo, SP, Brasil

Barbosa, J. M., Beatrice, C. A. G., & Pessan, L. A.

and agglomerates. The fundamental building block of carbon black is the primary particle and they rarely exist in isolation; however, they are solidly coalesced by covalent bonds in aggregates. Primary particles are conceptual in nature; once the aggregate is formed, the primary particle ceases to exist. Once produced, the individual aggregates are joined by secondary bonds (Van der Waals) to form clusters. Agglomerates do not break down into smaller components unless an adequate force (shear) is applied. The primary particle and the size of the aggregates are distributive properties and vary as a function of the CB grade[3,6]. Aggregates are robust structures capable of withstanding shear forces, the smallest units being dispersible. Agglomerates are challenging to measure accurately because they usually break when shear forces are applied.

According to the literature, primary particles exhibit a diameter ranging from approximately 10 to 100 nm and a surface area between 25 and 1500 m2/g. When grouped, they form the characteristic units of CB, called aggregates. Many types of CB, especially those used in plastics, are subsequently converted to higher density granules for easier handling[3]. The Primary Particle size can be accurately determined only by electron microscopy, for example, via ASTM D3849[7]. However, other tests such as hue, iodine index and Nitrogen in Surface Area (NSA) via ASTM D6556[8] can also give indications of the relative size of the particles[3]. Aggregates and distribution properties are also best determined by electron microscopy; however, the absorption of Dibutylphthalate (DBPA) as per ASTM D2414[9] is also commonly used to determine the structure of CB relative to each other.

The morphology of CB is determined by the combination of the Primary Particle and the Structure, and this brings different properties and characteristics to the pigment, which directly impacts the processability of mixtures with it and its performance[10]. Depending on these CB characteristics, different morphologies may eventually be mixed to obtain specific characteristics. The first studies on bimodal packing refer to the rheological behavior of colloidal suspensions in low molecular weight matrices. These studies present relevant information about the correlation between particle size distribution and packing and how this influences the viscosity of the matrix, demonstrating that the widening of

the particle size distribution provides the highest maximum packing fraction (φm), resulting in lower viscosity for the same pigment content[11]. In fact, small particles have greater mobility and can move between large particles and the suspension will have a lower viscosity. The effect of fillers of bimodal size on the properties of rubber and vulcanized compounds has few studies; however, one of them refers to the effectiveness of the insertion of iron particles in the excluded volume of silicone rubber with a bimodal size distribution, and it was observed that mixtures of carbon blacks or any fillers could improve the performance of composites compared to a single distribution composite, correlating the positive results in the quality of the filler dispersion. Therefore, a more accurate assessment of particle packing and its effect on the properties of polymeric compounds is needed[11]

When carbon black particles are incorporated into the polymer, there is an intense interaction between the matrix and the pigment structure, such as physical adsorption on the surface of the carbon black particles. The greater the surface area or structure of the pigment, the greater the interaction between them, and the greater the limitation of the mobility of the chains; that is, the relaxation times will be longer[12]

The rheological measurements commonly used in polymer characterization are the Rheological Properties in Shear Steady State. The measurements are obtained under shear flow, where the velocity has only the component in the flow direction. When a polymer is subjected to a given shear rate, it will present a resistance to flow, indicated by the quantity known as the steady-state shear viscosity, η(  γ). This is one of the most important rheological properties in the processing of molten polymers. The flow rates, pressure drops, and temperature increases, which are important parameters in these operations, directly depend on this property[12]

On the other hand, the Rheological Properties in Shear Oscillatory State are measured using a small amplitude oscillatory shear strain, in which the applied shear stress (or strain) varies at a given frequency. The magnitude of the strain must be small enough to ensure that the measurements fall within the linear viscoelasticity regime. As molten polymers are viscoelastic (they have a response composed

Polímeros, 32(3),

e2022030, 2022 2/8
Figure 1. Schematic diagram of the combustion reactor for the Furnace Black process[5]

of an elastic and a viscous part) and the stress (strain or stress) is of small amplitude, the response (stress or strain) will oscillate with the same frequency; however, it will be out of phase into the load, exhibiting a linear viscoelastic behavior[12,13]

In this way, Zhang et al.[14] determined the rheological behavior of HDPE composite filled with CB at low shear rates under constant temperature. The results indicate the correlation between the dispersed pigment and the polymer matrix. At a sufficiently high filler concentration, a structural skeleton appears to form, which significantly increases the modulus, particularly at low frequencies. The large structure and small primary particle size of CB significantly increase the modulus of elasticity, more than the small structure and larger particle size, for example, an N550, classified according to ASTM D 1765[15]. Oxidized CB increases the modulus of elasticity in the entire frequency region due to the greater interaction between the pigment and the polymer matrix[14].

Regarding particle packing, Aghajan et al.[11] studied bimodal mixtures of CB, type N220 and N550, with different average particle sizes but similar structures. The maximum packing density in the CB blend was achieved in the 35/65 composition of N220 / N550. In addition, some properties of non-vulcanized compounds, such as bulk density, rheometry and non-linear viscoelasticity, showed synergistic effect when the rubber was filled with this bimodal mixture. It is observed that the bimodal mixture of CB forms a packed or network structure with a short distance between particles in which the macromolecules are highly immobilized, playing an essential role in the density and rheological properties of the compounds. This phenomenon was absent in the vulcanized state of the compounds due to the degree of vulcanization and chemical crosslinking density in the rubber; however, such properties were improved as a function of the packing of the particles[11]

Therefore, studying the packing and distribution of particles and how this behavior influences the rheological properties of a composite or nanocomposite is of fundamental importance for the understanding its processability characteristics and the relationship between its structure and properties, in addition to providing information about the distribution and dispersion of particles in the polymer matrix, which directly affect and influence the processing characteristics and interfering with the colorimetric performance of the composition.

2. Materials and Methods

2.1 Materials

The inorganic pigment (Carbon black - CB) was identified as Black Pearls 900 (Small - S), Regal 99I (Medium - M) and Black Pearls 120 (Large - L), all supplied by Cabot

Table 1. Principal properties of carbon black[16]

Properties

Corporation (USA), according to Table 1[16] and dispersed at 30% loading in low density polyethylene (LDPE) grade PB608[17], with MFI of 30 g/10min (2.16 kg@190 °C) or 65 g/10min (5.00 kg@190 °C) produced by Braskem (Brazil).

2.2 CB concentrates preparation

Using the best formulation previously defined in PART 01, identified as F18 (25/75/00) and F13 (75/00/25), extrusion parameters were varied to improve concentrate dispersion in a twin-screw extruder by Specific Mechanical Energy (SME) of the process according to screw rotation speed (N) and feed rate (Q) in a ZSK18 (Coperion GmbH) with L/D 48 (same screw profile shown in part01), maximum power of 4 kW (5.43 hp), maximum amperage of 15.2 A, maximum screw rotation speed of 600 rpm and maximum feed rate of 140 kg/h by the main feeder (without using side feeder) and thermal profile between 120 and 180 °C. The parameters associated with the SME are presented in Equation 1[18,19]

where, SME = Specific Mechanical Energy (kWh/kg), N0 = extruder screw rotation speed (rpm), Nmax = maximum extruder screw rotation speed (rpm), Wmax = maximum power of the extruder engine (kW), T = extruder torque (%) and Q = feed rate (kg/h).

To obtain different levels of SME and vary its value, two values of extrusion screw rotation speeds (N) and two values of feed rates (Q) were used, as shown in Table 2

The screw elements profile extruder was based on information available in the literature[20,21]; however, there was a need for adaptation due to the difference in L/D between the extruders.

2.3 Dilution of CB concentrates

For some tests, measurements were done in a polymeric film and the specimens were prepared by blow mold extrusion (thickness 40 μm and blowing ratio of 1:3) with dilution at 5% in LDPE (MFI 2 g/10min).

2.4 Characterizations

2.4.1 Composition characterization

The CB content in the samples was determined via gravimetric after pyrolysis at 600 °C in a nitrogen atmosphere and then in a regular atmosphere, following the ASTM D1603[22]

Unit Standard BP 900 (S) Regal 99I (M) BP 120 (L)

Primary particle nm ASTM D3849 15 38 75

Oil absorption (OAN) cc/100g ASTM D2414 64 63 64

Nitrogen Surface Area (NSA) m2/g ASTM D6556 230 62 25

Tinting Strength % ASTM D3265 151 97 58

Polímeros, 32(3), e2022030, 2022

Influence of carbon black trimodal mixture on LDPE films properties: Part2 – SME
3/8
100 max max N T W N SME Q  ××   =   
(1)

Barbosa, J. M., Beatrice, C. A. G., & Pessan, L. A.

2.4.2 Rheological properties characterization of CB concentrates

The MFI, which is a basic determination of the rheological behavior of compositions, was determined according to ASTM D1238 (5.00 kg@190 ºC)[23]. Subsequently, the rheological properties were determined at low (parallel plates) and high (capillary) shear rates. The Complex Viscosity (η*) as a function of angular frequency (ω) was determined in a rheometer ARES from Rheometric Scientific (N2 atmosphere, 210 °C, parallel plates geometry with a diameter of 25 mm and 1 mm of gap) with a frequency range between 10-2 and 102 rad.s-1 and a constant strain of 1% (linear viscoelastic region). The behavior at high shear rates was obtained by capillary rheometry in an Instron rheometer, model 4467 (Lc = 24.384 mm, Dc = 1.270 mm, Lc/Dc = 20 at 210 °C) with a shear rate range between 101 and 104 s-1 which is equivalent to the values found in a twin-screw extrusion process[12].

2.4.3 Colorimetric and optical properties characterization

The tinting strength is a quantitative method for comparing pigment performance to a reference. Prepared by mixing one part of CB concentrate (black) with ten parts of titanium dioxide pigment (white) – 1:10, generating a gray color. The more intense this gray, the greater the tinting strength of CB, as it stands out over white. On the other hand, the less intense the gray, the lesser the tinting strength because the white pigment stands out from the CB. The quantitative determination was performed in a spectrophotometer Datacolor (SF 600), using Contrast Ratio mode, calculated by the CIE LAB L*a*b system[24]. For Total Transmittance (TT), measured in film specimen, which physically represents the total incident light and transmitted through the sample, being reduced by the reflectance or absorption of light by the sample, measured using a BYK Gardner spectrophotometer

Table 2. Processing parameters for SME modulation.

Process N (rpm) Q (kg/h) P01 300 10 P02 300 20 P03 600 10 P04 600 20

Table 3. Results of the main characterization tests.

Sample N (rpm) Q (kg/h) SME (kWh/ kg)

CB content (%) MFI (g/10min)

(Haze-Gard Plus), following ASTM D1003 standard, operating in transmittance mode[25-27]

2.4.4 Dispersion and microscopy characterization

The state of the dispersion was evaluated by two techniques: the first (quantitative) via the Filter Pressure Value (FPV) and the second (qualitative) by Optical Microscopy (OM), observing the agglomerates dispersed in the polymer matrix. The FPV evaluates the degree of dispersion of pigments through a standardized screen filtration mounted on an extruder and this filtration generates retention of undispersed pigment particles. The degree of dispersion can be quantified by the pressure variation, according to EN-13900[28], using #635 mesh (15 μm), 220 °C and 200 g of concentrate. The OM was used to observe the CB microdispersion in the film specimen using a Leica microscope (DMRXP) and the images were captured with Image Pro Software at 400x magnification.

3. Results and Discussions

In PART 1 of this study, the best CB combination was identified, F13 (75/00/25) and F18 (25/75/00), prepared in a twin-screw extruder, using 300 rpm@20 kg/h, resulting in the best dispersion, with the highest possible tinting strength and maintaining the lowest viscosity. In this PART 2, SME Extrusion was used to improve the dispersion, according to Table 3

F13 (75/00/25) and F18 (25/75/00) samples were evaluated in independent groups for better observation of the process variables and the balance between the colorimetric properties and viscosity of the formulation. As the desired result, the lowest possible FPV, higher Tinting Strength and higher MFI are expected to maximize the colorimetric properties with the lowest viscosity for processing. Regarding F13 (75/00/25) results, best values from Tinting Strength and FPV were obtained with N of 600 rpm and Q of 10kg/h in the formula F13-P03 with 124.8% and 15.4 bar, respectively. The colorimetric effect with the increase in tinting strength can be observed in the Ref. (F17) x Result columns, showing the darker gray. The highest MFI was obtained with the same Q but with an N of 300 rpm, resulting in 14.7 g/10min in F13-P01. The same trend was observed in the behavior of the

Tinting Strength (%) Ref. (F17) Result FPV (bar) TT (%)

F13-P01 300 10 0.15 29.6 14.7 114.9 22.1 10.7 ± 0.8

F13-P02 300 20 0.10 28.5 9.2 122.3 20.3 8.1 ± 0.7

F13-P03 600 10 0.28 30.2 7.2 124.8 15.4 7.5 ± 0.7

F13-P04 600 20 0.16 29.9 9.4 120.7 17.4 9.2 ± 0.6

F18-P01 300 10 0.14 29.6 23.4 129.4 1.5 7.2 ± 0.4

F18-P02 300 20 0.09 30.3 19.7 127.3 1.6 7.5 ± 0.5

F18-P03 600 10 0.29 30.2 16.2 133.2 1.5 5.7 ± 0.8

F18-P04 600 20 0.16 29.8 18.1 124.4 1.7 8.5 ± 0.9

Polímeros, 32(3),

2022 4/8
e2022030,

results for F18 (25/75/00), that is, higher Tinting Strength and lower FPV obtained 600rpm and 10kg/h, with the formula F18-P03 with 133, 2% and 1.5 bar, respectively. Visually, the colorimetric effect obtained by the increase in the tinting strength is more intense, as evidenced by the difference in tones observed between the Ref. (F17) x Result columns. The highest MFI was obtained with the same Q but with 300 rpm, resulting in 23.4 g/10min in the F18-P01. These behaviors in results can be observed in Figure 2 in the form of Misture Contour Graphics.

In Table 3, it is shown the correlation between the Total Transmittance (TT) and the Tinting Strength; thus, the greater the tinting strength, the lower TT because the pigment dispersed in the matrix, in addition to providing coloration, also reduces the passage of light in the substrate. This correlation is observed graphically in Figure 3 Evaluating the Complex Viscosity of the samples, it is observed that the difference in the profile of the curves was discrete and there was almost no variation between the curves of F13-P01 and F13-P03, which represent the extreme values of MFI. Subtly, F13-P03 showed higher viscosity than F13-P01, probably due to the higher SME in the process, which resulted in better pigment dispersion in the matrix, as observed in increased tinting strength and reduced FPV. The same logic applies to sample F13 (75/00/25). Regarding the F18 group, it is observed that the variation

Polímeros, 32(3), e2022030, 2022

in processing did not bring significant differences between F18-P01 and F18-P03; however, both had lower viscosity than F18 (25/75/00) with an increase in Tinting strength, which went from 126.7% to 133.2% but the FPV had a slight increase, going from 1.2 bar to 1.5 bar. This is due to a more efficient process, which dispersed the pigment better, increasing the Tinting strength without interfering with the viscosity of the system, as presented in Figure 4.

At high shear rates, the curves produced in capillary rheometry are shown in Figure 5. As observed, even at high rates, the rheological profile of viscosity remained close until 103 s-1; however, we have two very different groups of samples depending on the formulation, that is, the F13 group, with higher viscosity, with emphasis on F13 (75/00/25) and F13-P03, with values higher than F13-P01 due to the higher SME used in the process and which resulted in better pigment dispersion and consequent increase in tinting strength. In the F18 group, with lower viscosity, F18 (25/75/00) and F18-P01 showed similar behavior, while F18-P03 had a slightly higher viscosity than the others; however, it developed a significant increase in Tinting strength (133.2%) with low FPV (1.5 bar).

In Table 4, it is shown the Power Law Index (n) of the curves obtained by capillary rheometry, indicating the pseudoplasticity. Broadly, the F13 group showed greater pseudoplasticity than the F18 group. The formula F13-P01 presented n of 0.435,

Influence of carbon black trimodal mixture on LDPE films properties: Part2
5/8
Figure 2. Mixture Contour Graphics of MFI, FPV and Tinting Strength for F13 (a) and F18 (b) groups.

Barbosa, J. M., Beatrice, C. A. G., & Pessan, L. A.

Table 4. Power Law Index at high shear rates - F13 and F18 group.

Sample N (rpm) Q (kg/h) FPV (bar) Tinting stregth (%) n

F13 (75/00/25) 300 20 14 113.9 0.379 F13-P01 300 10 22.1 114.9 0.435 F13-P03 600 10 15.4 124.8 0.413 F18 (25/75/00) 300 20 1.2 126.7 0.484

F18-P01 300 10 1.5 129.4 0.506 F18-P03 600 10 1.5 133.2 0.469

Figure 3. Correlation between Tinting strength and total transmittance (TT).

which showed less pseudoplasticity than the F13-P03, with 0.413. The latter developed greater tinting strength. This is probably due to the more significant interaction between the matrix and the S pigment obtained by the better dispersion with increasing SME.

On the other hand, F18-P01 presented an n of 0.506 while F18-P03 had an n of 0.469, emphasizing that F18-P03 developed greater tinting strength, with lower viscosity and less pseudoplasticity, which represents easiness in processing and a better distributed pigment in the matrix. It also indicates that this process was able to disperse the pigment very well in the matrix, with no changes in viscosity at high rates.

The Specific Mechanical Energy (SME) used in each processing, which was modulated as a function of the rotation speed of the extruder screw (N) and the feed rate (Q) in the processes and monitored by the Torque (%) of the extruder motor, shows that the best dispersion results, leading to an increase in tinting strength, were obtained with higher levels of SME, as shown in Table 3

Figure 4. Complex Viscosity of F13 (a) and F18 (b) groups.

The above results are better explained in the OM micrographs below, which illustrate the clusters present in the films. It is observed that the P01 process (300 rpm@10 kg/h) was less efficient in the dispersion of CB, with the presence of a greater number of agglomerates due to the lower SME used in the processing. (0.14 and 0.15 kWh/kg). The P03 process (600 rpm@10 kg/h) produced a smaller number of agglomerates and a greater Tinting Strength, as discussed above and presented by the images in Figure 6

Figure 5. Viscosity at high shear rates of F13 and F18 groups.

Evaluating all the results presented, it is observed that the best results in Tinting strength and FPV were obtained with the use of the highest SME in the process, that is, values of 0.28 kWh/kg for F13-P03 and 0.29 kWh/kg for F18-P03, both used 600 rpm of rotation speed (N) and 10 kg/h in feed rate (Q). As for the formula variable, that is, the performance response of each of the mixtures as a function of the process, F18 (25/75/00) presented higher Tinting strength and lower FPV than F13 (75/00/25), as shown earlier in the results. In the rheological effect, an increase in viscosity was observed as a function of the increase in SME. However, the lowest impact was obtained with F18 (25/75/00) observed in the Complex Viscosity curves presented. In this way and based on the results presented above, the formula that followed for PART 03 was F18-P03.

Polímeros, 32(3),

2022 6/8
e2022030,

4. Conclusions

The trimodal mixture and distribution of different CB can produce an optimized combination between these pigments to improve the colorimetric properties, with less interference in the rheological and processing characteristics of the polymer, compared to using a single particle. In this study, the formulations F18 (25/75/00) and F13 (75/00/25) were processed with different levels of specific mechanical energy (SME), modulated by the screw rotation speed (N) and the feed rate (Q). It was determined that the higher energy level, in this case, 0.29 kWh/kg, brought an increase in tinting Strength, which went from 126.7% to 133.2% in the F18-P03, maintaining the viscosity due to the better dispersion of the pigment in the matrix, which was also detected in the complex viscosity. On the other hand, the F13-P03, due to the higher energy, improved its performance, slightly increasing the tinting strength from 113.9% to 124.8%. However, the MFI reduced from 29.7 g/10min to 7.2 g/10min, also observed in the rheological curves, demonstrating an increase in viscosity, compared to the previous study, due to the better dispersion of the pigment. Based on these results, it was possible to define the best process, with an SME of 0.29 kWh/kg using 600 rpm of rotation and 10 kg/h of feed rate, for the F18-P03.

5. Author’s Contribution

• Conceptualization – Juliano Martins Barbosa; Luiz Antonio Pessan.

• Data curation – Juliano Martins Barbosa; Luiz Antonio Pessan.

• Formal analysis – Juliano Martins Barbosa; Cesar Augusto Gonçalves Beatrice; Luiz Antonio Pessan.

• Funding acquisition – NA.

• Investigation – Juliano Martins Barbosa; Luiz Antonio Pessan.

• Methodology – Juliano Martins Barbosa; Cesar Augusto Gonçalves Beatrice; Luiz Antonio Pessan.

• Project administration – Juliano Martins Barbosa; Luiz Antonio Pessan.

• Resources – Juliano Martins Barbosa; Cesar Augusto Gonçalves Beatrice.

• Software – NA.

• Supervision – Juliano Martins Barbosa; Luiz Antonio Pessan.

• Validation – Juliano Martins Barbosa; Luiz Antonio Pessan.

7/8
Influence of carbon black trimodal mixture on LDPE films properties: Part2 – SME
Polímeros, 32(3), e2022030, 2022
Figure 6. Comparative optical micrographs (OM) of F13 and F18 group, with 400X magnification.

Barbosa, J. M., Beatrice, C. A. G., & Pessan, L. A.

• Visualization – Juliano Martins Barbosa; Luiz Antonio Pessan.

• Writing – original draft – Juliano Martins Barbosa; Luiz Antonio Pessan .

• Writing – review & editing – Juliano Martins Barbosa; Cesar Augusto Gonçalves Beatrice; Luiz Antonio Pessan.

6. Acknowledgements

This study was financed in part by the Coordenação de Aperfeiçoamento de Pessoal de Nível Superior - Brasil (CAPES) - Finance Code 001. The authors would like to thank the Engineering School of Mackenzie Presbyterian University, Cabot Corporation, Braskem S/A, and Cromex S/A for the technical support and donation of materials.

7. References

1 Rabelo, M. S. (2000). Aditivação de polímeros São Paulo: Artliber

2 Callister, W. D., Jr. (2002). Ciência e engenharia dos materiais: uma introdução Rio de Janeiro: LTC

3. Donnet, J.-B. (Ed.). (1993). Carbon black: science and technology (2nd ed.). New York: Routledge. http://dx.doi. org/10.1201/9781315138763.

4 Penta Carbon. (2020, November 11). Retrieved in 2022, May 7, from https://pentacarbon.de/es/wiki/

5 Pfaff, G. (2021). Carbon black pigments. Journal Physical Sciences Reviews, 7(2), 109-125 http://dx.doi.org/10.1515/ psr-2020-0152

6 Carbon Black Association. (2016). Carbon black user’s guide. USA: Carbon Black Association. Retrieved in 2022, May 7, from http://www.cabotcorp.de/~/media/files/product-stewardship/ industry-user-guides/international-carbon-black-associationicba-user-guide-portuguese.pdf

7 American Society for Testing and Materials – ASTM. (2014). ASTM D3849-14a: standard test method for carbon black: morphological characterization of carbon black using electron microscopy. West Conshohocken: ASTM http://dx.doi. org/10.1520/D3849-14A

8 American Society for Testing and Materials – ASTM. (2021). ASTM D6556-21: standard test method for carbon black: total and external surface area by nitrogen adsorption. West Conshohocken: ASTM http://dx.doi.org/10.1520/D6556-21

9 American Society for Testing and Materials – ASTM. (2018). ASTM D2414-18: standard test method for carbon black: oil absorption number (OAN). West Conshohocken: ASTM http:// dx.doi.org/10.1520/D2414-18

10 Spahr, M. E., & Rothon, R. (2015). Carbon black as a polymer filler. In S. Palsule (Ed.), Encyclopedia of polymers and composites (pp. 1-24). Berlin: Springer. http://dx.doi. org/10.1007/978-3-642-37179-0_36-1.

11. Aghajan, M. H., Hosseini, S. M., & Razzaghi-Kashani, M. (2019). Particle packing in bimodal size carbon black mixtures and its effect on the properties of styrene-butadiene rubber compounds. Polymer Testing, 78, 106002 http://dx.doi. org/10.1016/j.polymertesting.2019.106002

12 Bretas, R. E. S., & D’Avila, M. A. (2000). Reologia de polímeros fundidos. São Carlos: EdUFSCar

13 Aoki, Y., Hatano, A., & Watanabe, H. (2003). Rheology of carbon black suspensions. I.Three types of viscoelastic behavior.

Rheologica Acta, 42(3), 209-216 http://dx.doi.org/10.1007/ s00397-002-0278-3

14. Zhang, J.-F., & Yi, X.-S. (2002). Dynamic rheological behavior of high-density polyethylene filled with carbon black. Journal of Applied Polymer Science, 86(14), 3527-3531 http://dx.doi. org/10.1002/app.11101

15 American Society for Testing and Materials – ASTM. (2021). ASTM D1765-21: standard classificationsystem for carbon blacks used in rubber products. West Conshohocken: ASTM http://dx.doi.org/10.1520/D1765-21

16 Cabot Corporation. (2021, February 5). Retrieved in 2022, May 7, from https://www.cabotcorp.com/solutions/applications/ plastics

17 Braskem. (2021, April 19). Retrieved in 2022, May 7, from https://www.braskem.com/busca-de-produtos?p=133

18. Domenech, T., Peuvrel-Disdier, E., & Vergnes, B. (2013). The importance of specific mechanical energy during twin screw extrusion of organoclay based polypropylene nanocomposites. Composites Science and Technology, 75, 7-14 http://dx.doi. org/10.1016/j.compscitech.2012.11.016

19. Dreiblatt, A. (2018). Torque VS specific energy [Webinar]. Century Extrusion Group. Retrieved in 2022, May 7, from https://ekc.cpmextrusiongroup.com/project/torque-vs-specificenergy/

20 Manas, I., & Tadmor, Z. (Ed.). (1994). Mixing and compounding of polymers: theory and practice. USA: Hanser Publishers.

21 Lotti, C., Isaac, C. S., Branciforti, M. C., Alves, R. M. V., Liberman, S., & Bretas, R. E. S.. (2008). Rheological, mechanical and transport property of blow films of high density polyethylene nanocomposites. European Polymer Journal, 44(5), 1346-1357 http://dx.doi.org/10.1016/j.eurpolymj.2008.02.014

22 American Society for Testing and Materials – ASTM. (2020). ASTM D1603-20: standard test method for carbon black content in olefin plastics. West Conshohocken: ASTM http://dx.doi. org/10.1520/D1603-20.

23 American Society for Testing and Materials – ASTM. (2013). ASTM D1238-13: standard test method for melt flow rates of thermoplastics by extrusion plastometer. West Conshohocken: ASTM http://dx.doi.org/10.1520/D1238-13

24 Datacolor Color Measurement Instruments & Software. (2021, April 4). Retrieved in 2022, May 7, from https://www.datacolor. com/business-solutions/product-overview

25 Sarantópoulos, C. I. G. L., Oliveira, L. M., Padula, M., Coltro, L., & Alves, R. M. V. (2002). Embalagens plásticas flexíveis: principais polímeros e avaliação das propriedades. Campinas: CETEA/ITAL

26 Byk Instruments. (2021, May 14). Haze-gard transparency transmission haze meter. Retrieved in 2022, May 7, from https://www.byk-instruments.com/en/Appearance/haze-gardTransparency-Transmission-Haze-Meter/c/2345

27 American Society for Testing and Materials – ASTM. (2013). ASTM D1003-13: standard test method for haze and luminous transmittance of transparent plastics. West Conshohocken: ASTM http://dx.doi.org/10.1520/D1003-13

28 British Standards Institution – BSI. (2005). BS EN 139005:2005: pigments and extenders: methods of dispersion and assessment of dispersibility in plastics - part 5: determination by filter pressure value test. Belgium: BSI. http://dx.doi. org/10.3403/30105254U

Received: May 13, 2022 Revised: Aug. 14, 2022 Accepted: Oct. 03, 2022

Polímeros, 32(3), e2022030,

2022 8/8

Poly(methyl methacrylate) and silica nanocomposites as new materials for polymeric optical devices

Materiais

Obstract

PMMA is one of the most used polymers for optical applications, due to its well-known optical properties and low-cost. PMMA/fumed silica nanocomposites were synthesized by in situ polymerization under sonication to produce optical materials using two types of silica, a PDMS surface-modified and an unmodified one. Silica content and sonication amplitude effects on nanocomposites properties were studied by factorial experimental designs. Nanocomposites retained the high transparency of pristine PMMA, especially at lower levels of silica and sonication. Rheological analysis indicated better dispersion of the unmodified silica in PMMA. Dispersed silica in the PMMA nanocomposites decreased the PMMA refractive index by 0.012, making PMMA/fumed silica suitable for the cladding layer of PMMAcore waveguides, resulting in the total reflectance phenomenon for light guiding. Therefore, PMMA/fumed silica nanocomposites provide promising materials for polymer optical devices, such as optical fibers and panels, optical sensors and biosensors, photonic platforms, daylighting, and multi-touchscreen displays.

Keywords: polymer optical fibers, in situ polymerization, fumed silica, sonication, rheology.

How to cite: Affonso Netto, R., Menezes, F. F., Maciel Filho, R., & Bartoli, J. R. (2022). Poly(methyl methacrylate) and silica nanocomposites as new materials for polymeric optical devices. Polímeros: Ciência e Tecnlogia, 32(3), e2022031. https://doi.org/10.1590/0104-1428.20220009

1. Introduction

Optical fibers and waveguides are devices that transmit light signals with high speeds and low losses[1]. Light is continuously reflected inside a continuous core coated with a cladding, (total internal reflection)[1,2] which has a lower refractive index by, at least, 0.002 to 0.005, depending on the diameter of the core (usually 10 µm in monomode and 50 µm in multimode fibers)[1]. This difference between refractive indexes may be gradual or stepwise and the materials used for core and cladding may be silica or polymer-based[1]. Silica optical fibers (SOF) show the best optical properties, despite their low elastic limit hindering flexibility unless the fiber is produced with reduced diameters (less than 125 µm)[1,2], which might save space and weight, but causes handling problems, especially at connections, raising costs[1]. SOFs were revolutionary at optoelectronics, photonics and telecommunications, enabling high-speed data transfer (higher than 10 Gb/s) free of electromagnetic interferences[1,2]

Alternatively, polymeric optical fibers (POFs) have their core and cladding made of polymers[1–3], and the most used for POFs are poly(methyl methacrylate)

(PMMA)[1,4], polystyrene (PS)[5], polycarbonate (PC)[6], cyclic olefin polymers[7], fluorinated polymers blends, such as poly(vinylidene fluoride) (PVDF)[8] and plasma fluorinatedsurface polymers[4]. POFs show advantages compared to silica fibers, such as flexibility, enabling manipulation like bending with small radius without transmittance losses[1,2,9] Assembly of POFs is easier and application of visible light (usually at 680 nm) allows detection by eye[1]. POFs show good weathering resistance, enabling outdoor, underground, and even underwater applications[1,2,9].

However, POFs show disadvantages compared to SOFs, such as attenuation of the transmitted signal level and bandwidth over long distances, limiting their use to a 1 km radius[1]. Nevertheless, most of the Local Area Networks (LAN), Fiber to the Home (FTTH) technologies and industrial automation networks are located within this radius, making POFs advantageous over metallic conductors, such as copper wirings when regarding signal transmittance ratio and electromagnetic interferences[1,9,10]

Application of polymers on optical fibers and waveguides have been widely studied due to their molecular structure

https://doi.org/10.1590/0104-1428.20220009 O O O O O O O O O O O O O O O Polímeros, 32(3),
2022 ISSN 1678-5169 (Online) 1/9
e2022031,
Rafael Affonso Netto1* , Fabrícia Faria de Menezes2 , Rubens Maciel Filho2  and Julio Roberto Bartoli1* 
1Laboratório de
Dielétricos, Ópticos e Nanocompósitos – LMDON, Departamento de Materiais e Bioprocessos – DEMBio, Faculdade de Engenharia Química – FEQ, Universidade Estadual de Campinas –UNICAMP, Campinas, SP, Brasil
2Laboratório de Otimização, Projetos e Controle Avançado – LOPCA, Departamento de Desenvolvimento de Processos e Produtos – DDPP, Faculdade de Engenharia Química – FEQ, Universidade Estadual de Campinas – UNICAMP, Campinas, SP, Brasil *netto.affonso@gmail.com; bartoli@unicamp.br

versatility in establishing different refractive indexes, their well-known transformation processes, significant costbenefit ratio and raised flexibility limits, aspects that lead to several applications for POFs or waveguides, such as optical sensors, actuators, integrated optics, optical amplifiers, optoelectronic devices, photonic platforms, and others, industrial, automotive, aeronautics, and automation[1,4,10]

Microstructured optical fibers (MOFs), or photonic crystals, led to a great development in fiber technology[9,10], exhibiting different properties compared with regular fibers since a MOF structure consists of a geometric arrangement of repeating microscopic cavities along the cross-section of the fiber, considerably reducing the optical losses[11,12]. Recently, Cordeiro et al.[7] assembled a low-cost, laboratory bench extrusion machine to manufacture polymeric MOFs in a single-step process. In another work[13], nanocomposite films made from PMMA and fumed silica produced by sonication enabled promising applications as solid-state electrolytes for electrochromic windows and optoelectronic devices.

From another perspective, nanotechnology enables advances in the development of new, high-performance, innovative nanocomposite materials[14-27], with unique properties deriving from a synergistic relationship between a polymer matrix and a nanometric filler[25-27] that depends on particles dimensions, chemical affinity between polymer and particles and their dispersion on a nanometric scale within the matrix[25-27]. New properties of nanocomposites, such as mechanical and thermal enhancements, electric conductivity and different chemical reactivity depend on the type of filler, and might not be observed with micrometric or macrometric particles[28-39]. Several studies on PMMA nanocomposites showed that their mechanical properties can be enhanced without impairing their remarkable optical properties[12,13,34]. Reinforcement resulted by adding silica nanoparticles to amorphous polymers stems mainly from molecular stiffening of polymer chains due to interactions with nanoparticles, which show larger surface area interacting with these chains, increasing their physical adsorption[40-45] Light’s wavelength is higher than particles nanometric size, therefore, these particles would not influence the optical properties of the nanocomposites[46]. Polar OH groups on silica particles also interact with the dipoles on PMMA pendant groups through Van der Waals interactions. Silica particles have been widely studied in composite materials, showing versatile properties and enabling materials for various applications[43,44,47,48]

Several methods were applied to achieve homogeneous particle dispersion in nanocomposites, avoiding particle agglomerates or clusters[44,45]. One of these methods, in situ polymerization, consists in placing the filler inside the reaction site from the beginning of the reactions[44,45] Another method, sonication with an ultrasound probe, also provides advantages, such as lower reaction temperatures, higher filler particles or additives dispersion achieved on the reaction site by cavitation, breaking of particle clusters or agglomerates, facilitated mass transfer phenomenon, and elevated reaction conversions. Adequate sonication energy, time, and amplitude enables better control over polymer molar mass and morphology[49-51]

PMMA nanocomposites, with adequate cost-benefit ratio, are promising materials for optical devices such as optical fibers, waveguides and optical substrates for touch screens. In this study, PMMA and fumed silica nanocomposites were synthesized by in situ polymerization, in chloroform solution under sonication with ultrasound probe. Chloroform was chosen because it has the same solubility parameter as PMMA (19 MPa0.5), dissolving both PMMA and the MMA monomer, allowing better heat dissipation, maintaining a low viscosity of the reaction medium and favoring intercalation of silica nanoparticles with the growing polymeric chains. In addition, polymerization temperature is lower using chloroform (60°C). Rapid volatilization of chloroform is also useful in the preparation of PMMA films by casting.

Objectives of this work were to obtain PMMA nanocomposites applicable on optical devices. Two types of commercial fumed silica nanoparticles were used as fillers, one is surface-modified with polydimethylsiloxane (PDMS) and the other is unmodified. Optical and rheological properties were analyzed using two experimental designs as a function of nanoparticles content (2% to 6%, in weight) and ultrasound relative amplitude (26% to 50%). Range of nanosilica amount used in this work was assumed from Abramoff and Covino[38]. According to the authors, transmittance of PMMA, filled with fumed silica, decreases with increasing filler content, but increases as nanofiller dispersion improves within the matrix, which occurs as particles specific surface increases; that is, decrease in primary particle size.

Several factors that can influence the course of an ultrasound-assisted polymerization, such as intensity of the ultrasound amplitude, since the amount of bubbles generated in the reaction medium is closely linked to this variable, and affects the intensity of the cavitation phenomenon. Therefore, applied ultrasound amplitude is a factor that must be studied and planned if used in a polymerization. Price et al.[40,41] studied ultrasound-assisted polymerization of methyl methacrylate (MMA) and its degradation, with an effect on the molar mass of the obtained polymer. Degradation of PMMA molar mass occurs with increasing sonication time, inversely proportional to the square root of the ultrasound intensity.

2. Materials and Methods

2.1 Materials

MMA (99.9%) was supplied by UNIGEL. Silica nanoparticles were: AEROSIL® 300 (99.8%), average primary particle size of 7 nm, supplied by EVONIK, named nanosilica-A; and CAB-O-SIL® TS720 (99.4%), surfacemodified with polydimethylsiloxane (PDMS), average particle size around 0.4 µm, supplied by CABOT®, named nanosilica-C. Chloroform (99.8%) was used as solvent, supplied by Synth. AIBN (2,2’-azobis-(isobutyronitrile)) was used as initiator, supplied by DuPont. Gaseous N2 (99.996%) was supplied by White Martins.

2.2 Synthesis of nanocomposites

Nanocomposites were synthesized by in situ, solution, chain-growth polymerization with sonication, gaseous N2 as

Polímeros, 32(3), e2022031,

2022 2/9

Poly(methyl methacrylate) and silica nanocomposites as new materials for polymeric optical devices

inert atmosphere, and named according to the type of silica nanoparticles used. Chloroform (75 mL) was added to each amber flask (125 mL). Next, silica nanoparticles were added following the experimental designs (Table 1), with triplicate central points (22 + 1). Next, 25 mL of MMA and 0.1927 g of AIBN were added, in a mole ratio of 200 MMA : 1 AIBN. Proportion between MMA and chloroform was chosen to ensure constant solution viscosity and proper heat dissipation throughout the reactions Seven nanocomposites samples were synthesized for each nanosilica type. An unfilled PMMA sample was also produced without silica, named pristine, totaling 15 samples.

Polymerizations started with sonication (Q700 processor, QSONICA®, 700 W, 20 kHz) applied with a probe (diameter: 6.4 mm, maximum amplitude: 170 µm) in pulses of 1 s for 25 min of active sonication at the beginning of the reaction (50 min total), for all samples under inert N2 atmosphere flow (5.0 L/min). Relative amplitude of sonication probe ranged from 26% to 50% (Table 1). Next, the flasks were closed, sealed and kept in an oven at 60°C for 24 h to complete polymerization. Afterwards, samples solutions were used to produce films by casting. Precipitation of the synthesized samples was also conducted in methanol (12 hours, in ice bath), followed by filtration and drying in an oven, at 70°C for 72 h. Precipitated nanocomposites and pristine PMMA samples were used to produce discs through press molding.

2.3 Preparation of nanocomposites films and discs samples

Sample films of the nanocomposites and pristine PMMA were prepared from the produced solutions by casting and left for 24 hours at room temperature at a laboratory fume hood for solvent evaporation. After drying, the films easily detached from the aluminum sheet substrate. Disc-shaped test specimens (25 mm diameter and 1 mm thick) of the nanocomposites and pristine PMMA were prepared by compression molding (155ºC, 10 min).

2.4 Characterization methods

UV-visible spectroscopy analyses were performed on the nanocomposites and pristine PMMA films using a Shimadzu UV-1800 UV-Vis Spectrophotometer, wavelength range from 200 to 800 nm. Refractive index measurements were performed on the nanocomposites and pristine PMMA discs using a Carl Zeiss Abbe refractometer, at 589 nm wavelength (sodium D line light), at 23°C, with mono-bromonaphthalene

as contact liquid. Small Amplitude Oscillatory Shear (SAOS) parallel-plate rotational rheometry analyses were performed on the nanocomposites and pristine PMMA discs using a Thermo Scientific RheoStress 600 rheometer, at 190°C, under inert atmosphere (N2), frequency range from 1.5 × 10⁻³ Hz (9.42 × 10⁻³ rad/s) to 15 Hz (94.2 rad/s), and 500 Pa stress at the linear viscoelastic regime.

3. Results and Discussions

3.1 Optical properties of the nanocomposites and pristine PMMA

3.1.1 UV-Vis transmittance

Figure 1 shows the maximum measured UV-visible transmittance for pristine PMMA as 87.4% at 600 nm wavelength, slightly lower than the 92% reference value for PMMA at 600 nm in other works[23,24,41-43], which is associated to heterogeneities due to the casting process and possible solvent or monomer residues[45,46]. On the other hand, the maximum transmittances on visible light for the nanocomposites films were close to pristine PMMA films. At 600 nm wavelength, transmittances were between 83.7% and 86.4% for the PMMA/nanosilica-A nanocomposites and between 82.7% and 86.1% for the PMMA/nanosilica-C nanocomposites.

The obtained values enable usage of these materials in optical devices. It should be noted that the lowest intrinsic losses by light absorption in PMMA, due to the harmonics of molecular vibrational absorption in C−H bonds, appear at 506 nm, 568 nm, and 650 nm[38,40-47], hence, wavelengths

Polímeros, 32(3), e2022031, 2022

3/9
Transmittance values for nanocomposites and pristine PMMA films for wavelengths from 300 to 800 nm. Table 1. Experimental design of PMMA/nanosilica-A and PMMA/nanosilica-C nanocomposites. Samples description Variable levels Coded values PMMA/nanosilica-A PMMA/nanosilica-C X1: silica content (%) X2: sonication amplitude (%) X1 X2 2% A26 2% C26 2% 26% –1 –1 6% A26 6% C26 6% 26% 1 –1 2% A50 2% C50 2% 50% –1 1 6% A50 6% C50 6% 50% 1 1 4% A38-1 4% C38-1 4% 38% 0 0 4% A38-2 4% C38-2 4% 38% 0 0 4% A38-3 4% C38-3 4% 38% 0 0 Pristine PMMA 0% 38% - -
Figure 1.

in the visible region are preferred for signal transmissions in PMMA core fibers[1,38,47-49]. UV-Visible transmittances on 300, 350, 450, and 600 nm were statistically assessed for all produced nanocomposites. ANOVA (90%, α = 0.10, Table S1 of the Supplementary Material, calculated with Protimiza®) indicated no significant differences between measured transmittances for both variables. Interactions between variables were also not significant. Figure S1 in the Supplementary Material shows the complete UV-Vis transmittance curves.

Abramoff and Covino[38] described that the transmittance of PMMA/silica composites increases as filler dispersion improves within the polymer matrix when particles specific surface increases. Their results showed higher transmittance values for PMMA composites with nanometric particles due to their diameters being lower than light’s wavelength, as described by the Rayleigh theory[38,47]. From their results, transparency increased from 35% to 40% on PMMA/4% nanosilica films produced by in situ polymerization, at 600 nm wavelength, when particles diameter decreased from 27 nm to 7 nm. Li et al. [13] also prepared transparent thin films of PMMA/fumed silica nanocomposites and evaluated that UV-visible transmittances of their samples increased when particles dispersion increased through the action of a surfactant. Those results are also shown on the transmittances obtained in this work, clearly showing that in situ polymerization aided by sonication yields higher filler dispersion levels in polymer matrices than other processes, but without need for additives. Nanocomposites with Nanosilica-A show higher transmittances than those with Nanosilica-C, specially at lower silica levels and higher amplitudes, indicating that these samples show the most adequate particles dispersion.

3.1.2 Refractive index

The measured refractive indexes (n) of the prepared nanocomposites were lower than the refractive index of pristine PMMA, as expected due to silica’s lower index (1.4585, at 589 nm) compared to unfilled PMMA (1.4960, at 589 nm)[23,24]. The refractive index of a suspension varies linearly with the volume fraction of dispersed particles[47-50]. ANOVA (90%, α = 0.10, Table S2 of the Supplementary Material) of the indexes for silica content and sonication amplitude variables showed no significant effects for the nanocomposites with nanosilica-A on both variables –just a slight effect (p = 0.05) for the silica content and amplitude interactions, whereas, for the nanocomposites with nanosilica-C, sonication amplitude had no significant effect but silica content (p = 3.10−4) and interaction between the variables (p = 0.01) did.

For PMMA/nanosilica-A and PMMA/nanosilica-C nanocomposites the lower measured indexes (Table 2) are adequate for cladding applications due to the Δn ~ 0.006 and Δn ~ 0.012 when compared with pristine PMMA refraction index, respectively, which is enough for optical applications since it is higher than the required Δn ~ 0.002. The statistical significance observed in PMMA/nanosilica-C nanocomposites indexes is probably due to the effect of PDMS on the silica nanoparticle dispersion.

Results for 4% A38-3 are not available due to sample shortage. The particles or aggregates used as fillers should

Table 2. PMMA/nanosilica nanocomposites and pristine PMMA refractive indexes measured at 589 nm.

Sample Refractive index Sample Refractive index

2% A26 1.4902 2% C26 1.4925

6% A26 1.4918 6% C26 1.4840

2% A50 1.4930 2% C50 1.4910

6% A50 1.4905 6% C50 1.4869

4% A38-1 1.4919 4% C38-1 1.4881

4% A38-2 1.4926 4% C38-2 1.4880

4% A38-3 - 4% C38-3 1.4879

Pristine PMMA refractive index: 1.4960

have dimensions lower than 10% of the wavelength of incident light (589 nm) to avoid losses due to scattering by the particles (Rayleigh scattering)[38,47-50], where shock section (Cs) of a particle depends on its diameter (d), light wavelength (λ), and relation between the refractive indices of particle and matrix (m), according to Equation 1[50]: 2 562 42 21 31 s dm C m π λ   =  +  (1)

Therefore, since matching the refractive indexes of particles and matrix is impossible, reduction of losses due to light scattering in composites depends on their phase domains being smaller than light wavelength[46-50]. The lower the Δn between particles and matrix refractive indexes, the less significant is the scattering effect[38,46-50]. Obtained results for transmittance levels and refractive indexes are promising because Δn is high enough for the total internal reflection to happen, but is low enough to achieve low scattering levels, representing original contribution to the knowledge of technological applications for nanocomposites. In situ polymerization aided by sonication enabled the nanocomposites produced in this work to achieve higher levels of transparency and adequate refractive indexes for applications in optical devices and photonic platforms, also, Δn is directly related to particle dispersion in a polymer matrix[38], and a slight tendency of lower Δn for the PMMA/nanosilica-A nanocomposites could be noted, which implies that these nanocomposites achieved higher particle dispersion levels[38].

The numerical aperture (NA) is a critical quality that represents the light incidence angle on optical devices and depends on the difference between the refractive indexes of the materials in which devices are built[1]. It is calculated using Equation 2[1]:

In polymeric waveguides, changes between 0.002 and 0.005 in the refractive index, between its core and cladding, are enough to enable total internal reflection and let light be guided through[1-3,5]. That Δn range results in numerical apertures between 0.08 and 0.12. In this study, the numerical apertures ranged between 0.10 and 0.19 for the two types

Polímeros, 32(3),

Affonso Netto, R., Menezes, F. F., Maciel Filho, R., & Bartoli, J. R.
e2022031, 2022 4/9
( ) ( ) 1 2 2 2 NAnncorecladding =−  (2)

Poly(methyl methacrylate) and silica nanocomposites as new materials for polymeric optical devices

of nanocomposites related to pristine PMMA, as estimated with the obtained refractive indexes shown in Table 2. Thus, the two types of nanocomposites synthesized in this work are promising optical materials as cladding of polymeric optical fibers with a PMMA core.

3.3 Rheological analysis

Rheological behaviors of PMMA/nanosilica nanocomposites and pristine PMMA were assessed by SAOS, parallel-plates rheometry, in molten-state. Zhao et al.[51]. demonstrated that SAOS rheometry is appropriate to determine dispersion levels of nanoparticles in polymeric nanocomposites, since rheological properties are sensitive to structural changes on a nanometric scale[51,52]. Measuring parameters such as shearthinning exponent (nω), elastic plateau at low frequencies (ω), viscosity (η), shear storage (G’), and loss (G”) moduli, contributes to assessing dispersion and determining the percolation threshold of polymeric nanocomposites that follow the power-law relationship between η and ω, as seen on Equation 3[52]: n

Table 3 shows the results of the rheological analyses of the two types of nanocomposites and the pristine PMMA. Figures S3–S17 on the Supplementary Material show the rheological curves of G’, G”, and complex viscosity (η*), as a function of ω, for the nanocomposites and pristine PMMA. A strain sweep analysis was performed prior to the others, as seen on Figure S2 on the Supplementary Material.

Rheological analyses of the two types of nanocomposites showed increases in G’, G”, and η* values in the lowfrequency zone (ω = 1.5 × 10⁻³ Hz) compared to pristine PMMA, except for 6% A26, which probably had inadequate filler dispersion due to high nanosilica content (6%) and low sonication amplitude (26%). These results relate to the molecular stiffening caused in the PMMA chains by the presence of nanoparticles that restricts their relaxation[24,40]

PMMA/nanosilica-A nanocomposites showed the highest G’ values, between 0.69 to 1.56 kPa, at 2% and 4% silica contents and 38% and 50% sonication amplitudes. For 2% concentration and 50% sonication amplitude, for example, the G’ modulus values were ~ 1.0 kPa and ~ 0.6 kPa for the PMMA/nanosilica-A and PMMA/nanosilica-C nanocomposites, respectively. Possibly, the nanosilica-C surface modification with PDMS lowered chemical affinity between nanoparticles and PMMA matrix, along with some plasticizing effect.

The 4% A38-2 sample shows outlier results for G’, G”, and η*, superior to the other central points, probably due to random errors in the preparation of this sample and/ or in its rheological evaluation. In turn, ANOVA (90% confidence interval) of the G’, G”, and η* properties of the PMMA/nanosilica-C nanocomposites showed a significant interaction between the variables nanosilica-C content and the ultrasound amplitude level. These variables showed no significant interaction for PMMA/nanosilica-A nanocomposites, probably indicating a better dispersion of nanosilica-A in the PMMA matrix.

However, for all nanocomposites, no rheological percolation thresholds were observed, which is characterized by a plateau on the G’ curve in frequencies between 10−2 and 10−3 Hz (Figures S3-S17 on Supplementary Material), meaning that rheological behavior did not change from viscoelastic to pseudo-solid, which is generally observed for polymeric nanocomposites with lamellar nanoparticles[40,51-53]. Slopes of rheological curves (α) showed values between 1.0 and 1.4 for G’(ω) and between 0.7 and 1.0 for G”(ω), for lowfrequencies. Similar results were found for pristine PMMA, G’(ω) = 1.25 and G”(ω) = 0.8. Linear polymers that follow the power law have typical values of αG’ ~ 2 and αG” ~ 1 in that region[40]. One could attribute the values found for pristine PMMA, especially for G’(ω), to matrix effects, like molar mass and its distribution.

Kotsilkova and Pissis[53] studied polymeric nanocomposites with reduced particle sizes (around 10 nm) properly dispersed Table 3. Storage modulus (G’), loss modulus (G”), complex viscosity (η*), shear thinning exponent (−nɷ), storage modulus declivity (αG’) and loss modulus declivity (αG”) values for the nanocomposites and pristine PMMA, at the 1.5 × 10⁻³ Hz frequency (terminal zone). Sample G’ (kPa) G” (kPa) η* (kPa.s) −n ɷ α G’ α G” PMMA/nanosilica-A - - - - - -

2% A26 0.43 2.17 221.50 0.11 1.25 0.87

6% A26 0.19 0.73 75.01 0.05 0.95 0.95

2% A50 0.93 3.67 379.10 0.02 1.31 0.94

6% A50 0.32 2.17 219.60 0.05 1.39 0.92

4% A38-1 0.69 3.02 309.40 0.23 1.10 0.74

4% A38-2 1.56 6.32 650.60 0.13 1.27 0.82

4% A38-3 0.96 3.65 377.70 0.27 1.06 0.69

Pristine PMMA 0.27 1.60 162.60 0.18 1.25 0.79

PMMA/nanosilica-C - - - - - -

2% C26 0.38 1.56 160.80 0.11 1.10 0.87

6% C26 0.54 2.89 294.20 0.09 1.27 0.88

2% C50 0.58 3.06 311.60 0.09 1.31 0.88

6% C50 0.40 1.54 159.90 0.04 1.13 0.94

4% C38-1 0.52 2.27 233.10 0.16 1.12 0.81

4% C38-2 0.46 2.01 206.30 0.15 1.11 0.82

4% C38-3 0.38 1.80 184.50 0.08 1.28 0.89

Polímeros, 32(3), e2022031, 2022

5/9
k ω ηω = (3)

in a matrix, and found no evidence of the characteristic plateau of the pseudo-solid behavior in G’ and G”. This is due to the change in the mechanism by which the fillers reinforce the matrix when their dimensions drop from micrometric, where reinforcement occurs due to the volume occupied by the particles between the polymer chains, to nanometric dimensions, where reinforcement occurs due to molecular stiffening caused by interactions between chains and particles[24,40,51,53]. Thus, although the characteristic plateau was not observed, there is evidence of adequate dispersion of nanoparticles, as the G’ and G” moduli values increased in the two types of nanocomposites, compared with pristine PMMA.

Furthermore, G’ and G” values obtained for the nanocomposites prepared by in situ polymerization with sonication were about two magnitude orders higher than those reported for similar nanocomposites prepared by melt intercalation and polymer solution methods, showing the efficiency of this synthesis method in dispersing nanofillers within the polymer matrix[40,51,52]. The outlier G’, G”, η*, and −n ω results for 4% A38-2 appears to be due to defects located on the specimen disc caused by random factors on the compression molding process.

Relaxation time (λ) was also evaluated, calculated by the inverse of the frequency at the crossover point of the G’ and G” curves (Table S3 on the Supplementary Material) and indicates interactions between polymer and fillers since it takes longer for polymer chains to relax when exposed to oscillatory regimen, showing higher molecular stiffness[52] Relaxation times of PMMA/nanosilica-A were relatively longer than those of PMMA/nanosilica-C nanocomposites and, in general, both were longer than pristine PMMA. Nanosilica-A seems more adequately dispersed in the PMMA matrix, inferred by the longer chain relaxation times, compared with the modified silica. On the other hand, the lowest values for relaxation times were found for the highest levels of silica (6% wt.), modified or not, which were, in general, even lower than those of pristine PMMA. Therefore, rheological results for both types of PMMA/nanosilica nanocomposites: G’, G”, η*, nω, and λ, contributed to the characterization of silica dispersion in the polymeric matrix. As noted, unmodified silica showed results significantly superior to those of surface-modified silica, especially in the experimental designs with lower and intermediate silica content.

4. Conclusions

A simple route was proposed for synthesis of PMMA/ nanosilica optical nanocomposites by in situ solution polymerization under sonication. Optical and rheological properties of the nanocomposites were studied using experimental designs to assess the effects of the variables: nanosilica content (2% to 6% wt) and relative amplitude of sonication (26% to 50%). Synthesis method was effective in producing PMMA/silica nanocomposites with very adequate nanoparticles dispersion, as indicated by improved rheological results, storage and loss moduli, and complex viscosity, especially at lower levels of nanosilica, which also maintained the high UV-visible transmittance of PMMA. Also, the reduced refractive indexes of nanocomposites

compared with PMMA make them suitable materials for cladding of optical fibers or waveguides. Therefore, this work provides an interesting approach to the production of optical nanocomposites based on PMMA, enabling usage of these materials for applications in optical devices, such as polymeric optical fibers, waveguides, sensors and optical substrates for touch screens, showing the potential of the properties of composite materials.

5. Author’s Contribution

Conceptualization – Julio Roberto Bartoli.

Data curation – Rafael Affonso Netto; Julio Roberto Bartoli.

Formal analysis – Rafael Affonso Netto; Julio Roberto Bartoli.

Funding acquisition – Julio Roberto Bartoli.

Investigation – Rafael Affonso Netto; Fabrícia Farias de Menezes.

Methodology – Rafael Affonso Netto.

Project administration – Julio Roberto Bartoli.

Resources – Julio Roberto Bartoli.

Software – NA.

Supervision – Julio Roberto Bartoli; Rubens Maciel Filho. Validation – Julio Roberto Bartoli.

Visualization – Julio Roberto Bartoli; Rafael Affonso Netto.

Writing – original draft – Rafael Affonso Netto.

Writing – review & editing – Julio Roberto Bartoli.

6. Acknowledgements

The authors acknowledge: “Conselho Nacional de Desenvolvimento Científico e Tecnológico” – CNPq, for the financial support – Grant Number 131785/2016-8. Dr. M. I. R. B. Schiavon (FEQ/UNICAMP), A. C. da Costa (IFGW/UNICAMP), Dr. M. H. Ara and I. S. Tertuliano (LFS/EPUSP), Prof. Edson N. Ito (DEMat/UFRN) for the supplied nanoparticles and provided characterizations, UNIGEL® and DuPont™ for the supplied chemicals, and Espaço da Escrita – Pró-Reitoria de Pesquisa – UNICAMP, for the provided language services.

7. References

1 Ishigure, T., Horibe, A., Nihei, E., & Koike, Y. (1995). Highbandwidth, high-numerical aperture graded-index polymer optical fiber. Journal of Lightwave Technology, 13(8), 16861691 http://dx.doi.org/10.1109/50.405310

2 Bartoli, J. R. (2000). Development and characterization of graded-index polymeric films for optical guides and sensors. In 14th International International Conference on Optical Fiber Sensors (pp. 838-841). Bellingham: Society of Photo-Optical Instrumentation Engineers

3 Peng, G.-D., Ji, P. N., & Wang, T. (2004). Development of special polymer optical fibers and devices. In: Proceedings of SPIE 5595: Active and Passive Optical Components for WDM Communications IV (pp. 138-152) Bellingham: Society of Photo-Optical Instrumentation Engineers

Polímeros, 32(3),

2022 6/9
e2022031,

Poly(methyl methacrylate) and silica nanocomposites as new materials for polymeric optical devices

4 Giacon, V. M., Padilha, G. S., & Bartoli, J. R. (2015). Fabrication and characterization of polymeric optical by plasma fluorination process. Optik, 126(1), 74-76 http://dx.doi.org/10.1016/j. ijleo.2014.08.152

5 Kaino, T., Fujiki, M., & Nara, S. (1981). Low-loss polystyrene core-optical fibers. Journal of Applied Physics, 52(12), 70617063 http://dx.doi.org/10.1063/1.328702

6. van Eijkelenborg, M. A., Argyros, A., & Leon-Saval, S. G. (2008). Polycarbonate hollow-core microstructured optical fiber. Optics Letters, 33(21), 2446-2448 http://dx.doi.org/10.1364/ OL.33.002446 PMid:18978882.

7 Cordeiro, C. M. B., Ng, A. K. L., & Ebendorff-Heidepriem, H. (2020). Ultra-simplified single-step fabrication of microstructured optical fiber. Scientific Reports, 10(1), 9678. http://dx.doi. org/10.1038/s41598-020-66632-3 PMid:32541807.

8 Faiz, F., Baxter, G., Collins, S., Sidiroglou, F., & Cran, M. (2020). Polyvinylidene fluoride coated optical fibre for detecting perfluorinated chemicals. Sensors and Actuators. B, Chemical, 312, 128006 http://dx.doi.org/10.1016/j.snb.2020.128006

9. Koike, Y., & Ishigure, T. (2006). High-bandwidth plastic optical fiber for fiber to the display. Journal of Lightwave Technology, 24(12), 4541-4553 http://dx.doi.org/10.1109/ JLT.2006.885775.

10 Ferreira, R. A. S., André, P. S., & Carlos, L. D. (2010). Organic–inorganic hybrid materials towards passive and active architectures for the next generation of optical networks. Optical Materials, 32(11), 1397-1409 http://dx.doi.org/10.1016/j. optmat.2010.06.019

11 Benabid, F., Knight, J. C., Antonopoulos, G., & Russell, P. S. J. (2002). Stimulated Raman scattering in hydrogen-filled hollow-core photonic crystal fiber. Science, 298(5592), 399-402 http://dx.doi.org/10.1126/science.1076408. PMid:12376698.

12 Sharma, D. K., Sharma, A., & Tripathi, S. M. (2018). Thermooptic characteristics of hybrid polymer/silica microstructured optical fiber: an analytical approach. Optical Materials, 78, 508-520 http://dx.doi.org/10.1016/j.optmat.2018.02.037

13 Li, C.-P., Tenent, R. C., & Wolden, C. A. (2020). Optical and mechanical properties of nanocomposite films based on Polymethyl Methacrylate (PMMA) and fumed silica nanoparticles. Polymer Engineering and Science, 60(3), 553557. http://dx.doi.org/10.1002/pen.25312.

14 Anandhan, S. , & Bandyopadhyay, S. (2011). Polymer nanocomposites: from synthesis to applications. In J. Cuppoletti (Ed.), Nanocomposites and polymers with analytical methods (pp. 1-28). London: IntechOpen http://dx.doi.org/10.5772/17039

15 Zhang, Y., & Luo, Y. (2021). Naturally derived nanomaterials for multidisciplinary applications and beyond. ES Food & Agroforestry, 4, 1-2 http://dx.doi.org/10.30919/esfaf484

16 Islam, M. J., Rahman, M. J., & Mieno, T. (2020). Safely functionalized carbon nanotube–coated jute fibers for advanced technology. Advanced Composites and Hybrid Materials, 3(3), 285-293 http://dx.doi.org/10.1007/s42114-020-00160-6

17 Lewicki, J. P., Rodriguez, J. N., Zhu, C., Worsley, M. A., Wu, A. S., Kanarska, Y., Horn, J. D., Duoss, E. B., Ortega, J. M., Elmer, W., Hensleigh, R., Fellini, R. A., & King, M. J. (2017). 3D-printing of meso-structurally ordered carbon fiber/polymer composites with unprecedented orthotropic physical properties. Scientific Reports, 7(1), 43401 http://dx.doi.org/10.1038/ srep43401 PMid:28262669.

18 Qin, C., Gong, H., Sun, C., & Wu, X. (2021). Optical properties of a core/shell/shell shape metal-insulator-metal composite nanoparticle for solar energy absorption. Engineered Science, 17, 224-230 http://dx.doi.org/10.30919/es8e509

19. Xue, J., & Luo, Y. (2021). Sustainable food and agriculture system: a nanotechnology perspective. ES Food and Agroforestry, 5, 1-3 http://dx.doi.org/10.30919/esfaf538

Polímeros, 32(3), e2022031, 2022

20 Silva, E. A., Ribeiro, L. A., Nascimento, M. C. B. C., & Ito, E. N. (2014). Rheological and mechanical characterization of Poly (methyl methacrylate)/silica (PMMA/SiO2) composites. Materials Research, 17(4), 926-932 http://dx.doi.org/10.1590/ S1516-14392014005000114

21. Pötschke, P., Fornes, T. D., & Paul, D. R. (2002). Rheological behavior of multiwalled carbon nanotube/polycarbonate composites. Polymer , 43 (11), 3247-3255. http://dx.doi. org/10.1016/S0032-3861(02)00151-9

22 Sun, X., Lasecki, J., Zeng, D., Gan, Y., Su, X., & Tao, J. (2015). Measurement and quantitative analysis of fiber orientation distribution in long fiber reinforced part by injection molding. Polymer Testing, 42, 168-174 http://dx.doi.org/10.1016/j. polymertesting.2015.01.016

23 Prado, B. R., & Bartoli, J. R. (2018). Synthesis and characterization of PMMA and organic modified montmorilonites nanocomposites via in situ polymerization assisted by sonication. Applied Clay Science, 160, 132-143 http://dx.doi.org/10.1016/j. clay.2018.02.035

24. Bressanin, J. M., Assis, V. A. Jr., & Bartoli, J. R. (2018). Electrically conductive nanocomposites of PMMA and carbon nanotubes prepared by in situ polymerization under probe sonication. Chemical Papers, 72(7), 1799-1810 http://dx.doi. org/10.1007/s11696-018-0443-5

25 Chen, J., Zhu, Y., Guo, Z., & Nasibulin, A. G. (2020). Recent progress on thermo-electrical properties of conductive polymer composites and their application in temperature sensors. Engineered Science, 12, 13-22 http://dx.doi.org/10.30919/ es8d1129

26 Gu, H., Gao, C., Zhou, X., Du, A., Naik, N., & Guo, Z. (2021). Nanocellulose nanocomposite aerogel towards efficient oil and organic solvent adsorption. Advanced Composites and Hybrid Materials, 4(3), 459-468. http://dx.doi.org/10.1007/ s42114-021-00289-y.

27 Yu, Z., Yan, Z., Zhang, F., Wang, J., Shao, Q., Murugadoss, V., Alhadhrami, A., Mersal, G. A. M., Ibrahim, M. M., El-Bahy, Z. M., Li, Y., Huang, M., & Guo, Z. (2022). Waterborne acrylic resin co-modified by itaconic acid and γ-methacryloxypropyl triisopropoxidesilane for improved mechanical properties, thermal stability, and corrosion resistance. Progress in Organic Coatings, 168, 106875 http://dx.doi.org/10.1016/j. porgcoat.2022.106875

28 Chang, X., Chen, L., Chen, J., Zhu, Y., & Guo, Z. (2021). Advances in transparent and stretchable strain sensors. Advanced Composites and Hybrid Materials, 4(3), 435-450 http://dx.doi.org/10.1007/s42114-021-00292-3.

29 Münstedt, H., Köppl, T., & Triebel, C. (2010). Viscous and elastic properties of poly(methyl methacrylate) melts filled with silica nanoparticles. Polymer, 51(1), 185-191 http:// dx.doi.org/10.1016/j.polymer.2009.11.049

30 Triebel, C., & Münstedt, H. (2011). Temperature dependence of rheological properties of poly(methyl methacrylate) filled with silica nanoparticles. Polymer, 52(7), 1596-1602 http:// dx.doi.org/10.1016/j.polymer.2011.02.014

31 Zhang, Q., Huang, W.-X., & Zhong, G.-J. (2017). Towards transparent PMMA/SiO2 nanocomposites with promising scratch-resistance by manipulation of SiO2 aggregation followed by in situ polymerization. Journal of Applied Polymer Science, 134(12), 44612. http://dx.doi.org/10.1002/app.44612.

32 Mallakpour, S. , & Naghdi , M. ( 2018 ). Polymer/SiO 2 nanocomposites: production and applications. Progress in Materials Science, 97, 409-447 http://dx.doi.org/10.1016/j. pmatsci.2018.04.002

33 Jancar, J., & Recman, L. (2010). Particle size dependence of the elastic modulus of particulate filled PMMA near its

7/9

Affonso Netto, R., Menezes, F. F., Maciel Filho, R., & Bartoli, J. R.

T g Polymer, 51(17), 3826-3828 http://dx.doi.org/10.1016/j. polymer.2010.06.041

34 Hu, F., Li, G., Zou, P., Hu, J., Chen, S., Liu, Q., Zhang, J., Jiang, F., Wang, S., & Chi, N. (2020). 20.09-Gbit/s underwater WDM-VLC transmission based on a single Si/GaAs-substrate multichromatic LED array chip. In Optical Fiber Communication Conference (OFC) (pp. M3I.4). Washington, D.C.: Optica Publishing Group http://dx.doi.org/10.1364/OFC.2020.M3I.4

35 Kachere, A. R., Kakade, P. M., Kanwade, A. R., Dani, P., Mandlik, N. T., Rondiya, S. R., Dzade, N. Y., Jadkar, S. R., & Bhosale, S. V. (2022). Zinc oxide graphene oxide nanocomposites: synthesis, characterization and their optical properties. ES Materials & Manufacturing, 16, 19-29

36. Wang, C., Wen, Y., Sun, J., & Zhou, J. (2022). Recent progress on optical frequency conversion in nonlinear metasurfaces and nanophotonics. ES Materials & Manufacturing, 17, 1-13 http://dx.doi.org/10.30919/esmm5f655

37 Zou, D. Q., & Yoshida, H. (2010). Size effect of silica nanoparticles on thermal decomposition of PMMA. Journal of Thermal Analysis and Calorimetry, 99(1), 21-26. http:// dx.doi.org/10.1007/s10973-009-0531-4

38 Abramoff, B., & Covino, J. (1992). Transmittance and mechanical properties of PMMA-fumed silica composites. Journal of Applied Polymer Science, 46(10), 1785-1791 http:// dx.doi.org/10.1002/app.1992.070461009

39 Taurozzi, J. S., Hackley, V. A., & Wiesner, M. R. (2011). Ultrasonic dispersion of nanoparticles for environmental, health and safety assessment – issues and recommendations. Nanotoxicology, 5(4), 711-729. http://dx.doi.org/10.3109/17 435390.2010.528846 PMid:21073401.

40 Price, G. J., Norris, D. J., & West, P. J. (1992). Polymerization of methyl methacrylate initiated by ultrasound. Macromolecules, 25(24), 6447-6454 http://dx.doi.org/10.1021/ma00050a010

41 Price, G. J. (2003). Recent developments in sonochemical polymerization. Ultrasonics Sonochemistry, 10(4-5), 277283 http://dx.doi.org/10.1016/S1350-4177(02)00156-6 PMid:12818394.

42 Kaino, T. (1985). Absorption losses of low loss plastic optical fibers. Japanese Journal of Applied Physics, 24(12R), 16611665 http://dx.doi.org/10.1143/JJAP.24.1661

43 Zhu, H., Wang, Y., Qu, M., Pan, Y., Zheng, G., Dai, K., Huang, M., Alhadhrami, A., Ibrahim, M. M., ElBahy, Z. M., Liu, C., Shen, C., & Liu, X. (2022). Electrospun poly(vinyl alcohol)/ silica film for radiative cooling. Advanced Composites and

Hybrid Materials, 5(3), 1966-1975 http://dx.doi.org/10.1007/ s42114-022-00529-9

44 Si, Y., Li, J., Cui, B., Tang, D., Yang, L., Murugadoss, V., Maganti, S., Huang, M., & Guo, Z. (2022). Janus phenol–formaldehyde resin and periodic mesoporous organic silica nanoadsorbent for the removal of heavy metal ions and organic dyes from polluted water. Advanced Composites and Hybrid Materials, 5(2), 1180-1195 http://dx.doi.org/10.1007/s42114-022-00446-x

45 Bistac, S., & Schultz, J. (1997). Solvent retention in solution-cast films of PMMA: study by dielectric spectroscopy. Progress in Organic Coatings, 31(4), 347-350. http://dx.doi.org/10.1016/ S0300-9440(97)00093-3

46 Padilha, G. S., Giacon, V. M., & Bartoli, J. R. (2017). Effect of solvents on the morphology of PMMA films fabricated by spin-coating. Polímeros: Ciência e Tecnologia, 27(3), 195-200 http://dx.doi.org/10.1590/0104-1428.12516

47 Zhou, R.-J., & Burkhart, T. (2010). Optical properties of particle-filled polycarbonate, polystyrene, and poly(methyl methacrylate) composites. Journal of Applied Polymer Science, 115(3), 1866-1872 http://dx.doi.org/10.1002/app.31331

48 Yu, Y.-Y., Chen, C.-Y., & Chen, W.-C. (2003). Synthesis and characterization of organic–inorganic hybrid thin films from poly(acrylic) and monodispersed colloidal silica. Polymer, 44(3), 593-601 http://dx.doi.org/10.1016/S0032-3861(02)00824-8

49 Sunkara, H. B., Jethmalani, J. M., & Ford, W. T. (1994). Composite of colloidal crystals of silica in poly(methyl methacrylate). Chemistry of Materials, 6(4), 362-364 http:// dx.doi.org/10.1021/cm00040a006

50 van de Hulst, H. C. (1958). Light scattering by small particles. Quarterly Journal of the Royal Meteorological Society, 84(360), 198-199.

51 Zhao, J., Morgan, A. B., & Harris, J. D. (2005). Rheological characterization of polystyrene-clay nanocomposites to compare the degree of exfoliation and dispersion. Polymer, 46(20), 8641-8660 http://dx.doi.org/10.1016/j.polymer.2005.04.038

52 Schramm, G. (2006) A practical approach to rheology and rheometry Karlsruhe: Thermo Electron (Karlsruhe) GmbH

53 Kotsilkova, R. (2007). Thermoset nanocomposites for engineering applications Shawbury: Smithers Rapra Technology Limited

Received: Jan. 27, 2022

Revised: Aug. 31, 2022

Accepted: Oct. 05, 2022

Polímeros, 32(3), e2022031,

2022 8/9

Supplementary Material

Supplementary material accompanies this paper.

Table S1. ANOVA table for UV-Vis transmittance values.

Table S2. ANOVA table for refractive indexes values.

Table S3. G’ = G”, ɷcrossover and λ values for the produced nanocomposites and pristine PMMA

Figure S1. UV-Vis transmittance spectra of nanocomposites and pristine PMMA films.

Figure S2. Strain sweep analysis for rheological tests.

Figure S3. Rheological curves for the pristine PMMA sample.

Figure S4. Rheological curves for the sample: 4% A38-1.

Figure S5. Rheological curves for the sample: 4% A38-2.

Figure S6. Rheological curves for the sample: 4% A38-3.

Figure S7. Rheological curves for the sample: 2% A26.

Figure S8. Rheological curves for the sample: 2% A50.

Figure S9. Rheological curves for the sample: 6% A26.

Figure S10. Rheological curves for the sample: 6% A50.

Figure S11. Rheological curves for the sample: 4% C38-1.

Figure S12. Rheological curves for the sample: 4% C38-2.

Figure S13. Rheological curves for the sample: 4% C38-3.

Figure S14. Rheological curves for the sample: 2% C26.

Figure S15. Rheological curves for the sample: 2% C50.

Figure S16. Rheological curves for the sample: 6% C26.

Figure S17. Rheological curves for the sample: 6% C50.

This material is available as part of the online article from https://doi.org/10.1590/0104-1428.20220009

Polímeros, 32(3), e2022031, 2022

Poly(methyl methacrylate) and silica nanocomposites as new materials for polymeric optical devices
9/9

Interactions of PP-PET blends modified by montmorillonite with different polarities

1Laboratório de Blendas e Compósitos Poliméricos, Departamento de Engenharia de Materiais e de Bioprocessos, Universidade Estadual de Campinas – UNICAMP, Campinas, SP, Brasil

2Departamento de Engenharia Química, Centro de Pesquisa em Alimentos, Universidade de São Paulo –USP, São Paulo, SP, Brasil *morales@unicamp.br

Obstract

This paper describes the effects of adding organic montmorillonite clays (MMT) with different polarities (one polar and one non-polar) in recycled poly (ethylene terephthalate) (PET) and polypropylene (PP) blends. Styrene-Ethylene/ Butylene-Styrene-maleic anhydride-graft (SEBS-g-MA) was used as a compatibilizer. MMT polarity was chosen based on the expected specific interaction of each clay with PET and PP. Samples were evaluated by wide angle X-ray diffraction, scanning electronic microscopy, differential scanning calorimetry, Fourier transform infrared spectroscopy, dynamic mechanical analysis and mechanical tests. The clays caused no statistical change in the mechanical properties high-concentration PET blends, but increased Young’s modulus and decreased the elongation at break, tensile strength and impact strength of high-concentration PP blends. The different interactions between PET and SEBS-g-MA and the level of MMT exfoliation in each polymer-rich phase explained the results.

Keywords: nanocomposites, blends, montmorillonite, compatibility.

How to cite: Porto, A. S., Alves, J. L., & Morales, A. R. (2022). Interactions of PP-PET blends modified by montmorillonite with different polarities. Polímeros: Ciência e Tecnologia, 32(3), e2022032. https://doi.org/10.1590/0104-1428.20220014

1. Introduction

Recycling waste from different thermoplastic polymers is a challenge due to the incompatibility between materials of different polar characteristics and the partial loss of mechanical properties. Polymer blending is a widely known process of combining the properties of each polymeric component of the blend. Nanocomposites developed by using organic modified clays, particularly montmorillonite, as a reinforcing filler can often exhibit remarkable improved properties when compared to neat polymer, conventional composites[1-3], blends[4-6] or even biopolymers.[7-9] Polypropylene (PP), a low-cost thermoplastic, has many interesting properties, such as high chemical and solvent resistance, easy molding, high fatigue and bending fracture resistance, good impact strength above 15 °C, and good thermal stability[10]. Polyethylene terephthalate (PET) has a high melting point (~265°C) and presents an excellent relation between mechanical and thermal properties and production cost[11]. Its applications include textile fibers, packaging processed via injection molding process, films, and engineering. Environmental issues have drawn interest in recycling polymers from household waste, with PET being one of the most recycled plastics worldwide[11]

As global production of resins and fibers has increased from 2 Mt in 1950 to 380 Mt in 2015, recycling is crucial. The total amount of resins and fibers manufactured from

1950 to 2015 is 7800 Mt, and half of this number—3900 Mt— was produced in just the last 13 years[12]

The largest groups of plastics produced are PE (36%), PP (21%), and PVC (12%), followed by PET, PUR, and PS (<10% each). Polyester—which is mostly PET—accounts for 70% of all PP&A (polyester, polyamide, and acrylic fibers) production. Together, these seven groups account for 92% of all plastics ever made. Approximately 42% of all non-fiber plastics have been used for packaging, which is predominantly composed of PE, PP and PET[12]

Given this high consumption of plastics, recycling PP and PET becomes imperative as plastic waste has a huge negative impact on the natural environment. Recycling helps to reduce the pollution caused by waste.

Since PET is a polar polymer and PP a non-polar one, PET-PP blends require the use of a compatibilizing agent to achieve a fine morphology. A block or graft copolymer can be used to decrease interfacial tension, whereas PP/PET blends with Styrene-Ethylene/Butylene-Styrene-maleic anhydride-graft (SEBS-g-MA) in different amounts have shown significant changes in the morphology of blends, such as improved phase dispersion and better mechanical properties, especially impact strength[13]

Besides compatibilizers, clay minerals are widely used to obtain nanocomposites. Among these minerals, organic

https://doi.org/10.1590/0104-1428.20220014 O O O O O O O O O O O O O O O
ISSN 1678-5169 (Online) 1/8
Polímeros, 32(3), e2022032, 2022

Porto, A. S., Alves, J. L., & Morales, A. R.

montmorillonite (MMT) stands out due to its multilayer structure and high aspect ratio. The polarity relationship between polymers and MMT is fundamental in blends, as shown by studies on PP[14-16], PET[17-20], and PP-PET blends[21-23] with commercial MMT. Adding Cloisite® 10A to PP-PET blends improved the mechanical properties and the system retained the two-phase morphology, but the PET domains were shown to be smaller and with good adhesion at the interface with PP. The use of clay alone was therefore insufficient to make the polymers compatible, and optimal results were observed when maleic anhydride–grafted polypropylene was added[22]. Location of the polar nanoclay in the PET matrix led to a refined morphology and changed the rheological behavior of PET-PP blends, which was attributed to the formation of clay network-like structures[23]

None of these studies considered a mixture of MMT (polar and non-polar), as the blends involve both polar and non-polar polymers. To understand the interactions between polar and non-polar systems, this paper presents the effects of including a mixture of two MMT with different polarities, Cloisite® 20A (non-polar) and Cloisite® 30B (polar), on the properties of PP-PET and SEBS-g-MA blends. The formulations chosen for the system studied considered the possible interactions between the polar and non-polar groups (Figure 1).

2. Materials and Methods

2.1 Materials

We prepared the blends using PP pellets, MFI of 10 g/10min (RP 347, BRASKEM), recycled PET (GlobalPET), intrinsic viscosity of 0.72 dL/g, pellets size of 2.5 mm, MMT Cloisite® 20A and Cloisite® 30B (Southern Clays Products) modified with dimethyl di(hydrogenated tallow alkyl) and bis(2-hydroxyethyl) methyl (hydrogenated tallow alkyl) ammonium cations, respectively. SEBS-g-MA (FG1901, KRATON), MFI of 22 g/10min functionalized with 2% maleic anhydride, was used as compatibilizer and 1% Irganox 1010 (BASF) as a thermal stabilizer.

2.2 Blend preparation

To evaluate the interaction aspects between polymers and MMT, we calculated the solubility parameters of the materials using the Krevelen & Nijenhuis method[24] (Table 1). As can be observed, Cloisite 30B is expected to be more compatible with PET, whereas Cloisite 20A shows greater compatibility with PP. Hence, we chose a mixture of the organoclays to prepare the samples to study the presence of each clay in each blend phase.

Blends were prepared using melt intercalation. Table 2 presents the sample compositions.

Materials were dried in a circulating air oven at 100 ºC for 60 min, extruded on a Haake Reomex OS PTW24 twinscrew at temperatures ranging from 240 to 275 °C, screw rotation of 250 rpm, torque of 46 N/m, and feed rate of 60%. The extruded pellets were dried in a circulating air oven at 100 ºC for 60 min before being injected in a Boy 35 injection molding machine, at the temperatures of 260 ºC (barrel), 270 ºC (nozzle), and 60 °C (mold), according to ASTM D638-02 and ASTM D256-10 for tensile and impact tests, respectively.

Figure 1. Interactions between (a) non-polar and (b) polar systems. Red arrows represent strong interactions, whereas yellow arrows represent weak interactions.

Table 1. Solubility parameter (Krevelen & Nijenhuis method[24]). Polymers and Clays Solubility parameter (MJ/m3)1/2 PET (Polar) 20.5 PP (Non-polar) 17.0 SEBS-g-MA (Polar) 21.0 Cloisite 30B (Polar) 19.0 Cloisite 20A (Non-polar) 15.9

Scanning electron microscopy (SEM) experiments were performed on the FEI Inspect 5S operating at 20 kV. The observed surfaces were obtained by cryogenic fracturing of the samples and coated with a gold layer. Wide angle X-ray diffraction (WAXD) experiments were performed on a Rigaku diffractometer, and the samples were scanned using CuKα radiation (k = 1.5406 Å). The clay space gallery (d001) was determined using Bragg’s law for clays and nanocomposites. Tensile testing was conducted using the INSTRON 5582 testing machine according to ASTM D638-02, performed at 50 mm min-1 speed under ambient conditions. Izod impact tests were performed by an EMIC impact machine according to ASTM D256-10e1 using an impact pendulum of 2.82 J. Values from the tensile tests Young’s modulus (E), elongation at break (ε), tensile

Polímeros, 32(3), e2022032,

2022 2/8
Table 2. Sample compositions in % (w/w). Sample PP PET Cloisite 30B Cloisite 20A Irganox 1010 Compatibilizer SEBS-g-MA PP30/PET70 29 68 - - 1 2 PP70/PET30 68 29 - - 1 2 PP70/PET30/MMT 65 28 2 2 1 2 PP30/PET70/MMT 28 65 2 2 1 2 PP 100 - - - -PET - 100 - - - -

strength at break (σ) and impact strength (IS), performed to evaluate the equality of blends with and without MMT, were submitted to analysis of variance (ANOVA). In statistical analysis, p-value is the significance probability used in hypothesis testing, defining: the null hypothesis (H0), where means are equal; and the alternative hypothesis (HA), where means are different. By confronting the null hypothesis with the average results from the studied sample, we verify its occurrence in probabilistic terms, which leads us to reject H0 or not. If H0 is not rejected, it is assumed to be true; otherwise, HA is true. In this study, significance level was set at α = 0.05, so when the p-value was less than or equal to α, H0 was rejected and the means were considered different; for p-values greater than α, H0 was accepted and the means were considered equal[25]. Differential scanning calorimetry (DSC) curves were obtained by TA Instruments, model DSC Q100, with temperature ranging from -90 °C to 300 °C, under dynamic atmosphere of N2 (50 mL min-1) and a 10 °C min-1 heating rate. Fourier transform infrared spectroscopy (FTIR) analysis was performed on a Thermo Nicolet iS50, scanning 4000 to 650 cm-1 in attenuated total reflection (ATR) mode. Dynamic mechanical analysis (DMA) was performed by a TA Instruments Q800 on 63.5 x 12.7 x 3.2 mm rectangular samples, at 3 – Point Bend deformation mode, with a deformation amplitude of 60 μm determined using strain sweep tests to ensure a linear viscoelastic response of the material, temperature range of -30 °C to 230 °C, with 3 °C min-1 heating rate and 1 Hz frequency.

3. Results and Discussions

Table 3 presents the mechanical results and Table 4 summarizes the ANOVA tests comparing the equality of the mean results between two populations: blends with and without MMT.

The presence of MMT in the PP30/PET70 and PP30/ PET70MMT samples showed no statistical change between the populations regarding all measured mechanical properties,

indicating that MMT had no influence on these characteristics. In turn, the PP70/PET30 and PP70/PET30/MMT samples showed the opposite effect: the presence of MMT increased E (from 1342 MPa to 1504 MPa) and decreased ε (from 12% to 9%) and σ (from 26 MPa to 27 MPa). We also found that IS decreased from 6 J/m to 4 J/m.

Figure 2a shows the diffractograms for all samples and Figure 2b for the blends with and without clay. X-Ray diffractograms for the same Cloisite® 20A and Cloisite® 30B samples used in this study were published elsewhere and the authors described them as having basal space (d001) of 2.69 nm (2Θ = 3.28º) and 1.86 nm (2Θ = 4.74º), respectively[26]. In the X-Ray diffractograms of the blends in the region where the clay planes are detected, 2Θ between 2 and 7º (Figure 2b), we observe a peak at 2.44° for sample PP30/PET70/MMT

Figure 2. X-Ray diffractograms: (a) All samples and (b) PP30/ PET70, PP30/PET70/MMT, PP70/PE30 and PP70/PET30/MMT.

Table 3. Modulus (E), Tensile stress at break (σ), Elongation (ε) and Impact resistance (IS). Sample σ max (MPa) σ at break (MPa) ε (%) E (MPa) IS (J/m) Neat PP 34 ± 2 22 ± 5 194 ± 100 1359 ± 192 12 ± 2 Neat PET 55 ± 5 16 ± 10 123 ± 120 2315 ± 177 16.0 ± 0.2 PP30/PET70 38 ± 5 38 ± 4 4 ± 2 1920 ± 170 6.0 ± 0.9 PP30/PET70/MMT 41.0 ± 0.5 37 ± 2 5 ± 1 2009 ± 41 6.0 ± 0.8 PP70/PET30 29.7 ± 0.4 26 ± 2 12 ± 2 1342 ± 106 6.0 ± 1.0 PP70/PET30/MMT 27.8 ± 0.4 27 ± 1 9 ± 2 1504 ± 65 4.0 ± 0.4

Table 4. ANOVA of Modulus (E), Tensile stress at break (σ), Elongation (ε) and Impact resistance (IS) (α = 0.05).

Compared samples Response p-value Statistical mean results MMT influence

PP30/PET70 and PP30/PET70/ MMT E (MPa) 0.289 Equal No σ (MPa) 0.211 ε (%) 0.123 IS (J/m) 0.622 PP70/PET30 and PP70/PET30/ MMT E (MPa) 0.019 Different Yes (from1342 to 1504 MPa) σ (MPa) 0.007 Yes (from 26 to 27 MPa) ε (%) 0.019 Yes (from 12 to 9%) IS (J/m) 0.029 Yes (from 6 to 4 J/m)

Polímeros, 32(3), e2022032, 2022

Interactions of PP-PET blends modified by montmorillonite with different polarities
3/8

Porto, A. S., Alves, J. L., & Morales, A. R.

with d001 = 3.62 nm attributed to a first order peak of Cloisite® 20A non-polar clay. The second peak observed at 5.8° may be a second order peak of Cloisite® 20A[22,26]. This Cloisite® 20A peak in the blend is shifted when compared to the neat clay signal, indicating that some of the Cloisite® 20A may have exfoliated and some may have intercalated. Absence of the Cloisite® 30B clay signal suggests that most of the clay exfoliated in the system. For the PP70/PET30/MMT samples, the absence of both neat clay peaks indicates that exfoliation may have occurred primarily for both the nonpolar Cloisite® 20A and polar Cloisite® 30B.

SEM analysis indicated the two-phase morphology as expected, due to the non-miscibility between polymers (Figure 3). Adding MMT preserves the heterogeneous twophase system, but the PP70/PET30/MMT sample shows changes in the morphology where the domains present a poorly defined interface. The system morphology was certainly modified, most likely due to clay exfoliation which probably decreased the interfacial tension and/or the coalescence restriction of the dispersed phase domains.

HH w Hf ∆−∆ = × ∆×

( ) ,100% 100 mcc c m (1)

where ∆H m is the measured melting enthalpy for each peak and ∆Hm,100% the hypothetical equilibrium enthalpy considering the polymer to be 100% crystalline, assuming 140 J/g for PET and 207 J/g for isotactic PP homopolymer[27]; ∆Hcc is the enthalpy of crystallization that occurs during heating, if applicable, called cold crystallization; and f is the mass fraction of the polymer present in the mixture.

Samples

DSC WAXD

PP PET Blends

PET - 43 37

PP 43 - 49

PP70/PET30 26 27 19

PP70/PET30/ MMT 28 20 27

PP30/PET70 7 21 13 PP30/PET70/ MMT 4 22 20

Figure 3. Photomicrographs from SEM analysis: (a) PP30/PET70, (b) PP30/PET70/MMT, (c) PP70/PET30 and (d) PP70/PET30/MMT.

2022 4/8
Polímeros, 32(3), e2022032,
Figure 4 shows the DSC curves for the specimens subjected to mechanical tests. From the DSC results, we calculated the degree of crystallinity (Wc) using Equation 1 (Table 5):
Table 5. Degree of crystallinity – DSC and X-Ray deconvolution (WAXD).

A C AA ∑ = ∑+∑ (2)

The samples with higher PET content showed cold crystallization during the heating scan. Cold crystallization is related to the partial amorphous state of the polymer due to its slow crystallization rate: when a molten polymer is rapidly cooled, many crystalline nuclei are formed, but crystal growth is negligible. During the subsequent heating scan, amorphous regions rearrange into a crystalline phase and the crystalline nuclei grow, causing a rapid recrystallization process that occurs between the glass transition temperature and the melting point of the polymer[23]. This cold crystallization process overlaps with the PP melting signal; but since where the PP melting curve starts and ends is poorly defined, this can interfere with the calculation of the degree of crystallinity via DSC. Consequently, X-Ray could also help in determining the degree of crystallinity of the system. We thus calculated the degree of crystallinity of the blends using the Deconvolution Method and adjusting the peaks of the X-Ray diffraction pattern (Figure 2a). This method brings some considerations during adjustment, such as the shape and number of peaks observed in the diffractogram. Deconvolution is performed by computational programs that use functions—such as Gaussian ones—to adjust the curves from the crystalline contributions of each peak and the amorphous halo contribution. In this study, we used the ‘Fit Gaussian’ method, and the area of each peak led to a degree of crystallinity using Equation 2[28]: ( ) 100 % crystalline crystallineamorphous

where Acrystalline is the crystalline contribution of each peak and Aamorphous the amorphous halo contribution. Table 5 summarizes the results obtained.

Given the DSC inconclusive results, including those from WAXD, the presence of MMT appears to increase the degree of crystallinity of the entire system in both pairs of samples: when comparing PP30/PET70 with PP30/PET70/ MMT and PP70/PET30 with PP70/PET30/MMT. These results can explain the reduction in impact strength observed. High-density polyethylene nanocomposites with nanoclay showed a reduction in impact strength associated with an increase in the degree of polymer crystallinity near the clay/ polymer interface[29]. This local increase in the degree of crystallinity could lead to a more brittle system with less capacity to absorb impact energy. Given the observed increase in the degree of crystallinity of the system resulting from

the clay, we can assume that, for the PP70/PET30/MMT sample, where the clay was highly exfoliated, PP may have crystallized more easily at the clay interface.

Table 6 describes the glass transition temperature determined from the DMA curves (not shown). We can observe that the Tg of the blends shows no significant change when compared to neat polymers, which points to the lack of miscibility between the polymers.

The FTIR spectrum (Figure 5) shows typical absorption bands for the CH bonds present in PP, the stretching of CH/CH2/CH3 groups ranged from 2850 to 2980 cm-1, the angular deformation of CH3 groups varied between 1354 and 1460 cm-1, the stretching of C-C bonds at 1167 cm-1 and the angular deformation of C-H groups at 890 cm-1. PET shows important bands at 1710 cm-1 due the stretching of ester carbonyl groups, and at 1410 cm-1 due to the stretching of C = C bonds in the aromatic ring.

SEBS-g-MA, the compatibilizer used in this study, contains maleic anhydride that could react with polar PET groups. Although the amount of SEBS-g-MA was small and at 2% MA, the change in the absorption band at 1710 cm-1 due to the carbonyl of carboxylic groups suggests that the reaction may have occurred[30,31]. To normalize the FTIR peaks and verify the extent of this reaction, we chose the band of neutral aromatic group at 1410 cm-1 since the aromatic ring of PET is unchanged.

Despite the degree of uncertainty in the deconvolution method due to the integration of the absorption bands, it appears to be a good estimate for the ratio between the area of the 1710 cm-1 (A1710) and 1410 cm-1 (A1410) absorption bands (Table 7). The relation between these peaks indicates

Table 6. Glass transition temperatures determined from DMA curves.

Sample Tg PP (ºC) Tg PET (ºC) PP -1 ± 1PET - 80[22] PP30/PET70 -8 ± 3 84 ± 6 PP30/PET70/MMT -5 ± 1 78 ± 4 PP70/PET30 -2 ± 1 78 ± 1 PP70/PET30/MMT -1 ± 1 83 ± 7

Figure 4. DSC curves showing cold crystallization of PET.

Polímeros, 32(3), e2022032, 2022

Figure 5. FTIR spectrum of the samples, indicating bands at 1710 and 1410 cm-1

Interactions of PP-PET blends modified by montmorillonite with different polarities
5/8

Porto, A. S., Alves, J. L., & Morales, A. R.

Table 7. Ratio between the area of the 1710 cm-1 and 1410 cm-1 bands.

Sample A1710 / A1410 PET 8 PP30/PET70 12 PP30/PET70/MMT 13 PP70/PET30 15 PP70/PET30/MMT 24

that both PP30/PET70 and PP70/PET30 blends saw an increase in the number of free carboxyl groups, that is, maleic anhydride probably reacted in these cases, opening its ring and covalently binding the PET polymer, increasing the ester groups in the system and thus causing some compatibilization between PP and PET at the interface.

After adding clay to the PP30/PET70/MMT system, the ratio remained about the same when compared to sample PP30/PET70. In the system with more PP (PP70/PET30/ MMT), the ratio increased from 15 to 24. This result shows that besides the reaction between PET and SEBS-g-MA, the OH groups of the polar clay are highly likely to react with SEBS-g-MA in this system, increasing their compatibilization.

Figure 6 depicts the suggested scheme that may explain the behavior of the studied system. SEBS-g-MA tends to remain at the interface and interact with both polymers, but chemically reacts with PET (as the comparative FTIR analysis shows an increase in ester groups, which occurred due to the reaction between MA groups and the PET chain terminals). For sample PP70/PET30/MMT, the X-Ray diffraction analysis shows that the peaks of the neat clays seem to disappear. Thus, we hypothesize that both the polar Cloisite® 30B clay and the non-polar Cloisite® 20A clay have exfoliated in our sample. This behavior is evidenced in the SEM analysis, by comparing Figures 3c and 3d, where the PP70/PET30/MMT system showed reduction in the domains and a poorly defined interface, probably due to clay exfoliation. Cloisite® 20A is exfoliated in the PP domains, whereas Cloisite®30B is exfoliated in the PET matrix. PET is predominantly in the dispersed phase. In the PP30/PET70/MMT sample, PET is predominantly in the continuous phase where Cloisite®30B is exfoliated. The dispersed phase is a PP-rich phase where the non-polar Cloisite® 20A clay is still present, indicating that some of it may have been intercalated and some exfoliated, as observed by X-Ray analysis. In the literature, Cloisite® 20A incorporated into PP blends with other polymers was described to be predominantly localized in the continuous phase and at the interface causing a reduction in the size of the dispersed polymer phase domains and was attributed to act as a barrier and decrease interfacial tension between the components, acting as a compatibilizer[32]. Similarly, the PP/PA blends where Cloisite® 30B was used due to its affinity to PA, showed to be mainly located at the interface which inhibited coalescence and caused the reduction of PA domains[33]. Improved interface and reduced well-defined domains (observed in the SEM images) can be attributed to the good chemical interface between PET and SEBS-gMA caused by the chemical ring-opening reaction of the maleic anhydride. Despite this significant improvement

Figure 6. Schematic morphology and component distribution: (a) PP70/PET30/MMT and (b) PP30/PET70/MMT.

in the interface, we observed no significant change in the mechanical properties of the system.

4. Conclusions

Organic montmorillonite clays with different polarities have shown to improve the compatibility of the system studied. The PP-rich blend was statistically modified by the addition of different MMT polarity, although the higher affinity of the polar MMT with PET and the non-polar MMT with PP. This can be attributed to the exfoliated clays, which led to a reduction in the domains as observed by SEM. Adding SEBS-g-MA resulted in a good adhesion between the phases, probably because SEBS-g-MA reacted with PET, increasing the compatibility of the system. Besides this reaction, the OH group of polar Cloisite® 30B may have had a strong interaction with both the compatibilizer and PET. The increased degree of blend crystallinity could be explained by the organization of lamellae at the clay/ polymer interface, which leads to a more brittle system with less capacity to absorb impact energy. This study hypothesizes about how and where different organically modified clays are dispersed to the incompatible polymer system and contributes to a better understanding on the interactions that may occur, opening new possibilities for future studies on thermoplastic polymer reuse.

5. Author’s Contribution

• Conceptualization – Ana Rita Morales.

• Data curation – Ariane Sarzi Porto.

• Formal analysis – Ariane Sarzi Porto; Jefferson Lopes Alves

• Investigation – Ariane Sarzi Porto.

• Methodology – Ariane Sarzi Porto; Ana Rita Morales; Jefferson Lopes Alves.

• Project administration – Ariane Sarzi Porto; Ana Rita Morales.

Polímeros, 32(3), e2022032,

2022 6/8

Interactions of PP-PET blends modified by montmorillonite with different polarities

• Resources – Ariane Sarzi Porto; Ana Rita Morales.

• Software – NA.

• Supervision – Ana Rita Morales.

• Validation – NA.

• Visualization – Ariane Sarzi Porto; Ana Rita Morales; Jefferson Lopes Alves.

• Writing – original draft – Ariane Sarzi Porto.

• Writing – review & editing – Ana Rita Morales; Jefferson lopes Laves.

6. Acknowledgements

The authors thank GlobalPet and Southern Clay Products for supplying the sample materials; 3M, IPEN/ USP, UFRJ and Thermoblend for supporting the analysis; Espaço da Escrita – Pró-Reitoria de Pesquisa – UNICAMP – for the language services provided; and FAEPEX/ UNICAMP for the article publication charge.

7. References

1 Manias, E., Touny, A., Wu, L., Strawhecker, K., Lu, B., & Chung, T. C. (2001). Polypropylene/montmorillonite nanocomposites. Review of the synthetic routes and materials properties. Chemistry of Materials, 13(10), 3516-3523 http:// dx.doi.org/10.1021/cm0110627

2 Weng, Z., Wang, J., Senthil, T., & Wu, L. (2016). Mechanical and thermal properties of ABS/montmorillonite nanocomposites for fused deposition modeling 3D printing. Materials & Design, 102, 276-283 http://dx.doi.org/10.1016/j.matdes.2016.04.045

3 Wang, Y., Wu, G., Kou, K., Pan, C., & Feng, A. (2016). Mechanical, thermal conductive and dielectrical properties of organic montmorillonite reinforced benzoxazine/cyanate ester copolymer for electronic packaging. Journal of Materials Science Materials in Electronics, 27(8), 8279-8287 http:// dx.doi.org/10.1007/s10854-016-4834-5

4 Zhou, J., Yao, Z., Zhou, C., Wei, D., & Li, S. (2014). Mechanical properties of PLA/PBS foamed composites reinforced by organophilic montmorillonite. Journal of Applied Polymer Science, 131(18), 40773 http://dx.doi.org/10.1002/app.40773

5 Magalhães, N. F., Dahmouche, K., Lopes, G. K., & Andrade, C. T. (2013). Using an organically-modified montmorillonite to compatibilize a biodegradable blend. Applied Clay Science, 72, 1-8 http://dx.doi.org/10.1016/j.clay.2012.12.008

6 Sengwa, R. J., Choudhary, S., & Sankhla, S. (2010). Dielectric properties of montmorillonite clay filled poly(vinyl alcohol)/ poly(ethylene oxide) blend nanocomposites. Composites Science and Technology, 70(11), 1621-1627 http://dx.doi. org/10.1016/j.compscitech.2010.06.003

7 Cyras, V. P., Manfredi, L. B., Ton-That, M.-T., & Vázquez, A. (2008). Physical and mechanical properties of thermoplastic starch/ montmorillonite nanocomposite films. Carbohydrate Polymers, 73(1), 55-63. http://dx.doi.org/10.1016/j.carbpol.2007.11.014.

8. Chen, X., Gao, H., & Ploehn, H. J. (2014). Montmorillonite–levan nanocomposites with improved thermal and mechanical properties. Carbohydrate Polymers, 101, 565-573 http://dx.doi. org/10.1016/j.carbpol.2013.09.073 PMid:24299812.

Polímeros, 32(3), e2022032, 2022

9 Jollands, M., & Gupta, R. K. (2010). Effect of mixing conditions on mechanical properties of polylactide/montmorillonite clay nanocomposites. Journal of Applied Polymer Science, 118(3), 1489-1493 http://dx.doi.org/10.1002/app.32475

10 Maddah, H. A. (2016). Polypropylene as a promising plastic: a review. American Journal of Political Science, 6(1), 1-11 http://dx.doi.org/10.5923/j.ajps.20160601.01

11 Romão, W., Spinacé, M. A. S., & De Paoli, M.-A. (2009). Poly(ethylene terephthalate), PET: a review on the synthesis processes, degradation mechanisms and its recycling. Polímeros: Ciência e Tecnologia, 19(2), 121-132 http://dx.doi.org/10.1590/ S0104-14282009000200009

12 Geyer, R., Jambeck, J. R., & Law, K. L. (2017). Production, use, and fate of all plastics ever made. Science Advances, 3(7), e1700782 http://dx.doi.org/10.1126/sciadv.1700782 PMid:28776036.

13 Araujo, L. M. G., & Morales, A. R. (2018). Compatibilization of recycled polypropylene and recycled poly (ethylene terephthalate) blends with SEBS-g-MA. Polímeros: Ciência e Tecnologia, 28(1), 84-91 http://dx.doi.org/10.1590/01041428.03016

14. Paiva, L. B., Morales, A. R., & Guimarães, T. R. (2006). Propriedades mecânicas de nanocompósitos de polipropileno e montmorilonita organofílica. Polímeros: Ciência e Tecnologia, 16(2), 136-140 http://dx.doi.org/10.1590/S010414282006000200014

15 Komatsu, L. G. H., Oliani, W. L., Lugao, A. B., & Parra, D. F. (2014). Environmental ageing of irradiated polypropylene/ montmorillonite nanocomposites obtained in molten state. Radiation Physics and Chemistry, 97, 233-238 http://dx.doi. org/10.1016/j.radphyschem.2013.12.004

16 Kim, D. H., Fasulo, P. D., Rodgers, W. R., & Paul, D. R. (2007). Structure and properties of polypropylene-based nanocomposites: effect of PP-g-MA to organoclay ratio. Polymer, 48(18), 5308-5323. http://dx.doi.org/10.1016/j. polymer.2007.07.011

17 Kráčalík, M., Mikešová, J., Puffr, R., Baldrian, J., Thomann, R., & Friedrich, C. (2007). Effect of 3D structures on recycled PET/organoclay nanocomposites. Polymer Bulletin, 58(1), 313-319 http://dx.doi.org/10.1007/s00289-006-0592-5

18 Kráčalík, M., Studenovský, M., Mikešová, J., Sikora, A., Thomann, R., Friedrich, C., Fortelný, I., & Šimoník, J. (2007). Recycled PET nanocomposites improved by silanization of organoclays. Journal of Applied Polymer Science, 106(2), 926-937. http://dx.doi.org/10.1002/app.26690.

19 Kráčalík, M., Studenovský, M., Mikešová, J., Kovářová, J., Sikora, A., Thomann, R., & Friedrich, C. (2007). Recycled PET-organoclay nanocomposites with enhanced processing properties and thermal stability. Journal of Applied Polymer Science, 106(3), 2092-2100 http://dx.doi.org/10.1002/app.26858

20 . Gurmendi, U., Eguiazabal, J. I., & Nazabal, J. (2007). Structure and properties of nanocomposites with a poly(ethylene terephthalate) matrix. Macromolecular Materials and Engineering, 292(2), 169-175 http://dx.doi.org/10.1002/mame.200600376

21 Calcagno, C. I. W., Mariani, C. M., Teixeira, S. R., & Mauler, R. S. (2009). Morphology and crystallization behavior of the PP/PET nanocomposites. Journal of Applied Polymer Science, 111(1), 29-36. http://dx.doi.org/10.1002/app.28977.

22 Calcagno, C. I. W., Mariani, C. M., Teixeira, S. R., & Mauler, R. S. (2008). The role of the MMT on the morphology and mechanical properties of the PP/PET blends. Composites Science and Technology, 68(10-11), 2193-2200 http://dx.doi. org/10.1016/j.compscitech.2008.03.012

23. Entezam, M., Khonakdar, H. A., Yousefi, A. A., Jafari, S. H., Wagenknecht, U., & Heinrich, G. (2013). Dynamic and transient shear start-up flow experiments for analyzing nanoclay

7/8

Porto, A. S., Alves, J. L., & Morales, A. R.

localization in PP/PET blends: correlation with microstructure. Macromolecular Materials and Engineering, 298(1), 113-126 http://dx.doi.org/10.1002/mame.201100435

24 Van Krevelen, D. W., & Nijenhuis, K. T. (2009). Properties of polymers. Their correlation with chemical structure: their numerical estimation and prediction from additive group contributions Netherlands: Elsevier

25 Kim, T. K. (2017). Understanding one-way ANOVA using conceptual figures. Korean Journal of Anesthesiology, 70(1), 22-26 http://dx.doi.org/10.4097/kjae.2017.70.1.22 PMid:28184262.

26 Souza, P. M. S., Morales, A. R., Marin-Morales, M. A., & Mei, L. H. I. (2014). Estudo da influência de argilas organofílicas no processo de biodegradação do PLA. Polímeros Ciência e Tecnologia, 24(1), 110-116 http://dx.doi.org/10.4322/ polimeros.2014.058

27 Wunderlich, B. (1990). Thermal analysis USA: Academic Press, Inc. http://dx.doi.org/10.1016/B978-0-12-7656052.50006-6

28 Nagaraj, S. K., Shivanna, S., Subramani, N. K., & Siddaramaiah, H. (2016). Revisiting powder x-ray diffraction technique: a powerful tool to characterize polymers and their composite films. Research, & Reviews. Journal of Materials Science, 4(4), 1-5 http://dx.doi.org/10.4172/2321-6212.1000158

29 Tanniru, M., Yuan, Q., & Misra, R. D. K. (2006). On significant retention of impact strength in clay–reinforced high-density polyethylene (HDPE) nanocomposites. Polymer, 47(6), 21332146 http://dx.doi.org/10.1016/j.polymer.2006.01.063

30 Liu, N. C., & Baker, W. E. (1992). Reactive polymers for blend compatibilization. Advances in Polymer Technology, 11(4), 249-262 http://dx.doi.org/10.1002/adv.1992.060110403

31 Orr, C. A., Cernohous, J. J., Guegan, P., Hirao, A., Jeon, H. K., & Macosko, C. W. (2001). Homogeneous reactive coupling of terminally functional polymers. Polymer, 42(19), 8171-8178 http://dx.doi.org/10.1016/S0032-3861(01)00329-9

32 Chandran, N., Chandran, S., Maria, H. J., & Thomas, S. (2015). Compatibilizing action and localization of clay in a polypropylene/natural rubber (PP/NR) blend. RSC Advances, 5(105), 86265-86273 http://dx.doi.org/10.1039/C5RA14352G

33. Beuguel, Q., Ville, J., Crepin-Leblond, J., Mederic, P., & Aubry, T. (2017). Influence of clay mineral structure and polyamide polarity on the structural and morphological properties of clay polypropylene/polyamide nanocomposites. Applied Clay Science, 135, 253-259 http://dx.doi.org/10.1016/j.clay.2016.09.034

Received: Mar. 03, 2022

Revised: Jun. 20, 2022

Accepted: Aug. 04, 2022

Polímeros, 32(3), e2022032,

2022 8/8

Influence of processing parameters on mechanical and thermal behavior of PLA/PBAT blenda

Virnna Cristhielle Santana Barbosa1* , Ana Maria Furtado de Sousa1  and Ana Lúcia Nazareth da Silva2,3 

1Instituto de Química, Universidade do Estado do Rio de Janeiro – UERJ, Rio de Janeiro, RJ, Brasil

2Instituto de Macromoléculas Professora Eloisa Mano, Universidade Federal do Rio de Janeiro – UFRJ, Rio de Janeiro, RJ, Brasil

3Programa de Engenharia Ambiental, Universidade Federal do Rio de Janeiro – UFRJ, Rio de Janeiro, RJ, Brasil

aThis paper has been partially presented at the 16th Brazilian Polymer Congress, held on-line, 24-28/Oct/2021.

*ananazareth@ima.ufrj.br

Obstract

This study evaluates the influence of processing parameters and reactive extrusion on the mechanical and thermal behavior of PLA/PBAT (70/30, wt.%) blends. The effect of reverse mixing elements (RME) and feed rate (FR) of the extruder were studied using a factorial design of experiments. Further, two types of blends were processed by extrusion molding: with (AD) and without (NAD) additives. The FTIR analysis showed that PLA suffered some degree of degradation, being this process more pronounced for NAD blends. A better interaction between the PLA and PBAT phases occurred for reactive extrusion, inducing an improvement in the impact properties and thermal behavior. The cold crystallization temperature of the NAD blends decreased when two RME was used. Both RME and FR parameters affected the elastic modulus of NAD blends, while only FR affected the elastic modulus of AD blends.

Keywords: poly(lactic acid) (PLA), poly(butylene adipate-co-terephthalate) (PBAT), reactive extrusion.

How to cite: Barbosa, V. C. S., Sousa, A. M. F., & Silva, A. L. N. (2022). Influence of processing parameters on mechanical and thermal behavior of PLA/PBAT blend. Polímeros: Ciência e Tecnologia, 32(3), e2022033. https://doi.org/10.1590/0104-1428.20220018

1. Introduction

Researches based on polymers from biological sources and/or biodegradable polymeric materials have become one of the most interesting fields of macromolecular science and technology[1]. In this context, poly(lactic acid) (PLA) and poly(butylene adipate-co-terephthalate) (PBAT) are biopolymers from renewable and fossil sources, respectively, which have performance properties comparable to those of traditional thermoplastics. PLA and PBAT appear as favorable alternatives for application in several segments, especially in packaging[2-4]. PLA/PBAT blends attract interest due to the improvements promoted by their combinations of properties, in addition to having a significant commercial potential[5-8]. PLA has certain characteristics that limit its application, such as low toughness at room temperature and low heat deflection temperature compared to conventional polymers. This behavior can be balanced by blending with PBAT, which has a high elongation at break and low elastic modulus, with a mechanical behavior similar to a thermoplastic elastomer, thus being considered an excellent option for combining the characteristics of two polymers[5,9,10]

PLA and PBAT are polymers thermodynamically immiscible, which can compromise their blend morphology

and, consequently, their final performance[11]. The control of the complex morphology of the immiscible polymeric blends is an important factor for developing new materials. In this context, it is also important to study the effect of additive incorporation and the processing parameters on the interaction improvement between the phases of immiscible blends[11,12]

Arruda et al.[10] studied the action of multifunctional epoxide as a chain extender, available on the market as Joncryl, on the mechanical behavior of PLA/PBAT blends. They obtained an improvement in thermal stability and an increase in complex viscosity; however, the chain extender was not sufficient to provide greater adhesion between phases[13] Hongdilokkul et al.[14] used di-(tert.-butyl-peroxy-isopropyl) benzene peroxide, commercially known as Perkadox, as a reactive agent in the PLA/PBAT blend. The results showed improvements in the toughness properties of the blend and in interfacial adhesion. Rigolin et al.[11] also evaluated a method to obtain flexible blends with good interfacial adhesion. For this purpose, PLA was grafted with maleic anhydride, and the resulting PLA-g-MA was used as a matrix with the addition of dicumyl peroxide. The modification generated

https://doi.org/10.1590/0104-1428.20220018 O O O O O O O O O O O O O O O
ISSN 1678-5169 (Online) 1/11
Polímeros, 32(3), e2022033, 2022

Barbosa, V. C. S., Sousa, A. M. F., & Silva, A. L. N.

low molar mass blends, but with homogeneous dispersed phase morphology compared to the PLA/PBAT.

The extruder has at least three different types of elements that can be changed and configured. The transport elements, to transport the material along the length of the thread profile; mixing elements, to favor the mixing of constituent materials exerting direct influence on shear; and reverse elements, with the aim of extending the residence time and favoring a more intensive mixing[15,16]. Processing characteristics can be induced, from mild to severe, according to the configuration of the screw thread and its elements, changing the extent of physicochemical changes that influence the quality of the product[10,17,18]. The inclusion of reverse elements can widen the residence time distribution, especially at low feed rates[12], in addition to increasing the mixing and dispersion of the material in the extruder, as the geometry of the reverse elements must ensure a more intense shear of the material[19]. Ambrósio et al.[20] studied the effects of extrusion feed rate on the extrusion of a Polybutylene Terephthalate (PBT)/ Acrylonitrile butadiene styrene (ABS) blend. For them, the reduction in the feed rate contributed to the reduction of the Izod impact resistance. For Yeh et al.[21], the increase in the extruder feed rate reduced the average residence time, and this effect was more pronounced than the screw speed.

The novelty of the present work is the study of the influence of processing parameters, such as the screw profile and feed rate, on the mechanical and thermal properties of blends based on PLA and PBAT. The processing was carried out by non-reactive extrusion and reactive extrusion of a PLA/PBAT composition (70/30, wt.%).

2. Materials and Methods

2.1 Materials

The biopolymers PLA IngeoTM 2003 from NatureWorks LLC (data sheet value of melt flow index: 6 g.10min-1 at 2.26kg/210°C, test result value of melt flow index: 6.24 ± 0.54 g.10min-1 at 2.26kg/210°C, Mw: 206,239 g/mol, and polydispersity index:1.7) and PBAT Ecoflex® FBX 7011 from BASF (melt flow index: 2.7 – 4.9 g.10min-1 at 2.26kg/190°C) were purchased from Oeko Bioplásticos. Maleic anhydride (MA) grade STBH9257 and dicumyl peroxide (DCP) grade Retilox 40 SAP, both used as additives for reactive extrusion, were purchased in local market.

2.2 Design of experiments (DOE)

The effects of the reverse mixture elements (RME) and the feed rate (FR) in the properties of the PLA/PBAT (70/30, wt.%) blends were assessed using the Simple Factorial 22 design of experiment (DOE). Table 1 shows the experimental matrix and respective actual values of RME and FR. This DOE investigation was applied for two conditions of processing: non-reactive and reactive extrusion, which were coded as NAD (the additives MA and DCP were not used) and AD (the additives MA and DCP were used). The experimental code used for the blend identification is X/Y-W where X and Y are the actual values of RME and FR (Table 1), and W can assume the code “AD” or “NAD” for reactive and non-reactive extrusion, respectively. For AD blends the amount of MA and DCP were, respectively,

Table 1. DOE matrix of Simple Factorial 22

Code level Actual value

RME FR RME FR -1 -1 0 2.5 kg.h-1 -1 1 0 5.2 kg.h-1 1 -1 2 2.5 kg.h-1 1 1 2 5.2 kg.h-1 0 0 1 3.9 kg.h-1

Note: Center point (RME:0 and FR:0): three replicates for NAD and two replicates for AD.

1.0 and 2.0 phr (parts per hundred of resin) in relation to PLA, which corresponds to 1.0 and 1.9 wt%, respectively. Additionally, pristine polymers PLA and PBAT were also processed under RME/FR conditions of 0/2.5 (PLA–0/2.5 and PBAT–0/2.5) and 2/5.2 (PLA–2/5.2 and PBAT–2/5.2) to be used as references of comparison to the blends.

The response variables were impact resistance (IR), elastic modulus (EM), yield stress (YS), temperature at maximum degradation rate (Tmax), cold crystallization temperature (Tcc), cold crystallization enthalpy (ΔHc), melting temperatures (Tm1 and Tm2), melting enthalpy (ΔHf), and degree of crystallinity (χc).

The DOE analysis was performed using Statistics v.10 software at the 95% confidence level (p-values < 0.05), and the results were presented in this study as Pareto Charts and graphics of means. The Pareto chart is a bar graphic that displays the contribution of the factors and/ or their interactions in a decrease order of importance, and contains a line related to the p-value of 0.05. Any effect and/interaction that extends this reference line affects the response variable.

2.3 Blends preparation

Before the extrusion process, PLA and PBAT were dried in a forced-air oven at 60°C for 20h. The blends and pristine polymers were processed using a Tecktril DCT20 co-rotating twin screw extruder (L/D: 36 and D:20 mm) with screw speed of 200 rpm, and temperature profile of 90 /180/190/190/190/200/200/200/190ºC.

After extrusion, the materials were pelletized. The test specimens were prepared by injection molding in the Arburg machine model 270S with a temperature profile of 200/200/190/180/180ºC, 1500 bar injection pressure, molding temperature of 30°C, and cooling time of 30s. Similar to extrusion, the PLA/PBAT blends and PLA and PBAT were dried in a forced-air oven at 60°C for 20h before being submitted to the injection. The screw profiles used are described in Figure 1

2.4 Characterizations

Infrared spectra (FTIR) were recorded on a PerkinElmer spectrometer, model Spectrum One, working in the attenuated total reflectance (ATR) mode, in a range of 4000–515 cm-1. The absorbance height ratios were measured using the baseline 1910 – 810 cm-1. The impact resistance (IR) was evaluated with Izod impact test (ASTM D256). The specimens were subjected to the impact of a

Polímeros, 32(3), e2022033,

2022 2/11

Figure 1. Screw profiles used. Zones: 1-9.

2 J pendulum at an angle of 90°, on CEAST equipment, model Resil Impactor. Tensile properties were determined by the Universal Testing Machine, model EMIC DL3000, according to ASTM D638, with a speed of 5 mm.min-1 Thermogravimetric Analysis (TGA) was conducted in a Q500 analyzer, TA Instruments, under an atmosphere of N2, from 30 to 700°C, and heating rate of 20°C.min-1 From each thermogram, it was read the temperature at the maximum mass loss rate (Tmax). The effect of the process parameters on the crystallization behavior of the blends was evaluated using a DSC Analyzer, model 2910 MDSC, heating the samples in nitrogen atmosphere from 40 to 210°C at 5°C.min-1. This protocol was set to investigate the effect of the process parameters on the crystallization of the polymers. The crystallinity of pristine PLA and the PLA presented in the blends were determined by Equation 1, and the crystallinity of pristine PBAT was determined using Equation 2. 100 *93 PLA HfHc wPLA χ ∆−∆ =× (1)

where χPLA is the crystallinity degree of PLA, wPLA is the PLA content, ΔHf is the melting enthalpy of PLA in J.g-1 and ΔHc is the cold crystallization enthalpy of PLA in J.g-1 [13,22,23] 100 114 PBAT Hf

where χPBAT is crystallinity degree of PBAT, ΔHf is the melting enthalpy of PBAT in J.g-1 and ΔHc is the cold crystallization enthalpy of PBAT in J.g-1[13,22,23]. The morphology of the blends was observed using a scanning electron microscope (SEM), model JEOL JSM-6510. The standard dumbbell test specimens (Type 1, ASTM D638) were cryogenically fractured in the “neck region” to allow observing the disperse phase in the transverse and parallel directions in relation to the length of the sample (Lo), based on the Standard ASTM D638. Then, the cryofractured surface were sputter-coated with gold before analysis.

3. Results and Discussions

3.1 SEM micrographs

Figure 2 presents the images from SEM taken in the fractured surface of PLA/PBAT blends. As expected, both the NAD and AD blends show phase-separated morphology typical of immiscible polymers[7,8]

Analyzing the images of the NAD blends (Figure 2a-j), one observes that the dispersed phase of PBAT has a fibrillar form oriented with the parallel direction, although some droplets and circular cavities are also visible. On the other side, the dispersed phase of all AD blends presents the droplet shape in the parallel and transverse directions (Figure 2k-t). Additionally, both RME and FR factors did not affect the morphologies of the disperse phase of the AD and NAD blends. Similar droplet morphology with dimensions around 0.3 – 0.5 mm for PLA/PLA-g-MA/PBAT was reported by Rigolin et al.[11], that is, lower than that observed in this study.

3.2 Fourier-transform infrared spectroscopy (FT-IR)

FT-IR analysis was used to investigate whether the addition of MA and DCP for reactive extrusion and/or FR and RME have generated, or not, some occurrence of degradation in PLA/PBAT blends. Figure 3 presents a comparison among the spectra of the PLA/PBAT blends, and the PLA and PBAT without processing (coded “pellet”).

The most important bands that characterize sample “PLA pellet” are at around 1752 cm-1 (carbonyl elongation vibration C–O), 1453 cm-1 (CH3 asymmetric bending vibration), 1182, and 1090 cm-1 (symmetrical elongation of C–O–C), and 872 cm-1 (C-COOO stretching)[24-27]. Further, there are two bands at around 2800-3000 cm-1 relating to the symmetric stretching vibration of the axial CH groups in saturated hydrocarbons[13,28]. The presence of the bands around 3298 cm-1 (O–H)[27] and 1636 cm-1 (H–O–H)[13] can be associate with the presence of moisture in the “PLA pellet” sample. For sample “PBAT pellet,” the most relevant bands are located at the regions 727 cm-1, 1712 cm-1, and 2960 cm-1,

3/11
Influence of processing parameters on mechanical and thermal behavior of PLA/PBAT blenda Polímeros, 32(3), e2022033, 2022
χ ∆ =× (2)

of: (a-b) 0/2.5-NAD, (c-d) 0/5.2-NAD, (e-f) 2/2.5-NAD, (g-h) 2/5.2-NAD, (i-j) 1/3.9-NAD, (k-l) 0/2.5-AD, (m-n) 0/5.2-AD, (o-p) 2/2.5AD, (q-r) 2/5.2-AD, and (s-t) 1/3.9-AD.

which are assigned, respectively, to the vibration in the CH plane of the benzene ring[24,25], C–O stretch vibration[26] and CH stretching in the aliphatic and aromatic portions[28].

It is observed that NAD and AD blends present all the aforementioned bands of the PBAT and PLA pellet samples, except the bands at around 3298 cm-1 and 1636 cm1. This means that the bands of OH groups (around the 3500 cm-1)[27] associated with the degradation of PLA by mechanism hydroxyl groups[23] were not identified. Additionally, the band characteristic of the ester carbonyl group (1751 cm-1) did not shift to the region of the acid carbonyl group (around 1756 cm-1)[29]. This result indicates that PLA did not suffer hydrolysis degradation, which is an expected behavior, since both the PLA and PBAT were dried in an air circulation oven for moisture removal before being processed. However, PLA can suffer thermomechanical and thermo-oxidative degradation caused by high temperature and shear in the oxygen presence during the extrusion process. Since this degradation process

breaks the polymer chain, producing more ester group, it can be investigated by the absorbance height ratios related to carbonyl groups[30], that is, 1752 cm-1 (C=O stretching), 1182 cm-1 (C–O stretching), and 1090 cm-1 (C–O stretching) in relation to the band of CH3 deformation at 1453 cm-1 (Figure 4). Using “PLA pellet” data as a reference, the comparison shown in Figure 4 indicates that both PLA processed (PLA-0/2.5 and PLA-2/5.2) and PLA into the NAD and AD blends suffered thermomechanical and/or thermo-oxidative degradations, being this process more pronounced for the blends produced by non-reactive extrusion. It is important to highlight that this comparison is just a qualitative way to evaluate the occurrence of the degradation process.

Unlike other studies[31,32], the characteristic bands of MA corresponding to the stretch of C = O in the ranges of 1830 – 1800 cm-1 and 1775 – 1740 cm-1 [33] were not identified. One reason is the overlapping of the bands (region at1775 – 1740 cm-1) and/or the lower intensity of the band at

Polímeros,

Barbosa, V. C. S., Sousa, A. M. F., & Silva, A. L. N.
e2022033, 2022 4/11
32(3),
Figure 2. SEM images of PLA/PBAT blends at 8000x of magnification (2 µm) taken in the transverse and parallel melt flow directions

Influence of processing parameters on mechanical and thermal behavior of PLA/PBAT blenda

Figure 3. FT-IR spectra for: (a) PLA pellet, PLA–2/5.2, and PLA–0/2.5, (b) PBAT pellet, PBAT–2/5.2, (c) 2/5.2-NAD, 0/5.2-NAD, 2/2.5-NAD, 0/2.5-NAD, and (d) 2/5.2-AD, 0/5.2-AD, 2/2.5-AD, 0/2.5-AD.

around 1830 – 1800 cm-1 due to the small content of maleic anhydride (1.0 wt.%) in the AD blends.

3.3 Thermal properties by TGA

Table 2 shows the values of temperature at the maximum degradation rate (Tmax) for AD and NAD blends, PLA and PBAT processed under 0/2.5 and 2/5.2 conditions, and PLA and PBAT pellet. To better illustrate this thermal property, Figure 5 shows the comparison of the DTG curves of PLA–0/2.5, PBAT–0/2.5, 0/2.5-AD, and 0/2.5-NAD (Figure 5a) and PLA–2/5.2, PBAT–2/5.2, 2/5.2-AD, and 2/5.2-NAD (Figure 5b).

Using Tmax value of “PLA and PBAT pellet” as a reference (Table 3), one observes a reduction of the Tmax values just for the PLA–0/2.5 and PLA–2/5.2, being the values of processed PBAT remained the same as the PBAT pellet one. Furthermore, a reduction in the T max values of NAD and AD blends was also observed, being this reduction more pronounced than the one of processed PLA. This shift of Tmax for lower values of temperature corroborates the finds of the FTIR analysis, which indicated that PLA suffered some degradation process, being this process seemingly more pronounced for the PLA/ PBAT blend produced by non-reactive extrusion. This result is interesting since it suggests a better thermal resistance of the PLA/PBAT blend produced from reactive extrusion. According to the literature[2], blends with better phase interaction tend to show higher thermal stability. Regarding the effect of the extrusion process parameters, the analysis of DOE for AD and NAD blends resulted that both RME and FR did not cause any influence on the Tmax since all p-values were higher than 0.05.

Polímeros, 32(3), e2022033, 2022

Figure 4. Comparison of the absorbance height ratio among the PLA/PBAT blends produced from reactive (AD blends) and nonreactive extrusion (NAD blends), PLA-0/2.5, PLA-2/5.2, and PLA-pellet.

3.4 Thermal properties by DSC

Figures 6 and 7 show the DSC curves for the pristine polymers and blends, respectively. The thermal properties obtained from the DSC analysis are shown in Table 3

The analysis of curves in Figure 6 shows that the curve of PLA pellet did not exhibit a peak related to cold crystallization, while the PLA-0/2.5 and PLA-2/5.2 do due to a thermal history of processing. Different to PLA pellet, both PLA and PLA-2/5.2 showed an endothermic transition characterized by a bimodal melting peak that occurs due to

5/11

Barbosa, V. C. S., Sousa, A. M. F., & Silva, A. L. N.

Table 2. Temperature at maximum degradation rate (Tmax) of the PLA/PBAT blends produced from non-reactive extrusion (NAD blends) and reactive (AD blends), PLA and PBAT processed under 0/2.5 and 2/5.2 conditions, and PLA and PBAT pellets.

Sample code T max (°C) Sample code T max (°C) Sample code T max (°C) PLA–0/2.5 383 0/2.5-NAD 365 0/2.5-AD 369 PBAT-0/2.5 419 2/2.5-NAD

0/5.2-NAD 350 0/5.2-AD 373 347 2/2.5-AD 369 PLA–2/5.2 384 2/5.2-NAD 359 2/5.2-AD 362 PBAT-0/2.5 420

1/3.9-NAD 362 ± 5 1/3.9-AD 365 ± 4 PLA pellet 391 PBAT pellet 420

Figure 5. DTG curves comparison of PLA, PBAT, PLA/PBAT blends produced from non-reactive extrusion (NAD blends) and reactive (AD blends) under (a) 0/2.5 condition and (b) under 2/5.2 condition.

the heterogeneity of the crystal formation[34,35]. No significant differences were observed for any of the PBAT sample. In fact, one can observe in Table 3 that PLA-0/2.5 and PLA2/5.2 showed a reduction in χc, while that PBAT-0/2.5 and PBAT-2/5.2 did not, compared to the χc values of PLA pellet and PBAT pellet, respectively.

In contrast to the PBAT-0/2.5 and PBAT-2/5.2 (Figure 6), a peculiar result is observed in the DSC curves of the blends (Figure 7a, b), that is, the disappearance of the peak referring to the melting of PBAT crystals, which that should have occurred at temperatures around 125°C (Figure 4). This result indicates that the PBAT phase is in the amorphous state. One reason that can explain this find is that the lower chain flexibility of PLA can hinder the mobility of PBAT chains, making it difficult to crystallize[13]. The comparison of the values of χc of PLA (Table 3) shows that both NAD and AD blends presented lower χc than PLA pellet and slightly lower than PBAT-0/2.5 and PBAT-2/5.2, which suggests that the presence of the PBAT phase disturbs the PLA to crystalize[27,32]

The analysis of the experiment for NAD blends, for all properties presented in Table 3, resulted that only the cold crystallization temperature (Tcc) was affected by the extrusion process parameters. Figure 8 shows the Pareto Chart and the Graphic of means for Tcc obtained from the design of experiment.

Figure 6. DSC curves of PLA pellet, PBAT pellet, PLA-0/2.5, PLA-2/5.2, PBAT-0/2.5, and PBAT-2/5.2.

It is observed that RME had a slight effect (p-value: 0.039) on the Tcc property, that is, the use of two reverse mixture elements contributes to reducing the Tcc of the blends. Furthermore, one can observe that exists a trend of reduction in the T cc values of NAD blends compared with the PLA–0/2.5 and PLA–2/5.2, as well as AD blends.

Polímeros, 32(3), e2022033,

2022 6/11

Influence of processing parameters on mechanical and thermal behavior of PLA/PBAT blenda

Table 3. Test results of T cc, ΔHc, Tm1, Tm2, ΔHf and χc.

Samples Code T cc (J.g-1) ΔH c (J.g-1) Tm1 (°C) Tm2 (°C) ΔHf (J.g-1) χc PBAT (%) χc PLA (%)

PLA pellet - - 155 - 28 - 30

PBAT pellet - - 123 - 11 10 -

PLA–0/2.5 100 18 148 157 22 - 6

PLA–2/5.2 101 20 149 157 24 - 6

PBAT–0/2.5 - - 121 - 11 10 -

PBAT–2/5.2 - - 125 - 11 100/2.5 – NAD 99 13 146 153 16 - 5

0/5.2 – NAD 96 12 145 152 15 - 3 2/2.5 – NAD 86 12 134 142 15 - 5 2/5.2 – NAD 94 12 142 150 15 - 5 1/3.9 – NAD 94 ± 6 12 ±1 142 ±5 149 ±5 15 ± 1 - 4 ±1

0/2.5 – AD 98 15 145 155 18 - 3

0/5.2 – AD 98 14 145 155 17 - 5

2/2.5 – AD 96 14 143 154 17 - 5 2/5.2 – AD 100 15 145 156 17 - 3 1/3.9 – AD 98 ± 2 15 ±1 145±1 155 ±1 17 ± 1 - 4 ±1

Legend: Tcc: cold crystallization temperature; ΔHc: cold crystallization enthalpy; Tm1 and Tm2: first and second temperatures of the bimodal melting peak of PLA; ΔHf: melting enthalpy; and χc: degree of crystallinity.

Figure 7. DSC curves for PLA/PBAT blends produced from (a) non-reactive extrusion (NAD blends) and (b) reactive extrusion (AD blends).

Figure 8. Pareto’s chart and Plot of Means for Tcc of NAD blends generated from the analysis of experiment.

According to literature[36], the exothermic crystallization peak during heating occurs due to the reorganization of amorphous into crystalline domains, caused by the increase in flexibility and macromolecular mobility generated by the

Polímeros, 32(3), e2022033, 2022

temperature rise. Therefore, based on this finding, one can infer that the high shear generated by the use of the two RME produced a “arrange” of polymer chains that facilitated their movement. Regarding AD blends, the analysis of the

7/11

Barbosa, V. C. S., Sousa, A. M. F., & Silva, A. L. N.

experiment resulted that both RME and FR did not affect none of the thermal properties shown in Table 3 since all p-values were higher than 0.05.

3.5 Mechanical properties

Table 4 presents the experimental data of impact resistance (IR), initiation (IE) and crack propagation (PE) energies, elastic modulus (EM), and yield stress (YS).

The PLA/PBAT unmodified blends (NAD blends) showed higher standard deviation of all properties, as can be seen in the comparisons between 1/3.9–NAD and 1/3.9–AD blends. This tendency of higher variability of NAD blends can be attributed to the fact that the immiscibility of PLA and PBAT leads to the production of non-uniform morphology[14]

Regarding the Izod impact test, as expected, the blends of the two groups had a much higher IR values than the value of pristine PLA, showing the role of the PBAT to improve the toughness. One can observe that the AD blends presented higher values of IR than the NAD ones. The same behavior was found for IE and PE. Further, one can observe that the energies to initiate the crack are always higher than the propagation values regardless the group of blends. All the previous results indicated that the blends compatibilized by

Table 4. Mechanical Properties of PLA, PBAT and PLA/PBAT blends.

reactive extrusion showed a higher toughness behavior. This result suggests that a better interaction between the phases of PLA and PBAT occurred during reactive extrusion. The better toughness behaviour of AD blends was the opposite of the reported by Rigolin et al.[11]. With respect to the effect of RME and FR on the toughness behavior of the two groups of blends, the analysis of experiment resulted in p-value higher 0.05, meaning that the two factors did not lead to significant changes in the IR, IE, and PE properties.

In relation to tensile properties, although there is a tendency for reduction of YS values for AD blends compared to NAD ones, the same behavior was not seen for stiffness, given that the difference in EM’s values between the two groups was not so significant. Being precise, changes between the two groups were observed only for experiments 0/2.5 and 1/3.9, that is, the EM of 0/2.5–NAD was 10% higher than the value of 0/2.5–AD, while the EM of 1/3.9–NAD blend was 6% lower than the value of 1/3.9–AD. This find is the opposite of Rigolin et al.[11] study, which reported a decrease in elastic modulus for the blends produced by reactive extrusion.

Figure 9 shows the Pareto Chart and the Graphic of means for EM property obtained from the design of experiment.

Code IR (J/m) IE (J,10-3) PE (J,10-3) EM (MPa) YS (MPa)

PLA (0/2.5) 27 ± 2 78 ± 10 15 ± 3 1895 ± 122 58 ± 1

PLA (2/5.2) 26 ± 5 73 ± 16 15 ± 3 1852 ± 122 56 ± 1

PBAT (0/2.5) Specimens did not break 54 ± 9 6 ± 0 PBAT (2/5.2) Specimens did not break 54 ± 3 6 ± 0

0/2.5 – NAD 70 207 25 1788 40

0/5.2 – NAD 88 277 20 1538 38 2/2.5 – NAD 93 279 20 1602 39 2/5.2 – NAD 90 276 24 1583 38 1/3.9 – NAD 73 ± 11 229 ± 38 17 ± 7 1535 ± 4 39 ± 1 0/2.5 – AD 108 327 27 1610 35 0/5.2 – AD 100 295 32 1542 35 2/2.5 – AD 108 333 27 1603 35 2/5.2 – AD 110 330 22 1550 34 1/3.9 – AD 95 ± 2 296 ± 4 21 ± 3 1624 ± 1 34 ± 1

Figure 9. Elastic Modulus (EM) of NAD blends: (a)Pareto Chart and (b) Plot of means, and AD blends: (c) Pareto Chart and (d) Plot of means.

Polímeros, 32(3), e2022033,

2022 8/11

Influence of processing parameters on mechanical and thermal behavior of PLA/PBAT blenda

It is observed in the Pareto Chart (Figure 9a) that both RME and FR parameters and the interaction between them was significant for the NAD blend group (p-values are higher than 0.05). According to the means plot (Figure 9b), EM decreases and FR increases, but this reduction is more pronounced when there are no reverse mixture elements (Figure 9b – blue, RME: -1, actual value of 0) on the extruder profile. Alternatively, the Pareto Chart of AD blends (Figure 9c) shows that only FR influenced the EM property, producing a decrease in it as the factor level increased (Figure 9d). This result reveals how effective the reactive extrusion was since the AD blends were less susceptible to the effect of process parameters. One reason that explains this result is the fact that the addition of MA and DCP led to a greater interaction between PLA and PBAT phases, which was responsible for the higher stability of the melt morphology during processing. In contrast with EM, the analysis of experiment revealed that FR and RME, as well as their interaction, did not affect the YS for both AD and NAD blends (p-values > 0.05). Previous findings related to Izod impact and tensile properties mean that, depending on the processing conditions, PLA and PBAT compatibilized blends in the reactive extrusion can lead to the production of materials with higher toughness, simultaneously, without significantly lost its stiffness behavior.

4. Conclusions

This study revealed that a better interaction between the PLA and PBAT phases occurred by reactive extrusion. The FTIR and TGA analysis showed that pristine polymers and their blends suffered a slight thermo-mechanical and thermo-oxidative degradation that does not compromise the mechanical properties. An increase in the impact behavior of the blends was observed, without significantly lost in the rigidity behavior. The feed rate (FR) and reverse mixture elements (RME) affected the EM property for NAD blends, while only FR affected the AD blends. According to the thermal properties of the DSC, the AD blends were also more resistant and less sensitive to changes in processing. The T cc of the NAD blend decreased as the number of reverse mixing elements increased and this behavior did not repeat for AD blends. It can be concluded that blends produced by reactive extrusion presented better mechanical and thermal behavior.

5. Author’s Contribution

• Conceptualization – Virnna Cristhielle Santana Barbosa; Ana Maria Furtado de Sousa; Ana Lúcia Nazareth da Silva.

• Data curation – Virnna Cristhielle Santana Barbosa.

• Formal analysis – Virnna Cristhielle Santana Barbosa.

• Funding acquisition – Ana Maria Furtado de Sousa; Ana Lúcia Nazareth da Silva.

• Investigation – Virnna Cristhielle Santana Barbosa.

• Methodology – Ana Maria Furtado de Sousa; Ana Lúcia Nazareth da Silva.

• Project administration – Ana Lúcia Nazareth da Silva.

Polímeros, 32(3), e2022033, 2022

• Resources – Virnna Cristhielle Santana Barbosa; Ana Maria Furtado de Sousa; Ana Lúcia Nazareth da Silva.

• Software – Not applicable.

• Supervision – Ana Maria Furtado de Sousa; Ana Lúcia Nazareth da Silva.

• Validation – Virnna Cristhielle Santana Barbosa; Ana Maria Furtado de Sousa; Ana Lúcia Nazareth da Silva.

• Visualization – Virnna Cristhielle Santana Barbosa.

• Writing – original draft – Virnna Cristhielle Santana Barbosa.

• Writing – review; editing – Ana Maria Furtado de Sousa; Ana Lúcia Nazareth da Silva.

6. Acknowledgements

We would like to thank the Conselho Nacional de Desenvolvimento Científico e Tecnológico (BR) –CNPq [PQ-2/2018: 305007/2018-1 and PQ-2/2021: 309461/2021-9], Fundação Carlos Chagas Filho de Amparo à Pesquisa do Estado do Rio de Janeiro – FAPERJ [APQ1 2019: E-26/010.001927/2019], and Coordenação de Aperfeiçoamento de Pessoal de Nível Superior – Brasil (CAPES) [Financing code 001, and the PhD Scholarship received by Virnna Barbosa].

7. References

1 Urquijo, J., Aranburu, N., Dagréou, S., Guerrica-Echevarría, G., & Eguiazábal, J. I. (2017). CNT-induced morphology and its effect on properties in PLA/PBAT-based nanocomposites. European Polymer Journal , 93 , 545-555 http://dx.doi. org/10.1016/j.eurpolymj.2017.06.035.

2 Sangeetha, V. H., Deka, H., Varghese, T. O., & Nayak, S. K. (2016). State of the art and future prospectives of poly(lactic acid) based blends and composites. Polymer Composites, 39(1), 81-101 http://dx.doi.org/10.1002/pc.23906

3 Jian, J., Xiangbin, Z., & Xianbo, H. (2020). An overview on synthesis, properties and applications of poly(butylene-adipateco-terephthalate)–PBAT. Advanced Industrial and Engineering Polymer Research, 3(1), 19-26. http://dx.doi.org/10.1016/j. aiepr.2020.01.001.

4 Zhang, Y., Jia, S., Pan, H., Wang, L., Bian, J., Guan, Y., Li, B., Zhang, H., Yang, H., & Dong, L. (2021). Effect of glycidyl methacrylate-grafted poly(ethylene octene) on the compatibility in PLA/PBAT blends and films. Korean Journal of Chemical Engineering, 38(8), 1746-1755 http://dx.doi.org/10.1007/ s11814-021-0809-1

5. Dil, E. J., Carreau, P. J., & Favis, B. D. (2015). Morphology, miscibility, and continuity development in poly(lactic acid)/ poly(butylene adipate-co-terephthalate) blends. Polymer, 68, 202-212 http://dx.doi.org/10.1016/j.polymer.2015.05.012

6 Mohammadi, M., Heuzey, M.-C., Carreau, P. J., & Taguet, A. (2021). Morphological properties of PLA, PBAT, and PLA/PBAT blend nanocomposites containing CNCs. Nanomaterials, 11(4), 857 http://dx.doi.org/10.3390/nano11040857 PMid:33801672.

7 Su, S. (2021). Prediction of the Miscibility of PBAT/PLA blends. (2021). Polymers, 13(14), 2339. http://dx.doi.org/10.3390/ polym13142339. PMid:34301096.

8 Rebelo, R. C., Gonçalves, L. P. C., Fonseca, A. C., Fonseca, J., Rola, M., Coelho, J. F. J., Rola, F., & Serra, A. C. (2022). Increased degradation of PLA/PBAT blends with organic acids and derivatives in outdoor weathering and marine

9/11

Barbosa, V. C. S., Sousa, A. M. F., & Silva, A. L. N.

environment. Polymer, 256, 125223 http://dx.doi.org/10.1016/j. polymer.2022.125223

9 Lin, S., Guo, W., Chen, C., Ma, J., & Wang, B. (2012). Mechanical properties and morphology of biodegradable poly(lactic acid)/ poly(butylene adipate-co-terephthalate) blends compatibilized by transesterification. Materials & Design, 36, 604-608 http:// dx.doi.org/10.1016/j.matdes.2011.11.036

10. Arruda, L. C., Magaton, M., Bretas, R. E. S., & Ueki, M. M. (2015). Influence of chain extender on mechanical, thermal, and morphological properties of blown films of PLA/ PBAT blends. Polymer Testing, 43, 27-37 http://dx.doi.org/10.1016/j. polymertesting.2015.02.005

11 Rigolin, T. R., Costa, L. C., Chinelatto, M. A., Muñoz, P. A. R., & Bettini, S. H. P. (2017). Chemical modification of poly(lactic acid) and its use as matrix in poly(lactic acid) poly(butylene adipate- co -terephthalate) blends. Polymer Testing, 63, 542549 http://dx.doi.org/10.1016/j.polymertesting.2017.09.010

12 Choudhury, G. S., & Gautam, A. (1998). Comparative study of mixing elements during twin-screw extrusion of rice flour. Food Research International, 31(1), 7-17 http://dx.doi.org/10.1016/ S0963-9969(98)00053-2

13 Al-Itry, R., Lamnawar, K., & Maazouz, A. (2012). Improvement of thermal stability, rheological and mechanical properties of PLA, PBAT and their blends by reactive extrusion with functionalized epoxy. Polymer Degradation & Stability, 97(10), 1898-1914 http://dx.doi.org/10.1016/j.polymdegradstab.2012.06.028

14 Hongdilokkul, P., Keeratipinit, K., Chawthai, S., Hararak, B., Seadan, M., & Suttiruengwong, S. (2015). A study on properties of PLA/PBAT from blown film process. IOP Conference Series. Materials Science and Engineering, 87, 012112 http://dx.doi. org/10.1088/1757-899X/87/1/012112

15 Silva, D., Kaduri, M., Poley, M., Adir, O., Krinsky, N., Shainsky-Roitman, J., & Schroeder, A. (2018). Biocompatibility, biodegradation, and excretion of polylactic acid (PLA) in medical implants and theranostic systems. Chemical Engineering Journal, 340, 9-14 http://dx.doi.org/10.1016/j.cej.2018.01.010 PMid:31384170.

16. Zheng, J., Choo, K., & Rehmann, L. (2015). The effects of screw elements on enzymatic digestibility of corncobs after pretreatment in a twin-screw extruder. Biomass and Bioenergy, 74, 224-232 http://dx.doi.org/10.1016/j.biombioe.2015.01.022

17 Ding, Y., Abeykoon, C., & Perera, Y. S. (2022). The effects of extrusion parameters and blend composition on the mechanical, rheological, and thermal properties of LDPE/ PS/PMMAternary polymer blends. Advances in Industrial and Manufacturing Engineering, 4, 100067 http://dx.doi. org/10.1016/j.aime.2021.100067

18 Oliveira, A. G., Silva, A. L. N., Sousa, A. M. F., Leite, M. C. A. M., Jandorno, J. C., & Escócio, V. A. (2016). Composites based on green high-density polyethylene, polylactide and nanosized calcium carbonate: effect of the processing parameter and blend composition. Materials Chemistry and Physics, 181, 344-351 http://dx.doi.org/10.1016/j.matchemphys.2016.06.068.

19 Vergnes, B., Barrès, C., & Tayeb, J. (1992). Computation of residence time and energy distributions in the reverse screw element of a twin-screw extrusion-cooker. Journal of Food Engineering, 16(3), 215-237 http://dx.doi.org/10.1016/02608774(92)90035-5

20 Ambrósio, J. D., Pessan, L. A., Larocca, N. M., & Hage, E., Jr. (2010). Influência das condições de processamento na obtenção de blendas PBT/ABS. Polímeros: Ciência e Tecnologia, 20(4), 315-321 http://dx.doi.org/10.1590/s0104-14282010005000051

21 Yeh, A.-I., Hwang, S.-J., & Guo, J.-J. (1992). Effects of screw speed and feed rate on residence time distribution and axial

mixing of wheat flour in a twin-screw extruder. Journal of Food Engineering, 17(1), 1-13 http://dx.doi.org/10.1016/02608774(92)90061-A

22. Kamal, M. R., Utracki, L. A., & Mirzadeh, A. (2014) Rheology of polymer alloys and blends. In L. A. Utracki, & C. A. Wilkie (Eds.), Polymer blends handbook (pp. 725-873). Netherlands: Springer http://dx.doi.org/10.1007/978-94-007-6064-6_9

23 Al-Itry, R., Lamnawar, K., Maazouz, A., Billon, N., & Combeaud, C. (2015). Effect of the simultaneous biaxial stretching on the structural and mechanical properties of PLA, PBAT and their blends at rubbery state. European Polymer Journal, 68, 288-301 http://dx.doi.org/10.1016/j.eurpolymj.2015.05.001

24 Ding, Y., Feng, W., Lu, B., Wang, P., Wang, G., & Ji, J. (2018). PLA-PEG-PLA tri-block copolymers: effective compatibilizers for promotion of the interfacial structure and mechanical properties of PLA/PBAT blends. Polymer, 146, 179-187 http://dx.doi.org/10.1016/j.polymer.2018.05.037

25 Weng, Y.-X., Jin, Y.-J., Meng, Q.-Y., Wang, L., Zhang, M., & Wang, Y.-Z. (2013). Biodegradation behavior of poly(butylene adipate-coterephthalate)(PBTA), poly(lactic acid)(PLA), and their blend under soil conditions. Polymer Testing, 32(5), 918926 http://dx.doi.org/10.1016/j.polymertesting.2013.05.001

26 Rosenberger, A. G., Dragunski, D. C., Muniz, E. C., Módenes, A. N., Alves, H. J., Tarley, C. R. T., Machado, S. A. S., & Caetano, J. (2019). Electrospinning in the preparation of an electrochemical sensor based on carbon nanotubes. Journal of Molecular Liquids, 298, 112068 http://dx.doi.org/10.1016/j. molliq.2019.112068

27 Wang, L.-F., Rhim, J.-W., & Hong, S.-I. (2016). Preparation of poly(lactide)/poly(butylene adipate-co-terephthalate) blend films using a solvent casting method and their food packaging application. Lebensmittel-Wissenschaft + Technologie, 68, 454-461. http://dx.doi.org/10.1016/j.lwt.2015.12.062.

28 Harnnecker, F., Rosa, D. S., & Lenz, D. M. (2011). Biodegradable polyester-based blend reinforced with Curauá fiber: thermal, mechanical and biodegradation behaviour. Journal of Polymers and the Environment, 20(1), 237-244 http://dx.doi.org/10.1007/ s10924-011-0382-5.

29 Pujari, R. (2021). Ageing performance of biodegradable PLA for durable applications (Doctoral dissertation). Rochester Institute of Technology, USA

30. Oliveira, M., Santos, E., Araújo, A., Fechine, G. J. M., Machado, A. V., & Botelho, G. (2016). The role of shear and stabilizer on PLA degradation. Polymer Testing, 51, 109-116 http:// dx.doi.org/10.1016/j.polymertesting.2016.03.005

31 Wu, C.-S. (2003). Physical properties and biodegradability of maleated-polycaprolactone/starch composite. Polymer Degradation & Stability, 80 (1), 127-134 http://dx.doi. org/10.1016/S0141-3910(02)00393-2.

32 Phetwarotai, W., Zawong, M., Phusunti, N., & Aht-Ong, D. (2021). Toughening and thermal characteristics of plasticized polylactide and poly(butylene adipate-co-terephthalate) blend films: influence of compatibilization. International Journal of Biological Macromolecules, 183, 346-357 http://dx.doi. org/10.1016/j.ijbiomac.2021.04.172 PMid:33932412.

33 Pavia, D. L., Lampman, G. M., Kriz, G. S., & Vyvyan, J. (2015). Introdução à espectroscopia São Paulo: Cengage Learning

34 Palsikowski, P. A., Kuchnier, C. N., Pinheiro, I. F., & Morales, A. R. (2017). Biodegradation in soil of PLA/PBAT blends compatibilized with chain extender. Journal of Polymers and the Environment, 26(1), 330-341 http://dx.doi.org/10.1007/ s10924-017-0951-3

35 Kumar, M., Mohanty, S., Nayak, S. K., & Parvaiz, M. R. (2010). Effect of glycidyl methacrylate (GMA) on the thermal, mechanical and morphological property of biodegradable

Polímeros, 32(3), e2022033,

2022 10/11

Influence of processing parameters on mechanical and thermal behavior of PLA/PBAT blenda

PLA/PBAT blend and its nanocomposites. Bioresource Technology, 101(21), 8406-8415 http://dx.doi.org/10.1016/j. biortech.2010.05.075 PMid:20573502.

36 Signori, F., Coltelli, M.-B., & Bronco, S. (2009). Thermal degradation of poly(lactic acid) (PLA) and poly(butylene adipate-co-terephthalate) (PBAT) and their blends upon melt

processing. Polymer Degradation & Stability, 94(1), 74-82 http://dx.doi.org/10.1016/j.polymdegradstab.2008.10.004

Received: July 08, 2022 Revised: Oct. 18, 2022

Accepted: Oct. 25, 2022

Polímeros, 32(3), e2022033, 2022

11/11

Poly(vinyl alcohol)/poly(glycerol) dendrimer hydrogel mediated green synthesis of silver nanoparticles

Pollyana Marcondes1 , Gisela Helou Rosas2 , Maria Elena Leyva González1* , Alvaro Antonio Alencar de Queiroz3  and Paulo Sergio Marques4 

1Instituto de Físico Química, Universidade Federal de Itajubá, Itajubá, MG, Brasil

2Faculdade Wenceslau Braz, Itajubá, MG, Brasil

3Centro de Biotecnologia, Instituto de Pesquisas Energéticas e Nucleares, São Paulo, SP, Brasil

4Laboratório de Microbiologia Aplicada, Instituto de Recursos Naturais, Universidade Federal de Itajubá, Itajubá, MG, Brasil *mariae@unifei.edu.br

Obstract

In this paper, we report the synthesis and evaluation of a poly(vinyl alcohol)/poly(glycerol) dendrimer hydrogel incorporated with green synthesized silver nanoparticles (PVA/PGLD-AgNPs) using Cinnamomum verum extract as the reducting agent (Cz-extract). The Cz-extract was prepared using ultrasonic technique. UV-visible (UV-vis) spectra of Cz-extract confirmed the presence of cinnamaldehyde. PVA/PGLD-AgNPs films were prepared using 5, 10 and 20 mL of Cz-extract and characterized by UV-vis, Fourier transform infrared spectroscopy, Thermogravimetric analysis and X-ray diffraction (XRD). The surface plasmon resonance band in the UV-vis spectra confirmed the formation of AgNPs. XRD pattern confirmed the presence of silver, with average crystallite sizes calculated by Scherrer equal to 13.64 nm, 16.63nm and 20.27 nm for AgNPs prepared with 5 mL, 10 mL and 20 mL of Cz-extract, respectively. AgNPs release kinetic was studied by Korsmeyer– Peppas model. The antimicrobial results revealed that the PVA/PGLD-AgNPs hydrogels showed good antibacterial activity behavior against Escherichia coli.

Keywords: Cinnamomum verum bark, green synthesis, poly(glycerol) dendrimer, poly(vinyl alcohol), silver nanoparticles.

How to cite: Marcondes, P., Rosas, G. H., González, M. E. L., Queiroz, A. A. A., & Marques, P. S. (2022). Poly(vinyl alcohol)/poly(glycerol) dendrimer hydrogel mediated green synthesis of silver nanoparticles. Polímeros: Ciência e Tecnologia, 32(3), e2022034. https://doi.org/10.1590/0104-1428.20220025

1. Introduction

Burn wounds are one of the most common household injuries[1]. Burns represent the fourth most common type of trauma worldwide[2] and the second leading cause of hospitalizations in Brazil[3]. Unfortunately, in Brazil, as in other countries, the social isolation promoted by the COVID-19 pandemic has hit the low-income population hard. Although the price of cooking gas in the country has increased by almost 30% in the 12 months to March 2022, 56% of the Brazilian population has seen their income drop since the beginning of the pandemic. With the worsening of the economic and social crisis, families in need have been pressured to use alternative, more flammable and dangerous fuels to prepare their meals. The result is that domestic accidents with severe burns have now become more common in Brazil[4,5].

For centuries, metal, ions and silver compounds have extensively been used for hygienic and healing purposes, due to their strong bactericidal effects and antimicrobial properties[6]. In the 19th century, silver in the form of silver salts or silver solutions began to be used as dressing wounds in burns injuries[7]. Silver sulfadiazine was introduced

by Fox in the 1970s for topical treatment of burns and wounds and remains to this day as the most widely used substances[8]. In the last decade of the 20th century there has been a great innovation in wound care products based on silver nanoparticles. These products are nowadays based on silver in the form of nanocrystalline, ions or compounds incorporated within the dressing[9,10].

The use of silver nanoparticles (AgNPs) for treatment of burns is considered a multi-target process[11]. In addition of AgNPs attaching to the cell membranes and damaging the integrity and permeability of the membranes, they can produce reactive oxygen species (ROS). The ROS act damaging the cell membranes and react with the molecules in the functional proteins and DNA, which will interfere with the metabolism and DNA duplication of microorganisms[12-14]

Several methods have been used to prepare metal nanoparticles[15]. Besides physical and chemical methods, generally hazardous to the environment and very expensive, green synthesis methods result in a simple and ecologically appropriate way to obtain nanoparticles[16]. Green synthesis,

https://doi.org/10.1590/0104-1428.20220025 O O O O O O O O O O O O O O O Polímeros, 32(3),
2022 ISSN 1678-5169 (Online) 1/9
e2022034,

also known as phyto-synthesis, consists of the use of phytochemical compounds, with reducing properties and capping agent to stabilize the synthesized nanoparticles. The phyto-synthesis of nanoparticles can be either, intracellular or extracellular. The intracellular method consists in the synthesis of nanoparticles during the process of growth of the plant, in an organic medium containing metal ions. However, the extracellular method is more simple and consists of the use of some appropriate vegetal extract[17].

The extracellular phyto-synthesis method has several advantages to obtain metal nanoparticles, firstly, the plants are easily accessible, safe to handle, and have a great variety of phytochemical compounds. In the second place, many plants are well known by their medicinal properties, that could enhance the therapeutic efficiency of the nanoparticle[18]

The Cinnamomum verum is a medicinal plant with well known therapeutic properties, such as anti-oxidant, antidiabetic, antimicrobial and anti-inflammatory effects[18-23] Several authors have used different parts of Cinnamomum verum plants to perform green synthesis of nanoparticles[18,24-27].

In this work, the vegetal extract of Cinnamomum verum back powder was assisted by ultrasound technique and characterized by UV-visible spectroscopy (UV-vis), Fourier transform infrared spectroscopy (FTIR) and Thermogravimetric analysis (TGA). The aqueous extract of Cinnamomum verum (Cz-extract) was used for the green synthesis of silver nanoparticles (AgNPs) mediated by poly(vinyl alcohol)/ poly(glycerol) dendrimer (PVA/PGLD) hydrogel blends as reducing and capping agents, respectively. Hydrogel films of PVA/PGLD-AgNPs were prepared using 5, 10, and 20 mL of Cz-extract and characterized by UV-vis, FTIR, TGA and X-ray diffraction (XDR) techniques. The AgNPs release studies from hydrogels were realized for all PVA/ PGLD-AgNPs formulations at room temperature (25 °C). The kinetics of AgNPs release from PVA/PGLD-AgNPs hydrogels were studied by Higuchi and Korsmeyer–Peppas model. Finally, the antibacterial properties of PVA/PGLDAgNPs hydrogels were tested against Escherichia coli (E.coli) using the agar disk diffusion method.

2. Materials and Methods

2.1 Materials

Poly(vinyl alcohol) (PVA) 87-90% hydrolyzed with average molecular weight of 30-70 kDa and silver nitrate (99,0%) purity were purchased from Sigma-Aldrich (Brazil). Poly(glycerol) dendrimer of generation 4 was synthesized in accordance with previous work[28]. Cinnamomum verum bark powder was acquired from local commerce was washed with distilled water to remove eventual impurities and allowed to dry for 24 h at 60°C.

2.2 Green synthesis of silver nanoparticles in PVA/PGLD hydrogels

The aqueous extract of Cinnamomum verum bark powder was prepared by ultrasound assisted extraction. For each 1g of powder it was added 50 mL of distilled water and the aqueous powder suspension was kept in an ultrasonic bath (40 kHz) at 50°C for 60 min. The supernatant was filtered

through a 0.2 µm filter followed by lyophilization to obtain the Cz-extract.

The PVA hydrogels preparation was carried out by mixing a 0.8 g of PVA powder in 20 mL of distilled water under constant stirring at room temperature (25 oC) over a period of 24h until a homogeneous solution was obtained. Then, while constantly stirring, 2.0 g of PGLD was added. Later, the final solution of the PVA-PGLD pre-gel was transferred to three Erlenmeyer flasks. Subsequently, the PVA-PGLD pre-gel and Cz-extract solutions were mixed to obtain the final PVA-PGLD/Cz-extract proportions (v/v) of 95:5 (film PVA-PGLD5), 90:10 (film PVA-PGLD10) and 80:20 (film PVA-PGLD20). Finally, silver nitrate aqueous solution at concentration of 3.7 mM was added to each Erlenmeyr flask under constant stirring (300 rpm) for 24 h avoiding as much as possible light contact, until a homogeneous PVA-PGLD solution was obtained. Afterwards, 25 mL of each mixture was casted into polytetrafluoroethylene (PTFE) plates (100 cm2) and left to dry at 35 oC and controlled relative humidity (64%) for 168 h. Finally, the resulting films were washed with deionized water and dried at 37 oC before use.

2.3 Physico-chemical characterization

2.3.1 UV-Vis, ATR-FTIR and TGA analysis

The Cz-extract and prepared PVA/PGLD-AgNPs hydrogels were characterized by UV-Vis, ATR-FTIR and TGA, respectively. A Cary 50 Varian UV-Vis spectrometer was used in the characterization of Cz-extracts and AgNPs. The UV-Vis experiments were carried out in quartz cells using deionized water as solvent and the spectra were collected from 250 to 500 nm. The deconvolution of UV–vis spectra was realized with the software Origin®.

All samples were analyzed through FTIR Shimadzu IRTracer 100 spectrometer provided by an ATR diamond accessory. The spectrum was obtained on transmittance mode and was scanned registering the spectrum with 30 scans at a resolution of 4 cm−1, from 4000 to 650 cm−1 .

TGA measurements were carried out using a TGA-60, Shimadzu, Japan at a constant heating rate of 20 °C min−1 from 25 to 800 °C under nitrogen atmosphere (50 mL.min-1).

Powder X-ray diffractograms were collected at room temperature (25°C) using a X’Pert PRO, Malvern Panalytical, Cu Kα radiation (λ = 1.5417 Å) source, operating at 40 kV and 40 mA. Powder diffractograms were collected over an angular 2θ range between 5° and 90° (2 θ) with a step size of 0.02° and scanning speed of 2 sec/step.

2.3.2 Release profile of AgNPs from the hydrogels

The release of AgNPs from the PVA/PGLD-AgNPs films was studied in deionized water at room temperature (25°C). The PVA/PGLD-AgNPs films were immersed in deionized water (5 mL) at test tubes and put in thermal bath at 25°C without agitation. The films were carefully adhered to the test tube walls to ensure that they could be entirely submersed. At specific time intervals, the test tube was removed from the thermal bath and the absorbance measurements were at 440 nm and room temperature (25°C) using UV-Vis.

To study the release kinetics of AgNPs, the KorsmeyerPeppas[29] and Higuchi[30] kinetics models were used.

Polímeros, 32(3), e2022034,

Marcondes, P., Rosas, G. H., González, M. E. L., Queiroz, A. A. A., & Marques, P. S.
2022 2/9

The Korsmeyer-Peppas model (Equation 1) is a combination of the diffusion of the AgNPs (Fickian transport) from the PVA-PGLD hydrogels and Case II transport (non-Fickian) [29]. In the Higuchi’s model[30] (Equation 2), the erosion of the hydrogel matrix as well as its intumescence control the release rate of the nanoparticles, resulting in a AgNPs layer on the PVA-PGLD hydrogel surface and thus, prevent the entry of more water and prevent the release of more nanoparticles, resulting in decline of the AgNPs concentration over time. The diffusion models of Korsmeyer-Peppas and Higuchi are presented below: * n t KP M kt M ∞ = (1) 0.5 * Qt = (2)

where M t /M ∞ is the fraction of AgNPs released at time t, kKP is the kinetic rate constant for Korsmeyer-Peppas model, and n is the release exponent characterizing the different release mechanisms, kH is the release rate constant for the Higuchi model and Qt is the amount of the active principle released in time t.

2.4 Antibacterial activity

The in vitro antibacterial activity of PVA/PGLD-AgNPs system were tested against Escherichia coli (E.coli) by agar disk-diffusion method[31]. The E. coli bacteria were grown in nutrient broth to prepare stock solutions of 100 µg/mL. Firstly, the filter paper disc (6 mm in diameter) was sterilized in a laminar air flow chamber by exposure to a UV-C lamp (30 min, distance from the lamp 60 cm). A soft-top agar (1.0 wt %, 20 mL) was melted, cooled to 55 °C and inoculated with overnight (18 h) bacteria cultures (200 μL), then gently stirred and poured over previously solidified nutrient agar base in sterile Petri dishes. The number of bacteria in the nutrient soft-top agar layer was set to be 1.5x10⁸ CFU. mL-1. After solidification of soft-top agar diffusion discs, 10 µL samples of PVA/PGLD-AgNPs reaction solution were placed on their surface. The widths of inhibition zones around the disk were measured after incubation at 37 °C for 24 h. Each essay was carried out in triplicate.

3. Results and Discussions

3.1 Characterization of Cinnamomum verum aqueous extract

The UV–vis spectra of Cinnamomum verum aqueous extract (Cz-extract) and its deconvolution are shown in Figure 1. Two absorption bands centered at ~281 nm and ~300 nm were observed. The band centered at 281 nm can be assigned to n→π* electronic transitions of the carbonyl groups of Cinnamaldehyde[32,33]

The ultrasound assisted extraction is more effective and can increase the number of secondary metabolites extracted from vegetal matrices[34]. Hence, the absorbance band next to 300 nm can be linked to n→π* transitions of phenol, flavonoids or other secondary metabolites present in Cinnamomum verum bark[19]

Polímeros, 32(3), e2022034, 2022

The FTIR spectrum of lyophilized Cz-extract (Figure 2) was performed to identify the functional groups of the active components presents in the aqueous extract. The vibrational band next to 3282 cm-1 is due to the O-H stretching of alcohols and phenols groups. The band at 2927 cm-1 revealed the presence of -CH2 stretch. The 1649 cm-1 and 1606 cm-1 bands were linked to C=O and -C=C – stretchings, respectively[27], and the 1439 cm-1 band is due to C-H bending. The vibrational band at 1035 cm-1 indicates the C-O-C stretching, therefore suggesting the presence of glycosides group[20]

The Thermogravimetric analysis (TGA) and their differential thermal (DTG) analysis were examined to determine the thermochemical behavior of the lyophilized Cz-extract. The curves of TGA and DTG for Cz-extract are shown in Figure 3. The DTG curve suggests that thermal degradation of the Cz-extract occurs in four stages. The very first decomposition (7% of weight loss) was in the temperature level of 25 °C to 115 °C and was for the removal of moisture available in the sample. Stage 2 (9% weight loss) was recorded up to 115 to 220 °C for the sample, showing the elimination of volatile essential oils available in the sample. Stage 3 (19% of weight loss) recorded between 220 to 330°C, may be due to the thermal decomposition of carbohydrates and proteins. The percentage of weight loss in this stage was comparable with the results

Figure 1. UV–vis from Cinnamomum verum aqueous extract.

Figure 2. FTIR spectrum of lyophilized Cz-extract.

Poly(vinyl alcohol)/poly(glycerol) dendrimer hydrogel mediated green synthesis of silver nanoparticles
3/9

of literature[35]. Stage 4 was recorded up to 330 to 600 ◦C for the Cz-extract sample, showing the elimination of extractable macromolecules wich high thermal stability. The main decomposition which occurred in this stage is 50% of weight loss for the breakdown of the extractable macromolecules, probably the presence of lipids due to the strong extraction procedures employed. The residual mass was found to be around 15% after 600 °C temperature.

3.2 Physico-chemical characterization of PVA/PGLDAgNPs films.

The chemical groups present in the Cz-extract, such as aldehyde and alcohols, can reduce the silver ions into nanocrystals. The silver nanoparticles formed by chemical reduction are stabilized by the biological macromolecules

and the polymeric system used. Figure 4 shows the scheme of green synthesis of AgNPs due to the presence of Cinnamaldehyde in the Cz-extract. The AgNPs are sterically stabilized largely by PVA and PGLD, polymeric system. Also in the same Figure 4 is shown the hydrogel PVA/ PGLD-AgNPs10 obtained after casting on PTFE plates.

UV-Vis spectroscopy is an indirect method to examine the formation of AgNPs in PVA/PGLD hydrogels, through the absorption band relative to the surface plasmon resonance (SPR)[36].

Figure 5 shows UV–vis spectra of the solution resulting from the PVA/PGLD-AgNPs systems after 24h. The presence of the SPR band in the PVA/PGLD hydrogels ensures the formation of AgNPs. The intensity of the absorbance obeys the Lambert-Beer law and is related to the concentration of the AgNPs in PVA/PGLD matrix[37]. Therefore, as observed in Figure 5, higher concentration of Cz-extract yields higher concentrations of AgNPs.

Figure 5 shows that the amount of Cz-extract also changes the wavelenght of absorbance band. The wavelenght of the SPR absorbance band is related to both, shape and the size of the AgNPs dispersed in the PVA/PGLD hydrogel[36] The difference between the three reactional systems can be better observed upon normalizations of the absorbance band of the SPR, as shown in the inserted plot in Figure 5. The normalized absorbance curves show that the system with higher concentration of Cz-extract was more homogeneus and confirms the synergistic stabilizing and reduction properties of the Cinnamomum verum aqueous extract for the formation of AgNPs in the PVA/PGLD hydrogel matrix.

FTIR spectroscopy was carried out on PVA/PGLD-AgNPs films to identify the organic funtional groups responsible

Polímeros, 32(3), e2022034,

Marcondes, P., Rosas, G. H., González, M. E. L., Queiroz, A. A. A., & Marques, P. S.
2022 4/9
Figure 3. TGA/DTG of lyophilized Cz-extract. Figure 4. Scheme of green synthesis from Cinnamomum verum aqueous extract. On the right is shown a photograph of the PVA/PGLDAgNPs10 hydrogel after casting on PTFE plates.

for the stabilization of the AgNPs synthesized by Cz-extract and mediated by the PVA/PGLD hydrogel. Figure 6 shows the main stretching vibrations of chemical bonds in two wavenumber range (namely, 3600 – 2500 cm-1 and 1250 –590 cm-1). The -OH fuctional group is present in the Czextract as well as in the polymeric system. The films with 5 and 10 mL of Cz-extract shows O-H stretch vibrations at 3303 cm-1. The film with higher Cz-extract amount showed O-H stretching vibration at 3273 cm-1. This lower wavenumber suggests a decrease of the force constant of O-H bonds. This system has higher concentration of AgNPs and then requires more stabilization. Therefore, their results show that the -OH fuctional group of PVA and PGLD stabilizes the AgNPs being produced. According to the literature, the metal-OH interaction decreases the wavenumber of the O-H stretching vibrations[37].

The streching vibration at 2937 cm-1 is assigned to the -CH of alkane. The sharp absorptions at 1039 cm-1 corresponds to stretching vibration of C-O bonds. The vibration band observed at 675 cm-1 is assigned to bending vibration out of the plane of the O-H bond, associated with the peripheral hydroxyl groups (OH) on poly(glycerol) dendrimer.

Figure 7 shows the XRD pattern of the PVA/PGLD-AgNPs films at different concentrations of Cz-extract. The films show polycrystalline patterns with a broad reflection peaks at ~20° that was associated with PVA[38]. Diffraction peaks

with values of 2θ near to 38.37°, 44.50°, 64.86°, 77.44° and 81.7° respectively corresponds to the XRD patterns indexed in [111], [200], [220], [311] and [222] lattice planes. These lattice planes is in good agreement with the metallic silver with face centered cubic structure[24,39]. The other observed crystalline peaks suggests the presence of organic crystaline substances in Cz-extract.

The average crystallite sizes of the AgNPs dispersed in the PVA/PGLD films was calculated using the Scherrer equation[18]: cos k D λ βθ = (3)

where D is the average crystallite size, k is the Scherrer constant, λ is the wavelength of the incident X-ray (for Cu Kα, λ = 0.154056 nm), while β and θ are the full width at half maximum of the intensity and the Bragg angle respectively.

Gaussian method was used to find the full width at half maximum (FWHM) in Origin software®. The average crystallite sizes calculated by Scherrer were 13.64 nm, 16.63nm and 20.27 nm for PVA-PGLD5, PVA-PGLD10 and film PVA-PGLD20, respectively. Relating the average crystallite sizes with the intensity of SPR absorbance bands observed in UV-Vis spectra, it can be concluded that the higher concentrations of AgNPs the higher the average crystallite size of AgNPs.

The TGA-DTG analysis were carried out in order to evaluate the thermal stability and degradation profile of

Figure 5. UV–vis of green synthesis of the PVA/PGLD-AgNPs hydrogels.

Figure 6. FTIR spectrum of PVA/PGLD-AgNPs films.

Polímeros, 32(3), e2022034, 2022

Figure 7. XRD spectra of the PVA/PGLDAgNPs films.

5/9

the PVA/PGLD-AgNPs hydrogels. The results are shown in Figure 8. The PVA/PGLD-AgNPs hydrogels shows two steps in its thermal degradation process (Fig. 8). The first step occurs between 25 oC and 182 oC, accompanied with the weight loss of 20%. This first degradation process could be assigned to the loss of adsorbed and the water physically bonded to hydrogels through hydrogen bonding, respectively. In turn, the weight loss around 180°C may be due to the loss of volatile organic substances present in Cz-extract. Following loss weight is observed between 180 oC and 400 oC approximately and it should correspond to the thermal decomposition of the PVA/PGLD matrix and can also be associated probably to the volatilization of the polyssacharides and carbohydrates from the Cz-extract. This thermal decomposition happed in one step suggesting a strong interaction between PVA, PGLD and Cz-extract. The observed solid residues can be ascribed to thermally stable compounds and AgNPs.

3.3 AgNPs release studies

Considering the theoretical studies[40], the estimated molar extinction coefficients from wavelength of the SPR band in Figure 4 were 839.82x10⁸ M-1.cm-1, 773.36x10⁸ M-1 cm-1 and 911.03x10⁸ M-1.cm-1 for AgNPs synthesized using 5 mL, 10 mL and 20 mL of Cz-extract, respectively. These values were used to determine the concentration of AgNPs using the Lambert-Beer’s law. The release of AgNPs from PVA/PGLD-AgNPs films were monitored along an interval of 24h at room temperature (25°C). The AgNPs release profiles measurements for each PVA/PGLD-AgNPs films are presented in Figure 9. It was observed a slow AgNPs release rates from PVA/PGLD-AgNPs (Figure 9). The AgNPs release from PVA/PGLD generally occurs by diffusion through the gelatinous layer or erosion of the hydrogel matrix or a combination of these mechanisms. Because AgNPs is poorly water soluble, their release from the PVA/PGLD matrix system is likely to be predominately controlled by the dissolution rate of the hydrogel. The amount of Cz-extract incorporated in the PVA/PGLD seems to have a significant effect on the formation of the PVA/PGLD hydrogel matrix (Figure 9). The PGLD/PVA formulation with higher amounts of Cz-extract seems to create PGLD/PVA hydrogels matrices with lower crosslinking density relative to formulations with smaller amounts of the extract (PVA/ PGLD-AgNPs5). Interestingly, AgNPs released from the PGLD/PVA-AgNP20 exibited an anomalous behavior and showed a relatively slow release realively to PVA/PGLDAgNPs5 and PVA/PGLD-AgNPs10 matrices. Perhaps there is some critical concentration of Cz-extract for the formation of PVA/PGLD hydrogels with high crosslinking density and that promote a slower erosion rate and thus a slower AgNPs release rate. However, further research is needed

to investigate the critical Cz-extract concentration to form mechanically more stable PVA/PGLD hydrogels matrices.

The obtained kinetic rate constant K, the correlation coefficient R2 and the release exponents n are given in Table 1

The AgNPs releases from PVA/PGLD-AgNPs films were best fitted by Korsmeyer–Peppas model (Table 1). This model is used to describe the diffusion of a penetrant solute in a swellable polymeric matrix. Therefore, Korsmeyer–Peppas model can be applied to a hydrogel polymer that sorbs the solvent and desorbs the loaded active principle.

In the Korsmeyer–Peppas model, the exponent “n” is related to release mechanism of active principle. For a single thin film with 0.5 < n < 1, the system can be described as an anomalous transport (non-Fickian diffusion)[29]. For PVA/ PGLD-AgNPs5 and PVA/PGLD-AgNPs20 films, the values of the exponent “n” were larger than 0.5 and smaller than 1, indicating that a non-Fickian diffusion mechanism was dominant for the release of AgNPs. The mechanism

Figure 8. TGA/DTG of the PVA/PGLD-AgNPs films.

Figure 9. AgNPs release profile of the PVA/PGLD-AgNPs films.

Table 1. Release kinetics of silver nanoparticles. Films Higuchi Korsmeyer-Peppa kH R2 n kKP R2

PVA/PGLD AgNPs5 8.71x10⁻¹⁷ 0.93 0.96 5.33x10⁻⁴ 0.95 PVA/PGLD AgNPs10 1.28x10⁻¹⁴ 0.91 0.39 4.23x10⁻² 0.97

PVA/PGLD AgNPs20 1.33x10⁻¹⁵ 0.98 0.61 5.60x10⁻³ 1.00

Polímeros, 32(3), e2022034,

Marcondes, P., Rosas, G. H., González, M. E. L., Queiroz, A. A. A., & Marques, P. S.
2022 6/9

Figure 10. Antimicrobial activities of AgNPs against E. coli (a) PVA/PGLD-AgNPs5; (b) PVA/PGLD-AgNPs10; (c) PVA/PGLDAgNPs20 (PC positive control).

of release from PVA/PGLD10 film shows n < 0.5 values. Therefore, this system can be mechanistically identified as a quasi-Fickian diffusion. The Korsmeyer–Peppas kinetic rate constant, KKP, was higher in the PVA/PGLD10 film, suggesting a faster AgNPs release in this Cz-extract composition. These results reveals that the PVA/PGLD network changes with the amount of Cz-extract used in the green synthesis of the AgNPs.

3.4 Antimicrobial properties

The antimicrobial activities of the PVA/PGLD-AgNPs were investigated by disk diffusion method. Figure 10 shows the inhibition zone against E. coli for all films.

Comparison of these results indicates that, for E.coli, the PVA/PGLD-AgNPs5 film presents a higher inhibition zone (7.93±0.05 mm) than the PVA/PGLD-AgNPs10 and PVA/PGLD-AgNPs20 films (6.05±0.03 mm). This may be attributed to the different size and concentrations of AgNPs released from PVA/PGLD hydrogel matrices. The PVA/ PGLD-AgNPs5 film releases the lowest concentration of AgNPs, however its nanoparticles are smaller in size which could contribute to greater efficiency against E. coli bacteria.

4. Conclusions

Silver nanoparticles were successfully obtained by green synthesis using Cinnamomum verum aqueous extract, mediated by poly(vinyl alcohol)/poly(glycerol) dendrimer hydrogel. The UV-Vis, FTIR and TGA techniques of characterization showed that the extract of Cinnamomum verum bark contains phytochemical compounds with reducing properties and capping agent to stabilize AgNPs. The SPR band in the UV-vis spectra confirmed the formation of AgNPs. XRD pattern confirmed the presence of metallic silver with crystalline structure of face centered cubic. It was observed that the average crystallite size calculated by Scherrer equation was related with the amount of Cz-extract used, and to the concentration of AgNPs in the PVA/PGLD matrix. The residues obtained by TGA analysis confirmed

that the concentration of AgNPs is related with the amount of Cz-extract used in the green synthesis. The in vitro study of AgNPs release showed that all PVA/PGLD-AgNPs films are capable of controlling AgNPs release from the hydrogels and were best fitted by Korsmeyer–Peppas model. All PVA/ PGLD-AgNPs films showed antibacterial properties against E. coli which are related to the size of AgNPs.

5. Author’s Contribution

• Conceptualization – Maria Elena Leyva González; Gisela Helou Rosas; Alvaro Antonio Alencar de Queiroz.

• Data curation – Pollyana Marcondes; Paulo Sergio Marques.

• Formal analysis – Maria Elena Leyva González.

• Funding acquisition – Maria Elena Leyva González.

• Investigation – Pollyanna Marcondes; Paulo Sergio Marques.

• Methodology – Maria Elena Leyva González.

• Project administration – Maria Elena Leyva González.

• Resources – Alvaro Antonio Alencar de Queiroz.

• Software – NA.

• Supervision – Maria Elena Leyva González; Gisela Helou Rosas.

• Validation – Maria Elena Leyva González; Gisela Helou Rosas; Alvaro Antonio Alencar de Queiroz.

• Visualization – Maria Elena Leyva González; Alvaro Antonio Alencar de Queiroz.

• Writing – original draft – Maria Elena Leyva González.

• Writing – review & editing – Maria Elena Leyva González; Alvaro Antonio Alencar de Queiroz.

6. Acknowledgements

We would like to acknowledge the Fundação de Amparo à Pesquisa do Estado de Minas Gerais (FAPEMIG), Finance

Polímeros, 32(3), e2022034, 2022 7/9
Poly(vinyl alcohol)/poly(glycerol) dendrimer hydrogel mediated green synthesis of silver nanoparticles

Marcondes, P., Rosas, G. H., González, M. E. L., Queiroz, A. A. A., & Marques, P. S.

Code APQ-02676-16 and Coordenacão de Aperfeiçoamento de Pessoal de Ensino Superior (CAPES), for the financial support of this project.

7. References

1 Forjuoh, S. N. (2006). Burns in low- and middle-income countries: a review of available literature on descriptive epidemiology, risk factors, treatment, and prevention. Burns, 32(5), 529-537 http://dx.doi.org/10.1016/j.burns.2006.04.002 PMid:16777340.

2. Aghakhani, N., Nia, H. S., Soleimani, M. A., Bahrami, N., Rahbar, N., Fattahi, Y., & Beheshti, Z. (2011). Prevalence burn injuries and risk factors in persons older the 15 years in Urmia burn center in Iran. Caspian Journal of Internal Medicine, 2(2), 240-244 PMid:24024024.

3 Abib, S. C. V., Françóia, A. M., Waksman, R., Dolci, M. I., Guimarães, H. P., Moreira, F., Cezillo, M. V. B., & Góes, A. M., Jr. (2017). Unintentional pediatric injuries in São Paulo. How often is it severe? Acta Cirurgica Brasileira, 32(7), 587598. http://dx.doi.org/10.1590/s0102-865020170070000010. PMid:28793043.

4 Hohl, D. H., Coltro, P. S., Silva, G. M. A., Silveira, V. G., & Farina, J. A., Jr. (2021). Covid-19 quarantine has increased the incidence of ethyl alcohol burns. Burns, 47(5), 1212 http:// dx.doi.org/10.1016/j.burns.2020.05.025 PMid:34034953.

5 Valente, T. M., Ferreira, L. P. S., Silva, R. A., Leite, J. M. R. S., Tiraboschi, F. A., & Barboza, M. C. C. (2021). Brazil Covid-19: change of hospitalizations and deaths due to burn injury? Burns, 47(2), 479-501. http://dx.doi.org/10.1016/j. burns.2020.10.009 PMid:33303263.

6 Barillo, D. J., & Marx, D. E. (2014). Silver in medicine: a brief history BC 335 to present. Burns, 40(Suppl. 1), S3-S8 http:// dx.doi.org/10.1016/j.burns.2014.09.009 PMid:25418435.

7 Klasen, H. J. (2000). Historical review of the use of silver in the treatment of burns. I. Early uses. Burns, 26(2), 117-130 http:// dx.doi.org/10.1016/S0305-4179(99)00108-4 PMid:10716354.

8. Klasen, H. J. (2000). A historical review of the use of silver in the treatment of burns. II. Renewed interest for silver. Burns, 26(2), 131-138 http://dx.doi.org/10.1016/S0305-4179(99)001163 PMid:10716355.

9 Atiyeh, B. S., Costagliola, M., Hayek, S. N., & Dibo, S. A. (2007). Effect of silver on burn wound infection control and healing: review of the literature. Burns, 33(2), 139-148. http:// dx.doi.org/10.1016/j.burns.2006.06.010 PMid:17137719.

10 Walker, M., & Parsons, D. (2014). The biological fate of silver ions following the use of silver-containing wound care products – a review. International Wound Journal, 11(5), 496504 http://dx.doi.org/10.1111/j.1742-481X.2012.01115.x PMid:23173975.

11 Shaheen, H. M. (2016). Wound healing and silver nanoparticles. Global Drugs Therapeutics, 1(1), 1-2 http://dx.doi.org/10.15761/ GDT.1000105. PMid:27534756.

12 Zhang, K., Lui, V. C. H., Chen, Y., Lok, C. N., & Wong, K. K. Y. (2020). Delayed application of silver nanoparticles reveals the role of early infammation in burn wound healing. Scientific Reports, 10(1), 6338 http://dx.doi.org/10.1038/s41598-02063464-z PMid:32286492.

13 Lee, B., Lee, M. J., Yun, S. J., Kim, K., Choi, I., & Park, S. (2019). Silver nanoparticles induce reactive oxygen speciesmediated cell cycle delay and synergistic cytotoxicity with 3-bromopyruvate in Candida albicans, but not in Saccharomyces cerevisiae. International Journal of Nanomedicine, 14, 48014816 http://dx.doi.org/10.2147/IJN.S205736 PMid:31308659.

14 Reidy, B., Haase, A., Luch, A., Dawson, K. A., & Lynch, I. (2013). Mechanisms of silver nanoparticle release, transformation

and toxicity: a critical review of current knowledge and recommendations for future studies and applications. Materials (Basel), 6(6), 2295-2350 http://dx.doi.org/10.3390/ma6062295 PMid:28809275.

15 Habibullah, G., Viktorova, J., & Ruml, T. (2021). Current strategies for noble metal nanoparticle synthesis. Nanoscale Research Letters, 16(1), 47 http://dx.doi.org/10.1186/s11671021-03480-8 PMid:33721118.

16. Jha, A. K., Prasad, K., Prasad, K., & Kulkarni, A. R. (2009). Plant system: nature’s nanofactory. Colloids and Surfaces. B, Biointerfaces, 73(2), 219-223. http://dx.doi.org/10.1016/j. colsurfb.2009.05.018. PMid:19539452.

17 Santhoshkumar, J., Rajeshkumar, S., & Venkat Kumar, S. (2017). Phyto-assisted synthesis, characterization and applications of gold nanoparticles: a review. Biochemistry and Biophysics Reports, 11, 46-57 http://dx.doi.org/10.1016/j. bbrep.2017.06.004 PMid:28955767.

18 Alwan, S. H., & Al-Saeed, M. H. (2021). Biosynthesized silver nanoparticles (using Cinnamomum verum bark extract) improve the fertility status of rats with polycystic ovarian syndrome. Biocatalysis and Agricultural Biotechnology, 38, 102217 http://dx.doi.org/10.1016/j.bcab.2021.102217

19 Kumar, S., Kumari, R., & Mishra, S. (2019). Pharmacological properties and their medicinal uses of Cinnamomum: a review. The Journal of Pharmacy and Pharmacology, 71(12), 17351761 http://dx.doi.org/10.1111/jphp.13173 PMid:31646653.

20 Ghosh, T., Basu, A., Adhikari, D., Roy, D., & Pal, A. K. (2015). Antioxidant activity and structural features of Cinnamomum zeylanicum. 3 Biotech, 5(6), 939-947. PMid:28324396.

21 Maruthamuthu, R., & Ramanathan, K. (2016). Phytochemical analysis of bark extract of cinnamomum verum: a medicinal herb used for the treatment of coronary heart disease in malayali tribes, Pachamalai Hills, Tamil Nadu, India. International Journal of Pharmacognosy and Phytochemical Research, 8(7), 1218-1222. Retrieved in 2022, November 23, from https:// www.researchgate.net/publication/305326819

22 Doyle, A. A., & Stephens, J. C. (2019). A review of cinnamaldehyde and its derivatives as antibacterial agents. Fitoterapia, 139, 104405 http://dx.doi.org/10.1016/j.fitote.2019.104405 PMid:31707126.

23 Saki, M., Seyed-Mohammadi, S., Montazeri, E. A., Siahpoosh, A., Moosavian, M., & Latifi, S. M. (2020). In vitro antibacterial properties of Cinnamomum verum essential oil against clinical extensively drug-resistant bacteria. European Journal of Integrative Medicine, 37, 101146 http://dx.doi.org/10.1016/j. eujim.2020.101146

24 Sathishkumar, M., Sneha, K., Won, S. W., Cho, C., Kim, S., & Yun, Y. (2009). Cinnamon zeylanicum bark extract and powder mediated green synthesis of nano-crystalline silver particles and its bactericidal activity. Colloids and Surfaces. B, Biointerfaces, 73(2), 332-338. http://dx.doi.org/10.1016/j. colsurfb.2009.06.005. PMid:19576733.

25 Smitha, S. L., Philip, D., & Gopchandran, K. G. (2009). Green synthesis of gold nanoparticles using Cinnamomum zeylanicum leaf broth. Spectrochimica Acta. Part A: Molecular and Biomolecular Spectroscopy, 74(3), 735-739 http://dx.doi. org/10.1016/j.saa.2009.08.007 PMid:19744880.

26 Ansari, M. A., Murali, M., Prasad, D., Alzohairy, M. A., Almatroudi, A., Alomary, M. N., Udayashankar, A. C., Singh, S. B., Asiri, S. M. M., Ashwini, B. S., Gowtham, H. G., Kalegowda, N., Amruthesh, K. N., Lakshmeesha, T. R., & Niranjana, S. R. (2020). Cinnamomum verum bark extract mediated green synthesis of ZnO nanoparticles and their antibacterial potentiality. Biomolecules, 10(2), 336 http:// dx.doi.org/10.3390/biom10020336 PMid:32092985.

Polímeros, 32(3), e2022034,

2022 8/9

Poly(vinyl alcohol)/poly(glycerol) dendrimer hydrogel mediated green synthesis of silver nanoparticles

27 Liu, H., Wang, G., Liu, J., Nan, K., Zhang, J., Guo, L., & Liu, Y. (2021). Green synthesis of copper nanoparticles using Cinnamomum zelanicum extract and its applications as a highly efficient antioxidant and anti-human lung carcinoma. Journal of Experimental Nanoscience, 16(1), 410-423 http:// dx.doi.org/10.1080/17458080.2021.1991577

28 Oliveira, M. L. P., Wanderley Neto, E. T., Queiroz, A. A. A. E., & Queiroz, A. A. A. (2021). Intelligent optical temperature sensor based on polyglycerol dendrimer microspheres encapsulating hopeites. Materials Research, 24(4), e20200568. http://dx.doi. org/10.1590/1980-5373-mr-2020-0568

29 Siepmann, J., & Siepmann, F. (2008). Mathematical modeling of drug delivery. International Journal of Pharmaceutics, 364(2), 328-343 http://dx.doi.org/10.1016/j.ijpharm.2008.09.004 PMid:18822362.

30 Siepmann, J., & Peppas, N. A. (2011). Higuchi equation: derivation, applications, use and misuse. International Journal of Pharmaceutics, 418(1), 6-12 http://dx.doi.org/10.1016/j. ijpharm.2011.03.051 PMid:21458553.

31 Balouiri, M., Sadiki, M., & Ibnsouda, S. K. (2016). Methods for in vitro evaluating antimicrobial activity: A review. Journal of Pharmaceutical Analysis, 6(2), 71-79. http://dx.doi. org/10.1016/j.jpha.2015.11.005 PMid:29403965.

32 Rind, F. M. A., Memon, A. H., Almani, F., Laghari, M. G. H., Mughal, U. R., Maheshwari, M. L., & Khuhawar, M. Y. (2011). Spectrophotometric determination of Cinnamaldehyde from crude drugs and herbal preparations. Asian Journal of Chemistry, 23(2), 631-635. Retrieved in 2022, November 23, from https://asianjournalofchemistry.co.in/user/journal/ viewarticle.aspx?ArticleID=23_2_38

33 Singh, G., Maurya, S., deLampasona, M. P., & Catalan, C. A. N. (2007). A comparison of chemical, antioxidant and antimicrobial studies of cinnamon leaf and bark volatile oils, oleoresins and their constituents. Food and Chemical Toxicology, 45(9), 1650-1661 http://dx.doi.org/10.1016/j. fct.2007.02.031 PMid:17408833.

34 Silva, A. M. R., Ferreira, N. L. O., Oliveira, A. E., Borges, L. L., & Conceição, E. C. (2017). Comparison of ultrasoundassisted extraction and dynamic maceration over content of tagitinin C obtained from Tithonia diversifolia (Hemsl.) A.

gray leaves using factorial design. Pharmacognosy Magazine, 13(50), 270-274 http://dx.doi.org/10.4103/0973-1296.204555 PMid:28539720.

35. Bach, Q., & Chen, W. (2017). Pyrolysis characteristics and kinetics of microalgae via thermogravimetric analysis (TGA): A state-of-the-art review. Bioresource Technology, 246, 88-100 http://dx.doi.org/10.1016/j.biortech.2017.06.087 PMid:28709883.

36 Wu, C., Zhou, X., & Wei, J. (2015). Localized surface plasmon resonance of silver nanotriangles synthesized by a versatile solution reaction. Nanoscale Research Letters, 10(1), 354. http://dx.doi.org/10.1186/s11671-015-1058-1 PMid:26340946.

37 Salazar-Salinas, K., Baldera-Aguayo, P. A., Encomendero-Risco, J. J., Orihuela, M., Sheen, P., Seminario, J. M., & Zimic, M. (2014). Metal-ion effects on the polarization of metal-bound water and infrared vibrational modes of the coordinated metal center of mycobacterium tuberculosis pyrazinamidase via quantum mechanical calculations. The Journal of Physical Chemistry B, 118(34), 10065-10075. http://dx.doi.org/10.1021/ jp504096d PMid:25055049.

38 Ricciardi, R., Auriemma, F., De Rosa, C., & Lauprêtre, F. (2004). X-ray diffraction analysis of Poly(vinyl alcohol) hydrogels obtained by freezing and thawing techniques. Macromolecules, 37(5), 1921-1927 http://dx.doi.org/10.1021/ma035663q

39. Liu, C., Yang, X., Yuan, H., Zhou, Z., & Xiao, D. (2007). Preparation of silver nanoparticle and its application to the determination of ct-DNA. Sensors (Basel), 7(5), 708-718 http://dx.doi.org/10.3390/s7050708

40 Paramelle, D., Sadovoy, A., Gorelik, S., Free, P., Hobley, J., & Fernig, D. G. (2014). Rapid method to estimate the concentration of citrate capped silver nanoparticles from UV-visible light spectra. The Analyst, 139(19), 4855-4861. http://dx.doi.org/10.1039/C4AN00978A. PMid:25096538.

Received: Mar. 22, 2022

Revised: Sep. 19, 2022

Accepted: Oct. 31, 2022

9/9
Polímeros, 32(3), e2022034, 2022

Development of an SO2 indicator label applied to shrimp

Gleyca de Jesus Costa Fernandes1 , Karoline Ferreira Silva1 , Clara Suprani Marques2 , Luiza Zazini Benedito1 , Beatriz Ribeiro Cabral3 , Pedro Henrique Campelo2 , Soraia Vilela Borges3 , José Manoel Marconcini4 , Zuy Maria Magriotis5 , Pedro Ivo Cunha Claro6  and Marali Vilela Dias3* 

1Departamento de Ciências Florestais, Universidade Federal de Lavras, Lavras, MG, Brasil

2Departamento de Tecnologia de Alimentos, Universidade Federal de Viçosa, Viçosa, MG, Brasil

3Departamento de Ciência de Alimentos, Universidade Federal de Lavras, Lavras, MG, Brasil

4Embrapa Instrumentação, São Carlos, SP, Brasil

5Departamento de Engenharia, Universidade Federal de Lavras, Lavras, MG, Brasil

6Departamento de Engenharia de Materiais, Universidade Federal de São Carlos, São Carlos, SP, Brasil *maralivileladias@gmail.com

Obstract

Sulfiting agents are added to crustaceans products to prolong their shelf life. However, depending on the concentration, these agents can be toxic to consumers due to the presence of SO2. In this context, a colorimetric indicator label based on starch and iodine was developed to detect SO2 in shrimp, showing whether the product is safe or not for consumers. The incorporation of iodine into the starch matrix resulted in labels with a smooth and homogeneous surface, and reduced water solubility from 9.26% to around 0.12%. In both in vitro and shrimp paste test, a visual detection response was observed in the label containing 0.02% of iodine when evaluated in the presence of 100 to 160 ppm of SO2, with ΔE* values greater than 5 (can be identifiable by the human eye). Therefore, the elaborated label showed potential as an economical and simple method to detect SO2 concentration in shrimp-based foods.

Keywords: colorimetric indicator, crustaceans, food safety, smart label.

How to cite: Fernandes, G. J. C., Silva, K. F., Marques, C. S., Benedito, L. Z., Cabral, B. R., Campelo, P. H., Borges, S. V., Marconcini, J. M., Magriotis, Z. M., Claro, P. I. C., & Dias, M. V. (2022). Development of an SO2 indicator label applied to shrimp. Polímeros: Ciência e Tecnologia, 32(3). e2022035. https://doi.org/10.1590/0104-1428.20220033

1. Introduction

Crustaceans are highly perishable foods due to their high contents of amino acids, moisture, and their microbiota composition. Therefore, their shelf life depends on the processing techniques, additives, packaging technology, and storage conditions[1]. Sulfiting agents are the most commonly used preservatives aiming at extending the product shelf life, preventing color changes among other functions. However, their main residue, sulfur dioxide (SO2), can cause allergic reactions and asthma attacks in humans when at high concentrations[2]

In Brazil, the National Health Surveillance Agency (ANVISA) is responsible for regulating the use of several active ingredients in food, supported by Resolution nº 329/2019, which establishes a maximum residual concentration of SO2 of 100 ppm in frozen or chilled crustacean, and 150 ppm in ready-to-eat seafood[3]. Concentrations exceeding these limits can negatively affect consumers, food handlers, and buyers/importers[4]. Several methods are used to determine the SO2 concentration in foods, such as volumetric titration, rapid test with strips of paper, and more accurate and powerful techniques, as high-performance liquid chromatography[5] However, these methods have some disadvantages, including

the high cost of reagents, instrumental infrastructure, and long analysis times. A possible innovative and low-cost alternative to ensure the safe consumption of crustaceans could be a smart packaging composed of a colorimetric indicator system[6,7]

Smart or intelligent packaging conveys information to consumers/handlers about the presence of certain substances in the product, such as gases, for example, and it is a novel strategy that could result in benefits for the seafood industry[7,8]. Indicator labels are better options than other detection methods since they are easy to apply and understand (based on color changes), in addition to providing quick and reliable results[8]. Also, they could bring advantages for the consumers regarding food safety.

Recently, a few studies regarding the development of optical sensors and indicators systems of SO2 in food products have been conducted. Bener et al.[6] elaborated a potential sensitive optical sensor for SO2 detection in food matrices. Fu et al.[9], in turn, manufactured a smart PET/paper chip platform for detecting SO2 in food based on microfluidic device and color change by acid-basic indicator. At last,

https://doi.org/10.1590/0104-1428.20220033 O O O O O O O O O O O O O O O
ISSN 1678-5169 (Online) 1/9
Polímeros, 32(3), e2022035, 2022

Fernandes, G. J. C., Silva, K. F., Marques, C. S., Benedito, L. Z., Cabral, B. R., Campelo, P. H., Borges, S. V., Marconcini, J. M., Magriotis, Z. M., Claro, P. I. C., & Dias, M. V.

Khamkhajorn et al.[10] developed a colorimetric-based method to SO2 detection through a smartphone software.

In this context, the present study aimed to develop and characterize a colorimetric indicator starch-based label incorporated with iodine to detect SO2 in a shrimp paste. It was investigated the hypothesis that the manufactured label would change color when in contact with sulfitecontaining foods, enabling an easy and quick detection of high concentrations of SO2. To allow the preparation of this kind of label, this study was based on the Landolt reaction, which explains the starch/iodine/sulfite interaction[11]

2. Materials and Methods

2.1 Materials

The experimental labels were elaborated from cassava 406 starch (Indústria Agro Comercial Cassava SA, Brazil). According to the manufacturer, the starch was previously modified by esterification. Resublimed iodine (Exôdo Científica, Brazil); potassium iodide (Proquimios, Brazil); and sodium metabisulfite (Exodus Científica, Brazil) were also used. The shrimp paste was made from peeled and frozen southern brown shrimp (Farfantepenaeus subtilis) acquired from a local market.

2.2 Experimental design

A sequential design was used, in which the smart labels were developed with two iodine concentrations and characterized. Subsequentialy, the best-performing label was tested in vitro by contact with solutions with different SO2 concentrations, at 4 °C, simulating a cold storage condition, and in contact with a shrimp paste that contained SO2 concentrations ranging from 100 to 120 ppm. The design was completely randomized with three replicates.

2.3 Labels preparation

Starch was dispersed in deionized water, following the proportion of 3% (wt/v), under heating and magnetic stirring at 70 °C for 15 min. Subsequently, the dispersions were cooled down to approximately 30 °C, and iodine (I2) and potassium iodide (KI) were added and homogenized[12] The samples were named FI2 (0.02% wt/v of I2 and 0.04% wt/v of KI) and FI4 (0.04% wt/v of I2 and 0.08% wt/v of KI). After complete solubilization of I2, the labels were obtained by the casting method, in which 20 g of the dispersions were poured into plastic Petri dishes (Ø = 85 mm) and left on a bench at approximately 25 ºC until solvent evaporation (about 18 h). After drying, the labels were removed from the dishes and stored at 23 ºC ± 2 °C and 50% ± 5% relative humidity until analysis. A control label with starch only (PS) was manufactured for comparision purposes.

2.4 Characterization techniques

Fourier transform infrared spectroscopy in attenuated total reflectance (FTIR-ATR, Vertex 70, Bruker, USA), with a zinc selenide crystal, was performed to evaluate the interactions between iodine and the starch matrix. The spectra were obtained with 32 scans per sample at a resolution of 2 cm-1 in the 400 to 4000 cm-1 range.

Micrographs of cross-sections of the samples were taken to evaluate the morphology and homogeneity of the labels. The samples were fixed on stubs with double-sided carbon tape and were sputtered with gold to increase their conductivity. The samples were observed in a scanning electron microscope coupled with energy dispersive x-ray (SEM-EDS, JSM 6510, JEOL, Japan) with an electron acceleration voltage of 10 kV. The EDS method coupled to SEM was used to determine the qualitative composition and map the iodine distribution in the starch matrix. The parameters adopted for this analysis were a voltage of 15 kV and a mapping time of 45 min. In the EDS maps, the intensity of the points indicated the component concentration, and the colors pink, green, and blue corresponded to oxygen, carbon, and iodine, respectively.

The solubility of the films was evaluated to determine their water resistance since their intended application was on high-moisture products. For this purpose, the films were weighed and immersed in 100 mL of distilled water for 24 h. After, the water was drained, and the films were dried in an oven at 105 °C for 24 h and then weighed[13]. Finally, the portion of the films solubilized in water was calculated according to Equation 1: ( ) if i

w w.100 %SM w

  = (1) in which %SM is the percentage of solubilized material; wi is the initial weight of the sample; and wf is the final weight of the sample after drying.

Thermogravimetry analysis (TGA) was performed in a Shimadzu TGA-50 thermogravimetric analyzer (Japan). Approximately 7 mg of material was heated at a rate of 10 °C.min-1 in a nitrogen atmosphere (50 mL.min-1) from 25 °C to 800 °C. This analysis was performed to evaluate whether the incorporation of iodine would produce changes in the thermal decomposition behavior of the labels and determine the materials’ degradation temperature, which was necessary for performing the differential scanning calorimetry (DSC) analysis.

The thermal analyses by DSC were performed in a Shimadzu DSC TA 60 thermal analyzer (Japan). Heating and cooling ramps were performed at a rate of 10 °C.min-1 in a nitrogen atmosphere, in which the temperature varied between -50 °C and 200 °C. By knowing the glass transition temperature (Tg) of the film, it was possible to predict the label behavior under temperature change in specific applications[14]

The color of the labels was instrumentally determined in a Konica Minolta CM-5 colorimeter (Japan) using the CIELAB system, D65 illuminant, standard 10° observer angle, and reflectance mode. The colorimetric coordinates were analyzed and calculated according to Luchese et al.[15], describing the luminosity (L*), which ranges from 0 (light tones) to 100 (dark tones); the coordinate a* (variation in the color space from green (-a) to red (+a)); and the coordinate b* (variation in the color space from blue (-b) to yellow (+ b)). In this color space, C* represents chroma or saturation, and its value is the distance from the luminosity axis (L*), starting at 0 in the center. The hue angle (h*) begins on the

Polímeros, 32(3), e2022035, 2022

2/9

Development of an SO2 indicator label applied to shrimp

+a* axis and moves counterclockwise; along this path, values close to 0° represent red, close to 90° represent yellow, close to 180° represent green, and close to 270° represent blue.

2.5 In vitro evaluation of the label

The label that performed best in the characterization analyses was exposed to SO 2 solutions at different concentrations (40 to 200 ppm, with 20-ppm intervals), at 4 °C for 15 min. After, the labels were dried, and the color analysis was performed. The L* and h* parameters were evaluated as described in section 2.4 to monitor the color change after contact with the SO2 solutions. The total difference (ΔE*) was calculated by the sum of differences in the L*, a*, and b* values before versus after contact with the different SO2 solutions (Equation 2):

solution was transferred to an Erlenmeyer flask, and then 1.4 mL of hydrochloric acid (1 mol.L-1) and 1 mL of 1% (wt./v) starch solution were added. Titration was performed with iodine and N/63 bicarbonate until the solution turned blue. The SO2 concentration in ppm was obtained using the Equation 3:

SO 5000 V C W = (3)

in which CSO2 is the residual SO2 concentration (ppm), V is the volume (mL) spent in the titration with N/63 bicarbonate solution and iodine, and W is the weight (g) of the sample.

Regarding the blank, even after the washing steps, it was not possible to obtain a sample without any SO2, so the reference sample was made from shrimp without the addition of Na2S2O5, which had a residual SO2 concentration of 80 ppm.

2.6 Application on a shrimp-based product

The manufactured labels were tested on a shrimp-based product. Since commercial shrimp already contain sulfite, the acquired samples were previously immersed in distilled water for 20 min and washed twice to reduce the remaining sulfite present. Then, sodium metabisulfite (Na2S2O5) was applied in the shrimps to reach the final desired concentrations of 100, 110 and 120 ppm. Subsequently, 50 g of shrimp was ground to a paste and stored at 4 ± 2 ºC in the presence of the indicator labels. An illustrative scheme of the labels is displayed in Figure 1

To ensure that the concentrations of 100, 110 and 120 ppm were achieved, iodometric titration without heating was performed as follow[16]: 10 mL of sample

2.7 Color and transparency analysis of the labels

The colorimetric variations of the indicator labels exposed to the shrimp samples at different SO2 concentrations (100, 110, and 120 ppm) were measured by analyzing the L*, C*, and h* coordinates (Section 2.4). The ΔE* parameter was obtained as described in section 2.5.

The transparency of the films, which indicates the films’ loss of color, was measured with a GBC UV/VIS 918 spectrophotometer (Shimadzu, Tokyo, Japan) according to ASTM D1746-15[17], by measuring the percentage of transmittance (%T) at 600 nm. The transparency (T600) was calculated according to Equation 4, where δ is the film thickness (mm):

Polímeros, 32(3), e2022035, 2022

3/9
( ) ( ) ( ) 1/2 22 **** E La b²  ∆=∆+∆+∆   (2)
Figure 1. A schematic depiction of the indicator label’s application as smart packaging and the chemical reactions that occur.

Fernandes, G. J. C., Silva, K. F., Marques, C. S., Benedito, L. Z., Cabral, B. R., Campelo, P. H., Borges, S. V., Marconcini, J. M., Magriotis, Z. M., Claro, P. I. C., & Dias, M. V.

2.8 Statistical analysis

Water solubility, color (L*, a*, b*, C*, h*, and ΔE*), and transparency data were subjected to analysis of variance (ANOVA), and the treatment means were compared using Tukey’s test at 5% probability, when deemed appropriate. The statistical analyses were performed in Statistica 8.0 (StatSoft, Dell, USA). The FTIR, TGA, DSC, SEM, and EDS data were subjected to descriptive analysis.

3. Results and Discussions

3.1 Labels characterization

The FTIR spectra obtained for all samples are displayed in Figure 2. The pure starch label (PS) spectrum presented characteristic bands at 3294 cm-1, 2925 cm-1, and 1641 cm-1, corresponding to stretching of the OH bonds of starch, and stretching of the CH and OH bonds of the water present in the starch matrix, respectively[18]. By incorporating iodine into the polymer matrix, the band at 3294 cm-1 shifted to 3288 cm-1, possibly due to the interaction between the iodine molecules with starch. The FTIR spectra in the 3500-3200 cm-1 range can indicate the hydrophobicity of biopolymers[18]. Therefore, the displacement of the signal to a region of lower energy may mean fewer starch interactions with water, which means the films with iodine would be more hydrophobic[19].

The obtained cross-section-micrographs are displayed in Figure 3. All starch labels, with and without the addition of iodine, were compact, with a smooth and homogeneous surface, possible indicating good interaction and compatibility between the components..

The Figure 4 shows the EDS maps with the main elements present in the labels. Carbon (C) and oxygen (O) are represented in the images by pink and green dots, respectively, and are highly abundant because starch consists mostly of these elements. Regarding iodine (blue), FI4 had a higher intensity of dots, confirming the higher concentration of this element in this label when compared to FI2. Overall, the distribution of iodine in the matrix was homogeneous in both formulations, which is important to allow a colorimetric response of the same intensity in any label region, ensuring its efficacy.

Regarding the solubility of the films, the obtained results are displayed in Table 1. The films solubility in water is closely related to the interactions of their components[20] Starch labels usually show high water solubility at 25 °C due to the hydroxyl groups present in their structure[21,22] The low water solubility of iodine impacted the solubility of the labels when compared to the control, reducing it by almost 75 times. When compared to each other, however, no significant difference was verified between FI2 and FI4. As observed in the FTIR spectra (Figure 2), the addition of iodine to the starch matrix led to a decrease in the free OH groups when compared to the control sample, consequently reducing the water solubility of the labels. The FTIR spectra obtained for FI2 and FI4, on the other hand, were quite similar, suggesting that the effect on water solubility of the starch labels depended more on iodine presence rather than its concentration. This factor favored an increase in the stability of the labels, allowing them to remain intact even when submerged in water for 24 h, which is an attractive property for application in foods with high moisture content.

The thermal analyses results can be observed in Figure 5

Table 1. Water solubility values of the manufactured indicator labels.

Treatment Solubility (%)

Figure 2. FTIR spectra of the manufactured starch labels: with 0.02% of iodine (FI2), with 0.04% of iodine (FI4), and a control without iodine (PS).

PS 9.258 ± 0.005b FI2 0.127 ± 0.007a FI4 0.112 ± 0.009a PS - pure starch; FI2 (0.02% I2 and 0.04% KI); FI4 (0.04% I2 and 0.08% KI). Means followed by different letters in the column are significantly different by Tukey’s test (p<0.05).

Figure 3. Cross-sectional photomicrographs: (A) control film; (B) FI2 (0.02% I2 and 0.04% KI); and (C) FI4 (0.04% I2 and 0.08% KI).

Polímeros, 32(3), e2022035,

2022 4/9
600 Log %T T δ = (4)

Figure 4. EDS images of the indicator labels: (A) FI2 (0.02% I2 and 0.04% KI) and (B) FI4 (0.04% I2 and 0.08%KI). Carbon: pink; oxygen: green; iodine: blue.

Figure 5. Thermogravimetric (TG) and differential thermogravimetric (DTG) curves for (A) pure starch label(PS, control); (B) FI2 (0.02% I2 and 0.04% KI); and (C) FI4 (0.04% I2 and 0.08% KI); (D) DCS curves for PS, FI2, and FI4 labels.

Polímeros, 32(3), e2022035, 2022

5/9
Development of an SO2 indicator label applied to shrimp

Fernandes, G. J. C., Silva, K. F., Marques, C. S., Benedito, L. Z., Cabral, B. R., Campelo, P. H., Borges, S. V., Marconcini, J. M., Magriotis, Z. M., Claro, P. I. C., & Dias, M. V.

The PS TG curve (Figure 5A) showed mass loss in three stages, while FI2 and FI4 TG curves (Figure 5B and 5C, respectively) showed mass losses in four different stages. The first stage observed for all samples was attributed to water loss[23]. Regarding the PS labels, the second stage (265-453 °C) was related to the thermal degradation of amylose and amylopectin, with a mass loss around 69%.

Concerning FI2 and FI4, the second stage of mass change (200-240 ºC) was related to the sublimation of the iodine[24]. After this event, there was thermal decomposition of starch. With the addition of iodine, the maximum degradation temperature of the label decreased from 310 °C in the control film to 280 °C and 270 °C in FI2 and FI4, respectively. This was most likely due to electrostatic interactions between I3 and the carbonyl groups present in starch[24]. It was observed that the increase in iodine concentration from 0.02% to 0.04% slightly reduced the thermal stability of the labels. Similar behavior was observed by Chen et al.[25] when investigating carboxymethyl chitosan films grafted with iodine. Regarding the residual mass, there was an increase in the percentage of residues as the iodine concentration in the matrix increased: it went from 15.4% in PS to 20.3% in FI2 and 34.82% in FI4. Since the starch concentration was not changed, this increase may be related to the potassium and iodine added to the medium[24,26]

The DSC curves ( Figure 5D ) showed that the incorporation of iodine in the matrix, as well as the increase in its concentration, increased the samples’ glass transition temperature (Tg). This was probably due to a higher amount of energy required for chain mobility in the polymer as a consequence of the interactions between iodine and the starch matrix, through dipolar force. The iodine incorporated forms complexes with the amylose fraction of the starch, resulting in films with a dark blue color (Figure 1). It is discussed that the entering of iodine into the helical structure of amylose makes it stiffer and probably alters Tg[27]. Thus, the higher Tg value of the FI4 label may be related to the higher iodine concentration[28].

For all treatments, the Tg values were close to 0 °C, indicating that, at the recommended temperature for fresh shrimp storage (between 0 ºC and 4 ºC), the films would be above their Tg. In this temperature range, it would be expected a greater malleability of the polymer chains since they are in the elastomeric state[29]. This feature is important to the labels’ performance since it enables their accommodation on the irregular surface of the shrimp . In this sense, it is noteworthy to mention that storage temperatures below 0 ºC (more specifically, below the Tg) would not be ideal for the developed labels, since the materials would become more rigid, stiff, and brittle, compromising their use.

Concerning the color analysis, the increase in iodine concentration did not influence (p>0.05) the L*, a*, b*,

Table 2. Color coordinates of the manufactured labels.

or C* coordinates (Table 2). The coordinates a* and b* remained negative, indicating the predominance of blue and green color; the luminosity (L*) did not decrease, and the saturation (C*) did not increase significantly. Concerning h*, it did change significantly; however, the obtained values remained in the range between 200 and 295 º, representing a predominance of the color blue[30].

3.2 In vitro and in shrimp paste tests

According to the characterization results, the higher iodine concentration did not increase thermal stability nor decrease water solubility; regarding the color analysis, it only influenced h*, which remained within the blue range in both formulations. Therefore, a higher iodine concentration in the label was not attractive for application, and the following tests were performed only with the FI2 label. Besides that, taking into account that migration of iodine to the food could occur, labels with a smaller concentration of the substance would be preferable. The recommended intake of iodine is 150 µg/day for adults, however, it is known that, with the exception of susceptible individuals, exposure to higher doses are usually well tolerated[31]. Although iodine migration to food was not investigated in the present work, it would be interesting to verify if it could indeed occur and if the it would pose a risk to consummers.

When in contact with solutions with different SO2 concentrations, the L*, h*, and ΔE* values of FI2 label changed (Figure 6A). Higher SO2 concentrations promoted an increase in L* values and a reduction in the blue hue (h*), resulting in lighter and even transparent labels. The ΔE* values were satisfactory for a 120 to 160 ppm concentration range. Concentrations of SO2 greater than 120 ppm led to ΔE* values greater than 5, a change that can be identifiable by the human eye[30]. For SO2 concentrations above 160 ppm, the ΔE* values were above 12, which implies an absolute color difference, i.e., there was total discoloration of the labels, allowing visual identification when the SO2 in the product is higher than the limit allowed by Brazilian legislation for ready-to-eat seafoods (150 ppm)[3].

In this case, the increase in the SO2 concentration caused a more significant discoloration, which is explained by the Landolt reaction but in reverse. In this reaction, a potassium iodate (KIO3) solution is added to an acidified sodium bisulfite (NaHSO3) solution containing starch. The iodate (IO3 ) is oxidized to iodine (I2), but in the presence of bisulfite (HSO3 ), it rapidly reduces to iodate (IO3 ) again, keeping the medium colorless. After that, when all the bisulfite in the system is consumed, it leads to the accumulation of iodine and a complex distribution of I3 and I5 , which reacts with starch, changing the system color to dark blue (Figure 1)[9]. For the labels developed in this study, the bisulfite in the

Treatment L* a* b* C* h*

FI2 20.24±0.97a -0.04±0.04a -0.36±0.22a 0.36±0.22a 263.04±2.89b FI4 17.56±1.63a -0.14±0.09a -0.50±0.27a 0.52±0.29a 255.07±3.41a

FI2 (0.02% I2 and 0.04% KI); FI4 (0.04% I2 and 0.08% KI). Means followed by different letters in the same column are significantly different (ANOVA) (p<0.05).

Polímeros, 32(3), e2022035,

6/9
2022

Figure 6. (A) FI2 label after contact with different SO2 solutions at 4 °C and (B) after contact with shrimp paste.

Table 3. Color and transparency parameters of the indicator label (FI2) applied to shrimp.

Coordinates SO2 (ppm) 100 110 120

L* 23.60 ± 0.18 c 28.82 ± 0.29 b 32.71 ± 0.19 a h* 38.48 ± 5.08 a 40.83 ± 3.10 a 30.77 ± 8.61 a ΔE* 3.58 ± 1.13 c 8.68 ± 0.78 b 12.49 ± 0.88 a C* 0.94 ± 0.03ª 0.99 ± 0.06a 0.38 ± 0.04b

Means followed by different letters, in the same row, are significantly different by Tukey’s test (p<0.05).

medium reacted with the iodine–amylose complex, leading to the discoloration of the dark-blue color of the matrix.

For concentrations up to 100 ppm, the ΔE* values were lower than the limit of perception of the human eye (ΔE*<5), which would not affect the application of the labels when used in chilled crustaceans. However, new tests would be needed for application in other markets with more flexible laws. Nevertheless, the good performance of the discoloration rate of the label in the in vitro test demonstrated its suitability for testing on food.

Among the color coordinates, those significantly affected (p<0.05) by variations in the SO2 concentration when the label was applied to the shrimp paste were L*, C*, and ΔE* (Table 3). SO2 concentrations in shrimp paste greater than 120 ppm caused an increase in L* and a decrease in C* in the labels, resulting in lighter and less saturated labels, i.e., loss of color after contact with the shrimp paste. The h* coordinate did not differ significantly between the samples

as a function of the SO2 concentration, meaning there was a similar hue.

The ΔE* parameter increased significantly with the SO2 concentration. In the samples exposed to 110 ppm and 120 ppm, the ΔE* values were greater than 5, indicating easy detection by the human eye (Figure 6B). In this case, the determination of ΔE* becomes extremely important, as products that were not in accordance with the most restrictive legislation (100 ppm) would be easily perceived by the human eye if the label FI2 was used.

4. Conclusion

The incorporation of 0.02% of iodine into the starch matrix reduced the water solubility of the elaborated labels and increased their thermal stability.The tests in vitro and in shrimp paste showed that the labels have potential for use as a colorimetric indicator system to help verify the residual SO2 concentration in shrimp. Due to the simplicity of this system, easy production, and low cost, these labels may find application in the seafood industry to inspect the SO2 concentration in crustaceans during quality control, enabling quick identification of products with residual SO2 concentrations above the legal limit. The label can also be used by end consumers to monitor product safety when a dark-blue test result would mean that the product is safe for consumption. For future works, the labels could be tested in other commercial temperatures and in different seafood products, as well as an indirect contact mode, aiming to expand their application.

Polímeros,
7/9
32(3), e2022035, 2022
Development of an SO2 indicator label applied to shrimp

Fernandes, G. J. C., Silva, K. F., Marques, C. S., Benedito, L. Z., Cabral, B. R., Campelo, P. H., Borges, S. V., Marconcini, J. M., Magriotis, Z. M., Claro, P. I. C., & Dias, M. V.

5. Author’s Contribution

• Conceptualization – Gleyca de Jesus Costa Fernandes; Marali Vilela Dias; Soraia Vilela Borges.

• Data curation – Gleyca de Jesus Costa Fernandes; Marali Vilela Dias.

• Formal analysis – Gleyca de Jesus Costa Fernandes; Pedro Henrique Campelo.

• Investigation – Gleyca de Jesus Costa Fernandes; Pedro Henrique Campelo; Beatriz Ribeiro Cabral.

• Methodology – Gleyca de Jesus Costa Fernandes; Marali Vilela Dias.

• Project administration – Marali Vilela Dias.

• Resources – Marali Vilela Dias; Soraia Vilela Borges; José Manoel Marconcini; Pedro Henrique Campelo; Zuy Maria Magriotis; Pedro Ivo Cunha Claro.

• Software – NA.

• Supervision – Marali Vilela Dias.

• Validation – Gleyca de Jesus Costa Fernandes; Marali Vilela Dias; Soraia Vilela Borges.

• Visualization – Karoline Ferreira Silva; Clara Suprani Marques; Luiza Zanini Benedito.

• Writing – original draft – Gleyca de Jesus Costa Fernandes.

• Writing – review & editing – Karoline Ferreira Silva; Clara Suprani Marques; Marali Vilela Dias; Luiza Zanini Benedito.

6. Acknowledgements

The authors are grateful to the Laboratory of Electron Microscopy and Ultrastructural Analysis of the Federal University of Lavras, the Laboratory of Chemical Waste Management of the Federal University of Lavras, and EMBRAPA Instrumentation. We are also grateful to Finep, Fapemig, CNPq, and Capes for financial support (Finance code 001).

7. References

1 Sae-leaw, T., & Benjakul, S. (2019). Prevention of melanosis in crustaceans by plant polyphenols: a review. Trends in Food Science & Technology, 85, 1-9 http://dx.doi.org/10.1016/j. tifs.2018.12.003.

2 Lien, K.-W., Hsieh, D. P. H., Huang, H.-Y., Wu, C.-H., Ni, S.-P., & Ling, M.-P. (2016). Food safety risk assessment for estimating dietary intake of sulfites in the Taiwanese population. Toxicology Reports, 3, 544-551 http://dx.doi.org/10.1016/j. toxrep.2016.06.003. PMid:28959578.

3 Brasil. (2019, 19 de dezembro). Resolução - RDC Nº 329Estabelece os aditivos alimentares e coadjuvantes de tecnologia autorizados para uso em pescado e produtos de pescado Diário Oficial da União, Brasília.

4 Andrade, L. T., Lacerda, M. F. A. F., & Ventura, A. P. M. (2015). Uso do dióxido de enxofre na despesca e beneficiamento de camarão. Revista Principia Divulgação Científica e Tecnológica do IFPB, 1(28), 66-77 http://dx.doi.org/10.18265/151703062015v1n28p66-77.

5 D’Amore, T., Di Taranto, A., Berardi, G., Vita, V., Marchesani, G., Chiaravalle, A. E., & Iammarino, M. (2020). Sulfites in

meat: occurrence, activity, toxicity, regulation, and detection. A comprehensive review. Comprehensive Reviews in Food Science and Food Safety, 19(5), 2701-2720. http://dx.doi. org/10.1111/1541-4337.12607 PMid:33336981.

6 Bener, M., Şen, F. B., & Apak, R. (2020). Novel pararosaniline based optical sensor for the determination of sulfite in food extracts. Spectrochimica Acta. Part A: Molecular and Biomolecular Spectroscopy, 226, 117643 http://dx.doi. org/10.1016/j.saa.2019.117643 PMid:31627056.

7. Mohammadian, E., Alizadeh-Sani, M., & Jafari, S. M. (2020). Smart monitoring of gas/temperature changes within food packaging based on natural colorants. Comprehensive Reviews in Food Science and Food Safety, 19(6), 2885-2931 http:// dx.doi.org/10.1111/1541-4337.12635 PMid:33337068.

8 Kalpana, S., Priyadarshini, S. R., Leena, M. M., Moses, J. A., & Anandharamakrishnan, C. (2019). Intelligent packaging: trends and applications in food systems. Trends in Food Science & Technology, 93, 145-157 http://dx.doi.org/10.1016/j. tifs.2019.09.008

9 Fu, L., Liu, C.-C., Yang, C., Wang, Y., & Ko, C. (2019). A PET/paper chip platform for high resolution sulphur dioxide detection in food. Food Chemistry, 286, 316-321 http://dx.doi. org/10.1016/j.foodchem.2019.02.032 PMid:30827613.

10. Khamkhajorn, C., Pencharee, S., Jakmunee, J., & Youngvises, N. (2022 ). Smartphone-based colorimetric method for determining sulfites in wine using a universal clamp sample holder and microfluidic cotton swab-based analytical device. Microchemical Journal, 174, 107055. http://dx.doi.org/10.1016/j. microc.2021.107055

11 Csekõ, G., Varga, D., Horváth, A. K., & Nagypál, I. (2008). Simultaneous investigation of the Landolt and Dushman reactions. The Journal of Physical Chemistry A, 112(26), 59545959 http://dx.doi.org/10.1021/jp802239b PMid:18543894.

12. Fernandes, G. J. C. (2016). Desenvolvimento de etiqueta inteligente com indicador colorimétrico para identificação de SO2 em crustáceos (Dissertação de mestrado). Universidade Federal de Lavras, Lavras.

13 Wang, Y., Zhang, L., Liu, H., Yu, L., Simon, G. P., Zhang, N., & Chen, L. (2016). Relationship between morphologies and mechanical properties of hydroxypropyl methylcellulose/ hydroxypropyl starch blends. Carbohydrate Polymers, 153, 329-335 http://dx.doi.org/10.1016/j.carbpol.2016.07.029 PMid:27561503.

14 Salez, T., McGraw, J. D., Dalnoki-Veress, K., Raphaël, E., & Forrest, J. A. (2017). Glass transition at interfaces. Europhysics News, 48(1), 24-28. http://dx.doi.org/10.1051/epn/2017103.

15 Luchese, C. L., Sperotto, N., Spada, J. C., & Tessaro, I. C. (2017). Effect of blueberry agro-industrial waste addition to corn starch-based films for the production of a pH-indicator film. International Journal of Biological Macromolecules, 104(Pt A), 11-18 http://dx.doi.org/10.1016/j.ijbiomac.2017.05.149 PMid:28552729.

16. Vieira, K. P. B. A., Góes, L. M. N., Mendes, P. P., Galvez, A. O., & Mendes, E. S. (2008). Influência do aquecimento sobre diferentes métodos de titulação de SO2 residual em camarões Litopenaeus vannamei (Boone, 1931). Acta Scientiarum. Animal Sciences, 30(1), 83-88.

17 American Society for Testing and Materials – ASTM. (2015). ASTM D1746-15: standard test method for transparency of plastic sheeting USA: ASTM

18 Abral, H., Basri, A., Muhammad, F., Fernando, Y., Hafizulhaq, F., Mahardika, M., Sugiarti, E., Sapuan, S. M., Ilyas, R. A., & Stephane, I. (2019). A simple method for improving the properties of the sago starch films prepared by using ultrasonication treatment. Food Hydrocolloids, 93, 276-283 http://dx.doi.org/10.1016/j.foodhyd.2019.02.012

Polímeros, 32(3), e2022035, 2022

8/9

Development of an SO2 indicator label applied to shrimp

19 Shivaraju, V. K., Appukuttan, S. V., & Kumar, S. K. S. (2019). The Influence of bound water on the FTIR characteristics of starch and starch nanocrystals obtained from selected natural sources. Stärke, 71(5-6), 1700026

20 Basiak, E., Lenart, A., & Debeaufort, F. (2017). Effect of starch type on the physico chemical properties of edible films. International Journal of Biological Macromolecules, 98, 348-356 http://dx.doi.org/10.1016/j.ijbiomac.2017.01.122 PMid:28137462.

21 Colivet, J., & Carvalho, R. A. (2017). Hydrophilicity and physicochemical properties of chemically modified cassava starch films. Industrial Crops and Products, 95, 599-607 http://dx.doi.org/10.1016/j.indcrop.2016.11.018

22 Shah, U., Naqash, F., Gani, A., & Masoodi, F. A. (2016). Art and science behind modified starch edible films and coatings: a review. Comprehensive Reviews in Food Science and Food Safety, 15(3), 568-580 http://dx.doi.org/10.1111/1541-4337.12197 PMid:33401817.

23 Pigłowska, M., Kurc, B., Rymaniak, Ł., Lijewski, P., & Fuć, P. (2020). Kinetics and thermodynamics of thermal degradation of different starches and estimation the OH group and H2O content on the surface by TG/DTG-DTA. Polymers, 12(2), 357 http://dx.doi.org/10.3390/polym12020357 PMid:32041286.

24 Danilovas, P. P., Rutkaite, R., & Zemaitaitis, A. (2014). Thermal degradation and stability of cationic starches and their complexes with iodine. Carbohydrate Polymers, 112, 721-728 http://dx.doi.org/10.1016/j.carbpol.2014.06.038 PMid:25129801.

25 Chen, Y., Yang, Y., Liao, Q., Yang, W., Ma, W., Zhao, J., Zheng, X., Yang, Y., & Chen, R. (2016). Preparation, property of the complex of carboxymethyl chitosan grafted copolymer with

iodine and application of it in cervical antibacterial biomembrane. Materials Science and Engineering C, 67, 247-258 http:// dx.doi.org/10.1016/j.msec.2016.05.027 PMid:27287120.

26. Aqlil, M., Nzenguet, A. M., Essamlali, Y., Snik, A., Larzek, M., & Zahouily, M. (2017). Graphene oxide filled lignin/starch polymer bionanocomposite: structural, physical, and mechanical studies. Journal of Agricultural and Food Chemistry, 65(48), 10571-10581 http://dx.doi.org/10.1021/acs.jafc.7b04155 PMid:29113432.

27 Moulay, S. (2013). Molecular iodine/polymer complexes. Journal of Polymer Engineering, 33(5), 389-443. http://dx.doi. org/10.1515/polyeng-2012-0122

28 Ali, A., Ganie, S. A., & Mazumdar, N. (2018). A new study of iodine complexes of oxidized gum arabic: an interaction between iodine monochloride and aldehyde groups. Carbohydrate Polymers, 180, 337-347 http://dx.doi.org/10.1016/j.carbpol.2017.10.005 PMid:29103513.

29 Fan, F., & Roos, Y. H. (2017). Glass transition-associated structural relaxations and applications of relaxation times in amorphous food solids: a review. Food Engineering Reviews, 9(4), 257-270 http://dx.doi.org/10.1007/s12393-017-9166-6

30 Ramos, E. M., & Gomide, L. A. M. (2007). Avaliação da qualidade de carnes: fundamentos e metodologias Viçosa: Editora UFV.

31 Leung, A. M., & Braverman, L. E. (2014). Consequences of excess iodine. Nature Reviews. Endocrinology, 10(3), 136-142 http://dx.doi.org/10.1038/nrendo.2013.251 PMid:24342882.

Received: Mar. 24, 2022

Revised: Oct. 31, 2022

Accepted: Nov. 18, 2022

Polímeros, 32(3), e2022035, 2022

9/9

Evaluation of lignin as stabilizer in vulcanized natural rubber formulations

Gelsa Adriana Carpenedo1,2* , Nayrim Brizuela Guerra1 , Marcelo Giovanela1 , Marco Aurelio De Paoli3  and Janaina da Silva Crespo1* 

1Universidade de Caxias do Sul – UCS, Caxias do Sul, RS, Brasil

2Vipal Borrachas S.A, Nova Prata, RS, Brasil 3Instituto de Química, Universidade Estadual de Campinas – UNICAMP, Campinas, SP, Brasil *geacarpen@gmail.com; jscrespo@ucs.br

Obstract

In this study we evaluated the use of eucalyptus lignin as a stabilizer in combination with other stabilizers in a vulcanized elastomeric based on natural rubber. The stabilizers tested were 6PPD (N-1,3-dimethyl-butyl-N’-phenyl-pphenylenediamine), TMQ (oligomerized 2,2,4-trimethylquinoline), paraffin wax and eucalyptus lignin. At predetermined time intervals, samples were taken from aging conditions and the mechanical properties and additive content were determined. The sample with a combination of wax and lignin in the same formulation showed the greatest resistance to oxidative degradation. In samples with only one stabilizer, the migration test indicated greater diffusion of lignin to the surface. Samples exposed to thermo-oxidative aging showed greater loss in the mechanical properties of tear strength and 6PPD consumption. In the accelerated aging with ozone, all showed a behavior more resistant to aging. We concluded that lignin can be used as a substitute for synthetic stabilizers, without impairing the performance of natural rubber compounds.

Keywords: accelerated aging, lignin, natural rubber, paraffin wax.

How to cite: Carpenedo, G. A., Guerra, N. B., Giovanela, M., De Paoli, M. A., & Crespo, J. S. (2022). Evaluation of lignin as stabilizer in vulcanized natural rubber formulations. Polímeros: Ciência e Tecnologia, 32(3), e2022036. https://doi.org/10.1590/0104-1428.20220077

1. Introduction

Natural rubber (NR) is an elastomer obtained from latex extracted from the Hevea brasiliensis tree. Natural rubber latex is a colloidal emulsion with 60-70% water and 40-30% rubber, mainly composed of poly(cis-1,4-isoprene) [1]. After vulcanization, NR presents excellent dynamic‒mechanical performance, in relation to its tensile, tear and abrasion resistance properties[2]. However, due to its highly unsaturated polymer chain, NR presents low resistance to accelerated aging, mainly due to the action of heat, oxygen, ozone and sunlight[3].

The loss of properties of rubber compounds in service often directly results in mechanical fatigue fracture, initiated by surface cracks[4]. The interaction with ozone, heat and oxygen is evidenced when the rubber is stressed or tensioned, resulting in intensification of failures in the direction perpendicular to the applied stress[5]. Rubbers with unsaturated bonds near the surface will degrade more easily. Without stress or tension, the double bonds in the volume will not be exposed to external agents. Therefore, the cracks will not grow, remaining only in the surface layer of the material[6]. Depending on how the attack is, degradation will occur through molecular scission, which results in smaller chains and a greater number of chain ends, which generates reactive species, which are free radicals[7].

Oxidative aging in elastomers is one of the most important problems in rubber compound technology because the absorption of a small amount of oxygen causes considerable changes in physical and mechanical properties. These changes can be delayed, but not completely avoided, through the use of a stabilizer[8]. Stabilizers are chemical compounds that inhibit degradative processes in polymers[9], and generally three factors affect the efficiency of these substances within the NR.

The first is the intrinsic activity of the stabilizer, related to the ability of the stabilizer to delay or interfere with the main chain oxidation process. This may be limited by the molar mass of the stabilizer[10]. The second factor is the solubility or compatibility of the stabilizer with the polymer matrix. The polarity difference will result in an insoluble stabilizer in the polymer matrix, which leads to exudation of the material. The third factor is the volatility or loss of the stabilizer, which can affect the performance of the final product[11]. Of the three factors, the third is the most important, as it directly affects the persistence of the stabilizer. In this context, several researchers are trying to improve the effect of stabilizers, for which purpose they use combinations of additives with different diffusion coefficients, even knowing

https://doi.org/10.1590/0104-1428.20220077 O O O O O O O O O O O O O O O Polímeros, 32(3),
2022 ISSN 1678-5169 (Online) 1/8
e2022036,

that one of them can be lost by volatilization during the useful life of the elastomeric compound[12]

The use of additives from renewable sources in rubber compositions has gained attention and is currently becoming an attractive option for reducing environmental impacts[13]. Thus, the use of lignin as an elastomer stabilizer can be considered. Lignin can act as a stabilizer because the phenolic groups in its structure are similar to the structure of the hindered phenolic stabilizers used as primary stabilizers in the polymer industry[13,14]. The presence of hindered phenols in lignin favors the scavenging of free radicals and offers a protective effect against thermo-oxidative aging[15]. Paraffin waxes are predominantly mixtures of paraffin hydrocarbons[16]. At the temperatures at which most rubber products cure, petroleum waxes dissolve completely, and as the rubber cools after vulcanization a supersaturated solution of wax will form. In rubber, the waxes migrate to the surface and form a thin, inert film, which acts as a physical barrier[17]. Secondary aromatic amines are the most used primary stabilizers for unsaturated polymers like synthetic and natural rubber. These materials are processed by vulcanization in the presence of sulfur compounds and contain carbon black to increase their abrasion resistance[18]. In spite of the benefit of additives in rubber compounds, some researchers have shown that there is a tendency of some stabilizers to distribute among tire parts, reaching an equilibrium concentration. The migration of additives is affected by the polymer structure, presence of fillers, molar mass, and temperature[19].

In this study we used 6PPD (N-1,3-dimethyl-butylN’-phenyl-p-phenylenediamine) and TMQ (oligomerized 2,2,4-trimethylquinoline), classified as primary stabilizer, both of which are of the secondary aromatic amine type. Regarding the 6PPD stabilizer combined with TMQ for elastomers, few studies have been performed, and mainly to evaluate the behavior synergistically in accelerated aging. Paraffin wax and lignin were also used. Wax forms a physical barrier against aging agents, while TMQ and 6PPD form a chemical barrier, because they react with ozone and oxygen, preventing the premature degradation of the artifact[20]. In this context, the objective of this research was to evaluate the use of eucalyptus lignin as a stabilizer for vulcanized natural rubber in combination with other commercial stabilizers that

are routinely used by the industry. The performance of nine formulations was studied before and after their exposure to accelerated aging tests.

2. Materials and Methods

2.1 Materials

The materials used in this work were: NR (Hevea-Tec Indústria e Comércio Ltda), carbon black N550 (CB-N550, Aditia Byrla), stearic acid (Sabões Fontana), zinc oxide (ZnO, Votorantim Metais), sulfur (Eastamn Chemicals Company), 1,3-diphenylguanidine accelerator (DPG, General Química), 2-mercaptobenzothiazole accelerator (MBT, Lanxess), 6PPD (Lanxess), TMQ (Chemtura), lignin (Suzano Pulp and Paper) and paraffin wax (GeQuímica). All suppliers are from Brazil.

2.2 Preparation of specimens

Nine formulations were prepared (Table 1), four with individual stabilizer, four with combined additives and one formulation without additive. The amounts of stabilizers were chosen based on the previously published group results[8]. The components were mixed in an internal mixer (Banbury type Copé) using 1.250 kg per batch, a rotor speed of 50 rpm, at 150 °C for 150 s. Sulfur and accelerator incorporation was performed in an open roller mixer (Lab Mill 350, Copé), at 80 °C, with a cylinder friction ratio of 1:1.25, for 2 min. Samples with dimensions of 150 × 150 × 2 mm were prepared by compression molding in a Shultz PHS 15 T hydraulic press, vulcanized at 150 °C, 15 MPa for 15 min. Specimens were cut according to the specific ASTM for the different tests.

2.3 Migration test

The samples of 6PPD, TMQ, lignin and wax were vulcanized in 150 × 150 × 1.0 mm thick plates, without the addition of carbon black. Subsequently, each sample plate containing the additive (source disk) was placed between two non-additive rubber plates (receiver disks) and maintained under a pressure of 30 Pa at 25 °C. After 30, 60 and 120 days, the systems were dismantled, and 1 g of

Polímeros, 32(3), e2022036,

2022 2/8
Table 1. Composition of the formulations studied. Components Compositions (phr)* 6PPD TMQ Lignin Wax 6PT 6PTW 6PL 6PLW WA CB-N550 60 60 60 60 60 60 60 60 60 Stearic acid 2 2 2 2 2 2 2 2 2 ZnO 3 3 3 3 3 3 3 3 3 Sulfur 2.24 2.24 2.24 2.24 2.24 2.24 2.24 2.24 2.24 DPG 0.5 0.5 0.5 0.5 0.5
2
0.5 0.5 0.5 0.5 MBT
2 2 2 2 2 2 2 2 6PPD 2.5 - - - 2.5 2.5 2.5 2.5TMQ - 2.5 - - 1 1 - -Lignin - - 2.5 - - - 1 1Paraffin wax - - - 2.5 - 2 - 2*6PPD: Samples with only 6PPD as a stabilizer; TQM: Samples with only TQM as a stabilizer; lignin: Samples with only lignin as a stabilizer; Wax: Samples with only paraffin wax as a stabilizers; 6PT: Samples with the combination of 6PPD and TQM; 6PTW: Samples with the combination of 6PPD, TQM and paraffin wax; 6PL: Samples with the combination of 6PPD and lignin; 6PLW: Samples with the combination of 6PPD, lignin and paraffin wax; and WA: Samples without additive.

Evaluation of lignin as stabilizer in vulcanized natural rubber formulations

each vulcanized formulation was cut and soaked for 40 h in acetone at room temperature. Stabilizers were quantified by gas chromatography using a Clarus 600 Perkin Elmer gas chromatograph and the conditions can be seen in section Gas chromatography.

2.4 Elemental analysis (CHN)

The elemental compositions of the 6PPD, TMQ, lignin and wax samples were determined using a Perkin Elmer 2400 CHN elemental analyzer (Waltham, MA, USA). The relative quantities of carbon, hydrogen and nitrogen were measured directly with the analyzer. The oxygen contribution was estimated as the difference between the summed carbon, hydrogen and nitrogen concentrations and 100%.

2.5 Oxidation induction time test

The oxidation induction time (OIT) of samples WA, 6PT, 6PTW, 6PL and 6PLW was determined on a Differential Scanning Calorimeter, DSC Q2000 TA Instruments, according to ASTM D 3895-98[21]. The samples were first equilibrated at 30 °C, then heated at 20 °C/min to 60 °C. Subsequently, they were kept at 60 °C for another 3 min with a nitrogen flow of 50 mL/min and then heated to 200 °C. After reaching 200 °C, the nitrogen gas atmosphere was exchanged for oxygen for 120 min. The first exothermic event after the introduction of oxygen was considered the oxidation induction time.

2.6 Crosslinking density

Crosslinking density was determined using the analyzer RPA 2000 (Alpha Technologies). The elastic modulus (G’) measurements were performed on uncured and cured compounds at 100 °C, with 0.25° deformation and frequencies of 5 Hz and 0.5 Hz, respectively. From the G’ values of the samples before and after vulcanization and using Equation 1, the physical and chemical crosslink densities were determined:

totalchemphys XXX =+ (1)

where XCHEMICAL is the chemical crosslinking density and XPHYS is the physical crosslinking density. The XPHYS is related to the crosslinking chains in the non-vulcanized sample and can be approximated to G’ values at a high oscillation frequency and the XTOTAL is related to the crosslinking chains in the vulcanized sample and can be approximated to G’ values at a low oscillation frequency (Equations 2 and 3, respectively):

( ) 5 ´ 2 beforecureHz phys G X RT = (2) ( ) 0.5 ´ 2 aftercureHz total G X RT = (3)

where G´BEFORE CURE is the elastic modulus measured at 5 Hz frequency for uncured rubber; G´AFTER CURE is the elastic modulus measured at 0.5 Hz frequency for cured rubber; R is a universal gas constant (8.31 J K-1mol) and T is the work temperature in Kelvin. Therefore, the XCHEM was calculated using Equation 4.

Polímeros, 32(3), e2022036, 2022

chemtotalphys XXX =− (4)

2.7 Mechanical test

The tear strength (ASTM D 624-98[22]) and tensile strength (ASTM D 412-06[23]) were conducted using type C specimens, a load cell of 5 kN and the displacement rate of 500 mm min-1, in a Tensiometer Universal Testing Machine T2000 (Alpha Technologies). From the stress vs. elongation curve, the elongation at break and modulus at 100% were calculated. All tests were performed in quintuplicate.

2.8 Aging test

Different aging tests were performed. After each test, the samples were tested for tensile strength; the tear strength and content of 6PPD, TMQ, lignin and wax were analyzed by gas chromatography (see section Gas chromatography). All tests were performed in quintuplicate. From the results, the percentage of property retention for each aging time was determined using Equation 5.

% 100 final initial

P retention P =× (5) where PFINAL is the property value after aging and PINITIAL is the property value before aging.

2.9 Thermo-oxidative aging

The samples were submitted to accelerated thermooxidative aging in an oven (Marconi, model MA 035) at 100 °C with forced air circulation and absence of light. The exposure time was 24, 48 and 72 h according to ASTM D 572-04[24]

2.10 Photochemical aging

The samples were subjected to photochemical accelerated aging in a UV chamber model HD 704, according to ASTM G 154-06[25] operating at 50 °C for 240 and 480 h, in two cycles of 4 h each: 50% of the time subjected to condensation and 50% subjected to UVB radiation.

2.11 Ozone chamber aging

An ozone chamber accelerated aging test (model SIM, 6300) was conducted at 40 °C, 50 pphm ozone concentration for 6, 12 and 24 h, according to ASTM D 1149[26]

2.12 Gas chromatography

From the aged and non-aged samples submitted to tension and tear tests, 1 g of material was minced, dipped and left for 16 h at room temperature in acetone for extraction of 6PPD, TMQ, lignin and wax. Subsequently, the extracted solution was injected into the Clarus 600 Perkin Elmer gas chromatograph according to ASTM D 3156-96[27]. The initial temperature was 20 °C, with a heating rate of 20 °C min-1, end temperature of 300 °C, run time of 29 min, flame ionization detector and detector temperature of 330 °C, column of 100% polysiloxane of 30 m length, 25 mm diameter and a film thickness of 0.30 μm. The carrier gas used was helium, the injection volume was 1 μL and the flow was 1 mL min-1

3/8

3. Results and Discussion

3.1 Migration test

Knowing the diffusion capacity of additives in tire formulations can be very useful in predicting the useful life of rubber compounds. Intermolecular interactions between stabilizers and vulcanized elastomeric matrices affect the migration behavior of the material, because the stronger these interactions are, the slower the migration of the stabilizers[28]. The ability of the stabilizers to migrate was quantified in the 6PPD, TMQ, lignin and wax formulations (Figure 1). The lignin sample showed the highest migration (4.5%) compared to TMQ (0.5%), 6PPD (3.5%) and wax (4.0%). This behavior occurred because lignin has few interactions with the polymer matrix, since it has a significant number of polar phenolic groups in its structure (confirmed by CHN analysis; 58.2% carbon, 5.58% hydrogen and 36% oxygen). Wax showed the second highest migration percentage in relation to other additives, due to the presence of linear chains of low molar mass hydrocarbons, which facilitate its migration to the surface of the vulcanized material[29].

TQM and 6PPD stabilizers are primary additives and both are secondary aromatic amine types. However, TQM is an amine (quinoline type) considered to have a high mass in relation to 6PPD. This fact explains the lower migration of samples with TQM. Furthermore, TQM interacts strongly with the elastomeric matrix because it has C-C and C-H bonds (confirmed by CHN analysis; 82.9% carbon, 8.96% hydrogen and 7.85% nitrogen). According to Khinnavar and Aminabhavi[30], the diffusion profiles of solid accelerators in a natural rubber matrix indicated that the diffusion rate decreases with increasing molar mass of the diffusing species. The highest diffusion of lignin to the surface is a positive effect, because thermal and photochemical degradation reactions initiate at the surface of the vulcanizate and propagate to the bulk.

3.2 Oxidation induction time

The oxygen molecule is a highly reactive chemical species, as it has two unshared electrons, which favors a spontaneous and very rapid reaction with any free radical present in the medium, forming a peroxyl radical. Through the DSC technique, it was possible to observe the beginning of oxidation reactions, evidenced by the heat release characteristic of oxidative degradation[12]. In this work, the OIT was the time registered at the onset of the exothermic oxidation reaction. Usually, the more resistant the sample is to oxidative degradation, the higher the OIT value[31] The OIT obtain were: 7 min, 18 min, 80 min, 63 min and 130 min, for WA, 6PT, 6PL, 6PTW and 6PLW, respectively. Note, that the vulcanized natural rubber was immediately oxidized in the absence of stabilizers, with a short OIT of 7 min. The 6PLW sample has the longest OIT (130 min), when compared to the other samples. The efficient antioxidant performance of the 6PLW sample can be attributed to the combination of wax and lignin in the same formulation, where the phenolic hydroxyl groups of lignin act as stabilizers of the reactions caused by oxygen and its free radicals[32] These results corroborate the data presented in Figure 1 of the surface migration of stabilizer. The lignin and wax are more likely to migrate to the surface, making the 6PL and 6PLW samples more protected.

3.3 Crosslinking density

Generally, there is an important relationship between the resulting properties of rubber composites and the crosslinking density of the rubber chains[13] Figure 2 shows the crosslinking density results of the formulations, determined by the RPA method.

It should be noted that the sample without a stabilizing agent showed the highest crosslinking density (16.4 × 10⁻³ mol cm-3), and the rest of the samples with stabilizers (6PT, 6PTW, 6PL and 6PLW) showed similar values. The crosslinking density is reduced with the presence of stabilizers, as they capture free radicals and cause a lower crosslinking density, interfering with the vulcanization of the compounds. There are some authors who report the use of stabilizers in the devulcanization process[33]. Jiang et al. [34] observed that the crosslinking density of epoxidized natural rubber formulations was continuously reduced with increasing lignin content.

3.4 Aging tests

3.4.1 Thermo-oxidative aging

According to Ahagon et al.[35], thermo-oxidative aging is the result of different mechanisms, whose consequences

Figure 1. Migration of additives 6PPD, TMQ, lignin and wax to the surface of vulcanized rubber samples.

Figure 2. Crosslinking density of formulations WA, 6PT, 6PL, 6PTW and 6PLW.

Polímeros, 32(3), e2022036,

Carpenedo, G. A., Guerra, N. B., Giovanela, M., De Paoli, M. A., & Crespo, J. S.
2022 4/8

Evaluation of lignin as stabilizer in vulcanized natural rubber formulations

on the material properties can be contradictory, and depend strongly on the aging temperature. In this work, the tensile strength, tear strength and stabilizer content were determined for samples WA, 6PT, 6PL, 6PTW and 6PLW aged in the oven for 24, 48 and 72 h. In Figure 3a, we observe that for all three times, the WA sample showed the greatest reduction in the tensile strength retention property. This is due to the absence of stabilizer, which causes a higher crosslinking density, and consequently reduces the mobility of polymer chains, leading to rigid artifacts[36]. The rest of the samples, considering the standard deviation, showed similar retention. The stabilizer initially protect the vulcanized compound, but the level of stabilization decreases with age. Our results are in agreement with Oliani et al.[37], who explain that the tensile strength can increase or decrease with aging time and with temperature, indicating changes in the crosslinking density during the aging process.

In Figure 3b, we present the tear strength retention results. After 72 h of exposure, there is a significant decrease in tear strength for all samples, which occurred gradually over time. Samples 6PT, 6PTW, 6PL and 6PLW showed better retention of properties when compared to the sample without protection. The loss of mechanical properties is mainly due to the increase in stiffness of the elastomeric compound, caused by the increase in the crosslinking density as a result of aging[38]. In thermo-oxidative aging, there are more changes in crosslinking density than in chain division, so the behavior was similar among all samples with stabilizer[39]. The 6PLW sample had the highest tear strength retention, indicating a positive synergistic effect between lignin and wax, which resulted in better protection against the aging effect.

Using gas chromatography, we quantified the content of stabilizers extracted in samples 6PTW (6PPD, TMQ and wax) and 6PLW (6PPD, lignin and wax) (Figure 3c). After 72 h of oven aging in the 6PTW sample, the concentrations of 6PPD, TQM and wax were reduced to 86%, 78% and 32%, respectively, while in the 6PLW sample, the reduction was 80% of 6PPD, 60% of lignin, and there was no wax reduction. In this sample, the presence of lignin apparently prevented wax volatilization. When vulcanized rubbers are heated to a high temperature, the diffusion of stabilizers to the surface occurs and, consequently, their loss by volatilization. Lignin reacts with free radicals due to the presence of phenolic groups in its structure, which allows it to be thermally stable, and its lower loss in relation to TMQ indicates a greater stabilization effect, as observed in the OIT results.

3.4.2 Photo-oxidative aging

The photo-oxidative aging test in the UV chamber occurred at 240 and 480 h. The results of tensile strength retention are shown in Figure 4a. The other samples, 6PT, 6PL, 6PTW and 6PLW, showed ca. 80% property retention. Compared with the results of aging in the oven, the stabilizer provided greater protection in the UV environment. When UV radiation is intense, the changes caused by photo-oxidation occur close to the surface. This is because the oxygen diffusion process occurs at the surface, before it propagates into the interior of the elastomer[37]. It is important to remember that oxygen diffusion is more pronounced when the samples are subjected to mechanical stress, a fact that did not occur in this study[36]. Regarding the retention of tear strength (Figure 4b), the WA sample showed the lowest retention

Polímeros, 32(3), e2022036, 2022

5/8
Figure 3. Retention of properties of (a) tensile strength, (b) tear strength relative to the properties before aging (the dotted line corresponds to 100%) and (c) additive content in oven-aged formulations for 24, 48 and 72 h. Figure 4. Retention of the properties of (a) tensile strength, (b) tear strength relative to the properties before aging (the dotted line corresponds to 100%) and (c) additive content in formulations aged by photo-oxidation in UV chamber for 240 and 480 h.

after 480 h (70%). We noticed that samples 6PTW and 6PLW showed an increase in tensile strength and retention of tear strength from 240 to 480 h of irradiation, probably due to surface crosslinking induced by UV light. According to Figure 1, wax and lignin migrate to the surface, which favors protection from photo-oxidation, letting free radicals recombine and form crosslinks.

Figure 4c shows the percentage retention for each additive after aging. In the 6PTW sample, there was a significant loss of wax and 6PPD after 480 h, 67 and 54%, respectively, and the TMQ concentration was reduced by 38%. For the 6PLW sample, the reduction of wax and 6PPD was lower, 35 and 10%, respectively; however, the lignin concentration was reduced by 78%. The migration of the wax to the surface forms a physical barrier, which favored protection against UV aging in combination with other stabilizers[17] The persistence of the wax in the 6PLW sample indicates that the lignin prevented its migration and subsequent loss by volatilization. Furthermore, the higher concentration of 6PPD in this sample after 480 h of irradiation favored the protective effect of lignin[40]

3.4.3 Ozone aging

Ozone resistance testing on cured rubber compounds is widely performed in polymer degradation research. In Figure 4a and 4b, we observed that aging accelerated by ozone was less aggressive when compared to the two previous aging studies (Figure 3 and 4). Considering the standard deviation, the tensile strength property after 24 h in the ozone chamber did not show significant variations, all samples having values greater than 90%. In the tensile strength test, during elongation, the molecular and sulfur chains linked to the elastomer, not broken by aging, slide over each other, becoming more oriented and making it difficult to break[41].

According to Mathew and De[39], when the elastomers are tensioned, the attack by the ozone is more effective, resulting in deep cracks in the direction perpendicular to the applied tension. In our study, during aging the samples were not stressed, therefore, a small surface area exposed to ozone attack resulted in small changes in mechanical properties. In the retention of tear strength (Figure 5b), there was a gradual decrease in the properties with time, but this also occurred in the sample without stabilizers (WA). During the test, samples 6PT, 6PTW and 6PLW showed similar retention properties, and for sample 6PL

there was no decrease in property in the first 12 h, which could be explained by the migration of lignin to the surface of the sample, as shown in Figure 1. TMQ and 6PPD form a chemical barrier, as they react with ozone and oxygen, preventing premature degradation of the formulations and providing good protection[29]. On the other hand, TMQ and lignin combined with 6PPD show good stabilizing properties when the samples are not stressed.

In the research by Cataldo[29], carried out in an ozone chamber, 80 pphm, dynamically, it was observed that the tensile properties at rupture of the samples with TMQ-6PPDparaffin wax were superior to the sample that contained only 6PPD-paraffin wax, and this was superior to the sample with TMQ-paraffin wax. Cataldo concluded that when TMQ is used in combination with another stabilizer such as 6PPD, better resistance to ozone aging is achieved. TMQ is a stabilizer that stops the propagation of the degradation cycle by donating the hydrogen atom.

In the 6PTW sample, 6PPD and TMQ were not consumed by ozone aging, while the wax concentration decreased by 32% after 24 h. According to Varghese et al. [42], paraffin wax gives effective protection against ozone aging in combination with other stabilizers, as it migrates to the surface of the vulcanized sample and forms a physical barrier. Aging with ozone for 24 h caused a reduction of all stabilizer concentrations in the 6PLW sample: 29% 6PPD, 70% lignin and 24% wax. As shown in Figure 1, the surface migration of lignin and wax was higher than TMQ and 6PPD, which may favor good protection against ozone reaction with the unsaturated groups of natural rubber. In this study, the content of stabilizers was probably more influenced by the scission of the elastomeric chain than the possible changes in the crosslinking density.

4. Conclusions

Nine formulations were prepared combining natural and commercial stabilizing agents. For the first time, we evaluated the synergistic behavior of lignin with other stabilizers in the accelerated aging of natural rubber compounds. In the three aging processes tested, significant differences were observed in the tear strength property, when compared to the tensile strength. The longest oxidation induction time determined by DSC was evidenced by the sample with a combination of wax and lignin in the same formulation. In thermo-oxidative aging, due to the higher temperature

Polímeros, 32(3), e2022036,

Carpenedo, G. A., Guerra, N. B., Giovanela, M., De Paoli, M. A., & Crespo, J. S.
2022 6/8
Figure 5. Retention of the properties of (a) tensile strength, (b) tear strength relative to the properties before aging (the dotted line corresponds to 100%) and (c) additive content in formulations aged ozone for 6, 12 and 24 h.

Evaluation of lignin as stabilizer in vulcanized natural rubber formulations

(100 °C) there was a greater decrease in the mechanical properties and consumption of stabilizer. However, even with a significant loss of properties, formulations with different stabilizers showed similar results. In photo-oxidative aging, the samples with the least reduction of properties were those that used the combination of three stabilizing agents (6PTC and 6PLC). In the accelerated aging with ozone, the samples showed greater retention of properties, so they were more resistant to aging. According to the results, we conclude that lignin has the potential to be used as a stabilizer, replacing the synthetic stabilizers currently used, because its use in vulcanized NR formulations did not impair the performance of elastomeric artifacts. This result is financially and environmentally beneficial, as there are companies that generate lignin as a by-product, as well as companies that consume bio-based raw materials.

5. Author’s Contribution

• Conceptualization – Marco Aurelio De Paoli; Janaina da Silva Crespo.

• Data curation – NA.

• Formal analysis – Gelsa Adriana Carpenedo.

• Funding acquisition – NA.

• Investigation – Gelsa Adriana Carpenedo.

• Methodology – Gelsa Adriana Carpenedo; Marco Aurelio De Paoli; Janaina da Silva Crespo.

• Project administration – Marco Aurelio De Paoli; Janaina da Silva Crespo.

• Resources – NA.

• Software – NA.

• Supervision – Marco Aurelio De Paoli; Janaina da Silva Crespo.

• Validation – Gelsa Adriana Carpenedo.

• Visualization – NA.

• Writing – original draft – Gelsa Adriana Carpenedo.

• Writing – review & editing – Gelsa Adriana Carpenedo; Nayrim Brizuela Guerra; Marcelo Giovanela; Marco Aurelio De Paoli; Janaina da Silva Crespo.

6. Acknowledgements

The authors would like to thank the Vipal Borrachas S.A. Company and Coordenação de Aperfeiçoamento de Pessoal de Nível Superior (PROSUC funding) and Conselho Nacional de Desenvolvimento Científico e Tecnológico (CNPq) for their technical and financial support. Marco Aurelio De Paoli acknowledges a senior researcher fellowship from CNPq (Process Nr. 301933/2015-4).

7. References

1 Guerra, N. B., Pegorin, G. S., Boratto, M. H., Barros, N. R., Graeff, C. F. O., & Herculano, R. D. (2021). Biomedical applications of natural rubber latex from the rubber tree Hevea brasiliensis. Materials Science and Engineering C, 126, 112126 http://dx.doi.org/10.1016/j.msec.2021.112126 PMid:34082943.

Polímeros, 32(3), e2022036, 2022

2 Zhao, X., Hu, H., Zhang, D., Zhang, Z., Peng, S., & Sun, Y. (2019). Curing behaviors, mechanical properties, dynamic mechanical analysis and morphologies of natural rubber vulcanizates containing reclaimed rubber. E-Polymers, 19(1), 482-488 http://dx.doi.org/10.1515/epoly-2019-0051

3 Manaila, E., Stelescu, M. D., & Craciun, G. (2018). Degradation studies realized on natural rubber and plasticized potato starch based eco-composites obtained by peroxide cross-linking. International Journal of Molecular Sciences, 19(10), 2862 http://dx.doi.org/10.3390/ijms19102862 PMid:30241399.

4 Galiani, P. D., Malmonge, J. A., Soares, B. G., & Mattoso, L. H. C. (2013). Studies on thermal-oxidative degradation behaviours of raw natural rubber: PRI and thermogravimetry analysis. Plastics, Rubber and Composites, 42(8), 334-339 http://dx.doi.org/10.1179/1743289811Y.0000000046.

5 Radhakrishnan, C. K., Alex, R., & Unnikrishnan, G. (2006). Thermal, ozone and gamma ageing of styrene butadiene rubber and poly(ethylene-co-vinyl acetate) blends. Polymer Degradation & Stability, 91 (4), 902-910 http://dx.doi. org/10.1016/j.polymdegradstab.2005.06.013

6 Fainleib, A., Pires, R. V., Lucas, E. F., & Soares, B. G. (2013). Degradation of non-vulcanized natural rubber: renewable resource for fine chemicals used in polymer synthesis. Polímeros, 23(4), 441-450. http://dx.doi.org/10.4322/polimeros.2013.070.

7 Chatterjee, A. K. (2003). Applications in organic synthesis. In R. B. Grubbs (Ed.), Handbook of Metathesis (pp. 2246-2295). Weinheim: Wiley-VCH

8 Carpenedo, G. A., Demori, R., Carli, L. N., Giovanela, M., Paoli, M. A. D., & Crespo, J. S. (2020). Evaluation of stabilizing additives content in the mechanical properties of elastomeric compositions subject to environmental and accelerated aging. Materials Research, 23(5), e20201039 http://dx.doi. org/10.1590/1980-5373-mr-2020-0139.

9 Barana, D., Ali, S. D., Salanti, A., Orlandi, M., Castellani, L., Hanel, T., & Zoia, L. (2016). Influence of Lignin Features on Thermal Stability and Mechanical Properties of Natural Rubber Compounds. ACS Sustainable Chemistry & Engineering, 4(10), 5258-5267 http://dx.doi.org/10.1021/acssuschemeng.6b00774

10 Giese, U., Hahn, H., & Thust, S. (2017). Degradation and stabilization of elastomers. Nippon Gomu Kyokaishi, 91(7), 227-231 http://dx.doi.org/10.2324/gomu.91.227

11. Sabaa, M. W., Madkour, T. M., & Yassin, A. A. (1998). Polymerization products of p-benzoquinone as bound antioxidants for SBR. Part II: the antioxidizing efficiency. Polymer Degradation & Stability, 22(3), 205-222 http://dx.doi. org/10.1016/0141-3910(88)90011-0

12 De Paoli, M. A. (2009). Degradação e estabilização de polímeros São Paulo: Artliber

13 Roy, K., Debnath, S. C., & Potiyaraj, P. (2020). A review on recent trends and future prospects of lignin based green rubber composites. Journal of Polymers and the Environment, 28(2), 367-387 http://dx.doi.org/10.1007/s10924-019-01626-5

14 Li, G.-Y., & Koenig, J. L. (2005). A review of rubber oxidation. Rubber Chemistry and Technology, 78(3), 355-390 http:// dx.doi.org/10.5254/1.3547889

15 Furlan, L. T., Rodrigues, M. A., & De Paoli, M.-A. (1985). Sugar cane bagasse lignin as stabilizer for rubbers: part III—Styrene/ butadiene rubber and natural rubber. Polymer Degradation & Stability, 13(4), 337-350. http://dx.doi.org/10.1016/01413910(85)90082-5.

16 Sharj-Sharifi, M., Taghvaei-Ganjali, S., & Motiee, F. (2020). The effect of protecting waxes on staining antidegradant performance in tyre sidewall formulation. Journal of Rubber Research, 23(2), 111-124 http://dx.doi.org/10.1007/s42464020-00042-y

7/8

Carpenedo, G. A., Guerra, N. B., Giovanela, M., De Paoli, M. A., & Crespo, J. S.

17 Sulekha, P. B., Joseph, R., & Prathapan, S. (2001). Synthesis and characterization of chlorinated paraffin wax-bound paraphenylenediamine antioxidant and its application in natural rubber. Journal of Applied Polymer Science, 81(9), 2183-2189 http://dx.doi.org/10.1002/app.1654

18 Sarkar, P., & Bhowmick, A. K. (2018). Sustainable rubbers and rubber additives. Journal of Applied Polymer Science, 135(24), 45701-45712 http://dx.doi.org/10.1002/app.45701

19. Arabit, J., & Pajarito, B. B. (2015). Effect of ingredient loading on surface migration of additives in a surfactant-loaded natural rubber vulcanizate. Advanced Materials Research, 1125, 64-68 http://dx.doi.org/10.4028/www.scientific.net/AMR.1125.64

20 Yehia, A. A., Khalifa, W. D., & Ghanem, N. A. (1971). Compounding and testing of weather resistant rubber-I antioxidant effects on the accelerated light-ageing of rubbers of different network structures. European Polymer Journal, 7(5), 549-557 http://dx.doi.org/10.1016/0014-3057(71)90086-3

21 American Society for Testing and Materials – ASTM. (2019). ASTM D3895-19: standard test method for oxidative: induction time of polyolefins by differential scanning calorimetry. West Conshohocken: ASTM

22 American Society for Testing and Materials – ASTM. (2007). ASTM D624-00R07: standard test method for tear strength of conventional vulcanized rubber and thermoplastic elastomers. West Conshohocken: ASTM.

23 American Society for Testing and Materials – ASTM. (2006). ASTM D412-06: standard test methods for vulcanized rubber and thermoplastic elastomers: tension. West Conshohocken: ASTM.

24 American Society for Testing and Materials – ASTM. (2010). ASTM D572-04R10: standard test method for rubber-deterioration by heat and oxygen. West Conshohocken: ASTM

25 American Society for Testing and Materials – ASTM. (2006). ASTM G154-06: standard practice for operating fluorescent light apparatus for UV exposure of nonmetallic materials. West Conshohocken: ASTM

26 American Society for Testing and Materials – ASTM. (2007). ASTM D1149-07: standard test method for rubber deterioration: surface ozone cracking in a chamber. West Conshohocken: ASTM

27 American Society for Testing and Materials – ASTM. (1996). ASTM D3156-96: standard practice for rubber: chromatographic analysis of antidegradants (antioxidants, antiozonants and stabilizers). West Conshohocken: ASTM

28 Parra, D. F., Freire, M. T. A., & De Paoli, M.-A. (2000). Diffusion of amine stabilizers in vulcanized natural rubber compositions used in tires. Journal of Applied Polymer Science, 75(5), 670-676 http://dx.doi.org/10.1002/(SICI)10974628(20000131)75:5<670::AID-APP9>3.0.CO;2-K.

29 Cataldo, F. (2000). On the ozone protection of polymers having non-conjugated unsaturation. Polymer Degradation & Stability, 72(2), 287-296. http://dx.doi.org/10.1016/S01413910(01)00017-9

30 Khinnavar, R. S., & Aminabhavi, T. M. (1991). Diffusion and sorption of organic liquids through polymer membranes. I. Polyurethane versus n-alkanes. Journal of Applied Polymer Science , 42 ( 8 ), 2321 - 2328 http://dx.doi.org/10.1002/ app.1991.070420823

31 Wei, H., Zhou, J., Zheng, J., & Huang, G. (2015). Antioxidation efficiency and reinforcement performance of precipitated-

silica-based immobile antioxidants obtained by a sol method in natural rubber composites. RSC Advances, 5(112), 9234492353 http://dx.doi.org/10.1039/C5RA15435A

32 Yu, P., He, H., Jia, Y., Tian, S., Chen, J., Jia, D., & Luo, Y. (2016). A comprehensive study on lignin as a green alternative of silica in natural rubber composites. Polymer Testing, 54, 176185 http://dx.doi.org/10.1016/j.polymertesting.2016.07.014

33 Barbosa , R. , Nunes , A. T. , & Ambrósio , J. D. (2017 ). Devulcanization of Natural Rubber in Composites with Distinct Crosslink Densities by Twin-Screw Extruder. Materials Research, 20(Suppl. 2), 77-83 http://dx.doi.org/10.1590/19805373-mr-2016-0956

34 Jiang, C., He, H., Yao, X., Yu, P., Zhou, L., & Jia, D. (2015). In situ dispersion and compatibilization of lignin/epoxidized natural rubber composites: reactivity, morphology and property. Journal of Applied Polymer Science, 132(23), 42044 http:// dx.doi.org/10.1002/app.42044

35 Ahagon, A., Kida, M., & Kaidou, H. (1990). Aging of tire parts during service. I. Types of aging in heavy-duty tires. Rubber Chemistry and Technology, 63(5), 683-697 http:// dx.doi.org/10.5254/1.3538282

36 Escócio, V. A., Martins, A. F., Visconte, L. L. Y., & Nunes, R. C. R. (2004). Effect of ageing on mechanical and dynamic mechanical properties of natural rubber compositions with mica. Polímeros: Ciência e Tecnologia, 14(1), 13-16

37. Oliani, W. L., Parra, D. F., & Lugão, A. B. (2010). UV stability of HMS-PP (high melt strength polypropylene) obtained by radiation process. Radiation Physics and Chemistry, 79(3), 383-387 http://dx.doi.org/10.1016/j.radphyschem.2009.08.037

38 Oßwald, K., Reincke, K., Döhler, S., Heuert, U., Langer, B., & Grellmann, W. (2010). Aspects of the ageing of elastomeric materials. International Polymer Science and Technology, 44(12), 1-10. http://dx.doi.org/10.1177/0307174X1704401201.

39 Mathew, N. M., & De, S. K. (1983). Thermo-oxidative ageing and its effect on the network structure and fracture mode of natural rubber vulcanizates. Polymer, 24(8), 1042-1054 http:// dx.doi.org/10.1016/0032-3861(83)90158-1

40 Cataldo, F., Faucette, B., Huang, S., & Ebenezer, W. (2015). On the early reaction stages of ozone with N,N′-substituted p-phenylenediamines (6PPD, 77PD) and N,N′,N″-substituted1,3,5-triazine “Durazone®”: an electron spin resonance (ESR) and electronic absorption spectroscopy study. Polymer Degradation & Stability, 111, 223-231 http://dx.doi.org/10.1016/j. polymdegradstab.2014.11.011

41 Douminge, L., Feaugas, X., Bernard, J., & Mallarino, S. (2013). Extrinsic fluorescence as a sensitive method for studying photo-degradation of high density polyethylene correlated with mechanical stresses. Current Applied Physics, 13(8), 1751-1757 http://dx.doi.org/10.1016/j.cap.2013.06.027

42. Varghese, S., Kuriakose, B., & Thomas, S. (1994). Short sisal fibre reinforced natural rubber composites: high-energy radiation, thermal and ozone degradation. Polymer Degradation & Stability, 44(1), 55-61 http://dx.doi.org/10.1016/01413910(94)90032-9.

Received: Aug. 04, 2022

Revised: Sept. 12, 2022

Accepted: Sept. 21, 2022

Polímeros, 32(3), e2022036,

2022 8/8

ZwickRoell Science Award & Academia Day

Publicou descobertas científicas notáveis relacionadas com materiais ou ensaios de componentes recentemente? O prémio ZwickRoell Science Award reconhece autores de artigos científicos que relatam sobre inovações para o mundo dos ensaios de materiais com a utilização de máquinas de ensaios.

Prêmios:

• 1º lugar: Paul Roell Medal and €5,000

• 2º lugar: €2,000

Quem pode participar?

Qualquer autor de um artigo científico (não importa se ainda estiver cursando a Universidade). Quais trabalhos científicos podem ser inscritos?

• 3º lugar: €1,000 info.br@zwickroell.com

Podem participar com praticamente qualquer trabalho, ex. artigos de pesquisa, pôsteres e artigos científicos (artigos publicados já revisados por banca). É permitido inscrever mais de um trabalho. Que tipo de documento pode ser enviado para participar? O artigo (máx. 15 páginas), ou pôster, um CV resumido e fotos e/ou vídeos (se houver). Caso seja uma tese de mestrado, dê preferência ao artigo. Resumo em Inglês de no máximo 10 páginas com foco para parte dos “ensaios de materiais” da tese, poderá ser aceito também.

Pode-se participar apenas quando um equipamento ZwickRoell for utilizado? Não, todas as marcas de equipamentos para ensaios de materiais podem ser utilizados no trabalho. zwickroell.com/pt

São Paulo 994 St. São Carlos, SP, Brazil, 13560 -340 Phone: +55 16 3374-3949 Email: abpol@abpol.org.br 2021

Turn static files into dynamic content formats.

Create a flipbook
Issuu converts static files into: digital portfolios, online yearbooks, online catalogs, digital photo albums and more. Sign up and create your flipbook.