28 INDUSTRY-SUPPLIED CONTENT AW JULY 2021
Analytics Overload: Why You’re Confused And if you aren’t confused, you aren’t paying attention!
P
rocess manufacturing operations may be oversimplified as entailing raw materials, a production process, and finished goods. The same model can be applied to using production data to improve process and business outcomes: data, analytics, and insights. The issue is the value of insights is so high that enthusiasm for claiming credit for the “analytics” between data and insights has gotten out of control. Analytics, the systematic computational analysis of data or statistics (according to Merriam Webster), derives from the Greek analýein, which means “to loosen, dissolve, or resolve into constituent elements.” Leave it to marketing to mess up what Aristotle taught almost 2500 years ago. The result is “analytics” is now everything and everywhere in software products, platforms, and cloud services. You’d be hard pressed to find software that doesn’t claim analytics features or benefits as part of its offering. The abuse of this benign word means it’s difficult to tell what analytics means, what’s included, or what’s required. To overcome this, “analytics” is now frequently qualified to
define the exact type of analytics, a trend which can be broken into three categories.
Advanced and augmented analytics
First, there is the trend towards modern analytics that taps innovation in data science and computing resources; for example “advanced analytics,” which has come into use in the last several years. McKinsey & Company defines advanced analytics as “the application of statistics and other mathematical tools to business data in order to assess and improve practices ... [users can use advanced analytics] to take a deep dive into historical process data, identify patterns and relationships among discrete process steps and inputs, and optimize the factors that prove to have the greatest effect on yield. The issue with this definition is that it assumes a user has the skills for the statistics or machine learning or other technologies required to leverage advanced analytics. Therefore, Gartner has begun using the term augmented analytics, which taps the
By Michael Risse, Vice President and Chief Marketing Officer, Seeq Corporation
same innovation themes but puts the analytics in the context of the user experience with business intelligence applications or tools. As Gartner explains: Augmented analytics is the use of enabling technologies such as machine learning and artificial intelligence to assist with data preparation, insight generation, and insight explanation to augment how people explore and analyze data in analytics and business intelligence platforms. Perhaps the best example of augmented analytics is the simple Google Search Bar— the user doesn’t have to know what computations are taking place behind the web page they use to get results.
Iteration required
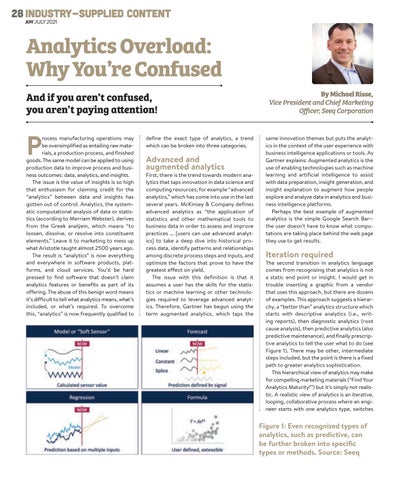
The second transition in analytics language comes from recognizing that analytics is not a static end point or insight. I would get in trouble inserting a graphic from a vendor that uses this approach, but there are dozens of examples. This approach suggests a hierarchy, a “better than” analytics structure which starts with descriptive analytics (i.e., writing reports), then diagnostic analytics (root cause analysis), then predictive analytics (also predictive maintenance), and finally prescriptive analytics to tell the user what to do (see Figure 1). There may be other, intermediate steps included, but the point is there is a fixed path to greater analytics sophistication. This hierarchical view of analytics may make for compelling marketing materials (“Find Your Analytics Maturity!”) but it’s simply not realistic. A realistic view of analytics is an iterative, looping, collaborative process where an engineer starts with one analytics type, switches
Figure 1: Even recognized types of analytics, such as predictive, can be further broken into specific types or methods. Source: Seeq
2107_F4.indd 28
6/24/21 9:05 AM


