

Resource Circularity
Reimagining Cities as Regenerative Ecosystems

Preface
Executive Summary
Introduction
Policy Frameworks
Market Analysis

Ecological and Environmental Impact
Technical Analysis and Guidelines
Design Implementation and Human Experience
Conclusions and Recommendations
Appendices
Appendix A: Publication List
Appendix B: Sources
Appendix C: Supplementary Data
Acknowledgments
Funding for this project has been provided by Agriculture and Agri-Food Canada through the Agricultural Clean Technology (ACT) Program
Matching funding for this project was provided by Perkins&Will and the BC Centre for Agritech Innovation (BCCAI).
The research team would also like to thank the following organizations for their valuable partnership and support. Their contributions were integral to the success of this project.
Agritecture
Bubbly Dynamics (The Plant)
City of Vancouver
Framlab
kono Deisgns
Quanto Tech Ltd
Simon Fraser University
The Growcer Inc.
University of British Columbia
University of Oregon
University of the Fraser Valley
Contributers
Perkins&Will Team
Mohamed Imam, Senior Research Lead
Yehia Madkour, Director of Innovation
Cheney Chen, Senior Research Lead
Amy Brander, Regenerative Design Advisor
Tyrone Marshall, Senior Research Lead
Nicole Pfeifer, Sustainable Design Advisor
Juan Rovalo, Director of Ecology
Tatiana Kaida, Designer III
Sam Ibrahim, Urban Designer II
Janna Fahmy, Designer I
Brainard Amay, Marketing Coordinator
Perkins&Will Review
Leigh Christy, Director of Research, Principal
Kimberly Seigel, Research Manager
Kathy Wardle, Regional Director of Regenerative Design, Principal
Jesce Walz, Senior Research Lead
Enlai Hooi, Head of Innovation
Myer Harrell, Senior Regenerative Design Advisor
Phaedra Svec, Director of Regenerative Design
Workshops Team
Aaron Knorr, Senior Architect
Aik Ablimit, Senior Architect
Alex Buss, Senior Architect
Cillian Collins, Senior Architect
Eli Wolpin, Senior Architect
Fargol Moshiri, Technical Coordinator
Jason Leblanc, Director of Urban Design
Johanna Becker, Architect III
Kevin Casey, Architect III
Laurence Rumble, Senior Project Manager
Manuela Londono Suarez, Senior Regenerative Design Advisor
Marco Mandelli, Project Architect
Negin Shakibi, Senior Urban Designer
Shiva Honarvar, Sustainable Design Advisor II
Stephanie Matkaluk, Project Architect
Academic, Industry & Policy Advisors
University of the Fraser Valley (UFV)
Alesandros Glaros, Vertical Agriculture Research Lead
Charmaine White, Assistant, Food and Agriculture Institute
Stefania Pizzirani, Associate Director, Food and Agriculture Institute
University of British Columbia (UBC)
Bridgette Kelly, Architecture Dual-Degree Student
Daniel Roehr, Professor and Chair, Landscape Architecture
Kevin Wong, Architecture Dual-Degree Student
Robert Ferguson, Architecture Dual-Degree Student
Simon Fraser University (SFU)
Zohreh Hassanpour Kahnamouei, Designer at Computational Design Lab
Halil Erhan, Professor, Director of Computational Design Lab
University of Oregon (UoO)
Aidan Teppema, Graduate Research Fellow
Gwynne Mhuireach, Assistant Professor
University of Guelph
Ajwal Dsouza, Ph.D. Candidate, Controlled Environment Systems
BC Centre for Agriculture Innovation (BCCAI)
Laila Benkrima. Ph.D., Agronomist Consultant
Micheal Bolu, Project Manager
Alycia Van der Gracht, Founder, Quanto tech
Chadd Bauman, Co-Founder Circular Harvest
Corey Ellis, Co-Founder & CEO, The Growcer Inc.
David Ceaser, Lead Agronomist, Agritecture
Emily Van Halem, Social Planner City of Vancouver
Erin Nichols, Senior Project Manager City of Vancouver
Henry Lau, Social Planner City of Vancouver
Jason Wegman, gökotta studio + lab
Kristina Zalite, Landscape Architect, Zale Design
Kyle Born, Co-Founder Circular Harvest
Laura Marie Neubert, Founder of UpFront
Peter Van der Gracht, Quanto tech
Sayon Chandrakanthan, Founder of Advanced Autoponics
List of Figures
Figure
Figure 3: Food systems contribution to global anthropogenic GHG emissions. Source EDGAR-FOOD,
Figure 4: Food waste comparison across North America, MENA, and Latin America. Adapted from World Resource
Figure
Figure 7: Farming systems examined in this report. Adapted from Dorr, Goldstein, Horvath, Aubry, & Gabrielle, 2021 and Benis, Gashgari, Alsaati, & Reinhart, 2018.
Figure 8: Soil-based green roof types and requirements. Adapted from Gundula Proksch,
Figure 9: Urban agriculture taxonomy. Adapted from Dorr, Goldstein, Horvath, Aubry, & Gabrielle, 2021 and Benis, Gashgari, Alsaati, & Reinhart,
Figure 34: Pasona Group Headquarters, Tokyo, Japan. Interior farming activities. Image courtesy of Kono Design..
Figure 35: Gotham Greens, Davis, CA. Image by Jim Heaphy (Creative Commons).. .........................................................................87
Figure 36: Systems diagram of The Growcer Inc. modular farm..
Figure 37: The Growcer Inc.
Figure 38: The Growcer Inc. modular containar farm interior hydropnic system..
Figure 39: Comparative performance of vertical farms vs. greenhouses for lettuce and tomatoes across key operational categories in Vancouver, BC.. .......................................................................................................................................................................
Figure 40: Comparison of net profit and payback periods (in CAD) for vertical farms vs. greenhouses across selected cities..
Figure 41: Operational cost comparison (in CAD) for vertical farms and greenhouses by crop and city.. ......................................
Figure 42: The carbon cycle. Adapted from Proksch, 2017..
Figure 43: Perkins&Will, Skeena Terrace, Vancouver, BC. Rooftop urban farming integrated into the BC Housing project.. ........
Figure 44: Perkins&Will, systems diagram of Skeena Terrace, Vancouver, BC..
Figure 45: Vancouver Plan, 2022, future ecological corridors with Skeena Terrace highlighted.. ....................................................
Figure 46: Tree retention plan for Skeena
:
Figure 48: GeoMap section showing Vancouver, BC. Skeena Terrace indicated by red circle. Source Turner & Clague,
Figure 49: Food miles and sourcing for British Columbia. Tomato and lettuce imports from the USA. Source Canada Food Flows,
Figure 50: Total trade volume (kg) and supply share of lettuce and tomatoes. Source from Canada Food Flows, 2024..
Figure 51: Perkins&Will, Skeena Terrace, Vancouver, BC.
: Temperature
: Cross-comparison of
Figure 64: Perkins&Will, Skeena Terrace, Vancouver, BC. Urban farming integrated into the BC Housing project..
Figure 66: Perkins&Will, 800 Granville proposal, Vancouver, BC. Sky gardens across the building core..
Figure 67: LCA studies dataset farm operations reviewed, yield, grow area, and production volumes..
Figure 68: Energy, water use, and operational carbon values per square meter and kg crop.. 163
Figure 69: EUIa and EUIb energy use breakdown across common infrastructure types. . .................................................................
Figure 70: Relative performance indicators by farm type as a percentage of total category values..
Figure 71: Carbon emission equivalents by life cycle phase across different farm types...................................................................
Figure 72: BIA system boundary and Sankey diagram illustrating relative carbon flows. Grey zones are excluded due to data limitations; post-farmgate transport is not quantified, consistent with the BIA LCA framework in Table 32..
Figure 73: Hypothetical systems diagram of a circular waste-to-resource ecosystem.. 169
Figure 74: Perkins&Will, Daphne Cockwell Health Sciences Complex, Toronto Metropolitan University, Toronto, ON.. 173
Figure 75: Typology breakdown (government, office/workplace, health services, hospitality, and retail), and associated waste stream potential..
Figure 76: Typology breakdown (manufacturing, science and technology, waste treatment plants, educational) and associated waste stream potential.. ..........................................................................................................................................................
Figure 77: Typology breakdown (mixed use, apartments, and event spaces) and associated waste stream potential..
Figure 78: Comparison of HVAC energy use (GJ/year) with and without ERV across Canadian cities. Illustrates waste heat recovery potential. Source from Natural Resources Canada, 2024..
Figure 79: Perkins&Will,
:
Figure 83: Location of Quanto
:
Figure 85: Quanto Tech system diagram illustrating the symbiosis between the vertical farm and the mushroom chambers..
Figure 87:
Figure 92: Perkins&Will, Hudson’s Bay Company, Vancouver, BC. Proposed design featuring three integrated food assets responding
Figure 98: Pasona Group Headquarters, Tokyo, Japan. Interior farming activities. Image courtesy of Kono Design..
Figure 99: Location of Framlab’s conceptual Glasir design, Brooklyn,
Figure 100: Glasir modular farm system components..
Figure 101: Glasir modular farm system diagram..
Figure 102: Expanded Glasir modular farm system layout..
Figure 103: Conceptual illustration of Glasir modular farm design.. ...................................................................................................
Figure 104: Location of Pasona Group Headquarters, Tokyo, Japan. Design by Kono Design..
Figure 105: Pasona Group Headquarters, Tokyo, Japan. Urban farm system components.. ..........................................................
Figure 106: Pasona Group Headquarters, Tokyo, Japan. Interior farm partitions. Image courtesy of Kono Design..
Figure 107: Pasona Group Headquarters, Tokyo, Japan. Exterior vertical farm façade. Image courtesy of Kono Design.. .......
Figure 108: Pasona Group Headquarters, Tokyo, Japan. Urban farm systems diagram..
Figure 109: Pasona Group Headquarters, Tokyo, Japan. Urban farm systems diagram.. ...............................................................
Figure 110: Pasona Group Headquarters, Tokyo, Japan. Urban agriculture systems diagram..
Figure 111: Pasona Group Headquarters, Tokyo, Japan. Interior farming activities. Image courtesy of Kono Design.. ...............
Figure 112: Mycelium production process by Joseph Dahmen, Associate Professor, SALA, University of British Columbia..
Figure 113: Perkins&Will, Daphne Cockwell Health Sciences Complex, Toronto Metropolitan University, Toronto, ON.. .............
Figure 114: Perkins&Will, Daphne Cockwell Health Sciences Complex, Toronto Metropolitan University, Toronto, ON..
Figure 115: Perkins&Will, Daphne Cockwell Health Sciences Complex, Toronto Metropolitan University, Toronto, ON..
Figure 116: Perkins&Will, VanDusen Botanical Garden Visitor Centre, Vancouver Board of Parks and Recreation, Vancouver, BC..
Figure 117: Perkins&Will, Albion Library, Toronto Public Library, Toronto, ON.. ...................................................................................
Table
Table 37: Indoor water consumption baseline (per person per day). Adapted from U.S. Green Building Council, 2025.
Table 38: Estimated wastewater volumes and their nutrient content, compiled from Statistics Canada (2024), EPA (2009), and Usman et al. (2024).
Table 39: Technologies reviewed and their associated assessment criteria.
Table 40: Case study analysis and compiled dataset of BIA projects. This dataset supports the analysis presented in Chapter V, Pillar 1 Data-Driven Insights.
Table 41: Life Cycle Assessment (LCA) data set compiled per square meter. This dataset supports the analysis presented in Chapter V, Pillar 2 Metric Pairing-Bridging Two Industries. ..............................................................................
Table 42: Life Cycle Assessment (LCA) data set compiled per kg crop. This dataset supports the analysis presented in Chapter V, Pillar 2 Metric Pairing-Bridging Two Industries.
Table 43: Compiled data from market studies reviewed in this research. This dataset supports the analysis presented in Chapter III, Economic Feasibility BIA Performance Across 8 Cities.
181
191
194
272
276
278
280
Glossary
Aerated Static Piles (ASP): Composting method using forced air through perforated pipes, eliminating the need for mechanical turning. Suitable for medium-scale operations with moderate process control.
Aerobic Digesters: Systems that use oxygen to break down organic waste into stabilized solids. Common in institutional or municipal settings; odor is low, but no energy is recovered.
Aeroponics: A soil-less farming technique where plant roots are suspended in air and misted with a nutrientrich solution.
Algal Photobioreactors (PBR): Enclosed systems that grow microalgae to treat wastewater and capture CO₂ through photosynthesis.
Anaerobic Digesters: Oxygen-free systems that convert organic waste into biogas and nutrient-rich digestate. Scalable and often used for renewable energy generation.
Aquaponics: A combined system of fish farming and hydroponics where fish waste provides nutrients for plant growth, and plants purify the water.
Bio-Based Catatonic Flocculant: Natural, positively charged agents (e.g., from starches or oils) that coagulate suspended materials in wastewater.
Biochar: A carbon-rich soil amendment produced from organic material via pyrolysis, improving soil fertility and water retention.
Biochar Production: Thermal conversion of biomass into biochar using pyrolysis or gasification. Often co-produces heat or gas for energy.
Biodiversity Corridors: Connected habitats that allow wildlife movement and promote species diversity.
Black Soldier Fly (BSF) Composting: A composting method using larvae to convert food waste into protein and fertilizer. Effective for high-fat or meat-based inputs.
Carbon Sequestration: Capturing and storing atmospheric carbon dioxide in plants, soil, or biomass to mitigate climate change.
Closed-Loop Irrigation System: A water-saving system that captures, filters, and recycles irrigation water.
Composting Toilets: Dry sanitation systems that convert human waste into compost via aerobic decomposition, separating urine and feces to reduce odor.
Controlled Environment Agriculture (CEA): High-tech farming in fully enclosed systems where light, temperature, humidity, and nutrients are precisely controlled.
Cover Cropping: Planting crops like clover or legumes to improve soil health, prevent erosion, and add nutrients during off-seasons.
Energy Demand: The amount of energy (electricity, gas, oil) required for crop production.
Eutrophication: Excessive algae growth in water bodies caused by nutrient runoff, leading to oxygen depletion and ecosystem damage.
Food Miles: The distance food travels from production to consumption, influencing its environmental footprint.
Greenhouse Gas (GHG) Emissions: Gases like carbon dioxide and methane that trap heat in the atmosphere and contribute to global warming.
Growing Medium: The material used to support plant roots, such as soil, coir, perlite, or rockwool. Varies by production system.
Harvest Process: The method of collecting mature crops. In urban agriculture, this is typically manual due to limited mechanization at scale.
Hydroponics: A method of growing plants in nutrient-rich water without soil. Common in vertical and indoor farms.
Intercropping: Growing two or more crops together to increase biodiversity and optimize space and resource use.
Last-Mile Distribution: The final leg of food delivery, from distribution hub to consumer, often affecting cost and emissions.
Membrane Bioreactors (MBR): Advanced systems combining biological treatment with membrane filtration to produce high-quality reusable wastewater.
Monocropping: Growing the same crop repeatedly on the same land, often leading to reduced soil fertility and pest resilience.
Mycorrhizal Fungi: Fungi that form symbiotic relationships with plant roots, improving nutrient uptake and soil structure.
Nutrient Leaching: Loss of nutrients from soil due to excessive watering or rainfall, often leading to water contamination.
Organic Matter: Decomposed plant and animal material in soil that improves structure, fertility, and microbial health.
Planetary Boundaries: A scientific framework identifying nine critical Earth system processes (such as climate change, biodiversity loss, and freshwater use) within which humanity can safely operate. Crossing these boundaries increases the risk of large-scale environmental instability.
Rooftop Greenhouse (RG): A greenhouse installed on a building roof to grow food under controlled conditions.
Soil-Based UA Systems (SB): Traditional growing systems using soil, often found in community gardens or open lots.
Soil Compaction: Compression of soil that limits aeration and root growth, typically caused by heavy machinery or overuse.
Soil Degradation: Decline in soil health due to erosion, nutrient loss, or pollution.
Soil Erosion: Displacement of topsoil by wind or water, reducing soil productivity and ecosystem function.
Stormwater Runoff: Rainwater that flows over impervious surfaces, carrying pollutants into natural water bodies.
Synthetic Fertilizers: Manufactured chemical nutrients used to promote plant growth. Can cause water pollution and soil degradation if overused.
Three-Dimensional Planting: Layered planting systems, such as trellises or vertical towers, to maximize yield in limited spaces.
Urban Agriculture (UA): Food production within urban environments, including community gardens, green roofs, and indoor farms.
Urban Heat Island Effect (UHI): Higher temperatures in urban areas caused by built surfaces absorbing and retaining heat.
Urine Source Separation (USS): The practice of diverting urine at the source to recover nutrients for reuse in fertilizers.
Vermicomposting: Composting organic waste using worms, producing nutrient-rich castings.
Vertical Farm (VF): A multi-level farming system using stacked surfaces, often indoors, with hydroponic or aeroponic methods.
Waste: By-products of farming operations, including plant waste and packaging, either composted, reused, or sent to landfill.
Waste Heat Recovery Technologies: Systems that capture heat from used water or exhaust to pre-warm incoming water, improving energy efficiency.
Water Demand: Total irrigation needs, including water from rain or potable sources.
Windrow Composting: Composting in long, turned piles; effective but requires space and regular management.
Abbreviation
BIA Building Integrated Agriculture
CAGR Compound Annual Growth Rate
CAPEX Capital Expenditures
CEA Controlled Environment Agriculture
CUA Commercial Urban Agriculture
EUI Energy Use Intensity
FAO Food and Agriculture Organization of the United Nations
GHGI Greenhouse Gas Intensity
H Herbs (focused on basil)
HVAC Heating-Ventilation and Air Conditioning
LCA Life Cycle Assessment
LED Light Emitting Diode
LG Leafy Greens (focused on Lettuce)
LUE Light Use Efficiency
NFT Nutrient Film Technique
OPEX Operational Expenditure
R&D Research and Development
TEDI Thermal Energy Demand Intensity
UA Urban Agriculture
USDA United States Department of Agriculture
VC Vining Crops (focused on Tomatoes)
WUI Water Use Intensity
Executive Summary
This
study examines the feasibility of Building-Integrated
Agriculture (BIA)
systems and their agency in facilitating regenerative cities through a crosssector analysis, interviews with BIA system providers, review of local and national policies, and evaluation of case studies and their associated performance data.
Our Approach
The findings reveal that while BIA systems offer compelling environmental and urban resilience benefits, their economic and regulatory frameworks remain underdeveloped. A shift from conceptual support to structural integration—across land-use planning, infrastructure policy, and investment mechanisms—is essential for scaling in urban centres.
Over the past decade, interest in BIA has intensified as cities seek local strategies for climate adaptation, food security, and circular economy development. BIA positions the built environment as a productive asset—integrating food systems, waste recovery, water reuse, and renewable energy into underutilized urban surfaces. However, despite growing pilot projects and policy ambitions, BIA is not mainstream, hindered by fragmented regulations, opaque performance metrics, and market immaturity.
Unlike conventional urban agriculture (UA), which is often soil-based and decentralized, BIA systems are defined by their architectural integration, higher yields per area, and frequent reliance on controlled-environment technologies. These systems typically involve high capital expenditures and annual operational expenditures driven largely by energy and maintenance costs. Food production is concentrated in high-turnover crops such as leafy greens and herbs, reflecting their short cycles, high harvest index, and compatibility with modular cultivation systems.
Energy and Environmental Performance
Although vertical and rooftop farms can reach high production rates, their resource intensity and dependency on energy raise environmental performance questions. For instance, lighting and HVAC loads account for 40–70% of total energy consumption in indoor BIA systems, leading to higher energy intensities relative to open-field agriculture, particularly in regions with carbon-intensive grids.
While new energy-efficient technologies (e.g., dynamic LED lighting, climate control algorithms, heat recovery systems) offer performance gains, the report shows that access to clean, affordable, and reliable energy remains a critical limiting factor. Most BIA operators interviewed identified energy costs as their highest operational risk, with some projects reporting over 50% of OpEx dedicated to electricity. In this context, climate resilience is linked to energy resilience, systems that can integrate renewables and reduce thermal vulnerability are better positioned to withstand both climatic and economic shocks.
Market Viability and Business Models
On the market side, BIA remains a marginal contributor to food supply and a high-cost producer relative to conventional agriculture. While direct-to-consumer sales, institutional contracts, and education programs offer supplementary revenue streams, few operators achieve breakeven solely through produce sales. This has led to a proliferation of hybrid models combining food production with research, tourism, and education.
Despite increasing public interest, consumer willingness to pay premium prices for BIA products remains uncertain. In the absence of verified data on nutritional benefits, carbon savings, or certification labels, BIA products struggle to differentiate in the retail market. This has further delayed investor confidence in regions where real estate and energy costs are high.
Several notable BIA ventures have exited the market in recent years, pointing to over-optimistic projections, underestimated OpEx, and insufficient attention to market demand. As in other capital-intensive sectors, failure to align technical ambition with operational realities can have grave consequences.
Barriers to Scaling BIA
One of the important findings of the report is the lack of standardized metrics for performance evaluation, which has hampered peer learning, investment benchmarking, and public-sector integration. Many of the environmental claims made by BIA proponents—ranging from Greenhouse Gas (GHG) reductions to stormwater mitigation—are difficult to verify due to inconsistencies in data reporting and lifecycle boundary definitions. This opacity also limits the ability of municipalities to integrate BIA into climate plans, food strategies, or infrastructure policy. Without clearer performance benchmarks and climate-aligned incentives, BIA’s potential to deliver climate resilience—through cooling, water retention, and food localization—remains largely untapped.
To address this, the report introduces a carbon-centric evaluation framework that harmonizes data across sectors and enables comparative assessment of BIA systems using four core metrics: Energy Use Intensity (EUI), Water Use Intensity (WUI), Greenhouse Gas Intensity (GHGI), and food yield. Applied across 48 BIA case studies, this framework reveals significant variability based on system type, climate, and building context. It also identifies a range of “lowcarbon leverage points,” such as waste-heat recovery, renewable integration, and passive environmental controls, that can improve system performance over time.
BIA’s Role in Climate Resilience
In parallel, BIA offers tangible pathways to strengthen climate resilience in cities. As extreme weather events intensify and supply chains grow more fragile, BIA systems provide local redundancy—through food production, water retention, and thermal regulation—embedded within the built environment. Whether through rooftop water capture, renewable energy integration, or urban heat mitigation, BIA enhances a city’s capacity to adapt and respond to climate shocks. Its multifunctionality positions it as both infrastructure and strategy for resilience planning.
Regulatory Landscape
From a regulatory standpoint, the report finds that BIA remains poorly integrated into most planning and permitting systems. While leading jurisdictions—including Vancouver, New York, Paris, and Montréal—have introduced zoning reforms, rooftop exemptions, and pilot incentives, most urban policies treat BIA as a niche or temporary intervention. Without clear legal status or integration into utility, infrastructure, or food systems policy, BIA projects face high costs and uncertain approval pathways. The lack of access to public subsidies or tax incentives—available to conventional agriculture or renewable energy—further disadvantages the sector.
“This report highlights that circular cities are an urgent necessity. By rethinking urban infrastructures— with agriculture at its core—as a regenerative, productive ecosystem, we move toward a new paradigm for sustainable cities—one where buildings are not just shelters but living systems that feed, sustain, and regenerate.”

Mohamed Imam, Ph.D. | Perkins&Will Senior Research Lead
Design Integration and Human Experience
The report also underscores the role of modular design and human-centered integration in scaling BIA. Standardized yet adaptable systems support adoption across building types—such as schools and mixed-use developments—and support decentralized deployment. These approaches not only enable flexible integration but also enhance human experience through improved environmental quality and more accessible green spaces.
Moving forward, the report identifies key enablers for scaling BIA:
Policy Frameworks:
Treating BIA as critical infrastructure by embedding it into zoning, building codes, and green development incentives.
Market Analysis:
Developing hybrid funding models that combine grants, private investment, and service contracts, while derisking upfront CAPEX.
Ecological and Environmental Impact:
Positioning BIA as an ecological infrastructure that supports biodiversity, reduces urban heat, and closes resource loops through on-site reuse of energy, water, and organics.
Technical Analysis and Guidelines:
Mandating carbon and resource reporting standards to enable verification, benchmarking, and eligibility for environmental incentives.
Design Implementation and Human Experience:
Standardizing hybrid modular BIA systems to integrate with diverse building types, climates, and programmatic uses—from schools and hospitals to housing and retail.
In conclusion, BIA is a tangible, scalable, and local solution to multiple urban challenges, from food insecurity to waste management and climate resilience. But realizing this potential requires a shift from experimentation to systembuilding. This report serves as a baseline and roadmap for that transition, providing the evidence, tools, and guidance needed to elevate BIA from innovation to infrastructure.
About This Report
The purpose of this report is to guide designers, planners, urban farmers, policymakers, and investors through the key dimensions of BuildingIntegrated Agriculture and resource circularity.
This report assesses the feasibility of implementing BIA projects and maximizing their potential for resource circularity. It lays the groundwork for integrating agriculture in, on, and around a variety of building typologies, and provides practical methods for doing so. The sections that follow examine BIA policy frameworks, market analysis, ecological and environmental impacts, technical systems and design guidelines, and human experience. These dimensions are considered in relation to hybrid BIA models, place-based research needs, and the careful negotiation of trade-offs unique to each project context.
How This Report Was Developed
This report is the outcome of a multi-disciplinary collaboration between architects, designers, engineers, academics, agri-food business leaders, planners, farmers, and engaged community members. The research team conducted in-depth case studies of BIA systems, engaged with stakeholders through interviews and workshops, and analyzed performance data across a wide range of contexts.
The findings are structured across seven parts, progressing from policy and market frameworks to ecological, technical, and design considerations, and culminating in actionable recommendations for scaling BIA as a strategy for regenerative urban ecosystems.

Planting The Seed Introduction
Reimagining Cities as Regenerative Ecosystems
Until the 20th century, cities were intertwined with their surrounding landscape, producing food while consuming local resources. These localized food systems provided resilience, ensuring communities had steady supplies even during natural, political, or social disruption periods (Barthel & Isendahl, 2013).
However, over time, globalized food supply chains replaced local production, improving efficiency to support growing urban populations but creating vulnerabilities to external shocks. The COVID-19 pandemic, for instance, exposed the fragility of these systems, disrupting trade and accelerating food insecurity (Clapp & Moseley, 2020).
As cities expand, rebuilding resilient, decentralized food networks to complement global supply chains is more urgent than ever.
This chapter introduces the critical opportunity to reposition cities as regenerative ecosystems by integrating BuildingIntegrated Agriculture (BIA) into the urban fabric. With rising urban populations, strained food systems, and increasing climate vulnerabilities, there is a growing imperative to embed food production within cities themselves.
This section sets the stage for the report by framing the urgency of transforming how food, waste, water, and energy are managed through architectural innovation. It positions BIA not merely as a technical intervention, but as a strategic response to systemic urban challenges—capable of addressing food insecurity, reducing emissions, and localizing resource loops.
Produce Less Emissions
From 12 Gt CO₂e to 4 Gt CO₂e: A 67% Reduction by 2050
Feed 10 Billion People in 2050
We will need 56% more food to feed nearly 10 Billion people in 2050
+56% more food for 2050
2010

Use Less Land
Stopping agricultural expansion could protect forests twice the size of India
Ensure Affordable Food Access
Food that is Steady and Reliable
Figure 1: The global food challenge by 2050. Adapted from: World Resources Institute, 2018.
The Global Challenge: Feeding 10 Billion Sustainably by 2050
By 2050, 70% of the projected 10 billion world population will live in cities (UN, 2023), placing unprecedented pressure on food, water, and energy systems.
Urban consumption remains linear and resource-intensive, with cities consuming substantial resources with minimal recovery or reuse mechanisms.
Meanwhile, global food demand is projected to rise by 56%, yet agricultural land use has already reached a tipping point. Nearly 50% of the world’s vegetated land— an area twice the size of India—is already dedicated to farming (World Resource Institute, 2018), see figure 1.
Expanding farmland further would accelerate deforestation, biodiversity loss, and climate instability. 1. Land Use
Food production is also a leading driver of climate change, responsible for nearly one-third of global anthropogenic Greenhouse Gas (GHG) emissions (Crippa, et al., 2021), see figure 2. Agriculture alone contributes 12 gigatons (Gt) of CO₂ equivalent annually, which must shrink to 4 Gt by 2050 to meet climate targets (World Resource Institute, 2018) Currently:
nj 70% of agricultural emissions stem from land-use conversion, deforestation, and soil degradation.
nj 30% originate from post-production activities, including refrigeration, long-distance transportation, industrial processing, and waste-heavy distribution (Poore & Nemecek, 2018) (Crippa, et al., 2021), see figure 3.
TRADITIONAL FOOD LIFE
TRADITIONAL FOOD LIFE CYCLE
PRODUCTION
DISTRIBUTION WASTE
Processing
1. Land Use 3. Processing
Farm and Harvest 5.7 Gigatonnes (32%) + 7.2 Gigatonnes (40%)
0.72 Gigatonnes
2. Farm and Harvest 5.7 Gigatonnes (32%) + 7.2 Gigatonnes (40%)
0.72 Gigatonnes
0.9 Gigatonnes (5%)
Transport
0.9 Gigatonnes (5%)
0.72 Gigatonnes + 0.54 Gigatonnes
0.9 Gigatonnes (5%)
Transport
0.9 Gigatonnes (5%)
0.72 Gigatonnes + 0.54 Gigatonnes
Figure 2: GHG emissions across the food production stream (EDGAR-FOOD, 2021).
Figure 3:
WHERE FOOD LOSS AND WASTE OCCURS ALONG THE SUPPLY CHAIN
Middle East, North Africa, Latin America North America, Oceana
Middle East, North Africa, Latin America North America, Oceana
Where Food Loss and Waste Occurs Along The Supply Chain
While global food production faces mounting pressures, access to nutritious, affordable food remains inconsistent. Supply chain disruptions, inflation, and extreme climate events have exacerbated food insecurity, increasing reliance on imported goods and volatile pricing.
In Canada, the National Farmers Union (NFU) has called for stronger food sovereignty policies to support local production, reduce import dependence, and ensure equitable food access. Resilient, decentralized food systems are not just an environmental goal but a social and economic imperative.
nj In North America and Oceania, waste is driven by overproduction, strict retail standards, and consumer habits, with 61% of losses occurring at the consumption stage.
nj In the Middle East, North Africa (MENA), and Latin America, food is lost much earlier in the supply chain due to poor storage and distribution infrastructure (World Resource Institute, 2018), see figure 4.
Tackling food waste requires comprehensive action across all levels of production and consumption, from improving consumer awareness to implementing policies that support food recovery and redistribution.
Furthermore, over 92% of farmed vegetable varieties have disappeared in the last century, eroding biodiversity and increasing reliance on monoculture-driven industrial food systems. Given that cities consume 80% of global food production while generating 1.3 billion tonnes of organic waste annually (FAO, 2019) which contributes to 8-10% of global GHG emissions (IPCC, 2021), they must actively reimagine sustainable food systems.
This disconnect presents an opportunity: What if cities could be redesigned to produce more than they consume?
Imagine if urban buildings could be designed as selfsustaining ecosystems, transforming waste streams into valuable resources. Instead of importing food and exporting waste, cities could close the loop, recovering nutrients, water, and energy to support localized food production.
The challenge is not just to grow more food—but to grow it smarter, integrating food production into the fabric of cities, transforming urban spaces into circular, regenerative food systems, reducing waste, lowering emissions, and increasing food security.
Figure 4: Food waste comparison across North America, MENA, and Latin America. Adapted from: World Resource Institute, 2018.
From Waste to Resource: A Circular Model for Cities
Different Diet
Integrated Food, Water, Waste and Energy
INNOVATIONS NEEDED IN THE WAY WE GROW AND CONSUME FOOD
Restoration of Degraded Farmland and Forests
The Balancing Act: Feeding a Growing Population Sustainably
The balancing act of feeding a growing population while reducing agriculture’s environmental footprint requires a fundamental shift in how cities grow, distribute, and consume food. Experts highlight four key innovations to ensure global food security within planetary boundaries (Porter, et al., 2014):
a. Shifting Diets: Reducing food waste and diversifying protein sources.
b. Restoring Degraded Farmlands and Forests: Protecting biodiversity while improving productivity.
c. Shifting Production Zones into Cities: Urban and periurban farming to reduce land-use pressure.
d. Integrating Food, Water, Waste, and Energy Systems: Designing circular urban metabolisms that minimize emissions and resource waste.
While the first two strategies focus on global agricultural reform, the built environment has an immediate role in the latter two. Cities must move beyond linear consumption models, where food is imported, consumed, and discarded, toward circular food systems that repurpose waste into valuable resources.
This is where Building-Integrated Agriculture (BIA) emerges as a transformative solution, bridging the gap between urban waste streams and food production to create a regenerative ecosystem. Though BIA alone won’t solve all food system challenges, scaling and integrating it into urban design will be crucial for building resilient, localized, and sustainable food networks.
Shift Production Zones to Cities
Figure 5: Innovation pathways for food security. Adapted from: Porter, et al., 2014.

Positioning: Building-Integrated Agriculture as an Urban Asset
The Solution: Circular, Integrated Resource Systems
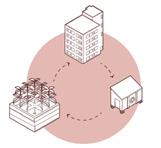
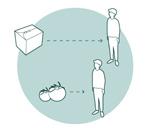
BIA offers a closed-loop solution by embedding resource recovery and food production within the built environment to address these inefficiencies. Instead of treating waste as an externality, BIA leverages urban waste streams to create circular, integrated resource systems. Key strategies include:
Turning Building Waste into Farm Inputs
nj Capturing CO₂ emissions from HVAC systems to enhance plant growth in controlled-environment agriculture (CEA), reducing emissions while increasing plant productivity
nj Greywater treatment captured from sinks and showers for hydroponics, lowering urban potable water demands.
nj Kitchen food waste can be composted or converted into biofertilizers, creating a nutrient loop that supports soil health and regenerative farming.
Integrating Farms as Urban Infrastructure
nj Rooftop greenhouses and green roofs serve as insulating climate buffers, reducing heating and cooling energy loads while producing fresh food.
nj Vertical farms in underutilized building spaces (e.g., atriums, facades, and underground spaces) enable year-round urban food production.
nj Adaptive reuse projects can incorporate urban farms into existing buildings, transforming them into productive assets.
Enhancing Circular Urban Metabolisms
nj Currently, cities import over 80% of their food, increasing vulnerability to supply chain disruptions.
nj City-wide BIA systems like rooftop greenhouses and vertical farms can meet 35-77% of a city’s vegetable demand (Orsini 2014) (McDougall et al. 2020) (Astee and Nirmal 2010) (Haberman 2014).
nj BIA using waste heat and renewable energy can cut food miles by 90% and lower agricultural sector emissions by 50% relative to traditional farming methods. (Poore & Nemecek, 2018).
nj Localized food systems improve food affordability, ensuring a steady supply of nutritious food, particularly in vulnerable communities.
The Role of Building-Integrated Agriculture (BIA)
BIA is not just about food production. It is a system-based approach to urban resilience, repositioning buildings from static, resource-consuming structures into dynamic, self-sustaining ecosystems. A BIA-integrated city leverages its existing infrastructure to create a regenerative relationship between agriculture, water, energy, and waste.
How buildings and farms work together
Our built environment generates waste streams that align seamlessly with agricultural needs:
nj Waste Heat: Enables year-round crop cultivation, particularly in rooftop greenhouses.
nj CO₂ Emissions: Enhances photosynthesis and crop growth in controlled environments.
nj Greywater: Treated and reused for irrigation, reducing municipal water demands.
nj Organic Waste: Converted through composters or anaerobic digestors into compost or biofertilizers, closing the nutrient loop.
In turn, these farms generate critical outputs that enhance urban ecosystems:
nj Fresh Food: Localized production reduces reliance on global supply chains.
nj Improved Air Quality: Plants sequester carbon, filter pollutants, and produces O2 as a by-product of photosynthesis.
nj Climate Resilience: BIA mitigates urban heat island effects by adding green roofs and facades, improving building energy efficiency (Zhang et al., 2022).
nj Restoring Local Ecosystems: embedding green spaces into urban infrastructure through rooftop and vertical farms restores urban biodiversity for a variety of animals and insects (Lanner, et al., 2019), and improve quality of life.
nj Water Efficiency: BIA contributes to sustainable urban water management through stormwater capture and greywater reuse.
While BIA offers a promising pathway to urban food security, its sustainability remains a topic of debate. Energy and resource intensity are key concerns, with some studies suggesting that BIA may not consistently outperform conventional agriculture in terms of environmental efficiency.
Assessing BIA’s life-cycle impact remains challenging due to limited standardized metrics and inconsistencies in evaluation methods. Studies indicate that GHG emissions and resource use efficiency vary widely depending on system design, location, and integration strategies.
For instance, Goldstein, et al. (2016) found that BIA may not always yield lower emissions than conventional agriculture, particularly when energy-intensive controlled environment systems are used.
Similarly, Kulak, Graves and Chatterton (2013) reported that producing strawberries in rooftop greenhouses in London resulted in a higher carbon footprint than importing greenhouse-grown strawberries from Spain.
In contrast, Goldstein, et al. (2016) found that importing tomatoes from Spain or Italy to Austria produced fewer emissions than growing them locally under energyintensive conditions.
A limitation of these assessments is their narrow system boundaries, which often exclude the building-level benefits of BIA. When integrated properly, BIA systems contribute to insulation, waste heat recovery, and stormwater management, offsetting some operational impacts.
These reciprocal efficiencies are rarely captured in conventional LCA, leading to an incomplete picture of BIA’s sustainability potential. A more holistic evaluation framework is needed to account for both agricultural outputs and building performance synergies to fully assess BIA’s role in creating climate-positive urban food systems.
Figure 6: Synergies between host buildings and integrated farms. Adapted from: Porter, et al., 2014.
BIA Typologies and the Scope of This Report
Unlike conventional urban agriculture, which primarily occupies ground-level spaces, BIA integrates soil-based and farming technologies into rooftops, facades, underutilized interiors, and adjacent building areas.
Studies by Dorr, Goldstein, Horvath, Aubry, and Gabrielle (2021), and by Benis, Gashgari, Alsaati, and Reinhart (2018), categorize BIA typologies into three primary types, each with distinct advantages and trade-offs:
Soil-Based System
Rooftop Greenhouses
Aeroponic System
Plants are grown by suspending their roots, receiving nutrients through misted solution.
• Efficient water use
High O2 exposure improves nutrient uptake
• Precise control over nutrient delivery
System failure risk
High initial cost and technical complexity
Soil Based System
Climate-dependent community gardens and rooftop farms.
nj Efficient biodiversity and urban ecosystem health.
nj Community building
nj Higher exposure to weather variability
nj Lower yields
Hydroponic System
Soil Based System
Climate-dependent community gardens and rooftop farms.
• Enhance biodiversity and urban ecosystem health.
nj Plants are grown in waterbased mineral nutrient solutions.
• Community building
nj Highly climate-controlled
Higher exposure to weather variability
• Lower yields
nj Maximize space and resources
nj Efficent water use (90% less water)
nj Higher energy demand
nj Soil-Based Systems: Climate-dependent community gardens and rooftop farms.
nj Rooftop Greenhouses: Climate-controlled structures utilizing building emissions and waste heat to optimize crop growth.
Hydroponic System
Plants are grown in water-based mineral nutrient solutions.
Highly climate-controlled
• Maximize space & resources
Aeroponic
Plants are grown their roots, receiving through misted
• Efficient water
• High O2 exposure nutrient uptake
nj Hydroponic Vertical Farms: Highly climate-controlled environments that maximize space and resource efficiency through hydroponics, aeroponics, and aquaponics.
Efficient water use (90% less water)
Higher energy demand
Hydroponic Vertical Farms
Hydroponic System
• Plants are grown in water-based mineral nutrient solutions.
Highly climate-controlled
• Maximize space & resources
Efficient water use (90% less water)
Higher energy demand
Aquaponic System
Plants are grown in water-based symbiotic environment with aquatic organisms.
• Dual output (vegetables and fish protein)
Efficient nutrient cycling through fish waste
Low water use, closed loop system
• Complex system management
Limited crop variety (works best with leafy greens)
• Precise control delivery
• System failure
• High initial cost complexity Soil Based
Climate-dependent gardens and rooftop
• Enhance biodiversity ecosystem health.
• Community building
• Higher exposure variability
• Lower yields
Aquaponic System
Aquaponic System
Plants are grown in water-based symbiotic environment with aquatic organisms.
Dual output (vegetables and fish protein)
Plants are grown in water-based symbiotic environment with aquatic organisms.
Efficient nutrient cycling through fish waste
• Low water use, closed loop system
• Complex system management
nj Dual output (vegetables and fish protein)
• Limited crop variety (works best with leafy greens)
nj Closed loop nutrient cycling through fish waste
nj Low water use
nj High initial cost and technical complexity
Aeroponic System
Plants are grown by suspending their roots, receiving nutrients through misted solution.
nj Efficient water use
nj High O2 exposure improves nutrient uptake
nj Precise control over nutrient delivery
nj System failure risk
nj High initial cost and technical complexity
Figure 7: Farming systems examined in this report. Adapted from: Dorr, Goldstein, Horvath, Aubry, & Gabrielle, 2021 and Benis, Gashgari, Alsaati, & Reinhart, 2018.
The most cultivated crops in these systems include:
nj Leafy greens (lettuce, spinach, kale): fast-growing, highyield crops ideal for hydroponic and soil-based systems.
nj Herbs (basil, mint, cilantro): compact plants with high market demand, well-suited for vertical farms.
nj Vining crops (tomatoes, cucumbers, peppers) – thriving in CO₂-enriched environments, these crops benefit from controlled greenhouse and vertical farm conditions.
Each BIA typology presents unique opportunities and constraints:
nj High-yielding vertical farms and rooftop greenhouses prioritize maximum food production per square meter but may place less emphasis on biodiversity conservation, or waste reduction (Newman, et al., 2023).
nj Soil-based rooftop farms enhance biodiversity and urban ecosystem health yet may offer lower yields and higher exposure to weather variability.
Balancing these trade-offs requires strategic planning to align BIA systems with specific urban needs, environmental goals, and food security priorities.
Extensive green roof
- 5” substrate depth
Intensive green roof
- 8” Roof garden
- 24”
Figure 8: Soil-based green roof types and requirements. Adapted from: Gundula Proksch, 2017.
Vertical Farming
Aquaponics
Aeroponics
Hydroponics
Green roof
Greenhouse
Green Wall
Soil/medium-based Farming
Mushroom
Open Air
Green Facade On Grade Greenhouse Productive Greenroof
Container Garden Permaculture
Rooftop Greenhouse Indoor Farm Indoor Farm Indoor Farm
Climate Dependent
Controlled Environment
Soil-Less growing
Soil Based growing
Mushroom Cultivation
Figure 9: Urban agriculture taxonomy. Adapted from: Dorr, Goldstein, Horvath, Aubry, & Gabrielle, 2021 and Benis, Gashgari, Alsaati, & Reinhart, 2018, Gundula Proksch, 2017.

Part II:
Policy Frameworks
Cultivating the Landscape
Positioning: Policy as the Catalyst for Change
BIA is poised to reshape urban food systems, yet its success depends on supportive policies integrating resource circularity into urban planning, building codes, and economic frameworks. Without strategic policy interventions, BIA remains a fragmented innovation a concept with promise but without the regulatory support to scale effectively.
The central question guiding this chapter:
What systemic conditions enable or hinder the integration of resource circularity in BIA, and how can policies drive its adoption at scale?
Despite increasing municipal interest in local food production, most urban policies remain stuck in a linear paradigm. Food, energy, water, and waste are treated as separate systems, limiting opportunities for synergy and resource optimization and preventing buildings from functioning as productive assets contributing to urban food security, waste valorization, and climate adaptation (De Jesus & Aguiar Borges, 2024).
Cities continue to operate with outdated land-use restrictions, misaligned incentives, and permitting barriers, preventing BIA from becoming a mainstream urban development strategy.
A global survey of municipal food policies reveals a stark reality
Fewer than 15% of municipal food policies explicitly reference BIA as a sustainability strategy.
Fewer than 10% provide dedicated funding, zoning provisions, or building codes that facilitate its integration.
“The positive influence of policy on the transformation of the green building sector in Canada has been evident. Municipal green building policies have played an important role in promoting the adoption of best practices, particularly in energy conservation, greenhouse gas mitigation, and resilient design, thereby enhancing the capacity within the local marketplace. Looking ahead, policies that support BIA best practices will facilitate the broader adoption of BIA technologies and the integration of urban developments.”

Kathy Wardle | Perkins&Will Regional Director of Regenerative Design Principal
Without targeted policy reform, cities will continue to discard valuable resources—food waste, greywater, heat, and CO₂—rather than reintegrating them into regenerative urban systems. BIA presents a unique opportunity to embed circularity within cities by leveraging underutilized building resources to support localized food production, but it cannot succeed without institutional backing.
Historically, food system planning has been a national and international policy concern, in recent years, with the increased interest in integrating food production into urban environments, city-regions are emerging as a key scale and planning priority for integrating food production, processing, retailing, distribution, and waste systems, as observed in the rise of local food plans and policies in cities across the world (Blay-Palmer et al., 2021; Issac et al., 2022).
While planning and policy support for local food production and BIA is still emerging (Liu, Korthals Altes, Melot, & Wallet, 2024), leading cities are beginning to adapt urban food strategies to regional governance structures, demonstrating how zoning reform, building code updates, and financial incentives can enable BIA (Speckt, et al., 2019).
This section identifies critical policy gaps and outlines the regulatory frameworks necessary to scale BIA from isolated pilot projects to a city-wide strategy for urban resilience. By examining leading Canadian and global cities at the forefront of local and regional agri-food planning, we assess existing policy supports, regulatory barriers, and opportunities for resource circularity. Through case studies, policy analysis, and strategic recommendations, this chapter explores how cities, businesses, and communities can leverage policy tools to embed urban agriculture into mainstream urban planning, transforming it into a fundamental pillar of sustainable development.
The Disconnect Between Urban Policy and BIA Implementation
Despite growing recognition of sustainability in urban development, policy frameworks governing food production and waste-to-resource strategies remain fragmented. The primary barriers preventing the widespread adoption of BIA include:

Zoning Restrictions
Many municipalities classify BIA as agriculture rather than an integrated building function, leading to land-use conflicts that limit its placement in commercial, residential, and mixeduse properties.

Lack of Financial Incentives
Unlike renewable energy infrastructure, urban farms receive little to no tax credits or subsidies, making BIA less financially competitive than traditional assets.

Building Code Challenges
Existing regulations for structural integrity, fire safety, and water use were designed for conventional buildings, making it challenging to incorporate controlled-environment agriculture, hydroponics, and rooftop farms.

Limited Circular Economy Integration
While many cities focus on waste reduction and resource recovery, food production is often left out, missing the opportunity to link BIA with energy, water, and waste management strategies.

Fragmented Governance
Urban food policy is often managed separately from zoning, sustainability, and infrastructure departments, leading to slow policy development and lack of coordination.
Beyond policy barriers, several key challenges impact the scalability and viability of BIA:

Food Safety Risks
Urban food production is vulnerable to air pollution, heavy metal exposure, and contamination from urban waste inputs. Soil-based UA in uncontrolled environments lacks strict quality checks of conventional food systems (Buscaroli, et al., 2021). Ensuring safe substrates, water sources, and growing conditions is crucial for BIA’s success.

Gentrification and Social Equity
While BIA and UA projects can enhance community amenities and neighbourhood greening, they may also increase property values and contribute to displacement and gentrification (Hawes, et al., 2022). These projects risk prioritizing private developers over local communities without equitable policy frameworks.

Uncertain Impact on Food Security
BIA’s role in urban food security is constrained by land use competition, high energy demands, yield variability and crop limitations (Lal, 2020).
Approach: Analyzing Policy Frameworks
This research examines civic policy frameworks incentivizing UA and BIA, focusing on leading international cities with well-developed local food, urban agriculture, and circular economy policies. The goal is to identify best practices and policy strategies to guide future BIA policy development.
The study evaluates large Canadian municipalities and global UA leaders based on:
nj Local food policies and plans
nj Government reports, news, and press releases
nj Technical reports and academic literature
nj Industry knowledge and interest in future BIA project
Canadian cities were initially screened based on their population size (over 250,000) and the presence of urban agriculture policies (e.g., zoning bylaws and strategic plans). Vancouver, Calgary, Toronto, and Montréal were prioritized due to their comprehensive policy frameworks.
A detailed analysis of Vancouver, BC, highlights its Sustainable Large Developments Policy as a progressive model for BIA integration.
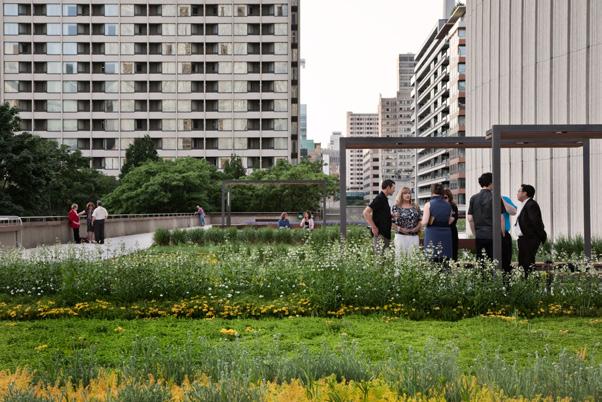
Figure 10: Perkins&Will, Nathan Phillips Square, non-edible green roof, Toronto, ON.
Data Collection and Analysis
This section employs desktop analysis and stakeholder consultations to refine policy recommendations and identify gaps in BIA integration at scale. Policy documents, action plans, and government websites were systematically coded to:
nj Track the number and type of BIA projects initiated under specific policies.
nj Assess government support mechanisms, including funding, incentives, and regulatory frameworks.
nj Conduct a gap analysis to identify policy deficiencies that may hinder BIA integration, particularly in technology adoption and local adaptation needs.
The study applies content analysis to UA, BIA, and circular economy policies to identify common policy goals, incentives, regulatory trends, and funding priorities (Issac, et al., 2022) (Vaismoradi, Turunen, & Bondas, 2013). This method helps to:
nj Analyze how food system policies are framed (e.g., sustainability, economic development, food security).
nj Map policy mechanisms that support or constrain UA/BIA adoption.
nj Correlate funding priorities with specific policy motivations.
Additionally, a case study approach was used to illustrate key policy trends, applying an instrumental case study methodology that considers one case to understand a common issue (Gerring, 2016) (Crowe et al., 2011) to examine BIA projects in practice.
This approach identifies best practices for BIA policy development at the city-region scale, offering insights into effective policy integration strategies for urban food systems.
While resource recovery is rarely a standalone policy, it is increasingly embedded within urban planning and food system policies to enhance food sustainability and shorten supply chains. Circular economy policies generally focus on resource reduction, reuse, and recycling, aiming to establish closed-loop systems that minimize environmental impact while strengthening local food security.
The chapter has three core objectives:
nj Identify the most incentivized forms of BIA, such as vertical farms and rooftop agriculture.
nj Analyze policies supporting or hindering BIA implementation, assessing regulatory frameworks and policy barriers.
nj Develop strategic policy recommendations, drawing insights from international case studies.
The Policy Landscape: Global, National and Municipal Frameworks
Policy frameworks at multiple governance levels shape the transition to resource circularity.
Global directives set overarching sustainability goals, national and regional policies define implementation mechanisms, and municipal regulations determine urban deployment strategies. The alignment of these policies directly influences the feasibility and scalability of BIA within cities.
While initiatives such as the Living Food Challenge, the European Union’s Farm to Fork Strategy, and the UN’s Food and Agriculture Organization FAO’s urban agriculture models highlight the importance of integrating food systems into circular economy goals, implementation at the national and local levels remains fragmented.
Sets overarching sustainability goals and indicators
Global scale
Creates policy implementation mechanisms that align with global goals
National scale
Implements regulations determining urban development strategies
Municipal scale
Regenerative food loops, waste elimination, and nutrient cycling, aligning food systems with nature’s processes.
Circular economy approach to food systems, with goals for food waste reduction, nutrient recovery, and urban farming incentives.
RELEVANCE TO BIA & RESOURCE CIRCULARITY
Advocates for food system integration into urban infrastructure and zero-waste systems but lacks enforceability in municipal policies.
Supports nutrient recovery from organic waste and urban farming incentives but does not mandate integration of BIA into city infrastructure.
Holistic regenerative framework with measurable targets in waste reduction, nutrient cycling, and energy balance.
Legally binding at the EU level includes structured funding for urban food initiatives.
Voluntary, with no legal mandate, making adoption inconsistent and slow.
Focus on urban resilience, food security, and integrating organic waste into agricultural systems.
Encourages organic waste integration into farming but does not explicitly reference BIA as an urban planning requirement.
Provides a strong global framework linking food resilience to waste valorization.
Lacks architectural integration strategies and building-level implementation frameworks.
Circular economy framework emphasizing food waste reduction, regenerative agricultural practices, and biocycling of organic materials.
Promotes food system circularity through waste-toresource principles, supporting nutrient recovery and lowimpact urban farming models.
Provides research-driven strategies linking agriculture, urban design, and waste valorization into a single framework.
Does not mandate BIA policies or formal integration into urban zoning.
Supports major cities in reducing food-related emissions and developing climate-aligned food policies.
Encourages BIA and urban agriculture as a strategy for reducing food miles, food waste, and emissions.
Engages a global network of cities, allowing policy innovation and best practice exchange for integrating BIA.
Conceptual focus; requires adaptation for city-level policies and enforceable regulations.
Primarily policy-driven with limited direct funding or enforcement mechanisms for BIA-specific projects.
National and Regional Approaches
While Canada has established food policy frameworks that promote sustainability, specific provisions for urban farming and BIA remain underdeveloped nationally. Existing policies primarily focus on:
nj Conventional agriculture and rural food security, rather than food production within cities.
nj Community gardening and rooftop farming incentives, but without structured support for integrating BIA into urban infrastructure.
nj Circular economy strategies that prioritize waste diversion, with limited emphasis on waste-to-resource conversion for local-regional food systems.
However, several national and regional initiatives have begun embedding urban agriculture and BIA within policy frameworks. These examples highlight opportunities for Canada to adopt best practices in developing structured approaches for BIA integration.
POLICY/INITIATIVE KEY FOCUS
Canada
Food Policy for Canada (2019) (Agriculture and Agri-Food Canada (AAFC), 2019)
United States USDA Urban Agriculture and Innovation Program (2020) (USDA, 2020)
France Green Roof & Urban Agriculture Law (2016)
Singapore 30 by 30 Food Security Initiative (2020)
Food security, local food systems, sustainability
Urban agriculture incentives, research funding
Mandatory green roofs or solar for commercial buildings
Local food production, agri-tech, vertical farming
RELEVANCE TO BIA & RESOURCE CIRCULARITY
Recognizes urban agriculture as a sustainability strategy but lacks specific funding or mandates for BIA integration into building codes or urban planning.
Lacks architectural integration strategies and building-level implementation frameworks.
Allows urban farming as an alternative to traditional green roofs, directly supporting BIA projects.
Incentivizes controlled-environment urban farming, with government funding for integrating urban farms into mixed-use developments.
Table 2: Comparison of key national policies focused on food systems.
Municipal Approaches
Vancouver has emerged as a leader in urban agriculture policy, implementing initiatives that encourage BIA adoption.
However, these policies remain fragmented, lacking comprehensive zoning, financial incentives, and regulatory support to integrate BIA into urban development fully.
Vancouver’s Food Policy Framework:
Key Strategies and Challenges
The Vancouver Food Strategy, adopted in 2013, is one of Canada’s comprehensive municipal food policies. Unlike previous frameworks, it integrates food production, processing, distribution, access, and waste management into municipal planning (City of Vancouver, 2024).
Key Objectives
nj Expanding food-friendly neighbourhoods by incorporating food systems into urban planning and infrastructure.
nj Empowering community stakeholders to participate in urban agriculture initiatives.
The strategy has driven progress in urban agriculture, food accessibility, and waste reduction. It has been implemented through actionable policies such as:
nj The Rezoning Policy for Sustainable Large Developments (SLD) mandates at least three food assets in large projects.
nj Urban agriculture project grants, supporting community gardens and urban farming.
Impact and Limitations
Since its adoption, the Vancouver Food Strategy has expanded urban food infrastructure. The key achievements can be summarized as:
nj Community garden plots increased by 60%, from 3,260 in 2010 to 5,500 in 2020.
nj Urban farms grew from 1 to 35 over the same period.
nj Farmers’ markets more than doubled, from 4 to 22.
nj The city’s green bin program diverted 216,000 tonnes of organic material (18% of total waste).
nj Total food assets: +71% growth (3,340 to 5,723).
nj Over 22,000 residents engaged through 11 neighbourhood food networks, supported by $169,000 in annual city funding.
Table 3: Assessment of Vancouver’s food policy framework impact (2010–2020).
Despite these successes of a 40% increase (2010-2017), the growth rate dropped to 10% (2013–2017) and 4% (2015–2017) (Vancouver, 2022) This is partly due to:
nj Limited availability of sites for new food assets.
nj Temporary gardens being repurposed for development.
nj Gaps in zoning and financial incentives for larger-scale BIA projects.
Zoning, Incentives, and Economic Policies for Building-Integrated Agriculture

While sustainability policies, food security strategies, and circular economy directives are gaining global traction, BIA implementation remains limited to minor zoning code adjustments or grant-funded pilot projects.
Key barriers include the absence of financial incentives and resource-recovery mandates, particularly for technology-intensive models like vertical farming and rooftop greenhouses. In contrast, renewable energy, water conservation, and waste reduction have received consistent regulatory and financial backing, enabling widespread adoption. This lack of policy integration for BIA results in limited incentives and regulatory misalignment.
Figure 13: Perkins&Will, Daphne Cockwell Health Sciences Complex, Toronto Metropolitan University, Toronto, ON.
Policy Summary
KEY POLICIES AND CITY RESOURCES
Vancouver, BC Vancouver Food Strategy
Vancouver, BC
Sustainable Large Development Policy (SLD)
London, Ontario
UA Strategy & “Making UA Easy”
Ottawa, Ontario
The New Official Plan & Ottawa Food Action Plan
Calgary, Alberta
Calgary EATS & Indoor Farming Business Support Program
Montréal, Quebec Stratégie d’Agriculture Urbaine
Montréal, Quebec Circularity Gap Report
Edmonton, Alberta
Edmonton Fresh & Zoning Bylaw 20001
✓
✓
✓
Establish a just and sustainable food system; increase access to affordable, culturally diverse food.
Foster sustainable site design; promote energy and water efficiency; enhance urban biodiversity; support sustainable food systems.
Increase adoption of vertical and rooftop agriculture; support midstream infrastructure for food processing and distribution.
Develop “15-minute neighbourhoods”; increase local food access via grocery stores, UA, and farmers markets.
✓
Expand local food access and production.
Strengthen self-sufficiency and urban resilience; integrate UA into city planning.
Expand urban food access and circularity initiatives.
Improve food security and local economic development.
Toronto, Ontario GrowTO UA Action Plan & Green Roof Bylaw ✓
Toronto, Ontario
Baselining for a Circular Toronto
Guelph, Ontario
Our Food Future
Mitigate urban heat island effect; integrate UA into rooftop developments.
Focus on food redistribution, waste avoidance, and local food procurement.
Support local economic development; improve food accessibility.
Mandates food assets in large developments; integrates urban food systems into community planning.
Requires integration of food assets in largescale developments; aligns food assets with sustainable infrastructure (rainwater management, zero-waste planning).
Separates container farming from other container-based uses, allowing expansion across multiple land zones; allows 50% of greenhouse area to count towards landscaping requirements; permits UA in all land-use designations.
Defines UA as a ‘food asset’ within 15-minute neighbourhoods; proposes tax incentives for landowners donating land for urban food production.
Provides property tax exemptions for farmed areas in buildings; waives business license fees; connects producers with vacant city land and buildings.
Invests $5 million to establish a circular food economy, develop urban agri-commercialization projects, and support local food markets.
Establishes ‘living labs’ for stakeholder collaboration; enhances food waste measurement and collection; increases UA infrastructure.
Examines regulatory barriers to rooftop agriculture; explores agricultural demonstration zones within urban neighborhoods.
Requires green roofs (not necessarily for agricultural purposes) on buildings exceeding 2,000m²; provides eco-rebates of up to $100/m² for green roofs.
Targets increasing locally sourced food tonnage; fosters circular economy integration.
Develops urban food asset datasets; implements incubator-accelerator services; creates impact funds and social currency models for carbon credits.
10% increase in food assets; UA bylaw adoption; 40% increase in community garden plots; 216,000+ tonnes of organic waste diverted.
Successful integration of BIA in multiple developments; increased developer engagement with food networks; greater awareness and adoption of BIA projects.
Zoning law Z-1, Section 4 amended to classify UA as permitted land use; removal of zoning restrictions for greenhouse and shipping container farms.
UA permitted in all zones; 80% of intensification in 2022 occurred within 15-minute neighbourhoods.
Established Canada’s largest vertical farm (as of 2023) and other high-yield controlled-environment farming operations.
Expansion of urban food production from 120 to 160 hectares (by 2026); increase in UA enterprises from 40 to 55; establishment of 50 school gardens.
Initiated $5 million circular economy strategy for food system integration.
Commercial indoor cultivation permitted for industrial zones; UA (outdoor farms and community gardens) permitted in most zones.
Over 1,000 green roofs constructed; limited operation of BIA farms on green roofs.
88 circular economy initiatives launched; establishment of Toronto’s circular economy consultation framework.
Launched multiple circular food economy initiatives, including food waste diversion programs, climatesmart agriculture platforms, and a B2B food waste exchange platform. Table 4: Overview and coding summary of
KEY POLICIES AND CITY RESOURCES BIA INTEGRATED KEY GOALS
Copehagen, Denmark
Food Strategy & Climate-Resilient Neighbourhood Østerbro
State of California UA Incentive Zone (UAIZ) Act
New York City Green Roof tax Abatement & UA Action Plan
Paris France Parisculteurs & Parisculteurs Toolbox
United Arab Emirates
✓
✓
Promote green infrastructure and biodiversity; support community urban farming.
Expand UA in food-insecure communities.
Increase transparency in food systems; educate the public on sustainable food production.
Expand urban food access through innovative farming.
URBAN PLANNING STRATEGIES RELEVANT TO BIA KEY ACHIEVEMENTS
Mandates green roofs on new developments (since 2010); integrates BIA into climate-resilient district planning.
Allows local governments to grant property tax incentives for UA integration within designated areas.
Requires reporting on urban food systems; establishes a UA-focused municipal office; implements training programs in VF, green roof operations, and UA.
Matches land and building owners with potential UA producers.
Established ØsterGRO rooftop farm in 2014; redeveloped 50,000m² in Østerbro into green infrastructure, including UA spaces.
Widespread adoption of UAIZ legislation across multiple counties and cities.
Supported 380 community gardens; developed 74 controlled-environment agriculture projects citywide.
80+ BIA projects supported through Parisculteurs program.
National Food Security Strategy & Emirates Sustainable Agriculture Label ✓
London, United Kingdom Strategy & Capital Growth Organization
Singapore 30x30 Initiative & Food Story Programme
Increase food selfsufficiency through waterefficient agriculture.
Strengthen communitybased food systems and green infrastructure.
Improve national food self-sufficiency through controlled-environment agriculture.
Table 5: Overview and coding summary of global policies and best practices.
Prioritizes investment in agritech solutions such as hydroponics and vertical farming.
Provides grant funding for urban food projects; develops UA networks.
Directs funding to agritech R&D; integrates UA within national food security planning.
Launched Food Tech Valley, a high-yield research and innovation zone; UAE captured 1.1%
£75 million allocated to 138 projects, including urban farming initiatives.
Allocated $309 million, with an additional $90 million for highyield urban agriculture projects.
Rezoning for Large Developments: City of Vancouver’s Sustainable Large Developments (SLD)
The SLD Policy, adopted by the City of Vancouver (CoV) in 2018 and last updated in 2023, represents a progressive regulatory effort to integrate sustainability and food systems into large-scale urban developments.
By mandating three diverse food asset inclusion and aligning urban food production with stormwater, energy, and waste management strategies, the policy aims to make BIA an integral part of Vancouver’s urban planning framework.
The policy applies to all rezoning applications for developments exceeding 8,000 m² (86,110 ft²) of land area or 45,000 m² (484,375 ft²) of new floor area. It ensures that major urban projects contribute to the city’s climate, biodiversity, and food security goals.
The SLD Policy is structured around six core sustainability priorities, with food assets as a required component: Sustainable Site Design, Food Assets, Water Management, Energy Efficiency, Green Mobility, and Zero Waste Planning.
At the rezoning stage, developers must identify and describe three food assets within their project. For sites over 10 acres, developers must provide a detailed operational and maintenance plan for at least five years to ensure the longterm viability of these food assets.
At the development permit stage, developers must submit detailed designs, confirmed programming partnerships, and long-term operational strategies to ensure food assets are not just symbolic additions but fully functional components of the development.
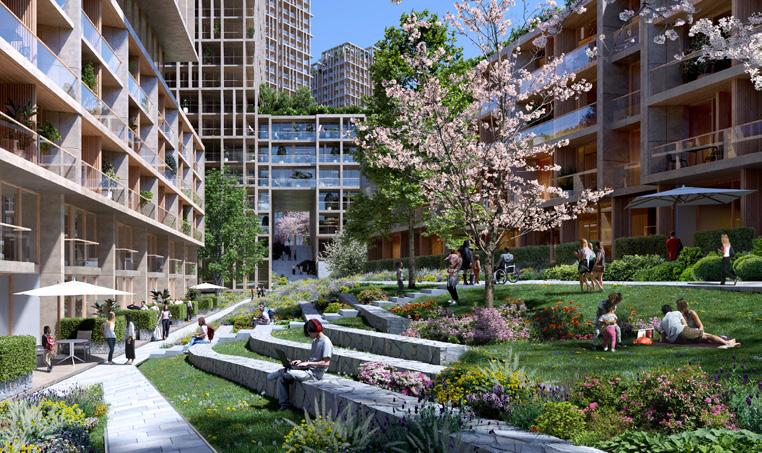
Figure 14: Perkins&Will, Skeena Terrace, Vancouver, BC. Urban farming at ground level and on rooftops. Rezoning
Key Objectives:
nj Mandatory inclusion of at least three food assets per development.
nj Design and operational commitments at the development permit stage.
Food Assets Integration
The SLD Policy defines various eligible food assets, recognizing that different site contexts and development scales may require tailored solutions. These assets include:
Community Gardens and Learning Gardens
nj Garden plots accessible to at least 30% of residential units that lack private outdoor space over 100 ft².
nj Minimum plot size of 24 ft² per resident to ensure meaningful food production capacity, with maximizes daylight exposure.
Urban Farms
nj Designed for commercial or high-yield food production in ground-level, rooftop, or controlled-environment settings.
nj For soil-based farms, a minimum area of 20,000 ft².
nj Vertical farms, greenhouses, and hydroponic systems are permitted but require specialized infrastructure considerations, such as Water access, nutrient recovery systems, Storage and logistics facilities, and Composting units for organic waste management.
Edible Landscaping
nj Requires integration of fruit-bearing trees, shrubs, and perennial food crops within publicly accessible green spaces.
nj Educational signage must be included to promote awareness and encourage resident participation.
Community Kitchens
nj Must accommodate 12 people for food preparation, workshops, and educational programs.
nj Encouraged to co-locate with other food assets, such as community gardens or food markets.
Food Markets and Distribution Hubs
nj Must include at least 10 stalls or booths (minimum size 3 m² per stall) for farmers and food vendors.
nj Developers must secure an operator agreement before final project approval, ensuring markets are not just theoretical inclusions but functional food hubs.
On-Site Organic Waste Management
nj Encourages on-site composting, vermiculture, or anaerobic digestion to close organic waste loops.
nj Requires integration with building-wide waste sorting systems to divert food scraps away from landfill disposal.
Implementation Outcomes
Since its adoption, the SLD Policy has influenced 38 developments, resulting in:
nj 117 food assets integrated into new projects.
nj 19 developments with approved food asset commitments.
nj 7 large-scale projects exceeding 10 acres requiring longterm food programming.
However, urban farms, CEA, and community food hubs remain underutilized compared to lower-impact options like edible landscaping and rooftop gardens.
Key Challenges
Tendency toward Lower-Impact Food Assets
nj Developments default to low-impact solutions (e.g., edible landscaping) due to lower capital and operational costs but have limited food security benefits.
nj Securing operators for food markets and urban farms remains a barrier.
Deferred Programming Commitments
nj Many developments delay finalizing their third food asset selection, which can result in inadequate space allocation.
nj Securing long-term operators for food markets is a challenge, as the city’s affordability criteria for vendors limit participation.
Regulatory Constraints on High-Intensity Urban Agriculture
nj BIA innovations such as hydroponics, aquaponics, and vertical farming face zoning barriers related to water use, energy demand, and parking requirements.
nj Floor space ratio (FSR) limits, parking requirements, and utility permits create logistical hurdles for integrating large-scale food production into developments.
Land Parcel +8,000m2 (1.98 acres)
Point Tower +60 Floors
Tower and Podium Mixed Typologies
Opportunities for Policy Evolution
This section presents key takeaways from workshops with Perkins&Will designers, offering recommendations to enhance policy mechanisms for effective BIA integration.
Aligning Policy Intent with Food Asset Selection
This policy can enhance community well-being, urban biodiversity, and local food access. However, further clarity on intent, design flexibility, and operational guidance is required. A stronger connection between policy objectives and food asset selection would help teams make informed design choices.
Furthermore, rather than a compliance-based approach, policy can adopt an outcome-driven strategy. This empowers designers to align assets with goals. For example:
nj Community Resilience—Community gardens, shared kitchens, edible landscaping.
nj Economic Viability—Hydroponic farms, rooftop greenhouses, community markets.
nj Urban Cooling & Biodiversity—Green roofs, tree-shaded food spaces.
Strengthening Incentives for BIA
Targeted policy incentives can accelerate BIA adoption by improving financial viability and regulatory clarity.
nj Density Bonuses and tax Incentives: Reward developments exceeding minimum food asset requirements, similar to green building incentives.
nj Pre-Approved Operator Networks: Establish a citysupported network of urban farmers, vendors, and food system organizations to streamline programming and long-term management.
nj Regulatory Clarity for CEA: Develop clear permitting pathways for indoor farms, aquaponics, and high-intensity hydroponics to enable broader adoption.
nj Expanding Food Asset Requirements: Move beyond large developments to include mid-sized and mixed-use projects for broader urban integration.
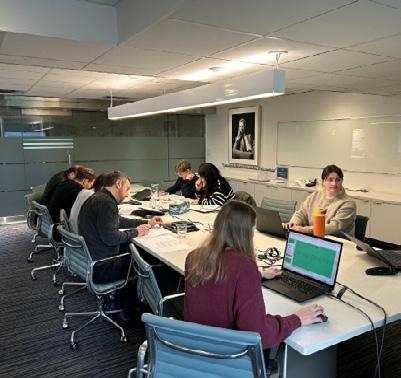
Asset Preferences: What Works Best?
Providing design templates, case studies, and operational guidance would encourage the adoption of food assets.
Most Frequently Selected Food Assets
nj Community Gardens & Edible Landscaping—Easy to implement, well-received, and contribute to well-being.
nj Community Food Markets—Flexible spaces for multiple uses fostering social connections and food education. There there is room for improvement bt clarifying regulations on stall fees, permanence, and zoning.
Less Commonly Selected Food Assets
nj Community Kitchens—High capital costs, need space, and there’s uncertainty around how the space would be shared with a non-profit/ or the public.
nj On-Site Organics Management—Perceived as technical and space-intensive, requiring clear feasibility guidelines.
Figure 17: Food asset workshop, Perkins&Will office, 2024.
Strengthening Policy for Clarity & Feasibility
Rezoning & Development Process: Streamlining Approvals
Early-stage planning is often challenging due to uncertainty in long-term operations and management. Pre-established partnerships and operational roadmaps can make integrating food assets easier.
nj Opportunities for Improvement:
‒ Community Food Markets: Clarify stall fees, operation frequency, and vendor partnerships.
‒ Urban Farms: Support with pre-approved operator lists and modular design examples.
Scaling for Impact: Quality Over Quantity
Designers raised concerns that policy prioritizes quantity over effectiveness. Greater design flexibility will allow food assets to serve communities better.
nj Opportunities for Improvement:
‒ Community Gardens: Allocate space based on site area rather than a fixed number of plots per unit.
‒ Community Kitchens: Define minimum space per user and clarify tenant vs. public use.
nj Urban Farms: Shift focus to modular vertical farms to maximize feasibility in space-constrained projects.
Ensuring Long-Term Operations
A recurring concern is who manages these spaces after construction. A clear management framework will help ensure long-term success.
nj Opportunities for Improvement:
‒ Pre-identify third-party operators (farmers, vendors, facility managers).
‒ Develop an operational guide for maintenance, security, and funding models.
Increasing Confidence in Asset Design
Empowering designers through education, precedent studies, and planning resources will improve food asset integration.
nj Education and Case Studies: Provide yield, energy savings, and social impact data will help teams advocate for food assets.
nj Mapping and Strategic Planning: Create a citywide food asset map to track progress and optimize placement.
nj Zoning Considerations: Prevent oversaturation of similar food assets in one area.
“Policy provides consistency and accountability in the design and integration of BIA. The City of Vancouver’s initiative to mandate 3 food assets for larger developments is one of many successful examples of Policy encouraging and informing the design of successful urban food systems. Our series of workshops allowed us to identify how policy can be improved upon to ensure food asset design and integration is more practical, sustainable and economic in the future to meet the needs of building occupants and the wider community.”

Amy Brander | Perkins&Will Regenerative Design Advisor
Confidential Mixed-Use Towers Designed with Integrated Vertical Farming
Architect: Perkins&Will Developer: Confidential Farm Operators: Quanto Tech Solutions Ltd.
Location: Vancouver, BC Climate Dependence: CEA Scale: 40m ² , 16 Grow Banks Growing Locations: Below Grade Growing Strategy: Vertical Farming (Modular Systems) Growing System: Hydoponic Primary Crops: Leafy Greens, Herbs, and Modular Farming Systems Policy: Rezoning Policy for SLD
An innovative application of the SLD Policy is the integration of vertical farming into high-rise residential projects. Perkins&Will designed this example, demonstrating how BIA can enhance urban food security within dense developments.
Impact and Limitations
This mixed-use development includes two residential towers with rental and condo units, a childcare center, and ground-floor commercial spaces. As part of the SLD Policy requirements, the project integrates three food assets:
nj Community Gardens: Spaces for residents to grow their food.
nj Edible Landscaping: Native food-producing plants with educational signage.
nj Hydroponic Urban Farm: A climate-controlled, belowgrade farm for year-round food production.
To ensure the hydroponic farm’s viability, Perkins&Will collaborated with Quanto Tech Solutions and the City of Vancouver. The 40 m² farm is in the parking level benefiting from:
nj Higher CO₂ levels, boosting plant growth.
nj A closed-loop hydroponic system, minimizing water use.
nj Glazed observation wall connects residents to the farm, creating an educational element.
Figure 18: Confidential Perkins&Will project with integrated vertical farming (location anonymized).
Farm Operations
nj Full-time farm operator managing planting, harvesting, and packaging.
nj Production of leafy greens and herbs such as Romaine, Basil, and Parsley.
nj Organic waste composting through Waste Connections Canada.
nj Twice-weekly fresh food markets in the building foyer.
nj Direct supply to local grocery stores and restaurants via e-cargo bike delivery.
nj 24/7 secure access with monitoring and direct loading stall connection.
As a hypothetical exercise, what if we expanded the scope of circularity into a waste to resource closed loop ecosystem.
What can this look like?
Figure 19: Residential tower with integrated indoor and outdoor urban farms.
Figure 20: Hypothetical systems diagram with a circular waste-to-resource ecosystem.
Greenhouse
Stormwater Cistern
Anaerobic Digester
Composting Bins
Sink
Mushroom Farm
Spent Grain
Waste
Waste
Figure 21: Hypothetical systems diagram with a circular waste-to-resource ecosystem.
Rezoning for Rooftop Greenhouse Integration
New York City’s Zoning Reforms Policy Overview
New York UA policy leverages zoning reforms, financial incentives, and strategic food system planning to integrate BIA. The city’s Food Forward NYC plan and PlaNYC, a broader sustainability strategy, emphasize UA’s role in building climate resilience and improving supply chain efficiency.
Two key legislative efforts—the Green Zoning Update (2012) and the Climate Mobilization Act (2019)—have laid the groundwork for urban farms to thrive in high-density environments by removing key regulatory barriers and offering financial incentives for green infrastructure.
Key Policy Provisions
nj Height exemptions for rooftop greenhouses: Rooftop agricultural spaces are not subject to standard height restrictions, allowing for more flexible greenhouse design and construction.
nj Floor-area ratio (FAR) exemptions: Urban farms do not count toward FAR calculations, which encourages commercial property owners to integrate BIA into their buildings without being penalized.
nj Zoning allowances for hydroponic and aquaponic farms: Controlled-environment agriculture (CEA) is now permitted in mixed-use and industrial zones, facilitating commercial adoption.
nj Green roof tax abatements: Property owners receive $15/ ft2 tax incentives for installing green roofs (Mayor’s Office of Climate and Sustainability, 2019).
New York’s urban agriculture strategy is anchored in its Food Forward NYC plan, a 10-year food system initiative introduced in 2021 to modernize food supply chains, support urban farming, and enhance food transparency (NYC Food Policy, 2023). This plan builds upon PlaNYC, a long-term development strategy integrating food and agriculture with the city’s broader climate resilience goals.
The Food Forward NYC plan emphasizes the role of urban agriculture through several key actions:
nj In 2022, NYC established an Office of Urban Agriculture to sustain policy support and funding.
nj Required annual reporting on food system infrastructure, including urban food production, distribution, and accessibility, increasing transparency and accountability(The New York City Council, 2011).
nj Funding for 380 community gardens has been secured for the next decade, reinforcing UA as a key element of NYC’s food security strategy in partnership with the NYC Housing Authority.
nj Exploring new land use designations to expand available spaces for food production.
nj Piloting emerging vertical farming technologies to advance research and innovation.
Key Challenges
While these policies have enabled commercial rooftop farms, such as Brooklyn Grange, to expand beyond traditional zoning constraints, several challenges remain:
nj Complex permitting processes create high compliance costs, particularly for smaller-scale urban farms.
nj Limited financial incentives make BIA economically uncompetitive against conventional real estate development.
nj High land costs remain a barrier, even with zoning reforms enabling food production.
Opportunities for Policy Evolution
To enhance the scalability of BIA, additional measures could include:
nj Streamlining permitting processes reduces financial and bureaucratic barriers for new farms.
nj Expanding Property Tax Incentives directly offset urban land costs for agricultural projects.
nj Developing grant programs to foster innovation in hydroponic and aquaponic farming.
Parisculteurs Initiative
Policy Overview
The City of Paris is a leader in UA policy, implementing a suite of regulatory tools to facilitate BIA. The Parisculteurs Initiative, launched in 2016, exemplifies this approach by matching farmers with landowners and developers, enabling the transformation of rooftops, walls, parking lots, and underutilized spaces into productive urban farms.
As of 2024, the initiative has cultivated 80 UA projects, covering 36 hectares of urban land.
Parisculteurs also catalogues ongoing and future UA projects, tracking their size, acreage, and impact. This data-driven approach aids food system planning and asset management, ensuring strategic UA expansion across the city.
A notable project under Parisculteurs is La Ferme Aromatique du Collège Pilâtre de Rozier, operated by Hydropousse. This initiative combines container/raised bed gardening with hydroponic systems, producing microgreens and edible flowers for local distribution via bike delivery. Such models exemplify how BIA integrates into urban infrastructure, leveraging innovative growing techniques while minimizing environmental impact.
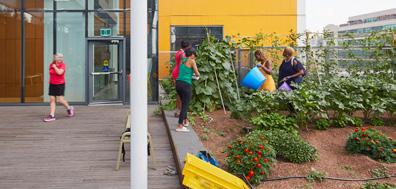
Key Policy Provisions
nj Rooftop greenhouse exemptions: Paris allows rooftop greenhouses to exceed traditional building height limits, with regulations for fire safety, access, and occupancy.
nj Zoning allowances for hydroponic and aquaponic farms: CEA is integrated into mixed-use zoning, encouraging high-tech urban food production.
nj Water and energy integration: Minimum rainwater retention allowances are mandated per plot to ensure efficient water management.
nj Public-private partnerships: Parisculteurs connect landowners with urban farmers, streamlining regulatory approvals for UA projects.
nj BIA Implementation Toolkit: The city provides a comprehensive guide to integrating UA into buildings, covering zoning, infrastructure, and safety requirements.
Key Challenges
nj Bureaucratic complexity: Despite zoning reforms, compliance with fire and safety codes remains a hurdle for rooftop farms.
nj Financial feasibility: Rooftop greenhouse construction and energy use costs remain high without targeted financial incentives.
nj Scaling barriers: While Parisculteurs has identified available spaces, scaling UA beyond pilot projects remains an ongoing challenge.
Opportunites for Policy Evolution
nj Expanding financial incentives, such as tax breaks or subsidies, to offset installation and operational costs.
nj Streamlining permitting for rooftop greenhouse projects to reduce bureaucratic hurdles.
nj Strengthening Climate Resilience Planning Integrating UA more explicitly into climate and resilience planning while building synergy between BIA and sustainability targets.
Figure 22: Perkins&Will, Daphne Cockwell Health Sciences Complex, Toronto Metropolitan University, Toronto, ON.
Brooklyn Grange – Rooftop Soil-Based Urban Farm
Form Operators: Brooklyn Grange Location: New York City, NY, USA
Climate Dependence: Seasonal (three Growing Seasons)
Scale: Brooklyn Navy Yard (6,000m² / ~65,000 ft2) Growing Locations: Rooftops Growing Strategy: Soil-based rooftop farming with dyroponic integration ― Growing System: Intensive Green Roofs, Hydroponic, and Container Gardening ― Primary Crops: Vegteables, Fruits, Leafy Greens Policy: Green Zoning Update (2012), Climate Mobilization Act (2019), Green Roof Tax Abatements.
This examination is based on publicly available information. It was prepared without the involvement of the project stakeholders.
Brooklyn Grange is a pioneering rooftop urban farm in NYC that demonstrates how Building-Integrated Agriculture can scale food production, enhance urban sustainability, and support community engagement.
The farm operates across multiple rooftops, integrating green infrastructure with community-supported agriculture, education, and urban resilience strategies.
Brooklyn Grange was established in 2010 during a period of increased investment in alternative energy and sustainable infrastructure in the United States. The farm emerged as a financially viable model for urban agriculture, balancing food production with community engagement, education, and environmental services.
Brooklyn Grange’s farms prioritize social equity and food accessibility through:
nj Community-supported agriculture (CSA) Boxes with a sliding-scale payment system to accommodate different income levels.
nj Equitable food distribution partnerships, including contracts to grow culturally relevant crops for public health programs.
nj Educational and public engagement programs, including workshops, field trips, and events.
Beyond food production, Brooklyn Grange integrates green infrastructure to enhance urban resilience. The farm’s stormwater management system helps retain rainwater, reducing combined sewer overflows (CSO), which are a major issue in NYC’s aging infrastructure.

Farm Operations
Brooklyn Grange utilizes underutilized urban rooftops to create multifunctional green infrastructure. The green roof is designed with an engineered soil blend that balances drainage, weight, and nutrient retention. A layered assembly consisting of a root barrier, filter fabric, aggregate drainage, and soil medium supports optimal growing conditions.
The farm incorporates hydroponic modules in select areas to enhance efficiency, optimizing water use while maintaining high yields. Greenhouses extend the growing season, allowing for year-round production. Together, these systems create a resilient and adaptable urban farming model.
nj Green Roof Tax Abatement ($15/ft²) under the Climate Mobilization Act (2019) helps offset installation and maintenance costs.
nj Green Zoning Update (2012) removes height and FAR restrictions, making rooftop agriculture more feasible in dense urban settings.
nj Public-private grant programs from the NYC Department of Environmental Protection support stormwater management initiatives, reinforcing the ecological benefits of rooftop farming.
Figure 23: Brooklyn Grange rooftop urban farm, New York City, NY. Image: Rhododendrites (Creative Commons).
Rezoning for Controlled-Environment Agriculture
Singapore’s Land Intensification Allowance (LIA)
Policy Overview
The 30X30 initiative, launched by the Singapore Food Agency (SFA), aims to produce 30% of the nation’s nutritional needs locally by 2030.
Singapore has taken bold steps to support food security and self-sufficiency, leveraging incentive-driven policies and land-efficient agriculture to address its severe land constraints.
A key component of this strategy is the Land Intensification Allowance (LIA), a policy within the 30X30 initiative, which promotes high-tech agriculture by offering financial support for integrating food production into urban and industrial spaces. This allowance supports capital investment in landefficient agricultural projects, including vertical farming and greenhouse-based production.
To achieve this goal, Singapore has implemented rezoning efforts, demonstration projects, and financial incentives that prioritize CEA and circular economy principles.
Key Policy Provisions
Demonstration Zones and Co-Location Strategies
Singapore has established dedicated agri-food zones that support urban farming, resource recovery, and circular economy development:
nj Lim Chu Kang Agri-Food Zone: A planned high-tech agricultural precinct designed to scale innovative urban farms.
nj LIA Incentives for Co-Location: This incentive program encourages food-producing businesses to integrate waste recovery, water recycling, and renewable energy into their operations.
nj Landscaping for Urban Spaces and High-Rises (LUSH) Program: Initially launched in 2009, this initiative was updated to support rooftop farms and food-producing green infrastructure.
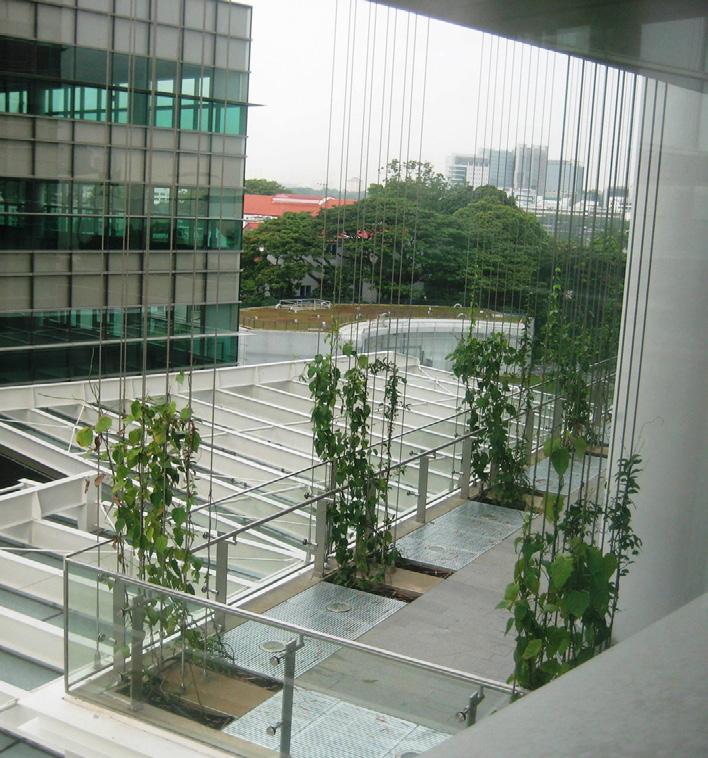
Figure 24: Perkins&Will, CREATE (Campus for Research Excellence and Technological Enterprise), Singapore. Developed for the National Research Foundation.
Financial Incentives for Developers
Singapore’s policy framework is strongly incentivedriven, offering financial support to accelerate urban food production:
nj 30X30 Express Fund ($30M): Launched in 2020 to scale domestic production of eggs, leafy greens, and fish.
nj Land Intensification Allowance (LIA): This allowance provides capital cost reimbursements of up to 25% for businesses engaged in high-tech agriculture.
nj Agri-Food Cluster Transformation Fund ($60M): This fund supports capital and technological advancements for local food producers, including infrastructure for urban farms.
nj Food Story Research and Development Programme ($309M): This programme funds research into CEA optimization, low-energy growing systems, new plant varietals, and reducing GHG emissions from urban agriculture.
Implementation Outcomes
Singapore’s policy-driven approach has resulted in significant advancements in urban food production, particularly in vertical and rooftop farming models:
nj Scaling Large-Scale Indoor Farms: Enabled companies like Sustenir Agriculture, which produces hydroponic leafy greens in industrial spaces, reducing reliance on food imports.
nj Mainstreaming UA in Commercial Developments: Singapore has successfully integrated food production into mixed-use developments, demonstrating a scalable model for co-locating food production with commercial activity.
nj Advancing High-Tech Farming Innovation: The government has allocated $309M for research funding, driving innovation in CEA, energy-efficient farming, and plant science.
Challenges and Opportunities
nj High Energy Demand of CEA: While Singapore is investing in low-carbon solutions, energy use remains a barrier to cost-competitive urban farming.
nj Scaling Food Production: Despite policy support, high capital costs prevent urban farms from competing with cheaper imported food.
nj Opportunities for Growth: Expanding density bonuses and tax incentives for developers integrating food production could enhance financial viability. Strengthening publicprivate partnerships in urban agriculture will be crucial for long-term sustainability.
Calgary’s Business License Exemptions and Industrial Zoning for CEA
Policy Overview
Calgary has taken a progressive approach to supporting CEA by implementing zoning and licensing reforms that facilitate vertical farming and commercial urban agriculture. These changes align with the city’s economic diversification strategy and efforts to repurpose underutilized spaces for food production.
Unlike Singapore, which prioritizes financial incentives, Calgary has focused on regulatory flexibility, removing administrative barriers that hinder CEA adoption. Additionally, the city has leveraged vacant industrial real estate and supported the adaptive reuse of office spaces to expand urban farming opportunities.
While Calgary’s EATS Action Plan (2013) provides a baseline assessment of the city’s food system, it lacks explicit targets for UA development. However, it recognizes UA’s role in community-building, food security, and environmental benefits, recommending land use inventories and policy refinements to enhance urban food production.
Key Policy Provisions
Special Zoning for Indoor Agriculture
nj Industrial buildings were reclassified to allow for commercial vertical farms, hydroponics, and aquaponics.
nj Encourages adaptive reuse of vacant spaces, including former office buildings, for CEA projects.
Business License Fee Exemptions
nj Waives business licensing fees for vertical farms to reduce startup costs.
nj Provides property tax rebates for businesses incorporating urban farming.
Business License Fee Exemptions
nj The city’s Growing Spaces Program connects entrepreneurs with vacant city-owned land for food production via shortterm leases.
nj Calgary EATS outlines food system strategies, emphasizing supply chain integration, circular economy principles, and community engagement.
Implementation Outcomes
nj Expansion of Large-Scale CEA: GoodLeaf Farms (74,000 ft²), Canada’s largest vertical farm, was established under Calgary’s revised zoning policies with $2.73 million in provincial funding.
nj Adaptive Reuse for Food Production: Agriplay’s urban farm in Calgary Tower is a plug-and-play vertical farming model, repurposing vacant office spaces to support highyield urban agriculture.
nj Flexible Real Estate Models for CEA: Calgary has leveraged favourable real estate prices and innovative business models to expand commercial urban agriculture. The city’s approach provides a unique example of how food production can coexist with urban development without competing for prime land.
Challenges and Opportunities
nj Land Use Bylaws Lack Explicit BIA Provisions: While Calgary encourages UA, BIA is not explicitly permitted in land use bylaws, requiring case-by-case approvals for integration.
nj UA as a Secondary Land Use: The Calgary EATS Action Plan acknowledges that food systems are often overlooked in urban planning, limiting their zoning and policy prioritization.
nj Long-Term Viability & Operational Barriers: Securing long-term commitments for urban farm operators remains challenging. Additionally, utility regulations and water-use policies limit access to alternative irrigation sources, such as rainwater harvesting and treated greywater, making large-scale indoor farming more difficult.
Rezoning for Resource Recovery in BIA
United Arab Emirates (UAE) – Food Tech Valley and Vertical Farming Incentives
Policy Overview
The UAE’s National Food Security Strategy 2051 aims to position the country as a global leader in food security by leveraging innovative agricultural technologies and sustainable practices.
Given the nation’s arid climate and reliance on food imports, the strategy emphasizes vertical farming, hydroponics, aeroponics and circular food systems to enhance local food production and reduce import dependency.
A cornerstone of this strategy is the rezoning of land for agricultural technology and food production, which facilitated the development of Food Tech Valley, a dedicated agricultural innovation hub integrating waste recovery, nutrient recycling, and energy-efficient food production.This initiative, alongside large-scale investments in controlledenvironment agriculture, reflects the UAE’s strategic focus on scaling high-tech food production through a circular economy lens.
Key Policy Provisions
Vertical Farming Incentives and Financial Support
nj Significant Investments: The UAE has committed $272M to indoor farming research and development through the Abu Dhabi Investment Office, aiming to bolster food security and sustainability.
nj Sustainable Agricultural Certification: The Emirates Sustainable Agricultural Label provides third-party certification to ensure farms meet sustainable agricultural standards, enhancing farm owners’ market exposure.
nj Financial Incentives: Programs like the Ag-Tech Loan Guarantee & Supply Chain Financing are designed to scale controlled-environment food systems, making advanced farming technologies more accessible.
Circular Food Production and Waste-to-Nutrient Systems
nj Closed-Loop Systems: Food Tech Valley aims to develop closed-loop food systems capable of recycling 50,000 tonnes of food waste annually.
nj Resource Recovery: Initiatives include recovering ammonia sulphate nutrients from wastewater for use in fertilizers and producing biodegradable polymers to enhance water and nutrient retention in arid regions.
Food Tech Valley Rezoning for Agricultural Innovation
nj Integrated Ecosystem: Land designated for food technology research, indoor farming, and sustainable food production. The valley includes an Innovation and R&D Centre dedicated to incubating new solutions and developing food and agricultural sciences.
nj Modern Farming Technologies: The initiative focuses on vertical farming, hydroponics, aquaculture, alternative proteins, drought-resistant crops, and robotics to optimize resource use and increase yield (Food tech valley, 2022).
Implementation Outcomes
nj Vertical Farming Milestones: Construction of the world’s largest vertical farm (Dubai, 2022), producing 3,000 kg of leafy greens daily using 95% less water than conventional agriculture. Additionally, the planned completion of the 900,000 ft² ‘Giga-Farm’ by 2026 is designed to replace 1% of the UAE’s food imports and integrate advanced circular farming methods.
nj Food Tech Valley Development: Establishing an integrated modern city focused on vertical farming and food technology.
Challenges
nj Energy Consumption: High Energy Demands for Vertical Farming, continued investment in renewable energy solutions is needed to offset the environmental impact of high-intensity food production.
nj Scaling Circular Practices: Expanding waste-to-nutrient systems in new developments beyond Food Tech Valley.
nj High Initial Costs: The capital investment required for advanced agricultural technologies can be a barrier for small-scale farmers and startups.
Opportunities for Policy Evolution
nj Support for Small-Scale Farmers: Financial incentives and technical support can encourage the wider adoption of advanced farming technologies among small-scale farmers.
nj Public-Private Partnerships: Collaborations between government entities and private companies can drive innovation and investment in the agricultural sector.
Food Tech Valley, UAE
Iniitiative: Food Tech Valley Launched By: Sheikh Mohammed bin Rashid Al Maktoum
Location: Dubai, United Arab Emirates
Climate Dependence: CEA Key Components: Food Production Zone, Logistics Zone, Business Park, Innovation and R&D Centre Growing Strategy: Vertical Farming Growing System: Hydroponic, Aquponic, Aeroponic Primary Crops: Varied ― Aligned with Policy: National Food Security Strategy 2051 (Food tech Valley, 2022) This examination is based on publicly available information. It was prepared without the involvement of the project stakeholders.
Launched in 2021, Food Tech Valley is an ambitious initiative to transform the UAE’s agricultural landscape. It will be
“..an integrated modern city that develops alternative proteins, creates drought-resistant crops, and uses 3D technology and robots to help sustain food production, create superfoods, and provide answers to global food challenges.”
Key Components
nj Food Production Zone: Dedicated to modern farming tech, including vertical farms, hydroponics, fish farms, and algae farms, aiming to optimize resource use and increase yield.
nj Logistics Zone: This zone caters to the entire value chain and focuses on trading, processing, packaging, and logistics to ensure efficient food distribution.
nj Business Park: Designed to support agritech and food tech companies, includes offices, conference venues, and business centers to foster collaboration and innovation.
Farm Operations
nj Production Capacity: Once fully operational, the Farm is expected to offset ~ 1% of UAE’s fresh produce imports.
nj Resource Recovery Practices: The facility is designed to divert 50,000 tonnes of food waste from landfills annually.
nj Vertical Farming Technology: The farms utilize AI-driven grow solutions. These systems enable cultivating crops in controlled environments, optimizing space and resources while minimizing water usage.
— UAE Ambassador to Canada Fahad Saeed Al Raqbany.
Montréal – Circular Economy Zoning for Urban Agriculture
Policy Overview
The city’s Stratégie D’Agriculture Urbaine (UA Strategy) 2021-2026 provides a regulatory framework for closing waste loops and repurposing underutilized spaces for food production, aligning with broader sustainability goals. Montréal’s approach to BIA is evident in policies that support various forms of urban food production, including rooftop greenhouses, vertical farms, microgreens, and mushroom cultivation.
A key regulatory shift includes zoning amendments that enable urban farms to:
nj Utilize building waste heat for greenhouse production.
nj Integrate insect-based composting into food systems.
nj Access financial incentives for green infrastructure in BIA projects
These policies align with the Programme Bâtiments Industriels Durables, which provides property tax benefits for businesses adopting sustainable building practices, including food production.
Key Policy Provisions
Waste Heat Integration
nj Permits the reuse of excess heat from buildings to support rooftop greenhouse production.
nj Enables the co-location of UA projects with industrial and commercial developments.
Organic Waste Processing through Insect Farming
nj Encourages insect larvae to process organic waste, generating natural fertilizers for urban farms.
nj Supports circular waste management in urban food systems, reducing landfill dependency.
Tax Incentives for Green Infrastructure in BIA
nj Property tax benefits for commercial buildings integrating food production into their design.
nj Grants for businesses adopting green roofs, urban gardens, and vertical farming solutions.
Tax Incentives for Green Infrastructure in BIA
nj Expansion of Lufa Farms, one of the world’s largest rooftop greenhouse networks, utilizing waste heat for year-round production.
nj Establish the UA Laboratory at Palais des congrès, a research and policy hub for BIA integration, supporting training, toolkits, and incubator programs for urban food entrepreneurs.
nj Launch of MontréalCulteurs and QuébecCulteurs, initiatives connecting urban farmers with vacant city land to scale sustainable food production.
Key Challenges
nj Decentralized Implementation: Variation in land-use regulations creates inconsistencies in policy execution across Montréal’s boroughs.
nj Need for Standardized Circularity Guidelines: Unified regulatory frameworks could improve the scalability and integration of BIA across the city.
Opportunities
for Policy Evolution
nj Expanding financial incentives for waste heat integration in commercial food production.
nj Strengthening partnerships between urban farmers, waste management agencies, and real estate developers to enhance circular economy adoption.
Rezoning for Food Markets and Food Distribution
As cities seek to enhance local food distribution, market access, and urban farming, zoning policies are evolving to integrate food markets and UA within high-density areas. California and Toronto provide two distinct policy models for achieving this:
California’s Urban Agriculture Incentive Zones (UAIZ)
Policy Overview
California has taken a statewide incentivebased approach to supporting UA through the UAIZ Act (AB 551, 2013). This legislation allows cities to create UAIZ, offering property tax reductions for landowners who commit to urban farming for five years. The policy aims to reduce financial barriers and encourage food production into commercial and residential zones.
California introduced a grant program, distributing $11.67 million across 33 urban agriculture initiatives, supporting projects ranging from community farming and education to vertical and rooftop agriculture. These initiatives align with the state’s broader sustainability and food security objectives while allowing flexibility for local implementation. Although statewide mandates for BIA integration remain limited, several municipalities, including Los Angeles, San Francisco, San Diego, and San Jose, have leveraged UAIZ to promote localized food production. For example, Los Angeles aims to increase the number of UA sites from 500 in 2021 to 625 by 2025.
Key Policy Provisions
Tax-Incentivized Zones for UA
nj California’s Department of Food and Agriculture (CDFA) defines UA broadly, including: small-plot in-ground farms, raised bed gardens, hydroponic, aeroponic, and aquaponic systems, rooftop farms and urban forestry, community gardens and edible landscapes.
nj Local jurisdictions can establish UAIZs in their boundaries.
nj Landowners receive property tax reductions for dedicating their land to urban farming.
nj UAIZs facilitates food distribution infrastructure.
Implementation Outcomes
nj 100+ new UA projects in major cities like Los Angeles, San Francisco, and San Diego.
nj Expanded community food hubs, enabling farm stands and direct-to-consumer distribution models.
nj $11.67 million in state grants distributed to support 33 UA initiatives across California, increasing farm viability.
Challenges and Opportunities
Equity Concerns in Land Access
nj Tax benefits often favour landowners with existing capital, potentially limiting UA’s food security benefits for marginalized communities.
nj Further research is needed to ensure social equity in UA zoning policies.
Lack of Statewide Mandates for BIA Integration
nj While UAIZ has been widely adopted and extended through 2029, there is no legal requirement for large-scale UA in urban development.
Regulatory Gaps in Zoning and Permitting
nj Local zoning codes and building regulations present barriers to scaling vertical farms, rooftop agriculture, and controlled-environment farming.
nj Unclear permitting pathways slow the adoption of high-tech agriculture, particularly indoor hydroponics, aquaponics, and urban greenhouses.
Opportunities for Expansion
UAIZ Beyond 2029 with Stronger Social Equity Measures
nj Policies should prioritize access for community-based organizations and lower-income groups.
nj Land-use incentives could favour nonprofit and cooperative farming models rather than benefiting only private landowners.
Developer Incentives for On-Site UA & BIA
nj Incorporate food production incentives into building codes and zoning policies, like Toronto’s Green Roof Bylaw.
nj Provide density bonuses or fast-track approvals for mixeduse projects integrating urban farming and BIA systems.
Policy Support for High-Tech BIA Models
nj Establish clear permitting pathways for vertical farming, aquaponics, and rooftop greenhouse agriculture.
nj Align state and municipal-level incentives to encourage adaptive reuse of underutilized spaces for BIA.
“The complexities of our current global food system means a change in one policy alone will not immediately force the evolution of the entire system. Regionally relevant implementation strategies such as incentives and demonstrated commitment are also needed for new local businesses to prosper, but explicit permission to embrace innovation in urban agriculture from a land-use perspective can be an effective first step.”

Leigh Christy | Perkins&Will Director of Research, Principal
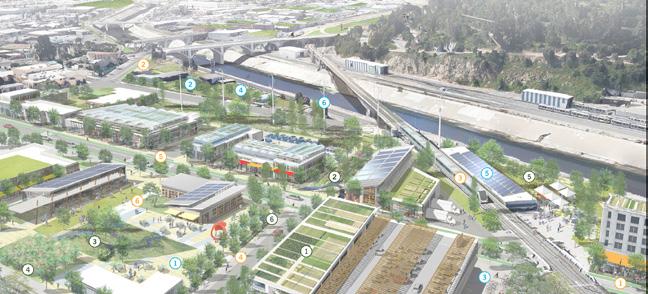

Figure 25: Perkins&Will, LA River Green Infrastructure Master Plan, Los Angeles, CA.
LA River Urban Agriculture Green Infrastructure Plan
Client: River LA Location: Los Angeles, California Climate Dependence: Varies Key Components: Food Production Zone, Logistics Zone, Business Park Scale: 660 Acres Growing System: Soil based urban agriculture, insect farming, beekeeping, aquaculture, and fungiculture Primary Crops: Varies Completion Date: 2015
Imagining Sustainable Future for the LA River
The LA River, reengineered from the 1930s to the 1960s into a concrete channel for flood control and industrialization, has been the focus of revitalization efforts. This Urban Agriculture Green Infrastructure Plan was supported by the Sustainable Communities grant from the State of California. The project reimagines the 660-acre Cornfield Arroyo Seco Specific Plan (CASP) area not as a single transformation, but as a layered strategy that builds upon existing land use, infrastructure, and food-related operations.
Rather than introducing a wholly new neighborhood or singular “agriculture hub,” the proposal takes a contextdriven approach: leveraging underutilized parcels, existing food businesses, public infrastructure, and evolving policy to enhance food access, stimulate local economies, and support neighborhood resilience.
The plan broadens the definition of urban agriculture to include not only cultivation, but also food processing and distribution. This expanded scope supports workforce training, job creation, and reuse of existing buildings— positioning the CASP as a district of opportunity for both public and private investment.
The strategy includes both district-wide and site-specific interventions. District-wide recommendations strengthen the public realm with edible landscapes, streetscape infrastructure, and multi-functional green networks that tie the area back into the broader urban fabric of Los Angeles. Meanwhile, four identified site-specific nodes serve as catalytic anchors—multi-block opportunity zones where urban agriculture clusters are supported by community amenities like bike hubs, shared parking, and free Wi-Fi.
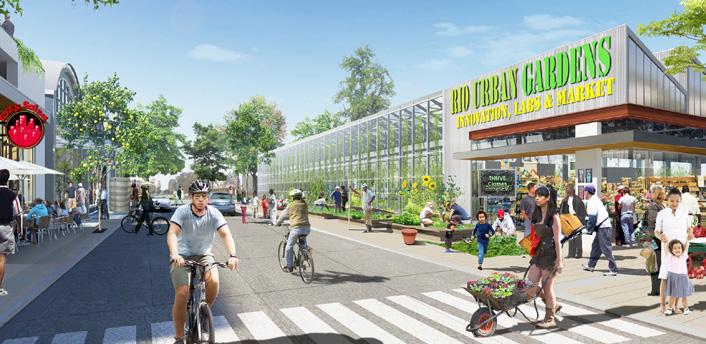
Figure 26: Perkins&Will, LA River integrated urban agriculture, Los Angeles, CA.
By clustering new enterprises such as aquaculture, beekeeping, and indoor farming near transit and existing food networks, the plan offers scalable, replicable models of regenerative food systems. These systems are designed to work across rooftops, vacant parcels, and publicly owned land, linking grassroots efforts with city-scale impact.
Ultimately, the plan provides a vision for a future LA—and a future LA River—that is healthy, connected, and equitably prosperous.

Figure 27: Perkins&Will, LA River Green Infrastructure Master Plan, Los Angeles, CA.
Toronto’s Green Roof Bylaw & Food Market Integration
Policy Overview
Toronto has implemented one of North America’s most comprehensive urban agriculture policies.
It has integrated food systems into its climate, infrastructure, and economic policies through initiatives such as:
nj The Green Roof Bylaw mandates that 20-60% of the roof area on new developments over 2,000m² incorporate vegetation, with financial incentives for food-producing green roofs (City of Toronto, 2024).
nj The GrowTO Urban Agriculture Action Plan (2012) is one of Canada’s first comprehensive UA plans. It outlines policies for land use, urban farming infrastructure, and food system development (Toronto Food Policy Council, 2012).
nj The Circular Economy Transition Plan: A citywide baseline study focused on reducing food waste, redistributing surplus food, and optimizing circular food systems, though it lacks specific BIA integration requirements (City of Toronto, 2022).
nj Toronto Food Policy Council (TFPC): Established in 1991 as North America’s first local food policy council, influencing municipal food governance (Toronto Food Policy Council, 2024).
Key Policy Provisions
Mandatory
Green
Roofs on Large Developments
nj Over 1,000+ green roofs built under the bylaw, covering 500,000+ m² of rooftop space (City of Toronto, 2024).
nj Developments over 2,000m² must allocate 20-60% of rooftop space to green infrastructure, depending on building size (City of Toronto, 2024).
nj Developers exceeding the minimum qualify for rebates up to $100/m², incentivizing larger food-growing installations (City of Toronto, 2024).
Food Production Incentives
nj Since 2019, 40% of new green roofs have included food production elements (e.g., raised beds, rooftop farms) (Toronto Metropolitan University, 2019).
nj Rooftop farms under this incentive program can produce up to 10 kg of fresh produce per m² annually, supporting local food access initiatives (Metropolitan University, 2019).
nj The city has awarded $4.2 million in green roof rebates, with a growing share directed toward food-producing green roofs (City of Toronto, 2024).
Food Market Integration in Urban Zones
nj Food markets are now permitted in commercial zones, facilitating direct sales from urban farms to consumers (City of Toronto, 2022).
nj The GrowTO Plan has led to more than 20 new farmers’ markets across the city, improving fresh food access in dense neighbourhoods (Toronto Food Policy Council, 2012).
nj High-density areas like Regent Park and St. Lawrence Market District have been prioritized for food hub development (City of Toronto, 2024).
Community & Conservation-Led Farming Initiatives
nj The Toronto Region Conservation Authority (TRCA) leases 279 hectares of farmland to urban and rural growers, contributing 2,500+ metric tons of fresh food to the city annually (Toronto Region Conservation Authority, 2024).
nj Large-scale farms such as Downsview Park (2.5 hectares) provide production and community engagement.
Key Challenges
Lack of Mandatory BIA Integration
nj While food-producing green roofs are incentivized, there is no mandate for integrating BIA into commercial or residential buildings, with fewer than 10% of total green roof projects actively growing food (City of Toronto, 2024).
nj No explicit BIA requirements exist for commercial or residential buildings, limiting large-scale adoption (City of Toronto, 2024).
Policy Fragmentation
nj Toronto’s green roof policy and food market integration strategies operate independently, missing the opportunity for synergistic policy alignment (City of Toronto, 2022).
nj The Circular Economy Transition Plan mentions food waste reduction but lacks implementation pathways for closedloop resource recovery within BIA (City of Toronto, 2022).
Regulatory Gaps in Food System Planning
nj Community food markets face uncertainties in stall fees, permanence, and zoning regulations, leading to limited adoption despite policy allowances (City of Toronto, 2022).
nj On-site organic waste processing is underutilized, with less than 15% of commercial food waste diverted for urban agriculture use (City of Toronto, 2024).
Opportunities for Expansion
BIA as Essential Green Infrastructure
nj Require a percentage of new green roofs to integrate food production into the city’s sustainability and stormwater management plans (City of Toronto, 2024).
nj Designate BIA as a permissible land-use category, allowing urban farms to operate with fewer permitting restrictions (City of Toronto, 2022).
Financial Incentives
nj Introduce tax credits for urban growers, like California’s Urban Agriculture Incentive Zone (UAIZ) program (City of Toronto, 2022).
nj Expand green roof rebate eligibility to include on-site composting and rainwater harvesting for food production, increasing the circularity potential of urban farms (City of Toronto, 2024).
Food Market Accessibility
nj Streamline permitting for year-round urban food markets, increasing accessibility for local farm-to-consumer models (City of Toronto, 2022).
nj Establish long-term vendor agreements to ensure the sustainability of new urban food hubs (City of Toronto, 2024).
Financial Incentives and Public Funding
London’s Good Growth Fund
Policy Overview
London has developed one of Europe’s largest urban agriculture networks, supported primarily through targeted financial incentives rather than zoning reforms. The Good Growth Fund (£75 million) has been instrumental in financing urban farming, food distribution, and community-led foodgrowing initiatives across the city (London Food Strategy, 2018).
Key policies shaping UA and BIA integration include:
nj The London Food Strategy (2018) recognizes urban farming as a critical component of community well-being, promoting food security and environmental sustainability (Greater London Authority, 2018).
nj The London Plan (2021) Positions food growing as part of London’s green infrastructure, advocating for integrating urban agriculture into new developments (The London Plan, 2021).
nj Capital Growth Initiative is a citywide food-growing network of over 2,000 gardens, providing resources, training, and funding to urban growers (Greater London Authority, 2024).
Key Policy Provisions
Good Growth Fund: Direct Financial Support for UA
nj The Good Growth Fund has allocated £75 million to 138 projects, many of which are focused on UA and food distribution (London Food Strategy, 2018).
nj In 2020, the initiative provided £1.2 million in funding to Organiclea, supporting the development of two foodgrowing sites (Organiclea, 2017).
nj The fund prioritizes projects that enhance community food systems, promote local food resilience, and reduce food miles.
Capital Growth: London’s Largest Food-Growing Network
nj Over 2,000 urban gardens are part of Capital Growth, making it the largest urban food-growing network in the UK (Greater London Authority, 2024).
nj The initiative provides discounted training, networking events, and support services to urban growers (Capital Growth, 2024).
nj The total land area dedicated to food growing in London is 79 hectares, reflecting the city’s commitment to local food production (London Food Strategy, 2018).
Integration with Sustainability & Green Infrastructure Policies
nj The London Plan 2021 lists food growing as an official Green Infrastructure Policy, encouraging UA in new developments and underutilized spaces (The London Plan, 2021).
Key Challenges
nj No formal zoning allowances for UA—While financial incentives exist, no specific mandates or rezoning provisions support BIA.
nj Long-term funding uncertainty—UA projects remain dependent on intermittent public funding, challenging long-term viability.
nj Limited land availability—High land costs in London restrict the expansion of urban farming projects despite financial support.
Opportunities for Policy Evolution
nj Introducing zoning reforms to provide dedicated space for urban farming within new developments.
nj Establishing permanent funding streams to ensure financial sustainability for UA initiatives.
nj Strengthening farm-to-market networks to enhance food security and economic viability.

Figure 28: Perkins&Will, the Union on 24th, non-edible green roof, Austin, TX.
Food for Thought: Key Policy Recommendations
The transition to waste-to-resource closedloop ecosystems is not just a technological challenge, it is a policy opportunity. Without regulatory frameworks that recognize and incentive resource circularity, cities remain trapped in linear, extractive systems, missing the chance to turn waste into value and buildings into productive assets.
Primary Policy Levers
Zoning Reform: Integrating BIA into Land-Use Policies
Most municipal zoning frameworks fail to recognize BIA as an explicit land use, treating food production as an agricultural rather than an urban function. This results in permitting challenges, regulatory inconsistencies, and administrative delays for BIA projects.
Key Zoning Strategies
nj Classify BIA as a permitted land use in zoning codes, allowing vertical farms, rooftop greenhouses, and CEA in residential, commercial, and industrial zones.
nj Streamline permitting for developers integrating BIA into mixed-use and high-density areas, particularly regarding height allowances (for greenhouses), water use, and landscape bylaws.
nj Introduce zoning incentives (e.g., density bonuses, height exemptions) for buildings integrating urban food production.
nj Expand rooftop agriculture regulations to include food production as part of green roof mandates, with corresponding incentives or rebates.
BIA is an essential urban infrastructure, not an alternative to conventional agriculture. While BIA will not singularly solve food system issues, its neglect in policy and practice presents a major missed opportunity for supporting more resilient cities.
This section presents key policy recommendations to embed BIA and urban circularity into regulatory frameworks, drawing from global and Canadian policy insights.
Findings from Policy Research
nj Rooftop agriculture is the most common form of BIA globally, often supported through green roof policies (e.g., Toronto, Copenhagen, and New York).
nj Few Canadian cities explicitly recognize CEA or vertical farming in zoning bylaws, except Vancouver, Calgary, London (Ontario), and Montréal.
nj Some cities, such as Paris, have expanded BIA beyond rooftops, recognizing walls, parking lots, and underground spaces for food production.
nj Project-based funding dominates global BIA policy efforts, with Singapore’s $30 million 30x30 Express Grant and UAE’s Food-Tech Challenge as leading examples.
nj Property tax exemptions for urban farms have been implemented in California’s UA Incentive Zone Program and Vancouver’s farm tax reclassification.
nj Some cities have integrated BIA into density-related incentives.
Financial Incentives: Structuring Sustainable Funding Models
Key Funding Strategies:
nj Introduce density bonus, tax incentives and property tax rebates for developers integrating BIA into new or retrofitted buildings.
nj Expand public grant programs and low-interest loan schemes to support BIA startups and capital investments.
nj Incorporate BIA into carbon credit frameworks, allowing urban farms to monetize waste reduction and emissions savings.
nj Leverage green bonds and climate finance programs to fund large-scale urban agriculture projects.
POLICY
Zoning Reform Rooftop farming ordinances
Demonstration projects and agriinnovation zones
BIA integration in urban planning and land use policies
Financial Incentives
Project-based funding
Challenge-based funding
Property tax exemptions for BIA
Carbon credit incentives for BIA projects
Infrastructure Integration Food production and waste valorization in developments
Mandatory composting programs for urban food systems
Table 6: Summary of primary policy levers influencing BIA implementation.
Infrastructure Integration: Embedding Resource Circularity
Key Infrastructure Strategies:
nj Mandate waste-to-resource loops in new developments, ensuring that organic waste, greywater, and surplus heat are redirected into urban food systems.
nj Require food production elements in sustainability standards, like energy efficiency mandates.
nj Develop nutrient recovery regulations to safely use composted organic materials in urban farms.
nj Clarify pathways with health department requirements for waste management, water reuse.
nj Promote co-location of BIA with renewable energy and water recycling systems, creating energy-food-water hubs.
Toronto Green Roof Bylaw – Mandates green roofs, supporting rooftop food production.
UAE’s Food Tech Valley – A research hub for agritech and urban food systems.
Copenhagen’s Climate-Resilient Neighborhood – Incorporates urban food production into community planning.
Singapore’s 30x30 Express Grant ($30M) – Funding to accelerate high-tech food production.
UAE’s FoodTech Challenge – Competitive grants for startups.
California UA Incentive Zone Program – Tax breaks for integrating urban farming into commercial properties
City of Guelph’s Landfill Carbon Credit Proposal – Monetizing waste-to-resource systems in urban farming.
City of Toronto’s Circular Economy Strategy – Supports closedloop food systems.
City of Vancouver Green Bin Program – Organic waste recovery for urban agriculture.
Stakeholder-Specific Recommendations
Local Governments: Policy and Regulatory Support
Local governments are central in BIA adoption by embedding it into urban planning, economic development, and sustainability frameworks. The following actions are critical:
nj Leverage regulatory mandates and incentives to accelerate BIA adoption.
nj Expand spatial planning for BIA, considering horizontal and vertical food production in rooftops, facades, parking structures, and underutilized spaces.
nj Develop digital governance systems to track food assets, waste flows, and resource recovery impacts, ensuring data-driven policymaking.
nj Foster public-private partnerships to unlock investment and market potential.
nj Ensure equitable access to BIA projects by:
‒ Prioritizing food deserts and underserved neighbourhoods in urban food strategies (McClintock et al., 2022).
‒ Implementing policies that prevent BIA from driving gentrification and displacement.
‒ Supporting community-driven participation to ensure projects align with local needs.
‒ Balancing top-down governance with grassroots engagement to create inclusive, accessible food systems.
Developers and Property Managers: Driving Capital and Innovation
Private sectors are essential for scaling BIA beyond smallscale pilots. Developers and property managers can drive capital investment and operational feasibility by:
nj Leveraging available incentives such as property tax reclassification, density bonuses, and height exemptions for BIA-integrated buildings.
nj Incorporating BIA beyond compliance, ensuring urban farms serve as long-term value-adding assets.
nj Prioritizing high-impact food production models, including CEA and multi-functional green infrastructure.
Designers and Architects: Optimizing Urban Integration
BIA’s success depends on technically sound and adaptable designs that align with zoning, permitting and resource management frameworks. Designers and architects should:
nj Integrate circular resource flows into BIA projects, ensuring waste heat, greywater, and organic waste are effectively recycled into food production.
nj Design modular and scalable systems, allowing BIA to adapt to different building typologies and climate conditions.
nj Support developers in navigating regulatory barriers, ensuring project compliance while maximizing available incentives.
Urban Farmers and Food Producers: Strengthening Market Viability
Urban farmers are at the forefront of BIA operations, ensuring economic sustainability. Key actions include:
nj Engaging in BIA practitioner networks, leveraging available land leasing, rooftop access, and business incubation programs.
nj Expanding technical skills in controlled-environment food production, ensuring alignment with urban regulations and resource circularity models.
nj Advocating for policy reforms that streamline permitting, expand zoning allowances, and increase funding for urban agriculture businesses.
With policy foundations in place, the next challenge is ensuring economic viability. Scaling BIA requires business models, financing strategies, and investment mechanisms that make urban food production profitable and scalable.
STAKEHOLDER ACTION
Local Governments Formalize BIA in zoning and infrastructure policies
Developers and Property Managers Integrate food production into long-term urban investment models
Designers and Architects Design flexible, high-performance BIA systems
Urban Farmers and Food Producers Establish viable business models that drive adoption
Table 7: Summary of stakeholder actions to support BIA growth.

Here We Grow Market Analysis
Positioning: BIA as an Economic Asset
Policy may set the stage for urban food system transformation, but market conditions determine feasibility. While BIA has been gaining traction as an innovative solution to urban food production, its longterm success depends on whether it can operate as a financially sustainable model. Without clear market viability, BIA will struggle to scale beyond pilot projects into mainstream urban developments.
Unlike traditional agriculture, which benefits from economies of scale and rural land availability, BIA operates in dense urban environments where land is scarce, infrastructure is costly, and business models must be highly adaptive. The challenge is to balance infrastructure costs, labour, consumer demand, and investment risks while adapting to placebased needs.
BIA projects offer an adaptable approach to urban farming, supporting various revenue models, from for-profit enterprises to nonprofit and community-based initiatives. Regardless of business structure, however, financial sustainability over time remains critical.
The central question of this chapter:
How can BIA become economically viable at scale, and what are the key market drivers and challenges shaping its adoption?
Beyond Food: The Economic and Social Value of BIA
BIA has the potential to reshape urban economies by creating jobs, stimulating local markets, and integrating into broader commercial ecosystems.
nj Local food economies benefit from fresh, high-quality produce that reduces food miles and strengthens food security.
nj Raw goods, value-added processing, and retail sales create business opportunities for small and medium-scale organizations and operations (Ilieva, et al., 2022).
nj Workforce development programs train individuals in urban agriculture, supporting a new green economy.
nj Community engagement initiatives foster social capital, food literacy, and mental well-being (Audate, Fernandez, Cloutier, & Lebel, 2019).
However, for BIA to succeed, it must move beyond food production alone. BIA operations have proliferated in recent years, supporting various economic and business models.
D’Ostuni et al. (2022) highlight that:
nj “…in those BIA projects where practitioners only produce and sell food, there is a much higher failure risk. Accordingly, most of the projects elaborate innovative business models where food or plant production is the core of a more complex multi-functional building.” (p.8)
This finding underscores the importance of integrating BIA with other urban functions, such as:
nj Mixed-use developments that combine farming with retail, office, or residential spaces.
nj Circular economy partnerships with business that provides input (e.g., breweries, bakeries) or recover waste streams.
nj Education and community programs that generate funding beyond food sales.
Understanding the economic landscape of BIA is crucial for shaping scalable and replicable models that can be integrated into urban planning and commercial development.
“Controlled Environment Agriculture (CEA) is becoming more important than ever to help provide a consistent supply of highly nutritious, fresh, local produce. While the
economics
of
CEA
operations cannot always compete with field production, Agritecture foresees a future where climate change impacts and economic forces cause field production to become less economically viable. We believe that CEA has a critical future helping to ensure the food security of our cities, and Perkins&Will’s vision to incorporate CEA operations into new construction should be highly relevant moving forward.”

David Ceaser | Agritecture Lead Agronomist
KEY FACTORS ANALYZED TO UNDERSTAND BIA’S ECONOMIC SCALABILITY
Market drivers
Economic opportunities and Scaling Strategies
Challenges and barriers preventing scalability
Market analysis of 8 cities, evaluating crop profitability and operational feasibility
Figure 29: Key factors analyzed to assess the economic scalability of BIA.
Approach: Understanding the Market Landscape of BIA
This research followed a structured multiphase methodology (Figure 32) to analyze BIA’s economic feasibility and scalability.
Step 1: Identifying BIA Business Models
A desktop analysis of BIA operations across Canada (with a focus on Vancouver and Victoria, British Columbia) identified a range of business models, categorized based on McMurty et al. (2015):
nj For-Profit Businesses: Commercial BIA enterprises focused on revenue generation.
nj Non-Profit Organizations: Urban farms embedded in social or environmental missions.
nj Community-Based Entities: Hybrid models balancing social impact and revenue generation.
Step 2: Interviewing BIA Leaders
Following this analysis, the research team conducted semistructured interviews with 12 BIA and urban agriculture practitioners across Canada
nj British Columbia (n=6)
nj Ontario (n=5)
nj Eastern Canada (n=1)
Each 45–60-minute interview explored key business challenges, market opportunities, and economic strategies. The interviews followed a standardized guide with a list of questions and were piloted through an external review ensuring consistency across responses (Kallio et al., 2016)
Data Collection Methods:
nj Six interviews were conducted in person (recorded with a personal recording device).
nj Seven interviews conducted online via Zoom (transcribed automatically).
nj Interviews coded for key themes and motivations, ensuring analytical consistency.
Step 3: Market Readiness Assessment
In parallel, a market analysis of eight global cities evaluated BIA crop viability and operational costs, helping to benchmark economic feasibility across diverse urban contexts. Desktop Based Review
Review of Market Case Studies Thematic Analysis of Motivations, Opportunities, and Challenge to Scale
Form and Type Analysis
Participant Recruitment
Transcribing and Preliminary Coding
Development of Codebook
30: Methodology used in this chapter for performance assessment.
Figure
An Organizational Typology of BIA Operations
Depending on their scale, location, and organizational model, BIA extends beyond growing plants—it provides infrastructure, services, and retail products, with revenue streams categorized into three key sectors:
Infrastructure Development
Some BIA organizations specialize in selling growing infrastructure, such as:
Product Sales & Distribution
BIA-grown produce is sold through various channels, each with unique business dynamics depending on scale and location. Potential customers include:
nj Public procurement (hospitals, schools): Reliable demand and consistent procurement through government contracts. On-site staff makes Maintenance easier, but procurement can be slow and bureaucratic. Larger-scale operations are typically more viable in these settings.
nj Wholesale to restaurants and retailers: High demand for fresh, locally grown produce that enhances branding and quality. Restaurants often buy in bulk, but they require consistent, high-quality products.
Service and Program Provisioning
BIA organizations often are operating within the service and program provisioning space:
nj Farm installation
nj Farm maintenence services (planting, harvesting, etc.)
nj Community organization and governance. Some organizations centralize community-building to their services, while others leave it to garden participants.
nj Direct-to-consumer / CSA: This is one of the most common operational models. It is flexible and adaptable to various building types, including mixed-use residential. This model fosters community connections but is labour-intensive, requiring time for sales, marketing, and distribution.
Soil-based grow container systems
Shipping container farms Modular hydroponic towers
Production Infrastructure (grow kits etc)
Community Organization and Governance
Garden Plot / Farm Maintenence
Garden Plot / Farm Installation
Lufa Farms (Montréal, Canada)
Company: Lufa Farms Established: 2009 Location: Montréal, Quebec, Canada Scale: Approximately total cultivated area is 301,000 square feet (combined across four locations) Growing Locations: Rooftops at Ahuntsic (2011), Laval (2013), Anjou (2017), Ville Saint-Laurent (2020) Growing Strategy: Greenhouse Growing System: Controlled Environment Agriculture (CEA) Primary Crops: Tomatoes, cucumbers, peppers, lettuce, herbs, microgreens, eggplants ― Distribution Model: Online marketplace with subscription-based weekly baskets, direct-to-consumer delivery, partnerships with local farmers and food producers. This examination is based on publicly available information. It was prepared without the involvement of the project stakeholders.
Established in 2009 in Montréal, Quebec, Lufa Farms is an urban agricultural company transforming underutilized urban rooftops into productive hydroponic greenhouses.
Lufa Farms co-locates greenhouse infrastructure on top of shopping districts (such as Le Marché Central) and industrial buildings across the city. This approach maximizes urban space efficiency while fostering local food production. By integrating agricultural techniques with a direct-toconsumer distribution model, Lufa Farms addresses the challenges of local food production in urban settings. The Laval Greenhouse, a recent additions to their network, incorporates key technologies and resource circularity principles to optimize energy use and minimize waste.
Farm Operations
Lufa Farms operates a vertically integrated model that combines urban agriculture with resource circularity to maximize local food production while minimizing environmental impact. The farm operations revolve around large-scale hydroponic greenhouses on commercial rooftops across Montréal, Quebec, allowong year-round cultivation. By integrating agricultural technologies such as closed-loop irrigation and climate control systems, Lufa Farms reduces water usage while maintaining optimal growing conditions.
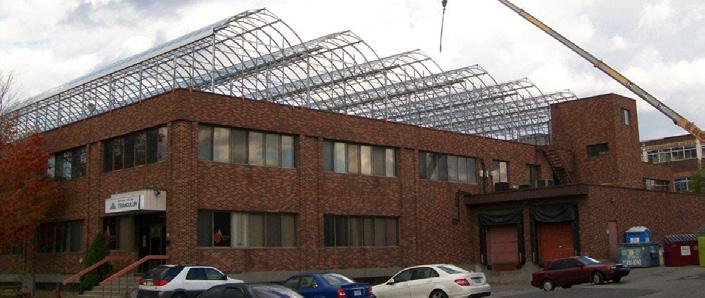
Figure 32: Lufa Farms’ first greenhouse construction, Montréal, QC. Image: Lufa Farms (Creative Commons).
Production and Distribution
The production process begins with hydroponic cultivation in controlled-environment greenhouses. The harvested produce is processed and packaged on-site to preserve freshness and maintain food safety standards.
Lufa Farms markets its products locally, fresh, and pesticidefree, positioning them as direct competitors to organic and local food markets. The company’s online marketplace is central to its distribution strategy, allowing customers to order through a subscription-based “Lufavore” basket system or make one-time purchases. This approach enhances customer retention and builds a sense of community involvement. According to the company, it became profitable after 5 years of operation (in 2016), employing over 500 people and serving two percent of Montréal’s population (AFP , 2020).
Key Features of Production and Distribution
Rooftop Greenhouses
nj Produces various crops, including tomatoes, cucumbers, peppers, lettuce, herbs, and microgreens.
nj Greenhouses are located on commercial rooftops to maximize space efficiency.
Online Marketplace & Subscription Model
nj Customers choose from weekly subscriptions or one-time purchases.
nj The “Lufavore” basket system allows for customization and convenient ordering.
nj Products include both in-house produce and locally sourced items from partnering farms.
Local Sourcing & Distribution
nj In addition to their crops, Lufa Farms partners with other local farmers and food producers.
nj Offers diverse products, including fruits, vegetables, dairy, baked goods, and meat.
Efficient Logistics & Delivery
nj Orders are packed at a central warehouse and distributed to pick-up points across the city or delivered directly to homes.
nj Efficient logistics reduce delivery times and maintain the freshness of perishable goods.
Business Model Impact: Scaling and Replication
Lufa Farms’ production and distribution model is a successful hybrid approach that combines urban agriculture with e-commerce and local food hub operations. By integrating scaling up (production, processing, packaging, and distribution) with scaling out (replication of rooftop systems across multiple locations), the company meets the growing demand for food self-sufficiency in urban settings.
This scalable and resilient model has inspired similar initiatives globally, including Brooklyn Grange in New York City. It demonstrates that urban agriculture can be economically viable and community-focused when backed by efficient production and distribution systems.
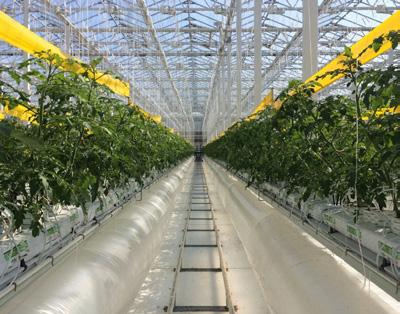
Figure 33: Lufa Farms, Montréal, QC. Image: Lufa Farms (Creative Commons).
Market Drivers Fueling BIA Adoption
To understand the economic viability and scalability of BIA, it is essential to identify the market forces that influence its adoption.
Through interviews with practitioners and stakeholders across Canada, several key drivers emerged:
nj Rising Demand for Local, High-Quality Produce
nj Community Building and Engagement
nj Food Literacy and Education
Rising Demand for Local, High-Quality Produce
A major driver of BIA adoption is the increasing consumer demand for fresh, locally grown produce, particularly in the restaurant and direct-to-consumer markets. Interviewees consistently emphasized that local food service providers particularly value fresh greens and other shortshelf-life items.
“Restaurants appreciate the longer-lasting freshness of locally grown produce than conventional supply chains. They are throwing half of [regular produce] away because it does not last, so it ends up being of similar cost.”
— Ashley Whelan | FED Urban Farm Program and Farm Operations Manager
This insight highlights that perceived quality and reduced waste can justify a premium price point, especially in markets that prioritize freshness, such as restaurants and specialty grocers. As urban food systems become increasingly strained by global supply chain disruptions, BIA’s ability to deliver reliable, high-quality local produce will continue to be a vital selling point.
Community Building and Engagement
While not a direct market opportunity, community engagement plays a pivotal role in the success and sustainability of BIA projects. By fostering social connections and providing shared spaces for gardening and urban agriculture, BIA becomes more than just a food production initiative, it becomes an integral part of the community fabric.
“When we are building these gardens, people come and talk about everything... they tell you about their history and what their family grew. It naturally encourages community interactions and storytelling”
— Chris Reid | Garden Building Operation
Founder
and Lead
This community-building dimension boosts public support and social buy-in and acts as a lever for securing programming funding. For many not-for-profit and charitable organizations, leveraging community programming and educational workshops becomes a way to diversify revenue streams while maintaining the social mission of their projects.
Revenue Generation through Community Engagement:
nj Offering workshops and seminars to teach food skills.
nj Creating interactive garden spaces for public use and education.
nj Securing grants and funding based on social impact and community cohesion.
Food Literacy and Education
BIA addresses food security and provides a platform for food literacy and skills training in urban settings. As cities become increasingly disconnected from traditional agriculture, urban residents often lack the skills and resources to grow their food.
By creating hands-on educational opportunities, BIA can address a crucial gap in urban food knowledge while fostering empowerment and self-reliance. This educational potential makes BIA attractive to schools, community organizations, and public institutions, which value promoting sustainable practices and enhancing local food skills.
“We would be targeting folks that do not have access to land, who might not have a lot of experience with growing food, but who want to learn and have something that is a great stepping stone to bigger, better, longer projects.”
— Ashley Whelan | FED Urban Farm Program and Farm Operations Manager
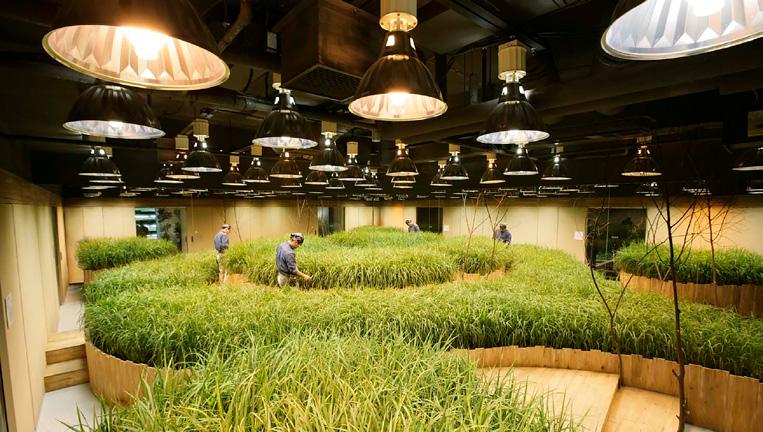
Figure 34: Pasona Group Headquarters, Tokyo, Japan. Interior farming activities. Image courtesy of Kono Design.
Agripolis (Paris, France)
Company: Agripolis Established: 2020 Location: Paris Expo Porte de Versailles, France Scale: 14,000 m 2 (~ 150,000 ft 2)
Growing Locations: Rooftop Growing Strategy: Vertical Farming system Growing System: Aeroponic vertical farming, hydroponic systems Primary Crops: Variety of leafy greens, herbs, fruits, and vegetables
Operational Model: Farming as a service, event space rental, community engagement initiatives. Food production, farm-to-table dining, community workshops, event hosting. This examination is based on publicly available information. It was prepared without the involvement of the project stakeholders.
Established in 2020, Agripolis is a leading French urban agriculture company that specializes in vertical vegetable gardens and urban farming infrastructures.
In partnership with the City of Paris, Agripolis developed Nature Urba ine, the world’s largest urban rooftop farm atop the Paris Expo Porte de Versailles exhibition complex. Spanning 14,000 m2, this project is a flagship example of sustainable urban agriculture integrated with public engagement and food production.
Agripolis’ unique operational model combines aeroponic vertical farming with a community-driven approach, reflecting a commitment to local food production and sustainable practices. The project aligns with Paris’ Parisculteurs Initiative, which supports urban agriculture to increase food resilience and reduce the city’s carbon footprint.
Farm Operations
Agripolis employs aeroponic and hydroponic systems that maximize space efficiency by growing plants in vertically stacked columns without soil. This closed-circuit watering system delivers nutrient-rich mist directly to plant roots, reducing water consumption while eliminating the need for pesticides.
The aeroponic technique minimizes water use and optimizes plant growth by maintaining consistent moisture and nutrient levels. This method is highly adaptable, allowing the farm to cultivate a wide range of crops in controlled environments, irrespective of external weather conditions.
The farm’s highly biodiverse system cultivates around 30 plant species daily during peak growing seasons. This produce is supplied directly to residents, shops, hotels, and restaurants, including the on-site Le Perchoir restaurant and bar.
Production and Distribution
Agripolis operates a vertically integrated business model, delivering produce directly to consumers while integrating community engagement and educational components into its operations. The project exemplifies scaling up and scaling out by combining large-scale food production with public engagement and social events.
Key Features of Production and Distribution
Local Food Production
nj Supplies to on-site restaurants, shops, and residents.
nj Short supply chains to reduce food miles and emissions.
Community Engagement
nj Educational workshops, tours, and community events.
nj Local residents can lease small plots to grow their own produce, fostering a connection with food production.
On-Site Dining Experience
nj Features a farm-to-table restaurant and bar operated by Le Perchoir with a capacity of 300 people.
nj Integrates event hosting and catering, generating additional revenue streams.
Scaling Strategies: Place-Based Projects and Farming as a Service
Agripolis’ success lies in its scalable and diversified business model, which combines agriculture with social and cultural spaces. The project integrates ‘farming as a service’ to support large-scale developments and public-facing projects while also positioning itself as a community hub.
This holistic approach aligns with the city’s Parisculteurs Initiative, which promotes urban agriculture to enhance local food resilience and sustainability (Agripolis, 2020 ).
Gotham Greens (New York,
USA)
Company: Gotham Greens Location: New York (Brooklyn, Queens) HQ, Chicago, Baltimore, Denver, California, Providence, and Virginia Established: 2009 Scale: Multiple greenhouses across seven states, totaling over 500,000 square feet Growing Location: Rooftop and ground-level Growing System: Hydroponic systems Primary Crops: Leafy greens (e.g., lettuce), herbs (e.g., basil), value-added products ― Operational Model: Local distribution to grocery stores, restaurants, and online retail This examination is based on publicly available information. It was prepared without the involvement of the project stakeholders.
Founded in 2009 in New York City, Gotham Greens is a pioneering urban agriculture company specializing in hydroponic greenhouse farming. The company aims to produce high-quality leafy greens and herbs year-round using controlled environment techniques.
Gotham Greens operates from multiple urban and suburban locations across the United States, including New York, Chicago, Baltimore, Denver, California, and Virginia.
Farm Operations
nj Automated Climate Control: Advanced HVAC systems maintain optimal growing conditions throughout the year.
nj Recirculating Water Systems: Hydroponic reduce water usage by up to 90% compared to traditional farming.
nj Renewable Energy Integration: facilities incorporate onsite solar panels to supplement energy needs.
nj Data-Driven Cultivation: According to Gotham Greens, the company utilizes Machine learning algorithms to optimize crop yield and resource efficiency.
Production and Distribution
nj Hyper-Local Supply Chains: All facilities are located close to urban centers to minimize transportation distances.
nj Centralized Processing: Harvested crops are processed, packaged, and stored on-site to maintain freshness.
nj Automated Monitoring: Systems track plant health and growth metrics enhancing efficiency.
Distribution Network
nj Retail Partnerships: Collaborates with Whole Foods and other major grocery chains to distribute produce locally.
nj Online Sales: Offers direct-to-consumer options through e-commerce platforms.
nj Regional Distribution Hubs: Expands multiple states to localize production and minimize logistics costs.
nj Strategic Acquisitions: Acquired FresH2O Growers to expand capacity and integrate regional distribution.
nj Gotham Greens markets pre-packaged salad mixes, herbs, dressings, and pesto under its brand, positioning itself as a premium provider of fresh, high-quality produce.

Figure 35: Gotham Greens, Davis, CA. Image: Jim Heaphy (Creative Commons).
Economic Opportunities and Scaling Strategies
BIA organizations pursuing scalability often follow two distinct approaches:
Vertical Integration: Building Multi-Functional Revenue Streams
Vertical integration is a dominant scaling strategy among BIA organizations. To enhance financial sustainability, many businesses diversified their revenue streams beyond food production to include:
nj Service provisioning: Maintenance, gardening, and operational support.
nj Educational programming: Workshops, training sessions, and skill-building initiatives.
nj Retail and direct sales: Selling produce directly to consumers or through partner networks.
However, a key challenge identified was staffing capacity. Many interview participants expressed difficulty in scaling service offerings without overextending their teams.
Additionally, achieving the correct scale of operations is crucial to maximizing benefits without straining resources.
“If the developer incorporates vertical farming into a strata, it should be big enough to reap the benefits. It is not just a few pots here and there for show—you can grow a good amount of food in there.”
— Ashley Whelan | FED Urban Farm Program and Farm Operations Manager
The core challenge lies in striking a balance between scaling up operations and maintaining manageable workloads. Successful BIA models must incorporate strategic workforce planning while embedding modularity and flexibility into service models to address this.
“BIA
presents an opportunity for local business development, at a time when complete reliance on global supply chains for food security is
no
longer
tenable.
Supporting small and medium-scale organizations (forprofit, not-for-profit, charity) to generate revenues by integrating food production into buildings is a no-brainer.”

Alesandros Glaros | University of Fraser Valley Vertical Agriculture Research Lead
Modularity: Replication and Flexibility
While vertical integration focuses on scaling revenue streams, modularity emphasizes replication and flexibility. Modular systems allow BIA projects to scale out rapidly without being tied to permanent installations. This adaptability is crucial in urban environments, where access to land can change frequently due to redevelopment or zoning changes. Corey Ellis, CEO of a BIA organization specialized in turnkey prefab grow units, described how modularity forms the core of their business strategy:
“You
just order and receive this fully assembled, fully built farm on the back of a truck. You drop it off with the crane, plug it into power, utilities, and water, and off you go... Then we’ve just built onto that initial heart of an idea to essentially build out a full-service firm all around urban and rural agriculture as well.”
—
Corey Ellis | The Growcer Inc. CEO Co-Founder
Key Benefits of Modularity:
nj Scalability: Easily expand to new sites with minimal disruption.
nj Flexibility: Adapt to changing urban planning policies and redevelopment timelines.
nj Community Empowerment: Enable local groups to operate urban farms with minimal technical expertise.
BIA organizations enhance operational resilience while reducing long-term infrastructure commitments by embedding modularity at the core of their business models. This strategy supports community-driven agriculture and enhances urban adaptability.
Growcer Modular Farms (Canada)
Company: The Growcer Inc. Farm Operators: Customer-operated Location: Various locations across Canada, including remote and urban communities Established: 2016 Modular Unit Size: 40’ x 10’ x 10’ (12.2m x 3m x 3m) Growing Location: Standalone self-contained Turn-key, modular farms Growing System: Controlled Environment Agriculture (CEA) Primary Crops: Leafy greens (e.g., lettuce, kale), herbs (e.g., basil, mint), Asian greens ― Yield Capacity: Up to 896 mature heads weekly (depending on crop mix) ― Annual Energy Use: 76,000 - 80,305 kWh Water Consumption: 1,900-2,200 Litres per month― Water Consumption: 1,900-2,200 Litres per ― Distribution Model: Local subscription boxes, retail partnerships, direct-to-consumer sales
The Growcer Inc. is a Canadian vertical farming company specializing in turn-key modular hydroponic farms designed to produce fresh, local produce year-round.
These containerized farms are engineered for rapid deployment and relocation, making them well-suited for urban settings and remote food-insecure communities. The plug-andplay installation minimizes construction timelines and permitting challenges, while the transportable design allows for flexible use in underutilized urban spaces.
The Growcer Inc. approach has led to successful deployments in diverse contexts, from urban community hubs to remote Arctic communities. Since its founding, the company has delivered over 70 modular farms, including installations serving the Gitmaxmak’ay Nisga’a Society, collectively producing more than 10 million servings of fresh, local produce.
Farm Operations
Hydroponic Production Systems and Resource Efficiency:
The economic viability of The Growcer Inc. projects is achieved through:
nj Closed-loop irrigation systems that reduce water consumption by up to 90%.
nj Nutrient management: Recirculating water systems minimize fertilizer runoff.
nj Automated environmental controls for temperature, humidity, and lighting, ensuring consistent crop growth and reduced energy use.
nj Vertical airflow systems to optimize plant growth and reduce disease risks.
nj Real-time monitoring to manage environmental parameters and troubleshoot issues remotely.
nj Reduced food waste: Growing based on community demand and locally grown produce stays fresher longer.
Production and Distribution
Customers of Growcer’s farms follow a variety of models from direct-to-consumer to wholesale models. For example, some customers offer a weekly produce subscription, while others partner with local grocery stores, schools, and restaurants to sell their produce. Many customers have a donation stream where they partner with community organizations like food banks to distribute fresh produce to the underserved and engage with the community.
The economic viability of The Growcer Inc. projects is achieved through:
nj Subscription Models: Generating consistent revenue through weekly fresh produce boxes.
nj Retail Partnerships: Establishing distribution networks with grocery stores and local businesses.
nj Operational Efficiency: Minimizing costs through automated systems and modular scalability.
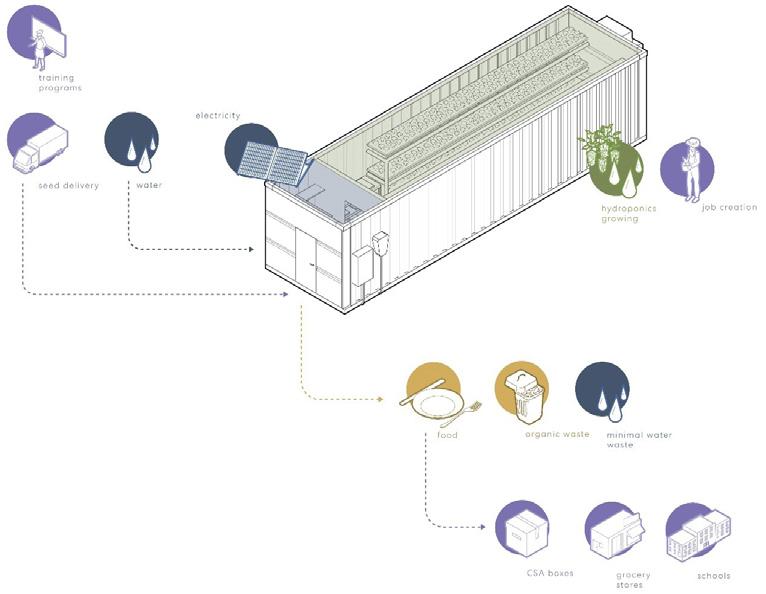
Figure 36: Systems diagram of The Growcer Inc. modular farm.
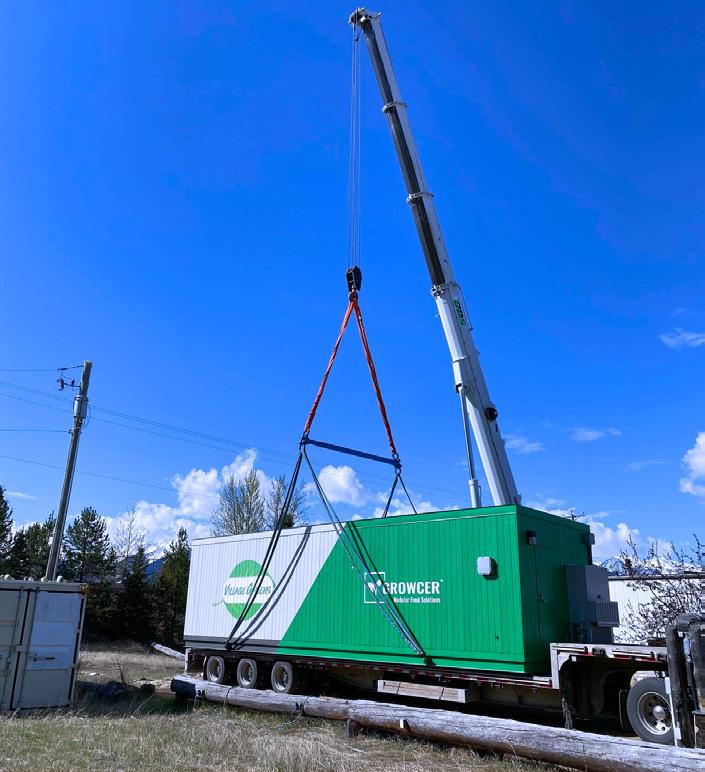
Figure 37: The Growcer Inc. modular farm installation.
“There’s so much potential to bring local food to the forefront of our daily lives. Modular farms are just one way to do that because they’re space efficient and can be integrated easily.
We hear from community organizations all the time that they want to grow local food, they just don’t know where to start. Developers can step in with the space, while community organizations could operate the technology and distribute the produce. It’s a win-win, increasing the amount of local food, community engagement, and social impact within a place.”

Corey Ellis | The Growcer Inc. CEO Co-Founder
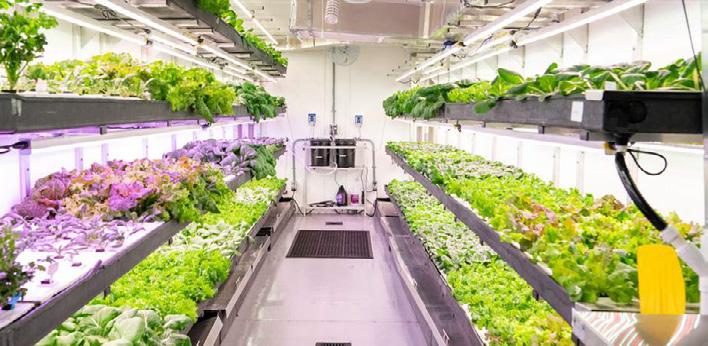
Figure 38: The Growcer Inc. modular containar farm interior hydropnic system.
Key Challenges: Navigating the Barriers to BIA Implementation
While Building-Integrated Agriculture (BIA) presents significant opportunities for urban food production and economic development, practitioners face numerous challenges that can hinder scalability and long-term viability. These challenges fall into four primary categories:
nj Land Access and Zoning Restrictions
nj Precarious Land Tenure
nj Infrastructure Limitations
nj Human Capital and Reliance on Champions
Land Access and Zoning Restrictions
Land access is a key driver of opportunity and a barrier to BIA businesses. Vacant and underutilized lands—such as rooftops, privately held lots, or sites designated for redevelopment—provide essential space for BIA operations.
“They [developers] have these vacant properties for one reason or another...So that’s where they say, why don’t we call this [a community garden], and you can build us a garden.”
— Chris Reid | Garden Building Operation Founder and Lead
However, while vacant lands offer potential, zoning restrictions often present obstacles. For example, in Saskatoon, one grocery store owner with a large commercial property could not integrate a small-scale urban farm because the land was zoned for industrial manufacturing. This illustrates how rigid zoning policies can limit the adoption of BIA practices.
“They [developers] own a property with a grocery store, fuel bar, etc. They would want to plop a little [unit] in the corner, but that is not allowed because it is industrial manufacturing... Because we’re growing food, which equals manufacturing. You cannot grow food on commercial land.”
— Ellis | The Growcer Inc. CEO Co-Founder
These challenges highlight the need for more flexible zoning policies that recognize the multi-functional potential of BIA projects. Enabling food production on commercial and industrial land could unlock new opportunities for urban farming while reducing land competition.
Precarious Land Tenure: The Challenge of Longevity
Even when BIA projects successfully secure land, tenure agreements often limit long-term planning and investment. In dense urban cores, space availability is an ongoing issue. Short-term leases create uncertainty for BIA operators, making investing in permanent infrastructure or long-term crops difficult.
“We have been there [the current farm premises] for a decade, and we are watching how they are developing with a keen eye to determine our timeline. We have been operating on a year-to-year lease with them...”
— Ashley Whelan | FED Urban Farm Program and Farm Operations Manager
However, when incentives and mandates for BIA are strengthened, organizations gain greater negotiating power with landowners and developers, resulting in longer-term commitments.
“...until
[the other organization] took over and said, we will not buy this farm unless we can secure a three-year lease at minimum.”
— Ashley Whelan | FED Urban Farm Program and Farm Operations Manager
This reality means precarious land tenure arrangements hinder long-term planning and influence infrastructure choices. BIA practitioners describe how uncertain land tenure forced them to avoid permanent installations, like coolers, and instead rely on off-site storage solutions.
Infrastructure Limitations: Creating Functional Safe Spaces
A challenge for BIA operations is the lack of appropriate agri-food infrastructure for a food safe produce, which complicates gardening operations’ design and safe upkeep. Whether it is space for workshops, food processing areas, or storage facilities, BIA projects often struggle to meet practical and regulatory requirements. Without adequate infrastructure, BIA practitioners face limitations in expanding their service offerings, which can negatively impact economic sustainability and community engagement.
Human Capital: Relying on Key Champions
Reliance on individual champions—key individuals who support BIA projects from inception through operation—can be both an asset and a liability. These champions often mobilize support, foster acceptance, and facilitate project setup. However, projects risk becoming too dependent on a single figure without institutional support. One farm operator describes how her project faced challenges when the land was slated for redevelopment, and her role lacked formal support.
This reliance on individual leadership rather than institutional backing limits long-term resilience and scalability. When champions leave, or projects lose momentum, the lack of structural support can result in project failure or relocation.
Addressing
the Challenges: Pathways to BIA
Overcoming these challenges requires a multifaceted approach:
nj Flexible Zoning Policies: Allowing food production on commercial and industrial land to expand the urban agriculture footprint.
nj Long-Term Land Tenure Agreements: Ensuring lease stability to support investment in permanent infrastructure.
nj Infrastructure Investment: Developing robust storage, processing, and programming support systems.
nj Institutional Support Models: Reducing reliance on individual champions through organizational capacity building.
Economic Feasibility: BIA Performance Across 8 Cities
This comparative analysis examines Vertical Farming (VF) and Greenhouse (GH) models for urban farming in 8 key cities, evaluating capital investment, operational feasibility, crop profitability, and return on investment (ROI). The Vancouver case study is highlighted here while the rest of the analysis is outlined in the appendix.
Overview of System Design & Assumptions
FACTOR
Total Area 500 m²
Area
Breakdown
Production System
Tested Crops**
70% production space (Not accounting for stacking) 30% support areas (office, storage, packing)
Multi-layer growing (up to 6 levels)
Genovese Basil (6 levels)
Lettuce (6 levels) Cherry Tomatoes (1 level)
Climate Control Horticulture-specific HVAC (temperature, humidity, lighting fully controlled)
Crop Yield
Consistency
High (controlled environment)
Infrastructure Pre-equipped for indoor farming (floors, drains, walls)
Energy Needs
Financing Model
Capital Investment
High (lighting, HVAC)
Modularized farm system
Designed for shipping and on-site assembly 12-year loan @ 5% interest
Standardized across locations
1,000 m²
90% production space 10% support areas (office, storage, packing)
Single-layer cultivation
Genovese Basil (1 level)
Lettuce (1 level) Cherry Tomatoes (1 level)
Natural climate adaptation, evaporative cooling, heating and supplemental lighting***
Variable (medium weather-dependency)
Additional structural requirements for wind resistance
Lower (depends on seasonal temperature and daylight hours)
Modularized farm system
Designed for shipping and on-site assembly 12-year loan @ 5% interest
Varies based on climate and structural needs
Table 8: System design and assumptions across vertical farming and greenhouse case studies.
* The VF model incorporates low-tech systems to reduce capital costs while maintaining efficiency.
** Crops chosen as they are the most researched with accessible data sets to use for this report.
*** In VF models, production remains consistent across locations due to controlled environments.
In GH models, yields and resource use vary based on local climate, modelled using 10 years of historical data.
Capital Expenditure (CAPEX) Estimates:
GH CAPEX varies by crop due to lighting needs based on local climate, while VF CAPEX remains consistent for all locations as the proposed farm is modularized and designed for shipping and on-site assembly.
* Productive racking for leafy greens and herbs includes a 6 level racking system with integrated lights and grow system. Racking for tomatoes is only one level.
Table 10: CAPEX summary for greenhouses, including stable and climate-dependent categories.
Table 9: CAPEX summary for vertical farming per crop across cities.
Economic Viability by Location
The economic performance of VF varies by location, primarily due to differences in operational expenses (OPEX), which are influenced by:
nj Major cost drivers such as energy, labour, and rent.
nj Revenue Factors include market price per unit, local demand, product waste levels (assumed at 10%).
nj Minor influences of waste costs, taxes, and other operational expenses.
Assuming that all VF models have consistent production characteristics across locations. The annual crop yields are estimated as follows:
City Profiles
Vancouver
In the case of vegetable production in the City of Vancouver, Tables 10–13 compare capital expenditures (CAPEX) across greenhouse (GH) and vertical farm (VF) models. Table 10 provides a detailed CAPEX breakdown for GH systems, while Table 12 does the same for VF. Notably, VF systems are climate-independent and require greater investment in lighting, whereas GH systems are more context-specific and incur higher heating costs. Table 13 summarizes these differences by crop: VF shows lower total CAPEX for cherry tomatoes, while GH is more cost-efficient for basil and lettuce.
Market Pricing & Distribution Assumptions
Crop Price Benchmarking
Prices were based on organic market rates since VF-grown products, like organic produce, typically command a local premium. Market research was conducted in January–February 2025, and seasonal price fluctuations may occur.
This model assumes wholesale pricing for basil while lettuce and cherry tomatoes are sold at retail prices to maximize revenue potential.
Table 11: Consistent annual vertical farming crop yields in Vancouver, BC.
Table 12: CAPEX data for greenhouse energy requirements in Vancouver, BC.
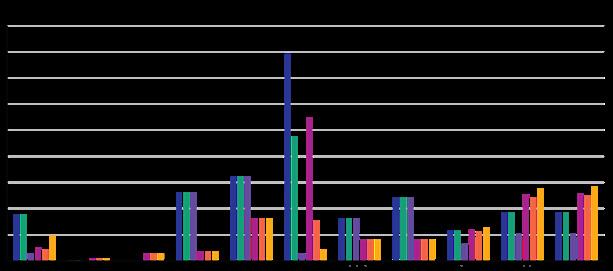
Figure 39: Comparative performance of vertical farms vs. greenhouses for lettuce and tomatoes across key
Vancouver, BC.
Table 13: Cost breakdown per crop type in Vancouver, BC.
Table 14: Economic performance and financial viability per crop in Vancouver, BC.
*Basil is the most profitable crop in both systems, with VF slightly outperforming GH.
**Lettuce is break-even in GH but risky in VF due to longer ROI (28.45 years).
***Cherry tomatoes are not viable in either system due to high costs and low returns.
Basil High (2.10-year ROIC)
Lettuce Low (28.45-year ROIC)
High (2.79-year ROIC)
Break-even
Cherry Tomatoes Not Viable Not Viable
Large-scale distribution required. Risk of market oversupply.
High labor costs, requires premium pricing to be profitable.
High light costs, long growth cycle, unoptimized indoor varieties.
Table 15: Crop-specific feasibility and market strategy overview in Vancouver, BC.
* The other City Profiles and their crop and cost breakdown can be found in the Appendix.
Focus on wholesale & retail mix. GH has lower OpEx, but VF allows for year-round production.
Seasonal GH production (warmer months) is best. VF is high-risk unless sold at a premium.
Avoid in VF. GH may work in warmer climates but not Vancouver.
Overall Economic Analysis
Performance Comparison (Basil)
Figure 42 presents a comparative analysis of the economic performance of VF (500 m2) and GH (1000 m2) models across eight cities, focusing on profitability (CAD) and Return on Invested Capital (ROIC) in years. VF outperforms GH in terms of profit in cities like New York and Los Angeles, with VF profits reaching nearly CAD 3 million in New York compared to approximately CAD 2.7 million for GH. However, in other cities like Vancouver, Calgary, Toronto, and Montréal, both systems show relatively modest profits, typically below CAD 500,000, with GH slightly outperforming VF in most cases.
Regarding ROIC, VF exhibits a low return period in New York (0.35 years) and Los Angeles (0.89 years), making it efficient. GH systems generally have a longer ROIC than VF, except in New York, where GH maintains a favourable 0.57-year ROIC.
The analysis highlights that VF is more profitable and efficient in cities with higher market prices and demand, like New York and Los Angeles. In contrast, GH remains competitive in cities with lower energy costs and operational expenses. The data suggests that urban environments with high produce prices and robust markets are best suited for VF, while GH can be more viable in regions with lower operational costs and more favourable climates.
$3,500,000
$2,000,000
$500,000
$0
Analysis of VF and GH Energy and Water Comparison Across Cities and Crops
The chart compares energy and water costs associated with VF and GH systems. The primary metrics analyzed include electricity, natural gas, and water consumption. VF systems consistently demonstrate higher electricity costs due to the requirement for 24/7 artificial lighting and climate control. This is particularly evident in cities like Los Angeles and New York, where electricity prices are relatively high. GH systems, in contrast, exhibit a more diverse cost profile, influenced by natural gas usage for heating in colder climates like Toronto, Calgary, and Montréal. Notably, cities with warmer climates, such as Los Angeles, Riyadh, and Dubai, show little to no natural gas expenses, as heating requirements are minimal or nonexistent.
Water costs present a comparatively lower expenditure across both systems, but VF systems tend to be more efficient in water usage due to controlled irrigation practices. While still efficient, GH systems are more susceptible to higher water usage, particularly in warmer and arid climates such as Dubai and Riyadh.
The contrast between VF and GH water consumption is especially stark in cities like Los Angeles and Dubai, where water scarcity and cost are significant concerns. This finding underscores the importance of adopting efficient water management strategies in GH setups within waterstressed regions.
Crop-specific analysis reveals that Basil consistently incurs higher energy costs across both systems, reflecting the crop’s sensitivity to temperature and light requirements. In contrast, Lettuce and Cherry Tomatoes exhibit a more balanced cost distribution. The choice between VF and GH depends on regional climate conditions, energy pricing, and crop requirements. While VF offers higher control and consistency, GH can be more cost-effective in regions with favourable natural conditions. Understanding these dynamics is crucial for decision-making in urban agriculture, particularly when prioritizing profitability and sustainability.
VF Elec. (Basil) VF Elec. (Lettuce)
Elec. (Tomatoes)
Food For Thought
The following four actionable recommendations are drawn from the Market Readiness analysis and aim to strengthen synergies between the built environment and food production. Together, they support resource recovery, operational efficiency, and the advancement of local food systems.
Diversify Revenue Models
Increase Community Engagement
Address Challenges of Land Access
Tailor Scaling Strategies
Diversify Revenue Models
BIA and UA organizations must diversify their revenue streams to build financial resilience, adopting multi-functional and flexible business models. Based on the study, successful revenue strategies include:
nj Selling agricultural infrastructure such as grow boxes and hydroponic systems.
nj Providing community services like garden maintenance, governance facilitation, and food literacy workshops.
nj Operating Community Supported Agriculture (CSA) programs and selling fresh produce through direct-toconsumer, wholesale, or restaurant channels.
Revenue Generation Strategies
One of the strongest drivers for BIA’s success is the growing demand for locally grown, high-quality fresh produce, particularly perishable items like greens. However, revenue generation models and funding requirements must align with project-specific needs and community support.
nj Smaller-scale systems may require grant funding to support ongoing maintenance and community programming.
nj Larger-scale operations like shipping container farms often need direct-to-consumer markets or partnerships with local retailers and wholesalers to achieve economic sustainability.
Strategic Integration
Diversifying revenue sources helps businesses adapt to market disruptions and enhances long-term viability. However, engaging with farmers and practitioners early in the project is crucial to understanding their capacity and potential contributions. This engagement can identify the trade-offs between high-cost infrastructure (shipping container farms) and more hands-on, cost-efficient systems (soil-based setups). Establishing clear roles minimizes operational challenges and improves service delivery. High produce prices and robust markets are best suited for VF, while GH can be more viable in regions with lower operational costs and more favourable climates.
Innovative Business Models
We identified unique business models that extend beyond typical farming operations through research interviews. For example:
nj Standalone Food Production Sites: Dedicated spaces for intensive crop cultivation.
nj Farm Incubators: Providing space and resources for microfarms to establish and operate independently.
nj Research Collaborations: Partnering with local colleges and universities to secure grant funding for environmental and social impact data collection, generating an additional revenue stream while measuring long-term benefits.
Increase Community Engagement
Community Building as a Revenue Source
Community engagement can generate revenue through workshops, events, and training programs. Projects emphasizing long-term community relationships and education initiatives may find grant funding opportunities more accessible. However, the time and effort required to secure such funding necessitate dedicated resources for program implementation and grant writing.
Best Practices for Architects and Developers
When implementing multiple projects, consider the relationships with BIA providers and build trust with key stakeholders. Integrating modularity and plug-and-play systems into project planning enhances the flexibility needed for long-term success. However, when community engagement and education are the primary objectives, prioritizing modularity may not be essential. Instead, baking food-growing infrastructures into institutional governance ensures that agriculture remains viable even as land uses evolve.
Address Challenges of Land Access
Land tenure and guaranteed access to space are fundamental to the success and longevity of BIA operations. Precarious land tenure remains a critical challenge, limiting long-term planning and influencing the types of infrastructure that can be deployed.
Strategic Land Use Planning
To ensure that BIA projects meet both tenant and operator needs, it is vital to establish clear and transparent land use agreements. Policymakers, developers, and community stakeholders should work together to develop secure, longterm land agreements that guarantee the right to cultivate and operate urban agriculture facilities.
Infrastructure Planning
The lack of agri-food infrastructure challenges BIA systems’ safe and effective maintenance. This can limit programmatic opportunities like corporate team-building exercises or community workshops. Modular and portable infrastructure investments can mitigate these challenges, especially when land tenure is uncertain.
Policy Support
Policymakers must recognize the need for flexible zoning policies that accommodate food production on commercial and industrial land. Clear guidelines on land use rights and infrastructure support can facilitate BIA projects integrated into urban planning frameworks.
Tailor Scaling Strategies
Scaling BIA projects requires a nuanced approach that balances vertical and horizontal growth strategies. Our research identified two primary scaling methods:
Vertical Scaling (Growth within a Single Site)
Vertical scaling involves expanding operations and increasing production capacity at existing sites. To achieve this, BIA organizations should:
nj Streamline operations and invest in monitoring and automation technologies to reduce labour demands.
nj Strengthen workforce capacity through specialized training, allowing teams to manage larger-scale operations efficiently.
nj Collaborate with developers to secure advanced infrastructure (e.g., vertical growing systems, climate control) that supports high-density farming.
Horizontal Scaling (Replication across Multiple Sites)
Horizontal scaling entails replicating successful models across different locations. To facilitate this:
nj Build partnerships with municipalities, landowners, and developers to secure transparent land use agreements.
nj Develop strategic alliances that support community engagement and localized governance, reducing dependence on specific sites.

Part IV:
Ecological and Environmental Impact
Cultivating the Landscape
Positioning: BIA as an Ecological Asset
Building-integrated agriculture (BIA) is often seen as an innovative food production strategy, but its ecological and environmental implications extend beyond farming.
BIA can play an active role in closing material loops and reimagining city infrastructure as part of an ecological cycle. BIA can actively contribute to climate resilience, biodiversity restoration, and resource conservation by embedding food production within urban infrastructures.
Unlike industrial agriculture, which can drive deforestation, soil depletion, and excessive water use, BIA operates in compact, resource-efficient environments such as rooftops, greenhouses, and hydroponic farms (Proksch, 2017). These systems optimize material loops by repurposing building waste streams, reducing reliance on synthetic fertilizers, conserving water, and lowering emissions through localized food production.
Carbon Reduction and Ecosystem Impact
How does BIA reduce emissions through food miles reduction, land savings, and soil health and regeneration? Industrial agriculture is a major driver of environmental degradation, contributing to:
nj 80% of global deforestation, accelerating climate change (Van Zanten et al., 2016).
nj 255% excess nitrogen emissions from synthetic fertilizers lead to water contamination and large-scale eutrophication.
nj 90% of phosphate use, depleting a non-renewable resource essential for food production (Imhoff, 2003).
nj Severe soil degradation, caused by intensive tillage, monocropping, and synthetic fertilizers, resulting in nutrient depletion, acidification, and erosion (Mangalassery et al., 2018; Gomiero, 2016).
nj Reliance on long-distance supply chains (Food Miles) increasing dependence on energy-intensive transportation (Weber & Matthews, 2008), exacerbated by wasteful distribution systems.
The central question of this section:
How does BIA contribute to urban ecological regeneration, and how can its design maximize environmental benefits?
This chapter compares BIA with industrialized open-land farming, evaluating its environmental impact across four pillars:
a. Carbon Reduction
b. Resource Conservation & Recovery
c. Biodiversity Enhancement
d. Climate Resilience
Resource Conservation & Recovery
How does BIA improve urban resource cycles through rainwater harvesting, greywater reuse, stormwater retention, and closed-loop nutrient recovery? Industrial agriculture places pressure on natural resources, contributing to:
nj Over 70% of global freshwater withdrawals, making it the largest consumer of freshwater (Dsouza et al., 2021).
nj Organic food waste, much of which is landfilled, produces methane and overloads urban waste management systems (Salomon et al., 2020).
Biodiversity Enhancement
How does BIA create urban habitats, restore pollinator corridors, and support ecosystem diversity? Industrial agriculture is a major driver of biodiversity loss, contributing to a 68% decline in global mammal, bird, fish, reptile, and amphibian populations since 1970 (World Wildlife Fund, 2021).
Climate Resilience
How does BIA mitigate heat island effects, improve air quality, and strengthen urban resilience to climate change? Food production significantly contributes to climate change, accounting for 26% of global GHG emissions.
Approach: Evaluating BIA’s Ecological Impact
This chapter contextualizes BIA as a strategy for urban ecological regeneration. It evaluates how BIA can improve carbon reduction, resource conservation and recovery, biodiversity, climate resilience, and land use efficiency through:
nj Literature review and empirical data captured through 51 research papers to establish environmental benefits.
nj Quantitative performance metrics and comparative analysis to measure impact.
nj Case studies to validate real-world applications, focusing on Skeena Terrace, Vancouver, Canada.
The case studies explore the comparative reduction of carbon emissions associated with land savings, food miles, and resource conservation for three common food sources: basil, lettuce, and tomatoes. This chapter also examines climate resilience and urban heat islands in the context of the current 2025 versus future climate modelling for 2080, highlighting the impact untampered higher temperatures have on human health and wellbeing, economic productivity, the environment and critical infrastructure and services.
Biodiversity Enhancement Species diversity (%) Habitat Quality Index
Carbon Reduction CO₂ saved (kg/m²) Life Cycle Assessment (LCA)
Resource Conservation and Recovery Resource Use Reduction (%) Urban Hydrology Modeling
Land Regeneration Food Miles Land Area Preserved (ha)
Productivity & Land Savings Analysis
Climate Resilience Temperature Reduction Urban Heat Island (UHI) Modeling
Table 16: Ecological pillars assessed in the Skeena Terrace case study.
The carbon cycle illustrates an inventory of the location of carbon dioxide (CO2) within our planet’s carbon pools. The impact of removing CO2 from the atmosphere depends on exchange and time.
Exchange
Forests sequester and store carbon, cycling it from the atmosphere to the biosphere to soil carbon, and back. Land use change and poor management practices break this cycle. Best management practices and market demand can support it.
Time
One tonne of carbon must be stored for at least 100 years to neutralize 1 tonne of today’s GHG emissions (Government of British Columbia, 2021). Longevity of use and opportunity for reuse are essential factors for maintaining and increasing storage of carbon in timber products.
Figure 42: The carbon cycle. Adapted from: Proksch, 2017.
Skeena Terrace, Vancouver, BC
Architect: Perkins&Will Developer: BC Housing Site: 10.8 acres Proposed Homes: 1,283 affordable rental homes, 641 market-rate rental homes Key Sustainability Features: Circular resource flows, mass timber, modular construction, urban agriculture Farm Operators: TBD Location: Vancouver, BC Climate Dependence: Climate Dependent Scale: ~12,000m ² of cultivated area* ―Growing Locations: Building adjacent and Rooftops ― Growing Strategy: Rooftop Green Roofs Growing System: Soil Based Primary Crops: TBD Policy: Rezoning Policy for SLD * Option 1 ~1,000 m² of cultivated land Option 2 ~12,000 m² (maximum feasible cultivation rooftop and at grade area ).
Vancouver, BC, is located on the the traditional, ancestral, and unceded territories of the the xʷm
Skeena Terrace is one of BC’s largest subsidized housing developments, originally built in the 1960s to provide affordable housing. BC Housing operates this 10.8-acre site in Vancouver, which has been home to generations of families. Today, with aging infrastructure and an ongoing affordability crisis, Skeena Terrace is undergoing a full redevelopment, transforming it into a high-density, transitoriented residential community.
The project proposes seven land parcels, integrating affordable and market-rate rental housing, childcare facilities, retail, and live-work spaces. The site is designed to support active transportation, reduce environmental impact, and enhance local resilience through green infrastructure and urban agriculture. The development aims to integrate modular construction and mass timber for sustainability while leveraging its ecological connections to the Still Creek Watershed and regional greenways.
The redevelopment offers an opportunity to integrate high-yield, space-efficient food systems, aligning with Vancouver’s sustainability goals and reducing dependence on long-distance food imports. The integration of private, semi-private and public urban agriculture became a priority for the project to encourage community engagement, interactive open spaces and connection to nature.
The case study outlined in this chapter assesses the potential for BIA at Skeena Terrace, focusing on food production capacity, resource efficiency, and environmental impact. The comparative analysis explores two scenarios:
nj Baseline: ~1,000 m² cultivated land.
nj Hypothetical: ~12,000 m² maximum feasible cultivation.
Across three key BIA models:
nj Community gardens (orchard) & Edible Landscaping at grade
nj Rooftop green roofs
nj Indoor hydroponic vertical farming (hypothetical)
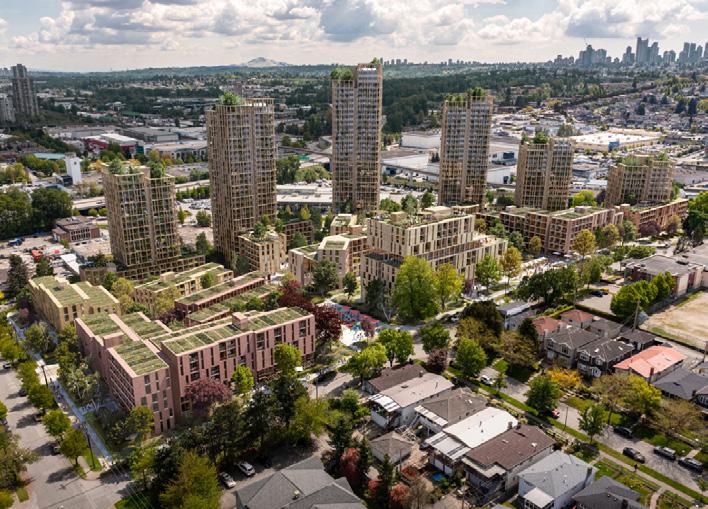
Figure 43: Perkins&Will, Skeena Terrace, Vancouver, BC. Rooftop urban farming integrated into the BC Housing project.
Farm Operations
Food Production & Distribution Strategy
To ensure urban agriculture viability, the project explores farm-to-community networks such as:
nj On-site Harvesting & Processing: Fresh produce delivered directly to residents or sold in local markets (weekly fresh food stalls).
nj Supply Chain Integration: Partnerships with grocery stores, local food hubs, and community-supported agriculture (subscription-based CSA) programs.
nj Waste-to-Resource Loop: Organic waste composting via on-site biodigesters, reducing waste hauling emissions.
nj Education and training programs on sustainable food production.
Water & Energy Optimization
nj Closed-Loop Irrigation: Water reuse in hydroponic systems reduces consumption by up to 95%.
nj Stormwater Harvesting: Collection systems for irrigation could replace up to 75% of potable water use.
nj Energy Recovery: Heat waste from residential buildings could offset greenhouse heating demand in winter.
Policy & Implementation Considerations
nj City of Vancouver Food Strategy: Supports urban food assets in large-scale developments.
nj Sustainable Large Developments (SLD) Policy: Requires onsite sustainability features, including food production.
nj BC Energy Step Code: Impacts energy efficiency strategies for controlled environment agriculture.
Benefits
Soil Health and Regeneration: Restoring the Foundations of Agriculture
Land Savings and Optimizing Urban Agriculture
• Food Miles Reduction: Localizing Food Systems for Sustainability
• Water Conservation: Optimizing Use and Reducing Waste
• Organic Waste Valorization: Closing Urban Nutrient Loops
• Energy Efficiency & Carbon Reduction
Figure 44: Perkins&Will, systems diagram of Skeena Terrace, Vancouver, BC.
“Urban Ecology is enhanced by protecting and promoting preserves, ecologically functional patches, corridors, and a high-quality matrix of small units distributed between them. This matrix is composed of small parks, street trees, and even backyards and green roofs. The quality of these spaces depends on species selection, structural composition, soils, and provision of shelter, food, and water.
Urban agriculture can play an important role in productivity, nutrient cycling, decomposition, pollination, seasonality, and interaction with other ecosystem processes that sustain all life while reconnecting people to processes that are deeply rooted within ourselves.”

Juan Rovalo | Perkins&Will Director of Ecology
Biodiversity Enhancement
Biodiversity loss has accelerated over the past century due to habitat destruction, land conversion for agriculture, and unsustainable land management.
Since 1970, global populations of mammals, birds, fish, reptiles, and amphibians have declined by 68% (World Wildlife Fund, 2021). Vertebrate extinction rates since 1900 are estimated to be 100 times higher than background extinction rates (Clucas, et al., 2018).
The primary driver of biodiversity loss is habitat loss and fragmentation caused by unsustainable agricultural expansion and logging (World Wildlife Fund, 2021). Beyond direct habitat destruction, industrial agriculture contributes to chemical pollution, soil degradation, disruption of water cycles, and excessive resource extraction, all of which negatively impact ecosystems (Imhoff, 2003).
Despite these alarming trends, urban policy rarely prioritizes biodiversity (D.L. Evans, 2022). Urban planning typically responds to immediate social and economic needs, overlooking biodiversity’s role in stormwater management, air pollution control, pest regulation, carbon sequestration, and water quality. However, the economic value of biodiversity is significant, natural processes such as pollination and pest control alone contribute over $57 billion annually to U.S. crop production resilience (Brenda B.Lin, 2015). Additionally, (Imhoff, 2003) found that species richness – a measure of biodiversity – is positively correlated with the selection of land for urbanization and agricultural conversion and concluded that humans tend to settle and prosper in the most species-rich areas.
The Role of Urban Agriculture in Biodiversity Enhancement
UA has the potential to enhance biodiversity and support ecological functions, yet research remains limited and largely qualitative (Clucas, 2018; Evans, 2022). While over 100 field studies suggest urban farming increases biodiversity, a lack of standardized data collection and quantitative metrics makes it difficult to measure its full impact. Without sufficient scientific evidence, governments and policymakers lack incentives to integrate biodiversityfocused strategies into urban agricultural planning.
Key Impacts of Urban Agriculture on Biodiversity
nj Creating Urban Habitats: Outdoor urban farms, such as community gardens and edible landscapes, provide refuge and stepping stones for wildlife (Clucas, et al., 2018). Strategic placement of green corridors and pollinatorfriendly spaces supports the movement of species, increasing population connectivity (B.Lin, et al., 2015).
nj Reducing Habitat Fragmentation: Integrating urban farms into the built environment reduces impervious surfaces, allowing more diverse plant and animal species to persist in urban landscapes.
nj Boosting Pollinator Populations: Flower-rich urban farms increase bee abundance and diversity, supporting essential pollination networks. Native flowering plants extend seasonal blooms, sustaining pollinators over longer periods (Lin, 2015).
nj Minimizing Pesticide and Fertilizer Runoff: Urban farmers often forgo chemical pesticides and fertilizers due to cost, environmental concerns, or public health policies (Joshua E. Arnold, 2019). Instead, they favour biocontrol methods, which rely on natural predators and companion planting to manage pests (Lin, 2015).
nj Supporting Indigenous Knowledge Systems: Traditional intercropping techniques, such as the Three Sisters Method (corn, climbing beans, and squash), demonstrate how companion planting enhances biodiversity while improving soil structure and reducing chemical inputs (Kimmerer, 2013). Corn acts as the structure for beans to climb, beans fix nitrogen in their roots, stabilizing corn in high winds, and squash’s broad leaves provide shade retaining soil moisture and suppress weeds.
Vertical Farming: A Scalable Biodiversity Solution
Vertical farming—using hydroponic, aquaponic, and aeroponic systems—presents a unique opportunity to decouple food production from fertile land, thereby preserving natural habitats. Unlike conventional farms, vertical farms can be in underutilized urban spaces, such as parking structures or abandoned buildings (Philomena & Nirmal, 2016).
Key Benefits of Vertical Farming for Biodiversity:
nj Land Preservation: Producing food vertically rather than expanding cropland protects existing ecosystems.
nj Eliminating Chemical Runoff: Nutrient solutions are delivered directly to plants, preventing fertilizer leaching and eutrophication of waterways.
nj Reducing Habitat Destruction: At scale, vertical farming could limit agricultural land expansion, protecting forests, wetlands, and grasslands from conversion to farmland.
nj Hydroponic farming produces yields 1,000 times greater per square meter than conventional soil-based farming (Philomena & Nirmal, 2016).
Best Practices for Biodiversity-Focused Urban Agriculture
nj Three-Dimensional Planting & Agroforestry: Encourages vertebrate abundance by creating layered habitats (B.Lin, et al., 2015).
nj Composting & Biocontrol Methods: Attracts predatory species, reducing reliance on chemical pesticides.
nj Intercropping & Cover Cropping: Increases plant diversity, supporting soil microbes and pollinators.
nj Edible Native Plant Integration: Ensures urban farms support local wildlife and ecosystems.
nj Green Corridors & Pollination Networks: Strategically placing urban farms near parks and natural areas enhances species connectivity.
Challenges and Future Directions
Despite its potential, urban agriculture’s role in biodiversity conservation is still under-researched. A recurring issue in biodiversity studies is the lack of standardized, quantitative assessments (Imhoff, 2003). Most research remains qualitative and site-specific, making it difficult to scale successful biodiversity-focused strategies (Clucas, 2018).
Key Research Gaps and Recommendations:
nj Develop standardized biodiversity metrics for urban agriculture to enable data-driven decision-making.
nj Incorporate biodiversity goals into urban planning to prioritize pollinator corridors and ecological connectivity.
nj Expand educational initiatives to help urban farmers implement biodiversity-enhancing practices, such as flower richness, native edible species, and rewilding efforts (Royer, et al., 2023).
Integrating urban agriculture and biodiversity strategies will be critical for creating resilient, ecologically functional cities as urban populations grow. A data-driven approach will ensure that biodiversity conservation is embedded in urban farming policy and practice.
Skeena Terrace Biodiversity Enhancement
Urban Ecological Context
Skeena Terrace sits within the Lower Mainland Ecoregion, a diverse and ecologically significant area. Urban development has historically led to stream burials, loss of wetlands, and habitat fragmentation. The site has direct connectivity to Still Creek, Brunette River, and Burnaby Lake, providing opportunities for ecological restoration.
Wildlife Habitat Support
Land transformation, habitat loss, pollution (including chemical, noise, and light pollution), resource overexploitation, and the introduction and expansion of invasive species are the main threats to biodiversity. Current environmental regulations have led to varying degrees of wildlife recovery.
PRIORITY GROUP
GENERAL STATUS
Salmon & Trout Severely reduced but showing slight recovery due to stewardship and habitat restoration.
While songbirds remain abundant and 12 bald eagle pairs nest in the city, shorebirds, insectivores, and forest-dependent species are declining.
Birds
nj Barn swallows have declined 90% since the 1970s.
nj Ruffed grouse and yellow-billed cuckoo are no longer found in Vancouver.
Native Frogs Pacific tree frogs remain relatively common, but red-legged frogs (a provincially threatened species) have not been recorded recently in Vancouver or Burnaby.
Large mammals (deer, elk, bear, wolf, cougar) are no longer present.
nj Coyotes are now the top predators.
Mammals
nj Coast moles, striped skunks, and raccoons have stable populations.
nj Whales & dolphins are more frequently observed in the Burrard Inlet.
Forage Fish Pacific herring, surf smelt, Pacific sand lance, and eulachon are severely declining, threatening the marine food web.
Native Bees Populations are sharply declining. The western bumblebee is now extirpated in Vancouver, posing a threat to fruit tree and vegetable crop pollination.
Figure 45: Vancouver Plan, 2022, future ecological corridors with Skeena Terrace highlighted.
Table 17: Priority species for protection at Skeena Terrace, Vancouver, BC, and their status.
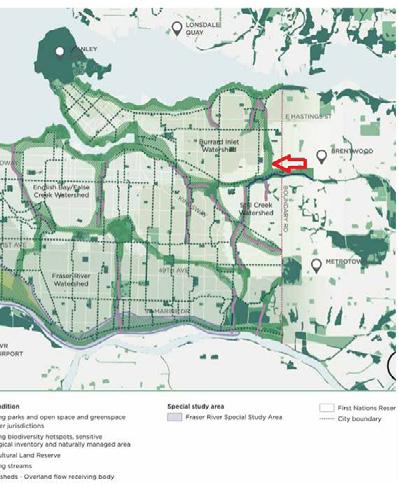
Biodiversity Restoration Strategies
nj Habitat Corridors: Strengthening ecological linkages to Still Creek to support migratory birds and aquatic species.
nj Pollinator Meadows: Traditional lawns should be replaced with native flowering species to support declining pollinators like monarchs, painted lady, and West Coast lady butterflies. The City of Vancouver promotes pollinator meadows in parks, partnering with initiatives like the Butterfly way Project (David Suzuki Foundation, 2025).
nj Invasive Species Management: Controlling plants like English Ivy, Japanese Knotweed, and Himalayan Blackberry to protect native plant communities.
Urban Farming and Wildlife Interactions
nj Use of bird-friendly landscape designs to prevent collisions and predation risks.
nj Integration of bat boxes to support natural pest control and enhance biodiversity.
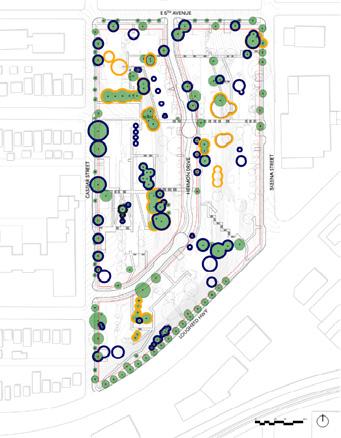

Tree Retention
The mature tree collection at Skeena Terrace, Vancouver, BC, plays a key role in shaping the redevelopment. As part of the rezoning submission to the City of Vancouver, a site-wide ecological assessment classified trees by retention value:
nj High Retention: Trees in good to excellent health, structurally sound, and prioritized for preservation.
nj Medium Retention: Trees with moderate health, requiring minor intervention but suitable for retention, especially in groups.
nj Low-No Retention: Trees in poor health or structurally compromised, deemed unsuitable for preservation.
Culturally Significant & Notable Trees
nj Includes community-identified trees, native species, and public street trees.
nj Tree groupings enhance wildlife habitat, support root communication, and share nutrients, strengthening weaker trees.
Figure 46: Tree retention plan for Skeena Terrace, Vancouver, BC.
Carbon Reduction
Soil Health and Regeneration:
Restoring the Foundations of Agriculture
Soil is the foundation of all terrestrial life, yet conventional agriculture practices have contributed to its degradation. Intensive farming practices – mechanized tillage, synthetic fertilizers, and monocropping – have degraded soil structure, disrupted microbial ecosystems, and depleted essential nutrients.
The result? Erosion, acidification, water scarcity, and declining soil fertility, all of which threaten long-term food security. UA and BIA are among the key regenerative alternatives, leveraging organic soil management, closed-loop nutrient cycles, and reduced land disturbance to restore soil health.
Key Impacts of Industrialized Agriculture on Soil:
nj Soil erosion and compaction: Monocropping and mechanical tillage destroy soil structure (Gomiero, 2016), reducing water retention and inability to sustain plant growth (Beniston & Lal, 2016).
nj Nutrient depletion: Excessive nitrogen and phosphorus use leads to imbalances, requiring constant chemical amendments.
nj Chemical runoff: Synthetic fertilizers and pesticides contaminate water sources, harming ecosystems.
UA & BIA for Soil Regeneration
nj Organic soil management: Raised beds and rooftop gardens use biochar, compost, and manure to increase soil organic matter.
nj Microbial enrichment: BIA farms foster beneficial fungi and bacteria (30-50% higher microbial biomass), restoring natural nutrient cycles.
nj Closed-loop nutrient systems: Hydroponic and aquaponic BIA models recycle water and nutrients, reducing waste while increasing crop yields by 20%, requiring less land (Diehl et al., 2020).
nj Urban composting and regenerative soil management techniques in BIA farms reduce soil degradation rates by up to 40% (McDougall et al., 2020).
The Crisis of Soil Degradation, Erosion
and Structural Collapse
Soil degradation is more than just nutrient depletion; it is the breakdown of soil architecture, disrupting its ability to retain water, support plant life, and resist erosion. Conventional tillage destroys soil aggregates, reducing moisture retention and increasing susceptibility to drought and erosion. Heavy machinery compacts the soil, limiting root penetration, aeration, and microbial activity, leading to nutrient depletion (Mangalassery et al., 2018).
Expanding croplands into marginal areas, often through deforestation, exacerbates soil instability, accelerates land degradation, and increases the risk of desertification (Lal, 2019). Meanwhile, the pressure to meet rising food demands has intensified reliance on synthetic fertilizers and pesticides, which, while boosting short-term yields, weaken soil resilience and ecosystem stability over time (Salomon et al., 2020). Without effective soil management, degradation progresses rapidly, threatening the long-term sustainability of conventional farming (Beniston & Lal, 2016).
Key Impacts of Conventional Farming on Soil Structure (Beniston & Lal, 2016):
nj Disrupted soil aggregates: Tillage breaks apart soil structure, accelerating erosion.
nj Compaction from mechanization: Compressed soil impairs water infiltration, causing surface runoff.
nj Loss of porosity: Reduced air pockets in soil suffocate microbial life.
BIA as a Structural Solution
UA and BIA practices offer a regenerative approach to minimize soil degradation while maintaining food production. Unlike industrial farming, BIA systems minimize soil disturbance and enhance soil stability, moisture retention, and microbial diversity through organic amendments such as compost, biochar, and manure (Igalavithana et al., 2017).
Additionally, organic mulches, compost, and ground covers improve soil organic matter content, strengthening moisture retention and aggregate stability, two key factors in erosion prevention (Ugarte & Taylor, 2020). By increasing soil resilience, BIA also enhances water infiltration and retention, helping to reduce runoff, a critical issue in urban environments where impervious surfaces worsen stormwater management challenges (Sanyé-Mengual et al., 2018).
Key BIA Strategies for Soil Restoration
nj Compost & Biochar Enrichment: Increases organic matter, strengthening soil aggregates, improving moisture retention and nutrient availability.
nj No-Till, Raised Bed & Rooftop Cultivation: Reduces compaction, enhancing root penetration and aeration and preventing soil erosion by limiting exposure to wind and precipitation displacement (Salomon et al., 2020).
nj Mycorrhizal Fungi Integration: Strengthens soil stability, reduces erosion risk, and enhances nutrient uptake (Proksch, 2017).
nj Closed-Loop Irrigation: BIA farms recycle water and nutrients, reducing waste and improving efficiency (Ugarte & Taylor, 2020).
nj Urban Expansion & Soil Regeneration: As more food production is invited into cities, parts of conventional farmland can be repurposed for rewilding, which restores its organic matter content, microbial diversity, and natural nutrient cycles (Gomiero, 2016). Studies show that abandoned cropland accumulates soil carbon at rates comparable to actively reforested land, demonstrating its potential for climate change mitigation (Beniston & Lal, 2016).
Nutrient Depletion and Sustainable Management
Soil nutrient depletion is challenging in conventional farming, where monocropping and excessive fertilization disrupts natural soil chemistry. Heavy applications of nitrogen and phosphorus-based fertilizers lead to nutrient leaching, contaminating waterways and disrupting aquatic ecosystems (Gomiero, 2016). At the same time, conventional agricultural practices strip the soil of essential micronutrients, necessitating periodic amendments that further disturb natural nutrient cycles (Beniston & Lal, 2016).
Over time, reliance on synthetic fertilizers contributes to soil acidification, reducing organic matter retention and diminishing beneficial microbial activity, critical for long-term soil fertility and plant health (Salomon et al., 2020). Without interventions that restore soil balance, conventional farming methods exacerbate nutrient deficiencies, requiring increasing external inputs to sustain yields.
Key Impacts of Conventional Farming on Soil Fertility
nj Nutrient leaching: Excess nitrogen and phosphorus runoff contaminates waterways (Arcas-Pilz et al., 2021).
nj Micronutrient depletion: Conventional methods strip the soil of essential trace elements.
nj Soil acidification: Chemical inputs lower soil pH, reducing its ability to retain organic matter.
Key BIA Strategies for Nutrient Regeneration
nj Composting & Vermicomposting: Repurpose food and plant waste into nutrient-rich soil amendments, Providing a steady release of nutrients and preventing sudden surges or depletions (Igalavithana et al., 2017) (Ade Oluwa et al., 2010).
nj Biofertilizers & Organic Amendments: Enhances microbial activity, supporting natural soil nutrient cycles. Urine-derived fertilizers and organic waste have been explored as viable nutrient sources for urban agriculture (Ade Oluwa et al., 2010).
nj Struvite-Based Fertilizers: Extracts phosphorus from wastewater, providing a sustainable alternative to mined phosphorus (Arcas-Pilz et al., 2021).
nj Hydroponic & Aquaponic Systems: Recycle nutrients within closed-loop systems, reducing waste and runoff contamination (Ugarte & Taylor, 2020).
nj Cover Cropping & Intercropping: Fixes nitrogen and improves soil structure, reducing reliance on chemical inputs (Mangalassery et al., 2018) (Proksch, 2017).
Denitrification
Figure 47:
Nitrogen gas in air
leguminous plants absorption through roots cycle
human community compost
mono-nitrogen oxides fixation by fertilizer
human interventions
Nitrogen Fixation Nitrification
natural phosphorus cycle Phosphate Rock
human interventions
additional sources for nutrients reaching the ground
Skeena Terrace
Geology, Soil Composition, and Risks
Geology, Soil Composition, and Risks
The Skeena Terrace site lies within the Fraser River lowlands, shaped by glacial deposits from the last Ice Age (~25,000–11,000 years ago). Subsurface conditions include layers of glacial till, gravel, sand, clay, and silt. The upper terraces likely consist of compacted glacial till, which restricts drainage and necessitates raised beds or deep soil amendments for planting. In contrast, lower terraces, characterized by sand and silt, are more susceptible to seasonal waterlogging and require dedicated drainage infrastructure such as bioswales or treatment cells.
The site is located in a moderate-to-high earthquake and flood risk zone. Ground elevations along Skeena Street are below the required Flood Construction Level (FCL) of 23 meters for the eastern portion of the site. As a result, ground-level programs incorporate flood-resilient design strategies. These include flood-proof elevators, waterproof wall skirting, and elevated mechanical and electrical systems with surge protection and accessible junction boxes.
BIA Soil Management and Restoration Strategies
nj Organic Soil Enrichment: Compost and biochar to improve soil structure, enhance water retention, and increase nutrient retention.
nj Raised Beds and No-Till Cultivation: On upper terraces, raised beds address poor drainage, while no-till methods protect soil microbiology and reduce erosion risks.
nj Drainage and Stormwater Management: Lower terraces should integrate bioswales and drainage systems to mitigate waterlogging and prevent nutrient runoff.
nj Flood-Resilient Design Interfaces: Ground-level urban agriculture spaces along Skeena Street should enhance the public realm while meeting FCL compliance—avoiding retaining walls in favor of active edges formed by buildings and landscape elements.
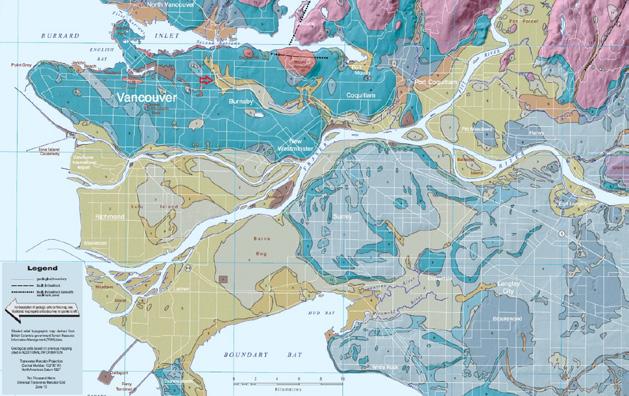
Figure 48: GeoMap section showing Vancouver, BC. Skeena Terrace indicated by red circle (Turner & Clague, 1997).
Edible Native Species for Regeneration
These species hold cultural value and significance as they are recognized as First Foods. The history of First Foods and First Nations is intimately connected. For many First Nations, the seasonality of wildlife migrations on land and water, the seasonal cycles of emergence, flowering, fruit production, and root development guided communities across the land, from longhouses and camps by the rivers, hills, or high mountains.
Several native plant species are suitable for soil restoration while also supporting biodiversity and food production:
nj Nitrogen Fixers: Springbank Clover (Trifolium wormskioldii), Wild Mint (Mentha arvensis).
nj Deep Rooted Species for Soil Aeration: Camas (Camassia quamash), Chocolate Lily (Fritillaria camschatcensis).
nj Erosion Control: Sword Fern (Polystichum munitum), Bracken Fern (Pteridium aquilinum).
Some of the edible species that the project could invite to establish include the following:
COMMON
Yarrow Achilea millefol Leaves, flowers
Nodding Onion Allium cernuum Bulbs
Serviceberries Amelanchier alnifolia Berries
Kinnikinnick Arctostaphylos uva-ursi Berries
Wild Ginger Asrum Caudatum Leaves, rhizomes
Balsamroot Balsamorhiza sagittata Roots
Camas Camassia quamash Bulbs
Fireweed Chamerion angustifolium Young shoots, leaves
Bunchberry Cornus canadenis Berries
Wild Carrot Daucus carota Roots
Yellow Glacier Lily Erthronium grandiflorum Bulbs
Coastal Strawberry Fragaria chiloensis
Berries
Chocolate Lily Fritillaria camschatcensis Bulbs
Salal Berries Gaultheria shallon Berries
Bitterroot Lewisia redivia Roots
Oregon Grape Mahonia aquifolium Berries
Wild Mint Mentha arvensis Leaves
Thimbleberries Rubus paviflorus Berries
Salmonberries Rubus spectabilis Berries
Blackberries Rubus spp.
Berries
Wapato Sagittaria latifolia Tubers
Elderberries Sambucus spp.
Springbank Clover Trifolium wormskioldii
Nettle Urtica dioica
Red Huckleberries Vaccinium parvifolium
Berries
Roots
Young leaves
Berries
Huckleberries Vaccinium spp. Berries
Table 18: Edible native species suitable for regeneration at Skeena Terrace, Vancouver, BC.
Upland, various habitats
Upland, rocky areas
Upland, open woodlands
Upland. well-drained soils
Upland, prairies
Upland, well-drained meadows
Upland, disturbed areas
Upland, forested areas
Upland, fields, and meadows
Upland, meadows
Upland, coastal areas
Upland, moist meadows
Upland,moist meadows
Upland, dry areas
Upland, forested areas
Upland, moist areas
Upland, moist forests
Upload, moist forests
Upload, various habitats
Wetland, marshes
Upland, forest edges
Upland, moist meadows
Upland, various habitats
Upland, forested areas
Upland, higher elevations
Most of these species are well-suited to upland areas, with only the Wapato (Sagittaria latifolia) requiring wetland conditions. This species should be interspersed with other species to complement their natural association, following the patterns found in reference native habitats.
Land Savings and Optimizing Urban Agriculture
The expansion of conventional agricultural land is a major driver of deforestation and land conversion, accelerating habitat loss and soil degradation.
Alternatively, BIA utilizes urban infrastructure for efficient food production, reducing the need for rural industrialized farmland expansion. Studies suggest that city-wide urban agriculture could conservatively supply 34% and up to 77% of a city’s food demand, decreasing reliance on traditional farmland (McDougall et al., 2020). By maximizing underutilized urban spaces, such as rooftops, vacant lots, and indoor environments, BIA can optimize food production within city limits, reducing pressure on rural landscapes.
The Role of BIA in Land Conservation
Maximizing Productivity in Limited Space
BIA increases yield per unit area, making urban food systems more land-efficient than traditional agriculture. Vertical farming models demonstrate that food production can be intensified without requiring expansive horizontal rural land conversion. Lovell (2010) highlights, “Urban agriculture offers a new frontier for land use planners and landscape designers to become involved in the development and transformation of cities.” Studies show that 10% of urban rooftops for agriculture could reduce farmland requirements by over 5% (McDougall et al., 2020).
Case Study: Singapore’s Sky Greens Vertical Farm
nj Produces 1.5 tons of vegetables per square meter annually, making it 10 times more productive than traditional farmland (Diehl et al., 2020).
nj Enables high-density food production, reducing the need for agricultural expansion.
Alternative Feed Production for Livestock
nj Expanding livestock farming is one of the most landintensive agricultural activities.
nj Research shows that BIA food waste-derived livestock feed can reduce land use for feed production by up to 30%, further conserving agricultural land (Van Zanten et al., 2016).
Repurposing Underutilized Urban Spaces
BIA transforms vacant urban areas into productive agricultural zones, supporting localized food production while reducing land competition. Cities can leverage:
nj Rooftop Farms: High-yield food production integrated into existing infrastructure.
nj Vacant Lot Farming: Reclaiming underutilized spaces for community agriculture.
nj Indoor & Vertical Farms: Expanding food production without additional land use.
Cities like Singapore have successfully integrated vertical farms into mixed-use developments, demonstrating how urban landscapes can accommodate high-yield agriculture (Diehl et al., 2020). McDougall et al. (2020) found that “urban agriculture can be highly productive in terms of yield per unit area, but productivity is limited by available land and high input requirements.” However, integrating BIA within existing infrastructure can mitigate these constraints, making urban food production viable for sustainable land use.
Reducing Agricultural Land Expansion and Food Miles
Localizing food production through BIA reduces dependency on conventional farming and minimizes the need for extensive land conversion. Research suggests that reducing food miles through localized production could lower agricultural land use by 15% (McDougall et al., 2020). By shifting production closer to urban populations, BIA:
nj Reduces food miles, cutting reliance on long-distance supply chains.
nj Limits greenhouse gas emissions, optimizing land use efficiency.
nj Strengthens decentralized food networks, improving local food security.
Food Miles Reduction: Localizing Food Systems for Sustainability
The environmental impact of food transportation has grown as global food systems rely increasingly on long-distance supply chains.
Food miles – the distance food travels from production to consumption – are a key metric for assessing the sustainability of food systems (Boyer et al., 2019). Industrialized food networks depend on energy-intensive transportation, leading to higher GHG emissions, food spoilage, and energy losses from refrigeration, packaging, and distribution (Weber & Matthews, 2008).
BIA offers a promising approach to localizing food production, reducing transportation-related emissions, and strengthening urban food security. However, its effectiveness in reducing food miles depends on crop perishability, climate conditions, urban density, and energy requirements. These factors must be carefully evaluated to ensure net sustainability benefits.
The
Impact of Long-Distance Food Transportation
The transportation sector is a major contributor to agricultural emissions, with air freight producing the highest carbon footprint. Studies show that perishable crops shipped by air have a more significant environmental impact than regionally produced or locally grown alternatives (Boyer et al., 2019). The data in Table 19 highlights the variation in emissions between transportation methods, emphasizing that reducing reliance on air-freighted produce through localized BIA farms could meaningfully reduce transportation emissions (Li et al., 2022).
GHG Emissions by Transportation Mode
nj Air freight is the highest emitter, with domestic flights producing 246 g CO₂e per km.
nj Sea freight produces just 19 g CO₂e/km.
nj Rail and public transit systems generate lower emissions than individual vehicles for food distribution (UK Department for Energy Security and Net Zero, 2022).
Table 19: GHG emissions by transport mode related to food miles.
Targeting High-Impact Crops for Food Miles Reduction
Not all crops benefit equally from localization. Highly perishable produce like leafy greens, berries, and tomatoes see the most food miles reductions when grown within BIA systems, reaching 80%, 75%, and 65%, respectively. These crops require rapid transportation and refrigeration, making them prime candidates for urban farming. In contrast, root vegetables and grains with longer shelf lives and transport efficiencies show more moderate 40% and 15% reductions, respectively (Boyer et al., 2019) (Pirog & Benjamin, 2003).
Geographic Variation in Food Miles Reduction
In Canada, California is the primary supplier of leafy greens (lettuce) and tomatoes to the country’s most populous provinces. The table below outlines 2020 trade volumes for British Columbia, Alberta, Ontario, and Quebec. Across these provinces, California and Mexico dominate tomato imports, though Italy surpasses Mexico in Quebec, securing a larger market share. In British Columbia, California accounted for 55.2% of lettuce imports (20.1 million kg) and 28.0% of tomatoes (45.8 million kg). Similarly, in Ontario, California supplied 56.1% of lettuce (58.1 million kg) and 20.6% of tomatoes (96.3 million kg) (Canadafoodflows, 2024).
Food Miles Reduction Insight
nj Urban farming reduces food miles by up to 80% for perishable crops like leafy greens.
nj Grains and root vegetables show only moderate reductions, as they are more efficiently transported via rail or sea.
Table 20: Food mile reduction potential of BIA per crop. Sources: Boyer et al., 2019; Pirog & Benjamin, 2003.
Table 21: Food miles associated with key crops supplied from California to BC (Canada Food Flows, 2024).
Figure 49: Food miles and sourcing for British Columbia. Tomato and lettuce imports from the USA (Canada Food Flows, 2024).
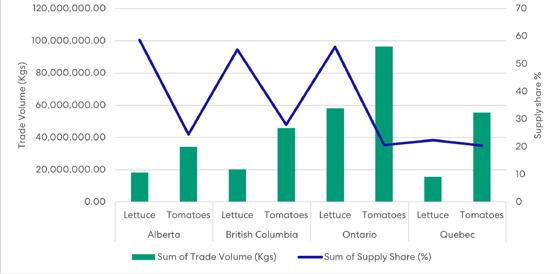
50: Total trade volume (kg) and supply share of lettuce and tomatoes (Canada Food Flows, 2024).
Figure
Skeena Terrace Reducing Food Miles Through Urban Agriculture
This case study evaluates the carbon emissions associated with food miles for basil, tomatoes, and lettuce under two production scenarios at Skeena Terrace, Vancouver:
nj Conventional (Industrial) Farming: Importing crops from Mexico, California, Florida, and Delta, BC via refrigerated trucks.
nj Urban Agriculture (BIA): Producing crops locally at Skeena Terrace, with two urban agriculture options:
‒ Option 1: ~1,000 m² of cultivated land.
‒ Option 2: ~12,000 m² (maximum feasible cultivation rooftop area).
The study examines food transportation emissions from conventional farming and compares them with the carbon emissions of soil importation (key variable) for urban agriculture at Skeena Terrace. The goal is to determine whether localizing food production can reduce food miles and associated carbon emissions.
Methodology: Calculating Carbon Emissions from Food Miles
Key Assumptions
The following assumptions were made for the carbon emissions calculation’s consistency and accuracy:
nj Mono-Cropping System: Each crop—basil, tomatoes, and lettuce—is grown independently, occupying 100% of the dedicated area in urban farming scenarios.
nj Soil Importation for Urban Farming: The carbon emissions from importing soil are proportional to the total cultivated area and the soil needed per square meter.
nj Yield Equivalency Across Farming Methods: UA in Skeena Terrace is modelled to match the total yield of conventional farming, meaning that the same amount of food would be imported or grown locally.
nj Transport Emissions Calculation: Food transport emissions for conventional farming are based on actual distances from key production regions (California, Arizona, Mexico) to Skeena Terrace. Refrigerated trucks, general trucks, and other transport modes are factored into the emissions model using CO₂ emission rates per kilometre.
nj Local Conditions in Urban Agriculture: The analysis assumes that soil must be imported to support cultivation at Skeena Terrace. Climate and environmental factors are not considered in crop yield variations.
nj Comprehensive Import Analysis: The study accounts for multiple supply routes, including imports from Mexico, the U.S. (California, Florida, Arizona), and local sources (Delta, BC). This ensures that seasonal and market-driven variations in food sourcing are fully captured.
nj Soil and Growing Medium Composition: Each farming method (soil-based, hydroponic, aeroponic) is assumed to use a single, dedicated growing medium rather than a mix of materials. All soil and growing media are assumed to be sourced locally, enabling accurate carbon emission factor calculations.
Step 1: Crop Yield Estimation
Total crop yield per farming method was calculated using the formula:
Total Yield (kg)=Yield per m² (kg per m² per year) x Area (m²)
Yield data was sourced from the average data developed in the technical chapter for soilbased, urban greenhouse, and vertical farming systems.
Table 22: Estimated total yield by farming type and crop.
Step 2: Transportation Emission Calculations
Emissions were determined using GHG conversion factors from the UK Government, which align with Canadian transport emission rates. Transportation distances from import sources to Skeena Terrace were considered for each crop. For UA, emissions related to importing soil for cultivation were calculated based on the soil required for each farming option. The carbon emissions for both scenarios are calculated using the following formula:
Table 23: Average kg CO₂e/tonne-km per transport method (UK Government GHG Conversion Factors, 2022).
Step 3: Comparing Carbon Emissions for Urban vs. Imported Crops
nj Conventional Farming: Emissions from food transport were based on crop origin and distance travelled. Emissions were estimated based on key supply regions, including Mexico, California, Florida, and Arizona, and local sources like Delta, BC. These locations were selected based on economic viability, peak growing seasons, and market demand.
nj Urban Agriculture: Soil Importation Emissions. Urban farming emissions were calculated based on the importation of soil required for cultivation at Skeena Terrace.
The process included:
nj Volume Calculation: Determining the total soil/medium volume based on cultivation area and planting depth for root growth.
nj Density & Weight Determination: Using the density of each medium (loamy soil, coconut coir, perlite) to calculate its total dry weight.
nj Carbon Emission Factor Application: Plugging the total weight into the CO₂ emission factor formula to estimate the carbon footprint of soil importation.
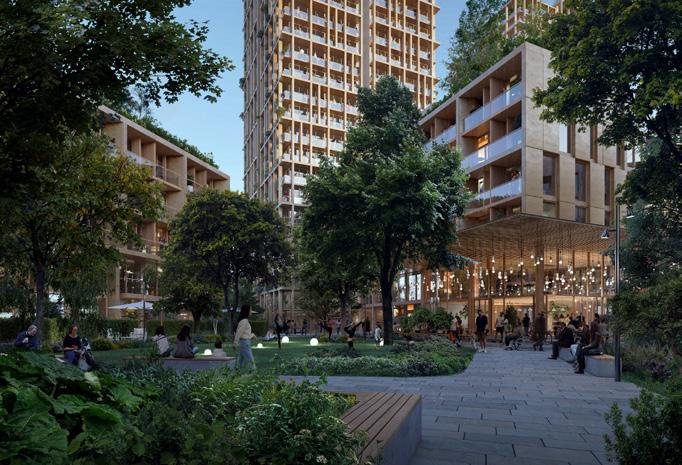
Figure 51: Perkins&Will, Skeena Terrace, Vancouver, BC. Urban farming integrated into the BC Housing project.
Findings: The Impact of Urban Agriculture on Food Miles Emissions from Importing Basil, Tomatoes, and Lettuce
24: Transport-related carbon emissions comparison for imported vs. urban-grown
Key Insights
nj Basil has the highest transport emissions, with imports from Mexico emitting over 85,972 kg CO₂e.
nj Lettuce and tomatoes also show substantial emissions, with transportation from California and Arizona contributing significantly.
nj Local sourcing (Delta, BC, Okanagan, BC) produces the lowest emissions, demonstrating the potential benefits of urban agriculture.
Table
Findings: The Impact of Urban Agriculture on Food Miles
Reducing Food Miles through BIA
Implementing urban agriculture at Skeena Terrace reduces food miles and emissions. The Emissions calculation follows the equation:
Density(kg/m³)= Mass of Soil/Medium (kg) / Volume(m³)
Volume(m³)=Area(m²)×Depth(m)
Total Weight(kg)=Volume(m³)×Density(kg/m³)
Total Emissions(kgCO2e) = Total Weight(kg)×Distance(km)×Emission Factor(kgCO2e/tonne−km) Table 25: Estimated
Food Miles and Emissions from Imports: The Case for Localized Production
The Impact of Long-Distance Food Transport
Food imports, mainly from Mexico and the United States, contribute significantly to carbon emissions due to longdistance transportation. The data highlights a stark contrast in emissions between imports from Mexico and closer supply chains like California.
nj Option 1 (1,000 m² of urban agriculture):
‒ Basil imports from Mexico emit 85,972 kg CO₂, while California imports emit just 36,609 kg CO₂.
‒ Tomatoes and lettuce follow the same pattern, with Mexico consistently producing the highest emissions.
nj Option 2 (12,000 m² of urban agriculture):
‒ Mexico imports produce over 1,021,782 kg CO₂ for basil, compared to 435,102 kg CO₂ from California.
‒ Tomatoes and lettuce show similar trends, with emissions more than double when transported from Mexico.
Key Insight: Longer transport distances exponentially increase food products’ carbon footprints. Reliance on imports from distant regions keeps BC’s food-related emissions high despite the potential for local urban agriculture to offset this impact through shorter distances and given BC’s clean energy grid..
Urban Agriculture: A Solution to Food Miles
Urban agriculture—especially greenhouses—offers a viable way to reduce food miles and related emissions by producing food closer to consumers.
Current Import Dependence in BC:
nj 76% of lettuce, 84% of tomatoes, and 90% of basil are imported (UBC, 2022; Metro Vancouver, 2020).
Emissions Reduction Potential:
nj Greenhouse-grown basil emits only 2,551 kg CO₂ (compared to 1,021,782 kg CO₂ from Mexico).
nj Lettuce and tomatoes grown locally in greenhouses also drastically reduce transport emissions.
nj Greenhouse systems utilize natural sunlight, making them more energy-efficient than vertical farms, which have higher emissions due to artificial lighting and climate control.
Key Insight: Scaling up urban agriculture—particularly greenhouse farming—could significantly reduce BC’s reliance on long-distance imports, reducing food miles and emissions.
Soil Importation vs. Food Miles Balancing Sustainability
While urban agriculture reduces food miles, the emissions from soil importation must also be considered.
Key Insight:
nj Hydroponic systems using Perlite (for small-scale production) and Rockwool (for large-scale production) have the lowest carbon footprint, making them the most sustainable soil alternatives.
nj Heavy soil imports can negate the benefits of reducing food miles, so carefully selecting growing media is crucial.
Final Takeways: Reducing Food Miles and Resources Miles
nj Food imports from distant regions (Mexico, California) significantly increase emissions.
nj Scaling up local urban agriculture—particularly greenhouse farming—can reduce food miles and cut BC’s carbon footprint.
nj Hydroponic systems (Perlite & Rockwool) have the lowest carbon impact on urban farming.
nj Soil-based farming has the highest emissions due to transport weight.
nj Greenhouses outperform vertical farms in energy efficiency and emissions reduction.
UA can potentially cut emissions from food transport and soil importation when optimized with locally sourced materials and energy-efficient methods. Prioritizing lightweight, locally sourced growing mediums and scaling up greenhouse production will be key to reducing BC’s food miles and overall carbon footprint.
Resource Conservation & Recovery: Closing Nutrient Loops
Industrialized farming is a primary driver of resource depletion, consuming ~70% of global freshwater withdrawals and contributing to land degradation, deforestation, and nutrient depletion (Dsouza et al., 2021).
As cities expand and arable land diminishes, sustainable alternatives must reduce pressure on natural ecosystems while ensuring food security.
BIA offers a closed-loop approach, integrating CEA, hydroponics, and rooftop farming to minimize resource consumption and waste generation (RufiSalis et al., 2020).
Plants require 16 essential elements for growth – carbon, hydrogen, and oxygen – from the atmosphere, while the remaining 13 macronutrients and micronutrients come from the soil (Philomena & Nirmal, 2016). Conventional farming delivers these nutrients via fertilizers sprayed onto soil, often alongside pesticides, to control weeds, insects, and disease. This process leads to fertilizer runoff, soil acidification, and water eutrophication, degrading ecosystems.
Vertical farms eliminate pesticide use and precisely control fertilizer application, delivering nutrients directly to plants with minimal waste. Excess nutrient solutions are captured, treated, and reintegrated into urban water infrastructure, preventing contamination of natural watercourses. By reducing chemical pollution, water cycle disruptions, and resource waste, vertical farming offers a low-impact alternative to traditional agriculture, preserving biodiversity and ecosystem stability.
Water Conservation: Optimizing Use and Reducing Waste
Traditional farming is highly water-intensive, with irrigation losses from evaporation, runoff, and inefficiency. Optimizing water use in food production is essential as climate change exacerbates water shortages.
Key Issues in Conventional Farming
nj Excessive irrigation demand: Depletes freshwater resources.
nj Wastewater through runoff: Leads to nutrient leaching and pollution.
nj Inefficient absorption: Crops receive only a fraction of applied water.
BIA’s Role in Water Efficiency
BIA reduces wastewater using hydroponic, aeroponic, and closed-loop irrigation systems, which recycle water and prevent nutrient leaching (Rufi-Salis et al., 2020).
nj Hydroponic & Closed-Loop Systems: Reduce water consumption by 40-90% less than traditional soil-based agriculture (Rufi-Salis et al., 2020).
nj Rainwater Harvesting: Rooftop greenhouses capture rainwater, reducing municipal water reliance (Romeo et al., 2018).
nj Precision Irrigation: Real-time monitoring optimizes water distribution, minimizing waste.
nj Rainwater-fed rooftop farms reduce municipal water dependence by 30-50% (Romeo et al., 2018).
Organic Waste Valorization: Closing
Urban Nutrient Loops
Urban food waste is a major contributor to GHG emissions, with organic matter often discarded instead of reused. Landfilled waste produces methane, worsening climate change.
Key Issues with Waste Mismanagement
nj Organic waste in landfills: Releases GHGs, increasing environmental footprint.
nj Loss of valuable nutrients: Compostable materials discarded instead of repurposed.
BIA’s Role in Waste Repurposing
BIA integrates food waste recovery, converting organic matter into valuable soil amendments and energy sources.
nj Composting Urban Food Waste: Enhances soil fertility and reduces landfill overflow and municipal waste burdens (Dsouza et al., 2021).
nj Microbial Biofiltration & Ozonation: Reduces emissions from composting, improving nutrient retention (Arcas-Pilaz et al., 2021).
nj Cities integrating municipal composting into urban farms reduce landfill waste by 30%.
Energy Efficiency & Carbon Reduction
Agriculture is a major carbon emitter, with fertilizer production, transportation, and deforestation contributing significantly to climate change.
Key Emissions Sources in Conventional Agriculture
nj Food miles: Long supply chains increase emissions from transportation (Romeo et al., 2018).
nj Fertilizer production: Generates nitrous oxide, a potent greenhouse gas.
nj Land-use change: Converting forests to farmland releases stored carbon.
BIA’s Role in Carbon Footprint Reduction
BIA localizes food production, minimizing emissions from transportation and fertilizer use. It also incorporates energyefficient technologies to reduce its environmental footprint (Gomez et al., 2019).
nj Energy-Efficient CEA: Uses LED lighting and climate automation to maximize space utilization with minimal energy demand (Gomez et al., 2019).
nj Waste Heat Recovery: Redirects industrial and commercial building waste heat to urban greenhouses, reducing energy demand by 30-50% (Wielemaker et al., 2018).
nj Renewable Energy: Incorporates solar panels and wasteto-energy systems, reducing reliance on fossil fuels.
Case Study: Skeena Terrace Resource Conservation
Stormwater and Aquatic Resource Management
nj The project is adjacent to Still Creek, one of Vancouver’s few remaining salmon-supporting urban streams.
nj Stormwater runoff poses risks of contamination from urban pollutants, particularly 6PPD-quinone, which is toxic to salmon.
nj Proposed solutions:
‒ Bioswales and retention ponds to slow and treat runoff before entering Still Creek.
‒ Rain gardens and permeable surfaces to improve infiltration and reduce flood risks.
Climate-Adapted Green Infrastructure
nj Tree Canopy Expansion: Increasing shade cover to mitigate urban heat islands.
nj Drought-Resistant Planting: Selecting species that require minimal irrigation.
nj Carbon Sequestration Potential: Restoring soil organic matter to enhance carbon capture.
Climate Resilience
The UHI Challenge and Climate Resilience
As cities expand and urbanization accelerates, climate change increasingly threatens urban environments. Rising temperatures, extreme weather events, and environmental degradation place urban populations, infrastructure, and ecosystems at risk.
“Landscape must be strategically planned to maximize its environmental benefits, including trees, shrubs on the ground, rooftop gardens, or vertical landscaping. Shadows cast by plants or shading structures are likely the most effective way to achieve thermal comfort in Vancouver’s climate on a hot summer day.”

Cheney Chen, Ph.D. | Perkins&Will Senior Research Lead
Climate resilience is the capacity of communities, systems, and infrastructure to anticipate, prepare for, and adapt to climate-related stresses. In urban environments, resilience-building efforts prioritize expanding green infrastructure, strengthening local food systems, and reducing environmental risks to safeguard public health and sustainability. The Urban Heat Island (UHI) effect is one of the most pressing challenges. In this phenomenon, urban areas become significantly warmer than surrounding rural regions due to heat-absorbing surfaces like asphalt, concrete, and glass.
This effect can increase urban temperatures by 1–7°C (Oke et al., 2017), leading to:
nj Increased energy consumption: Up to 5–10% higher electricity demand for cooling (Santamouris et al., 2015).
nj Decreased air quality: Higher temperatures accelerate the formation of ground-level ozone, worsening pollution.
nj Health risks: Elevated temperatures increase heat-related illnesses and mortality, particularly among vulnerable populations (Stone et al., 2012).
Urban agriculture (UA), including rooftop gardens, vertical landscaping, and high-tech vertical farming, has emerged as a potential strategy to mitigate UHI effects and enhance climate resilience. UA can:
nj Reduce temperatures through shading and evapotranspiration.
nj Improve air quality by filtering pollutants and sequestering carbon.
nj Enhance urban biodiversity by providing habitats for flora and fauna.
nj Strengthen local food security by reducing dependence on long-distance supply chains.
Urban Agriculture Strategies for UHI Mitigation
Soil-Base Agriculture: Cooling Through Green Coverage
Soil-based UA, such as rooftop gardens and community plots, leverages soil as a growing medium to enhance urban climate resilience. By integrating vegetation into urban surfaces, soil-based agriculture helps cool ambient temperatures through evapotranspiration and shade provision.
Climate Resilience
Soil-based systems improve climate resilience by absorbing rainwater, reducing stormwater runoff, and mitigating urban flooding. These systems are particularly effective during heatwaves, lowering surrounding air temperatures by 2–4°C (Berardi et al., 2014).
Environmental Benefits
Carbon Sequestration: Soil stores up to 5 kg CO₂/m² annually, reducing greenhouse gas emissions (Getter et al., 2009).
nj Biodiversity Support: Green spaces support pollinators, birds, and beneficial insects, promoting ecological diversity.
nj Air Quality Improvement: Vegetation filters particulate matter (PM10) by 50%, enhancing local air quality (Perini et al., 2011).
UHI Mitigation
Soil-based agriculture reduces ambient temperatures by up to 5°C by providing extensive green coverage, especially in densely built environments. This cooling effect also decreases energy demand for cooling in adjacent buildings.
Greenhouses and Vertical Farming: Climate-Controlled Food Production
Climate Resilience
Greenhouse agriculture uses controlled environments to optimize crop growth regardless of external weather conditions. These systems stabilize the food supply during extreme weather events such as frosts and heat waves. They also allow for efficient water management, which is crucial in areas facing prolonged droughts.
Environmental Benefits
nj Resource Efficiency: Uses less land and up to 90% less water than conventional farming (Despommier, 2013) making them ideal for urban settings where space is limited.
nj Reduced Pesticide Use: The controlled environment in greenhouses minimizes the need for chemical pesticides, reducing environmental contamination.
nj Energy Optimization: When paired with renewable energy sources like solar power, greenhouses can operate sustainably, reducing reliance on fossil fuels.
UHI Mitigation
While greenhouses do not directly lower temperatures, they indirectly reduce UHI by increasing food production within the city and reducing transportation emissions associated with food imports. Transparent greenhouse materials also stabilize local microclimates by allowing sunlight penetration while moderating heat retention in their immediate vicinity.
Skeena Terrace: UHI Mitigation
The Skeena Terrace case study aims to evaluate the impact of BIA on UHI mitigation and climate resilience. The project examines three primary BIA strategies:
nj Soil-Based Agriculture
nj Greenhouse Agriculture
nj Vertical Farming
The study employs Envi-MET simulation to assess the effects of green infrastructure on temperature, wind flow, and thermal comfort. The comparative analysis includes baseline and proposed design scenarios to quantify UHI reduction and climate adaptation potential.

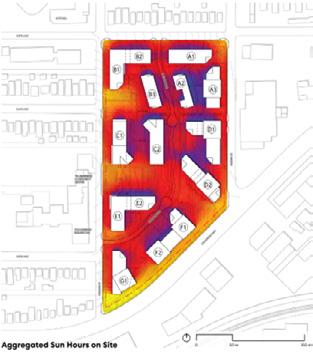
Methodology
Sunshine Hour Study
The first step in the study involved conducting a preliminary sunshine hour analysis to identify optimal locations for BIA integration. This analysis guided the placement of open spaces and habitable roofs within the master plan.
Key Findings:
nj Average annual sunshine hours at ground level: 1,274
nj Average annual sunshine hours on rooftops: 2,896
nj Threshold for viable agriculture: Areas receiving less than 1,600 hours per year were deemed unsuitable for BIA and excluded from further analysis.
The results informed the urban agriculture strategy, ensuring that the proposed interventions would maximize sunlight exposure and plant productivity.
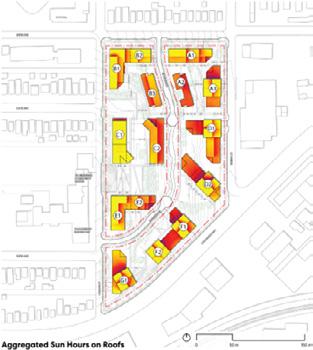
Figure 52: Annual sunshine hour mapping (ground vs rooftops).
Baseline and Proposed Design Models
Baseline Model: Current Urban Conditions
The baseline model represents existing conditions with no BIA integration, serving as a reference point for evaluating the effectiveness of proposed enhancements. It includes:
nj New buildings within the site boundary
nj Existing preserved trees
This model reflects typical urban heat conditions without additional vegetation or green infrastructure.
Proposed BIA-Enhanced Design Model
The proposed design model incorporates a range of BIA strategies to maximize green coverage and environmental benefits:
nj Intensive and extensive rooftop gardens to increase vegetation on urban surfaces.
nj Additional tree planting to enhance shading and carbon sequestration.
nj Garden plots integrated into open spaces to boost biodiversity and local food production
Scenario-Based Comparison
To assess the impact of BIA integration, the study compares four distinct scenarios:
Simulation Setup: Envi-MET Modeling
The study utilized Envi-MET, a high-resolution microclimate simulation software, to model interactions between buildings, vegetation, atmosphere, and surfaces. Envi-MET is widely used in urban planning, climate resilience studies, and environmental impact assessments to analyze key factors such as air temperature, thermal comfort, wind flow, and radiation exchange.
Model Configuration
nj Baseline Envi-MET Model: Simulates existing conditions without BIA integration.
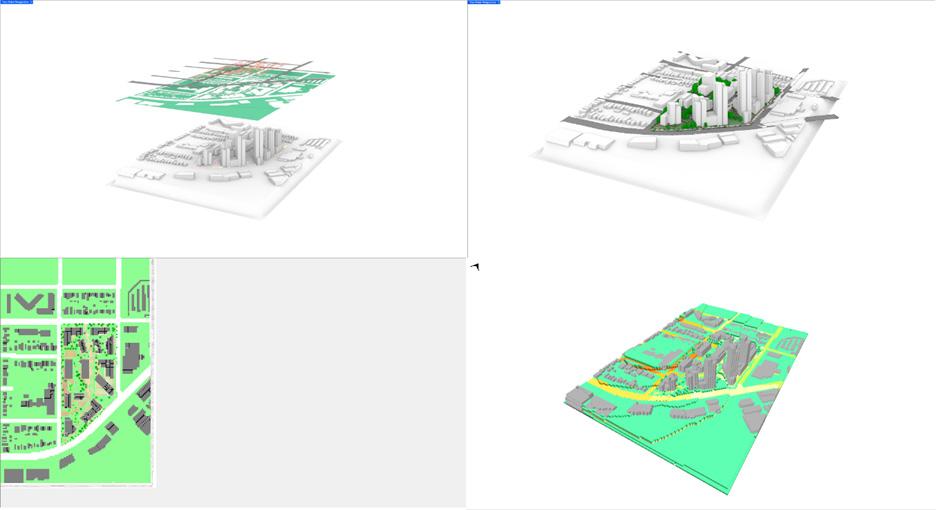

Figure 53: Envi-MET simulation setup and material identification for project modeling.
Results: Temperature and Thermal Comfort Analysis
Temperature Reduction and Wind Flow
The simulation compared temperature differences between the baseline and proposed models under current and future weather conditions. Distinguishing the temperature differences between the baseline and proposed cases is challenging, regardless of the current or future weather conditions. Key results include:
nj Temperature Reduction: Minimal differences were observed at ground level, primarily due to the limited scale of the intervention, elevated placement of rooftop gardens, lack of ground-level tree coverage, and strategic positioning.
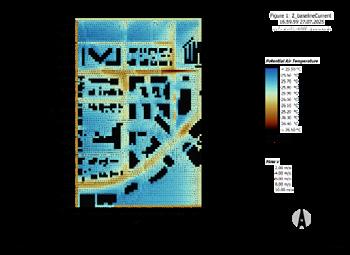
nj Wind Speed: Changes in wind patterns were insignificant, as vegetative cooling effects were localized rather than widespread.
nj Effect of High-Rise Shadows: Shaded areas from highrise towers maintained lower ambient temperatures, highlighting the role of strategic shading.
One clear finding is that when future climate (climate change) is considered, both the baseline and proposed designs will shift from relatively comfortable temperature conditions to hotter and more uncomfortable conditions. This suggests that the negative impacts of climate change cannot be mitigated by introducing a limited number of rooftop gardens alone.
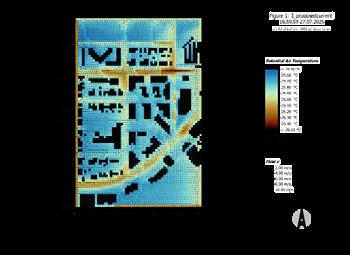
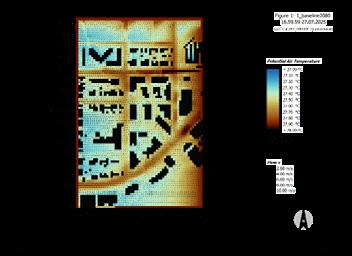
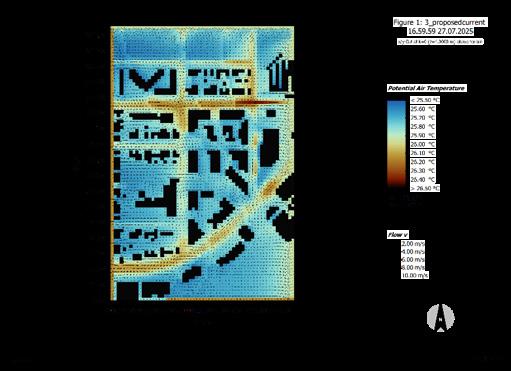
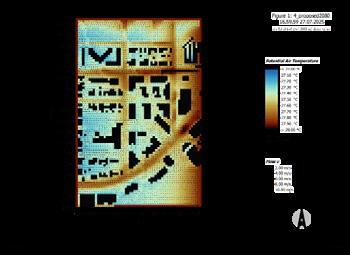
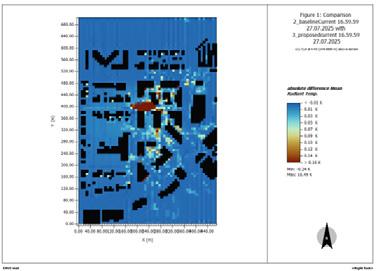
Figure 54: Temperature difference simulation comparison under current weather conditions (2025): baseline (left) vs. proposed (right).
Figure 55: Temperature difference simulation comparison under future weather conditions (2080): baseline (left) vs. proposed (right).
Figure 56: Cross-comparison of baseline and proposed simulations under current (2025) weather conditions.
Universal Thermal Climate Index (UTCI) Analysis
The Universal Thermal Climate Index (UTCI) is a widely used thermal comfort metric that assesses the physiological impact of outdoor temperature on the human body. It considers factors such as air temperature, humidity, wind speed, and radiation to evaluate human thermal stress in different environments.
This study uses UTCI to evaluate and compare ground-level thermal comfort. Like the findings for ambient temperature, we do not observe significant differences between the baseline and proposed designs, regardless of current or future weather conditions. The UTCI comparison further suggests that the current BIA-enhanced design does not significantly improve ground-level thermal comfort.


nj Negligible improvement in ground-level thermal comfort, regardless of the scenario.
nj Shaded zones created by high-rise towers remained notably cooler, regardless of climate conditions, highlighting the importance of strategically placing vegetation and sun-shading devices to enhance thermal comfort in urban environments.
nj Future Conditions (2080): Both baseline and proposed designs indicated a shift towards hotter and more


Figure 57: UTCI simulation comparison under current weather conditions (2025): baseline (left) vs. proposed (right).
Figure 58: UTCI simulation comparison under future weather conditions (2080): baseline (left) vs. proposed (right).
Mean Radiant Temperature (MRT) Assessment
MRT is a key component of thermal comfort assessment that represents the average temperature of all surrounding surfaces (such as walls, windows, and the ground) experienced by the human body. Through radiation, MRT influences how heat is exchanged between the body and its environment. The study evaluated MRT at ground level and 20 meters (low-rise rooftop level):
nj Higher MRT in High-Density Urban Canyons: MRT values are higher in dense urban canyons compared to more open urban areas. These zones trap heat due to limited air circulation and reflective surfaces, amplifying the UHI effect. The simulation results clearly show this pattern.

nj Limited Differences at Ground Level: Differences in groundlevel MRT are relatively small. This is mainly because of the limited ground-level vegetation and the limited cooling effect of rooftop gardens at street level. Consequently, ground-level MRT remains relatively unchanged despite rooftop interventions.
nj Impact at 20 Meters Above Ground: The reduction in MRT is more pronounced at 20 meters above ground. MRT reaches the 60°C range without rooftop gardens, but with the addition of rooftop gardens, it drops to below 50°C. This indicates that while rooftop gardens cool their


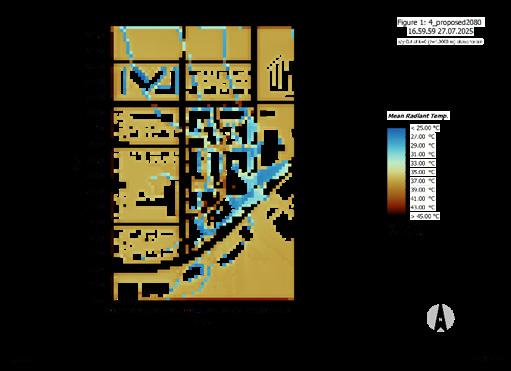
Key Takeaways Include
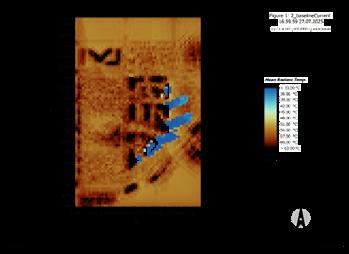

MRT is a key component of thermal comfort assessment that represents the average temperature of all surrounding surfaces (such as walls, windows, and the ground) experienced by the human body. Through radiation, MRT influences how heat is exchanged between the body and its environment. The study evaluated MRT at ground level and 20 meters (low-rise rooftop level):
Limited Ground-Level Impact: BIA interventions focused on rooftop gardens showed limited cooling at the pedestrian
Importance of Strategic Shading: High-rise shadows and shade-casting vegetation improve thermal comfort, especially in dense urban areas.


nj Comprehensive Green Infrastructure: The most effective results are achieved through an integrated approach combining ground-level trees, rooftop gardens, and vertical landscaping.
Future Projections: Climate change will likely intensify UHI effects, making adaptive urban planning essential.
Recommendations for Urban Planning
Implement multi-layered green infrastructure that includes both rooftop and ground-level vegetation.
Prioritize shading structures and dense tree planting to enhance thermal comfort in high-density urban areas.
Integrate passive cooling strategies with active BIA interventions for comprehensive UHI mitigation.
Food for Thought
BIA presents a transformative opportunity to redefine urban food systems and enhance ecological performance. By localizing food production and integrating green infrastructure, BIA mitigates key environmental challenges associated with conventional agriculture, such as carbon emissions, excessive water use, biodiversity loss, and the UHI effect.
Food Miles ~2,000–5,000 km per crop
Carbon Emissions ~1,000–1,300 kg CO₂/tonne for transport
0 km (on-site production)
Boyer et al., 2019
Potential 60–80% reduction Li et al., 2022
Water Use 250–300 L/kg (field-grown crops) 5–15 L/kg (hydroponic & greenhouse systems) Rufi-Salis et al., 2020
Soil Footprint Depletes nutrients and causes erosion
Composting and biochar improve soil health and resilience
Energy Use High energy use for long-distance transport Efficient climate control and LED lighting (15–25 kWh/ m² annually)
Biodiversity Limited habitat connectivity
Community Impact High dependency on distant food sources
Concluding Insights
Salomon et al., 2020
Urban habitats, pollinator corridors, reduced pesticide use
Enhanced food security, local job creation, community engagement
The ecological benefits of BIA are clear: reduced carbon emissions, enhanced biodiversity, efficient water use, and improved climate resilience. However, translating these ecological ambitions into practical, scalable solutions requires a robust technical framework.
In the next chapter, we will move from why BIA is ecologically essential to how it can be effectively implemented. We will break down the technical aspects of BIA, including carboncentric performance evaluation, resource recovery systems, and key performance indicators (KPIs) that ensure optimized outcomes.
McDougall et al., 2020
Table 26: Summary of overall quantified ecological impacts.
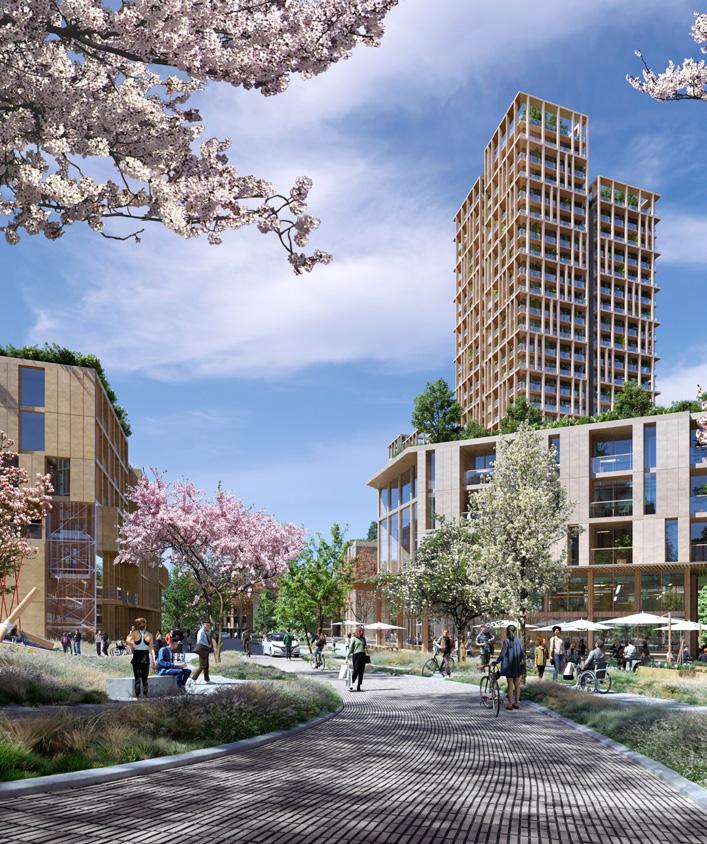
Figure 63: Perkins&Will, Skeena Terrace, Vancouver, BC. Urban farming integrated into the BC Housing project.
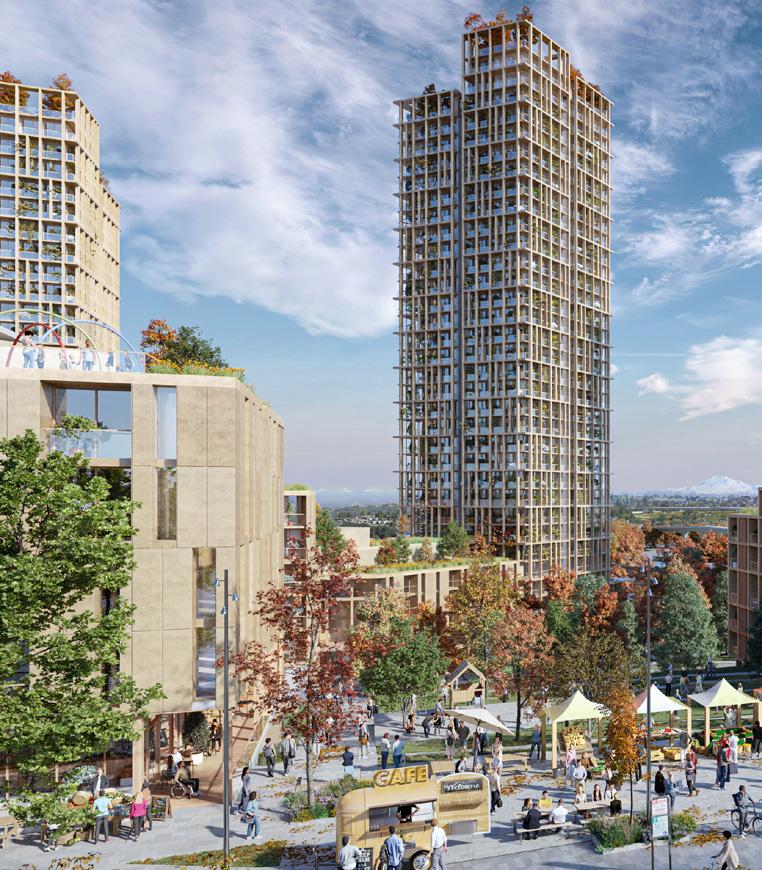
Figure 64: Perkins&Will, Skeena Terrace, Vancouver, BC. Urban farming integrated into the BC Housing project.
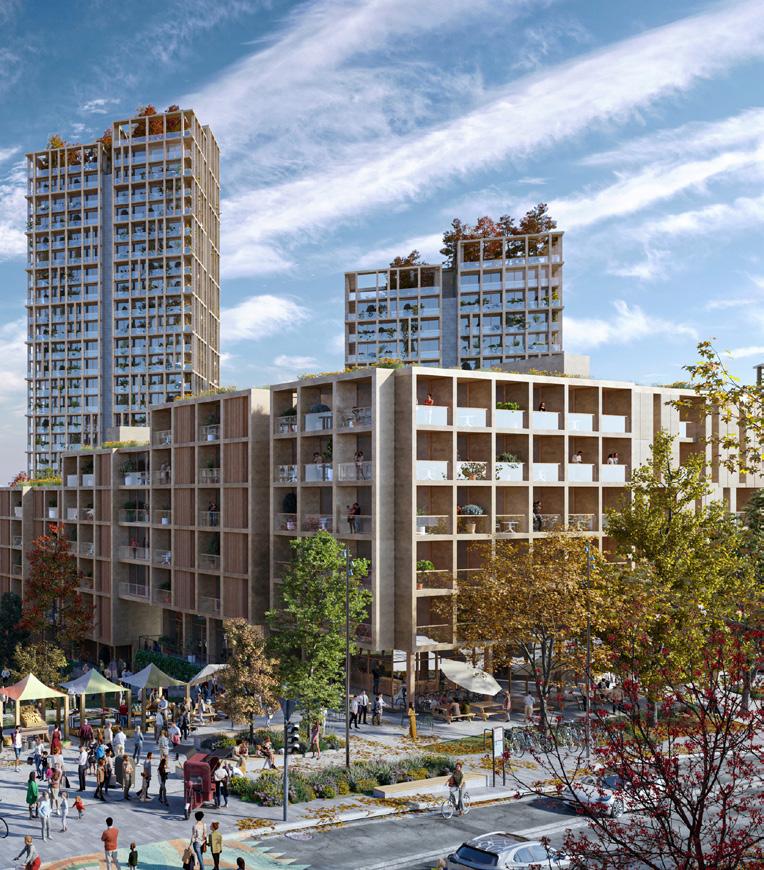

Part V:
Technical Analysis and Guidelines
Nuts and Bolts
Positioning: The Blueprint for Circularity
With the market context and environmental benefits established, this chapter lays the foundation for designing and optimizing BIA systems with a carbon-centric, resourcerecovery approach.
The driving question for this chapter is:
How do we technically implement BIA to enhance resource circularity while remaining scalable and operationally efficient?
This chapter is divided into two core sections, each focusing on a different aspect of technical feasibility:
Carbon-Centric Performance Evaluation: Applying Life Cycle Assessment (LCA) and key performance indicators (KPIs) to assess the environmental and resource impacts of BIA.
Resource Exchange & Recovery Systems: Mapping how buildings and farms can symbiotically share energy, water, and nutrients to enhance efficiency.
Note: The findings of this chapter are published: Front. Sustain. Food Syst. , 18 March 2025, Sec. Urban Agriculture Volume 9 - 2025 | https://doi.org/10.3389/fsufs.2025.1533433
Why Carbon-Centric Metrics Matter
To create a sustainable urban food system, BIA must not only produce food but also minimize environmental tradeoffs. A carbon-centric framework enables a cross-industry framework ensuring food production is embedded within low-impact, resource-efficient design. This novel framework redefines system boundaries and incorporates reciprocal benefits such as resource recovery between integrated farms and their host buildings.
BIA introduces new challenges and opportunities for evaluating environmental performance. Traditionally, the agriculture and building sectors have used fundamentally different measurement systems.
nj Agriculture Metrics: Focus on food yield efficiency and carbon emissions per kilogram of crop (e.g., kg CO₂e/kg).
nj Building Performance Metrics: Emphasize energy use per square meter (e.g., EUI), water use intensity (WUI) and greenhouse gas intensity (GHGI), measuring resource consumption and emissions at the building scale.
This fundamental discrepancy complicates the integration of BIA within the built environment, as both sectors need to be harmonized to fully unlock the potential of resource circularity.
The Need for a Carbon-Centric Evaluation Framework
A carbon-centric evaluation framework is essential to bridge the gap between these divergent metrics. Such a framework standardizes metrics across agriculture and building performance, enabling meaningful cross-comparisons and holistic impact assessments. By establishing carbon as a unifying metric, this approach ensures that resource use and environmental impacts are calculated systematically and consistently, supporting the operational feasibility of BIA.
However, the development of this framework faces several key challenges:
nj Lack of Robust LCA Frameworks: Current LCA methodologies are not standardized between the agriculture and building sectors, leading to inconsistent trends and inconclusive results.
nj Discrepancy in Metric Definitions: UA metrics often quantify impacts as kg CO₂e per kg of crop harvested, while building metrics like EUI, WUI, and GHGI focus on resource consumption and emissions per unit area.
nj Fragmented Lifecycle Impact Evaluation: Agriculture and construction have significantly different lifecycle stages. UA typically covers pre-farm, on-farm, and post-farm stages. At the same time, the construction industry evaluates the impacts of material extraction and processing (product stage), transportation to the construction site and on-site assembly (construction stage), operational energy and resource use over the building’s life span (use stage), and the disposal or recycling of materials (end-of-life stage).
nj Integration of Carbon Accounting: The lack of integrated frameworks limits the ability to capture the synergistic efficiencies of BIA systems relative to their host buildings.
There are several additional benefits to using carbon as a unifying metric between building and urban agriculture lifecycle:
nj Certification and Reporting: As carbon reporting becomes increasingly standardized within building certification systems (e.g., LEED), integrating BIA metrics can advance carbon accounting practices in urban agriculture (WBDG, 2024).
nj Policy Alignment: When metrics are streamlined and harmonized, urban planning policies centred on sustainability can better align with BIA initiatives.
Circular Design Opportunities: An integrated framework enables the identification of circular design principles, where hotspots of environmental performance across both systems are addressed synergistically (Chowdhury & Bahram, 2024).
For instance, practical applications of this approach have been demonstrated in the PAE Building in Portland, Oregon, where greywater reuse for irrigation and composting of organic waste is leveraged to close the resource loop. These examples highlight the practical value of an integrated carbon-centric framework, offering data-driven insights into how urban agriculture and buildings can symbiotically enhance resource circularity (Thomas, 2022).
Figure 65: Carbon-centric evaluation framework integrating UA and BIA metrics into a unified carbon accounting and policy alignment structure.
Approach: Carbon-Centric Performance Evaluation and Resource Circularity Framework
This chapter presents a framework that evaluates BIA through a carbon-centric lens, addressing operational and embodied carbon impacts. The primary goal is to develop a robust framework harmonizing building and agriculture metrics, enabling cross-industry data comparisons and effective carbon accounting.
The framework aims to quantify BIA implementations’ carbon reduction potential and resource efficiency by incorporating resource exchange and recovery systems.
The chapter focuses on high-impact BIA systems and crops, evaluating operational and embodied carbon perspectives while addressing gaps in existing LCA datasets. Additionally, it examines baseline energy and water consumption, food yield, and associated GHG emissions of common BIA systems.
The approach is structured around three core pillars:
Data-Driven Insights: Gathering robust data from real-world case studies and literature.
Metric Pairing: Developing a unified framework that connects agriculture and building metrics.
Resource Mapping: Mapping resource exchanges between BIA systems and host buildings.
Data-Driven Insights
The carbon-centric framework’s foundation is a comprehensive data collection strategy, drawing from diverse and credible sources to build a solid evidence base. The process involved curating real-world case studies, conducting a systematic literature review, and gathering insights from industry experts to ensure a holistic approach to data collection.
First, a benchmark is established to compare and standardize BIA life cycle inventories. The researchers selected ISO 14040 as the benchmark to which BIA studies would be standardized. These standards are globally adopted and intended to measure buildings’ environmental footprint and associated products.
The initial step in this research involved collecting and recording inventories from diverse urban farming studies to match and compare how they stack against these building LCA phase standards. Then, these inventories and associated value chains were mapped and compared against ISO 14040, an overarching standard encompassing all phases of LCA addressing quantitative assessment methods for environmental aspects of a product in its entire life cycle stages. This provides the necessary framework for comparing building and BIA life cycle studies, including identifying gaps in data and hotspots that demonstrate potential for resource circularity.
Curating Real-World Stories: Case Study Identification
To anchor the framework in practical applications, a global survey of 150 BIA projects was conducted to identify representative and robust case studies. The goal was to validate the most common systems, technologies, scales, and crops identified in the literature, ensuring the framework reflects real-world scenarios and current best practices.
From this initial pool, 48 case studies were selected for detailed analysis based on the following criteria:
nj Technology Reliability: Proven and operational systems.
nj Geographic Diversity: Representing various climate zones and urban contexts.
nj Resource Recovery Strategies: Integrating heat recovery, greywater reuse, composting, etc.
nj Operational Specification and Data Availability: Access to energy use by infrastructure type (HVAC, lighting, equipment, gas boilers), gathered through desktop research, project documentation, and conversations with architects, operators, and developers.
To support future analysis and validate the usability of the proposed framework, the study systematically collected and standardized carbon equivalent data between urban farming systems and their host buildings. The data encompasses energy, water, food yield, and carbon emissions, mainly focusing on high-impact BIA systems identified in the literature review, including:
nj Soil-Based Systems
nj Greenhouses
nj Vertical Farms
The case study classification strategy was designed to organize and evaluate BIA initiatives across five primary dimensions systematically:
DIMENSION
Building Attributes
Urban Scale
SUB-CATEGORIES
Building Types
ID DESCRIPTION
Renovation (R) or New Construction (NC)
Project Status Built (B), Under Construction (UC), or Design Phase (DP)
Primary Function Research (Re), Educational (E), Commercial (Co), Office (Of), Residential (Res)
Operational Strategy
Neighbourhood/District
Urban Installations
Community Lead (CL), Third-Party Operated (TPO), or Other (O)
Projects involving entire neighborhoods or city districts
Temporary and movable installations related to food production
Building Scale Projects integrated within individual buildings
Design Products
Project Support Local Policy
Local Incentives
Community Initiatives
Integration Type Growing Location
Growing Strategy
Growing System
Primary Crop
Quantitative Data
Energy/Renewables
Water Use
Food Yield
Waste
Carbon
Business Model
Other
Small-scale, micro soil-less farming systems integrated into living or commercial spaces
Local Policy Support (LPS), Local Policy Barriers (LPB), or Not Applicable (NA)
Local Incentive Support (LIS) or Not Applicable (NA)
Local Community Support (LCS), Educational (Ed), Social (S), or Cultural (C)
Grade (G), Terrace (T), Rooftop (R), Facade (F), Indoors (I), Service Zone (SZ), Below Grade (BG)
Edible landscape (EL), Green Roofs (GR), Greenhouse (GH), Green Walls (GW), Products (P), Vertical Farm (VF)
Soil-Based (SB), Mushroom (M), Hydroponic (H), Aquaponics (AQ), Aeroponics (AE), with technology levels (H/M/L)
Mushroom (M), Vine Crops (VC), Leafy Greens (LG), Microgreens (MG), Herbs (H), Vegetables/Fruits (VF)
Energy/Renewables Availability: Available (EA)
Water Usage Status: Available (WA)
Food Yield Data: Available (FA)
Waste Management Status: Available (WCA)
Carbon Footprint Data: Available (CA)
Business Model Status: Available (MA)
Additional Metrics: Available (OA)
Additionally, a systematic literature review was conducted from (Dorr, et al., 2021) Meta-review of life cycle papers to add robustness to the number of reviewed papers to supplement case study data and ensure the accuracy of our data collection and yield, water, and energy use calculations. A total of 41 studies were selected with key metrics:
nj Energy Use Intensity (EUI)
nj Water Use Intensity (WUI)
nj Greenhouse Gas Intensity (GHGI)
Informal interviews with architects, urban farmers, and engineers were conducted to Validate data accuracy and relevance, gain practical insights on technology integration and operational challenges, and understand localized adaptation strategies for BIA systems.
These conversations highlighted context-specific insights that helped refine the data framework, aligning technical concepts with practical applications.
Table 27: Case study classification framework.
Metric Pairing-Bridging Two Industries
The Challenge: BIA operates at the intersection of agriculture and building performance, each governed by distinct metrics and methodologies. To bridge this gap, we developed a carbon-centric framework that unifies:
nj Agriculture Metrics (kg CO₂e per kg of crop)
nj Building Metrics (kWh/m², L/m², kg CO₂e/m²)
Rethinking Boundaries
Traditionally, agriculture and construction employ distinct lifecycle stages:
nj Agriculture: Pre-farm, On-farm, Post-farm.
nj Buildings: Product, Construction, Use, End-of-life.
To harmonize these, we developed a hybrid LCA framework that evaluates:
nj Operational Carbon: Energy and resource use during production and maintenance.
nj Embodied Carbon: Materials and infrastructure impacts.
A New Language of Performance: Metric Pairing
We established metric pairs that link agriculture and building performance to enable comparison and compatibility. This was facilitated by standardizing operational carbon by functional unit (kg of farm-gate crop produced annually at the farm gate) and by area (per square meter of production space) to provide a comprehensive assessment framework. This approach evaluates the area occupied by BIA systems and the resulting food yield, with metrics designated by subscripts ‘a’ for agriculture and ‘b’ for building.
OPERATIONAL METRIC PAIR UNIT
EUI (Energy) kWh/ m² or kWh/kg
WUI (Water) L/m² or L/kg
GHGI (Carbon) kg CO2e/m² or kg CO2e/kg
AGRICULTURE CONTEXT (A)
Farm operational energy use per yield
Farm water use per yield
Farm operational carbon emissions per yield**
BUILDING CONTEXT (B)
Building operational energy use per area*
Building water use per area*
Building operational carbon emissions per area**
Table 28: Unifying metrics between agriculture and architecture sectors.
* Area is per BIA system occupied
** Post-processed data
Gross Floor Area (GFA) and Functional Design Scenarios
A critical metric for assessing BIA integration is the Gross Floor Area (GFA) that houses the agricultural system. This metric influences how energy, water, and food yield are calculated.
Scenario 1: Food Yield as Primary Factor
When food yield (kg) is the primary design factor, the calculations assess the energy impact and required space for the BIA system as follows:
Building EUI Impact =
Food Yield (kg) x EUIa
GFA
Food Yield (kg) x EUIa
Required Space =
EUIb
Scenario 2: Available Space as Primary Factor
When available building space (m²) is the primary constraint, the calculations evaluate energy impact and food yield potential as follows:
Available Space (m²) x EUIb
Building EUI Impact =
Required Space =
GFA
Available Space (m²) x EUIb
EUIAa
The same logic extends to WUI and GHGI calculations, allowing flexible adaptation based on space availability or food production requirements. This approach effectively translates and resolves stakeholder queries within the building design process.
From an environmental impact perspective, building design must account for operational and embodied carbon. While operational carbon metrics can be directly translated into performance impacts for agricultural ‘a’ and building ‘b’ contexts, embodied carbon in BIA refers explicitly to the carbon emissions associated with agricultural systems’ construction, installation, and maintenance.
This embodied carbon is integrated into the building’s overall embodied carbon profile through LCA, quantifying the combined carbon impact of the building and the BIA system. To develop a robust understanding, 48 selected LCA studies were analyzed and grouped by farm type, with data collated to capture embodied carbon across multiple life cycle phases.
The analysis focuses on upstream inputs (e.g., infrastructure, materials, and supplies) and downstream processes (e.g., end-of-life and materials disposal) bounded at the farm gate. Further work is necessary to model and compare downstream consumption and post-farmgate waste.
Like operational carbon, embodied carbon is quantified as kgCO₂e per functional unit (FU):
nj Agriculture Context (a): kgCO₂e per kilogram of crop harvested.
nj Building Context (b): kgCO₂e per square meter occupied area.
“Weaving together agriculture and building carbon metrics in a meaningful way helps grow BIA from conceptual daydream to a serious strategy toward climate-smart and circular design for more resilient and sustainable cities.”

Myer Jonathan Harrell | Perkins&Will Senior Regenerative Design Advisor
Resource Mapping - Connecting the Dots
The Goal: Transform buildings from resource consumers to resource generators by embedding agriculture into their operational metabolism.
A systematic review of resource recovery technologies identified the most viable solutions based on efficiency, scalability, and cost-effectiveness. The framework also identifies key resource exchange nodes where energy, water, and nutrient flows between building systems and BIA installations can be optimized. These include:
PERFORMANCE
Carbon Reduction CO₂ saved (kg/m²)
Resource Conservation
Resource use reduction (%)
Energy Efficiency Energy saved (kWh/m²/year)
Water
Recycling Efficiency
% of reused water
Yield per square meter kg/m²
Nutrient Recovery
% of waste valorized
Life Cycle Assessment (LCA)
Urban metabolism modeling
Operational monitoring and simulation
Greywater recovery calculations
Composting and biochar analysis
Lifecycle emissions reductions due to localized food production
Efficiency of lighting, HVAC, and farming equipment
Optimizing irrigation, hydroponic, and aquaponic systems
Productivity benchmark for urban agriculture
Effectiveness of composting and closed-loop nutrient cycles
Although carbon sequestration is often excluded from LCA due to data uncertainties on CO2e uptake before harvest, (Dorr & Raissi, 2017) (Al-Qubati, et al., 2024) modelled carbon sequestered from compost in the substrate, potting soil, and amendments in a UA urban farm, estimating that the sequestered carbon represents 0.2–3% of the farm’s GHG emissions. This can be a starting point to build the sequestration data set.
Table 29: Methodology for measuring BIA performance metrics.
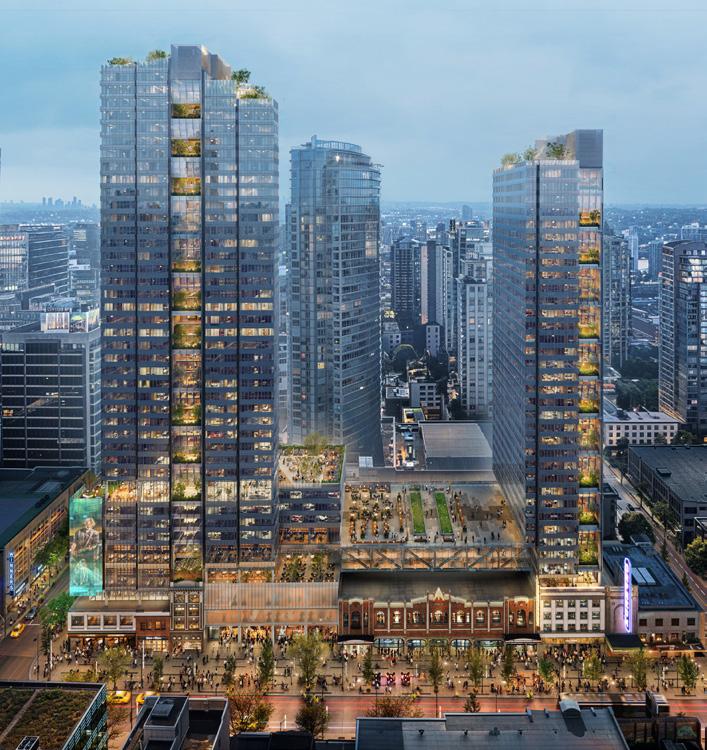
Figure 66: Perkins&Will, 800 Granville proposal, Vancouver, BC. Sky gardens across the building core.
Carbon-Centric Performance Evaluation
Data-Driven Insights
An effective carbon-centric framework for BIA requires a comprehensive and robust data foundation. This section draws from 48 detailed case studies, systematically analyzing trends across geographic regions, climate zones, system types, and attribute diversity.
These case studies provide a robust data set to establish operational characteristics for various farm types, including grow areas and yields. This dataset also provides a foundation to capture relevant life cycle inputs and outputs— inventory items required to develop the carbon-centric framework for building and urban farming life cycle integration. The full dataset and detailed findings are included in the appendix.
Curating Real-World Stories: Case Study Analysis
The case study analysis demonstrates the adaptability and diversity of BIA systems across multiple contexts and captures a wide range of BIA applications and configurations, demonstrating their adaptability to varying environmental conditions.
Soil-based urban farming demonstrates the largest growing area requirements, with consistent values across crop types (Median = 231 m²). Vertical farming, in contrast, shows a more diverse range for leafy greens (Median = 101 m²), herbs (Median = 119 m²), and vining crops (Median = 45 m²). The vining crop lower area is due to the facility type capturing this crop as a testing research facility and is not necessarily representative of this crop type area needs.
Greenhouses exhibit relatively smaller grow areas with less variation between leafy greens (Median = 80 m²), herbs (Median = 84 m²), and vining crops (Median = 104 m²).
This differentiation underscores the land efficiency of vertical farming and greenhouse systems, which maintain relatively consistent space requirements across crop types. Notably, the vertical farming area captured from the case studies does not capture tray stacking within the farm (i.e. they are based on grow area footprint); thus, vertical farming reflects higher land use efficiencies with respect to the other farm types.
Figure 69 compares yield with total annual yield per kg crop and meters squared, highlighting system compactness.
Vertical farms produce the highest yield and total crop yield per year due to stacking, year-long production, as well as controlled environmental conditions for leafy greens (Median = 110 kg/ m-2), herbs (Median = 108 kg/ m-2), and vining crops (Median = 55 kg/ m-2) respectively.
Regarding total production, leafy greens perform best in vertical farms, yielding up to 7,376 kg, followed by herbs at 25,000 kg and vining crops at 4,550 kg. In greenhouses, tomatoes have the highest yield at 1,445 kg, followed by leafy greens 963 kg and herbs 34 kg, indicating the optimization of greenhouses for vining crop production. Finally, soil-based systems reflect a large range in total yearly production, at 357 kg and 54,106 kg for leafy greens and vining crops, respectively.
As a comparative benchmark, FAOSTAT data from 2018-2022 for traditional farming of the same crops in Canada, notes that the average yield of leafy greens (lettuce) and vining crops (tomatoes) was 23 and 83 kg crop m2 (full data set included in the appendix).
These values indicate a higher yield in optimized traditional farming than in climate-dependent, soil-based urban farms, with traditional methods yielding approximately 10 times more. However, traditional farming yields are notably lower than those achieved through vertical farming (up to 5 times higher yields), with a reduction in land use.
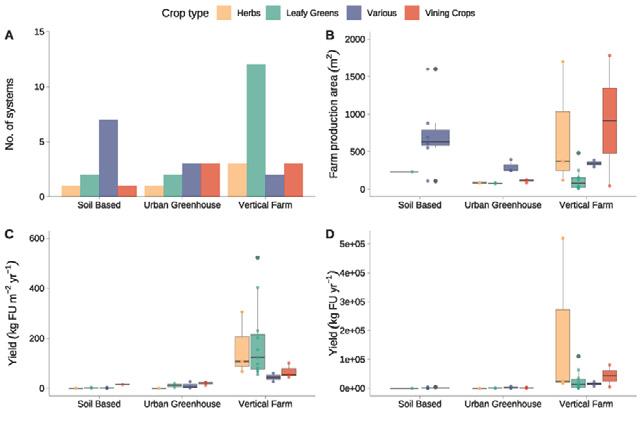
Figure 67: LCA studies dataset: farm operations reviewed, yield, grow area, and production volumes.
Metric Pairing-Bridging Two Industries
The paired metrics framework for farm operations was calculated using literature review data, including EUIa, EUIb, WUIa, WUIb, GHGIa, and GHGIb. Furthermore, the framework approach allows for adjusting and scaling embodied carbon values from each study. Detailed inventory data was recorded for embodied carbon emissions, focusing on infrastructure (input materials and end-of-life carbon), packaging, grow media, fertilizers/ seeds, and waste.
Most studies were conducted in Europe (especially Spain and Sweden); however, the findings are broadly applicable, as upstream inputs and end-of-life embodied carbon are less regionally variable than operational emissions, which are influenced by local energy grids and climate factors. Emerging research has noted that energy grids play a large role in the potential sustainability of vertical farming (Blom et al., 2022).
A New Language of Performance: Metric Pairing
Baseline Operational Water Use
Operational values are reported below in Figure 69 and Figure 70, synthesized from the life cycle analysis literature review. Values for Figure 71 were sourced from the case study analysis process. The vertical farming system is the most water efficient across all crop types (Median = 21 litres/kg crop), followed by the greenhouse system’s leafy greens crop (Median = 62 litres/kg crop).
In contrast, due to climate dependency and system inefficiencies, soil-based systems require far more water for the same leafy greens crop (Median = 2017 litres/kg crop). Vertical farms use much more water per land area; however, this is due to higher biomass production. Notably, this measure does not account for resource circularity practices, such as water recycling or distinguishing between blue and green (rainwater harvested) water (Sanye-Mengual et al., 2015) (Dorr, et al., 2021).
Baseline Energy Use
EUI is the key performance metric where vertical farms exhibit significantly higher energy demands compared to greenhouse or soil-based farms. Vertical farms, on average, require the highest amount of energy (Median = 814 kWh/ m2) to maintain year-round production, compared to greenhouses (Median = 97 kWh/m2) and soil-based systems (Median = 20 kWh/m2). When adjusted for yield kWh per kg crop, the high productivity of vertical farming helps to reduce its energy consumption relative to other farming types (i.e. it is only 1.05 to 1.32 times more energy intense per unit of crop than soil-based and greenhouse systems, respectively).
These values vary based on the constitution of energy grids in different world regions, with high energy requirements for cooling and heating in warm and cool climate regions. Overall energy use was highest in vertical farming operations. Results also suggest that lighting is the largest contributor to energy use values within these operations (Figure 71).
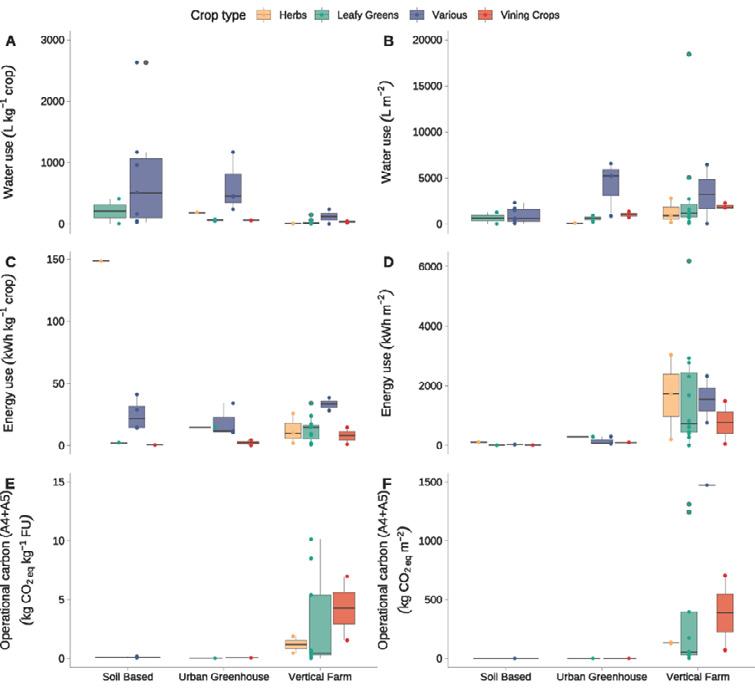
Figure 68: Energy, water use, and operational carbon values per square meter and kg crop.
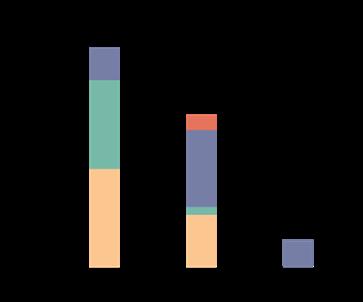
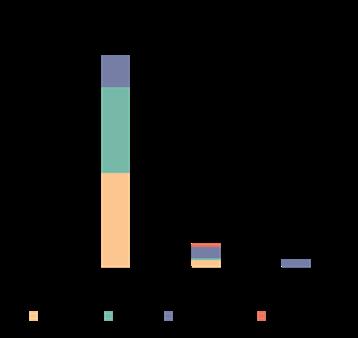
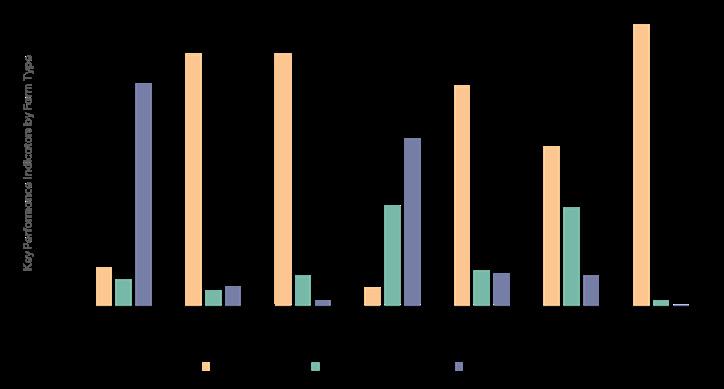
70: Relative performance indicators by farm type as a percentage of total category values.
Figure 69: EUIa and EUIb energy use breakdown across common infrastructure types.
Figure
Baseline Operational Carbon
Similarly, vertical farms’ operational carbon emissions (energy and water use, GHGIa) are higher (Median = 1.1 kgCO2/kg crop) than for greenhouses (Median = 0.036 kgCO2/kg crop) and soil-based farms (Median = 0.079 kgCO2/kg crop). In comparison, greenhouses (Median = 0.51 kgCO2/m²) and soil-based farms (Median = 0.10 kgCO2/ m2) have much lower GHGIb values than vertical farms (Median = 132 kgCO2/m2), see Figure 70.
Baseline Embodied Carbon Data
Drawing upon the data gathered from the LCA literature review data, Figure 73 shows the range of embodied emissions impact per life cycle phase.
Overall, each BIA system has differing impacts per phase and highlights the opportunities for system optimizations depending on the project application, location, and grid intensity.
Embodied carbon in VF is primarily driven by energy use (factoring in energy grid constitution) and end-of-life impacts from infrastructure. For soil-based farms, grow media significantly contributes to embodied carbon due to the high carbon intensity of large soil volumes, unlike the hydroponic grow media often used in greenhouses and vertical farms. The high yield of vertical farms also increases the carbon intensity of packaging and high operational energy demands. Both energy and packaging impacts offer optimization potential.
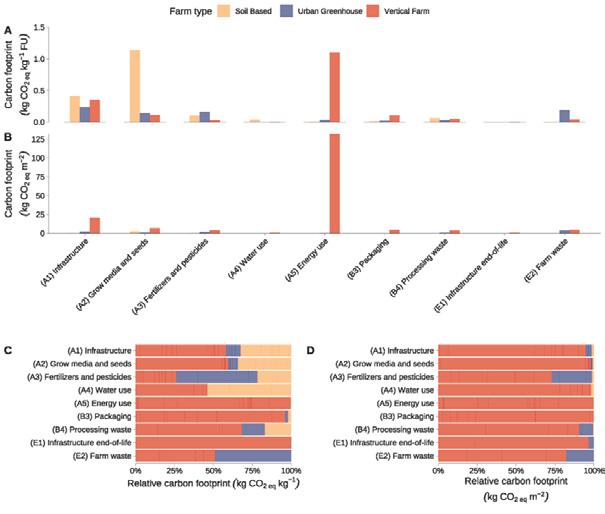
Figure 71: Carbon emission equivalents by life cycle phase across different farm types.
Rethinking Boundaries: Unifying LCA Perspectives
Table 32 proposes a cross-comparison framework between ISO 14040 building LCA standards and inventory items within BIA LCA literature. Figure 74 below illustrates the relative resource flows across each phase, recognizing data gaps in BIA LCA literature via greyed-in flows. While individual LCA inventory items differ between building and BIA systems, their common life cycle phases allow for cross-comparison between each system.
Infrastructure, grow media, and fertilizer as pre-production inputs are included. BIA LCA studies capture raw material extraction, transportation, and manufacturing of these infrastructural components within embodied carbon values.
Construction stage phases are common between building and BIA systems; however, no studies reviewed in this paper included embodied carbon values related to their installation.
Most use-phase and pre-processing inventory items vary between buildings and BIA LCA, where BIA systems include quality control measures for products stored and processed on-site and packaging materials. Other than energy use, water use, and packaging, there were insufficient data points to report embodied carbon values from storage, refrigeration, and processing waste, given that farms may not process products on-site and/or may only account for performance data in their physical production spaces. Endof-life inventory items in BIA LCA include consideration of both infrastructure and organic materials.
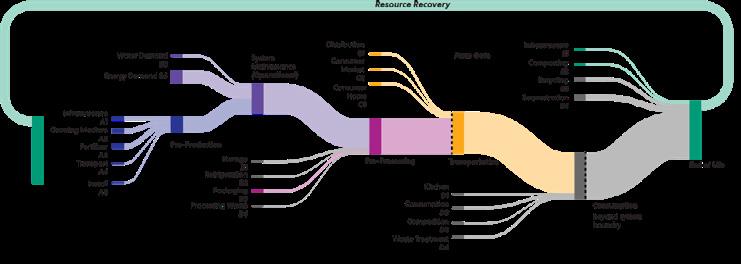
72: BIA system boundary and Sankey diagram illustrating relative carbon flows. Grey zones are excluded due to data limitations; post-farmgate transport is not quantified, consistent with the BIA LCA framework in Table 32.
Figure
ISO 14040 - BUILDING LCA STANDARD LIFE CYCLE PHASE
Raw Material Supply (A1)
Transport (A2)
Manufacturing (A3)
Transport to the Building Site (A4)
Installation into Building (A5)
Pre-Production
Construction Stage
Use/Application (B1) Use Phase/Pre-Processing
Maintenance (B2)
Repair (B3)
Replacement (B4)
Refurbishment (B5)
Operational Energy (B6)
Operational Water (B7)
Deconstruction and Demolition (C1)
Transport (C2)
Waste Processing (C3)
Disposal (C4)
Reuse (D1)
Recovery (D2)
Recycling (D3)
End-of-Life Stage
Benefits and Loads Beyond System Boundary
PROPOSED EQUIVALENT PHASES AMALGAMATED ACROSS BIA LCA LITERATURE INVENTORIES
Infrastructure (e.g., LED lighting, grow shelving and grow boxes, electrical)
Grow Media
Fertilizer
Transport to the Building Site
Installation into Building
Storage
Refrigeration
Packaging
Processing Waste
Operational Energy
Operational Water
Infrastructure End-of-Life
Composting
Recycling
Sequestration
Off-Farm Distribution
Consumer Market
Consumer Home
Kitchen
Consumption (Processing and Preparation)
Food Waste Treatment
Table 31: Integration of BIA LCA inventory into comparative building LCA framework (EN 14040).
Confidential Vancouver Development
The following section presents an application of the paired metrics framework to compare the addition of BIA systems with conventional building systems. This analysis is based on a confidential commercial project; therefore, specific details regarding the location and structure are omitted. The comparison evaluates building metrics—specifically Thermal Energy Use Intensity (TEUI)—with crop-related metrics such as EUIa, WUIa, and GHGIa
Crop-related metrics are reported per unit area (m²) to allow for conversion and integration into building design models, supporting performance mapping. To illustrate this integration, the case study applies paired BIA metrics to the building’s early design stage, demonstrating how BIA can be incorporated into overall performance targets. This approach helps quantify the potential energy and GHG implications of different crop and farm types, informing design decisions from the outset.
The project is a high-rise Multi-Unit Residential Building (MURB) located in Vancouver, BC, with a total modeled floor area of approximately 90,000 m² (see Figure 75). It is designed to meet specific energy intensity and GHG emission limits as required under Vancouver’s rezoning requirements. Energy simulation results are presented in Table 33 and Table 34 presented the associated conversion rates for operational energy based on the energy grid for Vancouver, BC.
Given its scale, the project complies with the Sustainable Large Developments Policy and integrates three diverse on-site food assets (City of Vancouver, 2024). The client has expressed support for integrating a BIA system into the unused areas of the underground parking facility alongside traditional soil-based urban agriculture. This case study also includes a hypothetical greenhouse to assess the three BIA systems discussed in this paper.
Based on the BIA systems requirements and building constraints, a 500 m² area has been allocated for each BIA system: vertical farm, soil-based, and greenhouse. While the client expressed support for BIA systems, the client did question the additional energy requirements for these agricultural systems and the overall impact on the project’s performance.
Table 32: Building performance indicators, city limits, and proposed design data.
Table 33: Building energy model results and conversion rates for Vancouver; full list in appendix.
Stormwater Cistern
Anaerobic
Figure 73: Hypothetical systems diagram of a
Table 35 summarizes the paired metrics calculated for the vertical farm system. These metrics are extracted from averages of the LCA analysis outlined in this research, and the full data set is included in the appendix (see Tables 10 and 11). These data points provide insights that address the client’s questions and connect the BIA system to the building’s overall performance at this design stage.
PERFORMANCE
Since the available space for BIA, is the known driving factor (500m2), the calculations are expressed as:
nj EUI impact = 500 m² x EUIb / GFA
nj GHGI impact (Operational) = 500 m² x GHGIb / GFA
nj Harvestable quantity = 500 m² x EUIb/EUIa
Table 35 also outlines the energy and operational carbon impacts of integrating a vertical farm into the building. It shows that all adjusted EUI and GHGI values remain within the city’s performance limits. Estimated crop yields are also included, enabling the client to understand the additional benefit of integrating such a system into an urban development.
This example illustrates a single design scenario for quantifying and incorporating BIA into building performance at the early design stage. By preparing paired metrics, as shown here, vendors can provide ready-touse specifications, easing cross-industry integration for designers. Multiple scenarios can be created based on client needs and design constraints, but this case highlights how BIA can be integrated into building design and underscores the importance of collaboration between BIA vendors and the building design industry.
Table 34: Paired performance metrics for vertical farms and rooftop greenhouses, with calculation outcomes.
Table 35: Building performance indicators for energy and carbon related to BIA resource inputs.
Leafy Greens
Vining Crops
Key Findings
This study reviews BIA lifecycle inventories and maps inventory items across BIA projects against the established building LCA standard ISO 14040.
The findings indicate that most BIA inventory items from pre-production to farm-gate align well with building lifecycle phases, from preproduction to end-of-life.
However, challenges arise when attempting to extend these comparisons to the post farm-gate phase, where products enter the supply chain. The complexity of agri-food logistics makes it challenging to directly compare BIA systems and traditional building performance standards.
Performance Metrics and Trade-Offs
The study reviewed performance metrics for three urban agriculture types—soil-based, greenhouse, and vertical farms—using a literature review, case study analysis, and industry discussions. The analysis revealed key operational and embodied carbon hotspots across farm types and trade-offs in food yield, energy use, and water use. Each farm type exhibits unique strengths and challenges, which will be explored in subsequent sections, focusing on strategies for balancing resource efficiency and production volume.
Yield Dependency and Carbon Emissions
Embodied carbon values vary based on yield efficiency. For instance, when assessed per kg of market-ready product and discounting operational carbon phases (A4 and A5), soil-based urban farms demonstrate the highest embodied carbon per kg of crop due to growing media and infrastructure requirements. Conversely, vertical farms report lower embodied carbon per kilogram but exhibit higher embodied carbon per square meter due to high infrastructure and packaging demands.
This indicates a trade-off between production volume and embodied carbon, with vertical farms excelling in yield density but incurring higher material and energy footprints vertical farms stand out for maximizing yield within minimal floor areas, making them a strong candidate when space efficiency is critical.
However, this advantage is offset by higher operational energy demands and carbon emissions, driven by lighting and climate control. Conversely, soil-based systems, while less productive, present opportunities for low-tech, passive solutions such as rainwater collection and reduced energy input, particularly suitable for low-density urban settings.
Opportunities and Challenges in CrossComparative Metrics
This study raises critical questions regarding the holistic assessment of urban food systems. A key limitation lies in the variability of KPIs across farm types, making it challenging to predict operational performance accurately. Additionally, while the embodied carbon metrics offer insights into resource efficiency, they do not fully account for food yield variations in low-yield systems. To improve the robustness of these metrics, further research is needed to integrate total production impacts using diverse urban farming models.
One limitation stems from the small sample size (n=41) of life cycle analyses, with many data points relying on selfreported KPIs from industry practitioners. Data availability remains an ongoing challenge, as publicly accessible LCA studies are limited. Most case studies originate from Europe, North America, and parts of Asia, highlighting a geographic data gap. Future studies should include data from Asia, Oceania, Africa, and South America to capture a global perspective on BIA performance.
Adapting to the Complexity of BIA Projects
Analyzing BIA case studies presents unique challenges due to the high scale, technology, and context variability. Projects range from small urban installations to large neighbourhood-scale initiatives, incorporating diverse practices and technologies. This variability complicates the development of a standardized analytical framework that adapts to each project’s specific characteristics and goals.
BIA initiatives often aim to address various urban challenges, including food security, climate resilience, and sustainability. This diversity makes it necessary to integrate multiple performance metrics and sustainability indicators. For example, while large-scale vertical farms may focus on high-yield production, soil-based urban farms often prioritize community engagement and food accessibility. Balancing these multi-faceted goals requires a methodical and adaptable approach that can evolve with new data and insights.
Path Forward: A Replicable Framework for Urban Sustainability
The approach presented in this study establishes a replicable framework for evaluating BIA performance by integrating agricultural and building lifecycle data. This methodology supports the identification of innovative solutions and the development of urban sustainability strategies. The framework enhances the cross-sectoral understanding needed to advance resource-efficient, resilient urban food systems by bridging performance metrics from two distinct industries.
Future work should continue to refine this framework as more data becomes available, emphasizing the potential for hybrid BIA systems that maximize the strengths of each approach. Additionally, policymakers and industry leaders must collaborate to develop clear guidelines and standardization protocols, ensuring consistent performance benchmarking across BIA projects.
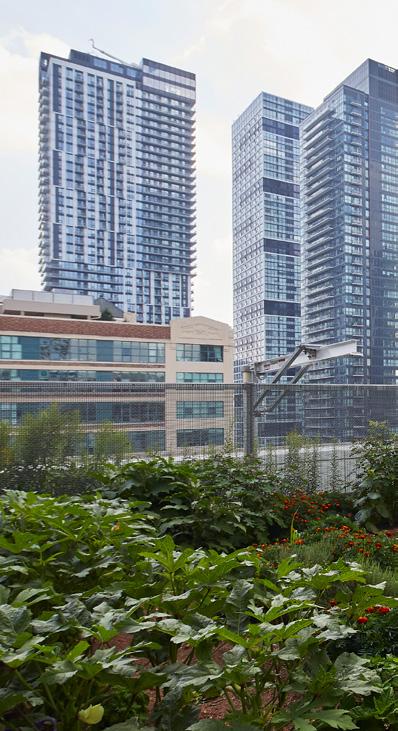
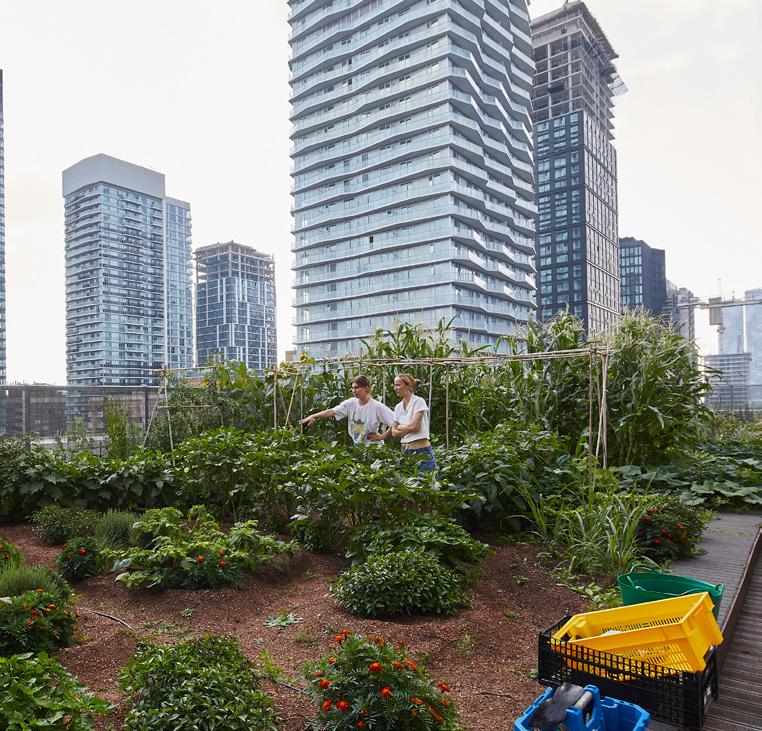
Figure 74: Perkins&Will, Daphne Cockwell Health Sciences Complex, Toronto Metropolitan University, Toronto, ON.
Resource Exchange & Recovery Systems
Introducing resource recovery measures between buildings and farms presents a promising pathway to improve KPIs and reduce embodied carbon emissions across all farm types. Buildings inherently generate waste, such as organic matter, excess water, and CO₂ emissions, which can be redirected as valuable inputs.
For example, grow media for plant production can be sourced from local building or business waste, where organic materials are treated and repurposed as substrates in hydroponic systems (Molari, Dominici, & Comino, 2024). Technologies and processes that recycle organic waste into compost, repurpose wastewater, and recover materials are essential for resource recovery. This approach extends the lifecycle of waste materials and reduces end-oflife emissions, thereby lowering the carbon footprint of integrated agricultural systems.
This section explores the opportunities for resource exchange as the third pillar of this chapter to better understand the environmental implications of BIA technologies.
Pillar 3
Resource MappingConnecting the Dots
Energy use remains the primary contributor to operational emissions in vertical farms. To reduce energy demands, reusing waste heat for climate control and integrating passive solar systems can help offset the need for artificial lighting. In regions with higher-carbon energy grids, the adoption of green energy becomes essential. Studies demonstrate that integrating vertical farms into buildings can reduce VF energy consumption by 12–51% (Blom, et al., 2023). Additionally, situating VF facilities in business parks or industrial zones can further minimize energy needs for climate control (Gentry, 2019). These principles are acute in an era of reshaped trade relations and increased need for more self-sufficient city design, as underscored by the COVID-19 pandemic (Bene, 2020 ).
Identifying specific opportunities for resource exchange is a crucial exercise as BIA projects expand globally. This section aims to match and quantify the unique needs and waste streams of different building types with an integrated farming systems. The guiding research sections are:
nj Typology-Waste Relationship
Examine how waste streams from various building typologies can be redirected into BIA systems. Qualify and quantify different waste streams per typology.
nj Resource Recovery Nodes
Develop scalable scenarios for integrating BIA. Identify strategic exchange points that facilitate resource sharing between building and BIA systems. Analyze resource recovery in BIA systems by mapping resource inputs (e.g., heat, CO₂, greywater) and outputs (e.g., nutrients, waste).
nj Technology Needs
Identify technologies that enable efficient resource recovery and exchange. Conduct a systematic review to assess cost, scalability, and efficiency.
Typology-Waste Relationship
Efficiently mapping resource recovery opportunities requires an in-depth understanding of local buildings and their associated waste streams. These opportunities vary per location, influenced by urban context, building typology, and resource availability. To establish a systematic approach, the research team developed a Building Typology and Resource Exchange Model, which is applied to case studies in Vancouver, Portland, and Chicago to assess potential opportunities for resource recovery.
The resource exchange modeling follows a two-pronged approach. First, the researchers developed a building typology – generalized building categories that may be conducive for integration with BIA systems. This typology aligns with Perkins&Will’s practice areas expertise and existing projects. This generalized building typology enables a more robust quantitative assessment of resource exchange opportunities, particularly considering the limited data available on waste resources and material inputs for specific business types.
Following the typology, the model maps and quantifies resource flow pathways between urban buildings and BIA systems. The goal is to identify critical exchange nodes where building waste streams can be efficiently redirected to support agricultural needs.
This section identifies, qualifies, and quantifies key waste streams across three representative building typologies selected for their high potential to enable resource exchange with BIA systems. The valorization of these waste streams is demonstrated through simplified case study analyses.
These case studies provide a framework for mapping wasteto-resource pathways, including energy, water, and organic waste flows, to advance circularity strategies and enhance the overall environmental performance of urban buildings.
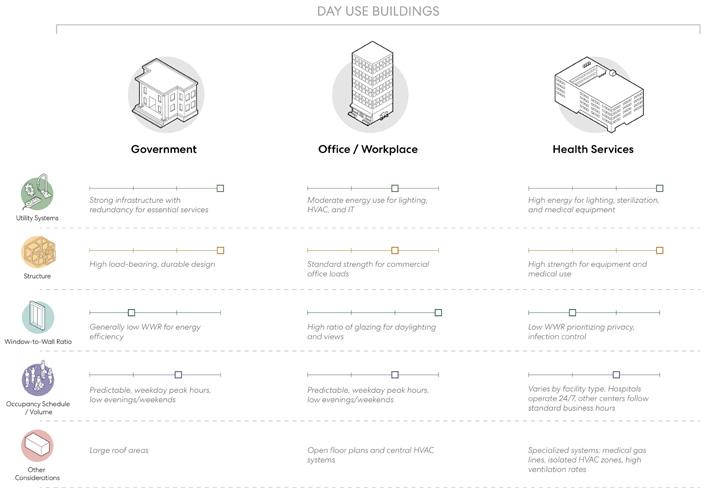
75: Typology breakdown (government, office/workplace, health services, hospitality, and retail), and associated waste stream potential.
Figure
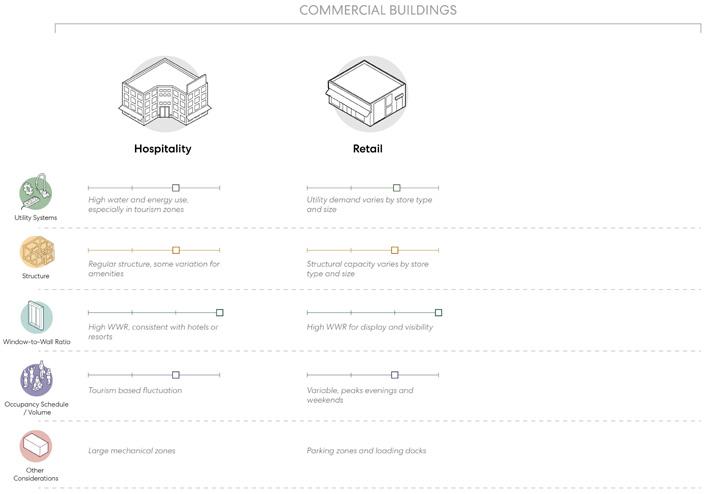

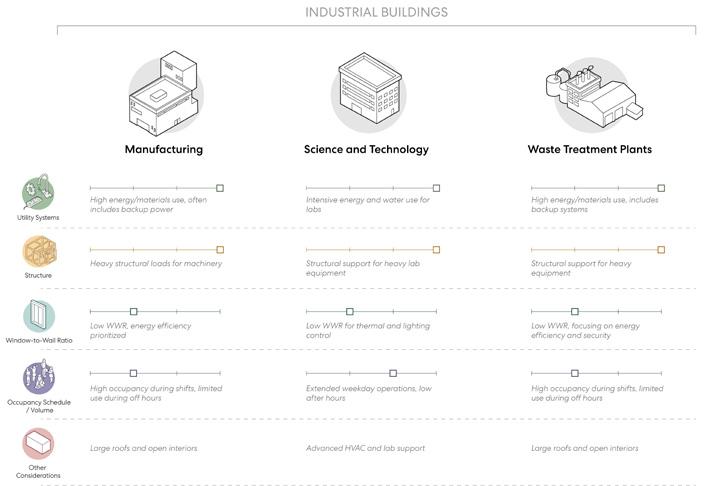
76: Typology breakdown (manufacturing, science and technology, waste treatment plants, educational) and associated waste stream potential.
Figure
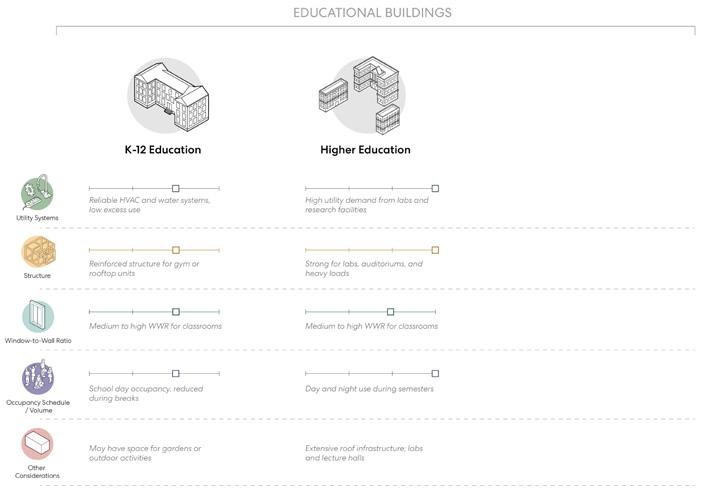

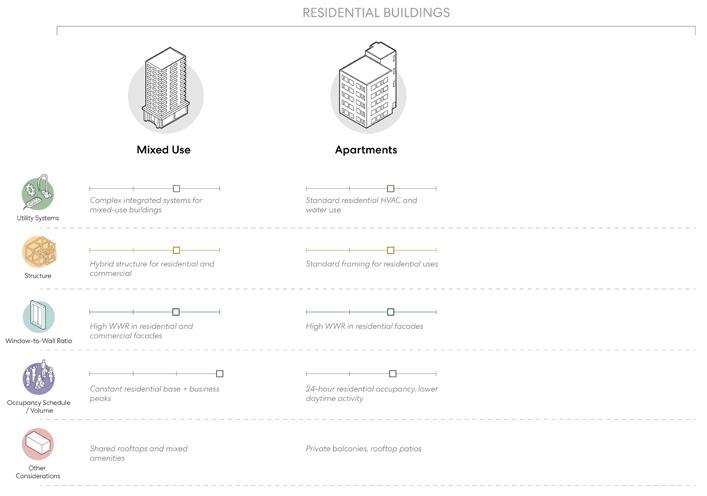
Figure 77: Typology breakdown (mixed use, apartments, and event spaces) and associated waste stream potential.


Waste Heat and Operational Energy
Source and Nature
Buildings consume energy for heating, cooling, ventilation, lighting, and equipment, with a portion of this energy being wasted as heat. In Canada, operational energy use intensities (EUI) are high and vary by building type, indicating heat flows that could be recovered. This waste heat is released through warm air exhausted from ventilation, hot water discharged down drains, heat rejected by chillers or cooling towers, and heat radiated through the building’s envelope.
Resource Recovery
Waste heat is a valuable resource for year-round farming in Canada’s cold climate. Recovered heat, in the form of warm air or water, can maintain optimal temperatures in rooftop soil beds or indoor grow rooms, thereby reducing the need for external heating. It can also drive absorption chillers or dryers in a greenhouse, helping to control humidity.
Ventilation Exhaust
Buildings expel stale indoor air, laden with both heat and CO₂, while simultaneously drawing in fresh air. Without heat recovery, this process represents a major source of energy loss. For instance:
nj A typical 10,000 m² office building with a ventilation rate of approximately 4,300 L/s (or about 7.5 L/s per person, as per ASHRAE 62.1 guidelines) requires significant outdoor air intake in cold Canadian climates. This ventilation rate can result in approximately 1 × 10⁶ kWh/year of energy loss as warm air is expelled. Figure 80 illustrates the potential savings with Energy Recovery Ventilators ERVs.
To mitigate this loss, Heat Recovery Ventilators (HRVs) can capture up to 90% of the waste heat from exhaust air. This recovered energy can then be utilized to:
nj Warm a rooftop greenhouse during winter months.
nj Maintain the internal climate of an vertical farm, significantly reducing heating loads.
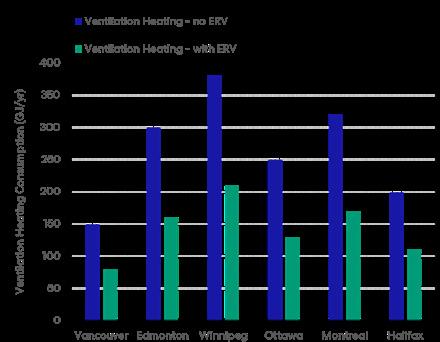
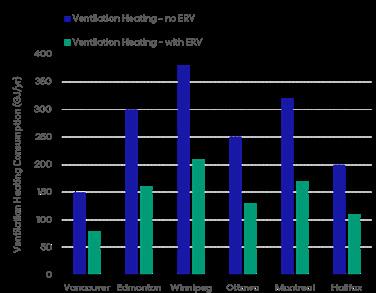
Figure 78: Comparison of HVAC energy use (GJ/year) with and without ERV across Canadian cities. Illustrates waste heat recovery potential (Natural Resources Canada, 2024).
Table 36: Canadian National Median Reference Values for Portfolio Manager Property Types (Energy Star, 2023).
Drain Water (Greywater) Heat
Warm water discharged from showers, sinks, or laundry carries away significant thermal energy. In Canadian households, the average hot water usage is ~75 liters per person per day, which translates to 5–8 kWh of heat energy used for water heating per day (USGBC, 2025).
Without the use of heat exchangers, most of this energy is lost as warm water (30–40°C) is drained directly into the sewer system. However, technologies like drain water heat recovery (DWHR) can reclaim approximately 50–60% of this energy.
nj One person’s greywater can contain approximately 2,000–3,000 kWh of recoverable heat energy per year.
nj Greywater heat recovery in showers can save approximately 5,000–8,000 kWh per year per household in Canada (Natural Resources Canada, 2003).
This calculation is based on 75 liters of hot water per day, with a temperature drop from 50°C to 15°C, which equates to approximately 12.6 MJ/day or 4.6 GJ/year.
In buildings with numerous occupants (e.g., apartments or hotels), the cumulative heat stream can be substantial, offering opportunities to:
nj Preheat greenhouse water.
nj Maintain soil warmth in rooftop farms or urban agriculture installations.
Table 37: Indoor water consumption baseline (per person per
Adapted from U.S. (Green Building Council, 2025).
Equipment and Lighting Waste Heat
Commercial buildings generate waste heat from lighting, computers, and various appliances. These internal heat gains can be enough that many office buildings remain in cooling mode even during winter. Capturing and redirecting this excess heat can enhance building efficiency and support BIA.
One effective strategy is to employ water-loop heat pumps or heat exchangers to recover and redirect waste heat from equipment and lighting. For example:
nj Server Rooms: The waste heat from server rooms, where cooling is continuously required, can be captured and used to warm hydroponic growing areas or rooftop greenhouses.
nj Refrigeration Compressors: Grocery stores generate waste heat from their refrigeration systems, which can be captured to maintain an optimal climate for indoor agriculture.
nj Ice Rinks: Ice rinks generate significant waste heat while maintaining the ice surface. In some Canadian arenas, this excess heat is recycled to:
‒ Warm spectator areas.
‒ Heat adjacent swimming pools.
‒ Maintain soil bed temperatures in connected greenhouses or growing areas.
Variability by Building Type
The potential for waste heat recovery and use in BIA varies by building type. Each typology presents unique operational patterns, energy intensities, and waste heat profiles, which can be leveraged for urban farming applications.
Healthcare
Hospitals, with their 2.20 GJ/m² energy use (Energy Star, 2023), generate continuous waste heat from sources such as:
nj Sterilization equipment
nj Laundry and kitchen operations
nj Medical imaging and diagnostic devices
nj HVAC and lighting in 24/7 spaces
While modern facilities often incorporate heat recovery systems from ventilation and chillers, integrating them with a BIA system can offer novel synergies. For example, low-grade waste heat from chillers could be used to warm soil beds or nutrient solution tanks in an adjacent rooftop greenhouse. The consistent operation of hospitals offers a stable and reliable heat stream, ideal for maintaining controlled agricultural environments year-round.
Educational
Educational facilities typically exhibit intermittent occupancy and variable thermal loads:
nj Buildings require heating in the mornings but may have a surplus of heat in the afternoons.
nj Waste heat can be stored in thermal batteries or water tanks and released into greenhouses after hours.
nj Many campuses are served by centralized boiler plants, which produce flue gases rich in heat and CO₂. These gases can be fed into connected indoor farms after proper scrubbing to stimulate plant growth.
After proper filtration and scrubbing, this flue gas could be redirected into an indoor growing space, enhancing plant growth through CO₂ enrichment while also utilizing the thermal energy. These systems can also facilitate the integration of curricular and research components for sustainability education.
Commercial Offices
Office buildings often have high internal heat gains due to dense occupancy, high computer and equipment usage, artificial lighting and plug loads. Even in cooler climates, this results in surplus heat. The predictable weekday occupancy of office towers supports steady energy flow and recoverability. Waste heat recovery opportunities include:
nj Energy recovery wheels can be installed in ventilation systems to precondition greenhouse air, transferring heat and humidity.
nj An office tower’s HVAC chiller also produces warm condenser water, a warm fluid that can be circulated through hydroponic racks to heat hydroponic systems or aquaponic tanks.
nj Potential integration with rooftop or atrium greenhouses using existing mechanical systems.
Sports/Recreational
Facilities like pools and ice arenas have specialized and often underutilized heat profiles, offering high-impact, event-driven integration potential.
nj Swimming pools generate warm, humid air requiring dehumidification. Heat pumps can reclaim latent heat, and condensate water can be reused for irrigation.
nj Ice rinks expel heat via refrigeration systems—even in winter. This rejected heat could support adjacent greenhouses or vertical farms.
nj Outdoor stadiums are heated intermittently for events, offering opportunistic energy capture, such as storing thermal energy on game days for later use in greenhouses or soil heating tanks.
Residential
Residential buildings, especially multi-unit dwellings, produce moderate but consistent heat streams. Although residential buildings have a slightly lower EUI (~0.82 GJ/m²/ year), the aggregate thermal output across occupants still represents a valuable heat stream for BIA systems, especially when scaled across large complexes.
nj Greywater from showers, dishwashers, and laundry carries significant heat, particularly in larger buildings.
nj Ventilation losses from bathroom and kitchen exhausts are often not recovered in low-rise homes.
nj High-rise apartments may utilize make-up air units, which can be supplemented with heat recovery systems to support rooftop gardens.
Total Waste Heat Recovery (WHR) Equations
WHR = Qbrew + QHVAC + Qprocess
nj Qbrew= Waste heat from brewing (kWh)
nj QHVACQ= Waste heat from HVAC systems (kWh)
nj Qprocess= Waste heat from other industrial processes (kWh)
Energy Offset from Recovery (EOR):
EOR = WHR × n
Etotal
nj n= Efficiency factor of the heat recovery system
nj Etotal= Total energy consumption
CO2 Enrichment
Source and Nature
Buildings inherently contain sources of CO₂. While CO₂ emissions may originate from building operations, such as heating systems or on-site power generation, the majority of indoor CO₂ emissions primarily stem from human respiration. Humans exhale CO₂ as a natural byproduct of metabolism, releasing approximately 1.0 kg of CO₂ per day, depending on activity levels (EPA, 2024). In occupied indoor environments, CO₂ accumulates and is exhausted to maintain air quality. For example:
nj Commercial Office Building (100-person capacity)
‒ Occupancy: ~8 hours per day, ~260 workdays per year
‒ CO₂ Emission per person during occupied hours: 0.33 kg/day
‒ Annual CO2 exhaust: ~8.6 tonnes
Resource Recovery
This steady CO₂ stream can be repurposed as a plant nutrient, enhancing crop yields when used appropriately. Rather than venting into the atmosphere, ventilation exhaust CO₂ could be redirected into rooftop greenhouses or indoor hydroponic farms, which often actively enrich the air with CO₂ to levels of ~800–1200 ppm to enhance photosynthesis.
The volume is substantial—a single person’s respiration contains roughly 100 kg of carbon that plants could assimilate per year. In high-occupancy buildings, this represents a considerable and continuous source of carbon that can be harnessed to close the loop between building emissions and food production.
Variability by Building Type
Occupant-driven CO₂ vary by building type, depending on occupancy density, usage patterns, and operational hours.
Healthcare
Hospitals operate 24/7 and maintain high occupancy levels due to the continuous presence of patients, staff, and visitors. A 500-bed hospital may generate approximately 500 kg of CO₂ per day from the respiration of its occupants. Additionally, hospitals often use natural gas boilers or cogeneration systems, contributing further CO₂ emissions through combustion.
Educational
Schools and universities have dense occupancy during class hours, typically on weekdays. A campus with 1,000 students and staff may produce 200–300 tonnes of CO₂ annually. Although this CO₂ is often diluted through ventilation, the concentrated occupancy during scheduled hours creates periodic CO₂ spikes that could be harnessed for controlledenvironment agriculture.
Commercial Offices
Offices typically experience moderate to high CO₂ levels during business hours, which are generally 8–10 hours per day. An average office worker exhales approximately 0.9 kg of CO₂ per workday, totaling ~ 200–300 kg per year (EPA, 2024), accounting for holidays and weekends. Large office towers with thousands of employees can collectively emit tens of tonnes of indoor CO₂ annually.
Sports/Recreational
These buildings have highly variable occupancies based on event schedules. During events, thousands of attendees can cause rapid CO₂ buildup. For instance, each spectator may emit ~40 liters of CO₂ per hour, or ~0.08 kg/hour (Howard, 2021). While overall annual CO₂ emissions depend on event frequency, venues such as arenas, stadiums, and gyms still represent intermittent but significant sources of CO₂.
Residential
Residential environments contribute high cumulative CO₂ emissions, as people spend much of their time at home. A typical household of four can emit approximately 4 kg of CO₂ per day, or around 1.5 tonnes per year, from respiration. Mixed-use residential buildings combine evening and overnight emissions from residents and daytime emissions from commercial tenants, such as shops and restaurants. These combined usage patterns create a steady CO₂ stream that, if captured, could be valuable for nearby BuildingIntegrated Agriculture systems.
Integrated CO₂ Capture and Reuse Impact Calculation (CCRI)
C0₂ emitted
CCRI =
CUR = x 100 x OCR x 100
C0₂ utilized
C0₂ emitted
C0₂ utilized
nj CO₂ captured = Volume of CO₂ captured from brewing processes (kg/year)
nj CO₂ emitted = Total CO₂ emissions from brewing and HVAC (kg/year)
nj CO₂ utilized = CO₂ used for crop growth enhancement (kg/year)
nj OCR = Operational Carbon Reduction
nj CUR = CO2 Utilization Rate
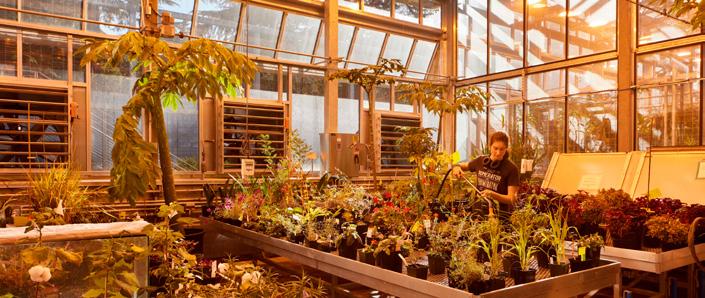
Figure 79: Perkins&Will, University of Washington Life Sciences Building, University of Washington, Seattle, WA.
Food Waste Streams (Organics)
Sources and Nature
Food waste is an underutilized waste stream found in all building types where food is prepared or consumed. This includes kitchen scraps from meal preparation, plate leftovers, expired groceries, and other organic materials. In Canada, an estimated 20% of all food produced— approximately 11 million tonnes annually—is wasted (Government of Canada, 2019). Much of this waste is both avoidable and nutrient-rich, offering a valuable resource that can be redirected from landfills and valorized through composting or integrated into closed-loop systems to support urban agriculture.
Usability of Food Waste
Food waste, with a carbon-to-nitrogen ratio of ~15–30:1 and ~70% moisture content, is a nutrient-rich resource. When stabilized through composting or digestion, it supports soil health and plant productivity. It can be transformed into compost, digestate, animal feed, or energy, effectively closing the nutrient loop.
nj Compost for Soil-Based Farms: Food scraps decompose into humus, returning carbon and essential nutrients (including nitrogen, phosphorus, potassium, and trace minerals) to rooftop soil systems. One tonne of mixed food waste can yield several hundred kilograms of finished compost, typically containing 1–2% nitrogen by weight. This enhances soil fertility, reduces the need for synthetic fertilizers, and promotes healthy microbial activity.
nj Digestate for Hydroponics: The anaerobic digestion of food waste produces a nutrient-rich digestate containing ammonia, phosphates, and potassium—usable, after treatment, as a hydroponic solution. It also generates biogas, primarily consisting of methane and CO₂, which can power grow lights through combined heat and power (CHP) systems. The CO₂-rich exhaust, once treated, can be directed to enhance plant growth.
Variation by Building Type
Institutions (Schools, Hospitals)
Institutional kitchens, especially in schools and hospitals, produce food waste from meal prep and plate waste. A university dining hall, for instance, may generate several hundred grams of food waste per student daily, amounting to several tonnes annually across the student population. In hospitals, uneaten patient meals are discarded for safety reasons, alongside prep waste and expired items.
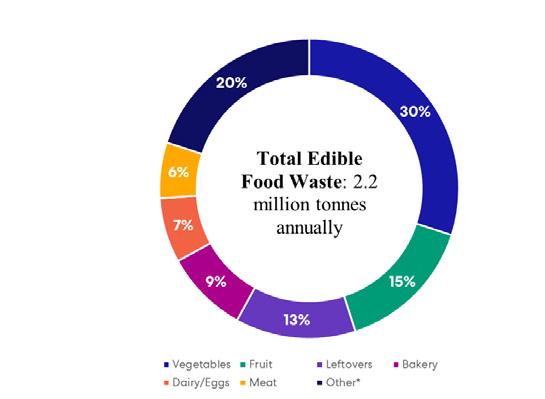
* “Other” includes snacks, staples, drinks, and oil/fat.
Figure 80: Benchmark study on household food waste (The National Zero Waste Council’s, 2017).
Restaurants and Hospitality
The food service industry produces a substantial volume of organic waste. In restaurants, hotels, and institutions, about 38% of fresh produce, 21% of dairy and eggs, and 20% of meat is discarded before reaching the consumer (Government of Canada, 2019). Post-consumer waste is also common. A single restaurant can generate dozens of kilograms of food waste daily. With over 97,000 food service establishments across Canada (Government of Canada, 2019), this amounts to hundreds of thousands of tonnes annually. While some of this material is composted or processed through anaerobic digestion in progressive cities, it remains a valuable nutrient stream—ideal for rooftop farms, via compost or vermiculture systems, which utilize worms whose castings fertilize crops.
Retail (Grocery Stores)
Supermarkets account for ~12% of avoidable food waste in the supply chain (Government of Canada, 2019). Waste typically includes bruised or unsold produce, expired bakery items, and products removed due to their expiration dates. A mid-sized grocery store can discard several tonnes of organic waste each year, which is often sent to municipal compost. In commercial centers with rooftop farms, these discards could be source-separated and composted on-site, returning nutrients to the rooftop soil system.
Sports and Event Venues
Stadiums and arenas generate episodic surges of food waste through concession stands and catering. At a typical hockey game, large volumes of food and beverages are sold, with considerable waste—unsold hot dogs, half-eaten snacks, and thousands of single-use containers containing food residue. One study found that major events can generate 5 to 15 tonnes of waste per event, a significant portion of which is compostable food waste. With proper infrastructure, this material could be diverted to community gardens or on-site green roofs.
Residential
According to the UN Food Waste Index, Canadian households generate about 79 kg of food waste per person annually, or roughly 237 kg for a three-person household. Most of this waste consists of fruits and vegetables (~30% by weight), along with bread, meat, dairy, and other nutrient-rich items. In a 100-unit apartment building, edible food waste alone could amount to over 14 tonnes per year (NATIONAL ZERO WASTE COUNCIL, 2018).
OWR = x 100 x OCR Mcomposted mtotal
nj Mcomposted = Mass of organic waste composted
nj Mtotal = Total organic waste generated
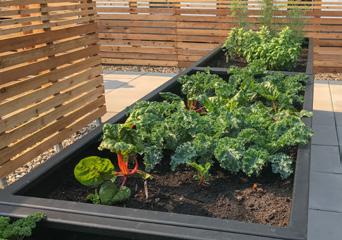
Figure 81: Perkins&Will, University of British Columbia Orchard Commons, Vancouver, BC.
Waste Water Recovery
Source and Nature
Buildings generate two primary wastewater streams:
nj Blackwater: Wastewater from toilets and urinals containing feces and urine.
nj Greywater: Relatively cleaner wastewater from showers, sinks, and laundry.
Both streams carry not only water but also valuable resources such as nutrients (nitrogen, phosphorus, potassium), organic matter, and residual heat, all of which can be recovered as inputs for urban farming through appropriate treatment systems.
Wastewater Volumes
Water use and corresponding wastewater generation are typically measured in liters per person per day (L/person/ day) or cubic meters per year (m³/year).
National Averages
In practice, combined domestic wastewater (blackwater + greywater) in Canada typically ranges from 100–300 L/ person/day (Kumari, et al., 2020), or roughly 0.1–0.4 m³ per person per day. Although Canada has historically been among the highest in per capita water use, conservation measures have begun to lower these figures.
Residential Buildings
Canadian households use ~180–225 L of potable water per person per day, most of which becomes wastewater. This equates to ~81 m³ of wastewater per person annually.
nj Approximately 30% of residential water use is dedicated to toilet flushing (USGBC, 2025), resulting in ~70 L/day of blackwater and 150 L/day of greywater per person.
nj For a household of four, this translates to approximately 28 m³/year of blackwater and 55 m³/year of greywater, totaling 83 m³/year.
Commercial and Institutional Buildings
Water use varies significantly based on building function:
nj Offices (no showers): 20–50 L per employee per day, primarily for washrooms and kitchenettes.
nj Schools: 20–50 L per student usage, with additional demands from gymnasiums and science labs.
nj Hospitals: Among the most water-intensive facilities, generating 1,200 L (~438 m³/year per bed) on the high end and an average of 400–1200 L of wastewater per bed per day (Kumari, et al., 2020). At 400 L/bed/day, a 500-bed hospital would produce over 73,000 m³/year of wastewater—rich in nutrients, pharmaceuticals, and cleaning agents, which are typically treated off-site.
Sports and Event Venues
These facilities experience sharp, short-term spikes in wastewater generation.
nj A stadium event with 20,000 attendees using washrooms once each, with low-flow toilets using ~5 L per flush, generates approximately 100 m³ of blackwater in just one evening.
“Water is life. It is imperative that we stop treating used water as a waste to be eliminated as quickly as possible from buildings. Reimagining building wastewater as a valuable resource to feed urban agriculture is a win-win from all angles.”

Gwynne Mhuireach | University of Oregon Assistant Professor
Nutrient Content
Human wastewater is often considered a dilute fertilizer solution, rich in essential plant nutrients. The majority of these nutrients come from urine and feces, and with appropriate treatment, they can be recovered and reused in agriculture.
Nitrogen (N)
Nitrogen is primarily excreted in urine as urea. An average adult produces approximately 11 g of nitrogen per day, or around 4–5 kg per year (Thomas, 2023). Once in wastewater, urea rapidly converts to ammonium and organic nitrogen.
nj Typical concentrations: 20–50 mg/L total nitrogen in domestic sewage (EPA, 2024).
nj Example: A person producing 80 m³ of sewage annually at 40 mg/L contributes ~3.2 kg of nitrogen. Recycled nitrogen, in the form of ammonium or nitrate, is a crucial
Phosphorus (P)
Phosphorus originates from both urine, in the form of phosphates, and feces, which contain undigested food and cellular waste. Adults excrete 1.3–1.5 g/day, or around 0.5 kg/ year (Government of Canada, 2024)
nj Wastewater concentrations: 5–15 mg/L in raw sewage, with municipal data ranging from 1.4 to 6 mg/L (Government of Canada, 2024).
nj Recovery: Phosphorus can be captured in sewage sludge or precipitated as struvite (magnesium ammonium phosphate), a slow-release fertilizer, from wastewater streams or through composting toilets. Sewage sludge (Biosolids) in Canada typically contains ~2.5% phosphorus by dry weight, totaling ~12,500 tonnes of P annually (Government of Canada, 2024). As phosphorus is essential for plants, its recovery is essential for long-term soil fertility.
Potassium (K)
Potassium is mostly excreted in urine, with daily output averaging 2–3 g, or 0.8–1.0 kg/year per person (O’Donnell, et al., 2014).
nj Wastewater concentrations: Typically, 10–30 mg/L.
nj Unlike nitrogen and phosphorus, potassium is not commonly removed in wastewater treatment and remains in the effluent; however, it can be recovered from urine or greywater through evaporation or filtration. Potassium is crucial for plant health and a key component of hydroponic nutrient solutions.
Organic Matter
Organic matter exists in blackwater, measured as Biological Oxygen Demand (BOD) and Chemical Oxygen Demand (COD).
nj Uses: This organic content can be processed in anaerobic digesters to produce biogas or converted into biosolids through composting.
nj Farming value: Properly treated from pathogens, biosolids contain around 4% nitrogen and 2.5% phosphorus, along with micronutrients—functionally equivalent to a slow-release organic fertilizer (Government of Canada, 2024). However, concerns around heavy metals and pharmaceutical residues mean biosolids should be carefully treated and monitored before application to food crops.
Usability of Wastewater for Urban Agriculture
With appropriate treatment, wastewater streams— particularly greywater, urine, and blackwater—can be transformed into valuable resources for irrigation, nutrient recovery, and energy production.
Greywater Reuse
Greywater contains low levels of nutrients and pathogens compared to blackwater. After basic filtration and disinfection, it can be safely reused for irrigation.
nj Applications: On rooftop farms, treated greywater can irrigate ornamental or non-edible plants directly. For edible crops, sub-surface irrigation or use in hydroponics is possible with further treatment—such as constructed wetlands or biofiltration—to achieve higher water quality.
nj Benefits: While primarily a strategy for water conservation, greywater also carries small amounts of nutrients (e.g., nitrogen from soaps) and retains residual heat and humidity, which may benefit greenhouse environments.
Urine Diversion and Fertilizer Production
Urine is sterile when freshly excreted and contains the majority of nitrogen and potassium, as well as about half of the phosphorus, in human waste.
nj Recovery Method: Source-separated urine can be stored and aged, during which urea converts to ammonia, raising the pH and sanitizing the solution.
nj Applications: This nutrient-rich liquid can be diluted and used in hydroponics or as fertilizer for crops. Successful pilot projects in Switzerland and Sweden have demonstrated the viability of growing grains and vegetables using human urine fertilizer.
nj Nutrient Yield: One person produces approximately 500 L of urine per year, containing ~4 kg of nitrogen, 0.5 kg of phosphorus, and 1 kg of potassium—sufficient to support a substantial volume of crop growth (Government of Canada, 2024).
Blackwater and Biosolids:
Blackwater can be processed through anaerobic digestion, producing two key outputs:
nj Biogas, a renewable energy source for greenhouse lighting or heating
nj Digestate, a nutrient-rich sludge that can be dewatered and composted into a safe, soil-friendly amendment This mirrors the municipal biosolids treatment process, where treated sewage sludge is used in agriculture and landscaping.
nj Example: 1 m³ of sewage can yield 20–30 m³ of biogas and a nutrient-dense sludge containing most of the original nitrogen and phosphorus. On a campus or in an eco-district, a decentralized digester could generate both energy and fertilizer for an integrated rooftop farm.
Aquaponics Potential
Treated wastewater, particularly after settling, filtration, or biological treatment, can be repurposed in aquaponic or algal systems.
nj Nutrient-laden water may first be routed through algae or duckweed ponds or used to raise fish, which in turn produce a more stable effluent suitable for plant cultivation.
nj Though still experimental at scale, these engineered ecosystems treat blackwater as a resource rather than waste, converting excess nutrients into food and biomass through natural cycles.
Variability by Building Type
Multi-Unit Residential Buildings (MURBs) generate the highest wastewater volume per person, while day-use buildings use less water per occupant. Higher water use leads to diluted nutrient concentrations, while buildings with lower water use—particularly those with predominantly toilet waste—produce more concentrated sewage.
Residential
In single family homes, blackwater is primarily human waste, while greywater comes from bathing and laundry. Although the nutrient content per person is relatively consistent, driven by diet, the total volume from a single household is modest. However, aggregated at the scale of a multi-unit building or neighborhood, these flows become significant. Residential wastewater typically contains fewer industrial contaminants or heavy metals, making it more suitable for nutrient recovery. Eco-home designs are increasingly incorporating composting toilets and greywater gardens.
Commercial (Offices)
Office buildings primarily generate blackwater from restrooms, with minimal greywater due to the absence of showers. The wastewater volume per person is lower in office settings compared to residential settings due to limited occupancy hours; however, the aggregate volumes in large office towers are substantial. Importantly, office wastewater tends to have fewer contaminants, simplifying treatment. Urine separation in commercial buildings presents a viable opportunity to collect nutrient-rich liquid fertilizer.
Educational
Schools generate mainly toilet waste and some greywater from handwashing and cafeteria cleaning. University dormitories resemble residential buildings in terms of water use and waste composition. A K–12 school, for example, could implement a greenhouse irrigated with greywater from sinks, which has a lower pathogen risk than toilet water. Educational settings also offer potential for integrated learning opportunities around water reuse.
Healthcare
Hospital wastewater is among the most complex. It includes human waste, as well as pharmaceuticals, and radioactive substances from diagnostic procedures. As such, direct reuse for food production is not viable without advanced treatment. Selective recovery, such as urine diversion, could be explored in long-term care or rehabilitation, where patient populations are stable and dietary management is in place. Since urine is typically sterile and nutrient-dense, separate collection could enable safe recovery. In most cases, hospital wastewater is best treated off-site, where centralized facilities can extract nutrients from treated sludge or effluent.
Sports and Recreational Facilities
These venues experience high-volume, intermittent blackwater generation during events, with limited greywater. Wastewater surges could be managed with on-site holding tanks or compact treatment systems. Some stadiums consider using constructed wetlands to treat seasonal wastewater loads, producing reclaimed water for landscaping. Given that urine often dominates blackwater volume, the nutrient content could support turfgrass or ornamental plant growth on-site.
Table 38: Estimated wastewater volumes and their nutrient content, compiled from Statistics Canada (2024), EPA (2009), and Usman et al. (2024).
Other Resoruce Recovery Streams
Beyond food waste and wastewater, buildings produce several valuable streams that can be integrated into urban farming systems with innovative design approaches:
Condensate Water
In buildings with air conditioning, HVAC systems produce condensate, which is water removed from humid air during cooling. This water is essentially distilled, with very low mineral content, making it ideal for reuse in irrigation or hydroponic systems.
nj A commercial air handler in a humid city might generate tens of thousands of liters over a summer.
nj In a 100,000 ft² (9,300 m²) building, daily production on humid days may reach 3–5 m³, totaling 300–500 m³ per season, a meaningful water supply for farming.
nj Some indoor farms co-located with commercial buildings or data centers already use this source. A large office tower may recover 5,000–10,000 m³/year of condensate, sufficient to irrigate several hectares of crops.
nj Condensate is a “blank slate” water supply, particularly suited to hydroponics, as its purity allows precise nutrient formulation.
Waste Air Humidity
Exhaust air from commercial kitchens, laundries, or shower areas carries latent water and heat. Using heat exchangers, it is possible to condense this humidity, recovering both water and thermal energy. For example, steam vented from a hospital laundry could be condensed and used to irrigate a therapeutic garden.
nj A 100,000 ft² office building in a city like Vancouver could generate ~3,000–5,000 L/day (~3–5 m³) of condensate on a warm humid day. Over a 100-day cooling season, that sums to ~300–500 m³/year.
Biogas and Bioenergy (via Anaerobic Digestion)
The anaerobic digestion of organics (e.g., food waste or blackwater) produces biogas, typically comprising 60% methane and 40% CO₂, which can be utilized for energy and CO₂ enrichment, enabling multiple cascading benefits from a single waste stream—energy, CO₂, and fertilizer.
nj 1 tonne of food waste can yield ~100 m³ of biogas, containing around 35 GJ of energy.
nj A cafeteria producing 50 tonnes/year of food waste could generate 5,000 m³ of biogas, enough to heat greenhouses during winter nights.
nj CO₂ output from burning this gas (~9 tonnes/year) can be redirected to enrich greenhouses, improving plant growth.
nj Digestate can be used as a nutrient-rich organic fertilizer.
Solid Organic Wastes for Composting
Beyond food scraps, buildings generate a variety of compostable solids, including paper towels, landscaping waste, cardboard, coffee grounds, and shredded paper.
nj These materials are carbon-rich and ideal for composting when combined with nitrogen-rich food waste.
nj For example, an office of 500 people using 3 paper towels/ day (~10 g each) produces ~15 kg/day or 3.75 tonnes/year of dry, compostable cellulose.
nj On campuses or residential buildings, autumn leaves and grass clippings collected by maintenance crews can supply rooftop farms with carbon inputs.
Waste CO₂ from Combustion Systems
Buildings that burn natural gas for heating produce CO₂-rich flue gases that are usually vented outdoors. With proper cleaning, this CO₂ can be captured and fed to greenhouses.
nj Burning 1 m³ of natural gas emits ~1.9 kg of CO₂.
nj A large building consuming 100,000 m³/year emits about 190 tonnes of CO₂ annually. If recovered, it can boost greenhouse productivity, especially in cold seasons when photosynthesis is limited by air exchange.
nj Some Canadian greenhouses already pipe cleaned industrial flue gas for this purpose.
Technology for Resource Recovery
Resource recovery within BIA relies on a diverse set of technologies, each tailored to specific types of waste and building configurations. These systems enable the conversion of wastewater, organic waste, and excess heat into valuable resources such as irrigation water, nutrients, or thermal energy. While many of these technologies are well-established in industrial contexts—such as composting, anaerobic digestion, or greywater heat recovery—their applicability and performance vary depending on the building’s type, scale, and use (Diaz-Elsayed et al., 2019).
To guide implementation, Table 39 includes a comparative matrix to evaluate a range of resource recovery technologies across multiple performance criteria. These include scalability, energy efficiency, return on investment, and circularity potential, among others.
This comparison also reveals key trade-offs—such as permitting complexity, installation footprint, or energy demand. By assessing factors like technology readiness level (TRL), stakeholder engagement, and food security contributions, the matrix serves as a tool for embedding resource recovery in diverse urban development contexts.
Methodology
The technologies included were identified through a literature review and keyword searches focused on “wastewater treatment” and “organic waste valorization.” Meta-analyses (e.g., Diaz-Elsayed et al., 2019; Zhou, 2022) provided a foundational inventory of systems applicable to BIA contexts. Each technology was then evaluated using a structured framework, examining performance and feasibility in both new construction and retrofit scenarios.
Figure 82: Suitability of wastewater treatment systems across various building scales.
Technologies and Associated Summaries
Table 39: Technologies reviewed and their associated assessment criteria.
SUB-CRITERIA
Scalability:
Suitability for small- and large-scale applications.
Adaptability:
Ability to integrate with existing systems (e.g., retrofitting potential).
Technology
Readiness Level (TRL): Stage of development
Energy Efficiency:
Input-to-output energy ratio, operational energy demand.
Carbon Footprint:
Net Greenhouse gas emissions (e.g.) CO, methane reduction
Waste Reduction:
Efficiency in diverting waste streams from landfills and waterways (e.g % of waste reduced)
Water Savings:
Reduction in freshwater demand through resuse and recycling
Biodiversity Support:
Potential to enhance soil health, plant productivity, or ecosystems.
Cost of Installation:
Capital expenditure for initial setup (e.g. anaerobic digester, PV panels).
HEAT RECOVERY TECHNOLOGIES (E.G., ECODRAIN)
Widely scalable; from single showers to full household drains.
Integrates inline with drainpipes and requires little retrofitting.
TRL 9 Fully commercialized and adopted.
Saves up to 70% energy from warm water; passive heat transfer.
URINE SOURCE SEPARATION (USS)
COMPOSTING TOILETS
Scalable to households with dual plumbing or portable toilets.
Scalable to individual homes or cabins.
Requires specialized toilets and storage tanks; retrofit possible.
Self-contained systems or basement units integrate easily.
TRL 9 Demonstrated in research and pilot sites.
TRL 9 Widely used and approved in many jurisdictions.
Very low energy use; gravity-based with minor pumping.
No water or electricity required in most models.
MEMBRANE BIOREACTORCATATONIC BIOBASED FLOCCULANT ALGAE PHOTO-BIOREACTOR
Modular systems for single-family homes or duplexes, can be scaled to large developments
Highly scalable due to low-cost production and adaptability to various treatment plant sizes.
Can be installed in basements or yards with plumbing access, retrofit into existing sewage systems
Can be retrofitted into existing chemical dosing systems with minimal infrastructure change.
TRL 9 NSF 350 certified; commercially deployed.
Energy use: ~0.4-1.0 kWh/m³ due to MBR aeration.
TRL 7-9 depending on source (e.g., chitosan, modified starches); many are commercially available.
Scalable from labscale to municipal applications; modular units allow phased expansion.
Integrates well into decentralized systems, particularly when paired with nutrient-rich wastewater streams.
TRL 6-9 depending on configuration; widely piloted and moving into early commercial stages.
High efficiency at low doses reduces chemical and energy inputs.
INDIVIDUAL COMPOST BINS
Scalable for individual homes and small gardens.
Easily integrates in backyards or community gardens.
TRL 9 Mature and widely adopted globally.
Photosynthetic process powered by sunlight; low external energy if light and CO‚‚ are sufficient. No external energy input required.
Very low carbon footprint; offsets energy demand.
Low carbon footprint; high nutrient recovery offsets fertilizer needs.
Extremely low carbon footprint and GHG emissions
Moderate carbon footprint unless solar-assisted.
Lower carbon footprint than petroleum-based polymers; biodegradable under certain conditions.
Carbon-negative potential via CO‚‚ fixation and oxygen release; strong climate mitigation co-benefits.
Minimal carbon footprint; avoids landfill emissions.
No waste reduction, but supports energy circularity. Significant nutrient removal at the source.
Eliminates blackwater and diverts organic waste.
Reduces organic and microbial load from greywater.
Effectively aggregates suspended solids and reduces sludge volume.
Removes nitrogen, phosphorus, and organic matter effectively through algal uptake.
Reduces food and yard waste at source.
No direct water savings.
No water savings unless paired with waterless urinals.
Saves 25-35% of household water (toilet flushing avoided).
Saves 40-70% household water via reuse.
No direct water savings; however, improved treatment can enhance reuse potential.
Limited direct water savings; however, treated effluent can be reused for irrigation or cooling.
No direct water savings; reduces leachate issues.
Neutral biodiversity impact.
Supports soil health via nutrient reuse.
Supports biodiversity by reducing nutrient loading in waterways.
$1000-$2000 depending on model and install.
Costs vary: $600$5000 for toilet, storage, and treatment units.
Unit cost: $9003,000 depending on complexity.
Neutral ecological impact; indirect biodiversity report
Biodegradable and less toxic, reducing ecological impact on discharge ecosystems.
Supports aquatic and microbial biodiversity; can be co-located with green infrastructure.
~$8,000-$75,000 depending on capacity.
Large scale systems upwards of $1,000,000
Low cost (~$1-$3 per kg); variable depending on feedstock and formulation.
$50K-$500K depending on scale and design (flat panel, tubular, etc.).
Improves soil biodiversity through compost use.
Very low cost (<$100); often DIY or subsidized. Moderate Low
IN-VESSEL COMPOSTING SYSTEMS AERATED STATIC PILES (ASP)
WINDROW COMPOSTING
VERMICOMPOSTING
BLACK SOLDIER FLY (BSF) COMPOSTING
AEROBIC DIGESTERS
ANAEROBIC DIGESTERS
BIOCHAR PRODUCTION SYSTEMS
Modular scalability for food hubs, campuses, municipalities.
Suited for farms, campuses, or regional compost sites.
Scalable for farms, municipalities, and large landscaping operations.
Scalable from kitchen bins to commercial worm farms.
Modular for home, farm, or institutional food systems.
Scalable from institutions to midsize communities.
Highly scalable; from farm digesters to city-scale plants.
Scalable from household TLUD stoves to large pyrolysis plants.
Integrates with existing institutional food waste programs.
Integrates with existing organics collection programs
TRL 9 Used worldwide for enclosed composting
TRL 9 Standard method in mediumscale composting.
Low/moderate energy for aeration/mixing.
Requires blowers and perforated piping (lowmoderate energy).
Lower GHGs than landfill; some emissions from energy use.
Low emissions when properly managed (covers, aeration).
Can integrate into agricultural or open space settings.
Can integrate into composting toilet or food scrap systems.
Works as add-on to kitchens, ag operations, food processors.
TRL 9 Widely used and well understood.
Low energy; mainly for mechanical turning (tractor or windrow turner).
Moderate carbon footprint; emissions from turning and decomposition.
TRL 9 Standard method in medium scale composting
Minimal energy required; mostly for climate control or harvesting.
Very low emissions; efficient bioconversion.
TRL 7-9 Widely piloted, commercial scaling underway.
Low energy use; some systems require heating or lights.
High bioconversion reduces methane from food waste.
Can retrofit into existing compost or wastewater sites.
Integrates with waste water treatment plants, dairies, food processing sites. Some small-scale systems possible
TRL 9 Mature and commercial available.
Moderate energy use for aeration and temperature control.
Lower GHGs than landfill; no methane release.
TRL 9 Proven in agricultural and industrial settings.
Produces renewable energy (biogas); heat may be needed.
Carbon-negative potential via methane capture and offset.
Can retrofit into farms, forestry operations, or compost sites.
TRL 8-9 Widely piloted and commercialized.
Energy positive; produces syngas or bio-oil alongside biochar.
Carbon-negative potential through long-term carbon sequestration.
High waste reduction (>80% volume reduction).
Efficient for food and green waste.
Handles large volumes of organic waste and nature.
Great for food scraps, paper, and some manures.
Processes meat, dairy, high-moisture waste effectively.
Reduces organic solids and odors.
Reduces up to 60-80% of volatile solids.
Reduces biomass waste and stabilizes nutrients.
Minimizes leachate via containment.
Limited leachate; tarp-covered or paved pad recommended.
No direct water savings; risk of leachate without covers.
No leachate if moisture balanced; castings retain nutrients.
Minimal water demand; frass is lowleachate fertilizer.
Reduces leachate through controlled aerobic process.
Water separated from slurry as part of digestate dewatering.
No direct water savings, but improves soil moisture retention.
Neutral; however, positive when compost reused on land.
Neutral positive with correct C:N ratios.
Positive soil impact when compost applied locally.
Supports soil health with biologically active outputs.
Positive biodiversity if frass reused in soil.
Neutral to positive if biosolids land-applied.
Digestate improves soil if reused; must meet safety limits.
Supports biodiversity through soil enhancement and pollutant reduction.
$30K$500K depending on scale.
$20K-150K depending on site prep & blower size
~$20K-$100K depending on site prep and turning equipment.
$100 (home bin) to $50K+ (commercial beds).
$300-3,000 (home units), $30K-300K (farm scale).
~$50K$300K for institutional scale systems.
~$250K-$5M depending on size and CHP integration.
$500 (barrel kiln) to $500K+ (industrial pyrolysis).
Technologies and Associated Summaries
SUB-CRITERIA
Operational Costs:
Maintenance, staffing, and energy needs.
Return on Investment (ROI):
Payback period and potential profitability (e.g., selling surplus energy or compost).
Tipping Fees:
Revenues from processing waste for third parties (e.g. anaerobic digesters.)
Job Creation:
Employment opportunities in operation and maintenance.
Community Engagement:
Capacity for educational workshops or community initiatives.
Food Security:
Contributions to local food production.
Input-Output Balance:
Efficiency in converting inputs (e.g. waste, water) into usable outputs (e.g. energy nutrients).
Closed-Loop Potential:
Degree to which the system supports circular economy principles.
Zoning Compatibility:
Alignment with local land use and building codes.
HEAT RECOVERY TECHNOLOGIES (E.G., ECODRAIN)
Negligible; no moving parts or power required.
Payback in 25 years from energy savings.
URINE SOURCE SEPARATION (USS) COMPOSTING TOILETS MEMBRANE BIOREACTORCATATONIC BIOBASED FLOCCULANT ALGAE PHOTO-BIOREACTOR INDIVIDUAL COMPOST BINS
Low ongoing costs
Low operating costs; occasional bulking agents and emptying.
ROI through avoided fertilizer use or community compost programs.
ROI in off-grid or waterscarce areas within 5-10 years.
No tipping fees; energy value is retained internally. No tipping fees; nutrients used locally. No tipping fees; material reused onsite.
~$0.20-0.40 per m³; includes membrane maintenance.
Minimal operational requirements; aligns with existing flocculation processes.
ROI over 10-20 years through water savings.
Improved sludge dewatering and reduced polymer costs contribute to ROI.
Requires moderate operations management: harvesting, light management, and occasional biofilm cleaning.
Potential ROI through biomass valorization (e.g., fertilizer, bioplastics, biofuels).
Minimal O&M costs; labor-based.
No tipping fees; reuse is internal.
Low employment impact; one-time installation labor.
Moderate jobs in maintenance or collection systems.
Can create jobs in collection and compost processing.
Low to moderate employment (installation, maintenance).
Low user interaction; largely passive technology.
Potentially high engagement if used in community nutrient cycles.
High community visibility; often linked to education.
Invisible to users; low engagement unless showcased.
Can be integrated into systems charging for sludge hauling or improved effluent quality.
Emerging markets may support tipping fees for combined water treatment and algae harvesting.
Limited direct job creation but aligns with green procurement supply chains.
Generates jobs in biotech, water treatment, and system monitoring.
Low visibility to the public; more relevant for utility or industrial users.
Visually engaging systems can be incorporated into educational and architectural features.
Long-term compost value; ROI via soil productivity.
No tipping fees; managed at household level.
Limited job creation (DIY/ educational roles).
Strong engagement potential (community composting).
No direct food link.
Can produce fertilizer for home gardens or urban farms.
Produces compost for non-edible landscape use.
Water reused for toilets, irrigation, laundry.
Indirectly supports food security by improving water reuse for irrigation.
Supports sustainable food and fertilizer production; potential for animal feed supplements.
Indirect via home food production support.
No material output; purely energy recovery.
High recovery of N, P, K as solid or liquid fertilizer.
Outputs stabilized humuslike material.
Effluent is very high quality; pathogenand odor-free.
High performance with low doses; enhances sludge quality for biosolids reuse.
High-quality biomass output with commercial and agricultural applications.
High conversion of waste to usable compost.
Supports household energy circularity.
Strong closed-loop nutrient recovery.
High circularity; local reuse possible.
Moderate circularity; depends on reuse integration.
Supports circular economy if derived from agricultural or food waste.
High circularity through nutrient recovery, CO‚‚ sequestration, and biomass reuse.
Strong closedloop model at household scale.
Residential zoning compatible.
Zoning compatibility varies; depends on local biosolids rules.
Generally allowed in rural or ecozoned areas; special permitting required but allowed for use in BC.
Compatible with most residential codes.
Compatible with industrial and municipal zoning; no spatial footprint.
Generally compatible with commercial, educational, or agricultural zoning.
Compatible with residential zoning.
IN-VESSEL COMPOSTING SYSTEMS AERATED STATIC PILES (ASP)
Labor, energy, maintenance (~$30-80/ton).
labor, electricity, monitoring (~$25-60/ton).
ROI via avoided landfill fees + compost sales.
ROI via compost sale and landfill diversion
WINDROW COMPOSTING
$15-40/ton for labor, fuel, and oversight.
Good ROI via compost sales, grants, or tipping fees.
Can charge tipping fees ($40-80/ ton typical).
Tipping fees ($30-70/ton) help cost recovery.
Tipping fees $25-60/ton common for green or food waste.
Moderate job creation (tech ops, hauling, outreach).
Moderate job creation (sorting, ops, sales).
Moderate job creation (tractor operation, QA, hauling).
Can integrate education (e.g., school food waste loops).
Can host training or community collection days.
Suitable for school farms or municipal engagement.
VERMICOMPOSTING BLACK SOLDIER FLY (BSF) COMPOSTING AEROBIC DIGESTERS
Feedstock prep, worm care, harvest labor.
Labor to feed, harvest, separate larvae.
Electricity and labor ($20-50/ton).
DIGESTERS BIOCHAR PRODUCTION SYSTEMS
Skilled labor, heat, gas processing (~$40-90/ton).
Feedstock prep, labor, and equipment maintenance.
ROI through castings and worm sales; educational value.
No tipping fees unless part of larger food recovery program.
Creates niche jobs in soil product sales and outreach.
ROI via larvae (animal feed) and frass (fertilizer).
ROI via tipping fees and biosolids reuse.
ROI through biogas sales, tipping fees, and RECs.
ROI from biochar sales, carbon credits, and avoided disposal.
Growing use in fee-for-service food waste diversion.
Common tipping fees ~$30-70/ ton for sludge or food waste.
Tipping fees $50100/ton common for food or biosolids. No tipping fees
Supports new employment in insect ag and waste sector.
Moderate employment in ops, maintenance, hauling.
Creates skilled jobs in ops, gas handling, engineering.
Creates jobs in production, agronomy, carbon tracking.
Strong community learning tool (schools, co-ops).
High interest for school demos and circular economy ed.
Low visibility unless tied to public utility tours.
Community engagement possible through district energy.
Community kilns or school projects foster engagement.
Compost supports urban/rural food systems.
Supports local farms and gardens with compost.
Compost supports field and orchard systems.
Castings enhance food crops and seedling starts.
Larvae can supplement chicken/fish feed; frass fertilizes.
Enhances soil if biosolids are used locally.
Digestate can fertilize crops or be refined to pellets.
Improves yields when used in food production soils.
Stable, nutrientrich compost.
Mature compost; meets regulatory stability levels.
Produces mature compost with proper curing.
Very highquality organic fertilizer output.
High-value protein + nutrient-rich frass.
Produces stabIlized solids; minimal volume reduction.
Biogas + digestate = dual outputs with market value.
Solid output with high surface area and cation exchange capacity.
High circularity when paired with local land application.
Requires zoning approval in urban cores.
Good circularity with local reuse.
Moderate circularity depending on reuse logistics.
Excellent circularity with on-site reuse.
Strong closed-loop for protein + soil inputs.
Moderate circularity when solids reused on land.
High circularity in nutrient energy recovery.
Excellent closed-loop when paired with local organics streams.
Needs agricultural/ industrial zoning.
Requires open land and appropriate buffers.
Indoor/greenhouse compatible; minimal zoning barriers.
Zoning still emerging; ag/industrial sites preferred.
Permitted in utility, rural, or mixed zones.
Zoning complex; usually industrial or agricultural.
Compatible with ag, forestry, and industrial zoning.
SUB-CRITERIA HEAT RECOVERY TECHNOLOGIES (E.G., ECODRAIN)
Permitting Requirements:
Ease or challenges in obtaining necessary approvals.
Environmental Standards:
Adherence to waste disposal and energy production regulations.
Reliability:
Consistency of system performance under varied conditions.
Flexibility:
Ability to handle fluctuations in input volume or type (e.g., mixed waste streams).
Output Quality:
Usability and market value of outputs (e.g., biogas purity, nutrientrich compost).
Space Efficiency:
Land and building area required for installation.
Time Horizon:
Expected operational lifespan and longterm performance.
No permitting needed in most areas.
URINE SOURCE SEPARATION (USS) COMPOSTING TOILETS MEMBRANE BIOREACTOR -
May require approvals for fertilizer distribution.
Permits needed for some types; governed by health regs.
Permit required; meets water reuse and health standards.
BIOBASED FLOCCULANT
Minimal permitting needed; treated as a chemical additive.
No water effluent; meets building safety codes. Not standardized; varies by jurisdiction.
Complies with pathogen control and handling standards.
Complies with NSF/ANSI 350 performance.
Meets regulatory requirements for effluent quality and biosolids safety.
Highly reliable; no moving parts.
Handles variable flow rates.
Stable if well maintained; odor and handling are concerns.
Reliable with proper maintenance and correct C:N ratio.
Handles daily household use; limited surge tolerance.
Handles typical household use; needs emptying management.
No output quality (not applicable).
High-value fertilizer output.
Output quality varies; best used for landscaping.
Very reliable with regular service.
Reliable performance under stable dosing; sensitive to pH and coagulant pairing.
Handles fluctuations in greywater flow well.
Moderate flexibility with varying influents; may require jar testing.
Permitting varies; effluent reuse and biomass enduse may require regulatory oversight. No permit needed for backyard use.
Can meet effluent standards for nutrients and pathogens with proper configuration.
Highly reliable under stable environmental conditions; sensitive to temperature and light shifts.
Environmentally safe if feedstock is clean.
Highly reliable with basic management.
Medium flexibility; sensitive to contamination and light/ nutrient imbalances. Handles moderate input variation.
High-quality non-potable water output.
Improves solids removal and sludge dewatering; minimal residuals.
Biomass quality varies with species and process control; high protein and nutrient content possible.
Compost quality varies with skill/feedstock.
Compact installed in wall or under shower.
Tanks may require exterior or underhouse storage.
Footprint varies: small (portable) to large (vault systems).
Compact; units fit in utility rooms or exterior tanks.
No additional space required; inline with existing treatment systems.
Footprint varies; vertical or stacked designs improve space efficiency. Requires small yard or community plot.
Durable lifespan ~20+ years.
Supplier Base: Availability of technology vendors. Widely available through plumbing retailers (EcoDrain)
Market Demand: For outputs like biogas, compost, or reclaimed water.
Stakeholder Buy-
In: Willingness of local communities and businesses to participate.
Growing interest in net-zero and energyefficient homes.
System durability ~10-15 years; containers replaced more often. 10-15 year lifespan with proper care.
System life ~15-20 years with membrane replacement.
Durable product shelf-life; processes persist as long as source feedstocks are available.
System durability 10-20 years; modular components can be replaced independently.
Durable bins last ~5-15 years.
Limited but emerging supplier ecosystem (e.g., Laufen Save!)
Broad supplier base globally.
Ovivo (Canada); BioMicrobics (US); Ecovie (US) ; Fluence (US)
Niche but growing in ecological design and farming circles.
High in off-grid, eco-home, and sustainable tourism sectors.
High demand in green building and waterscarce regions.
BioNova, ChitoVan, Green Science Alliance, Kemira (bio lines)
Demand is growing due to bans on synthetic polymers and interest in biobased options.
Vendors: Algenol, AlgEternal, Phycal, Clearas Water Recovery.
Mass-market availability (e.g., Envirocycle).
Growing interest in green infrastructure, wastewater reuse, and carbon markets.
Growing in suburban & urban agriculture.
High buy-in from green builders and renovators.
Mixed buy-in; higher acceptance in eco-communities.
Strong support among off-grid and zerowaste advocates.
Generally supported by builders and early adopters.
Strong institutional buy-in where sustainability goals are prioritized.
Positive stakeholder engagement when co-located with visible sustainability efforts.
Strong local buy-in, especially with education.
IN-VESSEL COMPOSTING SYSTEMS AERATED STATIC PILES (ASP) WINDROW COMPOSTING VERMICOMPOSTING BLACK SOLDIER FLY (BSF) COMPOSTING
Permit needed for commercial organics handling.
Permit required for large-scale operation.
Permitting needed for waste management and land use.
No permit needed for small systems; varies for commercial.
Permit needed in some regions for feed/ fertilizer sales.
DIGESTERS
DIGESTERS
PRODUCTION SYSTEMS
Permits required for biosolids reuse or disposal.
Permits for air, water, and digestate reuse.
Permits needed for air emissions; varies by scale.
Complies with composting regs (e.g., US EPA Part 503).
Complies with regional compost standards.
Meets basic compost quality regulations.
Meets organic certification and compost quality norms.
Complies with animal feed and compost regs (where allowed).
Meets Class B/ EQ biosolids or similar standards.
Complies with Waste Reduction Model and air emission rules.
Complies with IBI/EBC biochar standards and clean air rules.
Reliable under consistent feedstock and staffing.
Reliable with trained staff and airflow monitoring.
Reliable with routine turning and moisture control.
Reliable if moisture/ temp managed and predators excluded.
Reliable in warm climates or controlled rooms.
Reliable under stable feed and temperature.
Reliable with tech oversight and steady input.
Highly reliable with stable feedstock and trained ops.
Handles batch variation well with sensors/control.
Flexible with seasonal waste input.
Tolerant of seasonal and feedstock variation.
Handles steady feedstock; dislikes acidic or oily inputs.
Tolerant of feed variability; resilient microbes.
Tolerant of some variability; sensitive to toxic inputs.
Sensitive to pH and feed shifts; requires monitoring.
Flexible input (wood, husks, shells); output consistent.
Very high output quality (odor/ pathogen control).
Compost meets agronomic and horticultural quality.
Output varies; windrows may need post-screening.
Output is fine, rich, and highly marketable.
Consistent frass output; larvae need post-harvest drying.
Stabilized solids with moderate fertilizer value.
High-quality methane; digestate needs curing.
Biochar is highquality, storable, and long-lasting.
Compact; units fit in shipping containers/buildings.
Requires pad space; lower footprint than windrow.
Large footprint; not suited to dense urban areas.
Compact; fits indoors or in modular beds.
Compact relative to feedstock mass; stackable designs.
Moderate footprint; can be containerized.
Large footprint or centralized location needed.
Compact (TLUDs) to moderate (batch kilns, retorts).
Lifespan ~10-20 yrs with proper care.
System life 10-15 years (blowers, pads, site).
Site life 10-20 years with proper maintenance.
System life 10+ years with bin or bed maintenance.
System life ~7-15 years depending on housing, bins. 10-20 year lifespan with tank and aerator upkeep.
20-30 year system life with tank, CHP maintenance.
Durability 10-30 years depending on unit type.
Vendors: Green Mountain Tech, HotRot, BioCoTech.
Providers: O2Compost, engineered site builders.
Windrow turner suppliers, farmbased systems (e.g., Midwest BioSystems).
Uncle Jim's Worm Farm, TerraCycle, Worm Power.
Companies: Agriprotein, Enterra, Livin Farms.
Vendors: BCR, Ecoremedy, municipal solutions.
Vendors: DVO Inc., CH4 Biogas, PlanET Biogas.
Suppliers: PYREG, Kon-Tiki, Bioforcetech, AllPower Labs.
Strong demand from green campuses, hotels, cities.
Strong for community-scale infrastructure.
Common in regional compost operations and farms.
Growing in organic farming and schools.
Expanding rapidly in food and feed tech sectors.
Used in schools, correctional facilities, eco-communities.
Widespread in EU, US farms, and food industry.
Rising demand in regenerative ag, carbon removal markets.
Municipal & institutional support common. Generally positive public/ stakeholder view.
Supported by ag and waste management sectors.
Well received by gardeners, permaculturists, educators.
Interest from agriculture, aquaculture, zerowaste cities.
Accepted where biosolids reuse is allowed.
Policy-driven adoption; high utility & ag support.
Strong interest from farmers, foresters, climate advocates.
Quanto Tech Solutions Ltd.
Architect: Perkins&Will Developer: Confidential Farm Operators: Quanto Tech Solutions Ltd.
Location: Vancouver, BC Climate Dependence: CEA Scale: 40m ² , 16 Grow Banks Growing Locations: Below Grade Growing Strategy: Vertical Farming (Modular Systems) Growing System: Hydoponic Primary Crops: Leafy Greens, Herbs, and Modular Farming Systems Policy: Varies
Quanto Tech Solutions Ltd., headquartered in Vancouver, Canada, operates under the Northern Greens brand, addressing the challenges of urban agriculture through modular and scalable vertical farming systems that produce fresh, locally grown produce year-round.
The company’s hub-and-spoke model supports both largescale commercial operations and smaller, communityintegrated systems.
Quanto Tech’s hub farms are central production facilities that serve major buyers, such as the University of British Columbia (UBC), while spoke farms are integrated into residential and office buildings to meet local demand.
Project Overview
Quanto Tech’s vertical farm model is designed to minimize resource consumption while maximizing crop yields. Utilizing hydroponic systems and energy-efficient LED lighting, the company’s technology is adaptable to diverse urban settings.
The company’s highly standardized production model ensures consistent quality and reliability. The entire process is automated through the Q-Controller system, which manages climate conditions, nutrient delivery, and humidity levels.
Building Operations
nj Advanced Climate Control: Automated temperature and humidity regulation using the Q-Controller.
nj Water Recycling Systems: Minimized water loss through recirculation and filtration.
nj Resource Efficiency: LED lighting systems with optimized energy output reduce overall power demands.
nj Automated Monitoring: Sensors track pH, electrical conductivity (EC), and nutrient levels to maintain optimal growth conditions.
Figure 83: Location of Quanto Tech urban farm, Mount Pleasant, Vancouver, BC.
“Vertical farming is going to become essential in the coming years as climate change continues to impact traditional agriculture and the global population increases. By using our proprietary grow recipes, high level of automation, and grower focused engineering, we can maximize the productivity of our farms while minimizing the impact on the buildings that house them. Being able to not only adapt our recipes to optimize the growth and morphology of a variety of crops but also use historical electric data of buildings to manage electrical load and photoperiod, enables us access to ample underutilized space to meet the demands of the communities we serve.
The more we can integrate urban agriculture with buildings the more we can reduce our CO2e footprint while ensuring consistent access to fresh, high-quality produce.”

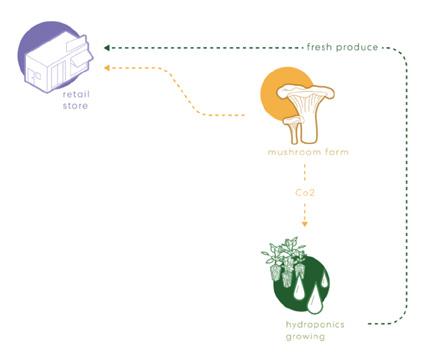
Alycia van der Gracht | Quanto Tech Founder and CEO
Figure 84: Quanto Tech system diagram illustrating the symbiosis between the vertical farm and the mushroom chambers.
Waste-to-Resource Cycles
CO₂ Utilization from Adjacent Mushroom Chambers
Quanto Tech capitalizes on CO₂ emissions from adjacent mushroom chambers to enhance crop productivity in its VF systems. By utilizing carbon capture and reuse technologies, this approach reduces operational carbon emissions and improves crop yield.
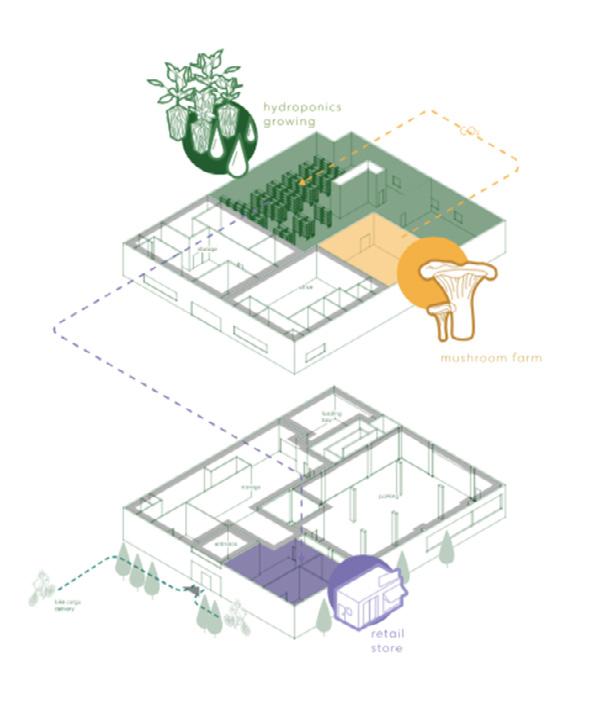
Figure 85: Quanto Tech system diagram illustrating the symbiosis between the vertical farm and the mushroom chambers.
Resource Recovery Exchange Nodes
Quanto Tech’s closed-loop system demonstrates a practical approach to integrating resource recovery within an urban farming context. By strategically placing VF systems next to mushroom cultivation chambers, the company captures and utilizes CO₂, creating synergistic efficiencies between diverse agricultural processes.
By aligning sustainability goals with economic models, Quanto Tech fosters resilient urban agriculture systems that support local food production, energy conservation, and resource recovery. This holistic approach highlights the potential for sustainable urban integration, making it a model for future developments.
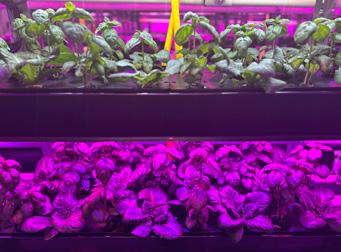
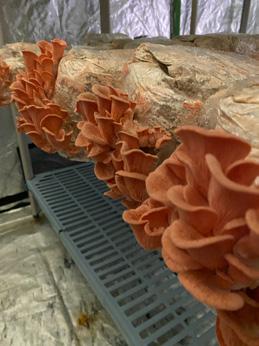
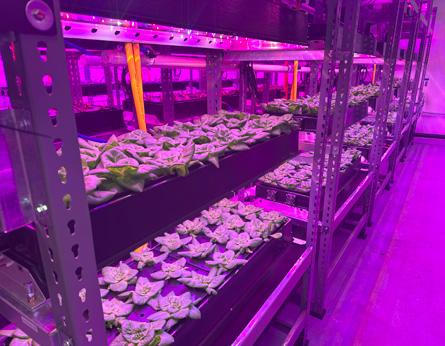
Figure 87: Quanto Tech vertical farm and mushroom chambers during active grow cycle.
Figure 86: Quanto Tech vertical farm chamber with active grow lights.
Industrial Typology: Bubbly Dynamics
Operator: Bubbly Dynamics LLC
Location: Chicago, Il
Climate Dependence: CEA
Scale: 93,500 ft ²
Primary Function: Incubation of food businesses, demonstration of circular economy, research and education on sustainable systems.
The Plant, a project of Bubbly Dynamics in Chicago, is an innovative redevelopment showcasing circular economy principles. Housed in a 93,500 ft² former meatpacking facility, the project has transformed a historically industrial building into a thriving circular hub, hosting a diverse community of entrepreneurs and food-based businesses.
The Plant is a living laboratory for waste-to-resource strategies, circular food systems, and community-based urban agriculture. By reimagining waste as a valuable resource, it fosters closed-loop systems that minimize environmental impact while maximizing productivity and economic opportunity.
Project Overview
Located in Chicago’s historic Back of the Yards neighborhood, The Plant serves as a dynamic food business incubator, offering affordable space for small-scale producers while also cultivating urban agriculture.
This multi-tenant facility hosts a wide range of enterprises, including:
nj Breweries
nj Kombucha Production
nj Outdoor and indoor farms utilizing hydroponics, aeroponics, and other growing techniques
nj Food Production Kitchens
nj Educational Spaces and Research Labs
The Plant’s design and operational ethos are rooted in industrial symbiosis, where the waste output of one process becomes the input for another. This creates a resourceefficient ecosystem that benefits both the community and the environment.
Building Operations
The facility integrates renewable energy systems, closedloop material cycles, and innovative urban farming techniques to minimize its environmental impact and promote local economic growth.
Figure 88: Location of Bubbly dynamics HQ, Chicago, IL.
Key Resource Streams at Bubbly Dynamics
Energy Waste
nj Electricity Usage: Grow lights, irrigation systems, climate control, and office equipment.
nj Heating and Cooling: HVAC systems for maintaining optimal conditions.
nj Energy Consumption Baseline: Approx. 800,000 kWh per year (600 kWh/m²/year), with a 35% heat recovery potential through integrated systems.
nj Waste Heat: Captured from brewing and production processes.
nj CO₂ Capture: In addition to exhaust from occupants, Carbon dioxide produced during the brewing and fermentation processes can be captured and redirected to enhance plant growth in indoor farming systems.
Wastewater
nj Irrigation Runoff: Excess water from urban farms.
nj Cooling and Condensation: Moisture generated from HVAC and brewing processes.
nj Rainwater Capture: Stored for reuse in agricultural activities. 10,000-gallon storage capacity from 20,000 sq. ft. of roof area.
nj Greywater: Generated from food processing and cleaning activities. Approx. 5,000 gallons per week.
nj Black Water: Generated from bathrooms and kitchens, estimated at 2,000 gallons per week.
Food Waste
nj Composting Capacity: Up to 32 tons per day processed through the anaerobic digester at full build out.
nj The digester is not currently operational; food waste and spent grains are composted
nj Brewery By-Products: Spent grains and yeast waste are redirected for composting or use as animal feed.
nj Organic Waste Recovery Rate: 95%, with the majority of waste being diverted to compost or animal feed.
Material Waste
nj Organic Waste: Food scraps, brewery by-products, and compostable materials.
nj Packaging Waste: Paper, plastic, and aluminum from food and beverage production.
nj Grow Media and Fertilizer Residues From soil-based and hydroponic systems.
Carbon Emissions Reduction Calculation
nj Operational Carbon: Emissions from HVAC, brewing, and indoor farming, 24% via energy recovery and circular practices.
nj Embodied Carbon: Associated with retrofitting the building and installing new systems, 30% post-retrofit.
‒ Estimated Operational Carbon Emissions: 300 metric tons CO₂ per year.
‒ Embodied Carbon from Retrofitting: ~150 metric tons CO₂.
‒ Detailed information on the Plant’s current recycling processes, stormwater capture and reuse is included on their resources page
Resource Recovery Exchange Nodes
The Plant’s commitment to industrial ecology not only minimizes waste but also fosters collaboration between tenants, each benefiting from the resource flows generated by others. For instance:
nj Breweries provide spent grain for composting or livestock feed.
nj Food businesses supply organic waste for anaerobic digestion.
nj Waste heat from fermentation processes helps regulate the climate in vertical farms.
By leveraging symbiotic relationships between various enterprises, The Plant maximizes productivity while minimizing resource consumption, creating a vibrant ecosystem where waste becomes an asset.
Figure 89: Bubbly Dynamics systems diagram showing synergies between integrated industries.
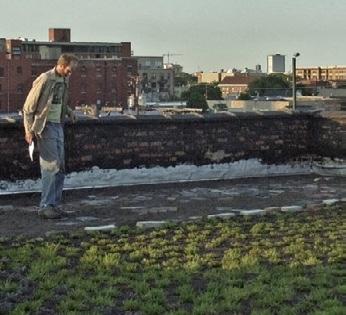


Figure 90: Interior and exterior views of Bubbly Dynamics showcasing grow cycles and co-located industries.
Figure 91: Bubbly Dynamics systems diagram, Chicago, IL.
Food for Thought
A detailed analysis of the operational mechanics of Building Integrated Agriculture (BIA) systems (and their environmental and resource impacts) provides critical data for guiding system design and the selection of appropriate technologies. BIA is highly diverse in both form and function, as are the buildings that host them, each offering unique waste-to-resource opportunities.
In this analysis, the research team examined life cycle metrics across a range of BIA configurations, comparing resource inputs, yields, and environmental trade-offs. The study also evaluated technologies for waste recovery in relation to different building typologies and operational contexts. Key insights from this work are summarized below:
Balancing Yields and Resource Use
Environmental performance and food yields often exist in tension across vertical farms, greenhouse systems, and soil-based urban farming. High-yield systems tend to demand more energy, water, and infrastructure to function optimally. As such, early consultation with project operators, designers, and engineers is essential to define projectspecific goals – whether prioritizing yield, resource efficiency, or environmental impact. In many cases, trade-offs are necessary; lower yields may be acceptable if they align with other priorities, such as reduced energy consumption or lower water use.
Hybridized Systems and Resource Recovery
BIA systems and waste-to-resource technologies can be combined in modular, hybridized designs that maximize flexibility and efficiency. For example, greenhouse and vertical farming technologies can be integrated to accommodate seasonal variability or functional zoning within a single building. Co-locating systems for wastewater treatment, composting, or organic waste valorization further enhances resource recovery potential. These synergies open up new possibilities for circular urban infrastructure.
Place-Based System Design
The performance and feasibility of BIA operations are highly place-dependent. Energy and water costs, local building/zoning codes, climate conditions, and access to waste streams all influence system design. Waste recovery potential is also shaped by building size, layout, and the nature of surrounding infrastructure. Therefore, robust, place-based assessments are crucial for optimizing both the environmental and economic performance of BIA systems, ensuring they are tailored to local conditions and opportunities.
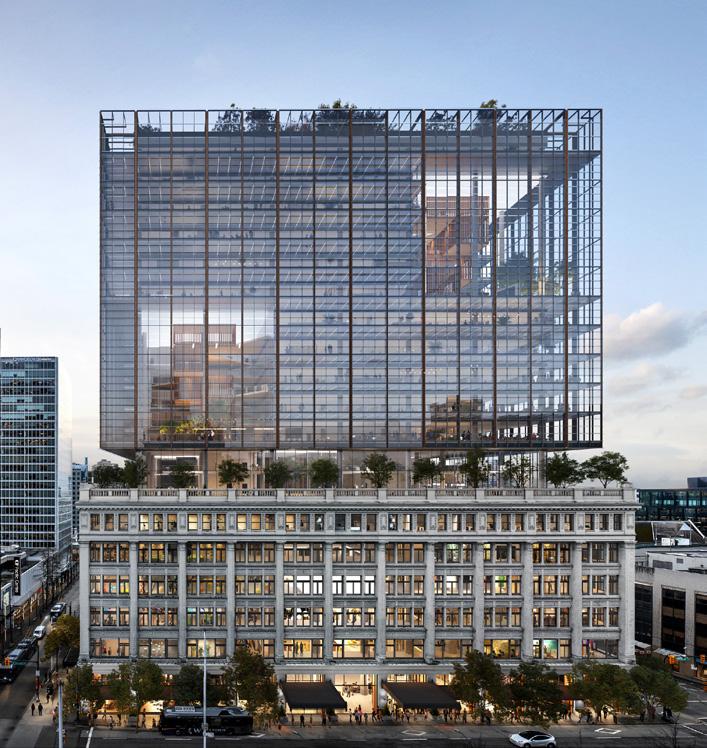
Figure 92: Perkins&Will, Hudson’s Bay Company, Vancouver, BC. Proposed design featuring three integrated food assets responding to CoV’s Sustainable Large Development Policy.
Scale for Resource Recovery
One of the central findings is that business-to-business resource recovery must be evaluated and implemented across multiple spatial scales with clearly defined boundaries. At the building level, BIA systems can be embedded directly within existing commercial or institutional operations. At the neighborhood or district level, co-locating compatible businesses can unlock greater resource-sharing potential, as demonstrated in successful models such as The Plant in Chicago or Food Tech Valley in the UAE. Across all scales, place-based planning, spatial mapping, and value chain analysis are essential for identifying synergies, assessing system efficiencies, and prioritizing where economies of scale can enhance resource recovery.
Retrofit vs Intentional Design
The study also distinguishes between retrofitted and new construction designed with BIA strategies. New developments offer greater flexibility for system integration, allowing resource recovery and farm operations to be designed holistically around site constraints and goals. Retrofitting existing buildings presents more significant challenges, especially when it comes to infrastructureheavy systems such as blackwater treatment, but it remains possible with careful planning. In both contexts, hybridizing BIA systems emerges as a promising strategy to balance environmental trade-offs. Rather than treating vertical farms, greenhouses, and aquaponics systems as isolated, integrating their strengths into hybrid configurations can improve energy and water efficiency, reduce embodied carbon, and support circularity. Recent studies have begun to demonstrate how combining systems, such as pairing hydroponics with compost-based nutrient cycling (Chowdhury & Asiabanpour, 2024) or using passive solar greenhouses to offset energy demands can improve performance (Forchino, et al., 2017). Future research should further model and implement these hybrid systems to inform policy and design practice.
Robust Data Collection
Robust data collection is another critical enabler of effective BIA implementation. While vertical farming systems often incorporate automation and sensors, data gaps persist across farm types, particularly in environmental, social, and economic performance metrics. Standardized and transparent monitoring frameworks are necessary to track impacts, assess trade-offs, and inform decisionmaking throughout the sector. Specific areas requiring more attention include pre- and post-treatment metrics for waste-to-resource technologies, life cycle data from post-farmgate stages, and more holistic measures of yield that reflect nutritional content, not just crop mass. Greater interoperability of data between farms, technologies, and building systems is essential to achieving replicable, evidence-based BIA integration.
Trade-offs in Resource Recovery Efforts
Importantly, every resource recovery strategy involves tradeoffs between cost, efficiency, social acceptability, and cobenefits. Some technologies, such as composting systems, are more accessible and socially embraced but offer limited economic returns. Others, such as photobioreactors or insect-based waste systems, offer valuable environmental benefits or circular protein streams but may be more expensive or face challenges in terms of public perception. The value of these systems must be considered not only in terms of technical efficiency but also through the lens of stakeholder engagement, education potential, and alignment with community values.
Having explored the technical backbone of BIA, from life cycle assessments to resource exchange systems, we now shift our focus from systems to people. Technical feasibility alone does not guarantee success; it must be embedded within the lived experience of communities, neighborhoods, and individuals.
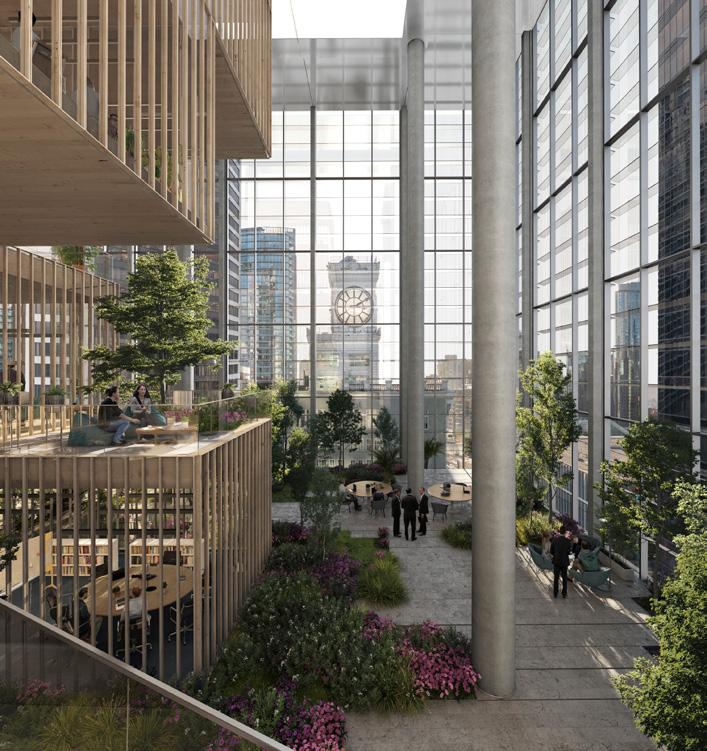
Figure 93: Perkins&Will, Hudson’s Bay Company, Vancouver, BC. Proposed design illustrating lush interior green spaces.

Part VI:
Design Implementation and Human Experience
Living Systems
Positioning: The Shift to Living Systems
Climate pressures, resource scarcity, and urban population growth demand a rethinking of urban resilience, cities must transform into living systems—adaptive, self-sustaining ecologies where buildings play an active role in producing food, capturing water, and closing resource loops.
At the heart of this transformation lies Building-Integrated Agriculture (BIA), a framework that redefines urban structures as food-producing ecologies. Concepts of modularity, customizability, place-based adaptation, and plug-and-play agricultural systems in buildings afford unique opportunities, moving cities beyond traditional food supply chains to localized, decentralized production models that reduce environmental impact while increasing food security. These systems are designed for adaptability, ensuring that urban farms evolve in response to changing climatic, technological, and social needs.
Modular design is an emerging paradigm in urban agriculture, providing solutions that encompass adaptability, efficiency and resilience. Similarly, in the context of Building Integrated Agriculture (BIA), modularity provides the basis for integration of food production systems within urban infrastructure maximizing efficiency with sustainability. Yet, the success of the modular design depends on the basic architecture directing its implementation.
The Report identifies five primary frameworks that influence the performance of modular urban farms
nj Centralized vs. Decentralized Networks
nj Scale and Scope (Micro vs. Macro)
nj Resilience & Redundancy
nj Temporal Design (Static vs. Dynamic)
nj Urban Context (Vertical vs. Horizontal)
By designing with these modular frameworks in mind, urban farms can be tailored to the unique environmental, spatial, and social conditions of each city, ensuring long-term adaptability and efficiency
Why Modular Design?
As we face an increasing demand for food production in our urban environments, we must consider redefining architectural hybrids that introduce food production within our cityscapes in new and innovative ways that maximize space, resources, and productivity.
The modular design, in its very nature, fits in with these goals, bringing scalability, adaptability and resourceefficiency. The ability to tailor agriculture systems, like irrigation, lighting and climate control means urban farms can be adapted to fit virtually any architecture and environmental changes.
Additionally, modular systems promote sustainability by facilitating the reuse, repair and reconfiguration of components. This elasticity improves resource efficiency, meaning less waste and a smaller environmental footprint for food production systems. From hydroponic units on building rooftops to modular green walls in courtyards, the versatility of modular agriculture is critical for addressing food insecurity in urban settings.
While modular design most certainly has its benefits, it also has its share of challenges. Issues such as infrastructure dependencies, operational complexity, and economic feasibility vary depending on the modular framework applied. Understanding these challenges through structured frameworks is essential for optimizing system performance and ensuring long-term viability.
How Can Modular Design Improve Urban Farming?
Modular frameworks are principles by which components are designed, assembled and adapted to varying conditions. These frameworks provide flexibility, efficiency and scalability in the system development process to ensure that each module is capable of operating independently and as part of a larger, integrated system. There are several modular typologies identified, each having their advantages and disadvantages, which in turn determines how modules relate and develop within the system.
Component sharing modularity is based on a common core structure that is used in multiple variations of a system. This approach minimizes production costs and simplifies maintenance, because shared components eliminate redundancy and promote standardization. In urban agriculture, this modularity ensures that all growing units depend on the same basic structure of environmental control, nutrient distribution, and irrigation. The primary drawback, however, is a lack of specialization; while it optimizes efficiency, it may not enable highly customized solutions for specific requirements.
Component swapping modularity builds on adaptability by enabling the components to be replaced within the given framework. This makes it possible to change the configuration of modules according to the needs of different plant development phases, for example, by using different lighting systems. The major benefit is that systems can be tailored and upgraded without having to develop new frameworks. However, due to the complexity of managing parts that can be replaced, it is possible that the cost of the product will be higher and there may be problems with the effectiveness of the system integration if the design is not proper.
Fabricate-to-fit modularity offers high level of customization by having components being permanently altered to fit certain conditions. In agriculture, this could mean fitting irrigation modules for different levels of humidity or changing the nutrient delivery systems for different types of crops. The greatest advantage is the precision and optimization since each module can be designed to work at its peak effectiveness. However, since these modifications are permanent, there is no flexibility to reuse components if the conditions change.
Bus modularity is a networked approach where a single system provides power, water or data to several associated modules. This framework is most effectively applied to urban farms where simultaneous control of many subsystems such as climate and nutrients is required. Its greatest advantage is the control which allows for real time monitoring and control. However, there is a disadvantage of having a single point of failure; that is, if the core system fails, all other modules may be affected and require backup systems to be in place to avoid downtime.
Sectional modularity refers to the ability to separate systems into distinct units that can be combined in many ways to form the final system. This is because it allows separate units to be used independently in different configurations. This flexibility is most useful in urban farms where there are likely to be different conditions in different areas. It supports phased growth; systems can be added or reduced to meet requirements. However, it is important to ensure that there is a good integration between the modules because; incompatibilities may lead to some losses.
In addition, mix modularity integrates different modular strategies to achieve the maximum flexibility. It incorporates the best features of component sharing, swapping, and networked systems to achieve the right balance between flexibility, optimization, and growth. This approach is most effective in the waste management sector where different recycling and composting processes must coexist in the same system. On the other hand, due to its complexity it can be more expensive and require more maintenance, which should be done with an aim to avoid pitfalls.
The Modules: Building Blocks of BIA
Growing Module
This module helps in planting by offering the right conditions for growth, increasing the yield and helping in food production in limited space. It enhances sustainability through the optimal utilization of resources, decreasing the reliance on land, and incorporating new and innovative farming practices that enhance yield and climate tolerance.
Light Module
This module improves crop health and efficiency by ensuring proper and correct lighting. It solves the problems of lack of natural light in the urban environment and enables yearround farming with minimal energy loss due to the use of advanced lighting systems.
nj Leafy greens (e.g., lettuce, spinach, kale): Typically require 10-12 moles of light per day (DLI - Daily Light Integral), which translates to about 12-16 hours of artificial light if grown indoors or at least 4-6 hours of direct sunlight in an outdoor/greenhouse setting.
nj Fruiting crops (e.g., tomatoes, peppers, cucumbers): Need a higher DLI, around 20-30 moles per day, meaning 14-18 hours of artificial light or a minimum of 6-8 hours of direct sunlight.
nj Microgreens & herbs: Generally require lower light levels, around 8-10 moles per day, which can be achieved with 10-14 hours of artificial light or 4-5 hours of direct sunlight.
Nutrient Module
The nutrient module provides the right amount of nutrients at the right time, which leads to proper growth of the plant and avoids the overuse of nutrients. It also improves the quality of food, faster growth cycles, and sustainable agricultural practices with minimal environmental effects.
Irrigation/Water Module
This module assists in water usage reduction and ensures that plants get adequate water supply. It plays a role in water conservation strategies that include reuse and prevention of losses in order to enhance the resilience of agriculture in water scarce regions especially in the urban areas.
Climate Control Module
This module controls the temperature, humidity and air movement and thus helps to create a perfect growing environment for the plants. It increases the tolerance to climatic changes in the external environment and guarantees continuity of production with minimal or no intervention.
Energy Module
This module reduces the dependency on external power grid by incorporating renewable energy sources to decrease the operational costs and environmental effects. It sustains modular food production systems for decentralized and climate change resilient urban agriculture.
Waste Management Module
This module contributes to the recovery of organic waste in order to use it again, thus enhancing the concept of the circular economy. It also contributes to the prevention of environmental pollution by preventing the accumulation of waste, thereby contributing to sustainability and the rational use of resources in the food production system.
Storage/Distribution Module
This module ensures that the produce is properly handled, stored and transported to the market on time to avoid spoilage. It improves the supply chain by increasing reliability of the local food system, reduces greenhouse gas emissions and increases the availability of fresh food in the urban areas.
Monitoring/Control Module
This module incorporates data acquisition and control to achieve optimal farm management for enhanced performance and control. It reduces the role of humans in the process while at the same time helping in the correct utilization of resources to minimize wastage and maximize production.
Community Interaction Module
Enhancing social relations, this module has a focus on educational, participatory, and food security aspects of urban communities. It enhances the local participation and the knowledge of sustainable agriculture and thus the integration of farming in the urban area.

Integrated Solar Panel
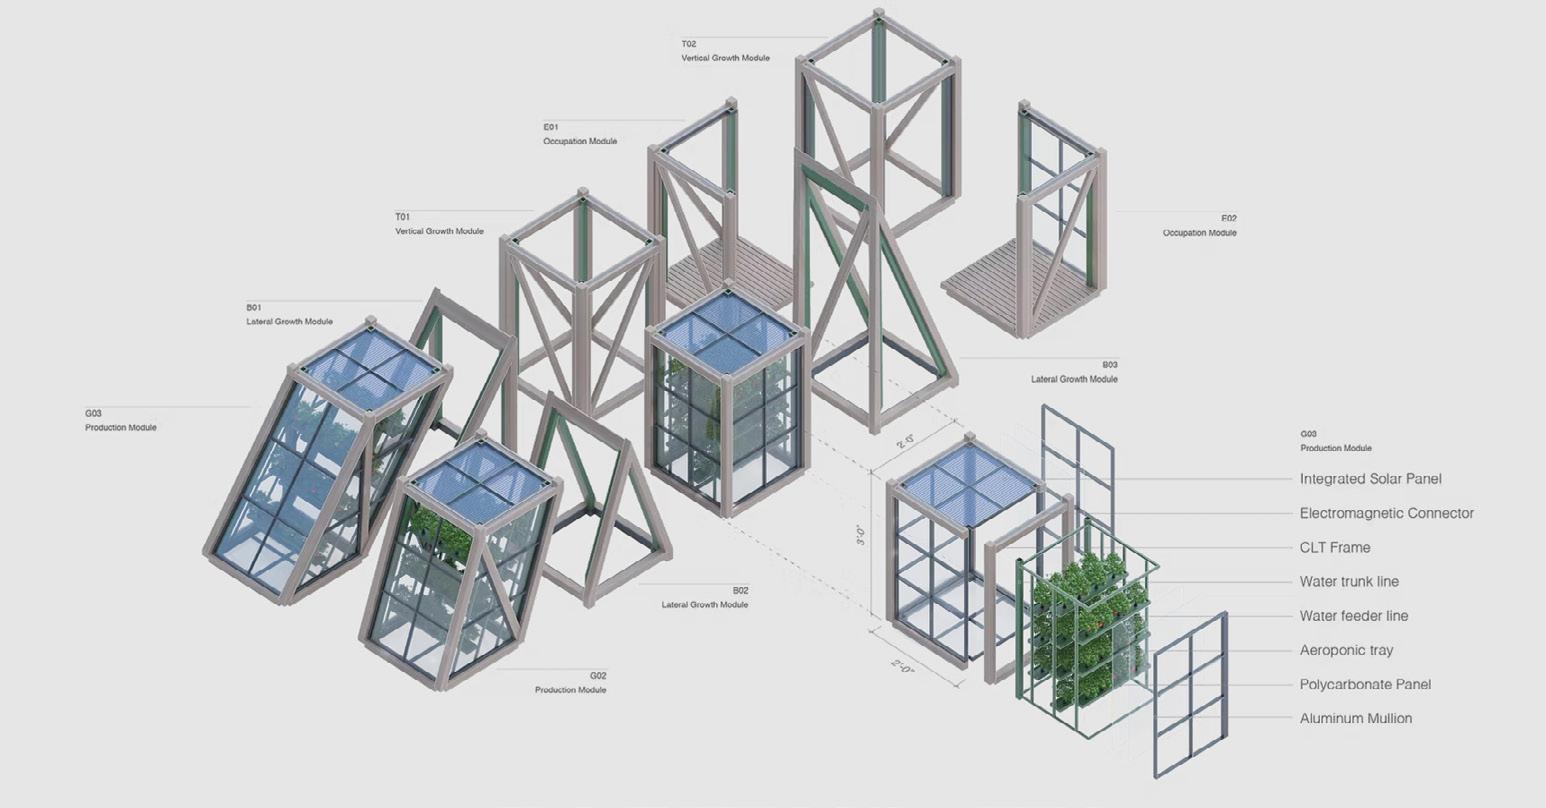
CLT Frame
Water Tank Line
Water Feeder
Aeroponic Tray
Polycarbonate Panel
Figure 95: Framlab Glasir design, Brooklyn, NY. Modular design approach for urban agriculture.
What Does Modularity Look Like in an Urban Context?
The efficiency, scalability, resilience and adaptability are mainly controlled by key frameworks that are used in defining modularity in urban agriculture. This is especially the case in dense cities where space is limited and modular systems must be developed to complement existing infrastructure. These systems should also be adaptable to accommodate future needs or technological advancements.
The modularity concept is applied differently depending on certain characteristics such as whether the system is centralized or decentralized, large or small, robust or simple, permanent or temporary and vertical or horizontal. These structural and operational factors explain how modular agricultural units are positioned within their surroundings, affect sustainability, and respond to the peculiarities of the urban environment.
These frameworks are crucial in the design of BIA systems, as they help to define the feasibility of various configurations. Each of the frameworks comes with its own set of tradeoffs that need to be made in order to achieve the optimal level of productivity, resilience, and economic feasibility. The following sections explain the five primary modular frameworks that determine the spatial, functional, and technological structure of urban agriculture.
Network - Centralized vs. Decentralized
Modular design can be done with a centralized or decentralized approach. Centralized systems are more efficient and clutter free because resources are pulled from a single source, while decentralized systems focus on failsafety and autonomy which are not susceptible to failures that occur with single points of failure.
Scale and Scope - Micro vs. Macro
Scale is a key contributor to the efficiency of modular systems. Micro-modular systems are intended for use at the point of consumption in limited spaces such as vertical gardens in apartments, balconies with hydroponics, while macro-modular systems are suitable for large format applications including commercial urban farms, rooftop greenhouses, or district scale agricultural complexes.
Resiliency - Resilient vs. Redundant
The degree of resistance or overbuilding determines the system’s robustness or robustness to failures. Resilient systems take advantage of technology to achieve flexibility while redundant systems have backup systems that can work independently in the event of a failure.
Temporal - Static vs. Dynamic
Modular systems can be classified as static where they are installed and used in a permanent manner or dynamic which allows movement and reorganisation. Dynamic systems are especially important for temporary urban farms, experimental agricultural layouts, and movable food production facilities.
Urban Context - Vertical vs. Horizontal
The spatial distribution of modular agriculture in cities is either vertical or horizontal. In order to optimize space and design principles in high rise buildings, vertical systems include multi-tiered hydroponics or facade integrated agriculture, while horizontal systems are more convenient in green roofs, urban courtyards, or community gardens.
Centralized vs. Decentralized: Control and Resource Distribution
A centralized modular system enhances the efficiency of the agricultural process by exercising control over essential functions such as irrigation, nutrient application, and climate control. This structure ensures even distribution of resources, which is particularly useful for large hydroponic farms or vertical farming where automation and close watch are critical to enhancing production. For instance, the growing module also benefits from centralized control of irrigation, lighting, and climate control, which leads to better farming conditions and higher yields. In the same way, the nutrient module works better in the centralized system because a single nutrient delivery system can supply several growing spaces with minimal losses and precise application. The lighting module also goes well with the centralization model because equally distributed light is beneficial for plant growth and reduces energy consumption. In addition, the centralized monitoring and control system provides realtime data analysis to help in the automation of adjustments to the environment throughout the system.
Nevertheless, centralization presents a vulnerability to failure since any problem in one part of the system can bring down the whole system. For instance, if the centralized irrigation module fails, all the connected growing units will not have enough water, resulting in poor performance of the entire system. Likewise, centralized energy modules are costly to install and maintain, and any failure in the power grid will affect the entire farm. Storage and distribution modules also present some problems with centralization since large storage systems require sophisticated management and are costly to maintain.
By contrast, a decentralized modular system improves the robustness and adaptability of the system by enabling the independent operation of modules. This model is most advantageous for farming patterns including distributed rooftop farms, community gardens, or small-scale home gardens, where modular control ensures that the disruption of a single module does not lead to the disruption of the entire system.
The irrigation module also benefits from decentralization, which allows each unit to connect to its own water source and delivery system, reducing dependency on a central pipe. Similarly, a decentralized energy module allows each unit to produce and store its own power, which improves reliability when the grid goes down. The waste management module is also more appropriate for decentralized system; for instance, on-site composting and management of organic waste within each growing enclosure can be done, rather than relying on a large central treatment facility.
However, due to the decentralized system, there may be increased redundancy and operating costs because each module needs its own infrastructure and management. For example, decentralized lighting modules may not be uniform, thereby resulting in poor use of resources in planting and therefore the harvest. In the same way, a decentralized climate control module implies that each unit has to condition its own temperature and humidity, which will inevitably increase energy consumption and make it harder to monitor the entire system.
In general, it can be stated that the optimal solution is often represented by the intermediate option, which implies that critical elements like climate control, nutrients, and monitoring are combined and located in the central part of the system, while irrigation, power, and waste management are decentralized to increase the robustness of the system. This way, the balanced system is productive and can easily be adjusted for risk mitigation while using resources effectively in the urban environment.
Implications for Modular Design
nj Centralized irrigation and lighting modules are efficient for large-scale operations but require robust infrastructure.
nj Decentralized growing modules enhance crop diversity and risk mitigation but require higher investment in redundancies.
nj Hybrid models, integrating centralized oversight with decentralized autonomy, can offer an optimal balance of efficiency and resilience.
Scale and Scope Framework:
Micro vs. Macro
The micro and macro framework addresses physical size, processing capacity, and technical efficiency of the system. Micro-Modular systems are developed for limited, localized agriculture such as residential hydroponic systems, balcony gardens, and small community farms. These systems provide flexibility because they enable users to control irrigation, climate, and lighting conditions according to the needs of the crop. Micro farms also address food problems by bringing production closer to consumers in cities. Nevertheless, they are not as resourceful as largescale farms because of the lack of economies of scale. Furthermore, small systems are more demanding in terms of resource usage, thus they are likely to use more energy and water to produce a single kilogram of food than large farms.
On the other hand, macro-modular systems are developed for commercial food production, large vertical farms and city farm clusters. They also minimize costs by integrating the infrastructure for water, lights and climate control across many growing areas to avoid wastage and increase production. These large-scale systems implement centralized automation to enhance the control of resources, energy and workforce. But macro farms are not as flexible to changing environments or market conditions, and they need a high initial capital to implement.
The choice of micro vs. macro scale impacts all the agricultural modules differently. Growing, irrigation and climate control modules can be best implemented at both the micro as well as the macro level but the design of the two will be different.
Macro-scale irrigation and climate control systems provide even environmental conditions, whereas micro-scale setups enable the user to manipulate the growing conditions freely. Both lighting and monitoring modules are most effective in the macro configuration, where the control of energy use and production periods can be done easily. On the other hand, the waste management and storage modules are most effective in the micro scale integration where local composting and decentralized food hubs decrease the costs of transportation and processing.
The hybrid approach combines both scales by incorporating macro-scale vertical farms for high yield and microscale urban agriculture in community gardens, rooftop gardens, and other small growing spaces. This guarantees the optimum use of large-scale farming while retaining the ability to respond to local conditions and ensure food security.
Implications for Modular Design
nj Micro-scale climate control modules improve efficiency for small-scale urban farms.
nj Macro-scale lighting modules provide uniform illumination across large indoor farms but require centralized energy management.
nj Scalability considerations should prioritize flexibility, ensuring that micro-modules can integrate into larger systems.
Temporal Framework: Static vs. Dynamic
The temporal framework of modular agriculture is defined as static systems that are located within a specific site and cannot be easily changed, and dynamic systems that allow for alteration and reconfiguration of the system at different points in time. Static systems are defined by their stability, high efficiency and long-term optimisation and are therefore advised for large-scale urban farms, rooftop greenhouses and permanent vertical farms. These modules are supposed to give a fixed and controlled culture room, which should result in the highest possible yield and utilization of resources. The major weakness of static systems, however, is their rigidity; once installed, they cannot be easily moved or altered and are therefore not well adapted to changing urban conditions or changing agricultural needs.
Conversely, dynamic modular systems are designed to address the transportability and adaptability that allows urban farms to modify their layout to fit shifting microclimates, practical farming, and temporary city uses. These systems are most useful in urban environments where space is limited and agriculture can be incorporated into previously underused areas, such as pop-up farms or mobile food production units. Less durable, however, are dynamic systems, which are usually constructed from lighter materials and require more frequent reconfiguration, which can raise the cost of maintenance and decrease long-term efficiency.
The modules are identified as supporting either static or dynamic structures based on their function and the degree of their integration. Growing and irrigation modules are best suited to static systems in which permanent soil or hydroponic infrastructure can be used to optimize plant growth and water use.
At the same time, the lighting and climate control modules can be more conveniently reconfigured to fit shifting crop arrangements or seasonal conditions with portable LED panels and modular HVAC units. Energy and waste management modules are best placed statically as permanent solar arrays and composting systems are more economical when incorporated into a fixed infrastructure. However, monitoring and community interaction modules work best in dynamic systems, which enable easy engagement with various urban spaces, pop-up educational initiatives, and mobile farm demonstrations. Therefore, the most suitable approach often involves the combination of the approaches wherein the essential structural components are maintained and the adjustable components are employed to fulfill the new needs. Thus, urban agriculture can be sustainable in the long run with the required degree of dynamism to address changes in spatial configuration, climate, and technology through the right balance between stability and flexibility.
Implications for Modular Design
nj Static growing modules in greenhouses provide stability but lack adaptability.
nj Dynamic lighting modules cater to changing agricultural layouts but require modular compatibility.
nj Hybrid static-dynamic models can optimize space use and crop yield.
Urban Context Framework: Vertical vs. Horizontal
The framework for modular agriculture within the urban context determines how space is used in dense cities and balances efficiency, accessibility, and integration with existing infrastructure. The systems are vertical and thus champion on space and yield by incorporating growing modules into building facades, multi-tier hydroponics and rooftop farms and so are most appropriate for high density areas with little or no horizontal space. These systems lead to higher density of production per meter square, which is crucial in cities where space is a scarce commodity. However, there are some issues with the vertical agriculture, such as the fact that it needs sophisticated irrigation, lighting, and climate control systems which raise the cost of installation and operating the system. Moreover, the maintenance may be more rigorous because workers need special tools to access the high levels for harvesting and repair.
Horizontal systems, however, are designed for ease of access and ease of maintenance and are therefore appropriate for use in ground level urban farms, green roofs, and open space community gardens. Through having food production at ground level or low profile designs, horizontal systems require less complicated irrigation and nutrient application than traditional farming methods, thus reducing the need for expensive and energy intensive automation and infrastructure. Also, it enhances engagement since many people can participate in farming activities and thus strengthen the local food systems. The major limitation of horizontal agriculture is that it needs a large amount of land, which is a problem in dense cities where land is scarce and costly. Furthermore, horizontal farms are more likely to be affected by climatic conditions and may require special protection from cold or unpredictable weather.
static dynamic
Some modules are better suited to one system than the other. Growing, irrigation and climate control modules are most appropriate for the vertical system where hydroponic or aeroponic tall structures realize full potential for resource utilization. Lighting modules are also more effective in the vertical placement as LED panels can be arranged to provide proper light for multiple levels of growth.
On the other hand, nutrient and energy modules are most effective in horizontal configuration, since gravity feed irrigation and decentralized solar power are less costly to operate. The horizontal configuration is more suitable for waste management and storage, such as composting, water collection and distribution of food within the context of community-based food systems.
An intermediate approach between the two extremes –vertical and horizontal – can be the optimal strategy to combine the advantages of both models for urban farming. While vertical growing modules are used to increase the yield in restricted spaces, the combination of horizontal storage, waste management and community interaction modules increases the usability, robustness and social value of the system.
centralized decentralized
Implications for Modular Design
nj Vertical irrigation and climate control modules enhance resource efficiency.
nj Horizontal growing modules support community-scale agriculture but require more land.
nj Blended approaches (e.g., tiered growing systems) optimize both benefits.
Figure 97: Modular system design strategies for urban farming components.
Conclusion
The function driven hybrid approach to modular urban agriculture runs each system at its best for the part it plays rather than for a centralized, decentralized, macro or micro approach. This guarantees that high efficiency features like lighting, climate control, irrigation and monitoring are made central and macro in order to take advantage of automation and the use of resources. At the same time, the robust and flexible aspects such as waste management, energy, distribution, storage and community participation are decentralized and made micro in order to improve redundancy and local participation. The static infrastructure provides the much-needed stability while the dynamic components provide for the adaptability so that the farms can adapt to changing environments and technologies. Vertical farms are designed to fit in tightly packed cities while horizontal layouts are ideal for community farming, thus ensuring a good balance of the urban food network.
These findings show that the future of urban agriculture will be system integrated to include large scale automation and localized resilience. Cities will require large, central efficient hubs to fulfil increasing food needs and support small, local community farms that will add social and ecological sustainability. This model solves the major urban issues of space, food, climate and energy through the creation of an interconnected agricultural network that is both sustainable and adaptable to environmental and economic changes.
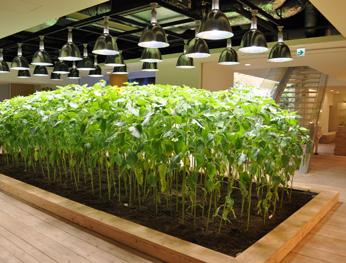
In the future, as technology continues to develop, the integration of smart monitoring, AI in resource management and modular farm designs will increase the sustainability of urban farming. With this hybrid approach, cities can grow and produce their own food, reduce their carbon footprint and develop stronger, more reliable urban agriculture systems that can be incorporated into sustainable city planning.
Figure 98: Pasona Group Headquarters, Tokyo, Japan. Interior farming activities. Image courtesy of Kono Design.
Glasir: A Tree Assembles in Brooklyn
Framlab conceptualized Glasir, a hyper-modular farming infrastructure for dense cities. Engineered as a self-contained “agricultural tree,” the system functions as a community-scaled food production hub, operating at the intersection of biophilic design, circular resource recovery, and decentralized food access.
By embedding aeroponic modules into a prefabricated structure, Glasir reimagines how vertical farming can blend with public space—generating food, energy, and environmental awareness in tight urban footprints.
Project Overview
Glasir is a modular and reconfigurable farming infrastructure. Designed to occupy underutilized public spaces—sidewalks, plazas, rooftops—it repositions food production as an interactive and public-facing urban utility. Each unit comprises a central steel “trunk” from which 10–100 hexagonal growing pods branch out, forming a vertical network of climate-controlled aeroponic units, bio-loop infrastructure, and community interaction zones.
The project aims to serve underserved neighborhoods, focusing on equitable food access and ecological education.
This multi-tenant system integrates:
• Aeroponic Crop Production
• Seedling Propagation Pods
• Nutrient Circulation Infrastructure
• Rainwater Harvesting and Filtration
• Solar-powered Lighting and Climate Control
• Charging Stations for e-bikes and mobile devices
• Community Learning Platforms
The design aims to foster ecological literacy and sustainable food behaviors while minimizing energy and water demand per kilogram of food produced.
Product Operations
Deployment Model:
• Rapid install via prefabricated base module (1 day assembly).
• Drone-enabled vertical stacking and reconfiguration.
Urban Compatibility:
• Rated for seismic, wind, and snow loads (modular anchoring).
• Drainage-integrated foundation for minimal site disruption.
Maintenance Protocol:
• Managed via app-based maintenance scheduling, remote diagnostics, and plug-and-play component swaps.
Figure 99: Location of Framlab’s conceptual Glasir design, Brooklyn, NY.
aeroponic growing modules
aeroponic growing modules
structural modules
structural modules
Figure 101: Glasir modular farm system diagram.
Figure 100: Glasir modular farm system components.
“Glasir is a project that challenges conventional approaches to vertical farming by promoting communitycentered, hyper-local solutions and a high degree of adaptability, aiming to drive systemic change in the industry.”

Andreas A. Tjeldflaat | Framlab Founder and Director
modular farming structure
aeroponics growing
Figure 102: Expanded Glasir modular farm system layout.
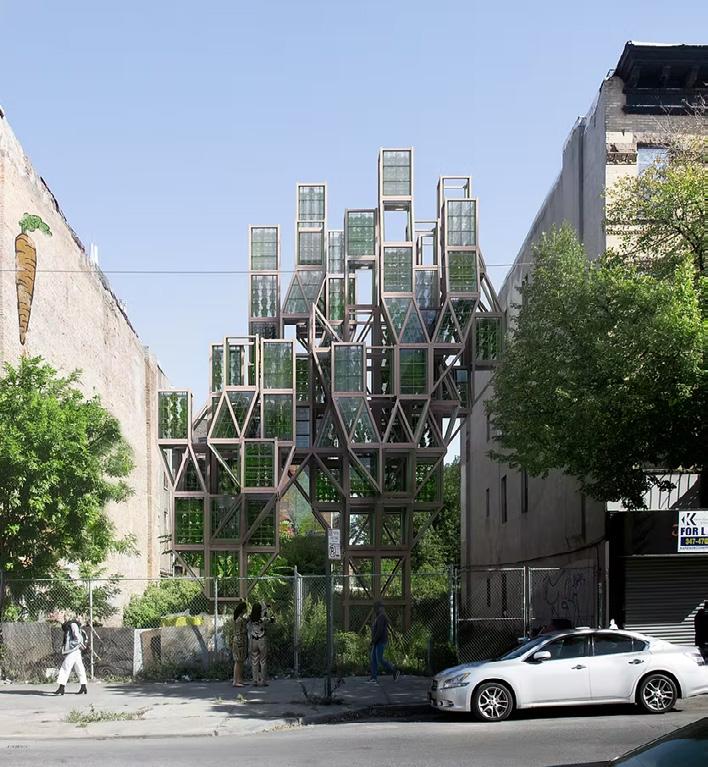
Figure 103: Conceptual illustration of Glasir modular farm design.
Design for Assembly and Disassembly: The Circular City
For modular systems to be truly sustainable, these systems need to operate on circular principles which enable straightforward assembly together with disassembly and supply extended durability for economic sustainability. Design for Disassembly (DfD) principles and assembly methods become vital for this purpose.
Design for Disassembly (DfD) establishes a strategic method which enables agricultural modules to be safely disassembled and relocated while also being repurposed or upgraded without creating excessive waste. Modular farming systems designed using DfD principles display natural flexibility because they differ from traditional fixed farming installations that demand expensive and timeconsuming modifications. The reuse and reconfiguration of materials and system components serve as priorities in urban farming operations to stay adaptable with urban environments and technological changes and policy shifts while reducing resource use.
The design principles of Design for Disassembly (DfD) guide urban agricultural projects through several fundamental design elements which boost efficiency alongside sustainability and functionality. The design incorporates prefabricated modular components and recyclable and reusable materials alongside standardized separable connections that enable rapid assembly and disassembly. These modular agricultural systems need to be adaptable and scalable so urban farmers can adjust their operations in response to changing seasonal requirements and population movements and available urban space.
Modular urban farming systems need to incorporate advanced agricultural technologies which optimize water management and lighting systems and climate control functions to maintain sustainable energy compatibility. A closed-loop agricultural system requires modular structures that integrate rainwater harvesting alongside composting systems and renewable power sources to support its maintainability and reuse capability.
The success of DfD-based urban farming depends heavily on the economic and regulatory framework during implementation. Cost-effective material choices together with government incentives and supportive urban policies determine how well these solutions can be scaled up and implemented. Designers need to collaborate with policymakers and urban stakeholders to make sure modular units meet sustainability requirements while also aligning with urban planning objectives and food security initiatives.
The subsequent parts of the research study modular urban agriculture design through seven core principles which combine technical elements with environmental considerations and economic properties to create adaptable circular urban farming systems. The integration of Design for Disassembly and assembly principles into modular agriculture leads cities to develop resilient sustainable selfsufficient food systems that transform underutilized urban areas into sustainable food production sites.
Minimize Parts for Efficiency and Sustainability
It is crucial to minimize component count in modular urban agriculture systems because it simplifies assembly processes and decreases operational complexity while enhancing scalability. Excessive parts in a design lead to increased assembly time and labour requirements and specialized skills needed which results in elevated initial installation expenses and maintenance costs over time. The simplification of modular agricultural components creates more affordable and accessible solutions which enable both large urban farms and community-based growing systems to grow without extra mechanical complexity.
The reduction of part count leads to enhanced logistics and transportation efficiency which proves vital in urban areas because space limitations and mobility issues affect how materials get moved and installed. The implementation of integrated components leads to reduced packaging requirements and reduced number of shipments and straightforward handling which results in decreased carbon emissions and material waste. Modular urban farming becomes more sustainable through reduced raw material extraction and manufacturing processes which makes it practical for dense urban areas.
Moreover, simplifying system components leads to greater reliability because there are fewer potential failure points. Modular system parts create additional mechanical or structural failure locations at their fastening points and alignment positions and throughout their lifespan. The integration of multiple functions into one unit through design reduces separate elements which creates a more durable and robust agricultural system. Urban farms need reliable and efficient operations since they produce food continuously without personnel for technical maintenance.
The use of streamlined designs allows urban farms to scale their operations with ease while expanding their facilities. Standardized components in urban agricultural systems enable straightforward scaling and replication which adapts to changing needs in urban spaces and market demands for crops alongside technological breakthroughs. Modular interchangeable parts increase system flexibility because their replacement or upgrade allows operators to minimize downtime and avoid full system reengineering.
Recommendations
nj Combine multiple functions within single components where possible. For example, irrigation channels can be integrated directly into growing trays, reducing the need for separate piping.
nj Use common or standard components across different modules to simplify manufacturing and repairs. For example, universal connectors for lighting, irrigation, and nutrient modules ensure compatibility across different urban farm setups.
nj Simplify geometry and standardize dimensions to make modules interchangeable and easily replaceable. Gridbased modular layouts for growing units help optimize both assembly speed and spatial efficiency.
Application to Urban Agriculture Modules:
nj Growing modules: Minimize individual container designs by integrating multi-functional, stackable units that combine plant beds, drainage, and irrigation channels in one piece.
nj Irrigation modules: Reduce the number of pipes and connectors by using pre-assembled, snap-fit distribution manifolds.
nj Energy and monitoring modules: Use modular power distribution and sensor hubs instead of multiple independent units.
Optimizing Fastening Methods
The effectiveness of assembling maintaining and reconfiguring modular urban agriculture systems depends mostly on fastening methods. The selection of fastening methods in complex multi-component systems directly impacts both structural integrity and both disassembly speed and overall adaptability. Short-term durability comes with permanent fastening methods including welding and rivets as well as adhesives, but these methods establish barriers towards future modifications and repairs and recycling efforts. When two components join permanently together the surrounding structure needs to be damaged to separate them which results in both unnecessary material waste and increased maintenance costs. The ability to scale and adapt systems becomes vital for urban agriculture due to its need to accommodate changing environmental conditions and spatial demands.
A circular system requires tool-free reversible fastening methods as its primary approach. Snap-fits combined with press-fits and magnetic fasteners and clips provide fast assembly and disassembly operations that need no specialized tools. The fastener system permits effortless part substitution which facilitates minimal downtime for maintaining urban farming operations. Standardized fasteners across different components minimize tool variation which makes maintenance tasks easier and allows workers to identify and replace required parts easily without handling multiple connection types. The method shows advantages in both worker safety and ease-of-use while also improving efficiency and scalability.
The number of times components require separation and reattachment determines the suitable fastener choice. The Urban farming environment requiring regular module adjustments calls for fasteners which are built to last through multiple cycles of use.
Fasteners should exclude those which deteriorate with
time especially plastic clips because they prefer durable connectors with many life cycles including metal snap-fits and modular bolt systems. Fastener placement should be accessible because this positioning enables routine maintenance and upgrade activities to take place without system component disassembly and system disruption.
Recommendations
nj Use non-permanent, tool-free fasteners such as snap-fits, press-fits, clips, and magnets to allow for easy disassembly and reconfiguration.
nj Standardize fastening hardware across different modules to reduce the number of tools required for maintenance and replacement.
nj Avoid adhesives and welding, which prevent part separation and limit material recovery at the end of the module’s lifespan.
nj Design joints and connectors for repeated assembly and disassembly, ensuring durability over time.
Application to Urban Agriculture Modules:
nj Light and climate control modules: Use magnetic or clip-on mounts for easy repositioning and replacement.
nj Nutrient and irrigation modules: Implement quick-connect fittings for tool-free attachment and detachment of water and nutrient lines.
nj Storage and waste management modules: Utilize interlocking, stackable bins with slide-in or clip-on lids for easy expansion and access.
Incorporate Design for Assembly (DfA) Principles to Improve Efficiency
The proper assembly technique is essential because it provides labour cost reduction and error reduction and facilitates system deployment for modular urban farming structures. Modular farms operated in dense urban areas require easy and fast installation capabilities, so they need assembly procedures which are simple and have reduced complexity. A configuration that needs fewer operations and basic instruments together with straightforward part positioning enables rapid deployment together with flexibility for part rearrangement which allows users to set it up and switch configurations efficiently regardless of their skill level to serve commercial urban farms and community-based farming operations. The optimization of assembly procedures makes urban agriculture an effective food production solution for space-constrained cities that combines cost-effectiveness with user-friendliness.
Assembly efficiency improves through the reduction of assembly directions to a minimum amount. The assembly process becomes longer, and mistakes become more likely when system components need installation in varied orientations alongside challenging angle settings and complex alignments. Modular agriculture systems should operate through single predictable movements such as top-to-bottom or front-to-back and slide-in configurations instead of being designed for multiple orientations. The designed approach eliminates most requirements for specialized training or technical expertise thus expanding modular farm accessibility to multiple operator types. Additionally, standardized parts and connection interfaces simplify the assembly process and reduce the number of tools required for installation. Shared fastening mechanisms and alignment features between modules of irrigation, climate control and growing trays make the assembly process much more intuitive. The use of colored self-aligning keyed parts eliminates mistakes and guarantees proper part orientation. The modularity of farming systems lowers the probability of system failures since parts can only be installed correctly which also enables easier scaling,
The last important element is standardizing part handling through the creation of components with smooth surfaces and built-in grip features which are also light in weight and comfortable to handle. The assembly process becomes slower and extra costs emerge when parts are heavy or awkwardly shaped because they demand more workers or equipment and complicated movements. Modular systems can be rapidly and safely assembled using minimal personnel when they utilize lightweight materials and integrate built-in handling features. Rooftop and vertical farm assembly logistics need to consider both space constraints and worker safety as top priorities.
Recommendations
nj Design modules that require minimal assembly operations by pre-integrating key components.
nj Reduce the number of assembly directions to streamline installation—ideally, components should be assembled using only top-down or front-facing movements rather than complex multi-angle placements.
nj Maximize symmetry and standardization to allow components to be installed in multiple orientations, preventing assembly errors.
nj Provide clear alignment features such as guiding slots, notches, and color-coded connectors to ensure intuitive assembly.
Application to Urban Agriculture Modules:
nj Growing modules: Utilize stackable, snap-fit trays that eliminate the need for fasteners and ensure quick assembly.
nj Irrigation modules: Use pre-aligned pipe grooves and color-coded quick-connect valves to eliminate errors.
nj Energy modules: Integrate modular, plug-and-play battery units for expandable power solutions.
Incorporate Design for Disassembly (DfD) for Long-Term Adaptability
The operation of modular urban farms demands regular performance enhancements along with moving operations and fixing mechanisms to function efficiently in dynamic urban settings. A proper design for disassembly (DfD) strategy is necessary to avoid such systems becoming less efficient and more costly to maintain since they lack effective disassembly strategies. When modular farm structures lack straightforward separation methods and require specialized tools for disassembly they generate both material waste and operational complexities. Systems designed with easyseparation materials and intuitive reversible connections enable efficient maintenance while facilitating seamless upgrades together with component reuse to achieve longterm adaptability and minimize environmental burden.
Systems built to withstand disassembly provide the advantage of flexible modifications alongside growth capabilities which prevents waste generation and complete system replacement. The operational environment of urban farms transforms because available space and climate conditions along with food demand requirements change frequently. Systems designed with quick-detaching panels and standard connectors and modular attachment points enable farmers to replace or rearrange components while keeping the entire structure intact. Farms can welcome new technological developments and improve resource and energy efficiency as well as respond to changing environmental conditions through these modifications which maintain food production operations.
The approach of designing products for disassembly facilitates straightforward maintenance and repair processes which also minimize interference and costs. Urban agricultural modules need regular checks and possible replacement of their irrigation lines along with lighting systems and climate control units. Quick-release mechanisms together with snap-fit connections and accessible fastening points in system designs enable workers to rapidly replace damaged parts without advanced tools or personnel. The farm’s operational effectiveness and productivity stay high because regular maintenance costs are minimized.
The process of disassembly planning includes two vital elements which are end-of-life material recovery and circularity. Without disassembly planning, outdated or broken components often end up in landfills, contributing to environmental degradation. Modular farms built with homogeneous recyclable materials and reduced mixedmaterial components operate on circular economy principles that enable decommissioned parts to be repurposed or recycled into new systems. The extended lifetime expansion of farming infrastructure results from reduced resource extraction together with waste reduction.
Recommendations
nj Label components and connection points to facilitate efficient disassembly and reassembly.
nj Avoid mixed materials, ensuring that parts can be easily separated and recycled at end-of-life.
nj Use visible and accessible fastening points for quick component removal and replacement.
nj •Plan for parallel disassembly, allowing multiple parts to be removed simultaneously rather than requiring step-bystep deconstruction.
Application to Urban Agriculture Modules:
nj Irrigation and nutrient modules: Clearly label water lines and make filters removable without special tools.
nj Climate control modules: Design ventilation and cooling components with easy-access panels for cleaning and upgrades.
nj Storage and waste management modules: Ensure bins and composting units can be taken apart in sections, making transport and cleaning easier.
Prioritizing Human-Centered Design
The effectiveness of modular urban agriculture largely depends on system usability regardless of technological complexity. A system which exhibits difficult assembly alongside unintuitive operation and unsafe maintenance characteristics will ultimately become a barrier to adoption and efficiency and sustainability. Modular farming units need to prioritize human elements during design to create accessible and user-friendly systems which remain safe throughout their entire lifespan from installation to daily use and until maintenance and disassembly.
The primary characteristic of human-centered design involves creating assemblies and disassemblies which both safe and simple to understand. All personnel including professional workers and community members should be able to perform installation modifications and component repairs with minimal physical effort and without needing advanced technical skills. The design should feature lightweight materials along with built-in handles and toolfree fastening systems which enable users to achieve snap, clip or press-fit connections without complex procedures. The use of clearly labeled parts together with color-coded connections and visual indicators minimizes assembly mistakes so that modules can be assembled or disassembled rapidly and accurately.
Modular farming systems require design attention to ergonomics because users need to perform planting and harvesting along with lighting adjustments and irrigation maintenance at comfortable efficiency levels. Growing beds should be placed at waist level to avoid bending while irrigation and lighting controls need to remain within reach. All heavy system components need to be designed for light weight or come with lifting support systems to avoid workplace injuries while serving users with accessibility for older adults and people with limited mobility.
Safety functions as a vital element during the humancentered design process. Modular systems need to reduce all dangers originating from electrical parts together with water contact and structural stability issues.
The integration of insulated wiring with waterproof enclosures and clearly marked hazard zones into energy and climate control modules serves to prevent accidental damage. Maintenance accessibility should exist in structural elements so adjustments can be made without stability complications. Urban farm designs need to incorporate slip-resistant flooring together with proper drainage and adequate lighting to eliminate workplace hazards.
Recommendations
nj Ensure ergonomic handling by keeping components lightweight and designing for one-person operation when possible.
nj Make assembly and disassembly intuitive through visual guides, clear labeling, and color-coded connectors.
nj Minimize the need for specialized tools or heavy lifting equipment in maintenance procedures.
nj Include built-in safety features such as rounded edges, insulated electrical components, and ergonomic lifting handles.
Application to Urban Agriculture Modules:
nj Growing and irrigation modules: Design units at waist height to reduce bending and strain during maintenance.
nj Storage modules: Include built-in handles and lightweight paneling for ergonomic movement.
nj Lighting modules: Use magnetic or snap-fit mounts for easy repositioning without the need for lifting tools.
Pasona Group Headquarters
Architect: Kono Designs Developer: Pasona Group Location: Tokyo, Japan Climate Dependence: Mixed (soil-based, hydroponic system, microclimate-controlled Scale: 3,200 m ²
Growing Location: Interior floors, reception, lobby, conference rooms, canteen, balconies, and exterior façade 3,200 m ²
Growing Strategy: Integrated Workplace Farming (Soil-based + Hydroponic) Growing System: Modular beds, hanging vine systems, hydroponic grow walls, soil planters, seasonal rotation.
The Pasona Headquarters redefines the urban workplace as a food-producing ecosystem. Retrofitted from a 50-year-old financial building, this project integrates hydroponic and soil-based agriculture into every level of the office environment—merging productivity, sustainability, and biophilic design.
The project hosts over 200 varieties of vegetables, fruits, and rice, transforming 3,200 m² of growing space within a 20,000 m² office building into a productive, healthoriented workspace.
Project Overview
This project merges agricultural and work functions through a layered, modular design:
Reception & Lobby (Level 01)
Vines and seasonal crops suspended from ceilings and fabric partitions; indoor rice paddy and field grown as a cultural centerpiece.
Canteen & Dining (Level 02)
Edible interior with lemon and passionfruit trees; microgreens and seedlings grown near seating areas.
Meeting & Conference Rooms (Level 03)
Hanging tomato plants and hydroponic racks soften workspaces and add seasonal interest.
Seminar & Education Spaces (Level 04)
Interactive grow walls, vertical planters, and aquaponic displays used in training and outreach.
Grow Lab & Research (Basement & Circulation Zones)
Climate-controlled seedling production and crop rotation experiments across adaptive niches.
Figure 104: Location of Pasona Group Headquarters, Tokyo, Japan. Design by Kono Design.
hydroponic display productive ceiling
rice field fabric pocket growing herb boxes productive partition
Figure 105: Pasona Group Headquarters, Tokyo, Japan. Urban farm system components.
Key Resource Streams
Energy Waste
nj Lighting System: Originally mixed HPS and fluorescent; now retrofitted with LED tailored to plant spectra and occupancy hours.
nj Energy Optimization: Lighting matched to work schedules to reduce peak load; no excess usage beyond building operational hours.
nj Climate Regulation: Building-integrated HVAC modified to support both human comfort and plant needs—humidity, airflow, and temperature managed via zoned systems.
nj Energy Transition: Significant energy-related emissions reductions reported due to on-site food production and offset transportation demand.
Wastewater
nj Irrigation: Fully automated drip and mist systems manage nutrient delivery, pH, and humidity in response to plant needs.
nj Water Routing: Building retrofit included repurposing ductwork and shaft space for nutrient and water lines, reducing material waste and increasing efficiency.
nj Microclimate Moisture: Moisture from transpiration recycled where possible in sealed grow environments.
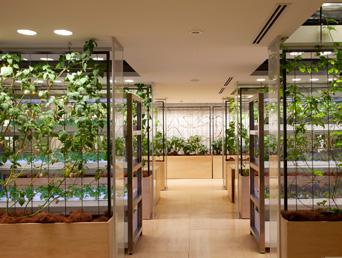
Material Waste
nj Organic Waste: All plant residues, including trimmings and expired crops, are composted or reused as fertilizer inputs.
nj Packaging & Processing Waste: Minimized due to on-site harvesting and food prep; direct use in staff meals reduces need for secondary packaging.
nj Structural Retrofitting: Reuse of vertical shafts and ceiling cavities minimizes the need for new materials and avoids structural overbuild.Edible interior with lemon and passionfruit trees; microgreens and seedlings grown near seating areas.
Carbon and Circularity Strategy
nj Operational Carbon: Lowered through passive energy synchronization (plants require light only when staff are present); reduction in VOCs and CO₂ achieved through active plant sequestration.
nj Embodied Carbon: Reduced by repurposing an existing structure rather than new construction; infrastructure adapted without demolition.
nj Biophilic Integration: Enhanced mental health, indoor air quality, and productivity documented through both formal studies and internal surveys.
Community Integration & Value Chain
nj Closed-Loop Food Chain: Crops are planned, grown, and harvested by employees; meals prepared on-site in the canteen, closing the producer-consumer gap.
nj Educational Platform: The farm functions as a teaching and demonstration site, supporting internal training and public tours on food, sustainability, and design.
nj Food Waste Strategy: Leftovers redistributed internally or composted; no industrial-scale food waste disposal required.
nj Urban Impact: Supports Tokyo’s push for indoor air quality and reduced food import dependency by sequestering carbon and VOCs, while growing food locally.
Figure 106: Pasona Group Headquarters, Tokyo, Japan. Interior farm partitions. Image courtesy of Kono Design.
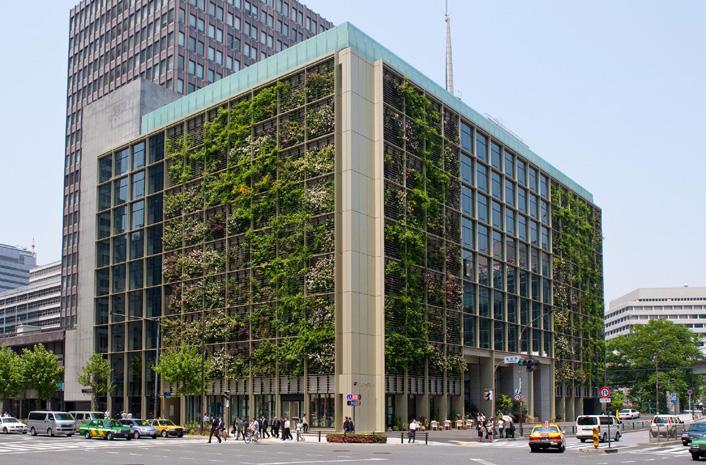
Figure 108: Pasona Group Headquarters, Tokyo, Japan. Urban farm systems diagram.
Figure 107: Pasona Group Headquarters, Tokyo, Japan. Exterior vertical farm façade. Image courtesy of Kono Design.
soil based growing
hydroponics growing
hydroponics growing
hydroponics growing
soil based growing
ground floor
2nd floor
3rd floor
4th floor
Figure 109: Pasona Group Headquarters, Tokyo, Japan. Urban farm systems diagram.
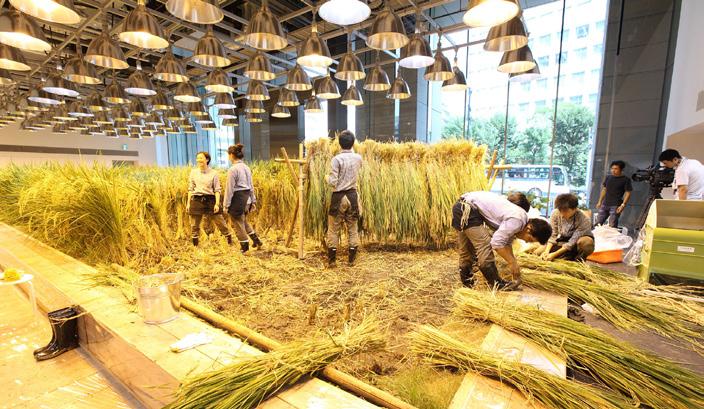
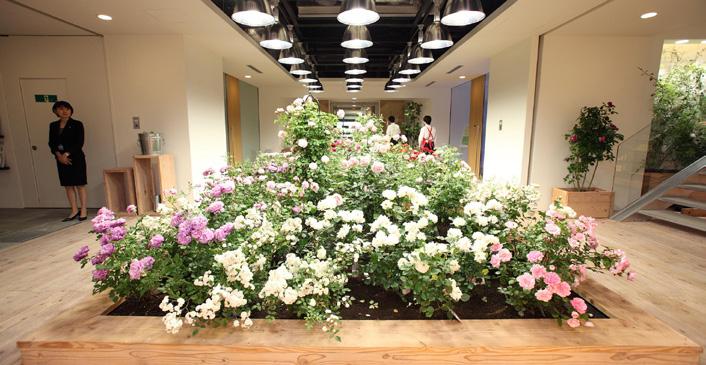
Figure 110: Pasona Group Headquarters, Tokyo, Japan. Urban agriculture systems diagram.
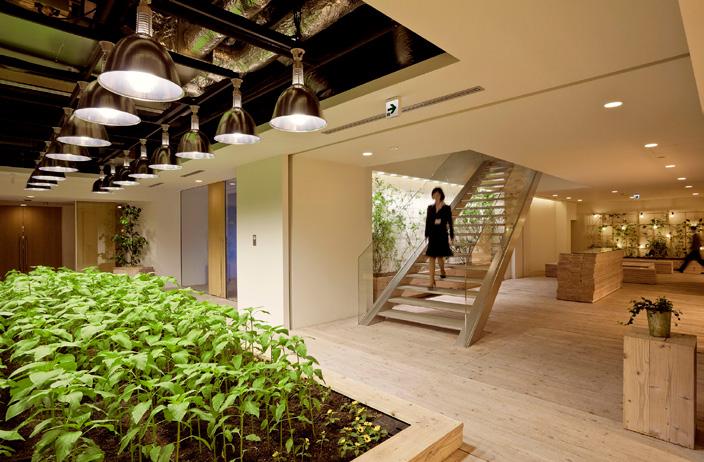
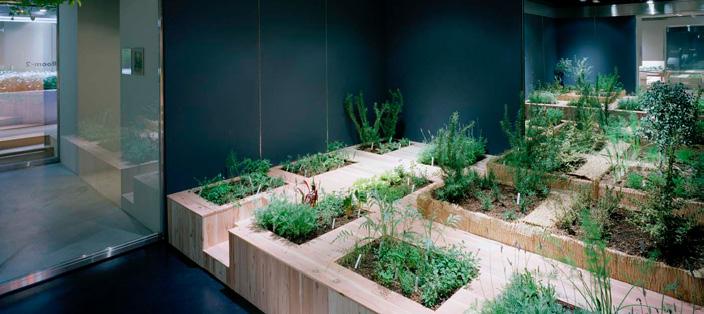
Figure 111: Pasona Group Headquarters, Tokyo, Japan. Interior farming activities. Image courtesy of Kono Design.
My view of indoor farming is that advanced technology will help realize the potential for urban agriculture to produce fresh produce. I want people to recognize that when planning indoor farming, there is often an overemphasis on increasing production, while other important aspects may be overlooked. I believe that indoor farming in urban environments presents a significant opportunity to consider food waste, educate individuals about the importance of food production, and foster a shift in attitudes towards dietary choices. This initiative could serve as a foundation for promoting healthier lifestyles within communities.
To achieve this, it is essential to establish spaces that allow local residents to engage directly with agriculture. My experience in designing such environments has illuminated the positive impact this interaction can have, as I have witnessed firsthand how integrating agricultural elements into people’s lives brings joy and enhances their well-being.”

Yoshimi Kono | Kono Designs Principal
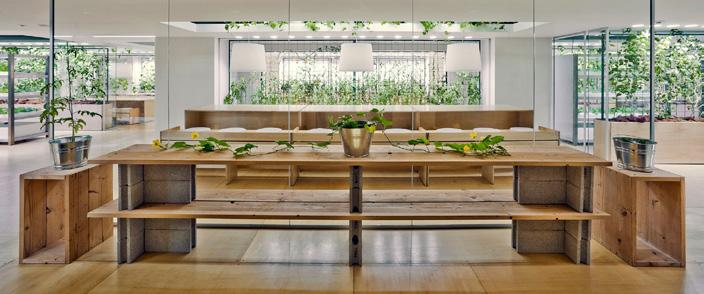
Materiality in BIA
An emerging and increasingly critical dimension of BIA is the materiality of its systems, the selection of construction materials and the environmental footprint of their production, use, and eventual disposal. In advancing toward regenerative and circular building practices, BIA projects are beginning to prioritize bio-based, low-carbon, and recyclable materials, ensuring that the environmental benefits of food production are not undermined by the structures that support it.
Bio-Based and Circular Construction Materials
Traditionally, greenhouse and indoor farm structures rely on aluminum, steel, and concrete, materials valued for their strength and durability but associated with high embodied carbon. In response, architects and engineers are increasingly experimenting with bio-based alternatives such as engineered timber, bamboo, hempcrete, and emerging fungal composites like mycelium. These materials offer pathways to lower embodied carbon and, in many cases, enable end-of-life biodegradability or reuse.
In Canada, particularly British Columbia, has a strategic advantage in this space. The province’s abundant and sustainably managed forestry resources make mass timber and glulam cost-effective and climate-aligned choices for structural applications like rooftop greenhouses or modular farm pods. Research in this study highlights that material choices shape the total life-cycle emissions per kilogram of produce, often even more than operational energy. Counterintuitively, the research found that soil-based rooftop farms, often assumed to be “natural,” can carry higher embodied emissions due to heavy infrastructure needs (e.g. concrete planters and structural reinforcements) that result in relatively modest yields. In contrast, hydroponic or aeroponic systems, lighter and capable of year-round production, can offset their material intensity through productivity.
“Mycelium biocomposites suggests a future in which dynamic architectural materials respond to needs that are at once aesthetic, structural, and visceral.”

Joseph Dahmen | UBC SALA Director, Biogenic Architecture Lab
Mycelium has emerged as a high value construction material for BIA. It is a material derived from fungal root networks, which is now being explored as a sustainable building material. Mycelium-based composites are lightweight, biodegradable, flame-resistant, and naturally insulating, making them suitable for applications like interior insulation panels, grow bed components, and acoustic dampening in vertical farms. Because mycelium thrives on agricultural and organic waste, it fits within BIA’s circular resource logic: waste from urban farms can become feedstock for growing materials, closing loops between food and construction.
Moreover, mycelium production itself does not require intensive processing, meaning it emits far less CO₂ than plastics or synthetic foams. As both a byproduct and a construction solution, mycelium represents the kind of symbiosis BIA seeks to operationalize in cities—linking waste valorization with low-impact design.
Embodied Carbon and Comparative Metrics
Quantifying material impact through LCA reveals the tradeoffs across BIA typologies. Vertical farms often have higher operational energy demands due to artificial lighting and environmental controls but yield higher produce volumes per unit area. In contrast, soil-based or rooftop farms leverage sunlight and passive systems, reducing operational energy but often delivering lower productivity. According to Goldstein et al. (2016), BIA systems only offer net climate benefits when designed holistically; poorly integrated or over-engineered systems may consume more resources than traditional agriculture.
Nonetheless, best-in-class BIA systems show promise. One rooftop hydroponic greenhouse model achieved a 44% reduction in food system emissions, primarily by minimizing transport and utilizing building waste heat. To evaluate such performance, designers now apply paired metrics—such as kg CO₂e per kg of produce, kWh per kg of yield, and yield per square meter—to align both agricultural output and building performance. For instance, a high-efficiency vertical farm might produce 120–150 kg of leafy greens per m² annually at 180–200 kWh/kg, while a rooftop soil farm may yield 25–35 kg/m² at just 20 kWh/kg. The former excels in spatial productivity, the latter in energy efficiency. However, integrated designs that leverage greywater reuse and waste heat from buildings, as promoted in BC’s emerging sustainable building codes, can help strike a performance equilibrium between resource input and yield output.
Recyclability, Nutrient Loops, and End-ofLife Strategies
Material sustainability in BIA extends to circularity, not only selecting low-impact inputs, but ensuring their reuse, recyclability, or composability. Projects like Altmarktgarten in Oberhausen, Germany, use aluminum framing and polycarbonate glazing, both recyclable materials, allowing for partial reclamation if the farm is dismantled. Similarly, recycled plastics are often used for hydroponic channels, NFT trays, and growing containers, with some producers now ensuring closed-loop recyclability of these components. New innovations are also redefining circularity. In addition to hempcrete planters and mycelium panels, designers are
exploring compostable bioplastics, reusable bio-composite racks, and carbon-sequestering concrete alternatives. Furthermore, BIA installations increasingly integrate biological loops—for example, composting organic waste into fertilizer, using biochar to enhance soil media, or even exploring urine diversion and blackwater treatment to recover nitrogen, phosphorus, and potassium for hydroponic systems. A Dutch study on regenerative urban systems found that urban agriculture could capture up to 40% of a city’s recoverable nutrients, significantly reducing dependence on fossil-derived fertilizers.
Notably, mycelium again plays a dual role here—not only as a material but as part of the nutrient cycle. Urban mushroom farms can be co-located with food waste processing to convert compost into edible biomass and structural material. The residual substrate from mushroom production (spent mycelium) can be re-used as animal feed, compost amendment, or remanufactured into insulation and packaging—making it a multi-lifecycle material suited to circular cities.
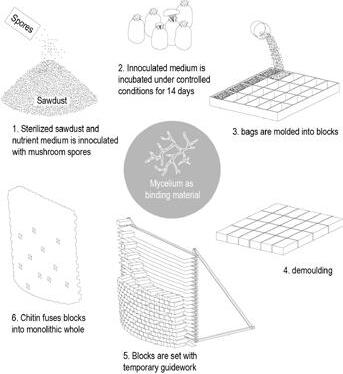
1. Sawdust and medium innoculated with mushroom spores
4. Demoulding
3. molded into blocks
5. Blocks are set
6. Chitin fuses blocks into monolith
2. incubated under controlled conditions
Figure 112: Mycelium production process by Joseph Dahmen, Associate Professor, SALA, University of British Columbia.
Human Experience of Design
Social Cohesion and Community Engagement
Urban agriculture, particularly when embedded in residential or civic buildings, can serve as a powerful catalyst for social cohesion.
By transforming underutilized rooftops, courtyards, and lobbies into shared green spaces, BIA fosters casual encounters and shared experiences that bring people together across cultural and socioeconomic lines. Numerous studies have identified community gardens and farms as effective forms of “social glue,” with one global review noting that community cohesion was the most frequently cited social benefit, appearing in 34% of urban agriculture literature.
How does BIA specifically foster these connections? Integration into communal building spaces, such as a rooftop accessible to residents, or a greenhouse atrium in a school or library, naturally creates places where people gather, linger, and interact. The very presence of greenery invites pause. A neighbour who might normally offer only a nod in passing could instead engage in a conversation while harvesting herbs or tending to shared crops. As Glover (2004) and others have shown, urban gardens are often as valued for their role as social and cultural gathering places as for the food they produce. In cities like Vancouver, resident surveys from multi-unit housing with shared garden terraces have reported not only improved social interaction but a stronger sense of collective ownership and pride in the space.
Community-oriented BIA initiatives frequently incorporate volunteer programs, education activities, and comanagement opportunities. For instance, residents might sign up for weekly watering shifts in a building’s vertical farm, or students and parents might co-lead planting days on a school rooftop garden. These activities establish a shared sense of purpose and break down social barriers by fostering collaboration across age, culture, and language. In multicultural contexts, urban farms have been shown to foster cultural integration—one comparative study noted that both gardeners in Copenhagen and students in California experienced decreased cultural bias and increased cross-cultural friendships when participating in urban agriculture programs.
The act of growing food together offers a neutral, nurturing space for the exchange of traditions, whether through recipes, seed sharing, or gardening techniques.
Beyond social interaction, BIA can build social capital by empowering marginalized communities. In lowerincome urban areas, whether in developing countries or within Canadian cities like Vancouver, BC, urban farming has emerged as a tool for subsistence, resilience, and empowerment. Community farms in neighborhoods like the Downtown Eastside in the City of Vancouver, not only provide access to fresh food but engage residents in decision-making and stewardship. This sense of agency enhances community identity and fosters solidarity. As noted by Eigenbrod and Gruda (2014), urban gardens often serve different functions across socioeconomic contexts— nutritional support in lower-income communities, and educational or social enrichment in wealthier areas—yet both outcomes strengthen the social fabric.
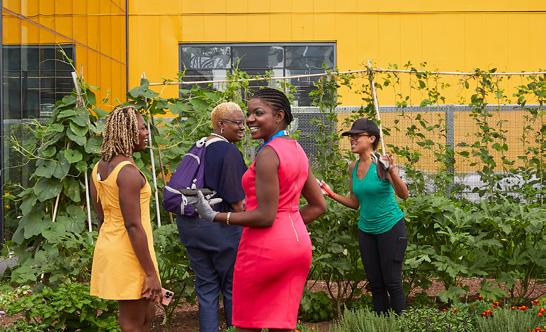
Importantly, the design of BIA spaces plays a crucial role in amplifying these benefits. Incorporating seating, shade, lighting, and aesthetic plantings around productive zones encourages informal use and comfort. Thoughtfully designed gardens become more than growing sites; they become venues for conversation, collaboration, and even celebration. BIA also frequently intersects with biophilic design, which enhances emotional well-being and fosters a sense of welcome—an essential precursor to social engagement.
A compelling example of this integration is the Daphne Cockwell Health Sciences Complex at Toronto Metropolitan University. Designed as a vertical campus, the building consolidates health science departments with student residences and a rooftop urban farm. The farm serves both as a food production site and a social space, supporting nutrition programs and providing a communal amenity for residents. Real-time monitoring of energy and water use further encourages behavioral accountability and environmental awareness among students.
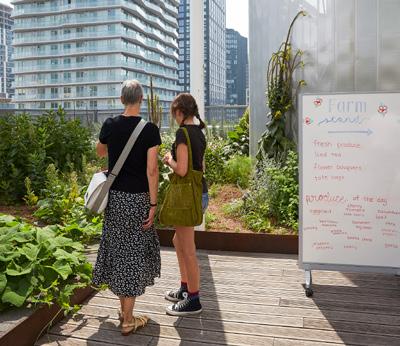
Figure 114: Perkins&Will, Daphne Cockwell Health Sciences Complex, Toronto Metropolitan University, Toronto, ON.
Figure 113: Perkins&Will, Daphne Cockwell Health Sciences Complex, Toronto Metropolitan University, Toronto, ON.
Health and Mental Well-Being
Access to greenery, and the act of gardening itself, has consistently been linked to improved mental and physical health. BIA bring these benefits into the fabric of daily urban life, embedding nature directly into the places where people live, work, and learn.
Two foundational theories often cited in this context are Stress Reduction Theory (Ulrich, 1984) and Attention Restoration Theory (Kaplan & Kaplan, 1989). Ulrich’s research demonstrated that exposure to natural scenes can prompt involuntary physiological responses such as lowered blood pressure and heart rate, helping to alleviate stress. The Kaplans, meanwhile, argued that even passive interaction with nature replenishes our capacity for directed attention—a resource often depleted by overstimulation in modern urban environments. In essence, even brief, incidental encounters with nature can soothe stress and restore cognitive function.
BIA systems offer exactly these kinds of restorative experiences. A green wall in a hospital atrium, or a vegetable garden in an office lobby, reintroduces the sensory complexity of nature, visual greenery, fragrant herbs, the soft rustle of leaves, into otherwise sterile, screendominated spaces. Numerous studies, including those referenced by WHO, have found correlations between proximity to green spaces and improved mental health outcomes. One seminal study found that hospital patients recovered faster and required less pain medication when their rooms overlooked trees rather than a blank wall (Roger S. Ulrich, 1984). In the context of BIA, consider an apartment where the window view opens onto a lush rooftop farm rather than an asphalt roof, an environmental shift with profound potential to elevate mood and daily mental state.
This aligns closely with the principles of biophilic design, which intentionally integrates natural elements, plants, water, daylight, organic materials, into built environments to promote well-being. BIA represents a high-functioning expression of biophilic design—it provides real, living systems that evolve over time, rather than static or simulated representations of nature. At the Pasona Urban Farm in Tokyo, employees experienced measurable improvements in well-being. Internal air quality testing and staff surveys indicated fewer complaints of eye irritation, fatigue, and discomfort. The organization reported a 12% increase in productivity and a 23% reduction in minor symptoms when plant density was increased—results that mirror findings in broader workplace wellness literature, particularly around the role of plants in filtering indoor air pollutants such as VOCs and excess CO₂.
The cognitive benefits of BIA also extend beyond general stress relief. Attention Restoration Theory suggests that mental fatigue, common in dense urban and highpressure work environments, can be alleviated through even momentary contact with nature. Studies have shown that employees with access to plants or views of greenery demonstrate higher levels of concentration, creativity, and job satisfaction. In educational settings, children attending schools with integrated gardens or green classrooms have exhibited improved attention spans and, in some studies, higher academic performance. These restorative benefits position BIA not just as a design intervention, but as a form of mental infrastructure—a buffer against the psychological stresses of urban living.
The health impacts are not only mental but also physical. BIA encourages light daily activity—watering, pruning, walking among plants—that can be especially valuable in sedentary settings like office towers or for elderly residents in multi-unit housing. In addition, consuming produce grown on-site supports healthier eating habits, offering ultrafresh fruits and vegetables with higher nutrient density and minimal processing.
On a broader scale, green buildings that incorporate BIA also support public health objectives by improving air quality, reducing ambient temperatures, and mitigating the urban heat island effect. Green roofs, for example, can lower surrounding air temperatures and filter airborne pollutants— creating a cleaner, more breathable microclimate for both occupants and neighboring communities. While a single rooftop farm may not solve urban air pollution, a network of BIA installations can collectively contribute to healthier, more climate-resilient cities.
BIA also plays a role in community mental health. Gardens often evolve into welcoming, low-barrier spaces that combat social isolation—an increasingly recognized determinant of depression and anxiety. In fact, therapeutic horticulture is widely used in mental health interventions, offering a sense of purpose, calm, and routine. When integrated into the built environment—such as in housing complexes, care facilities, or community centers—these gardens can provide daily access to green space for those without private yards. During the COVID-19 pandemic, public interest in gardening surged as people turned to plants for solace, grounding, and a sense of control. Building-integrated farms, by design, democratize access to this therapeutic experience, ensuring that the mental health benefits of growing and being around plants are not reserved for those with land, time, or privilege.
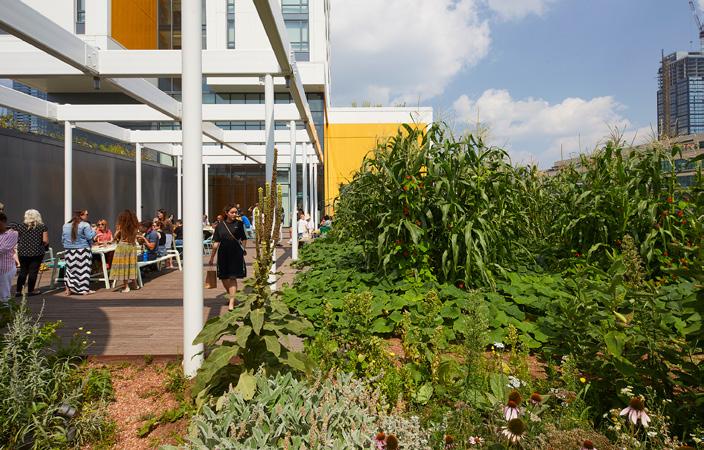
Figure 115: Perkins&Will, Daphne Cockwell Health Sciences Complex, Toronto Metropolitan University, Toronto, ON.
Livability, Biophilic Design, and Livelihoods
Livability refers to the quality of life experienced by city dwellers, shaped by environmental comfort, aesthetic enjoyment, and opportunities for rest and engagement. Agriculture integrated into buildings transforms lobbies, rooftops, and courtyards into spaces people want to be. Imagine entering an apartment that smells of basil or working in an office with a green terrace outside your window, these experiences can greatly improve daily satisfaction.
At the city scale, biophilic urbanism connects individual BIA efforts into a network of green spaces. When multiple buildings include vegetation and food gardens, cities gain more biodiversity, shade, pollinator habitats, and visual harmony. These changes fulfill an essential human need for connection to nature (Kellert, Heerwagen, & Mador, 2013).
Cities like Singapore lead globally in biophilic planning, while Toronto now mandates green roofs on many new buildings, some of which are used for food production. These features are not just aesthetic—they raise property values (mature trees alone can increase values by 5–18%) and improve well-being. A rooftop garden can make a building more attractive and livable, provided access is equitable.
BIA also supports livelihoods by creating new jobs and volunteer opportunities. Roles like greenhouse technician, market manager, or garden educator are emerging across Canadian cities. In British Columbia, rooftop greenhouses operated by social enterprises offer employment and skill development opportunities for youth and marginalized groups. These farms turn underused spaces into centers of food production, training, and community engagement. International examples, such as the Vertical Farm Beijing by van Bergen Kolpa, combine food production, public education, and innovation. Similar hubs in Canadian cities could support green job growth and urban food literacy while attracting visitors and investment.
Livability also connects to mental health. According to Attention Restoration Theory, natural elements like gardens and water features help people recover from cognitive fatigue. BIA spaces can be designed to support this—quiet greenhouse seating, indoor herb walls, and aquaponic displays offer places to pause, restore focus, and feel at ease. Architects are increasingly collaborating with health experts to integrate these experiences into schools, workplaces, and public buildings.
However, not all green amenities are equally accessible. Without careful planning, rooftop farms and gardens can become exclusive to high-end developments. To ensure equity, cities must support public or non-profit BIA projects. Montréal, for instance, has integrated rooftop farms into libraries and public parks, enabling residents of all ages and income levels to enjoy their benefits. One renovated library features a rooftop garden open to patrons, connecting green space with educational and community uses.
Nutrition and Food Access
One of the central promises of BIA is its potential to improve nutrition and food access in urban environments. By growing food where people live, work, and play, BIA can deliver fresh, nutrient-rich produce while addressing urban food deserts— neighborhoods with limited access to healthy food.
Nutrient Density and Freshness
Freshness is critical to nutritional quality. Fruits and vegetables begin losing vitamins and phytonutrients immediately after harvest. For example, spinach stored at 4°C for eight days can lose nearly 47% of its folate and carotenoids, while green beans lose 77% of their vitamin C after a week in cold storage (Penn State, 2025). Even broccoli loses more than half its vitamin C after just one week at room temperature. BIA eliminates much of this degradation by enabling harvest-to-plate delivery within hours. A UC Davis review confirmed that minimally stored produce retains more nutrients, especially vitamin C (Penn State, 2025).
This freshness translates to both higher nutritional value and improved taste. Residents often remark on the superior flavor of BIA-grown food. School garden programs have also observed that children are more likely to enjoy vegetables when they’re freshly harvested, with one study reporting that students believed “vegetables from the garden taste better than from the store.”
Additionally, BIA allows for the cultivation of varieties selected for their nutritional and flavor qualities rather than transport durability. Unlike industrial agriculture, which prioritizes shelf life, urban farms can grow delicate heirlooms, vine-ripened tomatoes, or nutrient-dense microgreens that are typically unsuited for long-distance shipping. Many BIA operations also tailor crops to local dietary and cultural needs, such as high-iron leafy greens in communities with elevated anemia rates or herbs specific to immigrant cuisines.
Micronutrient Bioavailability and Education
Beyond what is grown, how food is experienced also affects its nutritional value. Participation in gardening is linked to improved dietary habits. School-based programs that incorporate growing and harvesting activities often result in increased vegetable intake, fiber consumption, and a greater openness to new foods. The LA Sprouts program, for example, led to both higher fiber intake and reduced BMI and waist circumference in overweight children. BIA brings these benefits to dense cities by enabling rooftop and courtyard farms, where ground space is limited, thereby expanding the reach of food literacy and early nutrition education.
Food Security and Local Resilience
BIA also contributes to urban food security by localizing supply chains. Canadian cities, including Vancouver, depend heavily on imported produce—often from distant regions like California. BIA reduces this dependency by offering resilient, distributed production close to consumers. During the COVID-19 pandemic, disruptions to the food system highlighted the value of local sources. While BIA won’t replace rural agriculture, it can serve as a buffer during shocks.
Data supports its potential. A Guardian meta-analysis found that urban farms, particularly those specializing in leafy greens, can yield as much or more per square meter as conventional farms. Modeling has shown that even partial rooftop utilization could meet a portion of a city’s produce demand.
In Vancouver, organizations like Fresh Roots operate schoolyard farms that feed cafeterias and run market stands accepting food subsidies, reaching lower-income families. In Toronto, some public housing units now feature indoor gardens, providing year-round access to fresh produce in high-density areas where private gardens are not possible.
Nutrient Cycling and Circularity
BIA also supports circular food systems. Plant waste can be composted on-site and reused as fertilizer, closing the nutrient loop. This keeps organic matter within the local system, reducing landfill waste and supporting healthy soils (in soil-based systems) or organic nutrient supply (in hydroponics). Though primarily an environmental function, nutrient cycling indirectly supports nutrition by enhancing growing media and reducing reliance on synthetic fertilizers.
Bioavailability and Growing Methods
Freshness also affects nutrient bioavailability—not just the quantity of nutrients but how well the body absorbs them. Antioxidants, such as flavonoids and carotenoids, degrade in both potency and quantity over time. Eating freshly harvested greens maximizes their functional benefits. Research suggests that hydroponic and aquaponic systems, when well-managed, produce vegetables with macronutrient and micronutrient content comparable to those of soil-grown ones. In some cases, urban gardens may offer higher mineral concentrations due to the use of enriched compost or localized soil inputs. One study (Selhorst & Lal, 2013) found elevated mineral levels in urbangrown produce, while another (Sanyé-Mengual et al., 2015) found hydroponic rooftop tomatoes were as nutritious as field-grown equivalents.
Education and Awareness
BIA serves as a living classroom, embedding learning opportunities into everyday environments. By integrating food production into schools, libraries, offices, and housing, BIA naturally fosters curiosity, hands-on engagement, and long-term environmental awareness across all age groups.
School Gardens and Youth Education
When schools incorporate gardens or greenhouses, students gain direct experience in biology, ecology, and nutrition. A synthesis of school gardening programs found that students involved in gardening not only improved their subject knowledge (e.g., plant growth, healthy eating) but also demonstrated better behavior, higher science scores, and enhanced soft skills, such as teamwork and responsibility. In British Columbia, some schools have adopted the Edible Schoolyard model, integrating rooftop gardens and greenhouses into the curriculum throughout the academic year.
Teachers use these gardens to teach math (measuring plant growth and calculating yield), social studies (food systems and social justice), and health education (understanding the origins of food). These experiences are especially valuable in urban areas where children are often disconnected from agriculture. A key outcome is food literacy—students learn to grow, prepare, and appreciate fresh food. Programs that pair gardening with cooking lessons have been shown to instill healthier eating habits and combat childhood obesity. For example, the LA Sprouts program reported increases in fiber intake and reductions in BMI and waist circumference among overweight children. BIA can bring these benefits to space-constrained schools through the use of greenhouses on rooftops or vertical grow walls in classrooms.
Adult and Community Education
BIA also serves as a tool for community engagement and adult education. As urban farming is still novel to many, public-facing BIA projects often host tours, workshops, and volunteer days. These activities help demystify food production and promote awareness of sustainable practices. For instance, Lufa Farms in Montréal offers rooftop greenhouse tours that explain hydroponics, pest management, and energy use. In Vancouver, the City Hall rooftop garden provides interpretive signage and volunteer opportunities, serving as both a demonstration site and an informal training ground.
In workplaces like Pasona Urban Farm, employees participating in plant care inadvertently learn about plant life cycles, seasonal changes, and food systems, fostering an appreciation for farmers and making more informed food choices.
BIA also intersects with higher education and applied research. Universities are increasingly incorporating vertical farms and controlled-environment agriculture (CEA) into their campus infrastructure. These facilities serve dual purposes—supplying food to campus kitchens while enabling student research in hydroponics, agronomy, plant breeding, and environmental science. For example, the Agora Tower concept at the University of British Columbia integrates a vertical farm into student housing, creating a setting where students live, learn, and research sustainable food systems.
Cultural and Environmental Awareness
Exposure to BIA also enhances environmental literacy. Engaging with plants increases awareness of water use, waste, and climate variability, encouraging conservationoriented behavior. Participants often report becoming more mindful about food waste after seeing the effort involved in growing food. Community composting programs frequently emerge alongside BIA sites, educating people about waste reduction and soil health.
In multicultural neighborhoods, gardens also support cultural exchange and preservation. Elders may teach younger generations how to grow culturally significant crops, strengthening intergenerational ties and celebrating food traditions.
BIA also fosters a deeper connection to urban ecology. Witnessing pollinators at work, managing pests, or observing plant health firsthand gives participants an informal education in biodiversity and ecosystem function. These encounters promote greater public support for environmental initiatives and deepen ecological understanding. In this way, BIA not only grows food—it grows environmentally conscious, food-literate citizens equipped to participate in sustainable urban futures.
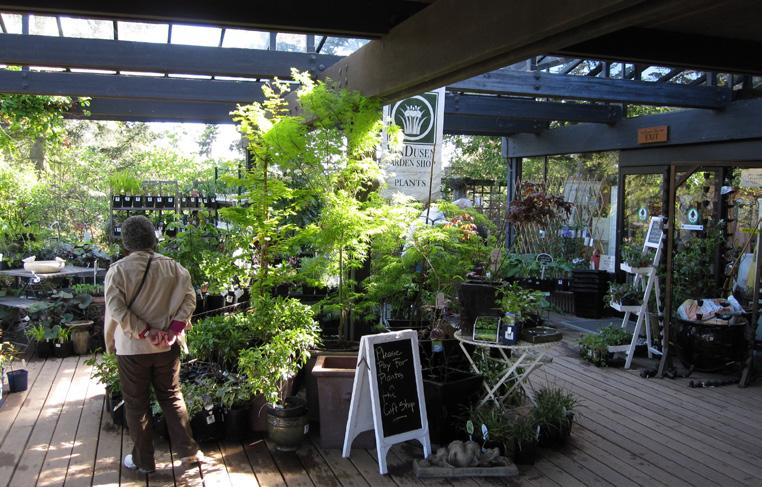
Figure 116: Perkins&Will, VanDusen Botanical Garden Visitor Centre, Vancouver Board of Parks and Recreation, Vancouver, BC.
Equity, Inclusion, and Addressing Green Gentrification
While Building-Integrated Agriculture (BIA) offers many benefits, it is essential to ask—Who receives those benefits? Without intentional design and policy, green infrastructure—including urban farms—can contribute to “green gentrification.” This occurs when environmental improvements, such as parks or gardens, increase an area’s desirability, drive up property values, and unintentionally displace lower-income residents—the very people these interventions were intended to support.
BIA has shown this dual potential. Once seen as a grassroots empowerment tool, it can now be co-opted into upscale developments or branding strategies, sometimes reinforcing inequality. For example, a luxury condo may install a rooftop farm as a marketing feature, offering residents produce exclusively, while nearby communities see no direct benefit. In such cases, urban agriculture becomes privatized and may even contribute to rising rents. Researchers like Anguelovski et al. (2018) and Rosan & Pearsall (2017) have documented how urban greening, without equity safeguards, can align with gentrification trends across North America and Europe.
Countering Displacement Through Inclusive BIA
Preventing these outcomes requires inclusive planning and policy interventions. Cities can ensure BIA projects support local communities by:
nj Mandating affordable access to produce (e.g. requiring farms to sell in nearby food deserts or donate surplus to food banks).
nj Supporting non-profit or cooperative models that involve residents in ownership and governance, protecting them from market-driven displacement.
nj Prioritizing project placement in underserved areas—not just where real estate gains are highest.
Some models already demonstrate this inclusive approach. The Glasir concept, for instance, targets food deserts with high-tech farms, flipping the script by starting in low-income areas rather than commercial districts. In the U.S., tax incentives and fast-track permits for urban farms in “Healthy Food Priority Areas” have helped steer investments to where they’re most needed—policies Canadian cities could adopt.
Ensuring Access and Participation
Equity also means ensuring the food reaches the broader public. Downtown office farms, while beneficial to tenants, may exclude surrounding communities. More inclusive models include:
nj Public CSA pickups or farmers markets at farm sites.
nj "Pay-what-you-can" stands or food bank donations from surplus harvests.
nj Subsidized programs—as with Toronto’s Ripple Farms, which provided free produce via community centers, supported by a private revenue stream.
Education access matters too. School farms should exist not only in private or well-funded institutions but also in public and inner-city schools, ensuring all students benefit from food literacy and experiential learning.
“Just Green Enough” Approaches
Urban planners and advocates have promoted “just green enough” strategies—implementing modest, communityled greening projects that improve quality of life without triggering speculative development. For BIA, this may mean:
nj Favoring multiple small, community-run farms over one large commercial installation in vulnerable areas.
nj Pairing green amenities with housing affordability protections (e.g., inclusionary zoning).
nj Involving residents from the start through participatory design and governance.
Cultural Inclusion and Food Sovereignty
Equity also involves cultural responsiveness. Urban farms should reflect the cultural needs of the communities they serve. This includes growing crops that are culturally relevant—bok choy, amaranth, or traditional herbs—rather than defaulting to kale or lettuce. Involving community members in crop selection ensures relevance, promotes participation, and aligns with food sovereignty principles, giving people agency over their food systems.
Canadian examples illustrate BIA’s equity potential. In remote Indigenous communities, hydroponic farms have brought fresh greens to regions with limited food access, improving diet and reducing dependence on costly imports. In cities, initiatives like schoolyard farms and public housing gardens continue to center equity, ensuring that BIA isn’t just about making cities greener—but also fairer and more inclusive.
A Tool for Equitable Urban Transformation
Ultimately, BIA can be either a tool for equity or an agent of displacement—it depends on how it’s implemented. Scholars and practitioners alike emphasize strategies such as:
nj Coupling BIA with affordable housing and antidisplacement policies,
nj Ensuring participatory planning,
nj And guaranteeing that benefits—such as food, jobs, and education—reach long-term residents.
When approached with care, BIA can uplift communities, bring fresh food to areas affected by “food apartheid,” create safe and beautiful public spaces, and empower residents with pride and purpose. The challenge is not just to grow food but to grow justice alongside it.

Figure 117: Perkins&Will, Albion Library, Toronto Public Library, Toronto, ON.
Food for Thought
BIA is emerging as a transformative strategy at the intersection of urban design, sustainability, and social well-being. As explored throughout this chapter, effective BIA demands a dual focus: innovative, integrated design and meaningful human experience.
On the design side, modular systems and design for assembly and disassembly approaches are enabling farms to be embedded within cities with greater adaptability and circular efficiency. Buildings in Canada and beyond are evolving from passive enclosures into living systems— structures that grow food, recycle resources, and adapt to changing needs. By embracing bio-based materials, lifecycle thinking, and integrated technologies (such as energy sharing between farm and building), cities can implement BIA solutions that minimize carbon footprints while maximizing productivity and resilience.
Case studies like Pasona Urban Farm, and Glasir illustrate the breadth of this potential. Pasona shows how indoor farming can transform workplace environments and culture. Glasir signals a future where modular farms serve as critical community infrastructure. Together, they show that BIA is not a one-size-fits-all model, but a versatile design approach that can be adapted across typologies and scales.
Equally critical are the human dimensions. Well-designed BIA projects enhance urban life—they strengthen social bonds, improve mental and physical health, support food literacy, and increase access to fresh, nutritious food. Drawing on principles from biophilic design and public health research, these projects deliver tangible outcomes— reduced stress, restored attention, healthier diets—while also enriching the urban fabric. But these benefits are not automatic.
Without intentional inclusion, BIA risks reinforcing existing
inequities. For BIA to be a tool for equitable development, it must be integrated into affordable housing, community-led initiatives, and inclusive food systems. Policies must guard against green gentrification and ensure benefits flow to long-standing residents—not just those who can afford to live in green buildings.
Looking ahead, Canada—particularly British Columbia—is well-positioned to lead in scaling BIA. With strong climate commitments, a culture of agricultural innovation, and rapidly urbanizing regions, Canadian cities can pioneer next-generation models. Picture a 2030 Vancouver where office towers include productive winter gardens; where school rooftops form a green patchwork of learning labs; where community greenhouses in Surrey or Burnaby supplement local food supply; and where new developments in Toronto or Calgary come with modular farms as standard amenities, just like gyms or bike storage. This vision aligns with multiple public goals—climate adaptation and mitigation, public health promotion, and economic development through green jobs and agricultural innovation.
Humans are at the heart of BIA projects. For these initiatives
to be successful, they must respond meaningfully to a range of social needs, including opportunities for social connection, access to beautiful and eye-catching spaces, education and training, and improved access to fresh, healthy food. When these needs are overlooked during project design and implementation, BIA risks failing to secure community buy-in, long-term support, and broader systems change for the sector, as a whole. This chapter outlines key human-centered design considerations essential to the planning and execution of inclusive, socially beneficial BIA projects.
The following insights summarize the main takeaways:
a. It is critical to implement BIA in ways that are inclusive of, and beneficial to, a diverse range of stakeholders, particularly communities that have been historically excluded from local food systems. Social and cultural responsiveness requires more than tokenistic or ‘checklist’ participation; it involves actively integrating community perspectives into decision-making and design. For example, developers should consider growing culturally important crops in addition to common leafy greens and herbs, especially in vertical farming systems where crop selection is often limited. Participatory planning processes and scenario modeling can help anticipate and mitigate unintended social impacts, fostering more equitable outcomes.
b. BIA projects can entail trade-offs between maximizing yield/production and fostering social cohesion. Highefficiency systems such as vertical farms or greenhouses may deliver significant food and environmental benefits but may fall short in creating accessible, engaging, or community-centered spaces. Project teams must evaluate how to balance multiple goals – food security, environmental performance, and social value – on a case-by-case basis, recognizing that over-optimization in one area may compromise others.
c. There is no universal template for BIA implementation.
Each project must be designed with attention to local contexts considering demographics, culture, economic opportunities (or lack thereof), and potential ecological benefits. This requires a blend of quantitative and qualitative research to assess anticipated outcomes and community priorities, engaging in modeling, workshops, and interviews. However, this place-based specificity must be balanced with the advantages of modular design. While modular systems enable faster deployment and potential replication, they risk overlooking the nuances of local need. The challenge lies in developing adaptable models that preserve both local relevance and the potential for scalable change across cities.
In conclusion, BIA is not just a design trend—it’s a paradigm shift. It reframes buildings as contributors to food security, wellness, and ecological performance. As this chapter has emphasized, the success of BIA depends on balancing the technical and the social. The most sophisticated hydroponic system means little if it excludes the community. Likewise, the most enthusiastic grassroots garden will struggle without thoughtful design integration. When both elements work in tandem, BIA becomes a vehicle for cities that are not only smart and sustainable, but resilient, inclusive, and nourishing.
The tools and precedents are already in place. What remains is to scale, refine, and embed these practices through coordinated action among architects, planners, policymakers, and communities. In doing so, we move closer to a future where buildings don’t just shelter life—they help sustain it. A future where cities truly function as living ecosystems.

Food for Thought Conclusions and Recommendations
Globally, more people live in cities than ever before. Urban areas, as predominant sites of resource consumption and waste, require further planning to reinforce more circular material and energy flows. At the same time, our food systems are radically restructuring. The guarantee of consistent access to low-cost, fresh and healthy food products provided by global supply chains is waning with geopolitical and trade uncertainties as well as climate change.
BIA, as has been described through this report, is a unique opportunity to address some of these concerns and further these goals. The integration of food production into cities, in its myriad of forms, can feed people on underutilized lands, while simultaneously contributing to better biodiversity, economy, and climate adaptation as well as mitigation-related outcomes. While BIA is not the only solution to the grand challenges described above, its implementation is a ‘no brainer’ for sustainable city development in the 21st century. There is incredible opportunity to integrate circular design principles into BIA projects as they are applied in cities. Farms require water, energy, and nutrients, among other forms of built infrastructure, that may be provided from local resource streams. Vice-versa, farms generate waste that may be valorized and/or integrated into commercial, residential, industrial, and institutional contexts.
This report assesses the feasibility of implementing BuildingIntegrated Agriculture (BIA) projects and maximizing their potential for resource circularity. Prepared by a multidisciplinary team—including architects, engineers, academics, agri-food business leaders, planners, farmers, and engaged community members—it lays the groundwork for the practical integration of farming in, on, and around a variety of building typologies.
The follow summary presents key findings across several areas: BIA policy frameworks, market analysis, ecological and environmental impacts, technical systems and design guidelines, and human experience. These are examined in relation to hybrid BIA models, place-based research needs, and the careful negotiation of trade-offs on a project-byproject basis.
Cross Cutting Themes
Building Integrated Agriculture (BIA) holds transformative potential for advancing sustainable, resilient, and socially inclusive food systems in urban environments. Yet its successful implementation hinges on thoughtful attention to cross-cutting themes that extend across policy, market, technical, social, and ecological domains.
Hybridized Models, Comprehensive Green Infrastructure
No single BIA model can meet the full range of social, environmental, and economic goals. In this report, the researchers have explored three distinct BIA forms and opportunities including vertical farms, greenhouse cultivation, and soil-based practices. Hybrid systems that combine elements from each of these BIA types within single projects offer the flexibility needed to optimize for contextspecific challenges. Further, these designs can integrate multiple modular waste-to-resource technologies (e.g., composting, greywater reuse, nutrient recovery), optimizing resource use and application.
The next phase of this project will explore possibilities for hybrid systems design. Rather than treating vertical farms, soil-based systems, or greenhouses in isolation, the research team will explore opportunities for their on-site integration by mapping building-through-city-scale modeling.
A Need for Systems Thinking
BIA initiatives inevitably involve tradeoffs. Some key tradeoffs described through this work are between maximizing yields and minimizing energy use; between rapid deployment and tailored, community-responsive design; between high-tech efficiency and social connection. For instance, highly productive vertical farms may reduce food miles and increase yield, but risk overlooking social outcomes like community engagement or public education. Addressing these tradeoffs requires an integrative design process that explicitly weighs multiple objectives and accepts that no single project can “do it all.” Flexibility, transparency, and iterative evaluation are key. Additionally, systems thinking – research that aims to anticipate and respond to conflicting strategies, goals, and outcomes for projects spanning social, environmental and economic domains (like BIA) is required for successful project planning and follow-through. Understanding the interplay between BIA system components (farms, local businesses) across multiple scales (from building to neighbourhood and entire city) is required for optimized project design.
Decision-support tools that will be developed from this initial phase of research will incorporate scenario and modelling testing to identify potential unintended challenges and opportunities fostered through BIA. Including the ability for project developers to test scenarios and run customizable simulations will stimulate critical thinking regarding project outcomes.
Grounding Projects in Place-Based and Participatory Approaches
BIA systems are deeply shaped by local conditions—climate, building typologies, energy infrastructure, community needs, and market dynamics all affect project feasibility and design. Successful projects center these variables, using participatory planning, scenario modeling, and stakeholder consultation to identify meaningful goals and avoid unintended harms. Cultural responsiveness, such as growing heritage or culturally important crops, further reinforces the social legitimacy and community value of BIA initiatives. In this context, qualitative and quantitative assessments play a vital role in shaping equitable and locally relevant designs. Further, recognizing that different projects will have diverse (and possibly contradictory goals) is required for responsive project implementation.
A community of practice in Vancouver, British Columbia has been mobilized around this initial phase of research. Future work will engage this community of architects, researchers, local government, engineers, companies, farmers, as well as business and community leaders to identify project considerations on case-by-case bases, and to ensure future tool designs respond to diverse user contexts. In this vein, Vancouver may become a living case study for BIA project design and implementation from which other cities may learn and adapt.
From Pilot to Scale: Balancing Modularity and Customization
Scaling BIA requires reconciling the tension between placespecific customization and the efficiencies of modular design. While standardized models can support replication and reduce costs, they must also be adaptable enough to reflect local needs and capacities. Strategic frameworks that allow for both customization and interoperability will be essential to moving BIA from isolated pilots to broader systems change.
Next phases of BIA technology development will explore opportunities for ‘plug-and-play’ as well as customizable solutions. Consulting with entrepreneurs and farmers who operate and/or develop BIA systems will be required to better understand the interplay between each form of farming system.
Limitations of BIA Identified through the Work
There are several challenges facing UA and BIA that deserve attention. Food safety is a key challenge, as urban food production, particularly in uncontrolled environments, using soil-based substrates, or incorporating urban waste in farming along with urban air pollution, raises contamination risks compared to the rigorous quality checks undergone for conventional food systems (Buscaroli, et al., 2021).
Another challenge is gentrification, where UA and BIA projects intended to enhance community amenities and neighbourhood features may inadvertently increase property values and displace residents (Hawes, Gounaridis, & Newell, 2022).
Finally, the extent to which food production in the built environment can contribute to food security is uncertain. Competing land uses, economies of scale, high energy requirements, yield variability, crop type limitations, and labour constraints challenge the assertion that BIA can replace a percentage of imported food into cities (Lal, 2020). For these reasons, it is important to acknowledge that UA and BIA, while promising innovations, are not a panacea for urban food system issues. Nevertheless, they can play a role in sustainably developing cities, and deeper investigations are necessary to realize their full potential and mitigate potential challenges.

Appendix A: Publication List
A carbon-centric evaluation framework for building-integrated agriculture: A comparison of three farm types and building standards. Front. Sustain. Food Syst. , 18 March 2025, Sec. Urban Agriculture. Volume 9 - 2025 | https:// doi.org/10.3389/fsufs.2025.1533433
Policy Mechanisms for Food Security and Waste Reduction in Urban Environments: An Analysis of Building-Integrated Agriculture Policies and Best Practices. Journal of Architectural Engineering (under review)
Social Entrepreneurship and Building Integrated Agriculture – A Growing Sector. Journal ‘Business Strategy and the Environment’ (Publication in progress)
Appendix B: Sources
Agriculture and Agri-Food Canada., 2017. A National Ecological Framework for Canada, s.l.: Government of Canada.
Al-Kodmany, K., 2018. The Vertical Farm: A Review of Developments and Implications for the Vertical City. Buildings, 8(2), p. 24.
Al-Qubati, Abdulhakeem, Lulu Zhang, and Matthias Forkel. 2024. “Urban and peri-urban agriculture under climate change: A review on carbon emissions and sequestration.” Sustainable Cities and Society.
Appolloni, E. et al., 2021. The global rise of urban rooftop agriculture: A review of worldwide cases. Journal of Cleaner Production, Volume 296, p. 126556.
Barbara Clucas, I. D. A. M.-P., 2018. A systematic review of the relationship between urban agriculture and biodiversity. Spring Nature, p. 9.
Bartlett, I., 2017. Brooklyn Grange Rooftop at Brooklyn. [Online] Available at: https://upload.wikimedia.org/wikipedia/commons/d/de/Brooklyn_Grange_ Rooftop_at_Brooklyn_Navy_Yard_with_View_of_Manhattan.jpg. [Accessed 07 09 2024].
Bauman, Chadd, and Kyle Born, interview by Mohamed Imam. 2024. Market analysis of Urban Mushroom Farming (March).
Beghi, Roberto, Valentina Giovenzana, Alessio Tugnolo, Domenico Pessina, and Riccardo Gudetti. 2020. “Evaluation of energy requirements of an industrial scale plant for the cultivation of white button mushroom (Agaricus bisporus).” Journal of Agricultural Engineering 57–63.
Béné, Christophe. 2020. “Resilience of local food systems and links to food security - A review of some important concepts in the context of COVID-19 and other shocks.” Food Sec. 12 805-822.
Benis, K., R. Gashgari, A. Alsaati, and C. Reinhart. 2018. “Urban Foodprints (UF) – Establishing baseline scenarios for the sustainability assessment of high-yield urban agriculture.” Int. J. of Design & Nature and Ecodynamics 349-360.
Bergeron, C., 2021. Palais des congrès de Montréal. [Online] Available at: https://www.flickr.com/photos/palais_des_congrs_de_montral_-_Montréal_ convention_center/51207776197 [Accessed 07 09 2024].
Bhatt, V. & Farah, L. M., 2016. Cultivating Montréal: A Brief History of Citizens and Institutions Integrating Urban Agriculture in the City. Urban Agriculture & Regional Food Systems, 1(1).
Blay-Palmer, A. et al., 2018. Validating the City Region Food System Approach: Enacting Inclusive, Transformational City Region Food Systems. Sustainability, 10(5), p. 1680.
Blom, T, A Jenkins, and A van den Dobbelsteen. 2023. “Synergetic integration of vertical farms and buildings: reducing the use of energy, water, and nutrients.” Frontiers in Sustainable Food Systems.
Brenda B.Lin, S. M. S. J., 2015. The future of urban agriculture and biodiversity-ecosystem services: Callenges and next steps. Basic and Applied Ecology.
Buscaroli, E. et al., 2021. Reviewing chemical and biological risks in urban agriculture: A comprehensive framework for a food safety assessment of city region food systems. Food Control, Volume 126, p. 108085.
Caffrey, K R, and M W Veal. 2013. “Conducting an Agricultural Life Cycle Assessment: Challenges and Perspectives.” The Scientific World Journal 472431.
Caldeira, C, V De Laurentiis, S Corrado, F van Holsteijn, and S Sala. 2019. “Quantification of food waste per product group along the food supply chain in the European Union: a mass flow analysis.” Resources, Conservation and Recycling 479-488.
Capital Growth, 2024. Capital Growth. [Online]
Available at: https://www.capitalgrowth.org/what_we_do/
CDFA, 2023. Urban Agriculture Grant Program Recipients. [Online]
Available at: https://cafarmtofork.cdfa.ca.gov/docs/urbanag/2023_ca_urban_agriculture_ grant_program_award_recipients_recommended.pdf [Accessed 06 09 2024].
Chowdhury, Hribhu, and Asiabanpour Bahram. 2024. “A Circular Economy Integration Approach into Vertical Farming with Computer-Based Simulation Model for Resource Optimization and Waste Reduction.” Journal of Cleaner Production 143256.
City of Calgary, 2012. Services and support for. [Online]
Available at: https://www.calgary.ca/environment/policies/food-action-plan.html
City of Calgary, 2013. Calgary EATS!. [Online]
Available at: https://www.calgary.ca/environment/policies/food-action-plan.html
City of Copenhagen, 2019. The City of Copenhagen’s Food Strategy. [Online]
Available at: https://maaltider.kk.dk/sites/default/files/2022-06/The%20City%20of%20 Copenhagen%20Food%20Strategy%202019.pdf
City of San José, 2011. Envision San José 2040. [Online]
Available at: https://www.sanjoseca.gov/your-government/departments-offices/planningbuilding-code-enforcement/planning-division/citywide-planning/envision-san-jos2040-general-plan [Accessed 06 09 2024].
City of San Jose, n.d.. Urban Agriculture Incentive Zone (UAIZ) Program: Case study of Valley Verde. [Online]
Available at: https://www.sanjoseca.gov/home/ showpublisheddocument/24813/636690013260770000 [Accessed 12 09 2024].
City of Toronto, 2022. Baselining for a Circular Toronto. [Online]
Available at: https://www.toronto.ca/wp-content/uploads/2022/06/8ed3-Baselining-for-ACircular-Toronto-Highlights-FINAL.pdf
City of Toronto, 2024. The City of Toronto Green Roof Bylaw. [Online]
Available at: https://www.toronto.ca/city-government/planning-development/ official-plan-guidelines/green-roofs/green-roof-bylaw/
City of Vancouver, 2024. guidelines.vancouver.ca. [Online]
Available at: https://guidelines.vancouver.ca/bulletins/bulletin-sustainable-largedevelopments.pdf
City of Vancouver, 2024. REZONING POLICY FOR SUSTAINABLE LARGE DEVELOPMENTS. [Online] Available at: https://guidelines.vancouver.ca/policy-rezoning-sustainable-largedevelopments.pdf
City of Vancouver, 2024. Vancouver Food Strategy. [Online]
Available at: https://vancouver.ca/files/cov/Van_Food_Charter.pdf
City of Vancouver, 2024. Zero emissions buildings, Building catalyst tools. [Online] Available at: https://vancouver.ca/green-vancouver/zero-emissions-buildings-tools.aspx [Accessed 07 09 2024].
Clapp, J., 2014. Food security and food sovereignty: Getting past the binary. Dialogues in Human Geography, 4(2), pp. 206-211.
COPENHAGEN CLIMATE ADAPTATION PLAN , 2011. COPENHAGEN CLIMATE ADAPTATION PLAN. [Online]
Available at: https://en.klimatilpasning.dk/media/568851/copenhagen_adaption_plan.pdf
CoV bylaws, 2024. I-1 District Schedule. [Online]
Available at: https://bylaws.vancouver.ca/zoning/zoning-by-law-district-schedule-i-1.pdf [Accessed 07 09 2024].
CoV bylaws, 2024. Section 4 Off-street Parking Space Regulations. [Online] Available at: https://bylaws.vancouver.ca/parking/Sec04.pdf [Accessed 07 09 2024].
CoV bylaws, 2024. Section 5 Off-Street Loading Space Regulations. [Online] Available at: https://bylaws.vancouver.ca/parking/sec05.pdf [Accessed 07 09 2024].
CoV bylaws, 2024. Section 6 Off-street Bicycle Space Regulations. [Online] Available at: https://bylaws.vancouver.ca/parking/sec06.pdf [Accessed 07 09 2024].
Crippa, M. et al., 2021. Food systems are responsible for a third of global anthropogenic GHG emissions. s.l.:Nature Food.
Crowe, S. et al., 2011. The case study approach. BMC Medical Research Methodology, 11(1), p. 100.
D.L. Evans, N. F. C. H. S. K. L. L. B. M. J. D., 2022. Ecosystem service delivery by urban agriculture and green infrastructure – a systematic review. Ecosystem Services, Volume 54.
David Suzuki Foundation, 2025. [Online] Available at: https://davidsuzuki.org/take-action/act-locally/butterflyway/ Desjardins, E., MacRae, R. & Schumilas, T., 2010. Linking future population food requirements for health with local production in Waterloo Region, Canada. Agriculture and Human Values, 27(2), pp. 129-140.
Despommier, D., 2013. Farming up the city: the rise of urban vertical farms. Trends in Biotechnology, 31(7), pp. 388-389.
Diehl, J. A. et al., 2020. Feeding cities: Singapore’s approach to land use planning for urban agriculture. Global Food Security, Volume 26, p. 100377.
Dorr, Erica, Benjamin Goldstein, Arpad Horvath, Christine Aubry, and Benoit Gabrielle. 2021. “Environmental impacts and resource use of urban agriculture: a systematic review and meta-analysis.” Environmental Research Letters, 28.
Dorr, Sebastian, and Mehdi Raissi. 2017. “Proper selection of substrates and crops enhances the sustainability of Paris rooftop garden.” Agronomy for Sustainable Development.
Dr.Philomena George, N. G., 2016. Hydroponics - (soilless cultivation of plants) for biodiversity conservation. International Journal of Modern Trends in Engineering and Science , 3(6), p. 97.
Dring, C., Newman, L. & Wittman, H., 2023. Assessing governability of agricultural systems: Municipal agricultural planning in Metro Vancouver, Canada. Frontiers in Sustainable Food Systems, Volume 6.
EDGAR-FOOD, 2021. A global emission inventory of GHGs and air pollutants from the food systems. [Online]
Available at: https://edgar.jrc.ec.europa.eu/edgar_food [Accessed 06 09 2024].
Emirates Media Centre, 2024. Emirates Flight Catering Opens World’s Largest Vertical Farm in Dubai. [Online] Available at: https://www.emirates.com/media-centre/ emirates-flight-catering-opens-worlds-largest-vertical-farm-in-dubai/
FAOSTAT. 2024. Emissions totals. Accessed 10 24, 2024. https://www.fao.org/faostat/ en/?#data/GT.
Fisher, Stephen. 2014. A case study of urban agriculture : a life cycle assessment of vegetable production. Denver, CO: University.
Food tech valley, 2022. FOOD TECH VALLEY ECOSYSTEM. [Online] Available at: https://www.foodtechvalley.ae/ [Accessed 04 09 2024].
Forchino, A A, H Lourguioui, D Brigolin, and R Pastres. 2017. “Aquaponics and sustainability: The comparison of two different aquaponic techniques using the Life Cycle Assessment (LCA).” Aquacultural Engineering 80-88.
Garnett, T., 2011. Where are the best opportunities for reducing greenhouse gas emissions in the food system (including the food chain)?. Food Policy, Volume 36, pp. S23-S32.
Garnett, T., 2014. Three Perspectives on Sustainable Food Security: Efficiency, Demand Restraint, Food System Transformation. What Role for Life Cycle Assessment?. Journal of Cleaner Production, Volume 73, p. 10–18.
Gentry, M. 2019. “Local Heat, Local Food: Integrating Vertical Hydroponic Farming with District Heating in Sweden.” Energy.
Gerring, J., 2016. Case Study Research: Principles and Practices. Cambridge University Press.
Good Leaf, 2019. Go West, Good Leaf!. [Online] Available at: https://www.goodleaffarms.com/news/calgary-farm-investment [Accessed 06 09 2024].
Goodman, W. & Minner, J., 2019. Will the urban agricultural revolution be vertical and soilless? A case study of controlled environment agriculture in New York City. Land Use Policy, Volume 83, pp. 160-173.
Greater London Authority, 2024. Good Growth Fund supported projects. [Online] Available at: https://www.london.gov.uk/programmes-strategies/shaping-localplaces/funding-opportunities/good-growth-fund-supporting-regeneration-london/ good-growth-fund-supported-projects?ac-54464=54463&ac-54472=54470
Green, R. N., & Klinka, K, 1994. A Field Guide for Site Identification and Interpretation for the Vancouver Forest Region., s.l.: Research Branch, Ministry of Forests.
Greeneration, 2024. Cultivating the Future: Vertical Farming in the UAE. [Online] Available at: https://greeneration.ae/blog/vertical_farming_uae [Accessed 06 September 2024].
Glaros, A, R Newell, A Benyam, S Pizzirani, and L L Newman. 2024. “Vertical Agriculture’s Potential Implications for Food System Resilience: Outcomes of focus groups in the Fraser Valley, British Columbia.” Ecology and Society 14547-290112.
Goldstein, Benjamin, Michael Hauschild, John Fernández, and Morten Birkved. 2016. “Urban versus conventional agriculture, taxonomy of resource profiles: a review.” Agronomy for Sustainable Development.
Haase, D., 2022. The Effects of Greening Cities on Climate Change Mitigation and Adaptation. In: M. Lackner, B. Sajjadi & W. Chen, eds. Handbook of Climate Change Mitigation and Adaptation. Cham: Springer International Publishing, pp. 2055-2073.
Hawes, Jason, Benjamin Goldstein, Joshua Newell, Erica Dorr, Silvio Caputo, Runrid Fox-Kämper, Baptiste Grard, Rositsa Ilieva, Agnès Fargue-Lelièvre, and Lidia Poniży. 2024. “Comparing the carbon footprints of urban and conventional agriculture.” Nature Cities 164-173.
H. Royer, J. Y. N. B., 2023. Urban agriculture and its biodiversity: What is it and what lives in it?. Agriculture Ecosystmes & Environment, Volume 364.
Harada, Y. et al., 2018. Hydrology of the Brooklyn Grange, an urban rooftop farm. Urban Ecosystems, 21(4), pp. 673-689.
Hawes, J. K., Gounaridis, D. & Newell, J. P., 2022. Does urban agriculture lead to gentrification?. Landscape and Urban Planning, Volume 225, p. 104447.
Horst, M., 2024. The Intersection of Planning, Urban Agriculture, and Food Justice: A Review of the Literature. In: N. McClintock, et al. eds. Planning for Equitable Urban Agriculture in the United States: Future Directions for a New Ethic in City Building. Cham: Springer International Publishing, pp. 89-120.
Imhoff, T. R. a. M., 2003. Biodiversity, Urban Areas, and Agriculture: Locating Priority Ecoregions for conservation. Conservation Ecology, 8(2), p. 16.
Invasive Species Centre, 2025. Invasive Species Centre. [Online] Available at: https://www.invasivespeciescentre.ca/
Invasive Species Council of BC, 2025. Invasive Species Council of British Columbia. [Online] Available at: https://bcinvasives.ca/
Issac, J. et al., 2022. Integrated Sustainability Planning and Local Food Systems: Examining Areas of and Gaps in Food Systems Integration in Community Sustainability Plans for Municipalities across British Columbia. Sustainability, 14(11), p. 6724.
Joshua E. Arnold, M. E. a. K. M. D., 2019. Local and Landscape Effects to Biological Controls in Urban Agriculture—A Review. Insects.
Kalantari, F, O Mohd tahir, L Mahmoudi, and S Kaltantari. 2017. “A Review of Vertical Farming Technology: A Guide for Implementation of Building Integrated Agriculture in Cities.” Advanced Engineering Forum 76-91.
Kellert, S. R., Heerwagen, J., & Mador, M. (2013). Biophilic Design: The Theory, Science and Practice of Bringing Buildings to Life. New Jersey: John Wiley & Sons, Inc.
Kimmerer, R. W., 2013. Braiding Sweetgrass. s.l.:Milkweed Editions.
Klimakvarter, n.d.. The Climate Resilient Neighbourhood Østerbro. [Online]
Available at: https://klimakvarter.dk/en/om/ [Accessed 06 09 2024].
Kulak, M, A Graves, and J Chatterton. 2013. “Reducing greenhouse gas emissions with urban agriculture: A Life Cycle Assessment perspective.” Landscape and Urban Planning 68-78.
La Rosa, D., Barbarossa, L., Privitera, R. & Martinico, F., 2014. Agriculture and the city: A method for sustainable planning of new forms of agriculture in urban contexts. Land Use Policy, Volume 41, pp. 290-303.
LA Urban Farms, 2020. Changing the landscape of our cities. [Online] Available at: https://laurbanfarms.com/urban-farms/ [Accessed 07 09 2024].
Labby, B., 2023. Large-scale indoor farming takes root in Calgary industrial park, s.l.: CBC. Lal, R., 2020. Home gardening and urban agriculture for advancing food and nutritional security in response to the COVID-19 pandemic. Food Security, 12(4), pp. 871-876.
Loboguerrero, A. et al., 2019. Food and Earth Systems: Priorities for Climate Change Adaptation and Mitigation for Agriculture and Food Systems. Sustainability, 11(5), p. 1372.
London Food Board, 2024. London Food Board. [Online]
Available at: https://www.london.gov.uk/programmes-strategies/ communities-and-social-justice/london-food-strategy/london-food-board
London Food Strategy, 2018. The London Plan 2021. [Online]
Available at: https://www.london.gov.uk/programmes-strategies/ communities-and-social-justice/london-food-strategy
Marston, J. & Burwood-Taylor, L., 2023. BREAKING: Intelligent Growth Solutions to power UAE ‘GigaFarm’ capable of replacing 1% of imports. [Online]
Available at: https://agfundernews.com/breaking-intelligent-growth-solutions-to-poweruae-gigafarm-capable-of-replacing-1-of-imports
Manríquez-Altamirano, A, J Sierra-Pérez, P Muñoz, and X Gabarrell. 2020. “Analysis of urban agriculture solid waste in the frame of circular economy: Case study of tomato crop in integrated rooftop greenhouse.” Science of The Total Environment 139375.
martin-thomsen, h., 2015. Stedsans on ØsterGro. [Online]
Available at: https://www.flickr.com/photos/henningthomsen/19600604016
[Accessed 07 09 2024].
Martin, Michael , Sofia Poulikidou, and Elvira Molin. 2019. “Exploring the Environmental Performance of Urban Symbiosis for Vertical Hydroponic Farming.” Sustainability 11, 6724. Martin, Michael, Maria J. Bustamante, Ilaria Zauli, and Francesco Orsini. 2024.
“Environmental life cycle assessment of an on-site modular cabinet vertical farm.” ront. Sustain. Food Syst. 8:1403580.
Martin, Michael, Sofia Poulikidou, and Elvira Molin. 2019. “Exploring the Environmental Performance of Urban Symbiosis for Vertical Hydroponic Farming.” Sustainability 11, 6724.
Mayor’s Office of Climate and Sustainability, 2019. Climate Mobilization Act. [Online]
Available at: https://climate.cityofnewyork.us/subtopics/buildings/#:~:text=The%20 centerpiece%20of%20the%20Climate,reduction%20targets%20beginning%20in%202024.
McClintock, N., 2021. Nullius no more? Valorising vacancy through urban agriculture in the settler-colonial ‘green city’. In: C. O’Callaghan & C. D. Feliciantonio, eds. The New Urban Ruins. UK: Bristol University Press, pp. 91-108.
Mehrabi, Z., 2023. Sims-style ‘digital twin’ models can tell us if food systems will weather crises. Nature, 615(7951), pp. 189-189.
Metro Vancouver, 2023. Overview of First Nations in the Metro Vancouver Region, City of Vancouver: Metro Vancouver Indigenous Relations.
Mok, H F, V Williamson, J Grove, K Burry, F Barker, and A Hamilton. 2014. “Strawberry fields forever? Urban agriculture in developed countries: a review.” Agronomy for Sustainable Development 21-43.
Molari, M, L Dominici, and E Comino. 2024. “Experimenting growing media through local bio-resources valorisation: A design-oriented approach for living walls.” Journal of Cleaner Production 140446.
Montréal, 2021a. Stratégie d’Agriculture Urbaine. [Online]
Available at: https://Montréal.ca/en/articles/ urban-agriculture-strategy-adapting-to-climate-change-18674
Montréal, 2021b. Montréal Economic Recovery Plan. [Online]
Available at: https://Montréal.ca/en/articles/2021-economic-recovery-plan-8767 Montréal, 2021c. Subvention pour les bâtiments industriels durables. [Online]
Available at: https://Montréal.ca/programmes/ subvention-pour-les-batiments-industriels-durables
Muñoz-Liesa, J. et al., 2020. Quantifying energy symbiosis of building-integrated agriculture in a mediterranean rooftop greenhouse. Renewable Energy, Volume 156, pp. 696-709.
Newman, L. et al., 2023. Agriculture for the Anthropocene: novel applications of technology and the future of food. Food Security.
North American Bird Conservation Initiative Canada (NABCIC), 2012. The State of Canada’s Birds, 2012., Canada: Environment Canada.
NYC Food Policy, 2023. Food Forward NYC: A 10-Year Food Policy Plan. [Online]
Available at: https://www.nyc.gov/site/foodpolicy/reports-and-data/food-forward.page Organiclea, 2017. Market Garden City. [Online]
Available at: https://www.organiclea.org.uk/2020/08/hawkwood-site-design/ [Accessed 05 09 2024].
Pact, Milan Urban Food Policy. 2024. About. Accessed October 2024. https://www. milanurbanfoodpolicypact.org/#.
Paris, 2022. Agriculture urbaine : « Paris Sème » soutient 13 nouveaux projets, pour sa 2e saison. [Online]
Available at: https://www.paris.fr/pages/ agriculture-urbaine-paris-seme-soutient-13-nouveaux-projets-22292
Paris, 2024. Paris Fertile : se former à l’agriculture et l’alimentation durables. [Online]
Available at: https://www.paris.fr/pages/paris-fertile-connaitre-se-former-se-faireaccompagner-vers-les-metiers-de-l-agriculture-durable-19772
Paucek, Ivan, Emanuele Durante, Giuseppina Pennisi, and Stefania Quaini. 2023. “A methodological tool for sustainability and feasibility assessment of vertical farming with artificial lighting in Africa.” scientificreports.
Penn State. “Storage Time And Temperature Effects Nutrients In Spinach.” ScienceDaily. www. sciencedaily.com/releases/2005/03/050323124809.htm (accessed May 26, 2025).
Perkins&Will, 2023. 1040-1080 Barclay Street East. [Online]
Available at: https://vancouver.ca/files/cov/1060-barclay-st-appendix-d.pdf [Accessed 07 09 2024].
Pollinator Partnership Canada, 2016. Selecting Plants for Pollinators: A Regional Guide for Farmers, Land Managers, and Gardeners in the Lower Mainland, s.l.: Pollinator Partnership Canada.
Poore, J. & Nemecek, T., 2018. Reducing food’s environmental impacts through producers and consumers. Science, 360(6392), pp. 987-992.
Research Branch, Ministry of Forests, 2025. How BEC Works., s.l.: Forest Service British Columbia.
Roger S. Ulrich ,View Through a Window May Influence Recovery from Surgery. Science224,420-421(1984).DOI:10.1126/science.6143402
Saha, M. & Eckelman, M., 2017. Growing fresh fruits and vegetables in an urban landscape: A geospatial assessment of ground level and rooftop urban agriculture potential in Boston, USA. Landscape and Urban Planning, Volume 165, pp. 130-141.
Sanjuan-Delmás, David, Pere Llorach-Massana, Ana Nadal, Mireia Ercilla-Montserrat, Pere Muñoz, Juan Ignacio Montero, Alejandro Josa, Xavier Gabarrell, and Joan Rieradevall. 2018. “Environmental assessment of an integrated rooftop greenhouse for food production in cities.” Journal of Cleaner Production 326-337.
Shaw, B. J., 2017. Case 12 - ØsterGRO Rooftop Farm – Community Supported Agriculture in the Middle of Copenhagen. In: Part II - Landscape Stewardship on the Ground. s.l.:Cambridge University Press.
SHMA, n.d.. Landscaping for Urban Spaces and Highrise. [Online] Available at: https://shmadesigns.com/knowledge/research/landscaping-for-urban-spacesand-high-rises-lush/ [Accessed 06 09 2024].
Singapore Food Agency, 2024. 30 by 30. [Online] Available at: https://www.ourfoodfuture.gov.sg/30by30/ [Accessed 06 09 2024].
Smith, J. P., Meerow, S. & Turner, B. L., 2021. Planning urban community gardens strategically through multicriteria decision analysis. Urban Forestry & Urban Greening, Volume 58, p. 126897.
space2place design inc. & Kerr Wood Leidal, 2023. Watershed Enhancement Opportunities Study: Still Creek, City of Vancouver: City of Vancouver.
Specht, Kathrin, Felix Zoll, Henrike Schümann, Julia Bela, Julia Kachel, and Marcel Robischon. 2019. “How Will We Eat and Produce in the Cities of the Future? From Edible Insects to Vertical Farming—A Study on the Perception and Acceptability of New Approaches.”
Sustainability 2019, 11.
Specht, Kathrin, Rosemarie Siebert, Susanne Thomaier, Ulf B. Freisinger, Magdalena Sawicka, Axel Dierich, Dietrich Henckel, and Maria Busse. 2015. “Zero-Acreage Farming in the City of Berlin: An Aggregated Stakeholder Perspective on Potential Benefits and Challenges.”
Sustainability 2015, 7 4511-4523.
Specht, K. & Sanyé-Mengual, E., 2017. Risks in urban rooftop agriculture: Assessing stakeholders’ perceptions to ensure efficient policymaking. Environmental Science & Policy, Volume 69, pp. 13-21.
Specht, K. et al., 2015. Zero-Acreage Farming in the City of Berlin: An Aggregated Stakeholder Perspective on Potential Benefits and Challenges. Sustainability, 7(4), pp. 4511-4523.
Technology, U. A. E. M. o. I. a. A., 2024. Emirates Sustainable Agriculture label: A comprehensive national framework to improve food security, drive major investments. [Online]
Available at: https://moiat.gov.ae/en/media-center/blogs/2024/02/15/emiratessustainable-agriculture-label-a-comprehensive-national-framework-to-improvefood-security-d
[Accessed 06 September 2024].
Thomas, Mary Adam. 2022. The PAE building: Developer-Led, Nature-Inspired. Seattle,: Ecotone Publishing.
The London Plan, 2021. The London Plan 2021. [Online]
Available at: https://www.london.gov.uk/programmes-strategies/planning/londonplan/new-london-plan/london-plan-2021#:~:text=The%20London%20Plan%202021%20 is,Mayor’s%20vision%20for%20Good%20Growth
The New York City Council, 2011. Int. No. 615-A. [Online]
Available at: https://www.nyc.gov/assets/foodpolicy/downloads/pdf/LL-52Legislation-Text.pdf
Tong, Z., Whitlow, T. H., Landers, A. & Flanner, B., 2016. A case study of air quality above an urban roof top vegetable farm. Environmental Pollution, Volume 208, pp. 256-260.
Toronto Food Policy Council, 2012. GrowTO. [Online]
Available at: https://www.toronto.ca/legdocs/mmis/2012/pe/bgrd/backgroundfile-51558.pdf
Toronto Metropolitan University, 2019. Urban Farm. [Online]
Available at: https://www.torontomu.ca/sciencerendezvous/activity-booths/urbanfarm/ [Accessed 06 09 2024].
TRCA, 2024. Urban Agriculture. [Online]
Available at: https://trca.ca/conservation/urban-agriculture/ [Accessed 06 09 2024].
Turner, R. J. W., & Clague, J. J, 1997. GeoMap Vancouver: Geological Map of the Vancouver Metropolitan Area, s.l.: Geological Survey of Canada Open File 3511.
Usman, M., Khan, A. Z., Malik, S., Xiong, W., Lv, Y., Zhang, S., Zhao, A., Solovchenko, A. E., Alam, M. A., Alessa, A. H., Mehmood, M. A., & Xu, J. (2024). A novel integrated approach employing Desertifilum tharense BERC-3 for efficient wastewater valorization and recycling for developing peri-urban algae farming system. Chemosphere, 361, 142527. https://doi. org/10.1016/j.chemosphere.2024.142527
Vaismoradi, M., Turunen, H. & Bondas, T., 2013. Content analysis and thematic analysis: Implications for conducting a qualitative descriptive study. Nursing & Health Sciences, 15(3), pp. 398-405.
van Delden, S. H. et al., 2021. Current status and future challenges in implementing and upscaling vertical farming systems. Nature Food, 2(12), pp. 944-956.
Vancouver Bird Advisory Committee, 2015. Vancouver Bird Strategy, City of Vancouver: City of Vancouver.
Vancouver Board of Parks and Recreation, 2016. Biodiversity Strategy, Vancouver BC: Vancouver Board of Parks and Recreation.
Vancouver, C. o., 2022. 2022 Community Services and Other Social Grants. [Online] Available at: https://council.vancouver.ca/20220719/documents/r1.pdf [Accessed 10 09 2024].
Ville de Paris, 2016. Parisculteurs in a nutshell. [Online] Available at: https://www.parisculteurs.paris/en/about/parisculteurs-in-a-nutshell/ [Accessed 07 09 2024].
Ville de Paris, 2018. Paris Climate Action Plan. [Online] Available at: https://cdn.paris.fr/paris/2020/11/23/a10afc931be2124e21e39a1624132724.pdf
World Wildlife Fund, 2021. A warning sign: where biodiversity loss is happening around the world. World Wildlife Magazine.
Government of British Columbia. (2021). Forest Management Strategies for Creating Carbon Offsets. Retrieved from https://www2.gov.bc.ca/assets/gov/environment/naturalresource-stewardship/nrs-climate-change/applied-science/262362_attachment_1_-_forest_ management_strategies_for_offsets_march_2021.pdf#:~:text=Permanence%20Forest%20 carbon%20sinks%20and%20avoided%20emis
WBDG. 2024. Green Building Standards and Certification Systems. Accessed 01 11, 2025. https://www.wbdg.org/resources/green-building-standards-and-certification-systems.
Appendix C: Supplementary Data
Table 40: Case study analysis and compiled dataset of BIA projects. This dataset supports the analysis presented in Chapter V, Pillar 1: Data-Driven Insights.
Growing Strategy Growing System Growing Crop
Table 41: Life Cycle Assessment (LCA) data set compiled per square meter. This dataset supports the analysis presented in Chapter V, Pillar 2: Metric Pairing-Bridging Two Industries.
Table 42: Life Cycle Assessment (LCA) data set compiled per kg crop. This dataset supports the analysis presented in Chapter V, Pillar 2: Metric Pairing-Bridging Two Industries.
Table 43: Compiled data from market studies reviewed in this research. This dataset supports the analysis presented in Chapter III, Economic Feasibility: BIA Performance Across 8 Cities.
Calgary
Refer to Table 10 for a detailed CAPEX breakdown for the GH model. Context-specific data is provided below. For VF CAPEX, see Table 12. It is noteworthy that VF requires higher lighting costs, while GH needs heating investments. Additionally, VF has a lower total CAPEX for cherry tomatoes, but GH is more cost-efficient for basil and lettuce.
CAPEX data for greenhouse energy requirements in Calgary, AB.
Cost breakdown per crop in Calgary, AB.
Crop economics and financial performance in Calgary, AB.
Basil High (2.35-year ROIC)
High (4.06-year ROIC)
Lettuce Very Low (69.29-year ROIC) Not Viable
Cherry Tomatoes Not Viable Not Viable
Crop specific feasibility and market strategy in Calgary, AB.
Large-scale distribution is required. Risk of market oversupply.
High labour costs require premium pricing to be profitable.
High light costs, long growth cycle, unoptimized indoor varieties.
Focus on wholesale and retail mix. GH has lower OpEx, but IVF allows for year-round production.
Seasonal GH production (warmer months) is best. IVF is high-risk unless sold at a premium.
Avoid IVF. GH may work in warmer climates but not Calgary.
Toronto
Refer to Table 10 for a detailed CAPEX breakdown for the GH model. Context-specific data is provided below. For VF CAPEX, see Table 12. It is noteworthy that VF requires higher lighting costs, while GH needs heating investments. Additionally, VF has a lower total CAPEX for cherry tomatoes, but GH is more cost-efficient for basil and lettuce.
CAPEX data for greenhouse energy requirements in Toronto, ON.
Cost breakdown per crop in Toronto, ON.
Crop economics and financial performance in Toronto, ON.
Basil High (2.64-year ROIC) High (3.34-year ROIC)
Lettuce Not Viable Break-even
Cherry Tomatoes Not Viable Not Viable
Crop specific feasibility and market strategy in Toronto, ON.
Large-scale distribution required. Risk of market oversupply.
High energy costs, requires premium pricing to be profitable.
High light costs, long growth cycle, unoptimized indoor varieties.
Focus on wholesale & retail mix. GH has lower OpEx, but IVF allows for year-round production.
Seasonal GH production (warmer months) is best. IVF is high-risk unless sold at a premium.
Avoid in IVF. GH may work in warmer climates but not Toronto.
Montréal
Refer to Table 10 for a detailed CAPEX breakdown for the GH model. Context-specific data is provided below. For VF CAPEX, see Table 12. It is noteworthy that VF requires higher lighting costs, while GH needs heating investments. Additionally, VF has a lower total CAPEX for cherry tomatoes, but GH is more cost-efficient for basil and lettuce.
CAPEX data for greenhouse energy requirements in Motreal, QC.
Crop economics and financial performance in Motreal, QC.
Basil
High (Strong revenue, 2.14-year ROIC)
Lettuce Low (Low margin, 21.6-year ROIC)
High (Strong revenue, 3.36-year ROIC)
Break-even (Not Viable)
Cherry Tomatoes Not Viable (Significant losses) Not Viable (Significant losses)
Crop specific feasibility and market strategy in Motreal, QC.
Large-scale distribution is required. Risk of market oversupply if demand is not matched.
Labor-intensive harvesting & packaging. Requires bulk retail sales to maintain viability. Long payback period makes investment risky.
Extremely high light requirements = unsustainable electricity costs. Long growth cycle slows revenue generation.
Focus on wholesale & retail mix. GH offers lower OpEx, but IVF allows for consistent year-round production.
Seasonal GH production (warmer months) is best. IVF is high-risk unless sold at a premium.
Avoid in IVF. GH may work in warmer climates but not Montréal.
Los Angeles
Refer to Table 10 for a detailed CAPEX breakdown for the GH model. Context-specific data is provided below. For VF CAPEX, see Table 12. It is noteworthy that VF requires higher lighting costs, while GH needs heating investments. Additionally, VF has a lower total CAPEX for cherry tomatoes, but GH is more cost-efficient for basil and lettuce.
The context specific CAPEX data for greenhouse energy requirements.
breakdown per crop.
Crop economics and financial performance.
Basil High (0.89-year ROIC) High (1.46-year ROIC)
Lettuce Not Viable Not Viable
Cherry Tomatoes Not Viable Not Viable
Crop specific feasibility and market strategy.
Market competition with local suppliers. Risk of oversupply.
Focus on high-value retail branding for IVF. GH should use wholesale distribution.
Intense market competition, higher costs than field-grown lettuce. Avoid in both systems.
High light costs, long growth cycle, unoptimized indoor varieties. Avoid in both systems.
New York
Refer to Table 10 for a detailed CAPEX breakdown for the GH model. Context-specific data is provided below. For VF CAPEX, see Table 12. It is noteworthy that VF requires higher lighting costs, while GH needs heating investments. Additionally, VF has a lower total CAPEX for cherry tomatoes, but GH is more cost-efficient for basil and lettuce.
The context specific CAPEX data for greenhouse energy requirements.
breakdown per crop.
Crop economics and financial performance.
Basil High (0.35-year ROIC)
High (0.57-year ROIC)
Lettuce Not Viable Not Viable
Cherry Tomatoes Not Viable Not Viable
Crop specific feasibility and market strategy.
Large-scale distribution required. Risk of market oversupply.
High labour costs, requires premium pricing to be profitable.
High light costs, long growth cycle, unoptimized indoor varieties.
Focus on wholesale & retail mix. GH has lower OpEx, but IVF allows for year-round production.
Not recommended for investment.
Avoid in IVF. GH may work in warmer climates but not New York.
Refer to Table 10 for a detailed CAPEX breakdown for the GH model. Context-specific data is provided below. For VF CAPEX, see Table 12. It is noteworthy that VF requires higher lighting costs, while GH needs heating investments. Additionally, VF has a lower total CAPEX for cherry tomatoes, but GH is more cost-efficient for basil and lettuce.
The context specific CAPEX data for greenhouse energy requirements.
Crop economics and financial performance.
Dubai
Refer to Table 10 for a detailed CAPEX breakdown for the GH model. Context-specific data is provided below. For VF CAPEX, see Table 12. It is noteworthy that VF requires higher lighting costs, while GH needs heating investments. Additionally, VF has a lower total CAPEX for cherry tomatoes, but GH is more cost-efficient for basil and lettuce.
The context specific CAPEX data for greenhouse energy requirements.

