exploring equitable reconnection

UNDERSTANDING THE EQUITABLE PRACTICES FOR RECONNECTING COMMUNITIES

UNDERSTANDING THE EQUITABLE PRACTICES FOR RECONNECTING COMMUNITIES


Siobhan is a writer and researcher born and raised in the SF Bay Area. She obtained her B.A. in Spanish from Denison University in 2021, where she studied the relationship between gender and place as represented in Spanish-language film. In December 2022, she completed her M.S. in Global Health from Georgetown University, during which she was awarded Student Research Fellowship for the Georgetown Global Irish Studies Initiative for her work on Irish sugar-sweetened drink taxes. Her academic work included research on the crosssector collaboration models for equitable infrastructure investments in Los Angeles County, highlighting her interest in urban studies and planning. While in Chiapas, Mexico, her Master’s capstone work focused on statistical analysis of the impact of socioeconomic factors on adolescent nutrition. She continues to explore the relationship between place, culture, and public health to advance how public space and infrastructure best serve communities. She currently lives in New York City.
https://www.linkedin.com/in/siobhanmitch/ siobhanmitchell.com
The Federal Interstate Highway Program arose as standard practice during the mid-20th century, transforming our cities. Highway projects cut swaths out of downtowns, traveled through parks, and next to waterfronts. Compared to today, they were built quickly. A freeway in mid-century could move from property acquisition to construction in under 10 years. Freeways formed the template for modern travel, but they also knocked apart neighborhoods - tearing apart communities that once bustled with businesses and homes such as West Oakland, CA, the Fifth Ward in Houston, the Overtown neighborhood in Miami, or the International District in Seattle. Neighborhoods fondly remembered by their now aging residents.
Over the past several years the implicit cityshaping results of the highway program have been made more visible. Researchers and community members are revisiting the choices behind the orginal freeway siting, and the present day consequences for communities. Before passage of the Civil Rights Act (1964), and the Environmental Protection Act (1970) freeways could follow the path of least political resistance, dovetailing with other federal planning programs for urban renewal and “blight clearance.” Freeways occupied the seams in our cities comprised of lower-income and minority populations. These neighborhoods were often segregated; and subject to “redlining,” making homewonership and mortgage access difficult.
We know that health and place are undeniably linked. The places where people live, work, grow, and learn influence opportunities to achieve the complete physical, mental, and social wellbeing entitled to “every human being without distinction of race, religion, political belief, economic or social condition.”9,10
In 2021, and in recognition of past practices, the Biden Administration launched the Reconnecting Communities Pilot (RCP) Program. The program’s $1 billion in discretionary grants challenges the concept that we must accept divided neighborhoods. If the Reconnecting Communities program aims to “repair harm caused by some of the infrastructure choices of the past,”1 this paper explores how we can best measure “repair and reconnection” not only in a project’s present day impact, but set transformational goals for improvement and communicate our best intention.
We propose that practicioners and policy makers apply a “spatial equity” lens to highlight and track the disparities in health, economic, and mobility outcomes across geographies. Spatial equity tools showcase the impact of compounding decisions, and how deeply our health outcomes are related to where we live, how we move, and our access to essential goods and services. We believe spatial equity’s data-driven framework further builds the case for public investment in connectivity, ultimately leading to more robust, cohesive communities and better public health outcomes.
In 2021, the Biden-Harris administration signed the Bipartisan Infrastructure Law and Inflation Reduction Act. Included are a set of “Reconnecting Communities” grants intended to “remove, retrofit or mitigate transportation facilities like highways or rail lines that create barriers to mobility, access, or economic development,”7 including roads, streets, parkways, and other transportation facilities.8
The RCP’s $1 billion budget over 5 years, while minor compared to the annual highway budget (nearly $70 billion), has still brighted our collective ability to deliver and plan for urban “reconnection.” It is also worth noting that the Bipartisan Infrastructure Law made the single largest dedicated investment in American transportation infrastructure since the midcentury construction of the Interstate Highway System. As a result, many comunities, RCP grant awardees and beyond are actively engaged in robust, civic conversations about how to physically (and socially) reconnect.
RCP can serve as a guide for our efforts to reinforce the nation’s aging infrastructure assets. RCP and related infrastructure investment more generally offers us a chance to reset expectations for more equitable outcomes, and intentional policy priorities. RCP’s imperative also contributes to the shift away from single-use, road-based solutions and towards multimodal and transit-based solutions that serve denser, human-scaled environments. When coupled with data on improved public health outcomes, the facts become harder to disregard: investment in more
and larger roadways simply does not solve urban congestion.2
Despite some cultural shifts, many Federal and State governments maintain a conventional playbook. Projects that have been “on the books,” and long promised to constituents can offer freeway expansions as core solutions for continued urban expansion and population growth.
An example of the tension between “business as usual” and commuity-driven advocacy is the $13 billion expansion of I-45 between Dallas and Houston. First conceived in the early 2000s, TxDOT seeks to solve its growing traffic problems by expanding the highway, and rebuilding parts of Houston’s outdated freeway structure. However, two additional lanes in each direction requires extensive land aquisition. The proposal has been criticized by many as a continuation of mid-century practices. It is estimated that the project will displace >1,000 affordable and public housing units and 300 businesses, while worsening air quality and other related health impacts. I-45’s disproportional effect on minority communities and TxDOT’s lack of transparency led to a 2021 Title VI complaint. While unsuccessful at altering the project scope, the suit did lead to changes in process; forcing twice-annual community meetings, allocation of a $30 million affordable housing fund, and some (albeit small) committments to air quality monitoring. The project has also resulted in a vocal set of advocates that continue to fight for substantive procedural change.


At left, a collage of the residential and commerical lots cleared during the 1960s to make way for the the 710 interchange with the 210 and 134. The portion of the interchange to the south is locally known as “The Stub.”

The West I-26/I-526 Lowcountry Corridor project in North Charleston, South Carolina, is also attempting to relieve traffic congestion by increasing freeway capacity4 at a cost of about $3 billion. Many residents live with the presentday environmental and noise pollution effects of the 1969 completion of I-26 and I-526, citing the destruction of natural areas and noise pollution near their homes. I-26 threatens to repeat history with the planned acquisition of 33 homes, four apartment buildings, 11 mobile homes, eight duplexes, and a church in a majority Black community.
On example of a freeway project playing out differently is in California’s Los Angeles region, an area famously planned around its freeway grid. Planned in the 1950s, SR-710 was envisioned to link the northern portion of LA County with Long Beach and the Port of LA. However, the 710 was never completed. Citizens of the City of South Pasadena waged a three decade, grassroots battle against the roadway. Their intense community opposition, combined with the runaway costs for freeway completion, led Caltrans to officially defund the SR-710 corridor in 2017.
But before it was defunded, Caltrans acquired and cleared land in the mid-1960s for the
710’s interchange with the I-210 and SR 134. Caltrans also built a fast-moving entry and exit to the regional system, known locally as “the stub.” In recognition that the City’s and Caltran’s priorities have now changed, the 50 acres making up the “stub,” a formerly redlined neighborhood, is now the subject of a closely watched community planning process. As a recipient of RCP funding, the 710 Vision Plan will determine the best way to relink neighborhoods that have been separated for over 50 years.
How we move forward with projects such as the I-710 in California or the I-45 in Texas will influence another generation of urban residents. It is imperative that we create workable project processes that can deliver infrastructure with the greatest public benefit for the money.
While the US is just beginning to address reconnection, international projects like the Cheonggyge Freeway removal project in Seoul, South Korea, provide us with useful case studies illustrating the tight relationship between improved community connectivity and the environment. Decades after its installation, facing disrepair, pollution, traffic congestion, and other harmful environmental consequences, Seoul’s local government rewrote the story of the riverfront and enacted the freeway’s removal.
Now complete, the Cheonggyge freeway removal has been characterized as a shift “from a car-oriented city to a human-oriented city.”24
Perkins Eastman led a feasibility assessment for a pedestrian and bicycle connection and active freeway lid spanning Interstate- 405 in Bellevue, WA. This project completes the City of Bellevue’s vision for a ‘Grand Connection’ from the waterfront through downtown and to a regional bicycle network.
A vision for the “Catalyst Connector” builds on many of the concepts of Reconnecting Communities Projects—it provides an active, safe, sustainable spine with generous pedestrian and cycling facilities, with links directly into new buildings, public parks and open spaces.The Catalyst Connector is moving to its next phase of design.

PERKINS EASTMAN DESIGNED THE JOHN LEWIS MEMORIAL CROSSING OF I-5, SIGNIFICANTLY EXTENDING THE REACH OF THE LINK LIGHT RAIL FROM THE NORTHGATE CENTER TO THE NORTH SEATTLE COMMUNITY COLLEGE.

“This bridge was built on a foundation with one goal in mind: bringing people together. This new infrastructure will transform much more than commutes—it will transform the lives of North Seattle College students heading to class, families visiting the Kraken Iceplex, and seniors who cannot drive but still want to move about the city.”
CITY OF SEATTLE COUNCIL MEMBER DEBORA JUAREZ
Freeway removal enabled daylighting of a creek and the reallocation of car space to green space. Changes were measured carefully and holistically. A few examples follow: the average neighborhood summer temperature surrounding Cheonggye Creek dropped by 3.3 degrees Celsius,25 small-air particle pollution dropped from 74 micrograms per cubic meter to 48, residents self-reported increased exercise in the newly available public spaces,24 and travel time to downtown decreased. The project serves as a model for the benefits of replacing freeways with usable green space and has led other Korean regions to pursue similar initiatives.26
Building on this and other examples, we offer a set of metrics to track how reconnection can be advanced over time. Metrics present an avenue to both investigate and communicate the value of contributing programs and policies, drive goal setting, and prioritize our decisions against outcomes.
The following indicators borrow from Spatial Equity NYC, a joint project by Massachusetts Institute of Technology (MIT) and Transportation Alternatives. We adapt Spatial Equity NYC’s indicators to the “principles of reconnection.”
We also test a selection of proposed metrics in the context of RCP capital construction grant awardees to understand if and how awardees addressed reconnection objectives.
We include three case studies from the FY22 RCP capital construction grants in California and Michigan.
* Spatial Equity NYC, a data tool from Transportation Alternatives and the Massachusetts Institute of Technology. 2023. https://www.spatialequity.nyc/

In the top three hottest City Council Districts, 96% of residents are people of color.
SPATIAL EQUITY NYC


HEALTH
Asthma
Noise Pollution
Traffic Injuries and Fatalities
Air Pollution
ENVIRONMENT
Sur face Temperature
Permeable Surface Area
Tree Canopy
Park Access
MOBILITY
Bike Parking
Protected Bike Lanes
Bus L anes and Speeds
Traffic Volume
Public Sea ting
Asthma is a chronic lung disease that causes inflamed and swollen airways in the lungs, characterized by repeated episodes of wheezing, breathlessness, chest tightness, and coughing. Studies show a statistically significant relationship between living close to high-traffic areas and asthma incidence, exacerbation, and recurrent asthma-related emergency department visits.11 Additionally, African American and Latino children living in low-socioeconomic-status urban neighborhoods in America are disproportionately burdened by asthma.12 Removing pollutant sources by rerouting high-traffic roadways away from schools and residences and introducing airquality improvement efforts can mitigate impacts for communities with disproportionate asthma burden and risk factors. Strategies to improve asthma risk factors are discussed in the following sections: air pollution, tree canopy, and traffic volume.
Noise pollution is defined as unwanted or disturbing sound that interferes with normal activities or disrupts/diminishes one’s quality of life.13 Additionally, noise pollution has documented negative health impacts, including stress-related illness, high blood pressure, speech interference, hearing loss, sleep disruption, and lost productivity.13 As set by the World Health Organization, environments should be below 70 decibels (dB) over 24 hours or 85dB over one hour to avoid hearing impairment.14
Living near a high auto-traffic area contributes to the frequency and duration of noise, making it particularly important for communities directly adjacent to high-traffic roadways. When within 50 feet, intensity typically ranges from 70 to 80 dB, a level known to interrupt concentration, increase heart rate, and limit the ability to carry a conversation between two people within three feet of each other.15 Research shows that reducing vehicle speed to 30 km/h (~18 mph) can lower noise pollution, reduce complaints about roadway noise, and lessen sleep disturbances for surrounding residents.16 Projects that prioritize lowering vehicle speeds can lessen the impact of noise pollution and its negative health consequences for neighboring communities, making vehicle speed a key consideration when establishing reconnection.
Traffic fatalities for pedestrians reached a 40year high in 2022, with 7,508 recorded fatalities in the US, a number that fell from 1980 to 2010 but has been increasing since. In addition, traffic injuries contribute to a significant physical and health burden in the US, leading to 104,000 emergency department visits for non-fatal traffic-crash injuries in 202017 and are responsible for the first and second most frequent direct post-traumatic stress disorder trauma for men and women, respectively.18 The rising rates of pedestrian fatalities and the burden on healthcare systems demonstrate the pressing need for measures aimed at reducing traffic injuries and fatalities.
The design and use of public spaces correlate heavily with the prevalence of traffic fatalities, and these risks disproportionately affect minority communities. In 2021, 68.7% of pedestrian traffic fatalities occurred on roadways without sidewalks,19 and non-Hispanic American Indians, Alaskan natives, and Black people had the highest pedestrian death rates attributed to traffic accidents.17
The likelihood of a pedestrian being hit and the severity of injury increased with higher vehicle speeds, with most pedestrian deaths occurring on urban roads with posted speed limits of 45-50 miles per hour.17 Research shows that reducing speed limits from 30 mph to 20 mph reduces the likelihood of severe injury or death for pedestrians struck by a vehicle from 45% to 5%. Similarly, 20 mph zones in the UK reduced child pedestrian and child cyclist accidents by 67%.20
Air pollution is most commonly characterized by the most harmful urban air pollutant, particulate matter (PM2.5), produced by combustion activity such as burning fuel for vehicles.21 These airborne solid and liquid particulates are less than 2.5 microns in diameter, allowing penetration into the lungs and entering the bloodstream, contributing to respiratory and cardiovascular disease, lower life expectancy, and increased risk of death. Areas within a few hundred meters of high-vehicle traffic roads show “pollution hot spots” where economically disadvantaged communities are more likely to live.22 Measuring the PM2.5 air pollution levels in neighborhoods is essential to understanding the health risks communities face. In particular, goal setting should include rerouting and reducing traffic volume near residential areas and low-income communities especially when PM2.5 levels exceed WHO guidelines (annual AQG level of exposure <5 and 24-hour exposure <15).23
Extreme heat is the leading cause of weatherrelated deaths in the United States.27 Due to more heat-retaining surfaces, fewer trees, and fewer parks that help cool neighborhoods, urban areas experience extreme heat at higher rates, making cities hotter than rural areas, a phenomenon called the “urban heat island effect.” High heat-retaining surfaces like asphalt and lack of cooling infrastructure (e.g., trees) are often felt in low-income communities experiencing barriers to climate-resilient spaces and emergency medical services.
Yale University developed Heat Vulnerability Index (HVI) scores ranging from 10 (least vulnerable) to 26 (most vulnerable) to measure the burden of extreme heat events on communities.29 By assessing heat vulnerability in communities surrounding reconnection projects, projects have the potential to address the disproportionate burden of extreme weather and climate change for communities with increased risk of injury and death from heat.
Projects aimed at reconnection often begin with conditions full of built, paved surfaces, which record the highest relative surface temperature of any land cover. Repurposing auto infrastructure to establish reconnection presents an opportunity to implement green infrastructure and environmental amenities, addressing extreme heat in communities with a high prevalence of heat-retaining surfaces. Where it’s not possible to expand green space, changing the color or composition of materials can reflect light and decrease surface temperature.27
Permeable surfaces include planting beds, mulched beds, gravel, turf, and permeable pavers. Impervious surfaces include concrete, asphalt, stone, and traditional stone/concrete/ brick pavers. Permeable surfaces allow water to infiltrate into the ground, reducing flood risk. As the percentage of impervious surfaces increases, so does vulnerability to flooding. A one-percent increase in impervious surfaces like roads, sidewalks, and parking lots increases flood magnitude by 3.3 percent.30
Auto infrastructure relies on paved roads and parking lots that are impervious and prevent water’s infiltration into the ground. Given that low-income communities experience greater vulnerability to extreme weather events like flooding, increasing permeable surface area in low-income areas is essential to partially relieving the burdens of climate change for disadvantaged communities. Similar to reductions in heat vulnerability through considering surface temperature, reducing paved surfaces can improve community resiliency to extreme weather, and should be considered when transforming existing transportation infrastructure.
Tree canopy coverage is linked to improved physical and mental health and is strongly connected to enhancing environmental resiliency by protecting against extreme heat, flooding, and air pollution.31 Despite these demonstrated benefits, coverage is unequally distributed among Americans, with Black and Brown neighborhoods recording 33% less coverage.32 To measure national disparities in tree canopy, American Forests developed the Tree Equity Score, which measures canopy coverage in relation to race, age, unemployment status, poverty, heat disparity, linguistic isolation, and community health burden.33 Leading research practices recommend a minimum of 30% tree canopy in neighborhoods to gain the mental, physical, and social health benefits and climate moderation aspects of local trees and green space.34 When reconnection projects reclaim land from vehicle infrastructure, it is essential to use the space to introduce a minimum tree canopy coverage goal of 30% to foster the benefits of tree canopy for new and existing communities in the area.
Parks contribute massive economic benefits to cities by mitigating extreme weather events, buffering pollution, and promoting mental/ physical health. By providing a place for residents to exercise and adding recreational value, parks are estimated to contribute to billions in reduced healthcare costs.35
The Trust for Public Land’s ParkScore® index rates how the 100 largest U.S. cities meet the need for parks, using community demographics and park availability within a 10-minute walk from home. The data from ParkScore® show neighborhoods with a majority Black, Hispanic/ Latinx, American Indian/Alaska Native, Pacific Islander, or Asian American residents have less park acreage per person than white neighborhoods, and residents are less likely to live within a 10-minute walk to a park.36
Natural areas (i.e., parks, greenspace, etc.) are the coolest places in cities, attributed to the ability of plants to cool surrounding areas.27 Expanding, protecting, and providing access to natural areas within cities is an integral part of fostering health and environmental resiliency benefits of natural areas and parklands. With RCP projects that re-envision public space, the impact of community connectivity must consider park access for communities harmed by past infrastructure decisions.
How projects address multigenerational park use is crucial to restoring communities. Reconnection should aim to ease access to parkland for populations with limited vehicle access, less park acreage per person, or longer than 10-minute walks to a park.


Designed by Perkins Eastman, COWI, and MIG SVR, Kirkland, Washington’s Totem Lake Connector is a new bicycle and pedestrian bridge connecting the two ends of the 5.75-mile Cross Kirkland Corridor once severed by one of Kirkland’s most complicated intersections: Totem Lake Boulevard and Northeast 124th Street.
Mobility is integral to improving access to economic opportunities, green space, health care, nutritious food options, and more. Lack of vehicle access often poses a barrier for disadvantaged communities relying on public transportation, walkability, and bikeability to access essential resources. In the United States, women, young adults, Black workers, low-income workers, elderly adults, and people with disabilities disproportionally rely on public transportation, making mass transit improvements an issue of social, economic, political, and health equity.37 Expanding mobility options has the potential to strengthen communities by improving regional health and reducing longstanding inequities to access for those without a vehicle. Currently, 8.3% of US households do not have access to a car,38 demonstrating the need to improve affordable transportation infrastructure options everywhere while delivering multi-mobility investments equitably in areas where access to a car is lowest.
by Princeton University survey data indicating that people of color were far more likely than white people to increase bicycle use with the availability of “plentiful, secure bike parking.” Similarly, individuals earning less than $75,000 per year were more likely than those earning more to increase their bike usage with “plentiful, secure bike parking.” 41
Free and available bike parking near transit hubs is an international best practice seen in cities like Amsterdam, London, and Paris.42
Comparing US bike infrastructure to European standards is often unreasonable but offers a lesson in best practices to promote biking. For example, research suggests that to integrate the bike-and-ride approach into U.S. cities, sheltered, secure bike spaces at mass transit stations should be provided to assist in connecting riders to transportation options.43
Bike parking is critical to facilitating cycling, and it has a relatively small cost in terms of space and budget. An estimated 10 bicycles can fit in a single car parking space, increasing parking capacity by 400 to 800 percent. 39 Ensuring bike parking is distributed among marginalized populations promotes the equitable distribution of active transportation options, which are shown to contribute to increased economic growth and productivity.40 This is supported
In the United States, every car has an estimated eight parking spots, and zoning laws require extensive parking options, influencing the urban landscape and mobility options.44 Additionally, bike parking comes at a low cost to space with an estimated 10 bike spots fitting in one car space.45 For multi-unit residential buildings, LEED standards recommend providing long-term bike storage for at least 30% of regular building occupants with no less than one storage space per unit.46 Scaling this to the neighborhood context, a similar goal is to provide bike parking for 30% of neighborhood residents, which would demonstrate a commitment to transportation efficiency and encourage multimodal transportation options for community members.
Protected bike lanes contribute to safety and economic and community benefits by increasing connectivity and access to essential goods and services. The lack of protected bike lanes contributed to 966 bicyclist deaths in 2021, which shows the need for improved and extensive protected bike lanes in the US.47 Additionally, pedestrian safety improves by installing protected bike lanes, as shown by data in Washington, DC, New York City, and Denver, where bike use on the sidewalk decreased following the installation of a protected bike lane therefore, reducing the risk of bike-pedestrian collisions.48
Data indicate the economic benefits of bike lanes with increased retail sales, property values, and traffic capacity where they are installed.49 Additionally, connected bike networks can promote equity in use and improved access to health care, goods, and services for marginalized communities.50
Where reconnection aims to build connectivity options for community members, installing protected bike lanes presents an opportunity to increase safety for existing riders. Additionally, as demonstrated through initiatives in New York City, safer bike lanes encourage new riders to utilize the paths, boosting ridership.51
Buses provide access to economic opportunity, food, medical services, and other basic needs for riders who are disproportionately Black, foreignborn, and make under $30,000 annually.52 To improve equity in access to these essential goods and services, bus lanes shift prioritization away from private vehicles, improving user travel times by passing traffic congestion.53
Bus infrastructure is a low-cost solution to establishing reconnection because bus lanes can be created on existing roadways, requiring little to no capital work. Reconnection projects should consider implementing lanes dedicated to buses to incentivize public transportation use and provide an essential service to underserved communities.
High traffic volumes harm communities through air and noise pollution, dangerous conditions for pedestrians/bikers, increased impervious surfaces (i.e., pavement), and heat vulnerability. Conditions perpetuated by high traffic volumes are referred to as traffic-related harms.54 Hightraffic roadways were historically routed through low-income communities, exacerbating health and safety risk factors. The vulnerability to high traffic volume effects is already present in neighborhoods experiencing these conditions, and reducing traffic volume in reconnection projects is integral to the program’s goals to repair harm to communities.
Public seating is an essential aspect of public open space, allowing people to interact socially or benefit individually from time outside. Seating within these settings builds a sense of community by cultivating familiarity and connection to the more extensive social system and encouraging people to be outdoors.55 Public seating allows those with mobility challenges and older individuals to safely use public spaces.56 The safety of public spaces relies, at least in part, on community members--often women and older adults--who are sitting and observing within their neighborhoods.57
When land is repurposed from auto infrastructure, accessible seating is essential to promoting the use of public space. Reconnection projects have the potential to reclaim land from cars, create new public spaces, and provide adequate seating to promote accessibility for a variety of users. In line with privately owned public space guidelines in New York, a minimum of one linear foot of seating for every 30 square feet of public space should be provided with considerations for comfort, accessibility, and orientation to promote a variety of uses.58
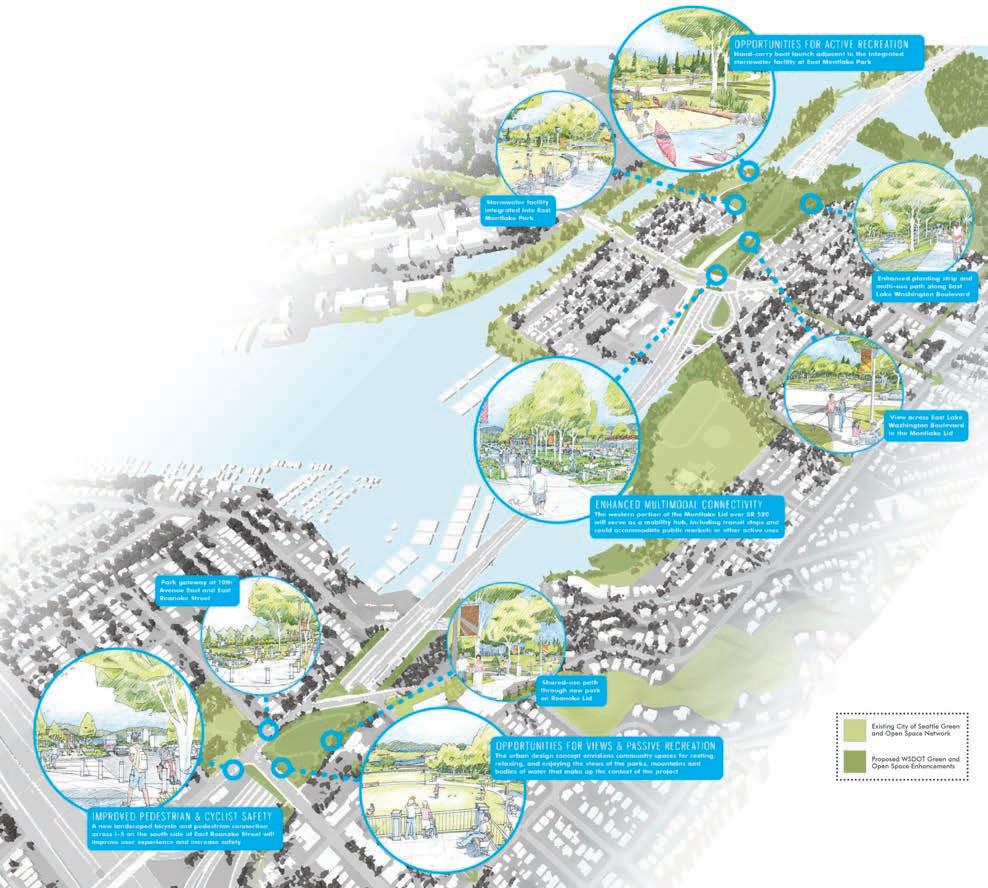
Now in construction, Washington DOT’s SR 520 project reconnects between neighborhoods. A rebuilt SR 520 transformed what was unsafe, with non-motorized paths, rapid transit, and new pedestrian outlooks, underpasses, and park access.
The freeway project also invests in the public realm well beyond its footprint.
SR 520 creates a series of active public environments rooted in the legacy of “nature meets city,” and returns to the well-loved themes of its Olmstedian 1909 Parks and Boulevard Plan.
SR 520’s west side program stitches the Montlake neighborhood of Seattle to the University District and Capitol Hill. A proactive engagement process between WSDOT and the Seattle Design Commission applied public health and sustainability measures to build consensus and initiate changes to a project design that had been stalled by conflict and litigation.
Before merging with Perkins Eastman, VIA spent 10 years contributing to the BRT station design and the interface between transit facilities, roadway structures, and mature neighborhoods. The team led a series of neighborhood charrettes, workshops, and regional strategic stakeholder discussions and debates.
Image: Montlake urban trail head on the Montlake Lid, Final Design (Perkins Eastman)
“This innovative and collaborative approach has produced contextsensitive infrastructure that is functional and reflects the needs, concerns, and voices of diverse and complex users, stakeholders, and community groups.”
Seattle Design Commission September 17, 2014

The RCP FY22 cycle awarded funding to 39 planning and six capital construction projects nationwide. These projects explore a variety of reconnection approaches addressing a range of existing conditions. The following case studies from the FY22 cohort of RCP capital construction awardees represent leading trends in contemporary planning efforts in the United States and inform our understanding of how reconnection projects relate to spatial equity goals. Future consideration of spatial equity indicators can support practitioners, advocates, and policymakers in understanding and communicating the non-monetary value of these capital projects.
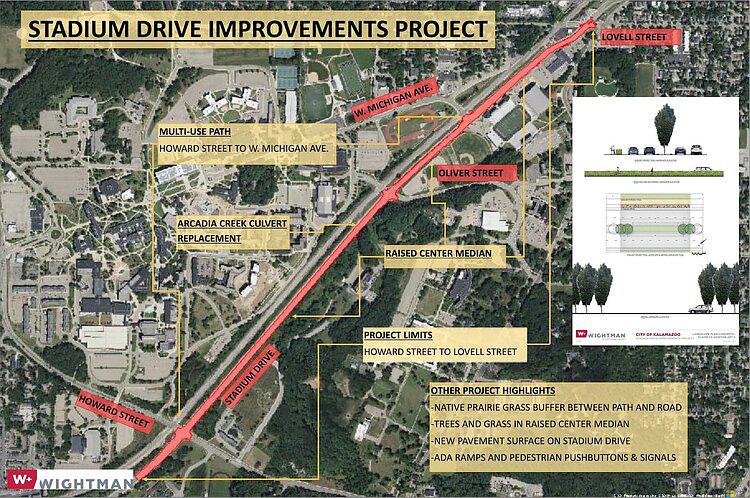
Kalamazoo and Michigan Drives
$12,272,799
• Introduce traffic calming measures with pedestrian, bike, and transit improvements
• Address climate resilience
• Partner with community members and organizations
Shoreline Drive Gateway
Award: $30,000,000
• Align the nor th- and southbound sections of W Shoreline Drive that are now dividing Cesar Chavez Park in Long Beach.
• By moving the northbound lane west to align with the southbound lane along the LA River, the park will gain 5.6 acres of additional green space.
• Create new protected bikeways separated by traffic
• Create a shared-use pedestrian path separate from the roadway
RCP Award: $21,704,970
• Reconstruct freeway deck with improved pedestrian and bicycle connection
• Improve driver safety during winter months on I-696
Uniting Neighborhoods & Infrastructure for Transportation Equity (UNITE): Ashley Drive
RCP Award: $5,354,695
• Provide new bicycle and pedestrian routes
• Remove Ashley Drive off-ramp to street level
• Establish new roadway connections
• Install new roadway signals
• Install public art elements
NYS Route 33: Kensington Expressway
RCP Award: $55,597,500
• Cap expressway to invest in green space and parkland while enhancing east-west connectivity
• Restore elements of historic Humboldt Parkway
Pedestrian Tunnel
RCP Award: $213,215,036
• Remove at-grade rail crossing
• Provide a pedestrian tunnel to eliminate problematic rail crossing for pedestrians and riders
• Build ADA-compliant ramps for access to the station
Long Beach, California
Currently, the Shoreline Drive Gateway northbound roadway runs through the center of Cesar Chavez Park, routing on-ramp traffic directly adjacent to Cesar Chavez Elementary School in a predominately Hispanic/Latino* neighborhood.59 The northbound roadway is approximately one block away from the residential neighborhood. Routing the northbound traffic away from the school in the proposed design reduces the environmental exposure for Cesar Chavez Elementary School and the residential neighborhood adjacent to the park.
For school-age children, major roadway proximity was independently associated with more asthma symptom days using a composite score of school and roadway proximity.60 Given the increased risk of asthma for Latino children in the US, reducing exposure to asthma pollutants is particularly important. Routing on-ramp traffic away from the school reduces an environmental risk factor for students, justifying the investment.
In Long Beach, residents in Hispanic/ Latinx neighborhoods have 65% less space dedicated to parkland than the city’s median per person. Additionally, 8% of the City’s land is dedicated to park space, below the national median of 15%.61 The realignment of northbound Shoreline Drive creates 5.5 additional acres of accessible park space, which is currently inaccessible due to the roadway barrier, supporting access for the predominantly Hispanic/Latino neighborhood.
Currently, Cesar Chavez Park has a tree canopy cover of 16% and 19%.33 The realignment of the northbound drive has the potential to open up space for increased planting and tree cover with the proposed project plan including planting along the new pedestrian-bike shared pathway.62 The project does not specify tree removals for design consideration of the new roadway, nor does it describe the planting plan. To support the local community in reaping the mental and physical benefits of trees, the plan should aim to bring the parkland to a 30% tree canopy coverage goal.
* Race was defined based upon the terminology used by the data source


Kalamazoo, Michigan
In the mid-20th century, the Michigan Department of Transportation implemented one-way corridors on Michigan and Kalamazoo Avenues to facilitate east-west auto connectivity. This process divided the predominately Black Northside neighborhood from the central business district, creating a physical barrier to access and limiting opportunities for Northside residents.63 The recent transfer of Michigan and Kalamazoo avenues from state to local jurisdiction spurred the community’s vision of promoting transportation networks that prioritize safety.
A major priority is to reduce speed on Michigan and Kalamazoo avenues. To achieve this, the current plan proposes implementing two-way traffic on both streets with pedestrian infrastructure, bike lanes, dedicated left-turn lanes, and on-street parking. Additionally, the project will introduce consistency in auto speeds where existing limits vary along the roadway. This approach aims to reduce the risk of crashes and crash severity. Overall, reducing vehicle speeds will create a safer and more appealing pedestrian experience and support multimodal connectivity between the Northside and the central business district for residents seeking pedestrian access.

The Long Branch Pedestrian Tunnel grant funds tunnel access to Long Branch Station providing access to Long Branch Station from multiple directions. The tunnel aims to eliminate the need for dangerous pedestrian railroad crossings currently required to access the station and provide east–west connectivity, essential for improving access to medical services and economic opportunities.
The project presents an opportunity to improve bike-and-ride for communities with historically low access to private vehicles. Populations in the surrounding area have a higher prevalence of poverty than the national average and lower percentages of
the population with access to a vehicle than the national average, as represented in Table 1.64,65 With a lack of vehicle access, pedestrian, rail, and bicycle infrastructure becomes an even more essential resource for communities to access economic opportunity, medical services, food, and green spaces.
Installing bike infrastructure, including bike parking, is particularly important for allowing Long Branch residents in the surrounding communities to access the station. The project plans to install bike racks within a new green station plaza which is currently the parking lot. Turning this paved area into a green space with bike parking helps promote equitable access to the rail station for bike-to-transit riders while improving environmental amenities.
* The national poverty rate for 2022 was 11.5%.73
† 8.3% of occupied housing units in the US lack access to a private vehicle


“This grant will help reconnect the east and west sides of the city near the station, make public transportation more accessible, and improve the safety of our transit infrastructure for commuters,” said Mayor John Pallone. “The pedestrian tunnel will ensure riders no longer have to cross the train tracks to access the platforms.”
Perkins Eastman’s “Repairing and Connecting Plan,” completed for the Washington DC’s National Capital Planning Commission (2023), shows how a placebased, stakeholder-driven approach for reconnecting can galvanize interest and build the case for more holistic investments. The work shows what could be possible through repairing the damage resulting from the construction of I-66 between K Street NW and the National Mall. A data-driven spatial equity approach could move the project forward, communicating project benefits to a broad set of stakeholders in experiential terms and making clear program objectives to build the case for change. Reconnecting through spatial equity lets us leverage our taxpayer investments into infrastructure that has multiple benefits, remaking and reinvesting in both physical and social links.

KENNEDY CENTER CULTURAL DISTRICT


Establishing baseline metrics for the community of interest is integral to understanding the impact of design decisions before, during, and after project implementation. Data availability can inhibit the ability to measure indicators in the project area. This report relies heavily on open data sources. Many RCP awardees do not have a full compliment of proposed indicators.
Investment is needed to collect and record reliable information on spatial equity metrics nationwide. Appendix C includes a list of available sources and visualizations for national data on spatial equity metrics.
During infrastructure project construction or removal, communities must pay special special attention to their existing vulnerabilities to environmental and health factors (e.g., high asthma prevalence, air pollution) caused by construction. For example in Syracuse, New York, houses can be located within seven feet of the aging viaduct slated for removal. The viaduct’s removal will expose residents to additional constuction impact, e.g. dust, while they already live with roadway pollution and high particulate matter.71
When neighborhood infrastructure improves, existing residents are often concerned about increased property and home values. Research shows that the demographic makeup of West Oakland, California was significantly altered following the rerouting of the Cypress Freeway and the construction of the Mandela Parkway. The proportion of Black residents decreased as property values rose. Measures for both affordable housing and business retention are critical to include in RCP projects, ensuring that long-time residents can remain in areas as conditions improve.
Another example in Rochester, New York, points to the ongoing work of addressing gentrification concerns associated with public infrastructure investment. This should be considered an iterative process, with clear information and approaches in place before, during, and after the implementation of new infrastructure. In 2017, Rochester, New York, filled in the eastern section of the sunken Inner Loop Highway to create a smaller pedestrianfriendly road. The reclaimed land was used to construct apartments. While residents were pleased to see the freeway “moat” removed, concerns about gentrification arose following the neighborhood improvements. Communityinitiated meetings helped to involve residents in the planning and decision-making process. 69 Residents continue to watch how the project has and will affect them. The results are unclear about how many existing residents have remained since 2017.70
In 2024, the path to achieving reconnection varies according to the local context, including political climate, population demographics, geography, and urban/rural environment. In our review of RCP awardees, we also see that the extent to which stakeholders are willing and/or able to radically change the transportation landscape differs wildly among grant recipients.
Spatial equity could present a framework to level the field and provide a baseline of measures for projects across varied conditions. This approach aligns with the goals of the RCP program to restore community connectivity by providing for a collection of interdisciplinary indicators.
The framework positions practitioners to convey the program’s non-monetary, easily understood benefits. Metrics can be be designed to support community process and engagement to inform practitioners, inform practitioners, community members, and elected officials about ways to improve their neighborhoods.
Creative engagement of stakeholders and the public’s ability to better portray the scope, risks, and benefits of a project lead to more inclusive—and ultimately more desireable—outcomes.
1. Reconnecting Communities and Neighborhoods Grant Program [Internet]. U.S. Department of Transportation. 2023 [cited 2023 Jul 26]. Available from: https://www.transportation.gov/grants/rcnprogram
2. Duranton G, Turner M. The Fundamental Law of Road Congestion: Evidence from US cities [Internet]. Cambridge, MA; 2009 Sep. Report No.: 15376. Available from: https://www.nber.org/papers/w15376; Volker, Jaime, Handy Susan "Inceasing Highway Capacity Induces more Automobile Travel" UC Davis, 2023. Available from: https://escholarship.org/uc/item/3q21f88p
3. Fechter J. After a two-year pause, feds give Texas the go-ahead to resume a major Houston highway expansion. The Texas Tribune [Internet]. 2023 Mar 7; Available from: https://www.texastribune.org/2023/03/07/houston-interstate-45-highway-expansion/
4. 526 Low Country Corridor [Internet]. South Carolina Department of Transportation . Available from: https://www.washingtonpost. com/climate-environment/interactive/2021/highways-black-homes-removal-racism/
5. Fears D, Muyskens J. Black people are about to be swept aside for a South Carolina freeway - again. The Washington Post [Internet]. 2021 Sep 8; Available from: https://www.washingtonpost.com/climate-environment/interactive/2021/highways-blackhomes-removal-racism/
6. Tozan Y, Ompad DC. Complexity and Dynamism from an Urban Health Perspective: a Rationale for a System Dynamics Approach. Journal of Urban Health. 2015 Jun 8;92(3):490–501.
7. Wang C, Emanuele A, Wainer Katz J, Underwood S, Hall F, Nelson A, et al. Past, Present, and Future of Reconnecting Communities [Internet]. U.S. Department of Transportation. Available from: https://storymaps.arcgis.com/stories/dc61e3bcecd44464b4bf ef8299d9d6ce
8. RCP Additional Guidance [Internet]. U.S. Department of Transportation. Available from: https://www.transportation.gov/grants/ rcnprogram/rcp-additional-guidance
9. Social determinants of health [Internet]. World Health Organization . Available from: https://www.who.int/health-topics/socialdeterminants-of-health#tab=tab_1
10. Constitution of the World Health Organization [Internet]. World Health Organization . Available from: https://www.who.int/about/ accountability/governance/constitution
11. Pratt GC, Parson K, Shinoda N, Lindgren P, Dunlap S, Yawn B, et al. Quantifying traffic exposure. J Expo Sci Environ Epidemiol. 2014 May 18;24(3):290–6.
12. Br yant-Stephens T. Asthma disparities in urban environments. Journal of Allergy and Clinical Immunology. 2009 Jun;123(6):1199–206.
13. United States Environmental Protection Agency. Clean Air Act Title IV - Noise Pollution [Internet]. Available from: https://www.epa. gov/clean-air-act-overview/clean-air-act-title-iv-noise-pollution#:~:text=Health%20Effects&text=Problems%20related%20to%20 noise%20include,sleep%20disruption%2C%20and%20lost%20productivity.
14. Neitzel R. Chronic health effects and injury associated with environmental noise pollution [Internet]. Center for Disease Control and Prevention; University of Michigan School of Public Health. 2018. Available from: https://www.cdc.gov/nceh/hearing_loss/ docs/CDCPresentationNeitzel-508.pdf
15. Corbisier C. Public Roads - July/August 2003. In: US Department of Transportation [Internet]. 1st ed. 2003. Available from: https://highways.dot.gov/public-roads/julyaugust-2003/living-noise
16. Brink M, Mathieu S, Rüttener S. Lowering urban speed limits to 30 km/h reduces noise annoyance and shifts exposure–response relationships: Evidence from a field study in Zurich. Environ Int. 2022 Dec;170:107651.
17. Pedestrian Safety [Internet]. Center for Disease Control and Prevention . 2023. Available from: https://www.cdc.gov/ transportationsafety/pedestrian_safety/index.html#:~:text=Nearly%208%2C000%20pedestrians%20were%20killed,a%20 motor%20vehicle%20in%202021.&text=That%27s%20about%20one%20death%20every%2066%20minutes.&text=One%20 in%20six%20people%20who%20died%20in%20crashes%20in%202021%20were%20pedestrians.
18. Blanchard EB, Hickling EJ. After the crash: Psychological assessment and treatment of survivors of motor vehicle accidents (2nd ed.). Washington: American Psychological Association; 2004.
19. Macek K, Petraglia E, Tony Frye Design. Highway Pedestrian Traffic Fatalities by State [Internet]. 2023 Jun. Available from: https:// www.ghsa.org/sites/default/files/2023-06/GHSA%20-%20Pedestrian%20Traffic%20Fatalities%20by%20State%2C%202022%20 Preliminary%20Data%20%28January-December%29.pdf
20. Pilkington P. Reducing the speed limit to 20 mph in urban areas. Child deaths and injuries would be decreased. BMJ. 2000 Apr 29;320(7243):1160.
21. Askariyeh MH, Venugopal M, Khreis H, Birt A, Zietsman J. Near-Road Traffic-Related Air Pollution: Resuspended PM2.5 from Highways and Arterials. Int J Environ Res Public Health. 2020 Apr 21;17(8):2851.
22. Eisinger D, Craig K, Lansberg K, Mukherjee A, Dewinter J, McCarthy M, et al. Near-Road Air Quality Insights from a U.S. DOT FiveYear Transportation Pooled Fund Study. 2021 Apr.
23. WHO global air quality guidelines. Particulate matter (PM2.5 and PM10), ozone, nitrogen dioxide, sulfur dioxide and carbon monoxide. [Internet]. Geneva; 2021. Available from: https://iris.who.int/bitstream/handle/10665/345329/97892400342 28 -eng.pdf
24. Revkins AC. Peeling Back Pavement to Expose Watery Havens. The New York Times [Internet]. 2009 Jul 16; Available from: https://www.nytimes.com/2009/07/17/world/asia/17daylight.html?pagewanted=all
25. Seoul | Cheonggye Freeway [Internet]. Congress for New Urbanism. Available from: https://www.cnu.org/highways-boulevards/ model-cities/seoul#:~:text=The%20open%20watercourse%20handles%20flooding,also%20boosted%20Seoul%27s%20 tourist%20economy.
26. Rao K. Seoul tears down an urban highway and the city can breathe again. Grist [Internet]. 2011 Apr 5; Available from: https:// grist.org/infrastructure/2011-04-04-seoul-korea-tears-down-an-urban-highway-life-goes-on/
27. Crown CA, Pregitzer CC, Clark JA, Plitt S. Cooling Cities Harnessing Natural Areas to Combat Urban Heat [Internet]. 2023 Jul. Available from: https://naturalareasnyc.org/media/pages/in-print/951f086032-1690225094/nac-cooling- cities.pdf
28. Why do cities get so hot? [Internet]. Available from: http://publichealth.lacounty.gov/eh/docs/climatechange/ExtremeHeat_ UrbanHeatIsland.pdf
29. Disparities in Heat Vulnerability in the United States [Internet]. Yale Center on Climate Change and Health (YCCCH). 2022. Available from: https://storymaps.arcgis.com/stories/887792e05ea744d3b085856ca061ef53
30. Gies E. Expanding Paved Areas Has an Outsize Effect on Urban Flooding. Scientific American [Internet]. 2020 May 15; Available from: https://www.scientificamerican.com/article/expanding-paved-areas-has-an-outsize-effect-on-urban-flooding1/
31. Nuccitelli D. The little-known physical and mental health benefits of urban trees. Yale Climate Connections [Internet]. 2023 Feb 28; Available from: https://yaleclimateconnections.org/2023/02/the-little-known-physical-and-mental-health-benefits-ofurban-trees/
32. American Forests Launches Nationwide Tree Equity Scores [Internet]. American Forests. 2021. Available from: https://www. americanforests.org/article/american-forests-launches-nationwide-tree-equity-scores/
33. Tree Equity Score [Internet]. American Forests. Available from: https://www.treeequityscore.org
34. Konijnendijk CC. Evidence-based guidelines for greener, healthier, more resilient neighbourhoods: Introducing the 3–30–300 rule. J For Res (Harbin). 2023 Jun 26;34(3):821–30.
35. Cohen M, Burrowes K, Gwam P. The Health Benefits of Parks and their Economic Impacts A Review of the Literature. 2022 Feb.
36. Chapman R, Foderaro L, Hwang L, Lee B, Muqeeth S, Sargent J, et al. Parks and Equitable Recovery [Internet]. Trust for Public Land. 2021. Available from: https://www.tpl.org/parks-and-an-equitable-recovery-parkscore-report
37. Heaps W, Abramsohn E, Skillen E. Public Transportation in the US: A Driver of Health and Equity [Internet]. 2021 Jul [cited 2023 Jul 31]. Available from: https://www.healthaffairs.org/do/10.1377/hpb20210630.810356/
38. Why We Ask Questions About... Vehicles Available [Internet]. United States Census Bureau. Available from: https://www.census. gov/acs/www/about/why-we-ask-each-question/vehicles/
39. Blue E. The Best Way to Promote City Riding? Bike Racks. Bicycling [Internet]. 2016 Apr 25; Available from: https://www.bicycling. com/news/a20024191/the-best-way-to-promote-city-riding-bike-racks/
40. Mueller D. Building Bike-Friendly Communities Is Good for Economies. Bicycling [Internet]. 2015 Jun 17; Available from: https:// www.bicycling.com/rides/a20022571/building-bike-friendly-communities-is-good-for- economies/
41. The New Majority Pedaling towards equity [Internet]. 2013 May. Available from: https://nacto.org/wp-content/uploads/2017/11/ LAB_equity_report.pdf
42. Mar tinez J. New York Just Getting Into Gear on Road to Transit-Biking Tandem [Internet]. The City. 2021. Available from: https:// www.thecity.nyc/2021/10/28/new-york-bike-pods-racks-mass-transit-cycling-mta/
43. Pucher J, Buehler R. Integrating Bicycling and Public Transport in North America. J Public Trans. 2009 Sep;12(3):79–104.
44. The high cost of free parking [Internet]. Vox ; 2017. Available from: https://www.youtube.com/watch?v=Akm7ik-H_7U
45. Peters A. How this Dutch design convinces residents to swap car parking for bike racks. Fast Company [Internet]. 2022 Aug 18; Available from: https://www.fastcompany.com/90780018/dutch-design-swap-car-parking-for-bike-racks
46. Bicycle facilities LEED ND: Planv4 - LEED v4 [Internet]. LEED . Available from: https://www.usgbc.org/credits/neighborhooddevelopment-plan-neighborhood-development/v4-draft/sllc4
47. Bicycle Deaths [Internet]. National Safety Council Injury Facts . Available from: https://injuryfacts.nsc.org/home-and-community/ safety-topics/bicycle-deaths/#:~:text=Of%20the%201%2C230%20bicyclist%20deaths,times%20the%20fatalities%20for%20 females.
48. Jaffe E. Tired of Cyclists Riding on the Sidewalk? Build More Bike Lanes. Bloomberg CityLab [Internet]. 2014 Aug 14; Available from: https://www.bloomberg.com/news/articles/2014-08-14/tired-of-cyclists-riding-on-the-sidewalk-build-more-bike-lanes
49. Protected Bike Lane Statistics Economic benefits [Internet]. People for Bikes. Available from: https://www.peopleforbikes.org/ statistics/economic-benefits
50. Fiol O, Freemark Y, Su Y. Why US Cities Are Investing in Safer, More-Connected Cycling Infrastructure [Internet]. Urban Institute Urban Wire. 2022. Available from: https://www.urban.org/urban-wire/why-us-cities-are-investing-safer-more-connected-cyclinginfrastructure
51. NYC DOT Taking New Steps to Expand Bike Infrastructure and Encourage Safe Operation of E-bikes as Overall Bike Ridership Reaches All-time High [Internet]. NYC DOT. 2023. Available from: https://www.nyc.gov/html/dot/html/pr2023/dot-expandbike-infrastructure.shtml#:~:text=%E2%80%9CThe%20proof%20is%20in%20the,said%20NYC%20DOT%20Commissioner%20 Rodriguez.
52. Anderson M. Who relies on public transit in the U.S. [Internet]. Pew Research Center. 2016. Available from: https://www. pewresearch.org/short-reads/2016/04/07/who-relies-on-public-transit-in-the-u-s/
53. Bus Lanes [Internet]. Federal Transit Administration. 2015. Available from: https://www.transit.dot.gov/researchinnovation/bus-lanes
54. Spatial Equity NYC, , a data tool [Internet]. Transportation Alternatives; MIT. Available from: spatialequity.nyc
55. Efe R, Cürebal I, Gad A, Tóth B. Environmental Sustainability and Landscape Management [Internet]. 2016. Available from: https://www.researchgate.net/profile/Recep-Efe/publication/311065048_Environmental_Sustainability_and_Landscape_ Management/links/583c862f08ae502a85e3e890/Environmental-Sustainability-and-Landscape-Mana gement.pdf
56. Wilson K. Why Sustainable Transportation Advocates Need to Talk About Seating [Internet]. StreetsBlog. 2021. Available from: https://usa.streetsblog.org/2021/01/07/why-transportation-advocates-need-to-talk-about-seating
57. Bynon R, Rishbeth C. Benches for everyone Solitude in public, sociability for free [Internet]. 2015 Nov. Available from: https:// youngfoundation.org/wp-content/uploads/2015/11/The-Bench-Project_single-pages.pdf
58. New York City’s Privately Owned Public Spaces Current Standards [Internet]. NYC Planning. 2017. Available from: https://www.nyc. gov/site/planning/plans/pops/pops-plaza-standards.page
59. Race and Ethnicity in the US by Dot Density (2020 Census) . esri_demographics. 2023.
60. Hauptman M, Gaffin JM, Petty CR, Sheehan WJ, Lai PS, Coull B, et al. Proximity to major roadways and asthma symptoms in the School Inner-City Asthma Study. Journal of Allergy and Clinical Immunology. 2020 Jan;145(1):119-126.e4.
61. Long Beach, CA 2023 ParkScore Ranking [Internet]. 2023. Available from: https://www.tpl.org/city/long-beach-california
62. 21. Fact Sheet - LA Metro - LA (I-405 Shoreline Drive Gateway) [Internet]. 2022. Available from: https://catc.ca.gov/-/media/ctcmedia/documents/programs/sccp/fact-sheets/fact-sheets-2022/21-fact-sheet--la-metro--la-i405-shoreline-drive-gateway.pdf
63. Reconnecting Communities Pilot Program FY 2022 Award Fact Sheets [Internet]. 2023 Feb. Available from: https://www. transportation.gov/sites/dot.gov/files/2023-02/RCP%20Fact%20Sheets% 202022.pdf
64. EDA-Census Poverty Status Viewer [Internet]. United State Census; U.S. Economic Development Administration . 2021. Available from: https://mtgis-portal.geo.census.gov/arcgis/apps/experiencebuilder/experience/?data_id=dataSource_8-High_ Poverty_7124-17%3A73881&id=ad8ad0751e474f938fc98345462cdfbf
65. Where are Households with No Vehicle Available? [Internet]. Urban Observatory by Esri. 2023. Available from: https://www.arcgis. com/home/item.html?id=a16b9f8f0d594125aac60179b9bb9741
66. Department of Transportation The President’s 2023 Budget [Internet]. 2023. Available from: https://www.govinfo.gov/content/ pkg/BUDGET-2023-BUD/pdf/BUDGET-2023- BUD-17.pdf
67. Salerno C. Mind the gap: USDOT’s first take on reconnecting communities [Internet]. Transportation for America T4America Blog. 2023. Available from: https://t4america.org/2023/06/13/min d-the-gap/
68. Patterson RF, Harley RA. Effects of Freeway Rerouting and Boulevard Replacement on Air Pollution Exposure and Neighborhood Attributes. Int J Environ Res Public Health. 2019 Oct 23;16(21):4072.
69. Popovich N, Williams J, Lu D. Can Removing Highways Fix America’s Cities? The New York Times. The New York Times [Internet]. 2021 May 27 [cited 2023 Jul 31]; Available from: https://www.nytimes.com/interactive/2021/05/27/climate/us-cities-highwayremoval.html
70. Lahman S. Inner Loop East: We asked for your thoughts on the highway’s removal. Here’s what we got. Rochester Democrat & Chronicle [Internet]. 2023 Jan 20; Available from: https://www.democratandchronicle.com/story/local/2023/01/20/qa-howremoving-the-inner-loop-changed-east-rochester/69713453007/
71. Magioncalda J. Interstate 81 and the Inner Loop: Viaducts for environmental racism [Internet]. 2023 Feb. Available from: https:// planetforward.org/story/interstate-81-environmental-racism/
72. U.S. Government Accountability Office. Highway Infrastructure: Better Alignment with Leading Practices Would Improve DOT’s Reconnecting Communities Pilot Program [Internet]. 2023. Available from: https://www.gao.gov/products/gao-23-105575
73. National Poverty in America Awareness Month: January 2024 [Internet]. United States Census. 2024. Available from: https:// www.census.gov/newsroom/stories/poverty-awareness-month.html#:~:text=Official%20Poverty%20Measure,decreased%20 between%202021%20and%202022.
Primary Author: Siobhan Mitchell, 2023 Design and Wellness Fellow Advisory Panel: Katherine Howe, Douglas Adams, Nasra Nimaga, Hanna Negami, Mindy No

Facility
Eligible Projects
Metropolitan planning organizations Nonprofit organizations
Road, street, parkway, other transportation facility which creates a barrier to community connectivity
Public engagement
Planning studies assessing feasibility
Other planning activities removal, retrofitting or mitigating an eligible facility; replacement with new facility that restores connectivity; delivery community benefits/ mitigate impacts identified through NEPA process
Facility owner
Eligible applicants from planning grants with the facility owner as a joint application endorsing the application
Road, street, parkway, other transportation facility which creates a barrier to community connectivity
Preliminary design activities and environmental studies
Predevelopment/preconstruction
Permitting activities (e.g., NEPA)
This section summarizes the measures and categories encompassed by Spatial Equity NYC (2023).
Asthma (adult asthma prevalence)
Noise Pollution (dB)
Traffic Fatalities (per 100,000 in given geographic area)
Traffic Injuries (per 100,000 in given geographic area)
Air Pollution (PM2.5 11.74 µg/m3)
Surface Temperature (average summer temperature deviation from mean)
Permeable Surface Area (area squared)
Tree Canopy (% canopy coverage)
Park Access (% of residents within 10-minute walk to a park)
Bike Parking (bike parking spaces per 10,000 residents)
Bus Lanes (% of street miles with bus lane/busway)
Bus Speeds. (average mph)
Protected Bike Lanes (% of street miles with protected bike lane)
Public Seating (benches per 10,000 residents)
This section aims to inform how spatial equity indicators area measured and where information is available. Where no data source is provided, local/municipal agencies are the most likely source of the data.
SPATIAL EQUITY PRINCIPLE
MEASUREMENT & DEFINITION
Asthma Adult or child asthma prevalence: number of adults/ children with asthma divided by the total population
Noise Pollution Decibels
Traffic Fatalities Fatality Rate (per 100,000 people)
Air Pollution
Surface Temperature
PM2.5 ug/m3 O3/ozone
Permeable Surface Area
Tree Canopy
Average summer temperature deviation from the mean Solar Reflective Index (SRI)
EVALUATION FRAMEWORK
How does local asthma prevalence compare to the national average?
What proportion of the population is exposed to noise pollution levels above 50dB?
How are traffic fatalities concentrated around the project site?
How do traffic fatalities in the county of interest compare to other counties nationally?
Does the annual mean concentration of PM2.5 exceed the WHO recommendations of 5 ug/m3?
Does the mean ozone (O3) pollution in peak season exceed the WHO recommendations of 60 ug/m3?
What percentage of paved areas have a solar reflectance index (SRI) over 40?
Does the project provide increase shade with focus over waiting, leisure, and active recreation?
POTENTIAL DATA SOURCE
CDC PLACES
University of Washington Noise Pollution Map
US DOT Traffic Fatalities
U.S. EPA AirCompare
Total impervious surface area
Tree canopy coverage
Does the project decrease the total impervious surface area?
Does the tree canopy coverage in the project area (census tract) cover 30% of the area?
Climate Central Urban Heat Island Map
NIHHIS Heat Equity Map
American Forests Tree Equity Score
Park Access
Percentage of residents living within a 10-minute walk to a park
Bike Parking Number of bicycle parking spots available
What percentage of city or neighborhood residents reside within a 10-minute walk to a park?
What percentage of city residents of color reside within a 10-minute walk to a park?
What percent of low-income households are within a 10-minute walk to a park?
How many bicycle parking spots are provided per 10,000 residents?
How many bicycle parking spots are provided per 10,000 feet of public space?
Bus Lanes
Linear feet of bus lanes
Bus Speeds Miles per hour (mph)
Protected Bike Lanes
Linear feet of protected bike lanes
Traffic Volume Count of vehicles at roadways within 500 meters
Are priority bus lanes installed in high traffic areas?
What is the average bus speed?
How do bus speeds compare to private vehicle speeds?
Does the project introduce protected bike lanes?
Have traffic calming measures been introduced in the surrounding area?
Does the project reroute traffic volume away from housing and schools?
Public Seating
Does the design add public seating?
Does 50% of seating have backs to provide comfort and accessibility?
Is accessible companion seating provided?
Climate and Economic Justice
Screening Tool