Progettiamo un futuro in grado di creare valore condiviso e di sostenere il cambiamento, aumentando la connettività in un’ottica di transizione ecologica e digitale.
Gallerie e Grandi Opere Sotterranee
Anno XLVII - N. 154 - Giugno 2025
Periodico trimestrale, riconosciuto dal C.N.R. della Società Italiana Gallerie – Italian Tunnelling Society – Member of ITA/AITES
ISSN: 0393-1641/S. Anagrafe Naz. delle Ricerche: cod. 318915PS
Editors: Ettore Accenti, Lorenzo Batocchioni, Daniela Boldini, Massimiliano Bringiotti, Carlo Callari, Remo Di Lorenzi, Stefania Fabozzi, Mauro Tutinelli
Editors Secretary: Ludovica Roda
Scientific Commitee: 56 esperti internazionali (informazioni dettagliate su: www.societaitalianagallerie.it)
Hanno collaborato a questo numero: Antonio Anania, Francesco Azzarone, Roberto Crova, Luca D’Accardi, Antonio Di Sandro, Matteo Falanesca, Marinella Galletto, Luca Giacomini, Vincenzo Ierardi, Marco Laffranchi, Simone Lolli, Andrea Magliocchetti, Davide Merlini, Iacopo Migliori, Pasquale Paladino, Boris Piccini, Massimo Pietrantoni, Salvatore Proto, Fabio Rizzo, Valentino Sevino, Beatrice Spina, Maurizio Tanzini, Enrico Trapasso, Marco Trezzi, Andrea Zambon, Luca Zecchetto.
Editore:
S.I.G. Società di Servizi S.r.l. Via Giovanni da Procida, 7 – 20149 Milano, (MI) Tel.: +39 02 25715805; Tel./Fax: +39 02 25708152 www.societaitalianagallerie.com
e-mail: info@societaitalianagallerie.it
Gestione editoriale abbonamenti e pubblicità: Casa Editrice Prof. Riccardo Pàtron & C. S.r.l. Via Marsala, 31 – 40126 Bologna, (BO) Tel. 051 767003 www.patroneditore.com
e-mail: info@patroneditore.com
Grafica e Impaginazione: Exegi Snc - Bologna Stampa: Tipografia Negri, Bologna - Luglio 2025
Autorizzazione del Tribunale di Torino no 2638 del 25.11.76
Pubblicazione trimestrale ai soci della Società Italiana Gallerie
Le opinioni espresse dagli Autori non impegnano la Direzione. Tutti i diritti di riproduzione sono riservati. Abbonamenti 2024
Per abbonamenti e ordini di arretrati, rivolgersi all’Ufficio Abbonamenti: abbonamenti@patroneditore.com o collegarsi al sito www.patroneditore.com/riviste.html Per ricevere i pdf dell’intera Rivista può essere inoltrata richiesta alla Segreteria della Società Italiana Gallerie (segreteria@societaitalianagallerie.it)
I pdf dei singoli articoli e gli abbonamenti online possono essere richiesti solo collegandosi al sito www.patroneditore.com/riviste.html Gli abbonamenti hanno decorrenza gennaio-dicembre, con diritto di ricevimento dei fascicoli già pubblicati, se sottoscritti in corso d’anno. I fascicoli cartacei non pervenuti vengono reintegrati non oltre 30 giorni dopo la spedizione del numero successivo. Modalità di pagamento: Versamento anticipato adottando una delle seguenti soluzioni: – c.c.p. n. 000016141400 intestato a Casa Editrice Prof. Riccardo Pàtron & C. S.r.l. - via Badini 12 - Quarto Inferiore - 40057 Granarolo dell’Emilia - Bologna - Italia – bonifico bancario a INTESA SAN PAOLO SPA, Filiale, Ag. 68 – Via Pertini 8 – Quarto Inferiore 40057 Granarolo dell’Emilia – Bologna – Italia
IBAN: IT58V0306936856074000000782
BIC: BCITITMM – carta di credito o carta prepagata a mezzo PAYPAL (www.paypal.it) specificando l’indirizzo e-mail amministrazione@patroneditore.com nel modulo di compilazione per l’invio della conferma di pagamento all’Editore.
Per pubblicare un articolo sulla Rivista Gallerie e Grandi Opere Sotterranee occorre inviare il manoscritto all’indirizzo redazione@societaitalianagallerie.it redatto secondo il format scaricabile dal sito www.societaitalianagallerie.it La revisione degli articoli è a cura dell’Editorial Board della rivista. Le opinioni dell’Autore non impegnano l’Editorial Board, ma esclusivamente la responsabilità dell’Autore stesso che garantisce l’originalità del proprio manoscritto e l’assenza di vincoli e di licenze per la pubblicazione, lasciando indenne la rivista da qualsiasi onere presente e futuro.
EDITORIALE
A. Pigorini
Grazie “Gallerie”!
D. Boldini, A. Pigorini
Special Issues on Tunnelling Projects in Italy
INTERVISTA A:
Aldo Isi
Amministratore Delegato e Direttore Generale di Rete Ferroviaria Italiana (RFI)
F. RIZZO, F. AZZARONE, M. GALLETTO, L. D’ACCARDI, R. CROVA
Turin Metro Line 2 – Challenges and Innovative Solutions
M. TANZINI, D. MERLINI, L. ZECCHETTO, M. TREZZI, M. FALANESCA, A. ANANIA, M. LAFFRANCHI
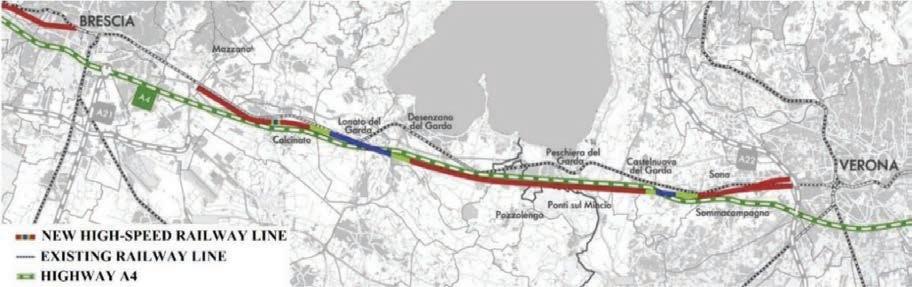
Tunnels along the new high-speed Brescia-Verona Railway Line – Design, Construction, Performance and Challenges
L. GIACOMINI, A. MAGLIOCCHETTI, I. MIGLIORI, A. ZAMBON, S. LOLLI
Real-time monitoring and predictive analysis in San Donato tunnel project
M. PIETRANTONI, S. PROTO, V. IERARDI, B. SPINA, E. TRAPASSO, P. PALADINO, B. PICCINI, A. DI SANDRO
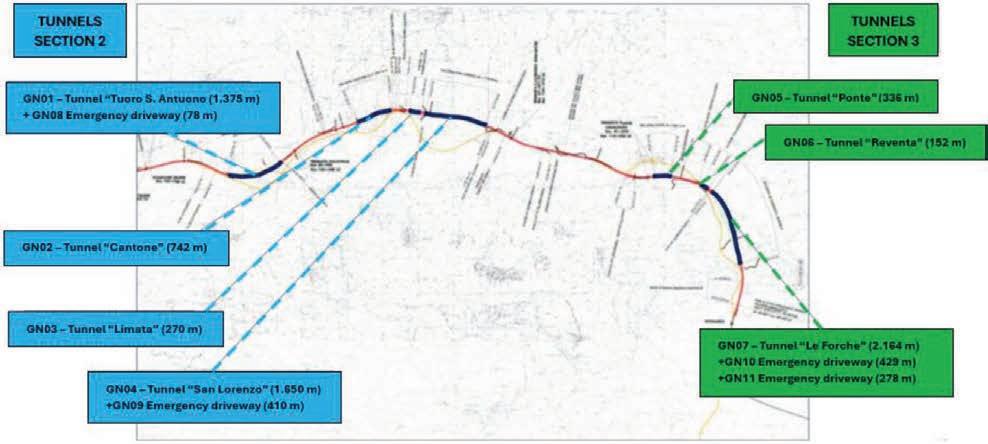
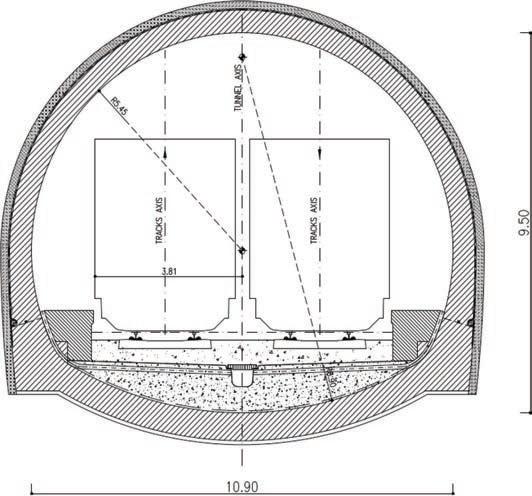
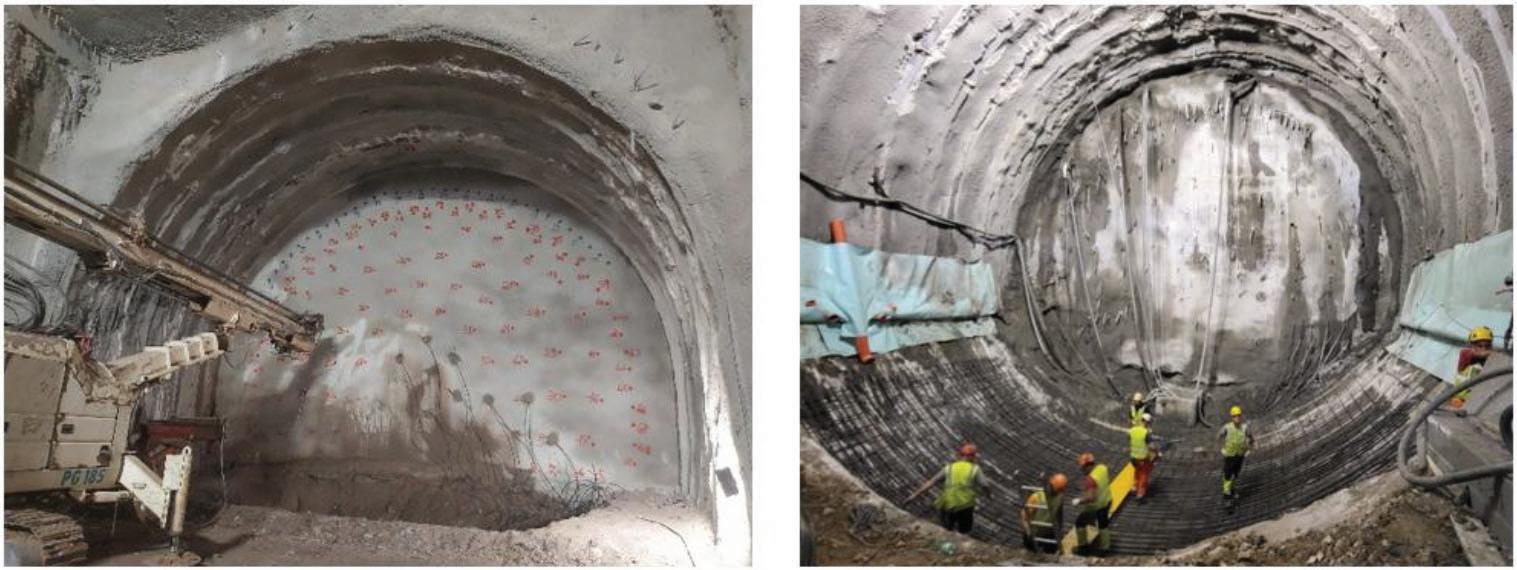
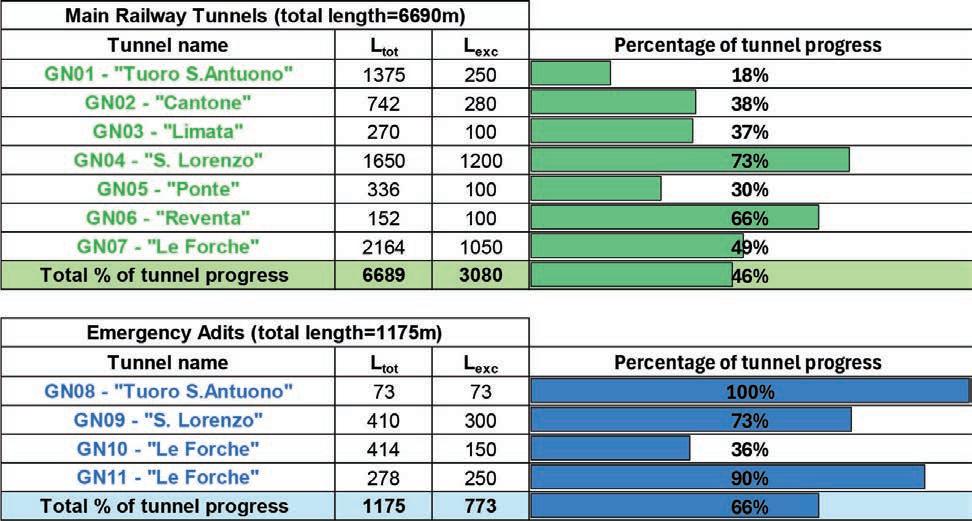
Naples-Bari H-S Railway Telese-San Lorenzo-Vitulano Section. Experiences of tunnels excavation in heterogenous geological formations
TECNOLOGIA
DAI CANTIERI
CONGRESSI E CONVEGNI
NOTIZIE SIG/ITA
SICUREZZA
SIG YM GROUP
ABBIAMO LETTO
NOTIZIE FLASH
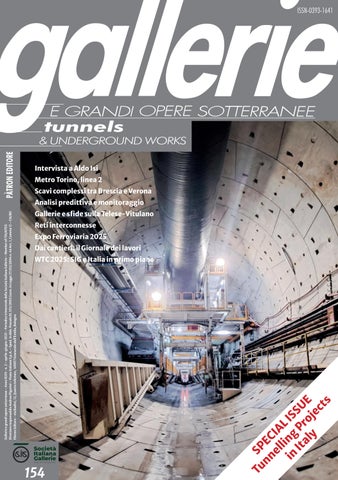
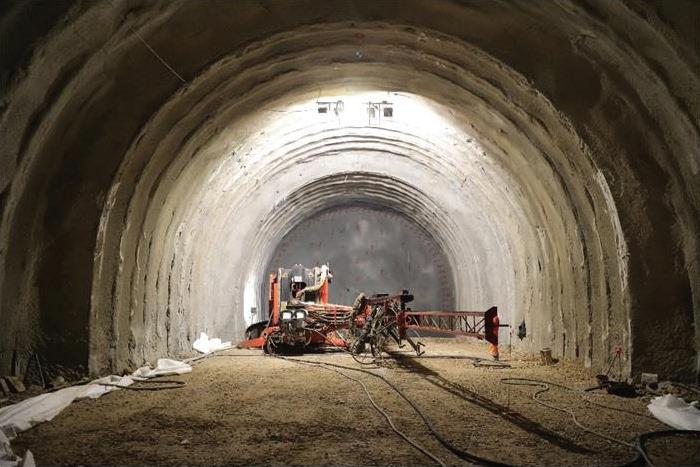
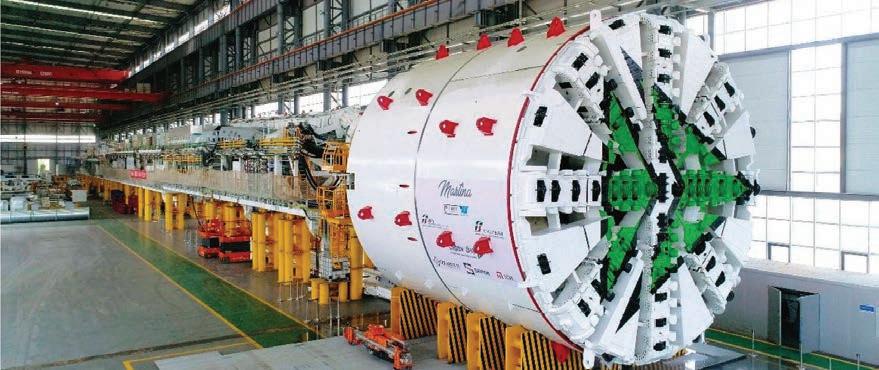
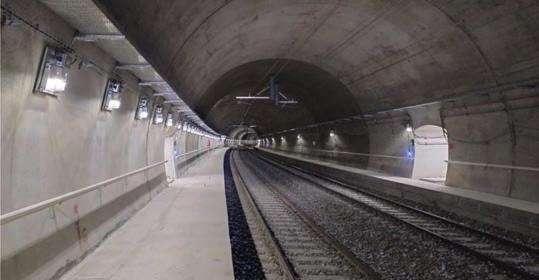
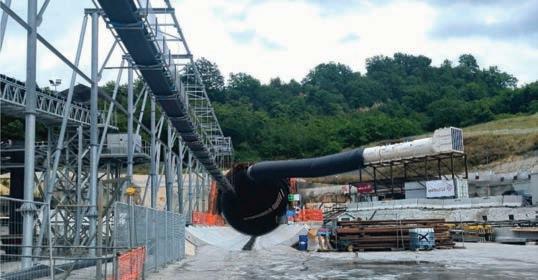
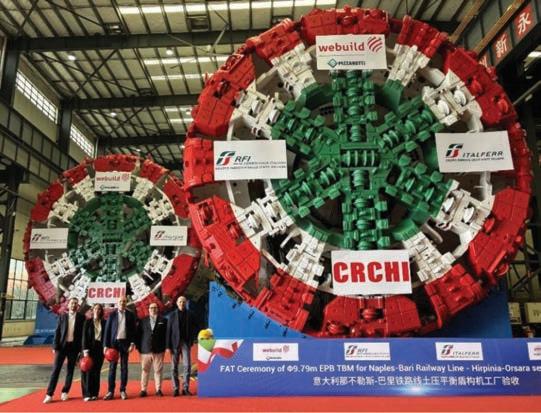
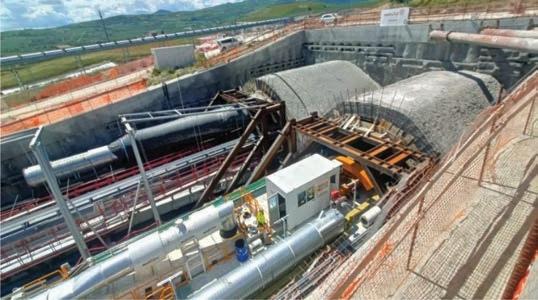
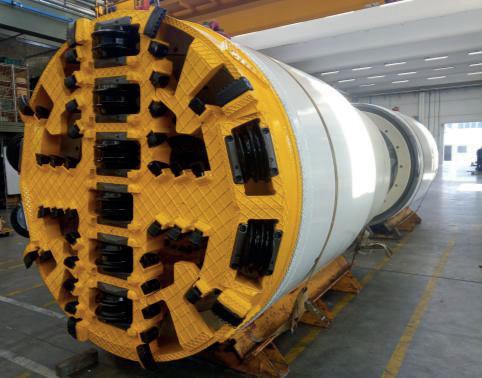
IN COPERTINA: Vista della TBM “Futura” impiegata nello scavo meccanizzato della Galleria Naturale “Rocchetta” per la realizzazione della seconda delle tre gallerie previste sulla Linea AV/AC Napoli-Bari, tratta Apice-Hirpinia. Credit: Vincenzo Santangelo, Italferr.
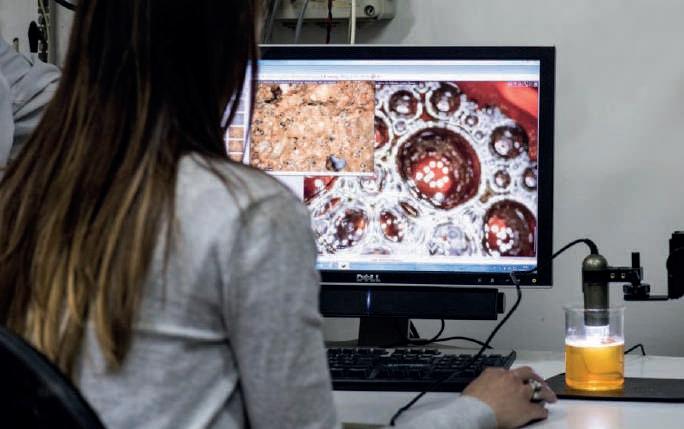
GEEG,startupdiSapienza,UniversitàdiRoma,affianca grandisocietàdiIngegneria,Imprese,fornitoriditecnologiee materialineiprocessidiRicercaeSviluppomediante proceduresperimentalieprotocolliinnovativiutiliinognifase, dal progetto fino ai controlli in corso d’opera.
Cerchi uno spazio in cui informarti su cosa succedenel mondo del sotterraneo? Iscriviti alla newsletter
Terra Terra - Down to Earth Tutto l'underground in un unico posto
Grazie “Gallerie”!
Cari lettori,
con questa “Special Issue” nata da una idea della professoressa Daniela Boldini e organizzato insieme a Lei, si esaurisce il mio incarico come Direttore Responsabile della rivista Gallerie e Grandi Opere Sotterranee, ruolo che ricopro dal 2017 dopo la scomparsa del comune amico Adolfo Colombo, al mio secondo mandato da Presidente dell’Associazione (3 mandati triennali dal 2013-2022), incarico che ho ricoperto anche per questo triennio (2022-2025) da Past President, come da decisione del Consiglio Direttivo.
Andrea Pigorini.
Un po’ di numeri: 8 anni e mezzo, 34 numeri (dal 121 al 154), tra cui 3 numeri speciali (il 129 per il WTC 2019, il numero 150, seguito dal 151 uscito in occasione dei 50 anni dell’Associazione festeggiati a Genova lo scorso anno), un numero doppio (il 135-136 ai tempi della pandemia da Covid 19), 2 Special Issue (144 - Innovation in TBM Tunnelling e appunto il 154) con guest editors. E ancora l’internazionalizzazione della rivista con la pubblicazione degli articoli scientifici in inglese, la possibilità di scegliere tra copia cartacea e copia digitale, un comitato scientifico internazionale che accompagna un processo di peer review solido, per traguardare l’indicizzazione della rivista, senza però trascurare d’altro canto gli articoli tecnici che trovano spazio nella nostra rivista in una sezione dedicata, rappresentando una ricchezza preziosa e fruibile facilmente dai lettori “meno accademici”.
Ma soprattutto “Gallerie” è anche le tante persone che volontariamente le hanno dedicato il proprio tempo: non menziono gli stimati colleghi responsabili prima di me (rimando al numero 150 dove il prof. Pelizza ne ha reso omaggio unitamente a una mirabile sintesi editoriale dei primi 150 numeri) e parto da Renzo Bindi che è stato in tutti questi anni un capo redattore/Advisory Editor prezioso, puntuale riferimento della rivista e sempre attento ai tempi di pubblicazione, a cui si è aggiunto più recentemente il prof. Miliziano, che ringrazio in particolare per aver contribuito alla internazionalizzazione della rivista, oltre a tanti giovani e meno giovani che hanno fatto parte in questi anni della Redazione e del Comitato Scientifico. Grazie a tutti: la vostra passione, competenza e impegno sono stati per me sempre fonte di riflessione: credo che poche Associazioni possano contare su soci così appassionati ed esperti del proprio lavoro.
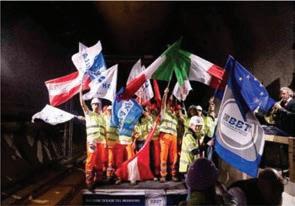
Non c’è che dire, le gallerie sono dei veri e propri “ponti” che oltre a collegare Paesi, città, persone e fornire risposte alle esigenze della collettività, collegano e uniscono i tanti esperti di opere in sotterraneo che contribuiscono nei diversi ruoli alla loro pianificazione, progettazione e costruzione.
È lo spirito della SIG e se allarghiamo i confini è anche quello dell’ITA.
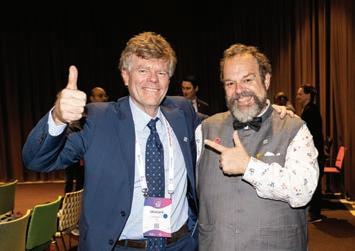
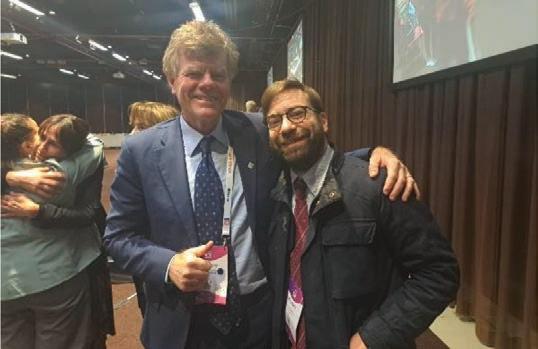
ITA General Assembly 2025 - Il nuovo Presidete neo eletto Andrea Pigorini con il past-President Arnold Dix.
Quanto a me, continuerò a leggere la nostra rivista e ad accompagnare la crescita della nostra Associazione anche dal nuovo ruolo che le 81 Associazioni Gallerie internazionali aderenti all’International Tunnelling and Underground Space Association (ITA) hanno voluto attribuirmi nel recente WTC di Stoccolma: Presidente dell’ITA per il triennio 2025-2028.
Un riconoscimento che nasce dai nostri Maestri (professori Pietro Lunardi e Sebastiano Pelizza), dal lavoro fatto prima di me nell’ExCo ITA dei vari consiglieri SIG che si sono succeduti (Bruno Pigorini, Sebastiano Pelizza – Presidente ITA 1995-1998, Piergiorgio Grasso, Daniele Peila, Giuseppe Lunardi), dalla serietà e competenza con cui SIG ha organizzato manifestazioni internazionali in questi anni (WTC 2019, ITA Award 2024) e dalla grande professionalità e competenza che ci viene riconosciuta nel campo delle opere in sotterraneo. Ad maiora!
Andrea Pigorini
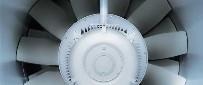
Depolveratori e ventilatori
Tappeti per nastri trasportatori
Controllo accessi in galleria
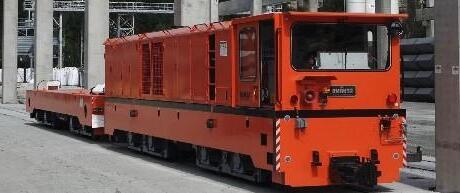
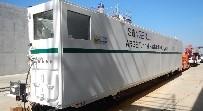
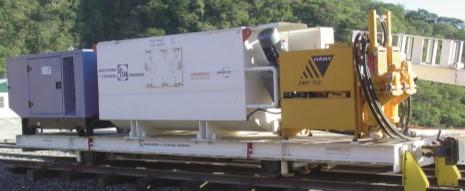
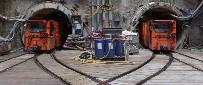
Veicoli speciali per gallerie
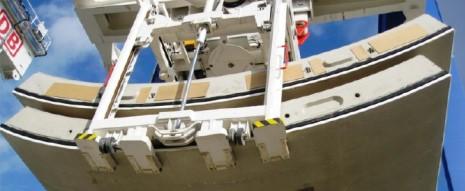
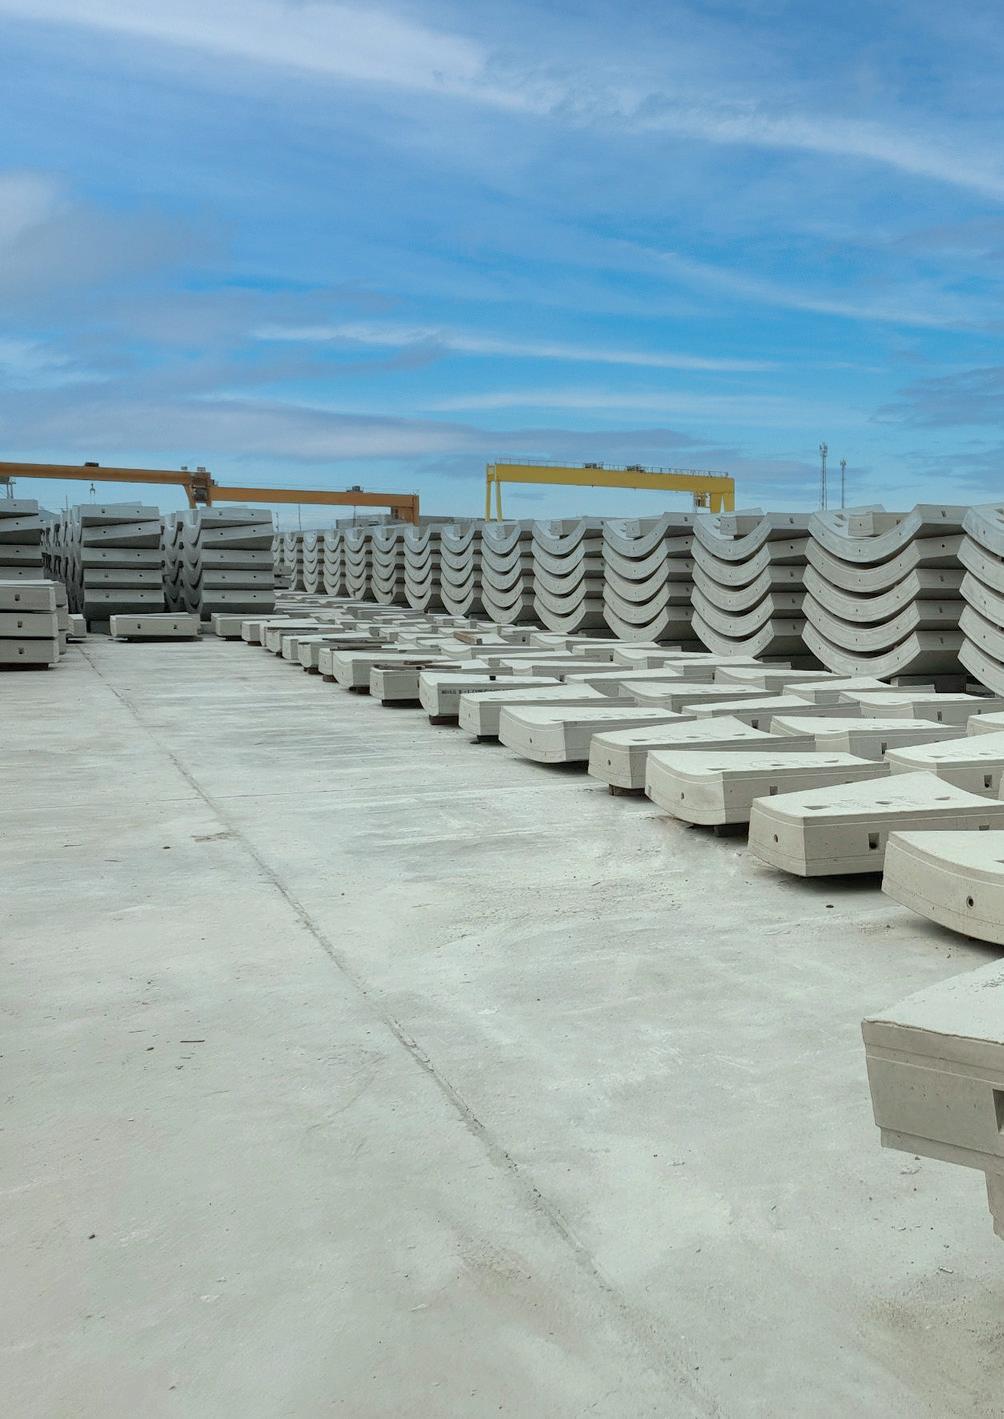
Casseri e impianti di produzione a carosello per conci
Impianti di separazione
SOLUZIONI INNOVATIVE PER LO SCAVO DI OGNI GALLERIA
Schiume e grassi
e rolling stock
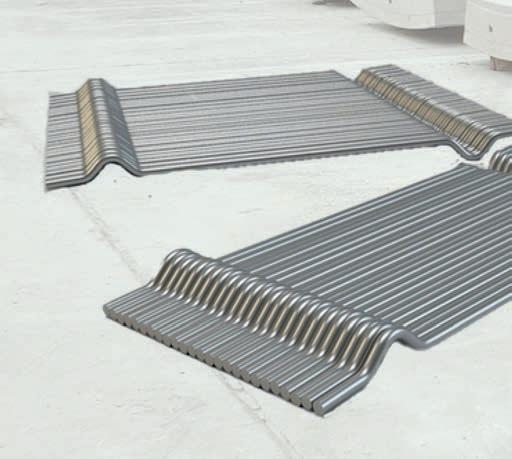
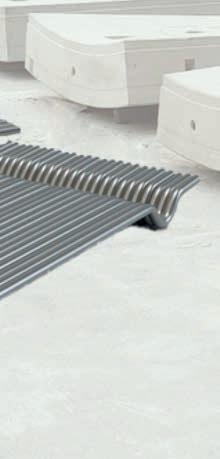
Passerelle pedonali per gallerie
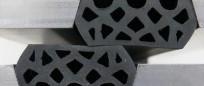
prefabbricati Impianti bicomponente
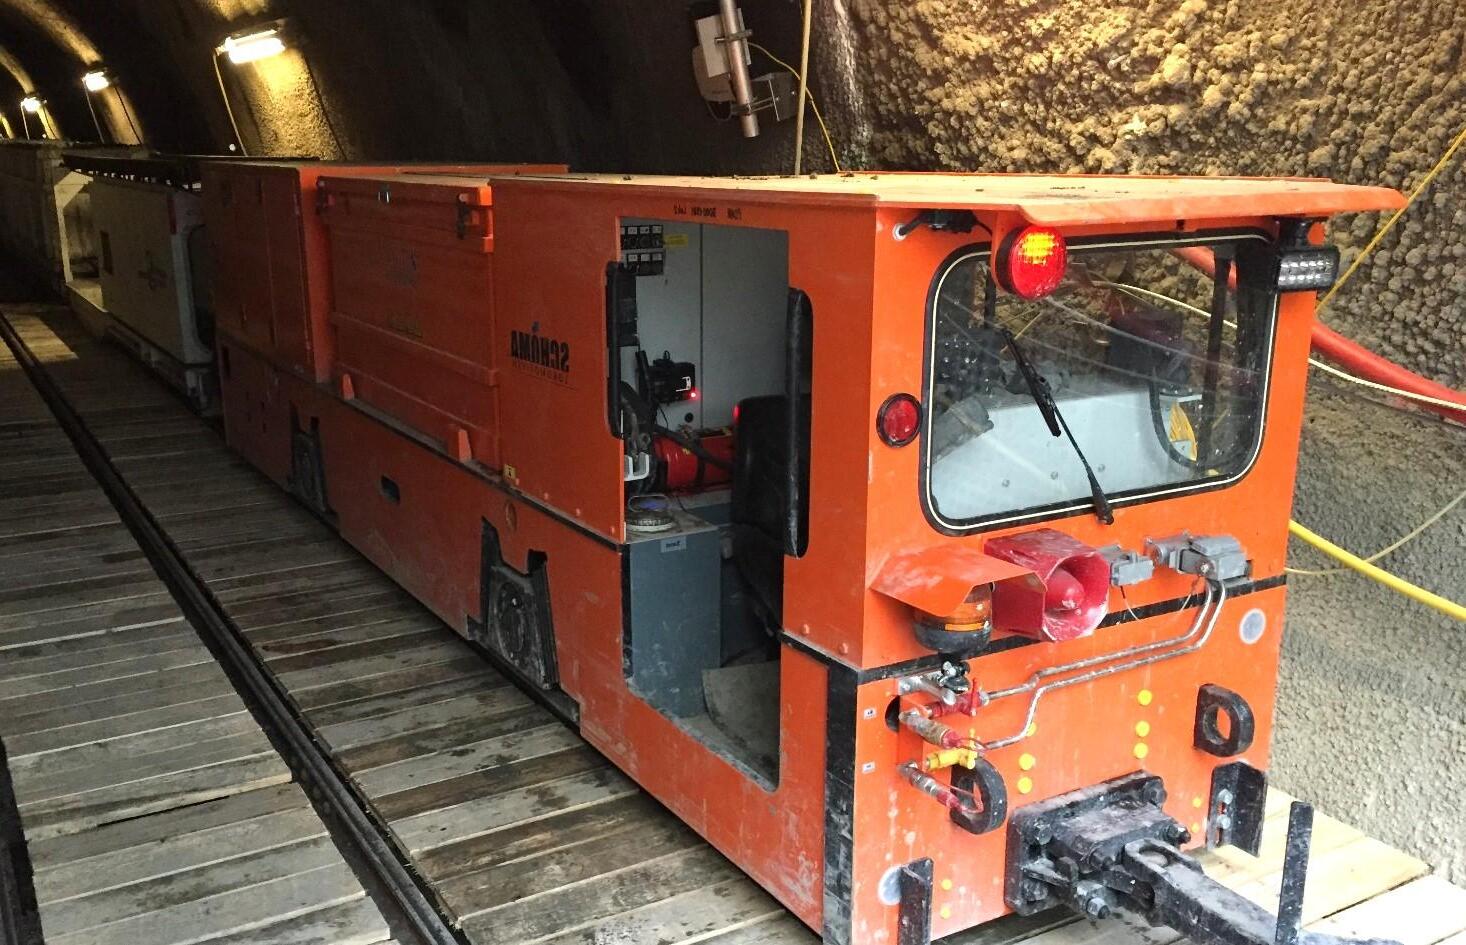
Locomotori
Ponti
Special Issues on Tunnelling Projects in Italy
Geomechanics and Tunnelling(Geomechanik und Tunnelbau) and Gallerie e Grandi Opere Sotterranee (Tunnels and Major Underground Works) have jointly organised two coordinated special issues focusing on the current tunnelling activity in Italy. These issues bring together a substantial collection of technical papers, illustrating the diversity, scale, and complexity of works currently underway across the country.
Daniela Boldini.
The prominent role of Italy in the field of tunnelling and underground construction is far from incidental. Due to its distinctive morphology, the country has long represented a challenging yet stimulating environment for clients, contractors, designers, and the industry as a whole. A popular saying describes Italy as “an island bordered on three sides by the sea, and on the fourth by the Alps”, effectively conveying the scale and geographical barrier posed by the Alpine range, which separates the Italian peninsula from the rest of Europe. Apart from the Po Valley, Italy is characterised by a complex orography extending from north to south, including the islands of Sicily and Sardinia. Moreover, the high population density and intense urbanisation across the country have often made underground solutions a strategic and practical choice for infrastructure development, even in relatively flat areas. This combination of morphological and anthropogenic factors has historically driven a continuous demand for underground connections aimed at overcoming geographical isolation and promoting trade, mobility, and economic growth. As a result, Italian contractors, engineers, and the related industrial sector have progressively acquired extensive expertise in underground works, fostering the development of innovative technologies and design approaches. For all these reasons, Italy today ranks among the world’s leading countries in the field of tunnelling and underground construction. Available online data indicate that Italy holds the second position worldwide in terms of both the number and total length of tunnels, preceded only by China and followed by Japan, Norway, Switzerland, Austria, and France.
The recent surge in tunnelling activities in Italy is closely linked to the substantial public investment plans initiated in the aftermath of the COVID-19 pandemic, most notably through the National Recovery and Resilience Plan (PNRR). Funded by the European Union’s NextGenerationEU programme, the Italian PNRR is the largest among those of EU Member States, with a total allocation of approximately € 194.5 billion, of which a significant portion has been earmarked for the modernisation and development of the country’s infrastructure. This unprecedented financial commitment has provided a decisive impetus for the advancement of numerous large-scale projects, particularly in the transport sector, where underground works play a key role in enhancing connectivity, reducing environmental impact, and overcoming the country’s complex orography and urban density. Notably, the PNRR allocated approximately € 23.8 billion to Mission 3, “Infrastructure for Sustainable Mobility,” representing about 12.2% of the total plan. Within this mission, around € 22.8 billion is dedicated to the development of the national railway network, and € 1.0 billion to intermodality and integrated logistics. These investments have significantly contributed to the proliferation of initiatives in the infrastructure sector, particularly in underground construction and tunnelling, reinforcing Italy’s position as a global leader in this field.
This unprecedented wave of investment and construction activity forms the framework for these coordinated special issues, which gather a representative selection of technical papers addressing some of the most significant underground infrastructure projects currently in progress across the country. The ten contributions are distributed between the two journals, with six papers published in Volume 4/2025 of Geomechanik und Tunnelbau and four in Volume 154/2025 of Gallerie e Grandi Opere Sotterranee, offering a comprehensive overview of key projects and pertinent topics within the Italian tunnelling sector. All papers are freely accessible online at the respective journal websites: https://onlinelibrary.wiley.com/toc/18657389/2025/18/4 for Geomechanics and Tunnelling and https://www.societaitalianagallerie.it/menu/journal-gallerie/the-journal/ for Gallerie e Grandi Opere Sotterranee
Gallerie e Grandi Opere Sotterranee n. 154 – giugno 2025
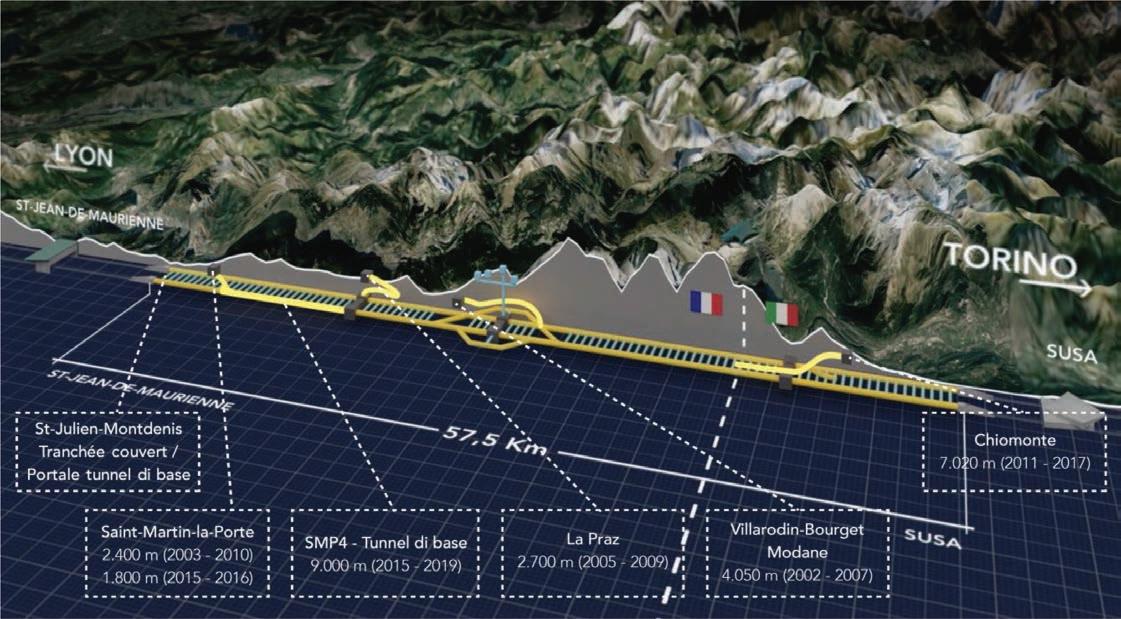
The first three papers published in Geomechanics and Tunnelling are devoted to railway base tunnels. Specifically, the first two, by Marini et al. and Turi et al., focus on the trans-national tunnels excavated beneath the Alps between Fortezza (Italy) and Innsbruck (Austria), namely the Brenner Base Tunnel, and between Turin (Italy) and Lyon (France), namely the Mont Cenis Base Tunnel. The third paper, prepared by Cassani et al., concerns the Terzo Valico dei Giovi project, excavated trough the Alps-Apennines contact zone between Genoa and Turin. The following two papers deal with tunnels excavated in urban environments. In particular, the fourth paper, co-authored by Romani et al., addresses the metro station under construction in Piazza Venezia, Rome, for the new Metro C line. The fifth, by Lia et al., discusses the high-speed railway underpass beneath the city of Florence. Finally, the sixth contribution, by Carigi et al., reviews the 2022 Italian Guidelines for the Risk Classification, Safety Evaluation, and Monitoring of Existing Roadway Tunnels.
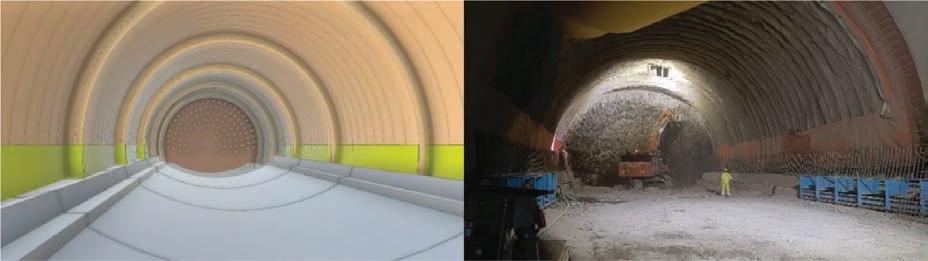
As for the four papers published in Gallerie e Grandi Opere Sotterranee, they describe other relevant projects in the Italian tunnelling scene. The first, by Rizzo et al., discusses the main challenges and innovative solutions implemented in the design of the new Turin Metro Line 2. The second, by Tanzini et al., is dedicated to the underground works of the new high-speed railway line between Brescia and Verona. The third paper, by Giacomini et al., refers to the new San Donato highway tunnel being excavated north of Florence, parallel to the existing line. Finally, the last one, by Pietrantoni et al., describes the Telese-Santo Lorenzo MaggioreVitulano lot under construction for the new Naples-Bari high speed railway line.
Together, these contributions offer a significant overview of the ongoing developments and testify to the vibrant momentum currently characterising the Italian tunnelling sector. We hope you will enjoy reading these contributions and find them both informative and inspiring!
On behalf of the Scientific Committee: Daniela Boldini (Coordinator of the project and Guest Editor of Geomechanics and Tunnelling ) Andrea Pigorini (Editor in Chief of Gallerie e Grandi Opere Sotterranee)
Scientific Committee of the Special Issues project:
Prof. Eng. Daniela Boldini, Sapienza University of Rome
Prof. Eng. Emilio Bilotta, University of Naples “Federico II”
Eng. Renzo Bindi, RockSoil S.p.A.
Eng. Andrea Magliocchetti, Autostrade per l’Italia S.p.A.
Prof. Eng. Salvatore Miliziano, Sapienza University of Rome
Prof. Eng. Daniele Peila, Polytechnic University of Turin
Eng. Andrea Pigorini, Italferr S.p.A.
Prof. Eng. Gianpiero Russo, University of Naples “Federico II”
Eng. Diego Sebastiani, GEEG S.r.l.
Eng. Carmine Todaro, Polytechnic University of Turin
Aldo Isi
Amministratore Delegato e Direttore Generale di Rete Ferroviaria Italiana (RFI)
Laureato in Ingegneria Civile all’Università degli Studi di Parma, l’ing. Aldo Isi ha iniziato la propria carriera nel Gruppo Ferrovie dello Stato Italiane nel 1999, a Bologna, con incarichi di progettazione e Direzione Lavori nel settore Armamento e Opere Civili di Rete Ferroviaria Italiana. Sempre in RFI, ha ricoperto molteplici incarichi di responsabilità crescente, dapprima nell’area dell’Ingegneria Civile e in seguito nell’area Sicurezza. Nel 2009 ha assunto la gestione dell’Unità Territoriale Emilia – Manutenzione ed Esercizio. Dal 2011 al 2014 ha rivestito l’incarico di Responsabile della Direzione Territoriale Produzione di Bologna e, successivamente, dal 2014 al 2016 è stato Responsabile della Direzione Territoriale Produzione di Milano. Nel febbraio del 2016 gli viene affidato il ruolo di Direttore Investimenti di Rete Ferroviaria Italiana, con sede a Roma. Nel dicembre 2018 l’ing. Aldo Isi è stato nominato Amministratore delegato e Direttore generale di Italferr, Società di ingegneria del Gruppo FS Italiane; dal 2021 al 2025 è stato Amministratore Delegato e Direttore Generale di ANAS e attualmente ricopre la carica di Amministratore Delegato e Direttore Generale di Rete Ferroviaria Italiana (RFI).
Buongiorno ing. Isi, è con grande piacere che Gallerie la intervista per la terza volta nel corso degli ultimi 10 anni, durante i quali ha ricoperto il ruolo di Amministratore Delegato e Direttore Generale presso tre importanti società del gruppo FS Italiane: Italferr, Anas ed RFI. Da queste importantissime posizioni per il sistema infrastrutturale del Paese, la prima domanda viene spontanea: potrebbe illustrare ai nostri lettori le differenze e punti di eccellenza (ed eventualmente di miglioramento) di ANAS e RFI, i due maggiori gestori di infrastrutture e committenze italiane? Ci sono sinergie che sono state messe in campo o che potrebbero essere messe in campo a breve? ANAS e RFI rappresentano due pilastri complementari del sistema infrastrutturale nazionale.
RFI è impegnata nella realizzazione di un grande piano di investimenti nei prossimi dieci anni, per un ammontare di oltre 100 miliardi. L’obiettivo è potenziare e manutenere la rete ferroviaria del Paese per renderla sempre più affidabile e sicura, in grado di sostenere lo sviluppo dell’economia na-
zionale e permettere lo spostamento di persone e merci in modo sempre più efficiente e sostenibile.
Similmente, ANAS è caratterizzata da un’attenzione crescente alla sicurezza, alla resilienza e all’innovazione, portando avanti investimenti strategici per il potenziamento e la manutenzione dell’infrastruttura stradale. Quanto alle sinergie, l’integrazione tra infrastrutture ferroviarie e stradali è un fattore abilitante per un trasporto intermodale fluido ed efficiente. A questo scopo lo scorso anno abbiamo sviluppato un Piano Integrato di sviluppo, analizzando congiuntamente gli sviluppi previsti da entrambi i gestori ed evidenziando i “missing links”. La vista integrata ha consentito anche alcune revisioni progettuali, in ottica di ottimizzazione rispetto ai flussi di mobilità attesi. La collaborazione su progetti condivisi, come nodi intermodali o corridoi logistici integrati, rappresenta infatti un volano per l’efficienza complessiva del sistema Paese: basti pensare allo sviluppo di dorsali energetiche e di telecomunicazione comuni o il potenziamento dei sistemi di protezione rispetto ad eventi esterni (es: idrogeologia e sismica)..
Come vede il grande piano infrastrutturale in corso (stradale e ferroviario) di sviluppo e ammodernamento della rete di trasporto, per rendere il nostro Paese da un lato collegato e connesso con l’Europa e dall’altro connesso con collegamenti moderni e veloci anche del sud della penisola: a che punto siamo? Il grande piano infrastrutturale in atto è molto più di un insieme di cantieri: è una leva strategica per ridisegnare l’Italia, rendendola più connessa, equa e sostenibile. Le opere in corso mirano a colmare i divari territoriali, migliorare l’accessibilità e rafforzare il legame con i corridoi europei. RFI ha già raggiunto importanti traguardi, come il completamento di due target europei nel 2023 e altri quattro nel 2024. Entro il 2025, dovremo garantire l’attivazione dell’ERTMS su almeno 1.400 chilometri di rete e completare almeno 70 chilometri di nuovi collegamenti ferroviari interregionali. Il PNRR ha dato un’accelerazione decisiva, soprattutto per il Sud, con investimenti mirati su linee AV, elettrificazione, resilienza e potenziamento delle stazioni, con uno stanziamento complessivo, per RFI, di circa 22 miliardi di euro.
Dove possiamo ancora migliorare, per amplificare l’effetto positivo dell’ingente mole di interventi di sviluppo, in ambito ferroviario e stradale, sono le opere complementari, come ad esempio i punti di accesso al sistema logi-
Aldo Isi.
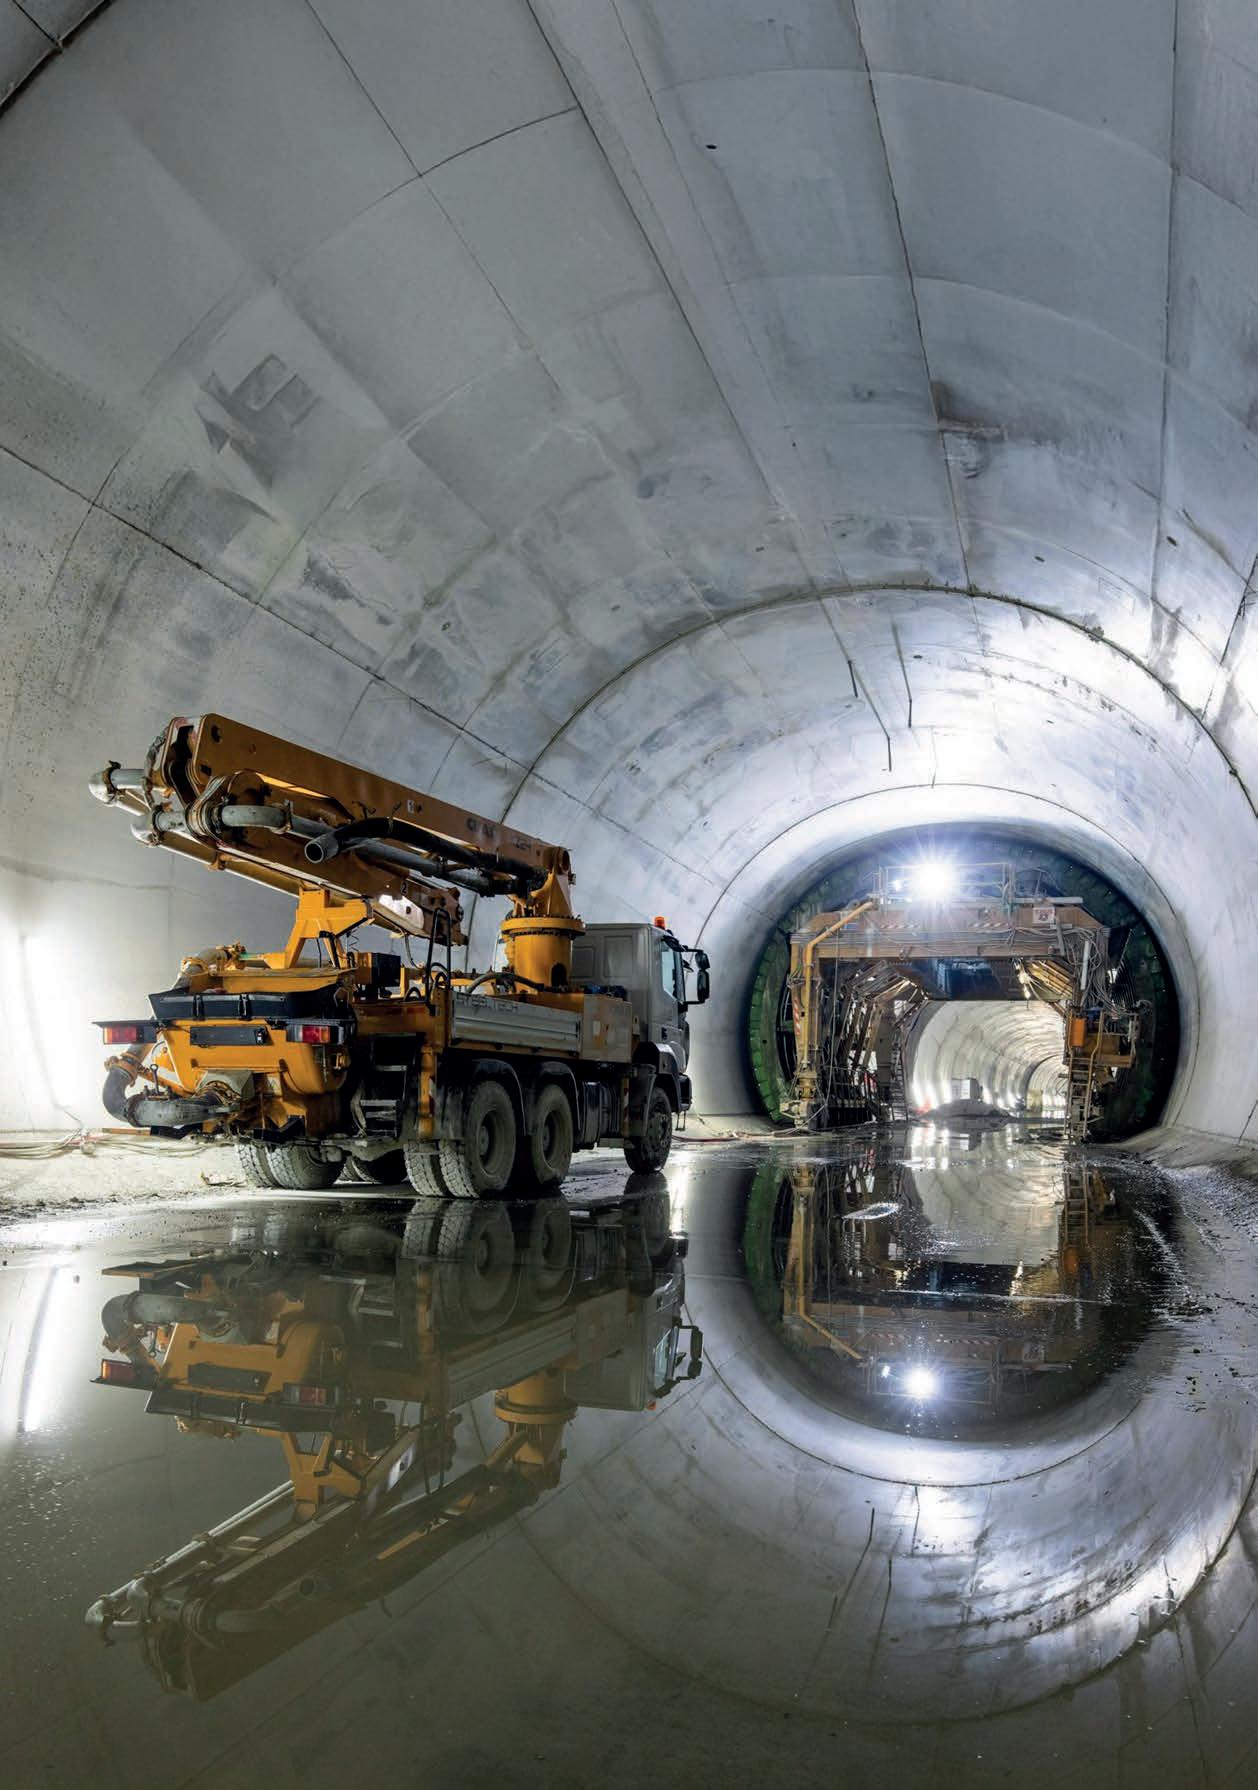
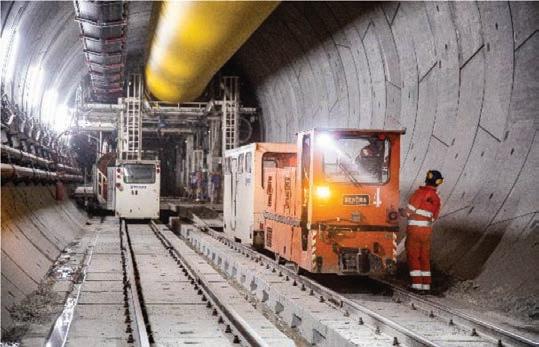
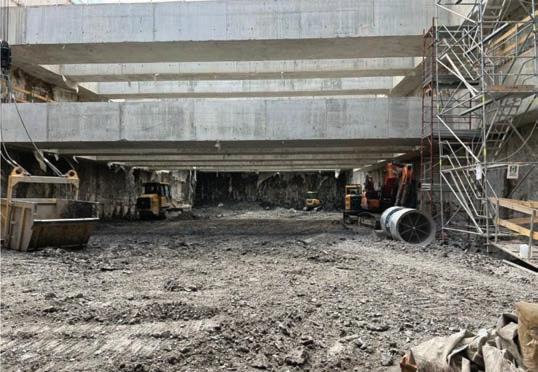
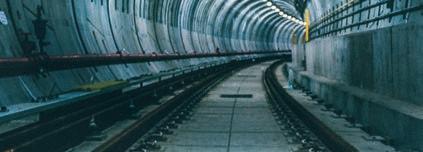
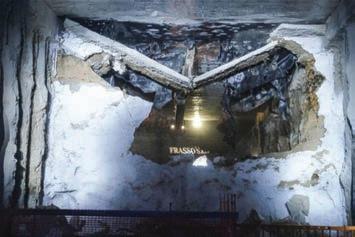
Napoli-Bari Galleria San Lorenzo lato Cancello.
interventi di potenziamento infrastrutturale e tecnologico. Tali interventi determineranno ripercussioni positive sul trasporto ferroviario sia regionale che a lunga percorrenza, con miglioramenti in termini di regolarità e puntualità del traffico ferroviario. Gli interventi in corso e quelli programmati consentiranno di innalzare la velocità fino a 250 km/h e la conclusione per fasi permetterà progressive riduzioni dei tempi di percorrenza, a vantaggio delle persone che viaggiano per motivi di lavoro, studio e turismo. Per affrontare queste sfide, la formazione continua è fondamentale ed investire in competenze, sicurezza e innovazione è la chiave per garantire qualità e sostenibilità.
stico, i collegamenti di ultimo miglio, la digitalizzazione delle informazioni ai clienti nelle stazioni, che integrano e completano i più importanti interventi di sviluppo dei corridoi rendendo l’esperienza di trasporto sempre più “seamless”.
Ma il valore aggiunto va oltre la mobilità: si tratta di un’occasione per promuovere coesione sociale, attrattività dei territori e sviluppo economico in chiave sostenibile.
Lato RFI a parte le opere in corso di realizzazione (anche grazie ai fondi PNRR), quali altri progetti e realizzazioni sono in rampa di lancio per dare continuità a cantieri, imprese, mondo industriale post PNRR (2026)? Il completamento delle opere PNRR è la priorità immediata, ma RFI guarda già oltre.
Il Piano Industriale 2025-2029 prevede circa 58 miliardi (di cui meno della metà nei primi due anni di orizzonte PNRR) di investimenti per trasformare radicalmente la geografia ferroviaria italiana per migliorare l’accessibilità urbana e territoriale, con un’attenzione particolare a porti, aeroporti e poli logistici e andare verso una mobilità integrata, resiliente e sostenibile. Nel prossimo futuro, entro il 2029, puntiamo ad aumentare del 30% il numero di persone raggiunte dall’Alta Velocità, a migliorare – velocizzandole – le connessioni a carattere regionale, a incrementare su tutta la rete la qualità del servizio, in particolare in termini di puntualità, a far evolvere il ruolo delle stazioni, che nella nostra vision si arricchiranno di servizi al viaggiatore e al territorio e, dal punto di vista della sostenibilità, ad accompagnare la transizione energetica attraverso l’installazione di oltre un Gigawatt di fotovoltaico ed altri interventi di gestione ottimizzata dell’energia. Inoltre, entro il 2040 puntiamo a coprire il 100% della rete Core Extended con il sistema ERTMS, mantenendo un focus costante e le nostre priorità saranno su la sicurezza, la puntualità, l’affidabilità e più in generale, l’incremento della soddisfazione dei passeggeri.
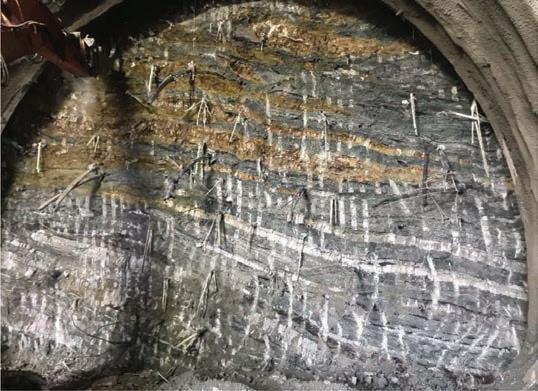
Tante opere sia in realizzazione che in progettazione prevedono lunghe gallerie che spesso attraversano contesti geotecnici complessi vuoi per attraversamenti urbani (vedi passante AV di Firenze) o Alpini (le gallerie di valico transnazionali con Austria e Francia) o Appenninci (i lotti della Napoli Bari o della Salerno Reggio Calabria): come valuta da Committente le competenze e il know how dei vari attori che concorrono alla costruzione di queste opere che possono indubbiamente a volte presentare grandi difficoltà tecniche: progettista, direzione lavori, imprese generali e specialistiche, mondo industriale. La realizzazione di gallerie in contesti geotecnici sfidanti – dalle Alpi agli Appennini, passando per i centri urbani – richiede un ecosistema di competenze altamente specializzate. RFI gestisce una rete imponente, con oltre 1.500 gallerie, e sa bene quanto sia cruciale il contributo di progettisti, imprese, direzioni lavori e industria. Nel meridione, Rete Ferroviaria Italiana ha in corso la realizzazione di opere ferroviarie di grande impegno tecnico ed economico. È in corso di realizzazione la nuova linea Napoli Bari e la direttrice Salerno Reggio Calabria; inoltre, la rete ferroviaria siciliana è oggetto di importanti e significativi
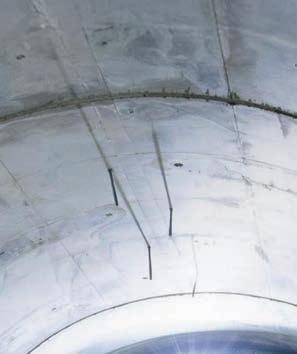
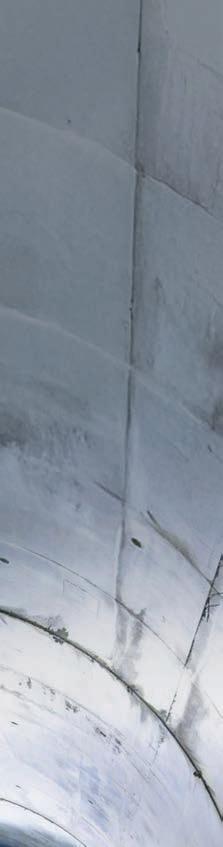
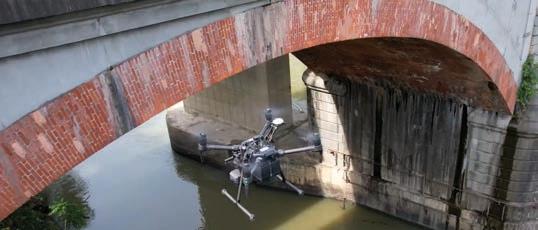
Attualmente RFI ha qualificato oltre 750 imprese che operano secondo i più alti standard tecnici e che rappresentano un patrimonio strategico da valorizzare e accompagnare nella transizione tecnologica. Per lo scavo delle gallerie sono previste tecnologie all’avanguardia con il ricorso, ove possibile, allo scavo meccanizzato tramite TBM di nuova generazione. Un esempio di tecnologia innovativa, adottato per la prima volta in Italia nella Galleria Casalnuovo della nuova tratta ferroviaria Napoli - Cancello dell’Alta Velocità Napoli-Bari, consente l’esecuzione dello scavo in presenza di falda: scavo iperbarico. Questa tecnologia prevede l’immissione di aria compressa all’interno della Galleria da scavare che contrasta la spinta della falda, consentendo, quindi, l’esecuzione di tutte le lavorazioni in condizioni asciutte. Inoltre, RFI è sempre impegnata nella ricerca di innovazioni volte a migliorare la sicurezza e il monitoraggio delle proprie infrastrutture con l’introduzione di sistemi di diagnostica finalizzata ad una manutenzione predittiva. Un esempio sono i sistemi di diagnostica mobile mediante l’utilizzo di telecamere laser che, mediante immagini 2D e profili 3D ad alta risoluzione della galleria rilevata, consentono di rilevare in maniera automatica i difetti delle gallerie. Questi sistemi permettono di individuare deformazioni, fessurazioni, distacchi e altri fenomeni di degrado del rivestimento delle gallerie con un’elevata accuratezza (millimetrica); i dati possono essere esportati e utilizzati per la costruzione di modelli digitali tridimensionali georeferenziati utili a pianificare anche i necessari interventi manutentivi.
Tali modelli vengono integrati nei sistemi informativi aziendali per alimentare processi di manutenzione predittiva e supportare le decisioni ingegneristiche con dati oggettivi e aggiornati, digitalizzando l’intero ciclo di vita dell’opera, in linea con i principi del Building Information Modeling (BIM) e della manutenzione 4.0. L’integrazione con sistemi di allerta precoce, come il SANF-RFI per il monitoraggio delle frane pluvio-indotte e il sistema di Early Warning Sismico, per la gestione dell’emergenza a seguito di terremoto completa il quadro di una strategia che punta a una gestione infrastrutturale sempre più proattiva, resiliente e tecnologicamente avanzata. C’è qualcosa che si sentirebbe di suggerire per la velocizzazione la messa a terra degli investimenti per la realizzazione delle infrastrutture e quindi nei processi di progettazione, autorizzazione e realizzazione?
Per velocizzare la messa a terra dei progetti infrastrutturali ritengo sia necessaria una visione integrata che combini semplificazione, flessibilità e innovazione, senza mai perdere di vista la sostenibilità ambientale e la qualità delle opere realizzate.
A tal proposito, oltre ad una ulteriore semplificazione normativa nella gestione delle autorizzazioni ambientali, paesaggistiche e culturali, anche attraverso una ottimizzazione delle loro tempistiche, e ad uno snellimento delle procedure in fase esecutiva, occorre tener conto dell’aspetto della sostenibilità finanziaria dei progetti, auspicabilmente tramite la diversificazione delle fonti di finanziamento.
Inoltre, la realizzazione di nuove tratte o il potenziamento di linee esistenti deve avvenire con una progettazione che renda minimo l’impatto sull’esercizio ferroviario.
In sintesi, occorre progettare bene, autorizzare in tempi certi e realizzare con qualità.
Le nuove tecnologie come i droni rappresentano un supporto innovativo per RFI nella gestione dei processi manutentivi.
Turin Metro Line 2 – Challenges and Innovative Solutions
Linea 2 della Metropolitana di Torino – Sfide e Soluzioni Innovative
Fabio RIZZO a, *
Francesco A ZZARONE a
Marinella GALLETTO a
Luca D’ACCARDI a
Roberto CROVA b
a Infratrasporti.To S.r.l., Torino
b Comune di Torino, Torino
* corresponding author: fabio.rizzo@infrato.it
Abstract
Turin Metro Line 2 aims to meet the need for a multimodal public transport network integrated with the metropolitan area’s transport system, enhancing the quality of life of the population. Line 2, funded by public resources, has successfully passed the Final Design phase. This article describes the main challenges encountered and the main innovative solutions adopted during the Final Design phase. It details the constraints and risks associated with the constructing an underground work in urban area, adhering to operational safety standards. These factors influenced the definition of functional layouts for stations, tunnels and shafts, as well as the design of civil works and technological installations in compliance with Italian legislation. The design was developed using the BIM process, which improved the multidisciplinary interfaces of this complex project, reduced the risk of errors and obtain shared models. The technical aspects are intertwined with a legal context shaped by evolving legislation on Public Procurement legislation. The Contracting Authority, working in synergy between technical and legal teams to ensure the legitimacy of the entire procurement process and adherence to principles of “public evidence”, will oversee the subsequent stages leading to the award and execution of the Contract.
Sommario
La Linea 2 della Metropolitana di Torino ha l’obiettivo di soddisfare la necessità di una rete di trasporto pubblico multimodale integrata con il sistema di trasporto dell’area metropolitana, al fine di migliorare la qualità della vita della collettività. La Linea 2, finanziata con finanziamenti pubblici, ha superato con successo la fase di Progetto Definitivo. Questo articolo descrive le principali sfide incontrate e le principali soluzioni innovative adottate durante la fase di Progetto Definitivo. Dettaglia i vincoli e i rischi associati alla costruzione di un’opera sotterranea in area urbana, aderendo agli standard di sicurezza operativa. Questi fattori hanno influenzato la definizione dei layout funzionali per stazioni, tunnel e pozzi, nonché la progettazione delle opere civili e delle installazioni tecnologiche in conformità con la legislazione italiana. La progettazione è stata sviluppata utilizzando il processo BIM, che ha migliorato le interfacce multidisciplinari di questo complesso progetto, ridotto il rischio di errori e ottenuto modelli condivisi. Gli aspetti tecnici sono associati ad un contesto giuridico dettato dalla legislazione in materia di Appalti Pubblici, in evoluzione. La Stazione Appaltante, operando in sinergia tra team tecnici e legali per garantire la legittimità dell’intero processo di appalto e l’adesione ai principi di “evidenza pubblica”, supervisionerà le fasi successive che porteranno all’assegnazione e all’esecuzione del contratto.
Keywords: Fire Brigades, Computational Fluid Dynamics (CFD), Building Risk Analysis (BRA), Volume loss, Horizontal Directional Drilling, geothermal energy, energetic segment/diaphragms, BIM, Public Procurement Code, legal issues. Parole chiave: Vigili del fuoco, Computational Fluid Dynamics (CFD), Building Risk Analysis (BRA), Volume perso, trivellazioni orizzontali controllate (TOC), energia geotermica, conci/diaframmi energetici, BIM, Codice Appalti Pubblici, Aspetti legali.
1. Introduction
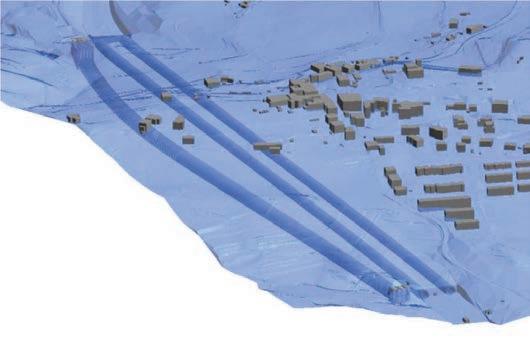
Turin Metro Line 2 was conceived with the ambition to redefine the city’s and metropolitan area’s public transport system. This initiative followed the territorial reorganization after the 2006 Winter Olympics in Turin and subsequent medium and long-term urban transformations. The goal is to provide an alternative to private transport, serve a larger number of users, reduce travel times, and consequently lower emissions of climate-changing gases and particulate matter, particulary PM10, thereby improving urban life quality.
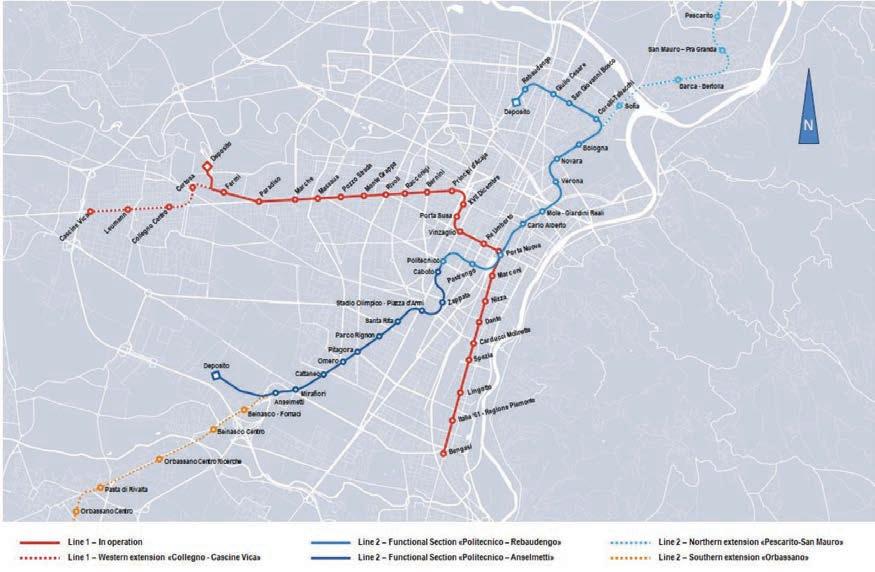
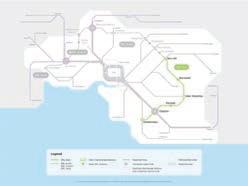
Preliminary studies and the mobility analysis have enabled the definition of the design structure for the entire Line 2, assessing the technical and economic feasibility, integration into the territory and the resulting urban transformations. Line 2 will be a “light automatic” driverless system, running north-south for approximately 28.0 km with 31 stations. It will be divided into four main sections, as illustrated in Table 1 and schematised in Fig. 1.
The entire Line 2 will be able to accommodate more than 284.000 passengers/day, which corresponds to more than 34.100 passengers in the morning rush hour (between 7 am
and 8 am) and an estimated 77 to 85 million passengers per year.
The total cost of the project was estimated at around €5 billion in 2019 and will be carried out in successive phases, depending on the availability of ministerial funds. Currently, the financing covers the design and construction of the “Rebaudengo-Politecnico” section, which will be able to accommodate more than 116.000 passengers/day, approximately 14.700 passengers during the morning rush hour, and approximately 30 million passengers per year.
1.1. Design Inputs and Constraints
The final design has been developed based on various inputs and in compliance with multiple design constraints. One of the most critical inputs is the need to keep the identification of the system and the rolling stock flexible to address potential issues arising from technological obsolescence. Consequently, the infrastructure and civil systems have been dimensioned to
accommodate a design “envelope” of technological solutions and rolling stock, based on the characteristics of an “optimal” driverless system with full automation. This system is nonproprietary and aims to achieve the best compromise between specifications and implementation costs for each subfunction, utilizing the best technologies available at the time of construction. In subsequent design and contract phases, the system and rolling stock will be identified, and clauses will be established to equip the metro line with the latest and most advanced technology available on the market, ensuring efficiency and safety at the time of commissioning. Additionally, mandatory design inputs include the planimetric alignment and the location of the stations. The design was developed in accordance with the latest safety standards and regulatory, environmental, geological, hydrogeological and geotechnical context, as well as historical-architectural and archaeological context (particularly in the historic centre), the presence of buildings, pre-existing structures, and public utilities networks.
Table 1. Line 2 Metro Turin – Functional sections and main characteristics.
Figure 1. Key plan of Metro Turin Lines; Line 2 and Northern/Southern extensions; intersection with Line 1 at Porta Nuova station.
Table 2. Type of stations.
S1L
Station with 1 underground level and entrance hall on street level
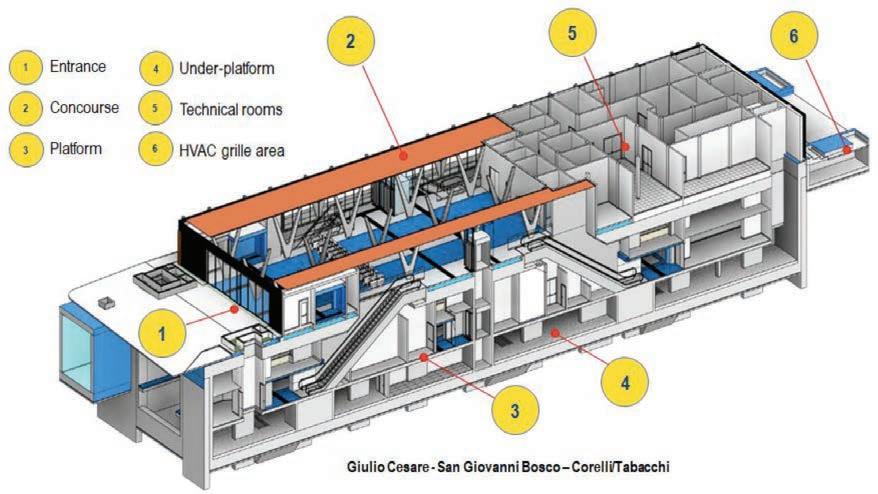
Giulio Cesare, San Giovanni Bosco, CorelliTabacchi 8m
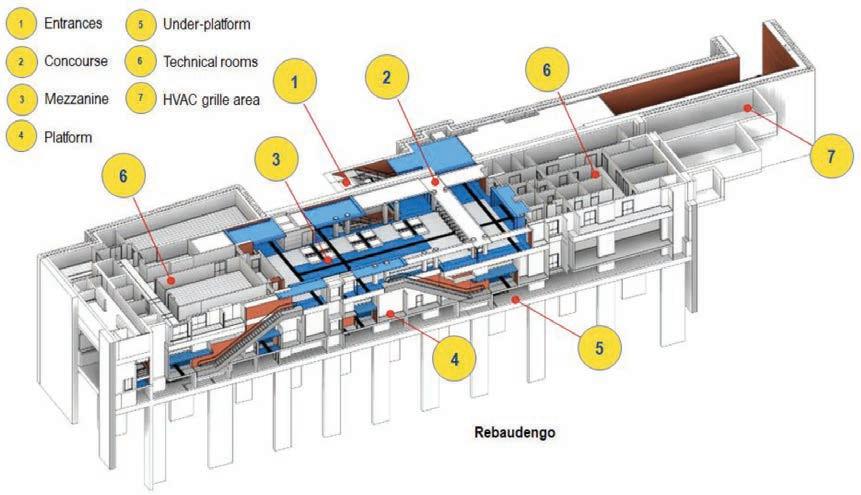
S2L Station with 2 underground levels Rebaudengo 14m
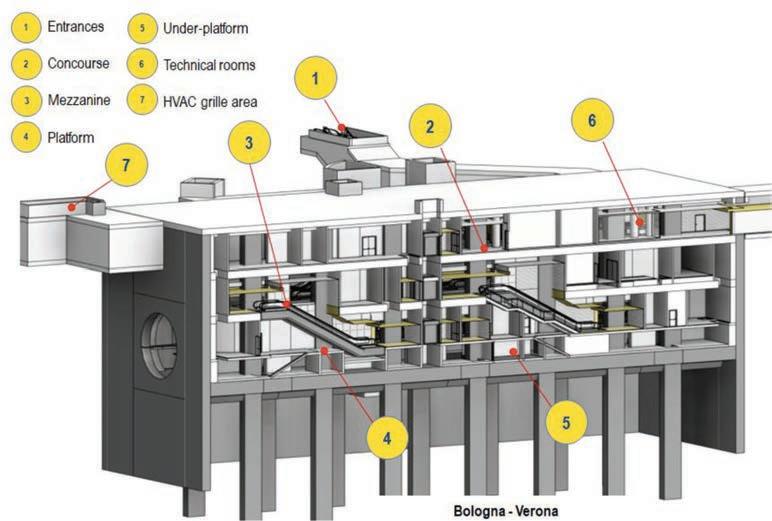
S3L Station with 3 underground levels Bologna, Verona 19m
S4L Station with 4 underground levels Politecnico 28m
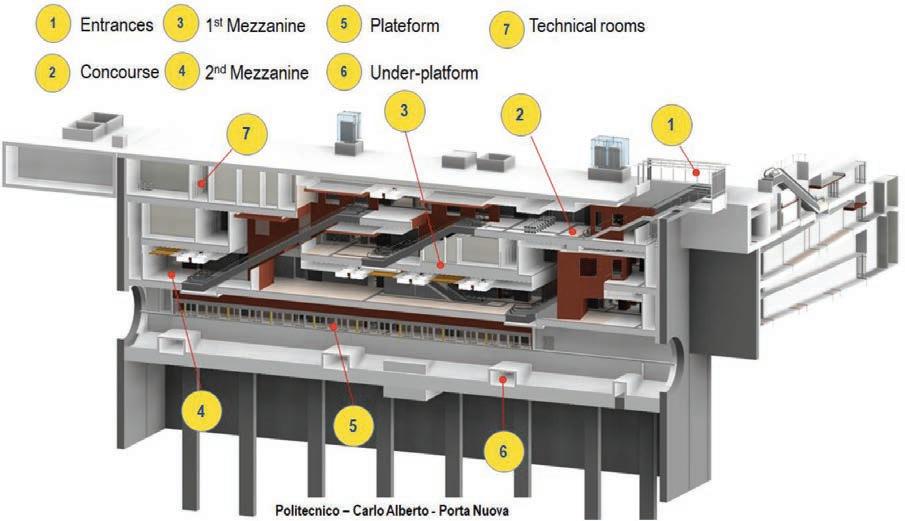
S4LS Special station with 4 underground levels Carlo Alberto, Porta Nuova 28m
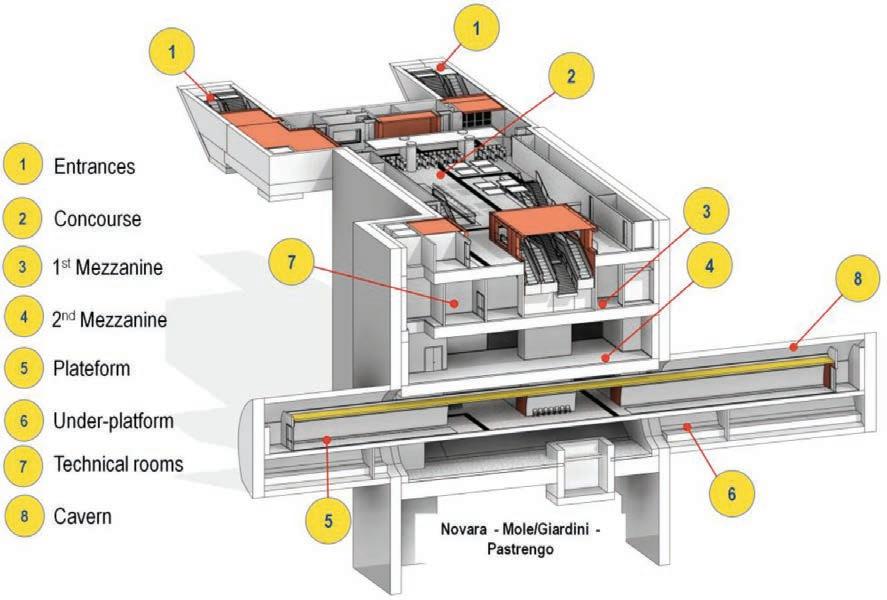
S4G Special station with 4 underground levels and platforms in cavern Novara, Mole/Giardini Reali, Pastrengo 25m
1.2. The Line and the Works
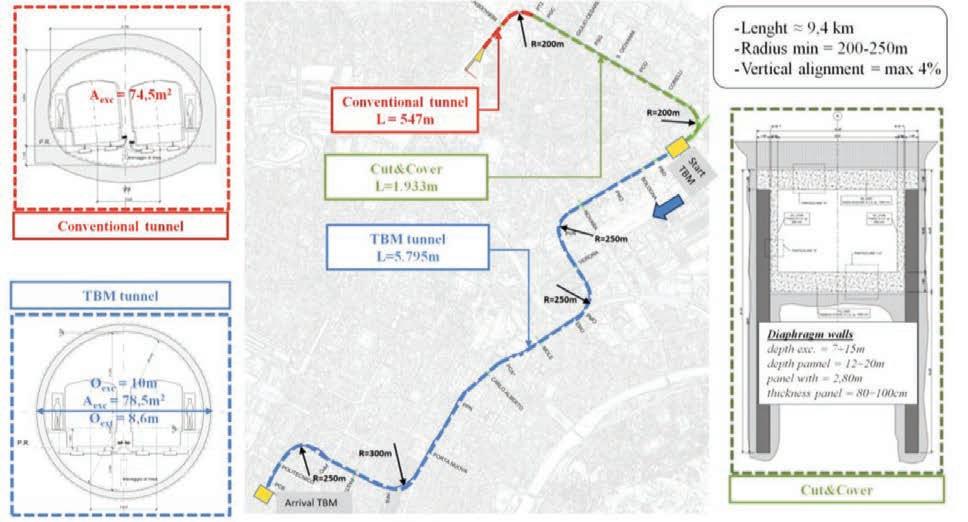
Proceeding from north to south, as illustrated in Fig. 1 and Fig. 2, the line will start at the Rebaudengo depot/workshop and runs through a conventional tunnel to the Rebaudengo station, which will connect with the Rebaudengo-Fossata railway station. From there, the line will continue in a conventional tunnel, bend eastward to pass under the Via Toscanini/Via Cigna underpass, and proceeds through an artificial tunnel along the former railway trench between Via Gottardo and Via Sempione. This section will be Cut&Cover and will include three stations: “Giulio Cesare Station” (at the namesake avenue, where there will be an interchange with other local public transport lines), “S. Giovanni Bosco Station” (at the namesake hospital), and “Corelli-Tabacchi Station” (near the former tobacco factory “Manifattura Tabacchi” under conversion). From Corelli-Tabacchi Station, the line will continue along Via Bologna to better serve the existing
and future developments in the integrated area, with the intermediate stations of Bologna and Novara. Beyond Novara station, the line will veer off the Via Bologna axis, continuing southeast beneath the Corso Verona corridor to arrive at the Largo Verona station.
The 12 stations along the ‘Rebaudengo-Politecnico’ functional section can be grouped into shallow and deep stations as summarised in the Table 2 and shown from Fig. 3 to Fig. 7 below.
The maintenance workshop, storage facilities, and stations will be constructed using the Cut&Cover method. Excavation between the diaphragm walls will be carried out using the top-down method, where after the construction of the top slab, which allows a partial surface opening, excavation will proceed beneath the slab. Diaphragm walls, racing from 100 to 120 cm in thickness and 12 to 40m in depth, will be constructed using hydromill technology to Type of
– alignment and types of tunnels.
Figure 2. Line 2 Metro Turin – functional Section “Rebaudengo-Politecnico”
i o arone Galletto ardi ro a
minimize vertical deviations and effectively penetrate cemented fluvioglacial deposits composed of gravel and sand with high cementation and irregular distribution. At stations where the excavation base reaches the water table, watertightness will be ensured by preempltively installing jet grouted bottom plugs. In stations where the excavated ground consists of clay or marl soils, it is unnecessary to construct an artificial bottom plug due to the low permeability of these soils. However, since these soils are not stiff
enough to provide adequate contrast of the diaphragm walls, cross walls (i.e., unreinforced diaphragm wall baffles perpendicular to the long sides of the station body) will be constructed.
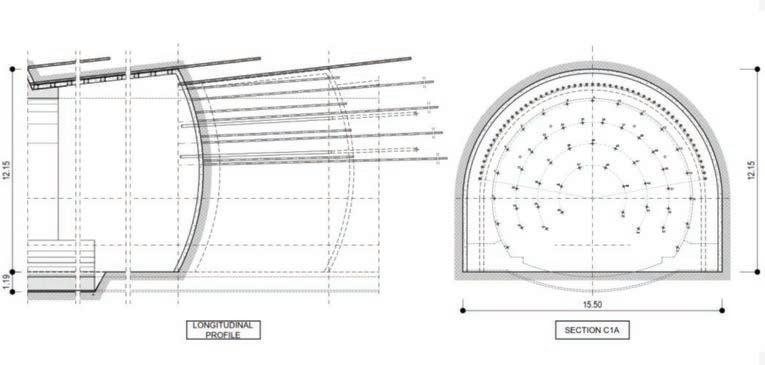
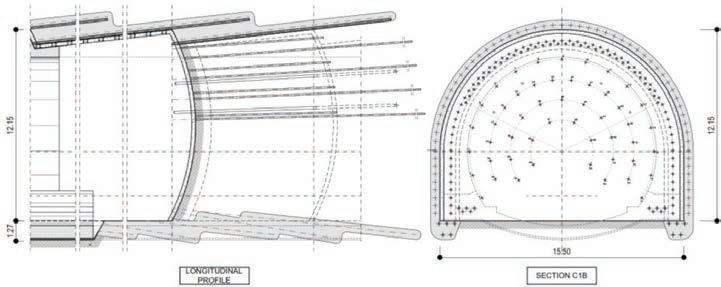
The S4G type stations have been designed to facilitate urban integration, whit the main course is oriented perpendicular to the layout. The central body, with rectangular plan (constructed between diaphragm walls) is positioned along the main course and houses the atrium, for the technical
Figure 3. Line 2 Metro Turin – Type Station “S1L” – Giulio Cesare – San Giovanni Bosco – Corelli/Tabacchi.
Figure 4. Line 2 Metro Turin – Type Station “S2L” – Rebaudengo.
rooms, access stairs and elevator shafts across various levels. Conversely, the platforms are built in a caverns oriented perpendicularly to the central body. The platform caverns, with an excavation section of 188 m2, will be excavated in a partial section, preceded by ground improvement using jet grouting from the surface. Ancillary works and station entrances, which require shallower excavation depth, will be
constructed with temporary micropile support works and permanent reinforced concrete walls. Between the stations there will be shafts servings as ventilation or emergency exits. The provisional works for these structures will primarily involve micropiles and jet grouting, while the permanent walls will be constructed from reinforced concrete.
Figure 5. Line 2 Metro Turin – Type Station “S3L” – Bologna – Verona.
Figure 6. Line 2 Metro Turin – Type Station “S4L/S4LS” – Politecnico – Carlo Alberto – Porta Nuova.
2. Geological and Geotechnical context
2.1. Geological framwork
The area where the “Rebaudengo-Politecnico” section will be developed is located in the “Northern Piedmont Plain”, bounded to the northwest by the Alps and to the southeast by the hills of the Collina di Torino and Monferrato. This region is characterized by a significant sedimentary succession of continental origin from the Late Pliocene-Holocene age, formed by the detrital inputs from two large fluvio-glacial conoids belonging to the Dora Riparia River and the Stura di Lanzo stream. The continental soil are overlaid by a series of marine origin deposits from Pliocene age, composed of sandy, sandy-silty, to completely silty materials. At greater depths, there are formations of marine origin from the Tertiary age, with a predominantly marly-clayey and arenaceous-conglomerate compositions, which constitute the characteristic successions of the Turin Hills area.
The general geological setting of the area, within the first approximately 150 meters from the surface, comprises three distinct but overlapping lithostratigraphic complexes, listed below from the shallowest to deepest:
– Fluvioglacial and fluvial deposits: sands and gravels in a silty matrix;
–Lacustrine and fluviolacustrine deposits: clayey silts and gravelly sands;
– Marine deposits: clayey silts, sandy silts and blue-gray sands with fossils.
Generally, the soils influenced by the tunnels and underground works are predominantly composed of thick gravelly-sandy deposits of fluvioglacial and fluvial origin, locally featuring layers or lenses of naturally cemented material. Cementation usually occurs with uneven vertical distribution and little horizontal continuity, consistent with the natural genesis of these deposits. The tunnel intersects marine-origin sediments only in specific sections where the alignment extends to greater depths:
– at Porta Nuova station and in the intermediate section between Porta Nuova station and Carlo Alberto station, the alignment crosses silty-clayey-sandy-gravelly deposits (Chronostratigraphic Unit of “Blue Clays”, CARG abbreviation: FAA);
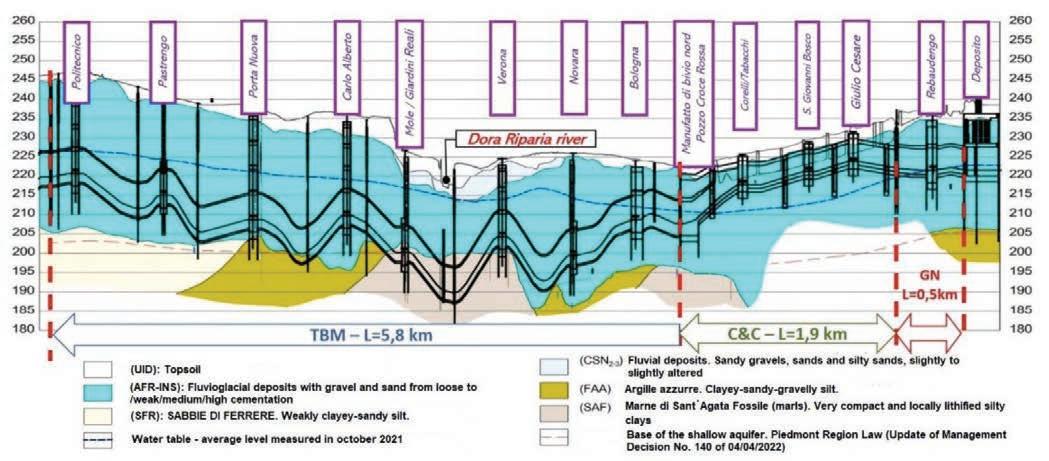
– in the section below the Dora Riparia River, the line is completely immersed in very compact and locally lithified silty clay deposits (Chronostratigraphic Unit of the “Fossil Sant’Agata Marls”, abbreviation CARG: SAF).
From a hydrogeological point of view, the groundwater level is close to the surface areas near the Dora Riparia River, typically less than 10 meters from deep. Between Politecnico and Pastrengo, the water table is generally around 20 meters deep. In the central section (Porta Nuova - Mole/Giardini Reali), it ranges between 10 and 20 meters, while in the area from Dora Riparia River to the Rebaudengo maintenance workshop, it varies between 10 and 18 meters.
Figure 7. Line 2 Metro Turin – Type Station “S4G” – Novara – Mole/Giardini Reali – Pastrengo.
2.2. Geotechnical Characterization
The geotechnical analysis showed that the investigated sections are affected by the following geotechnical units:
– Unit 1 (UID): Topsoil. It consists of anthropogenic surface fill, mainly composed of gravel and cobbles in a poorly thickened sandy matrix.
– Unit 2 (AFR-INS): Fluvio-glacial deposits with loose to weakly cemented gravel and sand (0 to 25% cementation).
– Unit 3 (AFR-INS): Fluvio-glacial deposit with weakly to moderately cemented gravel and sand (cementation between 25 and 50%).
– Unit 4 (AFR-INS): Fluvio-glacial deposits with medium to highly cemented gravel and sand (cementation between 50 and 75%).
– Unit 5 (FAA): “Argille azzurre”. Clayey-sandy-gravelly silt.
– Unit 6 (SFR): “Sabbie di Ferrere” (sands). Villafranchian deposits. Weakly clayey-sandy silt.
– Unit7(SAF): “Marne di Sant’Agata Fossile” (marls). Very compact and locally lithified silty clays.
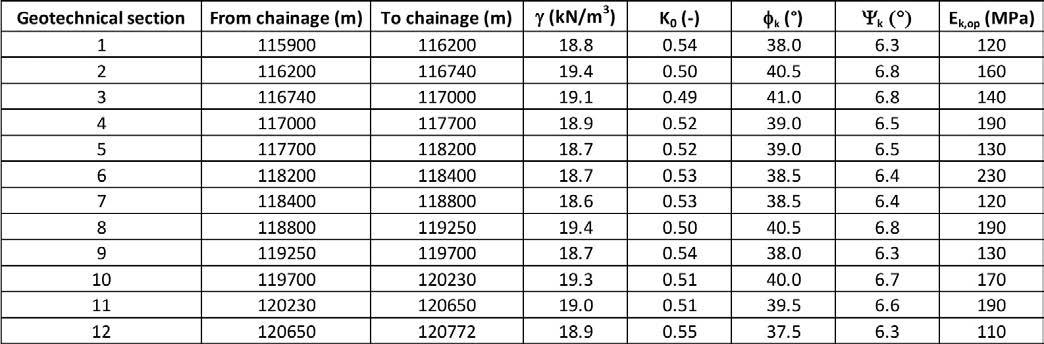
Table 3 shows the geotechnical parameterization of the above units.
Regarding the seismic characterization of the ground in the sections between the stations, reference was made to the geophysical tests carried out (Masw, Down Hole), according to which the value of the equivalent velocity Vs,eq was determined, to be always greater than 360 m/sec. In these cases, according to the Italian regulations in force, the underground was always classified as category B.
During the geotechnical studies, the problem of potential liquefaction of the soil under dynamic stresses caused by earthquakes was analysed. This concerns the upper noncohesive layers belonging to units 2 and 3 below the water
table. Based on the area’s conditions - including seismic characteristics, water table depth, and soil grain size distribution – the risk of liquefaction is negligible.
3. Functional and system design aspects, application focus on Ministerial Decree October 21, 2015
The design of Line 2 of the Turin Metro fully complies with the Decree of October 21, 2015 - Approval of the technical rule for fire prevention in the design, construction, and operation of metro systems (Official Gazette General Series No. 253 of 30-10-2015) and its Annex I. Line 2 represents the first case of application in the design for an entire metro line. The decree introduces a more modern, performance-based approach that shifts the focus toward performance-based design. The aim is not only to comply with fixed prescriptions, but to achieve specific safety objectives, such as smoke control and evacuation management, through performance analysis (e.g. fluid dynamics simulations - 1D and 3D - and evacuation modelling).
As highlighted, Line 2 has been the first metro system in Italy to be fully designed according to the 2015 Decree, starting from the early design phases such as concept and preliminary design. This led to a series of considerations both on the functional design theme (station types, sizing of escape routes, layout and location of technical rooms, etc.) and on all safety and security related issues, such as emergency smoke ventilation systems, types of fire protection systems, and other active related devices. Furthermore, a new type of emergency elevator has been introduced, partially modifying/integrating the existing equipment design base, as foreseen by the regulations and laws for elevator systems.
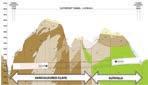
Figure 8. Schematic geological profile - Turin Metro Line 2 - “Rebaudengo-Politecnico” functional section.
In this context, an important modification has also been introduced regarding the use of mobile escalators in the emergency scenarios, with the aim of facilitating evacuation. Many of these elements had already been implemented by Infra.To during the initial activation of Line 1 of Turin (years 2006-2011).
In the application of the new technical regulation, the certified bodies and companies responsible for supervising the approval and validation of the project, in addition to the Fire Department (VVF), which manages the issuance of the approval certificate according to Article 3 of Presidential Decree No. 151/2011, found themselves in the position of applying a new decree with uncertainties related to the interpretation of the new regulation. The lack of previous applications in similar contexts required additional checks in terms of system security and functionality. Therefore, to verify the correct interpretation and application of the decree’s requirements, it was necessary to create a compliance matrix that considered all functional and dimensional aspects, as well as the constraints, to arrive at the design proposal to be submitted for approval. Some requirement examples that influenced the design:
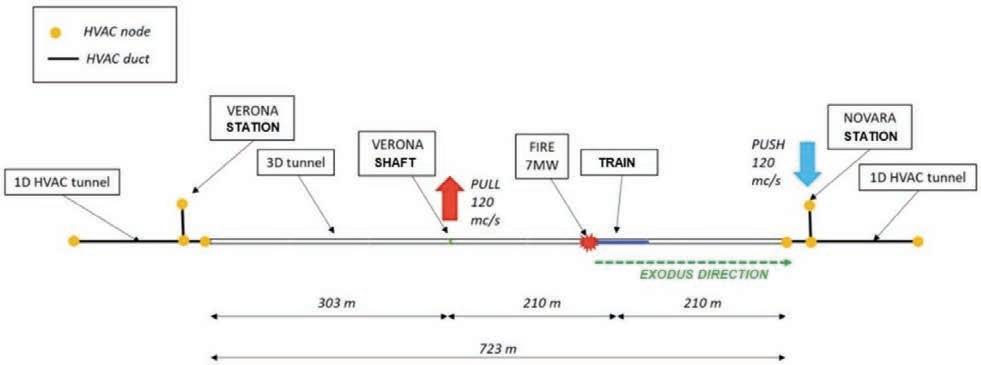
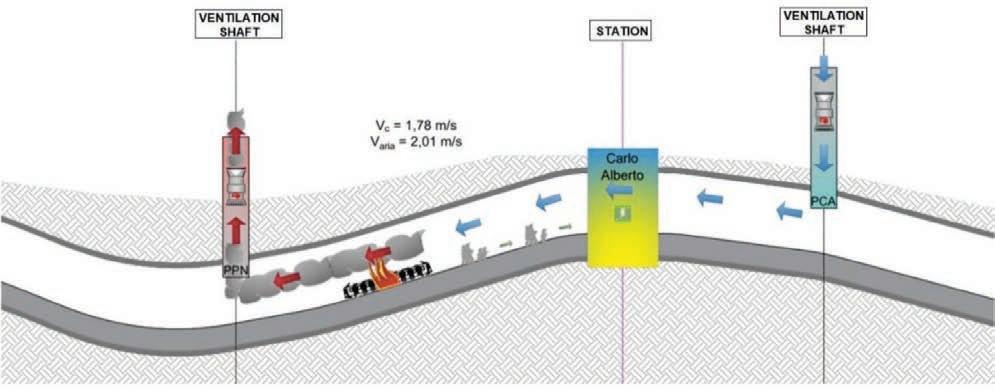
–Fluid dynamic modeling with a train fire power of at least 7MW
– Station layout, ventilation shafts and emergency exit from the tunnel
– Use of elevators and mobile escalators even in emergency situations
–
Layout, location and compartmentalization of equipment rooms
–Available Time to Evacuate (ASET) concept
–Required Time to Evacuation (RSET) concept
–Critical condition concept for human conditions and sustainable conditions
–Emergency procedures design and application
The technical regulation (ref. Ministerial Decree 21/10/2015
Annex I - Chapter I to Art. I.1.2) is based on guidelines that synthesize studies and design orientations shared internationally. This ensures that fire safety design criteria are clearly defined, understandable, supported by an adequate
safety margin and, most importantly, integrated into the broader design process of the works. Achieving fire safety objectives, particularly those related to smoke control management and evacuation design, must be achieved through performance-based studies. Therefore, a fluid dynamic verification (Fig. 9 and Fig.10) has been required to assess the efficiency of the emergency ventilation systems according to the scenarios as defined by the regulation. An innovative aspect involves verifying the activation of emergency ventilation systems without the presence of fire. This verification is essential to validate the full-scale functional tests during the commissioning phase (ref. Ministerial Decree 21/10/2015 - Chapter V).
The concept of emergency ventilation availability has been strengthened by implementing a 100% smoke fan backup capacity in the tunnel and across many stations. This measure has consolidated passenger safety beyond the decree’s requirements, aligning with the NFPA 130 standard, a globally recognized regulation for metro system design and safety. This alignment has raised safety standards in Italy, bringing them in line with international best practices. In addition, the minimum requirement for the type of fans used to extract smoke from fires has been deliberately raised to class F400/120 min (compared to the requirement in Chapter V.4 of F400/90 min).
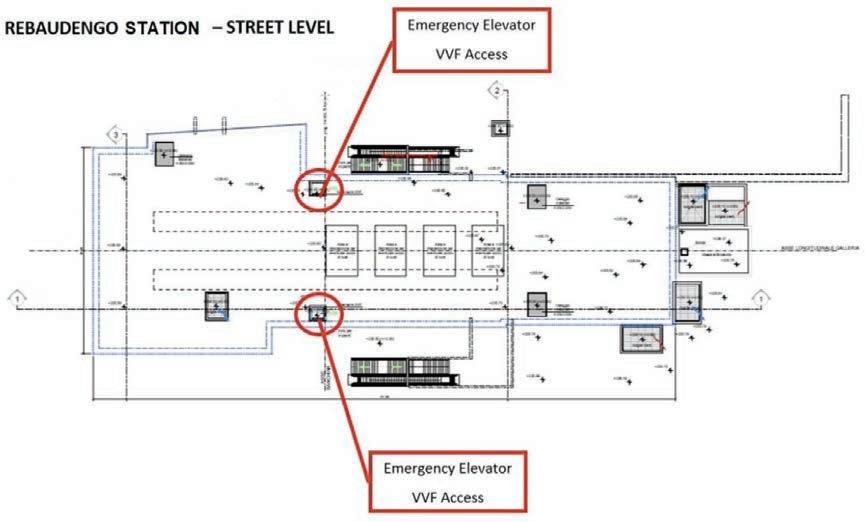
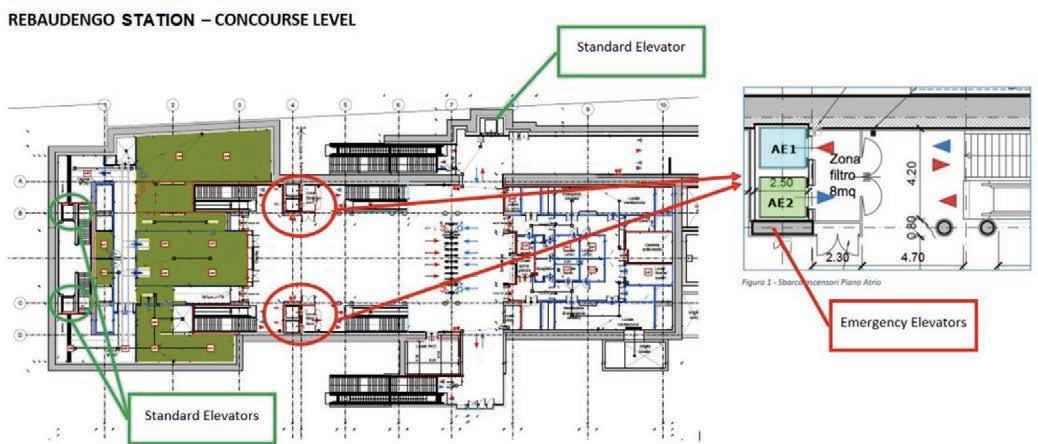
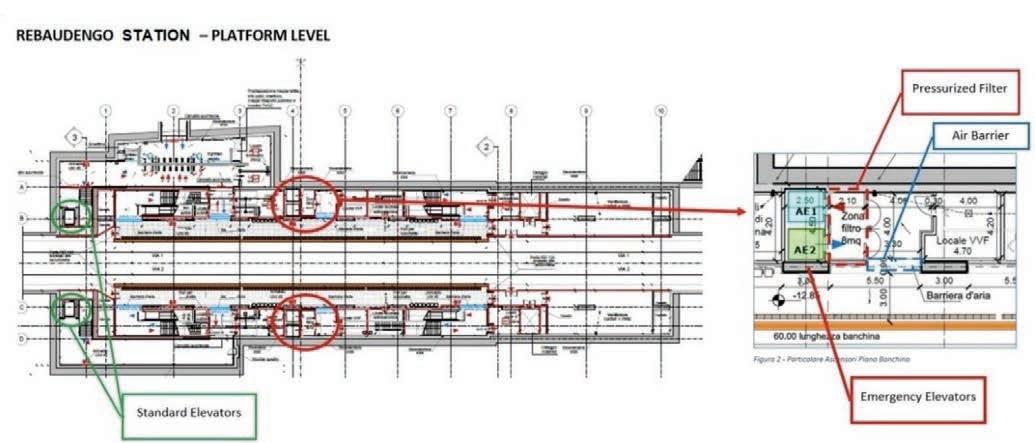
Another safety enhancement is the availability of emergency elevators during evacuations, particularly for passengers with reduced mobility, as well as for fire brigade access (VVF). In most stations, the fire brigades can reach the platform level directly from the outside via a dedicated and exclusive access located at street level through concourse or mezzanine levels (Fig. 11, Fig.12 and Fig.13). This configuration required the protection of a smoke filter in the elevator landing area within the protected pathways. The design also independently increased the redundancy level by providing two emergency elevators per each platform.
This also required a dual electrical power supply from two separate panels, each fed by two different power lines connected to the double medium voltage ring fed by two diffe-
rent substations provided by the Turin Electricity Distribution Company.
The growing number of new metro designs based on the 2015 Decree will certainly lead to a series of case studies that can help refine the design solutions derived from the application. of the Decree. Recent examples include the design of the Catania metro and the Afragola-Naples metro line.
4. Excavation in the Urban Environment
4.1.
Building Risk Assessment
One of the primary challenges in constructing the metro is excavating in a densely urbanized area, where historically and monumentally significant buildings must be preserved. The following sections will focus on the studies conducted for the mechanized tunnelling using the EPB TBM (Earth Pressure Balance Tunnel Boring Machine). Mechanized excavation significantly reduces the impact on the surface and on existing
structures, although it cannot be considered negligible. The methodology adopted, known as Building Risk Assessment [1], consists of three distinct phases, each characterized by specific boundary parameters (empirical mode failures and angular distortions1) for the damage caused by excavation. When the damage limits are exceeded in one phase, evaluation is required in the next phase. Results from the Final Project indicated that some buildings and structures already exhibit an expected level of damage in the first phase of the risk assessment (>10 mm of subsidence for normal buildings and >5 mm for sensitive buildings), necessitating progres-
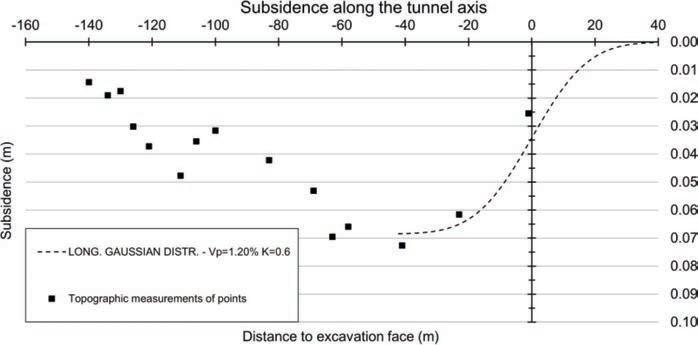
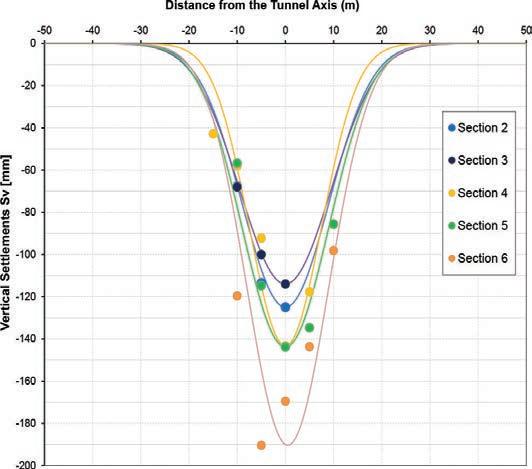
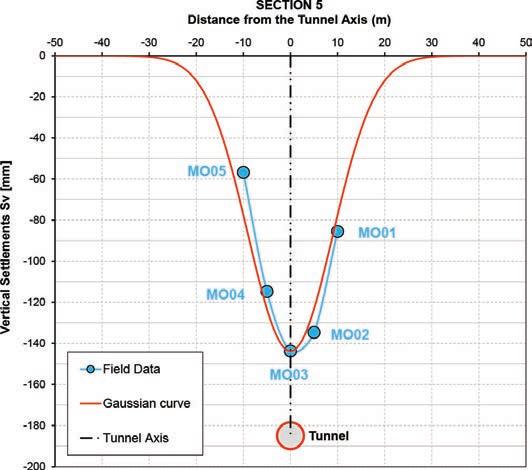
1 For the calculation of subsidence, under “greenfield” conditions, regardless of the soil conditions and the type of excavation method, the evolution of subsidence in a section perpendicular to the tunnel axis can be represented by a Gaussian curve with the expression (Peck 1969), which has been deepened by the studies carried out by Attewell and Farmer (1974) [2], Burland et al. (1977) [3], O’Really and New (1991) [4]; Mair, Taylor and Burland (1996) [5], to which reference is made for a detailed discussion.
Figure 9. CFD Model structure.
Figure 10. SES Modeling Tunnel design Scenario example.
sion to the second phase of the assessment. Therefore, in the Final Project, the second phase of damage assessment was conducted for all affected buildings, accompanied by a form following the Building Condition Survey (BCS). After Phase 2, buildings identified with moderate or severe damage were earmarked for Phase 3 to determine appropriate conservation measures through numerical analysis. In some cases, further assessment was necessary, and in certain areas of the site, mitigation measures are planned, as described below. The fundamental parameter characterizing all empirical me-
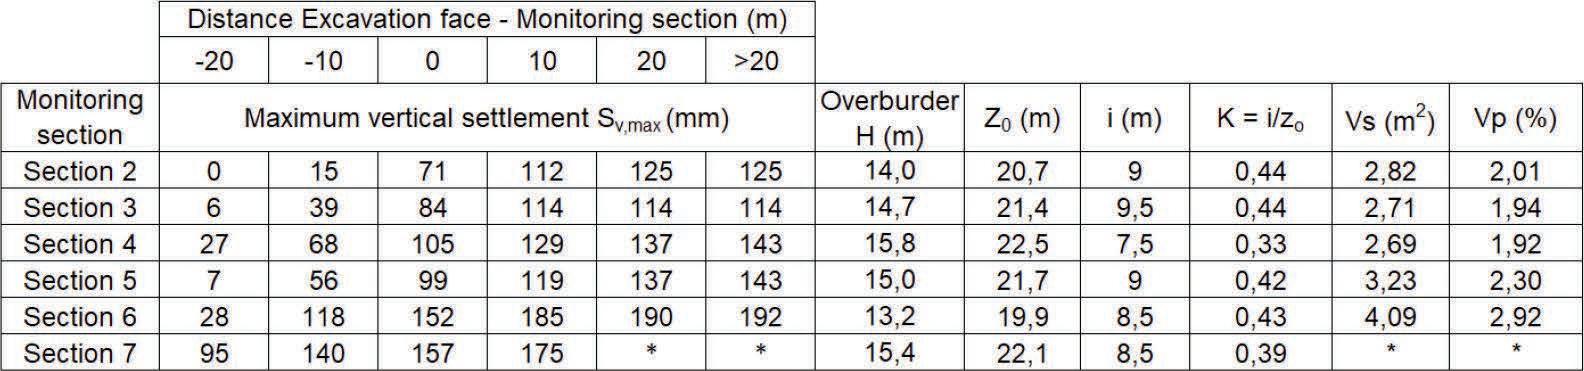
thods for estimating the settlement curve in tunnel excavation is the volume loss (VL). VL is defined as the ratio of the additional volume of soil removed (VS) to the theoretical volume of the tunnel (V0). Based on available literature and experience gained from excavations in urban environments like Line 2, two scenarios were evaluated for selecting of the VL value:
–Scenario 1: VL = 0.5% for straight sections and VL =1% for curved sections.
–Scenario 2: VL = 1% for the entire alignment, considered as the upper reference limit (alarm threshold).
Figure 11. Emergency elevator layout – Rebaudengo station, street level.
Figure 12. Emergency elevator layout – Rebaudengo station, concourse level.
Based on the experience from similar projects, it has been observed that VL of 0.5% (or even lower) is highly achievable under these geological and hydrogeological conditions if the TBM is operated with optimal parameters. However, it is prudent to consider a broader range of possibilities for unexpected situations by also accounting for higher VL values. This approach can serve as a more appropriate reference during in the design phase to define suitable conservation measures. In the most conservative scenario, with volume loss (VL) of 1%, several buildings in the central section fall into moderate to severe damage categories (Table 4). Consequently, these buildings are considered at risk of damage, and dimensioned mitigation interventions have been planned for them through specific numerical analyses (Phase 3).
For the numerical analyses, 8 buildings and 2 infrastructures representative of the most critical zone were examined, predicting both situations: without ground improvement and with ground improvement. The analysis without ground improvement indicated that, for most of the buildings, subsidence and angular distortion values exceeded the “Slight” damage limit. Additionally, for some buildings, deformation values along the structure were also surpassed. Conversely, when considering mitigation measures, all buildings analysed in Phase 3 fell into the “Slight” damage category, with the only criterion occasionally exceeded being the maximum subsidence.
4.2. Selection of ground improvement technologies
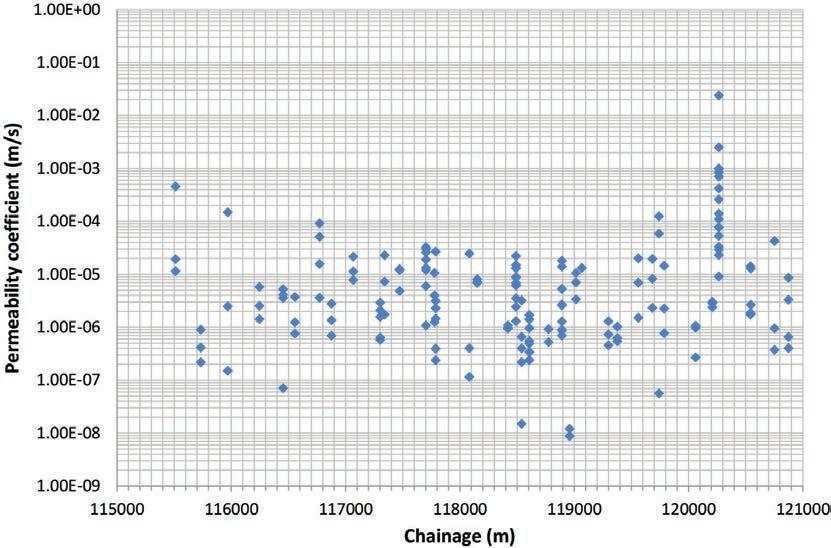
The selection of ground improvement technologies was determined by both the characteristics of the soils to be treated and the logistical conditions of the sites. Both permeation injection and jet grouting technologies were considered. The applicability of permeation injection
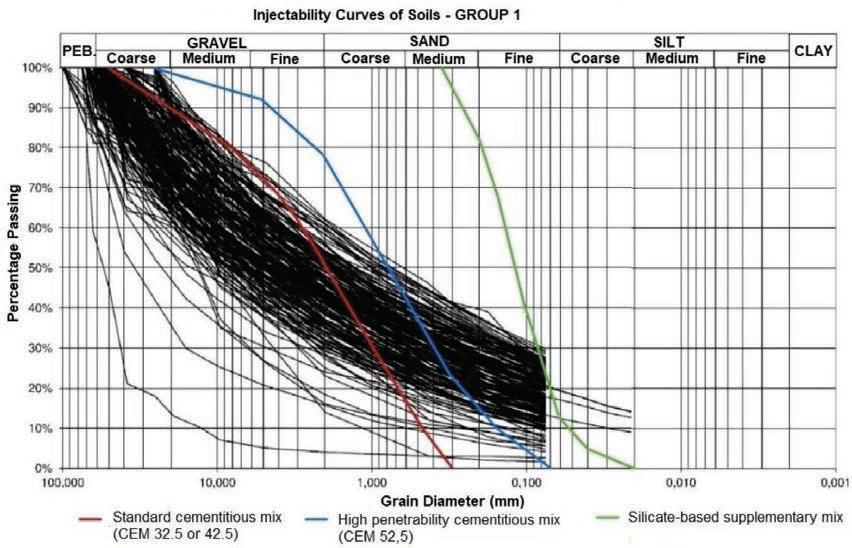
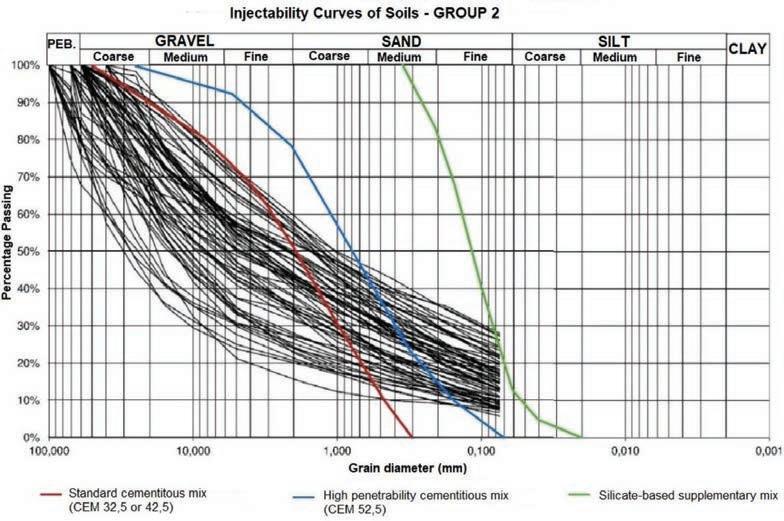
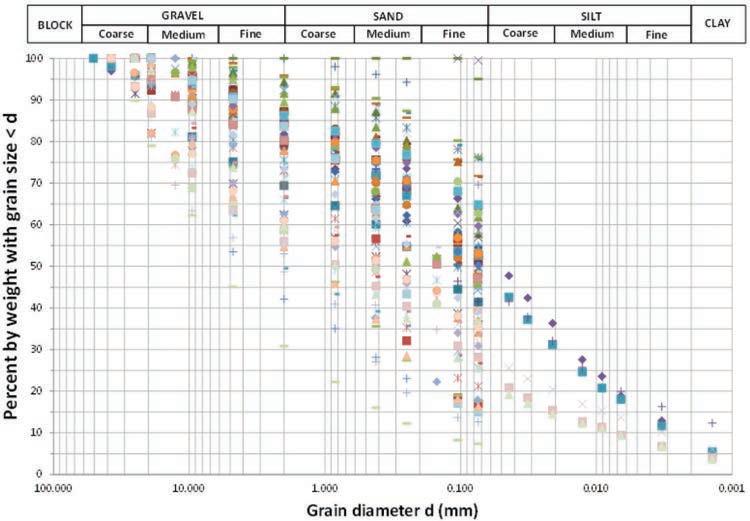
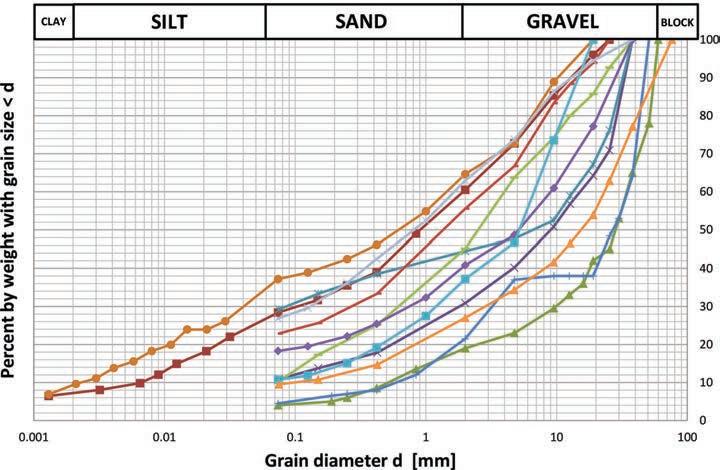
is primarily determined by the grain size and permeability of the soils, while the applicability of jet grouting is mainly influenced by the degree of thickening and cementation of granular soils and the compactness of fine-grained soils. The soils of Units 2, 3 and 4 (i.e. the soils affected by the consolidations in preparation for the TBM excavation) exhibit a broad grain size spectrum, with a predominance of sandygravelly fraction and a non-negligible percentage of fine fraction, varying between 2% and 30%. The permeability coefficient of these soils ranges between 10-5 and 10-6 m/s. Both parameters (grain size and permeability) indicate that these soils are suitable for treatment by permeation injection, provided that cementitious mixtures with high permeability and, in particular, silicate-based additives are used. In fact, as shown in the graphs in Fig. 14 and Fig. 15, which display three different injectability limit curves (for standard cementitious mix, high permeability cementitious mix, and silica-based integrated mix) alongside the grain size distributions of the in-situ soils, it appears that, with respect to the in-situ soils of Units 2, 3 and 4:
–Only soils identified by the particle size curves in the lower part of the spindle are readily injectable with a standard cementitious mix;
– Soils identified by the particle size curve below the middle part of the spindle are substantially injectable with a highly permeable cementitious mixture, consisting of 52.5 cement and dispersing and anti-flocculating additive. Referring to the soils identified by the particle size curves at the top of the spindle, which are the most limiting in terms of injectability, it appears that these soils: –are not injectable with a standard cementitious mix (70100% of the red curve has sections of the upper part of the spindle grain size curves to the right);
Figure 13. Emergency elevator layout – Rebaudengo station, Platform level.
– are difficult to inject with a highly permeable cementitious mixture containing 52.5 cement and dispersing and anti-flocculating additives (45-55% of the blue curve has sections of the upper part of the spindle grain size curves to its right);
–are basically injectable with a silicate-based additive (although 28-30% of the green curve still has stretches of the particle size curves of the upper part of the spindle to its right).
Considering the significant variability in grain size found in the various samples taken along the line at different depths and analysed in the laboratory, it is prudent to adopt a conservative approach. Therefore, the selection of injection mixtures should be calibrated based on the highest grain size band, which is the most restrictive in terms of injectability. Consequently, a permeation injection was chosen:
– firstly, with a high-permeability cementitious mixture, which, in the worst cases, is certainly at the limit of injectability;
– secondly, with an additional silicate-based mixture, which is substantially injectable even in the most unfa-
vourable cases, as represented by the grain size curves at the upper end of the spindle.
On the other hand, the injectability of the granular soils in Turin with high permeability cementitious mixes and silicate-based supplementary mixes is confirmed by previous experience in the work on Line 1 of the Metro.
Regarding jet grouting, it can be considered applicable to the soils of Units 2, 3 and 4.
The second differentiating element for selecting the most appropriate ground improvement technology is the logistical condition of the sites to be worked on. We can roughly distinguish the following main cases:
a) the tunnel passes under a road flanked by buildings on both sides or on one side; in this case, the buildings to be protected are not directly above the tunnel to be excavated, but on the sides;
b) the tunnel passes under buildings outside the historic center where the surface areas are relatively large;
c)the tunnel passes under buildings in the historic center, where the surface areas between buildings are small.
The focus here will be on the ground improvement planned
Table 4. Number of buildings for each expected damage category with VL = 1%.
Figure 14. Injectability curves of Unit 2 soils (also 3 and 4) - Group No. 1.
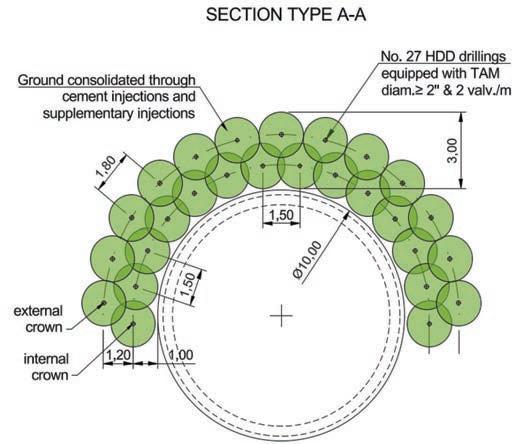
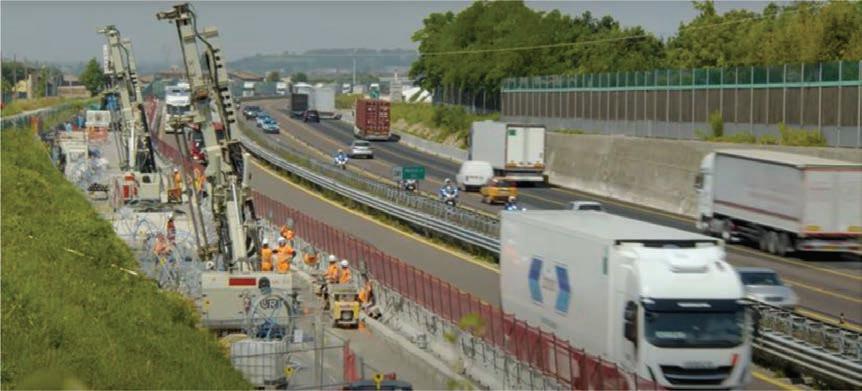
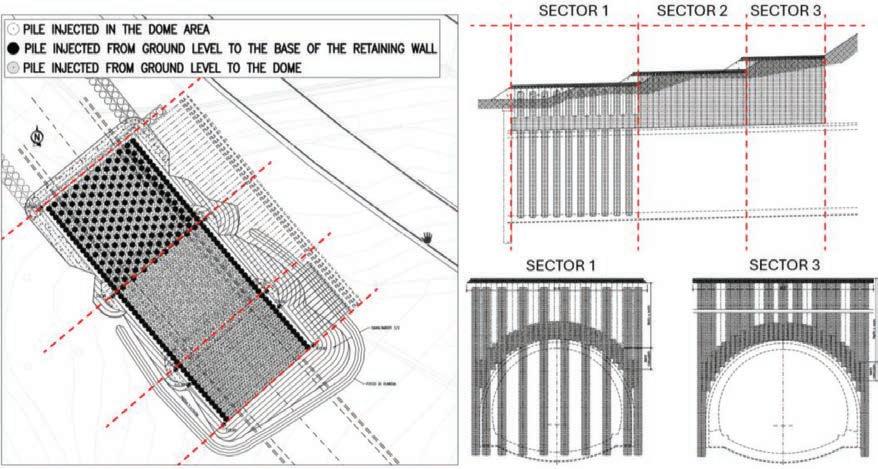
to address the condition described in c) above. Due to the impossibility of working from the surface for the installation of injection lines, we will proceed with the help of Horizontal Drilling Direction (HDD).
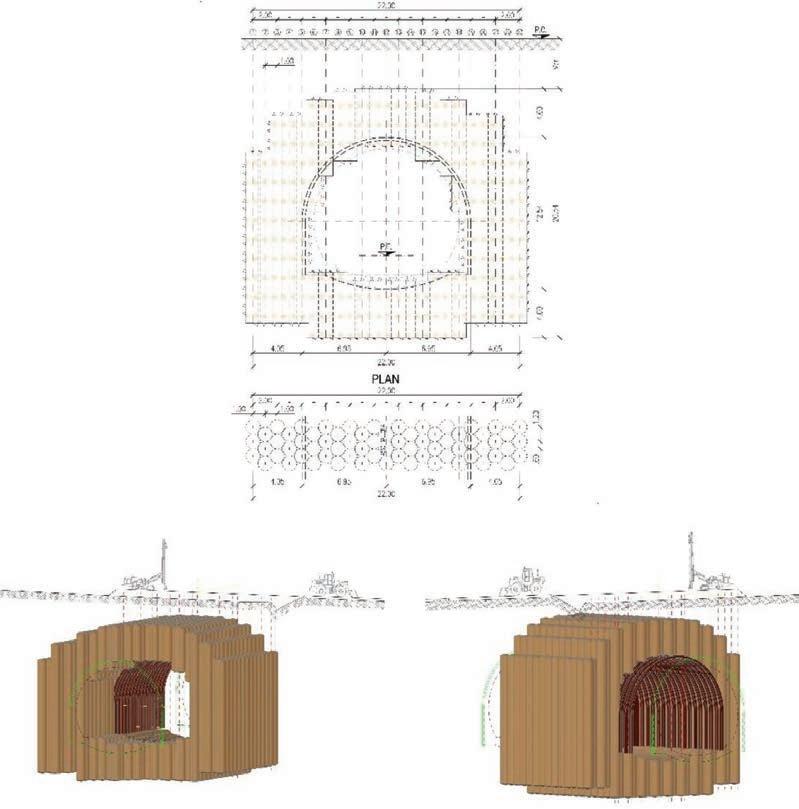
For this purpose, some of the planned structures were used as starting points for drilling and consolidation, such as the stations and the shafts. In some cases, it was also necessary to construct additional temporary structures, such as service shafts and tunnels. For these structures (both planned and additional), when located along the tunnel axis, consolida-
tion works were planned along the tunnel contour. This was achieved by drilling parallel to the tunnel axis arranging the drills in a double crowning pattern above the canopy, at least up to the level of the centers. Given the large distances between the various planned structures, the size of the blocks to be crossed, the considerable difficulty of constructing additional structures in the historic center, and the need for curvilinear drilling, it was necessary to adopt the technology of remote-controlled drilling (HDD) for this type of intervention. This technology enabled the design of consolida-
Figure 15. Injectability curves of Unit 2 soils (also 3 and 4) - Group No. 2.
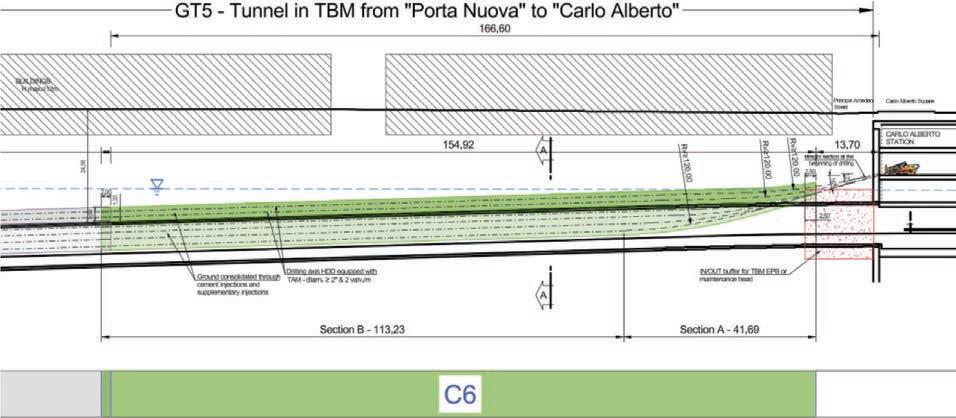
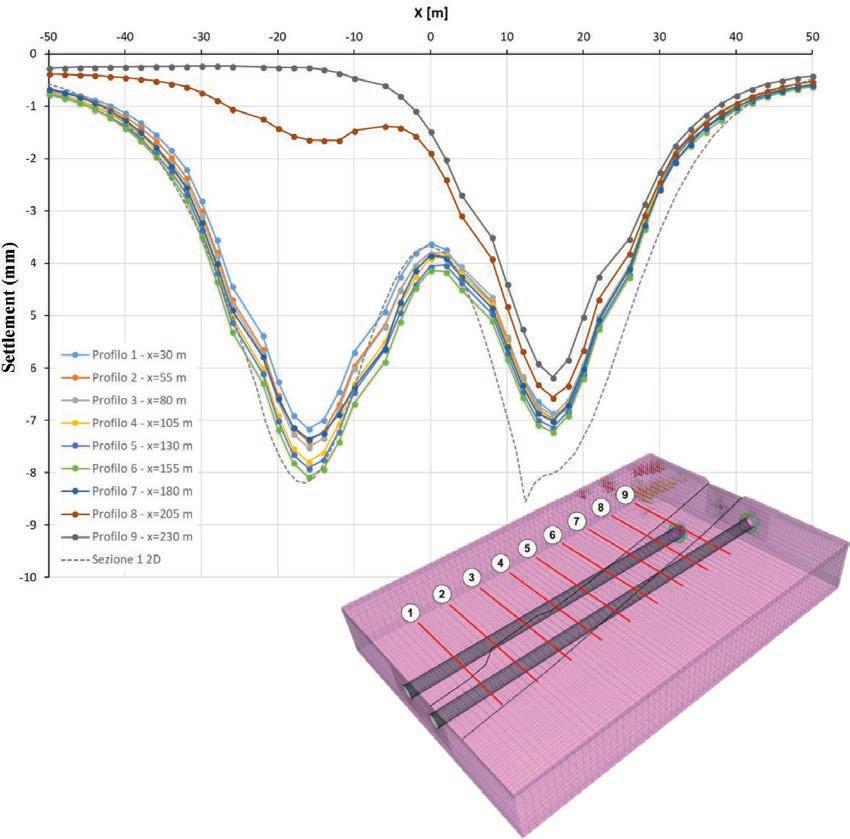
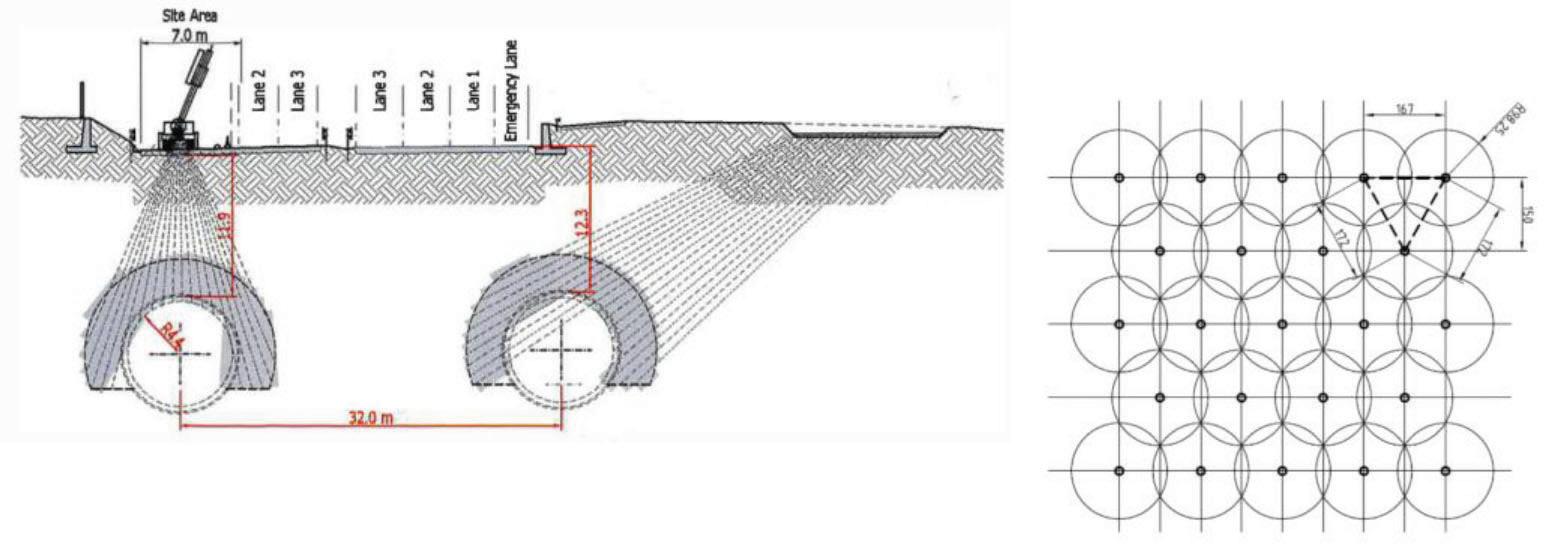
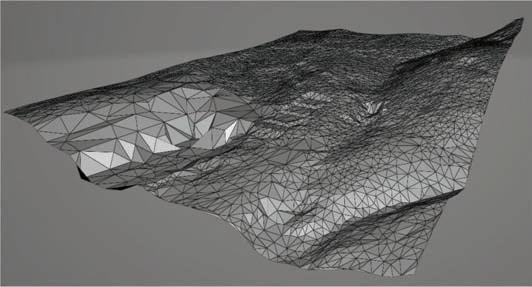
Figure 16. Longitudinal section of intervention around the tunnel, carried out underground with HDD parallels to the tunnel axis.
tion drilling up to 200 meters long, typically curvilinear in its initial segment to reach tunnel level, then straight in the latter part to remain parallel to the tunnel axis.
The purpose of this type of intervention is undoubtedly to minimize the volume loss. An example of this type of intervention is shown in Fig. 16 and Fig. 17.
Horizontal Directional Drilling (HDD) is an alternative trenchless method developed to facilitate the underground installation of pipelines. It offers numerous advantages over the traditional open trench method, particularly for undercrossing waterways, sea channels, communication routes, population centers.
More recently, the use of HDD technology [6] has been extended to other areas of civil engineering, particularly for underground works such as the consolidation and improvement of soil and rock characteristics. It can therefore be used to install drainage pipes, injection pipes, freezing probes, and other elements in the ground, depending on the consolidation technique chosen for the project.
The use of HDD technology for ground improvement has some significant differences from its classical application for pipeline installation:
– In most cases, the boreholes do not have continuous surface outflow at the point of arrival but are instead blind, meaning they terminate underground at a certain depth. This presents significant challenges for installing the components required for subsequent consolidation operations; –the diameters of the pipes to be installed are much smaller than in the pipeline installation, so reaming of the pilot hole is generally not necessary;
– temporary lining of the borehole is usually required to support the soil during the installation of the elements needed for subsequent consolidation operations.
For the HDD planned in this project to enable the installation of “tube à manchettes” (TAMs) inside the ground, either drillers specifically designed for HDD or conventional type drillers may be used. The former are faster both in drilling the pilot hole and in installing the casing, but they require more available working space and allow drilling at an angle of incidence to the horizontal of ≤16-18°. The latter, in addition to requiring less space, allows drilling to be set up at all possible entry angles.
Drilling rigs specifically designed for horizontal directional drilling (HDD) may be more suitable for operation from planned stations under construction, provided that the designed entry angles of the drill paths are compatible with their kinematic capabilities. Conventional drilling rigs, on the other hand, may be better suited for use from service shafts or from additional temporary shafts and tunnels.
Regardless of the choice, the drills used for HDD should have sufficient weight and power to carry out the drilling with the diameters and lengths planned in the project.
The HDDs in the project are generally designed to be partially curvilinear. Perforations of curvilinear sections in the vertical plane will have a radius of vertical curvature R v ≥ 120 m. In cases with simultaneous curvature in the vertical plane and plan curvature, the combined radius Rc will be ≥ 105 m.
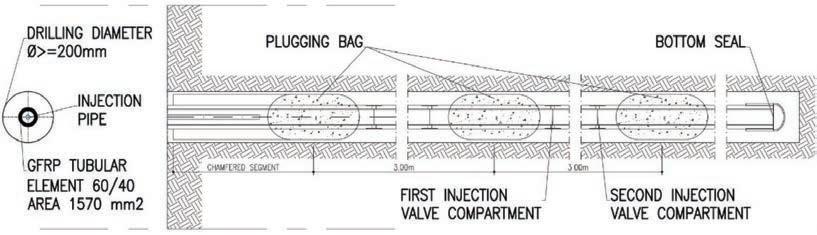
The construction method consists of drilling a pilot borehole, followed by installing the temporary borehole casing in which the TAM will be installed after the drill rod battery has been extracted.
The pilot borehole shall be drilled with the tools best suited to the characteristics of the soil to be traversed, considering the likely widespread presence of cemented layers of fluvioglacial deposits (gravel and sand with high cementation) and erratic distribution (so called “Puddinga”). Guidance shall be provided by asymmetric drill bit or bent rod (so called bent sub) and appropriate rotary or percussive drilling tool or mud motor (so called downhole mud motor).
The temporary casing of the borehole can be installed either simultaneously with the drilling of the pilot hole, as the pilot hole progresses, or after completion of the pilot hole if the stability of the borehole is sufficiently assured by the stabilizing drilling fluid. The temporary casing will consist of a jacket or wash pipe and will be guided during installation by the drill rods already in the hole. Its internal diameter will allow the subsequent maneuvering of the pilot hole drilling battery and the installation of the TAM.
The drilling fluid is one of the special features of this application; normally a bentonite suspension or a specially developed bentonite/polymer suspension is used.
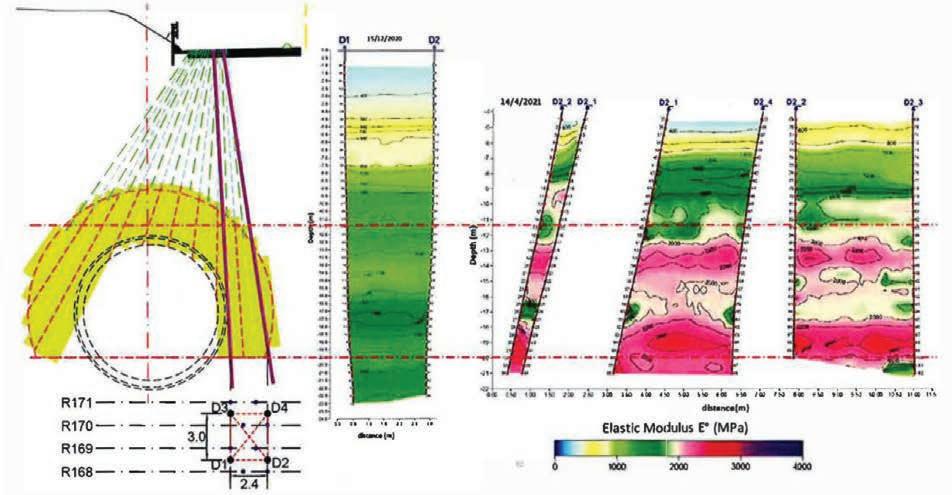
The pilot drilling will be “wireline” throughout its length, with the continuous assistance of a guidance engineer. Realtime localization of the tool in the ground during the drilling
Figure 17. Cross section of intervention around the tunnel, carried out underground with HDD parallels to the tunnel axis.
process, and thus the tracking its position and the determining the trajectory followed, will be carried out using a stateof-the-art Magnetic Guidance System (MGS).
The measuring probe, which transmits the necessary data by wire to the guidance engineer, is housed inside the non-magnetic drill rods. These rods are specially designed to eliminate as magnetic interference as possible, inherent in the metallic materials from which the drill rods are made.
The magnetic guidance system can be applied using an induced magnetic field, surface diffusion (if practicable), or special sacrificial holes made by conventional methods and monitored for actual trajectory.
Once the pilot hole drilling is completed and the hole is fully lined, the battery of rods used to drill the pilot hole is removed.
The TAM is then installed in the temporary casing, and the casing is formed with the appropriate cement mix. Finally, the temporary lining is removed, and the casing is topped up with additional cement mix.
5. Geothermal energy applied to underground structural elements
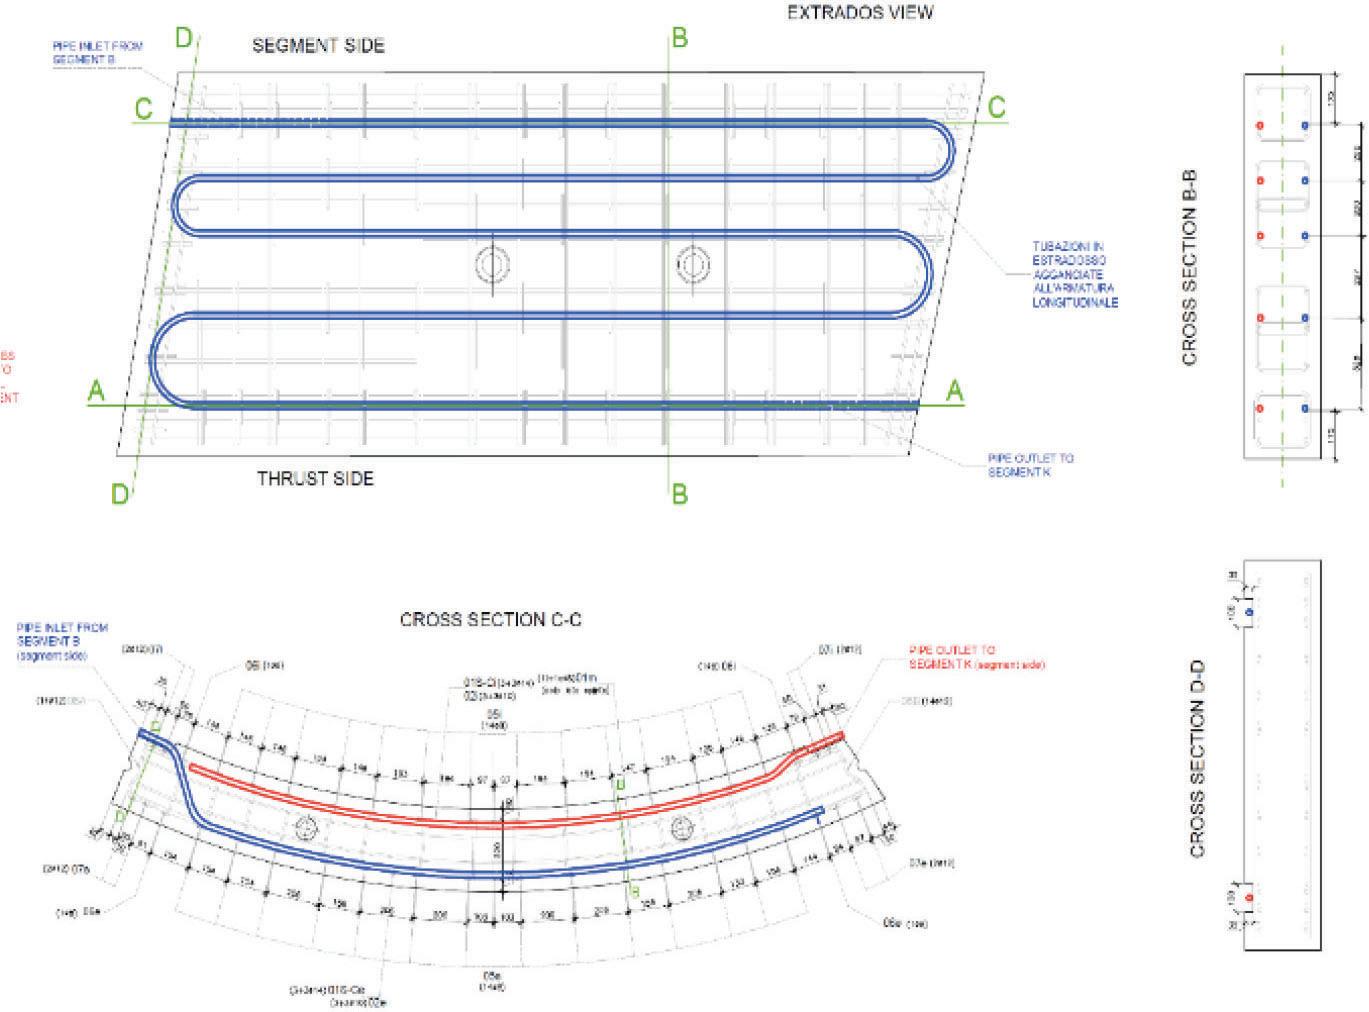
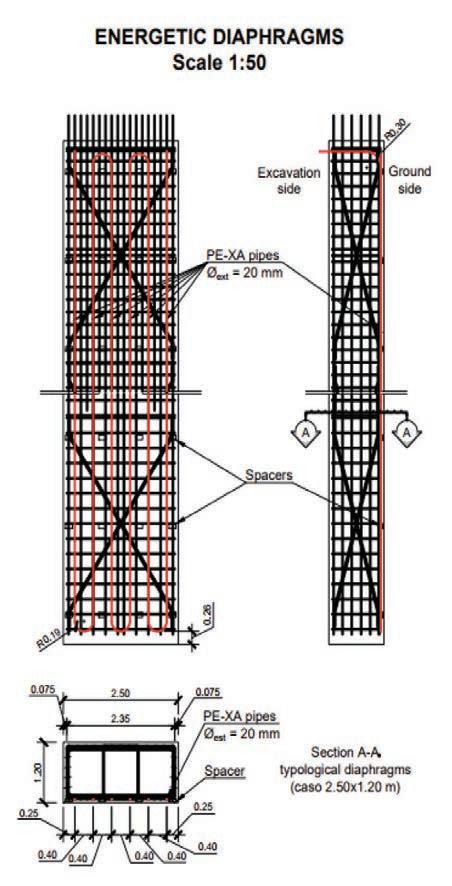
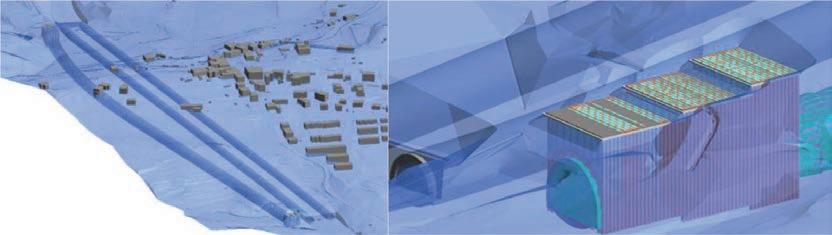
The concept of using geothermal energy in underground applications refers to the use of natural thermal resources from the underground to primarily meet the energy needs of the metro system, mainly for heating, cooling. The application of geothermal energy to underground structural elements is an innovative solution that combines structural engineering with energy efficiency. This technology uses foundations and other underground elements (such as piles, diaphragm walls, and foundation slabs, segmental lining of TBM tunnels) to exchange heat with the ground, thereby reducing energy consumption for air conditioning in stations and other metro-related facilities.
Low enthalpy geothermal systems have always been widely used for space heating and represent one of the most effective ways of providing sustainable energy in urban environments where the ground can be used as a reliable heat source. The thermal activation of underground structures
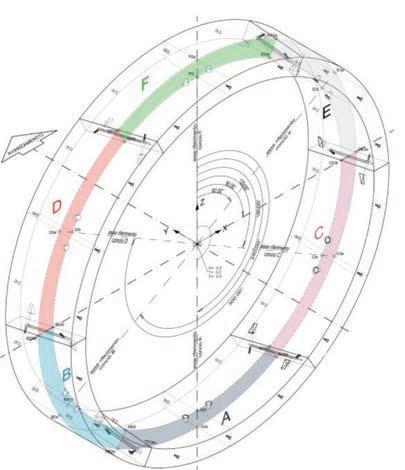
Figure 18. System TBM (energetic segment lining).
is achieved by embedding absorber pipes within them, allowing a circulating heat transfer fluid to transfer thermal energy from or to the ground according to seasonal demand, providing heating in winter and cooling in summer. The ENERTUN precast segmental lining system has been employed for the TBM-excavated tunnel of Metro Line 2 [7-8]. This application is based on experimental tests carried out in the tunnel of Turin Metro Line 1 [9], which evaluated the performance of this technology in real installation conditions. The design objective of the project is to quantify, through finite element thermo-hydro simulations, the amount of heat that can be extracted from and injected into the ground by geothermal activation of the tunnel linings. In addition, the potential recipients of the extracted thermal energy have been identified, considering firstly metro stations and then existing buildings and future urban developments.
5.1. Data Collection for Line 2 Geothermal Analysis
To support the design of the geothermal system, various data sets were collected based on existing information and additional investigations were carried out during the design of Line 2:
–Geometric characteristics of the metro line;
– Construction technologies and methods (TBM, Cut & Cover);
–Geological profile along the tunnel alignment;
– Geotechnical and hydrogeological properties, including permeability and effective porosity of the ground;
–Thermal properties of the ground (conductivity, heat capacity, diffusivity);
– Groundwater characteristics along the alignment, such as piezometric levels, groundwater flow direction and groundwater temperature.
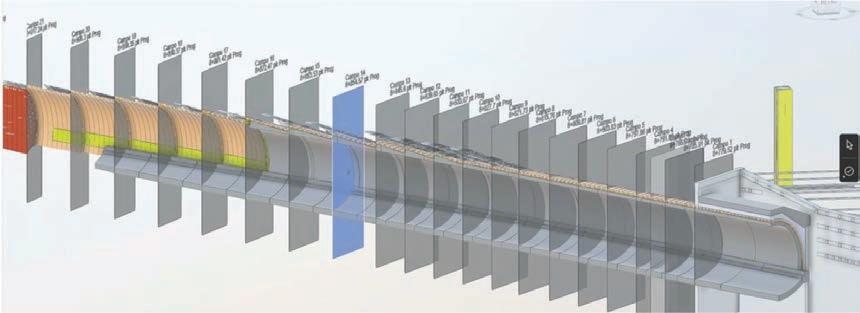
Once the global geometric, geotechnical, thermal and hydrogeological framework of the subsoil surrounding the tunnel was established, the metro line was divided into homogeneous sections based on geothermal behaviour, following the methodology described by [10], on this base the application of the following typical section is foreseen (Fig. 18 and Fig. 19):
•In TBM driven sections, the entire precast tunnel lining is thermally activated using the ENERTUN system.
•In Cut & Cover (C&C) sections - both tunnels and stations - only the vertical diaphragm walls will be used for geothermal exchange.
5.2. Numerical Modeling and Performance Evaluation
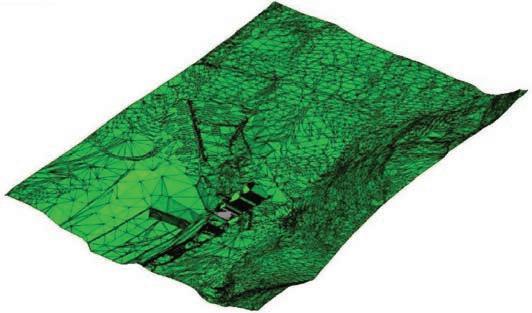
The excavation method (TBM or C&C), the groundwater flow characteristics (direction and velocity) and the geothermal conditions of the subsurface have a significant impact on the performance of the system. Coupled thermohydro finite element numerical models were developed for each homogeneous section to analyse the geothermal potential of the infrastructure. These simulations allowed the estimation of:
The amount of thermal energy that can be extracted or injected (measured in kWh);
•The energy efficiency of each homogeneous section;
• The total geothermal potential that can be delivered by Metro Line 2.
Three-dimensional thermo-hydro finite element models were used to further refine the geothermal potential assessment and to evaluate the impact of tunnel activation on the surrounding subsurface. These models simulated both ENERTUN tunnel segments (for TBM sections) and diaphragm walls (for C&C sections) equipped with heat absorber pipes. The FEFLOW® software was used, following the mathematical formulations detailed in [11].
One-dimensional discrete feature elements available in FEFLOW were used to model the absorber pipes installed in the tunnel lining.
Figure 19. System C&C Tunnel (energetic diaphragms).
5.3. Geothermal Potential Assessment
The interpretation of the results of the thermo-hydro FEM simulations allowed the evaluation of the geothermal potential in different sections of Line 2. The results were summarised by mapping the thermal output (W/m of tunnel length) for both winter and summer conditions.
For intuitive visualization, five thermal efficiency classes were defined:
•Class 1 (<200 W/m): Least favourable conditions for geothermal heat exchange.
•Class 5 (>800 W/m): Most favourable conditions for geothermal heat extraction/injection.
Figure 20. Geothermal System Specific Power in W/m for TBM and C&C Tunnel.
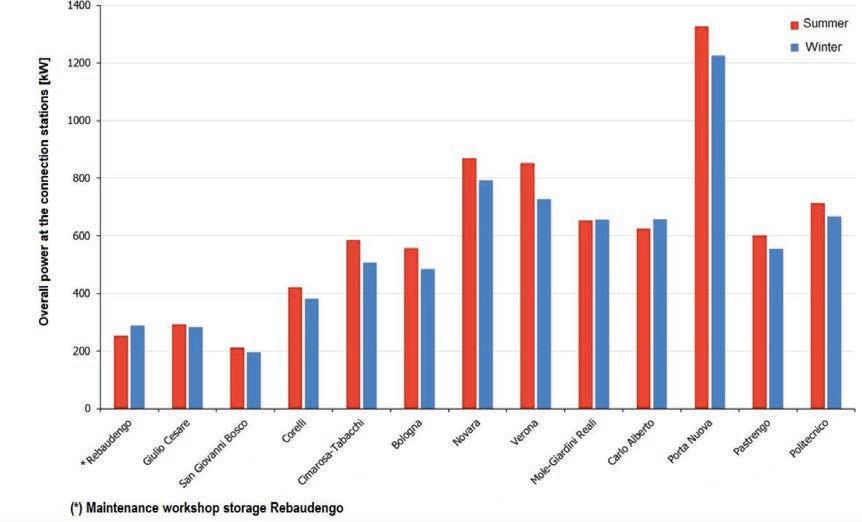
Figure 21. Overall summer and winter power extracted from each station.
The two most important factors influencing heat exchange efficiency were identified as:
•Groundwater flow velocity
•Piezometric height relative to tunnel position
5.4. Summary of Results
This design study highlights the significant benefits of tunnel thermal activation for the Turin Metro Line 2. Based on the results obtained, the thermal activation of the station and tunnels would meet the heating/cooling needs of all the metro stations along the line as shown in Fig. 20 and Fig. 21. The excess thermal energy can be used for other potential users along the Line 2.
6. Implementation of the BIM process
The project for Line 2 of the Turin Metro involved various design fields (structural, architectural, and plant engineering) and required the interaction of multidisciplinary teams throughout the entire project lifecycle.
The BIM process enabled optimal project management and was implemented in accordance with current Italian regulations (i.e., Public Contracts Code and related ministerial decrees) and in line with the requirements specified by the Client in the Information Specification for the drafting of the Definitive Project.
This approach overcame the limitations of traditional design, characterized by a linear and sequential workflow, which often led to errors and inconsistencies. Integrated design, on the other hand, allowed the creation of a threedimensional and parametric virtual model containing data related to objects, attributes, and relationships. This model accurately represented the work and met the requirements of the various design levels, enabling the transfer of information without any loss between different disciplines.
The design phase was managed through three data sharing environments: the first, within the corporate cloud, to connect all stakeholders; the second, on dedicated cloud platforms, to coordinate the production of models; and the third, also on dedicated cloud platforms, to manage the fifth dimension of BIM.
The process involved the breakdown of the metro infrastructure into 49 Work Breakdown Structures (WBS), allowing the development and management of 250 digital models, from which approximately 1.500 coordinated design documents were produced. Additionally, information for the determination of the bill of quantities (the so-called 5D dimension) was derived by linking individual models to the price list. This approach enabled the determination of the bill of quantities and the establishment of construction cost management. Another aspect introduced by the BIM methodology, included among the modelling objectives, concerned communication. For Line 2 of the metro, in addition to photo insertions and illustrative videos, two experimental applications related to augmented reality and virtual reality were developed (Fig. 22). These applications were further refined and released in the executive design phase to engage the public and provide a comprehensive view of the entire work.
7. Legal Issues
The execution of such complex works by a public contracting authority requires compliance with various legal limits, set by applicable laws to ensure the objective public interest [12]. The public interest includes awarding contracts and the performing services in accordance with tender rules, maximizing timeliness, value for money, legality, transparency and competition, also known as the “result principle” and made object of a recent statutory regulation by the Italian legisla-
Figure 22. Digital Communication - Virtual and Augmented Reality.
tor (art. 1 of Legislative Decree no. 36/2023).
To ensure the legitimacy of the entire procurement procedure and respect the principles of “public evidence”, close cooperation between the technical and legal teams is essential in three phases: planning and programming, participant selection, and contract execution. This synergy ensures the procedure meets legal principles and rules, and maximize technical expertise.
The choice of the best procurement procedure is crucial, with flexibility allowed for constrained procedures (“open procedure” and “restricted procedure”) and flexible procedures (“competitive dialogue”, “competitive procedure with negotiation”, “innovation partnership”). Coordination between legal and technical sides ensures appropriate request to economic operators, considering project specifics. Post-selection, cooperation continues in preparing tender documents, defining participation requirements, and identifying evaluation criteria. This integrated approach anticipates and prevents potential issues during execution, reducing risks and disputes [13], [14].
A new instrument, the “Collaboration Agreement” (D.Lgs. n. 36/2023 art. 82 bis and All. II.6 bis) address legal and technical problems during contract execution, promoting “alliancing” techniques closer to the Anglo-Saxon tradition [15]. This Agreement fosters collaboration all parties involved, including subcontractors and suppliers, enhancing project efficiency and reducing conflicts [16].
In practice, the Collaborative Agreements act as “umbrella” contracts, gathering contractors under a common disciplined framework, promoting synergy and economies of scale [17]. . This approach identifies common goals, rewards virtuous behaviors, and reduces antagonisms, creating network bodies to resolve conflicts. Consider, for example, the challenges associated with technological, system, and infrastructure changes, which often render a service obsolete before it is even completed. In such cases, the Collaboration Agreement can serve as the primary framework for integrating legal, technical, and market requirements.
Although relatively new, Collaborative Agreements show promise in addressing technical disruptions—such as technological changes—helping to ensure that services remain relevant and effective throughout execution.
Conclusions
The final design of Line 2 of the Turin Metro represents a significant challenge due to the complexity of the infrastructure and the multidisciplinary of the topics involved. After a synthetic description of the inputs and constraints of the project, the development of the alignment and related works, we moved on to the description of the geological and geotechnical context in which the underground work will be carried out. In this paper the authors wish to share with the tunnelling community the main challenges encountered,
with insights into some innovative solutions adopted concerning different aspects:
I. FunctionalandSystemDesignAspects: the safety management in the metro system according to the Ministerial Decree of 21/10/2015 represents the first case of application in the design of an entire metro line. This innovative approach has proved safety management and introduced new technologies for smoke control and evacuation.
II. BuildingRiskAssessment: The estimate of the effects induced by the TBM tunnel excavation on surrounding buildings was illustrated. Based on the BRA (Building Risk Analysis) methodology, two volume loss (VL) scenarios were identified: VL = 0.5% and VL = 1%. Although it is possible to achieve a VL = 0.5% (or lower) in geological-hydrogeological conditions similar to those of Line 2, as a precaution, the designers took the value VL = 1% as reference. In this scenario it appears that several buildings in the central section fall into moderate to severe damage categories; therefore, they appear to be at risk of damage and mitigation measures have been planned for these.
III. MitigationMeasures: The mitigation measures envisaged in the project depend both on the grain size of the soil affected by the TBM tunnel excavation and on the logistical conditions of the sites subject to intervention. The types of ground improvement adopted include permeation injections with highly penetrable silicate-based cement mixtures or jet-grouting. Among the various technologies implemented in the project, HDD technology was particularly noteworthy. Due to the impossibility of operating from the surface, especially to improve the ground beneath the buildings in the historic center, the installation of the injection lines will proceed with the aid of HDD. This involves the installation of “tubes à manchettes” (TAMs) through which permeation injections will be carried out, aimed at creating a double crown of consolidated soil at the contour of the tunnel, above the canopy, up to at least the level of the centres. With this technology, consolidation perforations with a length of up to 200 meters have been designed. These perforations are generally curved in the initial part to reach the tunnel level and rectilinear in the second part, remaining parallel to the tunnel axis.
IV. GeothermalEnergy: The geothermal energy applied to underground structural elements is described. The heat exchange between the underground structure and the surrounding soil was simulated in detail using 3D Finite Element Method (FEM)8. models, taking into account various influencing factors such as tunnel geometry and hydrogeological conditions. Numerical analyses show that the presence of groundwater flow increases heat exchange rates while minimizing temperature variations in the surrounding soil. In addition to the production thermal energy to feed the Hvac systems for station air conditioning, another favourable perspective can be envisaged. It is
well known that the construction of a metro line can stimulate new urban and building development. Consequently, an added value to the thermal activation of the metro structures is foreseeable in areas of new urbanisation or complete renovation. In these areas, connection to the existing district heating system is technically challenging. Therefore, geothermal energy can be an interesting option for meeting the minimum legal requirements for energy from renewable sources. In this context, the Metro Line 2 itself can be seen as a local district heating and cooling network. The future challenge in terms of feasibility will depend on the design, production and automated installation of prefabricated segments of the ENERTUN type, an application context to be addressed and solved in the subsequent design and construction phase.
V. Implementation of BIMprocess: The BIM process represents an important challenge for all the stakeholders involved. This methodology improves multidisciplinary interfaces of such a complex project, reduce the risk of errors, and achieves shared models. BIM 5D was introduced to determine the bill of quantities and set up the management of construction costs. This methodology also helped project communication through augmented and virtual reality.
VI. Legal Issues: It is necessary for the Contracting Authority to operate in synergy between the technical and legal parts to ensure the legitimacy of the entire procurement process and respect the principles of “public evidence”. Collaboration between technical and legal teams is essential to address technical and legal challenges during the contract execution, promoting project efficiency and reducing conflicts. The introduction of Collaborative Agreements further aids in resolving issues related to technological, system, and infrastructure changes, ensuring the service remains relevant and effective.
The challenges and innovative solutions described in this article represent an important starting point to face the future and fundamental challenges of the construction and commissioning of Line 2. The goal is to improve the quality of urban life by providing an efficient and sustainable public transport system.
Acknowledgements
The Authors would like to thank the Infratrasporti.To team for their dedicated efforts in developing the final design. Special thanks area extended to the Municipality of Turin and, in particular to Eng. Amerigo Strozziero, who served as Lead Manager of the Project, for the substantial support in managing the design process. The Authors also wish to thank Eng. Vittorio Manassero for his specialist consultancy on the ground improvement technologies implemented, and Prof. Eng. Marco Barla and his team for their invaluable consultancy on the innovative application of geothermal energy in underground works.
References
[1] Guglielmetti V., Grasso P., Mahtab A., Xu S. (2007) – Mechanized tunneling in Urban areas. Ed. Taylor & Francis.
[2] Attewell P.B., Farmer I.W., (1974) – Ground disturbance caused by shield tunnelling in a stiff, overconsolidated clay. Eng. Geol., 8: 361-381.
[3] Burland J.B., Broms B., De Mello V.F.B. (1977) – Behaviour of fundations and structures. SOA Report, Session 2, Proc. 9th Int. Conf. SMFE, Tokyo, 2: 495-546.
41] New B.M., O’Reilly M.P. (1991) – Tunnelling induced ground movements; predicting their magnitude and effects, 4th International Conference on Ground Movements and Structures. Cardiff, pp. 671-697, Pentech Press.
[5] Mair R.J., Taylor R.N., Burland J.B. (1996) – Prediction of ground movements and assessment of risk of building damage due to bored tunnelling. Geotechnical Aspects of Underground Construction in Soft Ground. Eds. Mair & Taylor.
[6] Manassero V., Di Salvo G. (2017) – Sotto-attraversamento di un complesso monumentale con TBM, previo consolidamento del terreno mediante iniezioni. XXVI Convegno Nazionale di Geotecnica, Roma, 20-22 giugno, Vol. 2, pp. 629-637.
[7] Barla M., Di Donna A. (2018) – Energy tunnels: concept and design aspects. Undergr. Space.
[8] Di Donna A., Barla M. (2016) – The role of ground conditions and properties on the efficiency of energy tunnels. Environ. Geotech., 1-11.
[9] Barla M., Di Donna A., Insana A. (2019) – A novel real-scale experimental prototype of energy tunnel. Tunn. Undergr. Space Technol. 87,1-14.
[10] Baralis M., Barla M., Bogusz W., Di Donna A., Ryzynski G., Zerun M. (2018) – Geothermal potential of the NE extension warsaw metro tunnels. Environ. Geotech.
[12] Cons. Stato, Sent. 2256/2017, point 7.8, which expressed this principle with regard to the definition in article 3, paragraph 1, letter dd), Legislative Decree 50/2016.
[13] Caringella, Mantini, Giustiniani (2022) – Codice dei contratti pubblici, Milano.
[14] The national legislature deviates from Dir. Com. art. 58 by defining “requirements of the special order” instead of “selection criteria” (“selection criteria”).
[15] Mosey D. (2019) – Collaborative Construction Procurement and Improved value. London; parte italiana a cura di Valaguzza, S. (2019). How does collaborative procurement operate in Italy
[16] Valaguzza S. (2019) – Gli accordi collaborativi nel settore pubblico: dagli schemi antagonisti ai modelli dialogici, in Il diritto dell’economia, anno 65, n. 99 (2/2019), pp. 255-278.
Tunnels along the new high-speed Brescia-Verona Railway Line – Design, Construction, Performance and Challenges
Gallerie della nuova Linea Ferroviaria ad Alta Velocità Brescia-Verona – principali sfide nella progettazione e costruzione
Maurizio TANZINI a, *
Davide MERLINI b
Luca ZECCHETTO a
Marco TREZZI a
Matteo FALANESCA b
Antonio A NANIA c
Marco L AFFRANCHI c
a ARX ITALIA S.r.l.
b ARX Group SA
c Cepav Due, Brescia, Italia
* corresponding author: maurizio.tanzini@arx.ing
Abstract
This paper provides a general overview of the main underground works of the Brescia Est - Verona high-speed railway line which is part of the Milan - Venice line. The main design aspects of double-track and twin single-track tunnels, constructed by conventional tunnelling and by a tunnel boring machine, are described. For the mechanized excavation of the Lonato tunnel, a TBM - EPB with a diameter of 10.03 m was used. In particular, for both the San Giorgio in Salici and Lonato tunnels, the geotechnical and design problems related to the sub-crossings of the A4 motorway with extremely reduced ground cover, ranging between 7 and 12 m, are described. Furthermore, since the excavations of the tunnels in question have now been completed, for the Lonato tunnel, whose excavations was carried out using a TBM-EPB, some results are reported in terms of the operational parameters adopted during the excavations and of the monitoring data, acquired during the works, with reference to the section relating to the undercrossing of the A4 highway.
Sommario
In questo articolo viene fornita una descrizione delle principali opere in sotterraneo relative alla tratta ferroviaria AV/AC Brescia Est – Verona, importante tappa nella realizzazione del collegamento ferroviario AV/AC Milano – Venezia. A tale riguardo sono riportati gli aspetti progettuali ed esecutivi rilevanti relativi alle gallerie a doppio binario con singola canna (galleria Calcinato II e San Giorgio in Salici) e alla galleria a singolo binario con doppia canna (galleria Lonato), realizzate con il metodo sia dello scavo tradizionale a piena sezione sia dello scavo meccanizzato. Per lo scavo meccanizzato della galleria Lonato è stata utilizzata una TBM - EPB con diametro di 10,03 m. In particolare, per entrambe le gallerie San Giorgio in Salici e Lonato, vengono descritte le problematiche geotecniche e progettuali relative ai sotto attraversamenti dell’autostrada A4, con coperture estremamente ridotte comprese fra 7 e 12 m. Inoltre, essendo ormai ultimati gli scavi delle gallerie in oggetto, per la galleria di Lonato, il cui scavo è stato eseguito con TBM - EPB, vengono riportati alcuni risultati significativi dei parametri operativi adottati durante gli avanzamenti e dei dati di monitoraggio acquisiti in corso d’opera, con riferimento alla tratta relativa al sotto attraversamento dell’autostrada A4.
Keywords: soil classification, geomechanical parameters, full face excavation, ADECO-RS approach, TBM-EPB, earth pressure balance, soil grouting; grout mixes; monitoring. Parole chiave: classificazione dei terreni, parametri geotecnici, scavo tradizionale a piena sezione, approccio progettuale ADECO-RS, TBM-EPB, sostegno del fronte di scavo, miglioramento dei terreni, miscele di iniezione, monitoraggio.
1. Introduction
The new High - Speed/High - Capacity Brescia -Verona railway line is one of the central links of the Central Mediterranean Corridor, intended to connect the ports of the south of the Iberian Peninsula to the Ukrainian border. Between Brescia and Verona, the new line is about 48 km long, running mostly alongside the A4 highway (Figure 1). The project involves the construction of three tunnels in soft ground using conventional and mechanized methods, as well as several cut-and-
cover tunnels for a total length of 10.6 km. The main challenges of the project were: excavation in soft ground, heterogeneous geological formations, low cover and highly variable soil permeability values, presence of numerous buildings and structures and, for two tunnels, the undercrossing of the A4 highway in presence of shallow overburden (8 - 12 m) [1]. Both the tunnels built using conventional methods (Calcinato II and San Giorgio in Salici tunnels) and the twin Lonato tunnel built by a TBM – EPB have been completed in 2024. The project was commissioned by the Italian Railway Network (RFI - Rete Ferroviaria Italiana) to the Cepav Due Consortium consisting of Saipem (59.09%), Impresa Pizzarotti (27.27%), and ICM Group (13.64%). The Pini Group is handling the tunnel design and assisting the construction management, while Italferr is responsible for high supervision and construction work direction. The economic investment in the Brescia EstVerona functional lot, approved by the Interministerial Committee for Economic Planning, is 2,499 million euros while the quota assigned to Cepav Due is 2,160 million euros.
2. Key data of the project
The project consists in the construction of three railway tunnels in soft ground by means of conventional and mechanized tunnelling (EPB machine) as well as the execution of several sections by means of cut and cover and top-down tunnels. The main challenges of the project are represented by the interference with the existing hydraulic systems and by the excavation at very low overburden underneath existing roads and highways. The key data of the project are the following:
–Conventional and mechanized tunnels for a total length of 11.2 km,
–Cut and cover and top-down tunnels for a total length of 5.0 km,
–Lonato Tunnel 7.6 km (diameter 10 m):
Twin-tube tunnel excavated by means of TBM-EPB (about 4,800 m each),
Two cut and cover tunnels partially mono-tube and partially twin-tube (2,781 m),
Maximum overburden = 98 m,
–San Giorgio in Salici Tunnel 3.4 km (equivalent diameter about 14 m):
Conventional tunnel, single tube (1,427 m), Two cut and cover tunnels, single tube (1,966 m), Maximum overburden = 23 m,
– Calcinato II Tunnel 460 m (equivalent diameter about 14 m):
Conventional tunnel, single tube (230 m), Two cut and cover tunnels, single tube (230 m), Maximum overburden = 30 m.
2.1. Calcinato II tunnel
The Calcinato II tunnel consists of a 230 m long single doubletrack tube with cross – section of about 160 m2. The construction works affects a promontory belonging to a morainic cordon of the outermost circle of the so-called Garda amphitheatre and is included within a mostly flat territory of alluvial and fluvioglacial origin. The overburden of the tunnel , H, is extremely low, ranging from a minimum of 5 m, in the first section, starting from the portal on the Milan side, up to a maximum
Figure 1. The High-Speed/High-Capacity Brescia East -Verona railway line.
Figure 2. Calcinato II tunnel, low overburden tunnel close to the A4 highway, cross-section across the slope.
of approximately 13 m in the central section of the tunnel. The tunnel has been designed, excavated and completed using full face excavation, according to the ADECO-RS design approach, which stands for “Analysis of controlled deformations in rock and soil” [2]. With reference to Figure 2, the tunnel is located into a slope and close to an important gravity wall, approximately 6 m high along the A4 highway. The tunnel develops substantially parallel to the A4 highway in a West-East direction. According with the predictions based on ADECO-RS, the tunnel has been excavated along the entire length in unstable core - face conditions (“C” behaviour category). As shown in Figure 3, the excavation took place full face by “protecting” and “reinforcing” the core ahead of the advancing tunnel face with the use of fibreglass elements, sub-horizontal jet – grouting columns and forepoling support by steel pipes [3]. In addition, the distance of the kickers and invert of the final lining from the face has been defined on the basis of the monitored deformations and stresses during advance, reducing this distance in case the measured values exceed the design values.
2.2. San Giorgio in Salici tunnel
The total tunnel length is equal to 1,427.39 m, with a singletube double-track section and a cross section of 155 m2 . The overburden of the tunnel varies from 5 m to 20 m. According with the predictions based on ADECO-RS approach, the tunnel has been excavated along the entire length in unstable core - face conditions (“C” behaviour category). The following two main cross – sections have been adopted with reference to the different soils of interest in the tunnel excavation: –Cross – section C1A (Figure 4) for the glacial and fluvioglacial deposits of the San Giorgio Allogroup (Garda Morainic Amphitheatre) with predominantly fine-grained soils (clayey silt, sandy silt, weakly sandy silt with gravel) that includes: pre-confinement of the face using an average value of 50 (min. 40, max. 60) cemented fibre-glass structural elements, consisting of a tube with an external diameter of 60 mm, an internal diameter of 40 mm, 18 m long, with a minimum overlapping of 9 m; a forepoling umbrella consisting of 55 pipes, each of 88.9 mm in diameter, thickness 10 mm; a temporary lining made of 25
Figure 3. Calcinato II tunnel, typical cross – section with the stabilization measures for the core and tunnel contour ahead of the advancing face.
Figure 4. San Giorgio in Salici tunnel, C1A cross – section with stabilization measures of the core and tunnel contour ahead of the advancing face.
cm fibre-reinforced shotcrete and 2 IPN 180 ribs spaced an average value of 1.0 (min. 0.8 m, max. 1.2 m).
Cross – section C1B (Figure 5), for the glacial and fluvioglacial deposits of the San Giorgio Allogroup (Garda Morainic Amphitheatre) in the sections of the tunnel in terrains with a higher percentage of cohesionless coarse-grained soil (silty gravels and silty sands with gravel), that includes, in addition to the stabilization measures foreseen for C1A cross section, sub-horizontal jet-grouting columns. The most critical design aspect was the stretch that underpass the A4 highway, with the extrados of the tunnel crown located at about 7÷8 m under the highway pavement. The area, where the San Giorgio in Salici tunnel undercrosses the A4 motorway, consists of glacial and fluvioglacial deposits. In this stretch the deposits are characterized by a
presence of coarse grained soil, mainly sandy gravels that include lenses of fine sand and silty sand, however with a finegrained content up to 40-50% (see Figure 6). All stratigraphic levels contains clasts with diameters up to 20-40 cm. Numerical analyses conducted for the excavation of the tunnel beneath the A4 motorway had highlighted the need of a ground improvement to obtain an increase in cohesion of at least 500 kPa. Numerous test fields have been carried out to evaluate the different technologies available for ground improvement and the conclusions have led to identify the jet - grouting as the best technology. Therefore, with reference to the following Figures, the adopted tunnel cross – section below the highway has included jet-grouting technology, carried out from the highway pavement, using vertical jet – grouting by the double – fluid system (grout and air), 1.2
Figure 5. San Giorgio in Salici tunnel, C1B cross – section with stabilization measures of the core and tunnel contour ahead of the advancing face.
Figure 6. Grain size of soils hosting the stretch of the San Giorgio in Salici tunnel corresponding to the A4 highway underpass.
m diameter arranged according to a rectangular grid with a transversal and longitudinal spacing of 1.0 and 1.2 m. This intervention allows obtaining a reinforcement of the ground around the cavity as uniform as possible and with high mechanical characteristics, typical of columnar elements of soil created by the jet-grouting. Ground improvement by jetgrouting has been extended below the tunnel invert, as the piezometric readings have shown the presence of a high water table, at a depth of 2÷3 m below the ground level. The jetgrouting at the invert has been necessary for the following reasons: (1) creation of a consolidated shell that surrounds the entire perimeter of the tunnel; (2) avoid a lowering of the water table that could induce consolidation and induced settlement below the highway pavement; (3) avoid piping phenomena, at the bottom of the inverted excavation, due to the high gradients caused by the seepage that could produce a loosening of the ground and a loss of bearing capacity (source of subsequent settlements) below the rail level; (4) furthermore, this design solution allowed the jet-grouting
shell to be sectioned with walls of columns transverse to the tunnel axis, creating closed boxes. In each box, it has been possible to extract water by lowering the internal piezometric level compared to the natural one existing around it. The tunnel excavation has been carried out, in successive sections, by entering each box and, consequently, lowering the water table in conditions of total safety. Also for the purposes of hydrogeological balance, this execution method allows not to unbalance the underground water flows.
2.3. Lonato tunnel
The most significant work, from construction complexity point of view, is represented by the Lonato tunnel system, consisting of a twin-tube tunnel excavated by means of TBM (about 4,800 m each) and two cut and cover tunnels (Milan side and Verona side) for a total length of approximately 7,950.0 m. The tunnel is located just south of the town of Lonato adjacent to an industrial area. The railway line underpasses the A4 Milan-Venice motorway after approximately
Figure 7. San Giorgio in Salici tunnel, cross – section by jet – grouting for the undercrossing of the highway.
200 m from its start, with an overburden between 11 and 13 m. The distance between the two tubes is approximately 30 m, while the minimum planimetric curve radius of 7,130.0 m and a maximum gradient of 0,605%. Along the tunnel alignment the maximum overburden is equal to 98 m and the a nominal excavation diameter is 10,030.0 mm.
The tunnels have been excavated with an EPB type TBM, i.e. with balanced earth pressure, manufactured by China Railway Engineering Equipment Group (CREG). The technical characteristics and functional peculiarities have been the subject of an in-depth study by a working group created ad hoc by the Consortium Cepav due, in order to select the ideal machine to face the difficult geotechnical conditions, characteristic of the morainic, glacial and fluvioglacial for-
mations, expected along the Lonato tunnel alignment. The final lining of the tunnel consists of pre-casted segmental lining rings in reinforced concrete of the universal type that allow to follow the alignment of the project even in the sections with variable horizontal and vertical curvature (see Figure 10). Each ring, with an intrados diameter of 8.800 mm, is composed of 6 segments with a thickness of 450 mm and a length of 2.000 mm.
The shield (see Figure 11), divided into three main sections, is 14.5 m long while the cutterhead protrudes from it for about 1 m bringing the overall length of the machine to 15.5 m.
The machine has been designed with twin screw conveyors to operate in high water and earth pressures and with extra provisions to catch big boulders to avoid that they will be conveyed
Figure 8. San Giorgio in Salici tunnel, macro phases for the diversion of the highway and execution of jet-grouting.
by the tunnel belt with the risk of damaging the rubber belt. The back-up, with a total length of approximately 152 m, consists of 8 platforms equipped with a stabilizing wheels alignment correction device in order to enable easy passage in the curved sections of the tunnel. A summary of the main technical characteristics of the selected machine is shown in Table 1 [4].
3. Some design and construction aspects of Lonato tunnel
3.1. Geological and geotechnical setting
The soils affected by the Lonato tunnel excavation were investigated, during the various design phases, by a series of
survey campaigns. More precisely, three main campaigns were conducted in 1992-1994, 2000-2002 and 2004-2005. A further campaign was carried out in 2014-2015 in support of the environmental and land use plans. Finally, in December 2017 and January 2018, an additional survey was carried out preparatory to the Detailed Design. The geotechnical investigation consisted of continuous core drilling, piezometers, tests and on-site measurements, Standard Penetration Tests (SPT), Lefranc permeability tests and Down-Hole and CrossHole geophysical tests; in addition numerous samples were taken for laboratory testing. The geotechnical campaigns have allowed to identify, along the alignment of Lonato tunnel, two main types of terrains to be bored by means of the mechanised excavation, the morainic deposits belonging to the Lugana group (Upper Pleistocene) and the fluvioglacial deposits, geologically less recent, belonging to the Lonato and San Giorgio groups (Middle Pleistocene) as shown in Figure 12. In the morainic terrains, there are gravels and pebbles immersed in a silty clay matrix, silts, sandy gravelly silts and clayey silts with gravels and are interbedded with fluvioglacial deposits; the latter, whose thickness is such that reach depths greater than those of the tunnel, are lithological homogeneous and from a geotechnical point of view they consist of gravels and gravels with sand, that locally incorporate lenses of silty sand. In the Gardesan morainic ridges, there are gravels and pebbles immersed in a silty clay matrix, silts, sandy gravelly silts and clayey silts with gravels and are interspersed with fluvioglacial deposits. A simplified geotechnical profile along the Lonato tunnel is shown in Figure 13. As it can be seen, 3 main geotechnical groups have been identified: (1) Group 1: gravel and silty – clayey sand; (2) silty gravel and silty sand with gravel; (3) sand, silty gravel, gravel – sand – silt mixtures.
Figure 9. Lonato Tunnel: typical cross section.
Figure 10. Assembling scheme for the Lonato tunnel segmental lining.
In consideration of the importance of the granulometry of the soils expected to be encountered along the tunnel alignment, the different fractions, representing the soils along the alignment at the depth of the tunnel, were determined by means of grain size analyses conducted on samples of material obtained from the boreholes. Based on the results of the grain size analyses, the alignment of the tunnel has been discretized in two sections: the first, between the chainage km 115-118, in which gravels with slightly silty sand and sandy gravels weakly silty with fine fractions on average less than 15% are predominant (Figure 14) and a second section, from chainage km 118 to the end of the tunnel approximately at chainage km 120, characterized by the presence of silty gravels with slightly clayey sand in which the fine fractions are averaging between 30% and 40% (Figure 15).
Although the grain size is only one of the elements to be considered, for the selection of the machine, in a multi-criteria analysis [5,6,7] it is also the determining factor for understanding the risks associated with the phenomena of instability of the face and for the conditioning of the terrains to be excavated [8,9].
MachineType EPB(manufactured by GREG)
Nominal Excavation Diameter 10.030 mm
Total Length and Weight 150 m ; 1.750 t
Cutterhead Power 11 x 350 kW = 385 MW
Cutterhead Tools 6+50 cutters 18” + 124 scrapers
Cutterhead Opening Ratio 34%
Main Bearing diameter size 5.020 mm
Nominal Torque 22.200 kNm at 1,57 rpm
Breakout Torque 26.650 kNm
Maximum Thrust 140.000 kN
It is evident that the terrains encountered in the first section, comprised between the chainage km 106-108 needs an appropriate integration for the conditioning by means of bentonite fillers necessary to compensate the lack of fines. For this purpose, conditioning tests were carried out in the laboratory of the Polytechnic of Turin, with the addition of bentonite filler in the form of slurry, which highlighted the possibility of obtaining a well-conditioned material with good workability [10].
The stratigraphic structure complexity entails an equally complex hydrogeological structure characterized by large variations of the permeability, due to porosity, of the deposits in which the Lonato tunnel has been excavated. Despite a considerable permeability coefficients variability in the various formations along the tunnel alignment, two hydrogeological units can be distinguished, one consisting of the silty-clayey sequences of the moraine deposits with permeability coefficient of the order of 10-6 m/s, therefore with permeability for medium-low porosity, and one with much higher hydraulic conductivity (Figure 16) consisting of fluvioglacial deposits in which high hydraulic loads can be expected.
The analysis of piezometric data has highlighted a complex system of surface aquifers that does not allow for the identification of a single piezometric surface along the alignment of the tunnel. To evaluate the presence of boulders in the morainic and the fluvioglacial deposits, a detailed studybased on the borehole logs and site surveys to map all the erratic boulders at the ground level along the tunnel route - has been carried out; the tunnel excavation confirmed the presence of frequent boulders with very variable dimensions up to a maximum of 1.5 m.
Furthermore, on the basis of the interpretation of the investigations conducted along the entire alignment, it was possible to define sections with homogeneous geotechnical behaviour, each of which is characterized by the character-
Table 1. TBM technical Specifications.
Figure 11. Lonato TBM – EPB.
istic values of the geotechnical parameters relevant for the tunnel design. The main geotechnical parameters, at the depth of the tunnel, are summarized in Table 2.
3.2.
The undercrossing of the highway
One of the most problematic items of the Lonato tunnel design and construction is the undercrossing of the A4 highway. This paragraph focuses on the design solution adopted for this tunnel stretch.
At the south of Lonato, the tunnel underpass the highway,
with 6 lanes + 2 emergency lanes, at an angle of approximately 10° in relation to the direction of the highway, effectively extending the intersection area between the two infrastructures for a total length of approximately 500 m (Figure 17). The extradoses of the tunnel crowns are located at about 11-13 m under the highway pavement.
For the design of this stretch of the tunnel, a detailed risk analysis has been carried out taking into account the following aspects: (1) the absolute necessity to keep the highway in operation, which in this section is the busiest in Italy, espe-
Figure 12. Stratigraphic relationships scheme.
Figure 13. Geotechnical profile Lonato Tunnel.
Figure 14. Lonato Tunnel. Grain size analysis of the soils between chainage km 115-118.
cially for heavy vehicles; (2) for the operation of the highway pavement, the value of 10 mm, for the absolute settlement induced by the excavation of the tunnel, cannot be exceeded and furthermore the deflection ratio and horizontal strain, induced by the excavation, must match a category of damage 0, according to the chart proposed by Mair et al. [11]. Such stringent design criteria and the presence of extremely
heterogeneous soils, which below the highway pavement were not investigated by boreholes, led to the conclusion that the assessment of the volume losses, although for a TBMEPB are normally low, could be prone to error [12]. In conclusion, as a further precaution for the reduction of any unforeseen risk on the correct operation of the highway pavement, a ground improvement was deemed necessary to protect the
Figure 15. Lonato Tunnel. Grain size analysis of the soils between chainage km 118-120.
Figure 16. Lonato Tunnel, permeability coefficient along the tunnel.
Table 2. Main geotechnical parameters of the soils along Lonato tunnel.
highway from subsidence before the TBM was deployed. In order to study in detail the interaction between the Lonato tunnel and the A4 Turin-Trieste highway in terms of surface settlement and induced effects on the highway pavement, a three-dimensional calculation model representing the interference zone under examination has been carried. Given the complexity of the numerical model and the number of calculation phases required for the realistic simulation of the excavation, it was necessary to reduce the size of the model to a minimum (300 x 200 m) to contain the calculation times. The following three-dimensional solid modelling and finite difference calculation software has been implemented: (1) Rhino, version 6, produced by Robert McNeel & Associates (USA); (2) FLAC3D, version 6.0, produced by Itasca (USA). In the following Figure 18, the mesh of the adopted FLAC3D model constituted by 285120 triangular elements, is shown. In the Table 3 the characteristic geotechnical parameters, used in the numerical calculation model, are shown while in Figure 19, it is shown a view of the three-dimensional numerical model illustrating the stratigraphy. The pore-pressures approximately follow a hydrostatic distribution governed by a piezometric surface located at a depth of 10 m from the ground level
All the analyses were performed in effective stress and, due to the relatively high permeability of the soil, in drained conditions. For the reasons previously discussed, the analysis has taken into account the implementation of a ground improvement in the surroundings of both tunnels, which was modelled by improving the geotechnical properties of the soil around the tunnel for a thickness of 3 m. More precisely, the effect of the ground improvement was taken into account by assuming an increase of 50 kPa for the cohesion and of 50% for the deformability modulus; values which were verified on site using appropriate test fields.
The 3D numerical analyses have been carried out assuming a chamber pressure equal to 150 kPa, obtained from the results of axisymmetric analyses. On the basis of the 3D nume-
rical analysis, Figure 20 shows some representative sections of the settlement induced on the highway pavement during the tunnel excavation.
As it can be seen from Figure 20, the values of induced settlement on the highway pavement are extremely low with a maximum of approximately 8-9 mm; these values are lower than the threshold limit value defined equal to 10 mm. Some 3D numerical analyses carried out without the ground improvement around the tunnel gave maximum settlement equal to about 15 mm, thus exceeding the threshold values equal to 10 mm.
3.3. Drilling and grouting works
Taking into account the limited coverage, the sensitivity of the work and the need to maintain road traffic, the borehole placement pattern for grouting was optimized by selecting sub-vertical boreholes drilled as far above the tunnel as possible, with the aim of increasing the number of injection points per cubic meter of soil (i.e. reducing the distance between injection points). To apply this borehole layout, Autostrade S.p.A. (the company managing the A4 highway) gave permission for operating drilling and grouting from one of the highway’s emergency lanes and one of the lowspeed lanes, for a total span of 7 m. Thus, part of the holes was drilled from the highway pavement, while part of the holes was drilled from external dedicated areas (see Figures 21, 22). In addition, more effective grout mixes for soil treatment were developed, including a combination of cementbase mixes and the silicate base chemical mixture. To select the best grout hole pattern and proper grout mixes, field trial tests were performed along tunnel alignment, and post-treatment tests were carried out to evaluate the effectiveness of the proposed grouting treatment. The extreme heterogeneity of the soils required the execution of several trial tests to collect all the necessary information. In the test section, groups of grout holes were installed. Each group included five holes, located on a triangular grid. The spacing between holes in the various groups ranged between 2.2 m and 1.6 m,
Figure 17. Aerial photograph (above) and plan (below) of the interference area between the Lonato tunnel and the A4 highway. The red rectangle represents the plan extension of the three-dimensional calculation model.
Figure 18. (a) Mesh of the topographic surface of the interference area between the Lonato tunnel and the A4 highway obtained using the Rhino 6 software; (b) views of the input solid geometry used in FLAC3D. a)
corresponding to a frequency of 1 hole each for 3.8 m and 1.9 m2, respectively. The holes of each group were injected with a primary - secondary sequence, with a combination of different grouts (chemical mixes, mixes with cement and micro-cement in various dosages, etc.).
For each group of trial holes, tomographic (cross-hole) tests
were performed by drilling a couple of holes before the installation of the grout pipes, to collect data to be compared with those recorded after grouting and allowing the evaluation of the grout test results.
Upon the trial tests results, it was decided to redesign the borehole layout to obtain a maximum distance of 1.67 m (at
Table 3. Characteristic geotechnical parameters used in the numerical calculation model.
Tabella 3. Valori dei parametri geotecnici caratteristici utilizzati nelle analisi numeriche.
the hole’s foot) between the holes on the same radial pattern, with radial pattern 1.5 m regularly spaced. The same trial tests’ results led to the selection of two mixes for the grouting of the soil: Mistra mix (cement base mix) and Silacsol (a silicate base mix).
Mistra is a ternary water-bentonite-cement mix with special admixtures, characterized by low viscosity and cohesion, high stability against bleeding, and segregation under pressure. On site, the mix was prepared using Portland Cement CEM-1-52.5, with fineness Blaine equal to 5000 cm²/g.
Considering the high percentage of fine sand and silt in the soil to be treated, and the distance between the holes, the mix was prepared with a relatively low content of cement (water/cement higher than 1), as the permeability of the soil to the mixture is influenced by the quantity of solid particles in suspension in the mixture itself. After the grouting of the Mistra mix, the Silacsol was chosen to reach and fill the finest voids. Silacsol-S is obtained by mixing a silicate special solution with an inorganic reactant [13].
Most of the grout holes were drilled by a rotary system, 88.9 mm in diameter, using water as the drilling fluid. Where needed, because of hole instability, the borehole was directly
drilled by suitable casing, 114 mm in diameter. Each borehole was equipped with a polyvinyl chloride (PVC)-sleeved pipe Tube a Manchettes (TAM), with three ports per meter. The hollow annulus between the grout pipes and the ground was backfilled with a plastic sheath grout. Once this grout set and adequately aged, the grouting activity was initiated to permeate the soil around the twin tunnels. A topographic measuring system monitored that no heave or subsidence occurred during all drilling and injection operations. The grouting was performed by a double packer, port by port, starting from the lowermost one. All mixes were injected through the same pipes and the same ports. The grouting parameters were controlled and recorded by the computerized monitoring system.
As a customary practice, when grouting alluvial soil through TAM, the ‘controlled volume and pressure’ grouting criterion was applied. Namely, the grouting of each port (in each pass), was considered complete once Vmax (maximum designed volume) or P max (refusal pressure) was reached, whichever occurred first. First, the Mistra mix was injected, proceeding with a sequence of primary and secondary holes. For this mix, a maximum volume egual to 11% of the volume of soil to be treated (Vmix/Vsoil = 11%) was designed. Afterwards, Silacsol was grouted to fill the fine porosity, with the same sequence. For this mix, Vmix/Vsoil =18% was designed. The volume to be injected was defined based on the volume of soil pertaining to each hole and each valve, i.e., as function of hole spacing, taking into account the volume of voids given by the soil porosity. During the drilling and grouting activities, tests and monitoring were conducted to check borehole deviations, the grout mix characteristics, the injection parameters, and procedures. In addition, as in the field trial tests, a campaign of Seismic Cross Hole Tests was implemented, to validate the achieved results in terms of mechanical characteristics of the treated soils. The tests were performed through ten groups of holes, distributed along the tunnel alignment. For each group, four check holes were drilled in the area behind one of the tunnel piers, straddling two adjacent radial patterns (fans) of grouting holes (Figure 23). The recorded velocity of VP and VS (compression and shear waves) was used to draft the tomographic sections and estimate the elastic modulus, before and after treatment.
Figure 19. Assonometric view of the three-dimensional numerical model illustrating the stratigraphy.
Figure 20. Transverse profiles of the settlements at the end of the excavation (Stage 52 of the 3DFLAC analysis) at the intersection between the Lonato tunnel and the highway.
Figure 21. Typical boreholes patterns for soil grouting under the A4 highway.
The drilling and grouting works for the highway underpass were conducted between January 2021 and October 2021, for a total of 280 calendar days; the activity from the A4 emergency and low-speed lanes was completed in 108 days, between March and June 2021. This result allowed the TBM to start the boring within the project schedule: the first tunnel tube section under highway, for a total length of 231 m, was excavated in 60 days (between April – June 2021), for an average advance rate of 4 m/day, while the second tunnel tube section under the highway, 286 m length, was excavated in 40 days (between January - February 2023) for an average advance rate equal to 6 m/day.
3.4. EPB
tunnelling on the stretch below the highway
In the following Figures, for the odd bore that was excavated first, are given the more relevant shield operational parameters adopted on stretch below the highway.
In Figure 24, it is shown the adopted EPB earth pressure at crown, according to the target values defined from the finite element settlement calculations, in order to assure face stability and especially to achieve the required minimization of settlement, taking into account the permissible values for the highway pavement.
As part of the process control, it was also possible to record the entire mass balance including water and conditioning
Figure 22. Overview of drilling activities along the highway.
Figure 23. Typical seismic tomography results: position of testing holes (left). Elastic modulus before treatment (center). Elastic modulus after grouting (right).
materials by installation of two dynamic conveyor belt weight scales to monitor muck weight on the trailing gear conveyor versus TBM advance. Scale data was collected from a display screen in the operator’s cabin. In Figure 24, the scale data for each ring, 2 m length, are shown. As it can be seen the fairly uniform scale data indicates a regular and apparent accuracy in soil extraction of +/- 5% per day, as it will be further ahead illustrated on the basis of the very small measured surface settlements. However with reference to the Figure 25 that shows the soil density estimated from the mass control for each excavated
ring, it should be highlighted that during the design phase, on the basis of laboratory test results, the ideal density value has been underestimated. Indeed, the greatest uncertainty in all the methods is the determination of the ideal density value for the theoretical transport volumes/masses. The decisive soil parameters, like dry sensitivity, water content, pore volume and assumptions related to the process regarding the displacement of the water in the pores, the ingress of formation water, the overcut and the determination of the conditioning agent quantities, are all subject to greater variation than the measurement precision of the systems [14].
Figure 24. Support pressure at crown of the Lonato odd drive in the stretch undercrossing the A4 highway.
Figure 25. Muck conveyor belt weight scale output for Lonato odd drive.
Consequently, during the works, also on the basis of specific test fields, the values of the soil density assumed in the project phase equal to 1.91 t/m3 (for sandy silty gravels) and 1.94 t/m3 for gravels with silty sand, were increased. This increase of soil density, on the basis of the values reported in
Figure 26, is largely due to a greater quantity of boulders and rock blocks encountered during the excavation which in turn led to greater wear of the excavation tools.
To control the behaviour of the deformation process, during and after excavation by TBM, a monitoring system of nine
27. Lonato tunnel, undercrossing of the highway, topographic surface monitoring; (a) key plan of the three alignments of the microprisms along the highway; (b) key picture of the three alignments of the microprisms (blue colour for the sides and red colour for the central line between the two carriageways). a) b)
Figure 26. Estimated soil density from the mass control.
Figure
groups of benchmarks were installed along the highway for topographic measurements. More precisely, there have been installed 167 precision microprisms for topographic monitoring of movements with 3D control by means of a robotic total station and 2 robotic total stations with real-time monitoring. Figure 28 shows, for the odd bore, the evolution of the settlement and the TBM station throughout the excavation works (from 10 January 2021 to 30 June 2021). For 3 monitoring stations, chosen as representative and shown in figure 28a, the values of the settlements measured are shown in Figure 28b, respectively, for each section, in correspondence with both the emergency lane of the highway, for the North and South carriageways, and for the guardrail separating the two highway carriageways. As you can see,
these settlements are negligible, being in the order of millimetres. These values are in line with project forecasts and correspond to a volume loss between 0.10% and 0.25%, and frequently close to 0.10%.
Conclusions
The article presents a general overview of the main underground works of the Brescia Est - Verona high-speed railway line which is part of the Milan - Venice line, relating to the tunnels San Giorgio in Salici and Calcinato II, built using conventional methods, and the twin Lonato tunnel being built using a TBM – EPB with a diameter of 10.03 m. The low tunnel coverage, particularly in the sections relating to the underpasses
Figure 28. Lonato tunnel, stretch undercrossing the highway; (a) topographic monitoring stations; (b) surveyed settlement versus time and TBM station for odd drive.
a)
b)
of the A4 motorway, and the extremely heterogeneous characteristics of the glacial and fluvioglacial deposits affected by the excavations, have led to technical and technological solutions capable of minimising the subsidence induced on the surface and the effects on the highway pavement and on the numerous buildings and construction, present along the route of the railway infrastructure. On the basis of the geotechnical characterization conducted for each tunnel built in conventional way, it was possible to define the pre-confinement interventions consisting of the reinforcement of the advancement face - core using fiberglass structural elements and, depending on the case, the ground improvement using sub-horizontal from the face tunnel or sub-vertical jet grouting columns made from the ground level, or the installation of forepole umbrella consisting of steel pipes.
On the basis of these stabilization interventions, the execution phases and the advancement rates were defined for each typical section, providing in particular the maximum distances from the advancement face within which to implement the support interventions (first phase linings, casting of the invert and final lining).
In accordance with the adopted design approach (analysis of controlled deformations in rocks and soils, ADECO-RS), the reliability of the design solutions, developed in the diagnosis and therapy phases, have been verified, with regard to the deformation response of the soil to the excavation, through specific monitoring planned both in the tunnel and at ground level. For the verification phase during construction, the design project has adopted, for the tunnels built using conventional methods, a specific document called “Guidelines for the application of the cross - sections” in which, based on the expected extrusion and convergence values, the alert and alarm thresholds and the related variability criteria for the pre-confinement and support interventions have been indicated and adopted.
With regard to the Lonato tunnel, which has been built using a TBM – EPB, the final result of the design activity, preparatory to construction, has been represented by the advancement procedures, named PAT (Plan for Advance of Tunnel). These procedures represent in operational terms the design reference framework considered reliable and acceptable, defining the ranges of variation of the values within which to maintain some of the machine’s working parameters. Together with the design of the geotechnical-structural monitoring system, these advancement procedures constitute the connection and the link between the design phase and the construction phase, being a tool that is continuously updated by the designer, on the basis of the actual feedback acquired during the work. This on-site verification has lead, in the case of particular anomalies highlighted by the monitoring and control system, to the revision of the procedures and principles applied in the forecast design phase, which involved, in accordance with the observational method, repeated iterations between the design and the management
during the work. In this regard, the main machine parameters that have been kept under direct control of the designer on site have been: pressure in the excavation chamber; apparent density in the excavation chamber; thrust force; penetration rate; cutter head torque; injection line pressure behind the segments; volume of mortar injected behind the segments; volume of foam injected for conditioning; weight and volume of extracted material; advancement and ring assembly times.
References
[1] Tanzini M., Merlini D., Rutigliano R., Liani R., Anania A., Laffranchi M. (2021) – Aspetti progettuali delle principali opere in sotterraneo della tratta AV/AC Brescia Est-Verona. Gallerie e Grandi Opere Sotterranee, 137, pp. 19-33.
[2] Lunardi P. (2008) – Design and construction of tunnels: Analysis of Controlled Deformations in Rock and Soils (ADECO-RS). Berlin, Heidelberg: Springer.
[3] Lunardi P., Barla G. (2014) – Full face excavation in difficult ground. Geomechanics and Tunnelling 7, n. 5.
[4] Concilia M. (2022) – Lonato railway tunnel:mechanised excavation through from the moraines of Garda lake - The peculiarities of the selected TBM. Gallerie e Grandi Opere Sotterranee n. 143.
[5] AFTES (2003) – Recommandations du GT1: Caractérisation des massifs rocheux utile à l’étude et à la réalisation des ouvrages souterrains. Revue Tunnels & OS, n. 177, pp. 138-186.
[6] AFTES (2004) – Recommandations du GT32: Prise en compte des risques géotechniques dans les DCE. Revue Tunnels & OS, n. 185, pp. 316-327.
[7] ITA/AITES (2004) – Working Group N° 2: Guidelines for Tunneling Risk Management – Tunneling & Underground Space Technology, n. 19, pp. 217-237.
[8] AFTES (2005) – GT4R3A1 Recommendations: Choosing mechanized tunnelling techniques. L’Association Française des Tunnels et de l’Espace Souterrain, Hors Série n. 1, pp. 137-163.
[9] DAUB (2010) – Recommendations for selecting and evaluating tunnel boring machines. Deutsche Ausschuss für Unterirdisches Bauen, pp. 1- 46.
[10] Peila D., Martinelli D., Todaro C., Luciani A. (2019) –Soil conditioning in EPB shield tunnelling – An overview of laboratory tests. Geomechanics and Tunnelling 12, n. 5.
[11] Mair R.J., Taylor R.N., Burland J.B. (1996) – Prediction of ground movements and assessment of risk of building damage due to bored tunnelling. Geotechnical Aspects of Underground Construction in Soft Ground (eds R. J. Mair & R.N. Taylor), Balkema, Rotterdam, pp. 713-718.
[12] Mair R.J. (2008) – Tunnelling and geotechnics: new horizons. Géotechnique 58, n. 9, pp. 695-736.
[13] Di Salvo G., Granata R. (2022) – Grouting at Lonato tunnel. Geomechanics and Tunnelling 15, n. 5.
[14] Maidl B., Herrenknecht M., Maidl U., Wehrmeyer G. (2012) – Mechanised Shield Tunnelling, 2nd Edition, Ernst & Sohn.
Real-time monitoring and predictive analysis in San Donato tunnel project
Monitoraggio in tempo reale e analisi predittiva nel progetto del tunnel di San Donato
Luca GIACOMINI a
Andrea M AGLIOCCHETTI b
Iacopo MIGLIORI a
Andrea Z AMBON b, *
Simone LOLLI b
a Autostrade per l’Italia SpA
b Tecne Gruppo Autostrade per l’Italia SpA; Technical Authority Tunneling * corresponding author: andrea.zambon@tecneautostrade.it
Abstract
The third-lane expansion of the primary Italian highway connecting Milan to Naples, between the Florence and Incisa junctions, includes the construction of the new San Donato tunnel, which will run parallel to the existing operational highway tunnel. The 980 m long tunnel is being excavated using conventional excavation methods. It features a large cross section with a span of 17 m and a face area ranging between 190 and 220 m2. The project presents significant challenges due to the difficult ground conditions, the proximity to existing tunnels, and the presence of surface structures. To facilitate the understanding of the project’s current state, a continuously updated digital twin building information modeling (BIM) model was implemented, parallel to construction activities. This approach enables real-time monitoring of the excavation process while incorporating continuous data acquisition. The collected data are used to calibrate the geotechnical parameters required for predictive numerical deformation analyses, ensuring alignment with observed deformations and settlements. These calibrated parameters are subsequently applied to refine the design, focusing on optimizing tunnel face consolidation, determining the minimum required distance between the tunnel face and the final lining, and enhancing face stabilization measures. This innovative integration of BIM with real-time monitoring is used to optimize the construction process and sets future possible artificial intelligence applications.
Sommario
L’ampliamento a tre corsie della principale autostrada italiana A1 che collega Milano a Napoli, nel tratto compreso tra gli svincoli di Firenze e Incisa, prevede la realizzazione del nuovo tunnel di San Donato, che correrà in parallelo al tunnel autostradale esistente attualmente in esercizio. Il tunnel, lungo 980 metri, viene scavato utilizzando metodi di scavo convenzionali. Presenta una sezione trasversale considerevole, con una luce di 17 metri e una superficie del fronte compresa tra 190 e 220 m². Il progetto presenta condizioni sfidanti a causa delle difficili condizioni del terreno, della vicinanza ai tunnel esistenti e della presenza di strutture in superficie. Per facilitare la comprensione dello stato attuale del progetto, è stato implementato un modello BIM (Building Information Modeling) creando quindi un gemello digitale costantemente aggiornato, in parallelo alle attività di costruzione in situ. Questo approccio consente il monitoraggio in tempo reale del processo di scavo, integrando l’acquisizione continua dei dati.
I dati raccolti vengono utilizzati per calibrare i parametri geotecnici necessari alle analisi numeriche predittive delle deformazioni, assicurando la coerenza con le deformazioni e i cedimenti osservati. Tali parametri calibrati vengono successivamente applicati per perfezionare il progetto, con l’obiettivo di ottimizzare il consolidamento del fronte di scavo, determinare la distanza minima necessaria tra il fronte di avanzamento e il rivestimento finale, e migliorare le misure di stabilizzazione del fronte. Questa integrazione innovativa del modello BIM con il monitoraggio in tempo reale è utilizzata per ottimizzare il processo costruttivo e apre la strada a future possibili applicazioni dell’intelligenza artificiale.
Keywords: digital twin model, real-time monitoring, conventional excavation, San Donato tunnel, autostrade per l’Italia. Parole chiave: modello di gemello digitale, monitoraggio in tempo reale, scavo convenzionale, galleria di San Donato; Autostrade per l’Italia.
1. Basic principles and introduction
Tunnel deformation is a critical aspect of underground construction, shaped by the stress–strain behavior of the surrounding rock or soil [1, 2]. Three fundamental deformation metrics are typically considered: extrusion, occurring at the tunnel face; preconvergence, representing deformation ahe-
ad of the face; and convergence, involving the deformation of the cavity after the face’s passage. The rigidity of the advance core plays a crucial role in stabilizing tunnels, as it directly influences deformation control. By adjusting the mechanical properties of the advance core through techniques such as preconfinement and reinforcement, it is possible to achieve safer and more predictable tunnel behavior across varying
geological conditions [3–5]. Thanks to real-time monitoring, using the observational method [6], geological and geotechnical data, combined with deformation measurements, guide the selection of excavation and support strategies [7].
1.1. Sustainability of the design solution
The new San Donato tunnel is a key infrastructure project located along Italy’s A1 highway between Milan and Naples, designed to enhance traffic flow and safety.
In order to add a third lane to the principal infrastructure, the approach considered is to create a new tunnel as an alternative, so as not to interfere with the existing tunnels (Fig. 1) and not to disrupt the flow of traffic during construction. The excavation of the new tunnel in the variant solution includes the construction of a section to accommodate a three-lane platform plus an emergency lane (south direction). The existing tubes will both be used in the same direction (north) of travel and will be upgraded when the new tunnel is completed, with traffic diverted in each direction.
This design solution ensures that the adjacent existing tunnel remains operational throughout construction, avoiding significant disruptions to traffic flow. By preventing its closure, the need for rerouting is eliminated, which would otherwise result in an estimated increase of approximately 100 million km traveled annually. Additionally, this approach prevents around 12 million extra hours of travel time each year. The optimization of travel not only reduces CO2 emissions from vehicles but also contributes to a simultaneous increase in the country’s gross domestic product (GDP), showcasing the project’s broad economic and environmental benefits.
1.2. Description of the project
The tunnel features modern construction techniques, in-
cluding advanced excavation and drilling methods to cope with the challenging geology of the area. It also incorporates state-of-the-art safety systems to ensure the protection of both construction workers and drivers. As well as improving regional connectivity, the project will adhere to strict environmental standards to minimize the impact on the surrounding landscape. The total length of the new San Donato tunnel is 980 m, with a maximum overburden of 80 m and a minimum distance of 15 m between the new structure and the existing tunnel in operation.
1.3. Site characteristics and excavation techniques
The predominant geological formation in the area is the Sillano formation, characterized by alternating layers of scaly argillites, siltstones, and gray marly limestones. Excavation is carried out using conventional methods, managing a challenging 17 m span with a cross-sectional area of 200–220 m2. Prior to excavation, boreholes were drilled within the initial 50 m from the northern entrance and the first 10 m from the southern entrance of the new tunnel, and were filled with lean concrete, creating a continuous concrete arch around the excavation area (Fig. 2). This pretreatment ensured that excavation could proceed without impacting the existing tunnel and effectively minimized settlements in the lower overburden section. Additionally, at the southern entrance, for a length of approximately 70 m, the multiple packer sleeve pipe (MPSP) methodology will be adopted to create a consolidated layer around the tunnel, approximately 2.5–3.0 m thick (Fig. 3). The implementation of this technology involves the following steps: 1) performing dry drilling; 2) installing glass fiber-reinforced polyester resin pipes (60/40) equipped with obturator bags (sections every 3 m); 3) subsequent expansion of the obturator bags and washing of the injection barrel; and 4) executing pressure injections using double packers through the valves in the different sections delimited by the obturator bags.
Excavation advances in 1 m increments under the protection of a pipe umbrella [8]. Face stabilization measures include the installation of drainage pipes and glass fiber-reinforced polymer (GFRP) anchors [9]. For immediate support, steel tubular ribs and a fiber-reinforced shotcrete lining are applied. The final cast-in-place concrete lining is installed in phases, with the invert and crown poured separately. The distance from the excavation face to the lining installation is adjusted dynamically based on ongoing monitoring data.
2. Methodology
This section outlines the following steps required to implement the methodology for developing predictive analyses and modifying the construction process in real time to adapt the project to actual site conditions:
1. building information modeling (BIM) model creation, based on topographic surveys and design drawings;
Figure 1. North portal of the tunnel under construction with proximity of the existing tunnel in operation.
2. interoperability between models, enabling real-time data exchange between the two models (BIM and numerical);
3. development of the numerical model, using the exact geometry of the structure derived by BIM and a simplified representation of the topographic surface;
4. monitoring data and cross sections, presented in BIM model, describing the key parameters of interest and how individual data points are utilized;
5.back analysis
Additionally, a case study will be presented regarding the implementation of this methodology in the construction of the Nuova Galleria San Donato and its practical application.
2.1. Construction of the BIM model
The process begins with the creation of the BIM model based on the information contained in the design documents. At this stage, the topographic surface and preexisting structures – such as buildings, roads, and adjacent infrastructures, including the two existing tunnels of the San Donato tunnel
– are defined using topographic surveys and aerial photogrammetry.
The topographic surface is then limited to the area relevant to the construction project, considering the propagation of excavation-induced effects at ground level. Consequently, the extension of the surface is defined to be sufficiently large to allow for effective monitoring of the surrounding environment. As an example, Fig. 4 illustrates the topographic surface implemented in the BIM model of the new San Donato tunnel.
Once the geometry and spatial domain of the model have been defined, the project representation follows, strictly adhering to the provided design documents.
In addition to the geometric representation, the BIM model integrates all relevant data concerning the characteristics of materials, structural components, and construction techniques. This allows for a comprehensive and data-rich digital environment where information regarding the mechanical properties of materials, construction methodologies, and specific design details is embedded within the model itself.
Figure 2. Soil treatment from ground level at the northern portal.
At this point, an accurate digital reconstruction of the planned infrastructure is available, serving as the foundation for computational analysis.
Fig. 5 presents the BIM model, which includes the topographic surface, existing buildings, and the new tunnel to be constructed. This model serves as a flexible base that can be modified during construction, allowing for optimizations or design variations that may be defined during the execution phase.
2.2. Interoperability between models
The next step after creating the BIM model is the separate export of the represented information. Four types of georeferenced files are exported, each referenced to a chosen node:
1.new tunnel;
2.nearby underground structures;
3.aboveground structures;
4.topographic surface.
Each of these files follows a distinct workflow based on the level of detail required for the numerical model.
The newly constructed tunnel is exported as a .dxf file and remains unchanged to preserve its complete geometric and positional characteristics. However, consolidations undergo
modifications: instead of being imported as individual elements, a consolidated volume is defined. Using analytical formulations, equivalent physical and mechanical properties are assigned to this volume to simulate the presence of soil treatments and reinforcements. This approach is applied to entrance soil treatments executed from above (see Fig. 2), face stabilizations using GFRP elements – allowing the definition of an equivalent cohesion value – and perimeter soil treatments and reinforcement.
Nearby underground structures are also exported as .dxf files, and then imported into a 3D modeling software where their geometry is simplified to avoid overloading the numerical model’s mesh with details that are not critical for back analysis. For example, recesses are removed, and internal sections are homogenized. In the case of tunnels, surfaces and volumes are defined to represent the preliminary lining, steel ribs, shotcrete, finalized lining, and entrance structures. Structures at the surfaces (buildings) undergo significant simplification, retaining only their planimetric footprint and position. They are represented as planar polygons, using only their vertices as control points.
Finally, the topographic surface, originally derived from topographic surveys and aerial photogrammetry, contains a high level of detail useful in BIM but excessive for numerical modeling. To prevent the generation of an overly complex mesh that would hinder real-time analysis, the topographic surface is simplified.
This simplification is performed using software such as Dynamo, which starts with a high-resolution mesh and reduces the number of nodes while maintaining essential geometric characteristic, by means of specific algorithms. The final result depends on several variables, including computational power, the level of detail available from the survey, and the required resolution of the surface model for back analysis. Once the desired level of detail is established, Dynamo optimizes the mesh by reducing the number of nodes, ensuring that the numerical model remains computationally manageable while preserving the essential features required for simulations.
The surfaces defined in the DXF file are then converted into a finite element mesh for numerical analysis. The following image shows the simplified topographic surface obtained using Dynamo, derived from the surface depicted in Fig. 4. As illustrated – particularly in the second image – the number of nodes in the mesh is significantly reduced.
By comparing Fig. 4 and 6, one can observe the difference between the original BIM topographic surface, reconstructed from photogrammetric and topographic, and the simplified surface used in the numerical model. The latter is confined to the project’s area of interest to eliminate boundary effects caused by modeling constraints. At the same time, it prevents excessive model complexity that would otherwise require extended computational time due to unnecessary data richness.
Figure 4. Topographic surface reconstructed in BIM.
Figure 5. Complete BIM model.
2.3. Numerical model
At this stage, the numerical model is created in PLAXIS 3D for performing numerical analyses [10]. This process is structured into several phases:
1.defining the model boundaries;
2.importing the topographic surface;
3.creating the soil volume involved in the analysis;
4. importing simplified underground structures and aboveground preexisting elements;
5.importing the geometry of the new tunnel;
6. defining the material properties, including soil stratigraphy, materials used for existing structures, and materials for the new tunnel;
7.defining groundwater conditions.
The files are simplified only at the geometric level while remaining georeferenced, enabling their seamless import into the numerical model using a reference control node. This ensures a rapid and efficient exchange of information between the BIM model and the numerical model at any time, allowing for adjustments in case of modifications to the executive project.
Careful consideration must be given to the type of elements imported into PLAXIS (Fig. 7). In some cases, an intermediate step using CAD software may be required to properly define the information associated with each element, ensuring that PLAXIS correctly recognizes them.
Once this process is complete, the numerical model and the BIM model are synchronized, enabling real-time data exchange.
Another essential step is the implementation of monitoring sections and control points, where specific mesh nodes are designated to track the correlation between in situ monitoring data and numerical model results.
2.4. Monitoring data
Parallel to the development of the numerical model, the BIM model is continuously updated to incorporate ground-level monitoring stations and convergence measurements. Several monitoring systems are deployed on-site, each ope-
rated by specialized companies with their own data collection platforms. This presents a challenge for the BIM platform, as all monitoring data must be centralized within a single environment alongside the construction data.
To address this challenge, specific algorithms were developed to automate the migration of data from various systems to the common data environment (CDE) platform. For this purpose, Dynamo software was utilized, enabling API communication with the Revit authoring software via external libraries. This approach facilitated automated data access, migration, and the seamless assignment of information to geometric elements within the BIM model.
A series of three-dimensional views were created within the model to represent different monitoring instruments, each characterized by unique geometric elements in terms of shape and color (see Fig. 8). Each element (inclinometers, piezometers, total station prisms, etc.) is linked to the corresponding collected monitoring data, allowing for an intuitive and accessible visualization directly within the model.
Operators navigating the BIM model can therefore access both project documentation and real-time monitoring data, enabling an integrated information management system. Fig. 8 illustrates the generated views used for observing and analyzing monitoring data.
Once the data centralization process is completed, the processing phase begins. An algorithm was developed to correlate the monitoring data with information related to the progress of the work. This includes the distance from the excavation front, the amount and type of consolidation used, the temporal progress, the distance of the invert from the front, etc. This allowed the relationships between excavation conditions and measurement results to be visualized and understood, providing a clearer view of the impact of design choices and consolidation measures applied on the measured displacements and settlements.
Thanks to this approach, the BIM model not only serves as a document archive and operational tool but also becomes a tool for predicting and controlling the structural behavior at the excavation front. Based on the collected information,
Figure 6. Topographic surface obtained following simplification with Dynamo.
Figure 7. Creation of the numerical model in Plaxis 3D software.
useful insights can be gained to optimize future project phases, such as consolidation measures and managing the distances from the excavation front for the casting of the final lining. Ultimately, this integrated process improves the efficiency and accuracy of excavation operations while providing a comprehensive and transparent view of the ongoing operations.
2.5. Back analysis
The continuous workflow involves updating the numerical model analyses whenever site conditions change and verifying the alignment of the results with real-time data recorded on-site and integrated into the model. This dynamic approach ensures an increasingly precise correlation between the numerical model (Fig. 9) and actual site conditions as the project advances. The continuous inflow of data allows for the progressive refinement of model parameters, enhancing the accuracy of excavation and consolidation simulations.
Changes in site conditions encompass any construction activities, such as progressive soil treatment measures (e.g., VTR face reinforcements or perimeter stabilizations), excavation progress, and the installation of either temporary or permanent linings.
The next section will provide a comprehensive overview of the operations conducted during the back-analysis phase for San Donato tunnel.
3. Case history – New San Donato tunnel
3.1. San Donato tunnel BIM model
The BIM methodology plays a central role in the construction of the San Donato tunnel, facilitating seamless, real-time communication among all stakeholders involved. To implement this method, a digital geometric “twin” model of the tunnel has been developed, which evolves alongside the progress of the works, capturing the entire history of the project (see Fig. 10). The digital twin (Fig. 11) serves as a dynamic,
Figure 8. 3D view of the monitoring system in the BIM Model.
Figure 9. The numerical model implemented in PLAXIS 3D.
living archive capable of collecting and synthesizing project data, ensuring traceability and easy access to both historical and real-time information. Its user-friendly interface provides access not only to geometric models but also to all project documentation, construction records, and field data. One of the key features of the BIM system is the integration of critical site monitoring data, such as surface settlements, deformations of the existing tunnel, and convergence measurements of the excavation profile. This information plays a crucial role in optimizing the excavation process and calibrating numerical models, as will be shown in this article. To centralize the diverse monitoring data collected by various specialized companies on-site, the BIM model serves as the CDE. It consolidates both surface and subsurface monitoring data alongside construction progress information, allowing for integration from multiple platforms into a unified environment. The BIM model also provides intuitive three-dimensional visualizations of monitoring instruments such as inclinometers, piezometers, and total station prisms, each represented by distinct geometric elements, color-coded for easy identification. These visual elements are directly linked to the monitoring data, allowing operators to access real-time information and project documentation seamlessly.
Once the monitoring data are centralized, it is processed to correlate with the progress of construction activities (Fig. 12). Parameters such as distance from the excavation front, consolidation measures, and temporal progress are syste -
matically analyzed to better understand the relationships between excavation conditions and measured displacements and settlements. This analysis provides valuable insight into the impact of design decisions and stabilization measures on ground behavior.
The integrated BIM model functions not only as a documentation archive and project coordination tool but also as a vital instrument for controlling and analyzing structural behavior at the excavation front. This innovative approach enhances the efficiency and accuracy of excavation operations, offering a comprehensive overview of ongoing activities and supporting informed decision-making throughout the construction process.
3.2. San Donato tunnel numerical model
The 3D numerical model depicted in Fig. 9 was created in PLAXIS 3D for the purpose of simulating the northern entrance of the new San Donato tunnel, including both the existing tunnels and the initial sections of the new excavation. Additionally, the model incorporates simplified representations of the entrance areas and the platforms from which surface consolidations are deployed.
The stratigraphy and geotechnical properties were obtained through a site investigation campaign that included both field and laboratory tests. Tab. 1 enumerates the essential parameters necessary to define the Mohr–Coulomb constitutive model utilized in the analysis.
The model dimensions have been selected to encompass the
Figure 10. Parallel progress of construction site and BIM twin model.
Figure 11. 3D representation of the new tunnel adjacent to the existing ones: a) surface-level 3D simulation and b) soil treatment at the northern entrance.
zones of influence impacted by the tunneling activities, thereby minimizing boundary effects.
3.3. Numerical model calibration
Starting from the northern portal of the tunnel, immediately after the initial section reinforced from above, the previously described methodology was adopted in order to refine the soil parameters and better interpret the ongoing monitoring response.
The initial numerical analyses were carried out using the parameters hypothesized following the site investigation campaign conducted during the preliminary design phase (see Tab. 1). As the excavation progressed, the increasing amount of monitoring data – collected over a period exceeding 1 year – allowed for an improved calibration between the monitoring results and those obtained from the numerical model. The model has been calibrated with the objective of predicting the measured ground settlements and structural displacements. The outcomes of the 3D numerical model are evaluated in conjunction with real-time monitoring data extracted directly from the BIM model. The comparison of the model results with the observed field measurements allows for an iterative back-analysis process, whereby the strength and stiffness parameters of the rock mass can be updated.
Such a comparison is crucial for validating the predictive ca-
Table I. Initial input parameters of the numerical model (γ = specific weight; c’K = characteristic cohesion; f’K = characteristic friction angle; E’ = Young’s modulus; n’ = Poisson ratio; k0 = coefficient of earth pressure at rest).
Landslide0-5190.016.0800.30.72
SIL-230-502362.022.06500.30.62
pacity of the model and for evaluating its ability to accurately capture the deformations induced in the rock mass. The convergence measurements of the existing tunnel and the surface settlements are of great importance in evaluating the impact of the new tunnel excavation on adjacent structures and the surrounding environment.
At each stage of the excavation process, the calculated predictions are updated at regular intervals in accordance with the advancement of the tunnel face. In addition to the settlement trough evaluated along the axis of the new tunnel and the tunnel convergence, the model also captures the face extrusion, thereby providing a comprehensive understanding of the tunnel’s response to the excavation sequence. The accurate tracking of both the tunnel convergence and face extrusion is essential to ensure that the stability and integrity of both the new and existing structures are maintained throughout the excavation process. Furthermore, the monitoring of surface settlements serves to prevent any potential damage to existing structures above ground.
3.3.1. Subsidence
Fig. 5 illustrates the subsidence results obtained from numerical models compared with those derived from the topographic measurements of monitoring measurement points. The alignment under consideration is situated along the longitudinal axis of the tunnel and extends from the area outside the surface consolidation zones up to the current position of the tunnel face.
Any discrepancies between the numerical and measured data are subjected to careful analysis in order to assess the potential necessity for adjustments to the model parameters, with particular attention paid to ground stiffness and consolidation interventions. This comparison is crucial for validating the predictive capability of the model and ensuring its reliability in simulating ground behavior as the excavation progresses.
Furthermore, the evaluation considers the spatial distribu-
Figure 12. 3D view of the new San Donato tunnel, with monitoring and information sections associated with each excavation round length of 6 or 9m, depending on the specific excavation section.
13. Comparison between topographic measurements and the results of the finite element model – behaviour of a single measure point due to seasonal variations in temperature and rainfall.
tion of settlements, analyzing whether the deformations are localized or more evenly distributed along the alignment. In the event of notable discrepancies between the predicted and actual values, adjustments to the excavation strategy and consolidation measures are contemplated in the subsequent excavation phase.
The monitoring data indicated that the observed ground surface settlements are greater than those calculated along the axis of the new tunnel in the numerical model (see Fig. 5). In fact, the maximum value observed in situ reaches approximately 7 cm, whereas the numerical model predicts only 4 cm at the surface. This discrepancy may be attributed to seasonal variations in temperature and rainfall, which affect the
superficial soil layer. Such behavior has also been observed at other topographic monitoring points that are not directly influenced by the excavation. These seasonal effects illustrate the necessity of incorporating environmental factors into the interpretation of settlement data. The measurements were thus corrected to enable comparison with the numerical model, which is unable to account for these effects. Correction of monitoring values refers to the subtraction of the portion of settlement attributable to climatic variations. The estimation of this component can be derived using the trend shown in Fig. 13, by observing the recorded settlement over a fixed period in the years 2024 and 2025. This seasonal trend is evident along the entire alignment and at neighbo-
14. Comparison between topographic measurements and Gaussian longitudinal distribution – subsidence along the tunnel axis – no seasonal and temperature corrections.
Figure
Figure
Figure 15. Comparison between topographic measurements, results of the finite element mode and Gaussian longitudinal distribution – subsidence along the tunnel axis – seasonal and temperature corrections.
ring monitoring points as well.
The correction value was determined as the average of multiple representative monitoring points, leading to the conclusion that the actual visible settlement associated with seasonal fluctuations ranges between 2 and 3 cm. For calculation purposes, a conservative assumption of 2.5 cm was adopted.
Accordingly, the following graphs are presented:
Fig. 14 shows the actual recorded settlements as the maximum values reached.
Fig. 15 displays the current settlement values at the same monitoring points.
The difference between the two datasets is attributable to changes in climatic conditions.
Additionally, an analysis based on established literature formulations was conducted to obtain a longitudinal Gaussian distribution. This evaluation quantified the loss volume from the excavation between 0.75% and 1.20% [2], values that are considered consistent with standard design practice in similar excavation contexts.
3.3.2. Convergence of preliminary lining
The subsequent comparison is centered on the tunnel convergence, wherein the outcomes of the numerical model are compared with the data gathered from internal monitoring stations situated within the tunnel. The studied alignment pertains to the tunnel crown axis; however, settlements at the haunches and the sidewalls were also examined in order to provide a comprehensive assessment of deformations across the entire tunnel cross section.
This section assesses the structural stability of the tunnel during key excavation phases, utilizing convergence measurements. As previously discussed, the same model calibration is employed here to capture the observed measurements.
A comparison of the results presented in Fig. 16 with in situ data reveals that the numerically simulated convergence values are comparable. This indicated that the parameters utilized in the numerical model are sufficiently accurate for simulating the actual ground conditions. To compare between the in situ monitoring data and the numerical displacements, a postprocessing step was required to filter the convergence data obtained from the model during the simulation of each excavation step. This was required because the installation of the monitoring devices took place at a distance of at least 2 m from the actual front of the excavation.
3.3.3. Effects on the existing tunnel
This section of the analysis is dedicated to a detailed examination of particular elements of the existing San Donato tunnel lining. The numerical model predicts the displacements of the existing lining to be less than 1 mm (see Fig. 17), which closely aligns with the monitoring data. These slight movements demonstrate the efficiency of the design and consolidation measures in reducing the interaction between the new tunnel and the existing structure, particularly in the initial section where the rock partition is narrower. This comparison serves to validate the model’s capacity to simulate the behavior of the existing tunnel during the excavation of the new one. Any deviations between the predicted and the actual displacements could indicate the necessity for design modifications. Such modifications could include alterations to the consolidation zones or adjustments to the excavation sequence with the aim of further reducing interactions with the existing structure.
4. Optimization of the design
Through the calibration of this model with respect to the monitoring data, along with the geological face mapping,
ongoing borehole investigations, interpretation of DACTEST results, and the observations made during excavation phases, it became evident that the parameters adopted in the preliminary design (PE) could be refined to better capture the actual in situ behavior (see new back-analysis parameters in Tab. 2).
Once it was established that the observed improvement was not a localized phenomenon, an extensive series of analyses was carried out to identify potential solutions aimed at increasing production efficiency – expressed in terms of daily excavation progress (m/day) – while maintaining stability conditions and avoiding the risk of local detachments within the rock mass.
These analyses considered not only geotechnical behavior but also construction logistics and sequencing strategies. Among the viable solutions identified were: –delaying the installation of the final lining relative to the excavation face, allowing these operations to occur in the shadow of excavation activities and thereby enabling a continuous cycle without interruptions; – reducing the extent of preconsolidation treatments, which, in turn, shortened the duration required for each excavation stage.
Each improvement was initially introduced independently into the numerical model to assess its isolated effect. Subsequently, a step-by-step numerical simulation was conducted to evaluate the combined implementation of these measures. The model, updated with new physical–mechanical parameters, confirmed that the system response remained within alert thresholds, with no indication of instability. This entire process was guided and validated through a continuous back-analysis approach, which compared numerical predictions with real-time monitoring data. This comparison is a key element of the iterative design process, allowing for the identification and resolution of discrepancies between predicted and observed ground and tunnel behavior. Whenever the model predicted convergence displacements exceeding the expected values, corrective actions were undertaken in line with the excavation guidelines specified in the project. These included adjustments to the support systems, excavation round length, minimum face-to-lining distance, or the staging of the excavation sequence. As a result, both optimization measures were successfully implemented on-site, starting with the deferred final lining installation and followed by the reduction of preconsolidation. Monitoring data were continuously reviewed to ensure
Figure 16. Comparison between topographic measurements and the results of the finite element model – Tunnel preliminary lining convergence along the tunnel axis .
Figure 17. Horizontal displacements around the existing San Donato tunnel due to the excavation of the new tunnel.
Table II. Final back-analysis input parameters of the numerical model (γ = specific weight; c’K = characteristic cohesion; f’K = characteristic friction angle; E’ = Young’s modulus; n’ = Poisson ratio; k0 = coefficient of earth pressure at rest).
consistency with the numerical results and to promptly detect any anomalies.
A comparative analysis of production data before and after the implementation of these strategies showed a notable improvement in performance, with an average increase in excavation rates of approximately 40%, attributed to both the adopted measures and the improved quality of the rock mass. The monitoring system remains fully operational and continues to play a crucial role in validating project performance, enabling the design and construction teams to react swiftly to evolving conditions, mitigate deformation risks, and ensure the protection of surface structures and existing underground works.
Conclusions
This article presents an innovative and adaptive approach to tunnel design, emphasizing the integration of real-time monitoring data with BIM and numerical modeling to enhance safety, sustainability, and efficiency during the construction phase of the San Donato tunnel. The design solution ensures the continuous operation of the existing tunnel while the new one is being constructed, minimizing traffic disruptions, reducing CO2 emissions, and contributing to an increase in the country’s GDP.
The application of BIM throughout the project has played a crucial role in streamlining both design and construction processes. Acting as a dynamic digital twin, the BIM model provides real-time access to data, allowing monitoring results to be integrated into the design. This integration enables continuous updates to the numerical model parameters, ensuring they align with observed ground surface settlements and tunnel convergence. The seamless interoperability between Revit and PLAXIS 3D, enhanced by the computational power of Dynamo, marks a significant step forward in combining BIM with finite element method (FEM) in tunneling projects.
The integration of real-time feedback from the BIM model into numerical simulations allows for the continuous adjustment of the design, including the adaptation of the tunnel excavation method, the optimization of consolidation measures, the minimization of the distance between
the advancing tunnel face and the final lining installation, and other modifications. These optimizations not only improve the safety and efficiency of the excavation process but also ensure that tunnel construction responds effectively to local geological conditions, minimizing the impact on surrounding infrastructure and the environment. Future advancements in this approach will focus on automating the back-analysis process through a computational algorithm, refining the alignment between real-time data and monitoring results. The incorporation of additional data sources, such as face mapping, more detailed monitoring parameters, and data related to tunnels already excavated in similar contexts, will enable even more accurate predictions and optimizations for subsequent consolidation phases. This continuous refinement will further enhance the flexibility and adaptability of tunnel design, ensuring that future tunneling projects benefit from improved predictive capabilities and a more sustainable, data-driven approach to underground construction.
References
[1] Ribacchi R., Riccioni R. (1977) – Stato di sforzo e di deformazione intorno ad una galleria circolare. Gallerie e Grandi opere sotteranee, pp. 7-18.
[2] Ribacchi R. (2018) – Meccanica delle Rocce - Teoria e Applicazioni nell’Ingegneria - Lezioni dell’autore riviste e ampliate da Rotonda in: Graziani, T.; Boldini, A; Tommasi, D.; Lembo Fazio, P; Hevelius, A. [Hrsg.].
[3] Lunardi P. (2000) – Design & constructing tunnel –ADECO-RS approach. Tunnels & Tunneling International, Special supplement, May.
[4] Lunardi P. (2006) – Design and Construction of Tunnels: Analysis of Controlled Deformations in Rocks and Soils (ADECO-RS). Hoepli Publishing.
[5] Anagnostou G., Cantieni L., Ramoni M. (2010) – The importance of three-dimensional effects near the excavation face. Tunnels and Large Underground Works XXXII, No. 96 – December 2010. Bologna: Pàtron Editore, pp. 28-38.
[6] Peck R.B. (1969) – Deep excavations and tunnelling in soft ground. Proc. 7th Int. Conf. Soil Mech. and Found. Eng., Mexico City, pp. 225-290.
[7] Peila D. (1994) – A theoretical study of reinforcement influence on the stability of a tunnel face. Geotechnical and Geological Engineering, pp. 145-168.
[8] Stille H., Holmberg M., Nord G. (1989) – Support of weak rock with grouted bolts and shotcrete. International Journal of Rock Mechanics and Mining Sciences & Geomechanics Abstracts 26, n. 1, pp. 99-113.
[9] Peila D., Oreste P., Poma A. (1996) – A theoretical study of the influence of sub-horizontal fiber glass pipes on the stability of a tunnel face. North American Tunnelling, pp. 425-432.
[10] Plaxis 3D Reference Manual 2023.
Naples-Bari H-S Railway Telese-San LorenzoVitulano Section. Experiences of tunnels excavation in heterogenous geological formations
Ex Linea AV/AC Napoli-Bari, Tratta Telese-S. Lorenzo-Vitulano. Esperienze di scavo di gallerie in formazioni geologiche eterogenee
Massimo PIETRANTONI a, *
Salvatore PROTO a
Vincenzo IERARDI a
Beatrice SPINA a
Enrico TRAPASSO a
Pasquale PALDINO a
Boris PICCINI a
Antonio DI SANDRO a
a Systra S.p.A., Rome, Italy
* corresponding author: mpietrantoni@systra.com
Abstract
The Telese – San Lorenzo Maggiore – Vitulano section is part of the wider construction program for the new Naples – Bari high speed railway, which crosses southern Italy west to east and is part of the Scandinavian-Mediterranean corridor of the Trans-European Transport Network (TEN-T). This paper deals with the experiences derived from the excavation of 7 tunnels and 4 emergency adits on the Telese-Vitulano section, with an overall underground length of about 20 km, corresponding to approximately 40% of the alignment. The paper presents the design choices and construction methodologies applied on this works, with a focus on the engineering approaches on site assistance activities, based on the interpretation of survey and monitoring data as well as on the experiences gained in similar geological contexts. The quick and flexible adaptation of the standard tunnel support section types included in the design allowed to overcome critical issues during the excavation in a very heterogenous geological context with low overburden, avoiding an impact on the construction program.
Sommario
La tratta Telese – San Lorenzo Maggiore – Vitulano fa parte del più ampio programma di realizzazione della nuova linea ferroviaria ad alta velocità Napoli – Bari, che attraversa il Sud Italia da ovest a est e fa parte del corridoio scandinavo-mediterraneo della Rete Transeuropea di Trasporto (TEN-T). Il presente articolo affronta le esperienze maturate durante lo scavo di 7 gallerie e 4 finestre di emergenza sulla tratta Telese-Vitulano, che comprende una lunghezza complessiva in sotterraneo di circa 20 km, corrispondente a circa il 40% dell’intero tracciato. Vengono illustrate le scelte progettuali e le metodologie costruttive adottate, ponendo particolare attenzione alla correlazione tra gli approcci ingegneristici applicati durante lo sviluppo del progetto e le attività di assistenza in cantiere, basate sull’interpretazione dei dati di rilievo e monitoraggio nonché sulle esperienze derivate da contesti geologici simili. L’adozione di un approccio flessibile nell’adattare le sezioni di tipo di scavo previste in progetto con quanto effettivamente riscontrato in cantiere, ha permesso di superare le criticità durante lo scavo condotto in un contesto geologico-geotecnico eterogeneo e in condizioni di basse coperture, scongiurando conseguentemente il rischio di impatti importanti sul cronoprogramma lavori.
Keywords: Conventional excavation, Geotechnical complex formations, Site assistance during construction, Monitoring, Deformations and settlements, Shallow conditions, Tunnel support section types. Parole chiave: Scavo convenzionale, formazioni geotecniche complesse, assistenza durante la costruzione, monitoraggio, deformazioni e cedimenti, basse coperture, sezioni di scavo e sostegni.
1. General framework
The Telese-Vitulano section is part of the overall upgrade program of the Naples-Bari route which is going to enhance the integration of Southern Italy within the European “Scan-
dinavian-Mediterranean” transportation corridor. The main scope is to cut travel times and improve accessibility of crossed territories to long-haul, regional, and freightrail services.
When the whole route will be completed, the Naples-Bari di-
rect service (Fig. 1) will be covered in just two hours instead of the current four, and the Rome-Bari link in three hours, saving about two hours.
The total length of the section between Telese station (ch 27+700) and Vitulano station (ch 46+950) is about 19.2 km, running underground for a total length of about 6.7 km (Fig. 2), through 7 single tube double-track bored tunnels called “Tuoro S. Antuono”, “Cantone”, “Limata”, “S. Lorenzo”, “Ponte”, “Reventa” and “Le Forche”, and includes 4 emergency adits for a total length of about 1.2 km. Hence, overall, the underground sections make up approximately 40% of the alignment. Fig. 2
shows how these tunnels cut through the existing alignment to increase the radius of the curves, allowing for higher speeds. The Naples-Bari project is financed by both national and European funds, including the PNRR fund (National Recovery Plan funded by the Next Generation EU program) which is producing a speed up of construction works on the TeleseVitulano section, aiming at completing works by May 2026 and starting single track services by December 2026. This acceleration produced additional challenges for the progress of underground works, increasing the need for extremely reactive and effective design approaches.
Figure 1. Naples-Bari route with current progress of construction works.
Figure 2. Alignment of the Telese-Vitulano section.
2. Geological and geostructural context
The project is located in the southern Apennines, between the Camposauro massif to the south and the Matese massif to the north. The main structure is made up of overlying strata, which can be grouped into three main complexes: (i) Liguride units that tectonically overlays the (ii) units of the Apennine Platform that cover the units of the (iii) Lagonegrese-Molise Basin. The three complexes are covered by Neogene wedge-top basin deposits and Quaternary postorogenic soils. Due to the complex geological structure, the tunnelling works deal with several different formations.
– Terraced alluvial deposits (bn Geological Unit): these are continental quaternary deposits of alluvial type; tunnelling works mainly deal with the gravelly-conglomeratic lithofacies (bn1 Unit), with sandy-silty (bn2 Unit) and siltclayey (bn3 Unit) intercalations.
– Maddaloni Formation (MDL Geological Unit): Quaternary Lake deposits. The excavation is predominantly dealing with clayey lithofacies.
– Caiazzo Sandstones (AIZ Geological Unit): mainly sandyarenaceous marine deposits involved in “melange” processes and in tectonic contact with the “Varicoloured” clays.
–Altavilla Formation (ALT Geological Unit): these are marine deposits. The excavation involves clayey siltstone lithofacies.
–Upper “Varicoloured” clays (ALV Geological Unit): these are deep basin marine deposits, allochthonous and with a chaotic structure. Three different lithofacies are distinguished:
–ALVa Unit: Clays, silty clays and marly clays, chaotic and with a scaly structure with rare limestone intercalations.
–ALVb Unit: Chaotic and scaly clays, silty clays and marly clays alternating with limestones and marly limestones, in thin to thick layers.
– ALVc Units: Whitish crystalline limestones, massive to well stratified, with frequent intercalations of calcarenites, calcareous brecce, often with a very high degree of fracturing.
3. Tunnels cross-section and lining
A polycentric tunnel cross section is applied for both the single tube double-track tunnels and the emergency adits, with the standard internal dimensions for railway lines of up
Figure 4. Typical full-face conventional excavation sequence applied for tunnels on the Naples-Bari route.
to 200 km/h in Italy (Fig. 3) in accordance with the requirements of the network rail manager (Rete Ferroviaria Italiana – RFI).
The full-face excavation is carried out by conventional method. The excavation areas vary from 140 m2 for main tunnels to 80 m2 for emergency adits. The challenging geological conditions required the use of reinforcing elements, such as pipe roof and fiberglass bolts on the tunnel face and around its contour. Horizontal jet-grouting columns have been also applied at the most critical geological areas (such as gravel and loose soils, below water table and with shallow conditions) to achieve face stability. The temporary lining is made of steel ribs (also at tunnel invert, when required by challenging geotechnical conditions) and shotcrete. The permanent lining (crown and invert) is cast-in-situ and ensures long term stability. The full list of tunnels on the Telese-Vitulano section with their excavation progress is summarized in Table 1. To date, all the tunnels are still under construction, with 18 excavation faces working at the same time, and a progress of about 50% of the whole underground length. The tunnel cover varies from very shallow conditions up to a maximum overburden of 80 m.
4. Definition of tunnel section types for excavation and support
Depending on the geotechnical characteristics of the different formations and on the expected behaviour during excavation, many support section types (Fig. 5) were included in the design, considering the construction sequences, ground
improvement treatments and support interventions, drainages arrangement, as well as the applied excavation methodologies. The tunnel support sections types were designed according to the “ADECO-RS” method, sometimes referred to as the New Italian Tunnelling Method (NITM). The core philosophy of “ADECO-RS”, design approach developed by the Prof. Ing. Lunardi Pietro, consists in paying attention to the role of the core ahead of the face, predicting the face stability by surveying the core soil and analysing the behaviour of the core-face in terms of extrusion, pre-convergence and convergence. The behaviour is then categorized according to its stress-strain response as Category A (stable core-face); Category B (stable core-face in the short term); Category C (unstable core-face). The “ADECO-RS” method emphasizes the control of surrounding ground deformation through the reinforcement of the core ahead of the face. In case of stable core-face behaviour (category A), the tunnel stability is ensured even without any reinforcement of the core. On the other hand, category B and C indicate the need for core-reinforcement to prevent the instability of the face and of the cavity, by restoring a stable core-face condition as for category A. As a result, this method allows to excavate in full-face conditions, even in case of challenging geotechnical contexts, without partializing the excavation face. This simplifies the construction logistics as involves only one large excavation face instead of many small, staggered faces, thus allowing a higher industrialization of the construction process. What is needed is an adjustment of the core-face stabilization measures depending on the different geotechnical conditions encountered during the excavation.
Table 1. Construction progress on the tunnels of the Telese-Vitulano section.
Table 2. Tunnel support section types main characteristics.
Figure 5. Examples of tunnel support section types (A2, B1, B2 and C2p).
The main characteristics of the tunnel support section types are summarized in Tab. 2, based on the identified behaviour category, the geological context, and the support-reinforcement measures.
During the excavation progress, additional support sections and core-face support-reinforcement adjustments have been made based on the actual soil response, particularly in very shallow sections where the excavation involved complex formations such as the “Varicoloured” clays in the clayey lithofacies (ALVa).
In the spirit of the ADECO-RS approach, the most appropriate support section type was selected out after each advance step, based on the geological face mapping and on the interpretation of the data acquired through the monitoring system.
5. The importance of the monitoring system
The monitoring system has been designed to obtain, in combination with the geological face mapping all the information needed to identify the actual excavation condition in a comprehensive way and as quickly as possible. In case threshold limits are exceeded it is possible to promptly implement corrective and mitigation measures, such as adding support elements or adjusting the construction sequences or using a different support section type to minimise the risk of insta-
bility phenomena. Thanks to the monitoring system, within certain limits, it is also possible to verify the reliability of the design assumptions with the actual excavation behaviour and investigate the structural integrity of the temporary and permanent lining. The monitoring system includes the socalled “internal” and “external” monitoring instrumentation, installed inside the tunnel and at ground surface (Fig. 6). The internal monitoring instrumentation includes different sections: tunnel convergence measurement (“Type 1”, with optical targets installed immediately after each round of excavation), tunnel face deformations measurement (“Type 2”, with installation of an extrusometer to carry out displacement measurements ahead of the face), tunnel surrounding deformations (“Type 3”, which consists of multi-base extensometers, to measure incremental displacements between the head and the anchored points placed at predetermined depths from the tunnel periphery), stress-strain measurement of temporary support (“Type 4”, including strain gauges welded on the steel ribs flanges and load cells between intermediate connection plates and the base plates), inner lining state of stress (“Type 5”, through the installation of vibrating-wire strain-gauges welded on the steel rebars embedded in the concrete).
The external monitoring instrumentation, applied for the shallow tunnel conditions, consists of series of levelling
Figure 6. Underground internal monitoring sections. a) Type 1 b) Type 2 c) Type 3 d) Type 4 e) Type 5.
points driven into the ground that form a cross-section to the axis of the tunnel to evaluate the soil response in terms of settlements at ground surface.
6. Design approach during construction: the “Le Forche” tunnel case study
The underground works are historically characterized by continuous adjustments of the design solution due to the typical degree of uncertainty typical of complex geological formations, the feasibility and effectiveness of the excavation methodologies in each geological condition, the construction timing, costs-benefits evaluations related to the use of a specific excavation methodology and, in conclusion, agreement on the best technical solution defined to fit the actual conditions among all the parties involved in the construction. A typical example of the implementation of a flexible design approach is the case of “Le Forche” Tunnel (GN07) with a total length of 2164 m. The excavation is carried out in structurally complex formations (“Varicoloured” Clays and “Altavilla” Formation), with inter-and intraformational lithological contacts governed by massive tectonics phenomena, therefore characterized by high heterogeneity, complexity and unpredictable conditions. The excavation is carried out from both portals (GA16 and GA17) and from two intermediate adits (GN10 and GN11). At the time of writing this paper, excavation is ongoing from GA16 (tunnel face at Ch. 44+108) with an already excavated length of 580 m (approx. 26% of the entire stretch) and from GA17 with a total excavation of 470 m (equal to 23% of the entire stretch), as shown in Fig. 7.
The excavation faces of the two emergency adits, GN10 and GN11, are currently located at about 280 m and 50 m respectively from the junction with the main tunnel. The excavation starting from GA16 portal is described hereinafter.
As stated in par. 2, “Varicoloured” clays have been conventionally divided into three lithofacies differing by a different percentage of the clayey and calcareous component (predominantly clayey ALVa, predominantly calcareous ALVc and mixed ALVb). The Detailed Design initially included the application of the three groups of “standard” tunnel support sections types of the ADECO-RS method used in Italy (as already shown in Fig. 5) depending on the expected lithology and on the boundary conditions: “type A” sections for predominantly limestone formations (ALVc), “type B” for mixed conditions or highly fractured rock masses (ALVb/c) and “type C” for clay formations (ALVa). The distribution and application length of the standard tunnel support sections was based on a rigorous approach dependent on the prediction of the location of the contact between the different lithofacies. However, given the heterogeneous and complex geological context described so far, along with a considerable tunnel length, it is not possible to make a prediction based on a purely “deterministic approach”, even in case several boreholes are available. Since the very first tunnel advance from the portal, the excavation face immediately showed a great variability, with a continuous and sudden transitions of clay and limestone. This chaotic alternance and extreme variability was so evident after each round of excavation. At several sections the geological conditions determined by
Figure 7. Geomechanical profile of the “Le Forche” tunnel.
the face mappings, were not consistent with the design assumption. This was not due to lack or wrong geological interpretation during the previous design phase, but rather to the intrinsic variability typical of the “Varicoloured” clays. In fact, the tunnel face encountered complex geological structures with narrow “squeezed” folds, presence of calcareous components (“olistoliths”) immersed in clayey matrix, portions and shreds of stratified structures in a substantially chaotic mass (Fig. 8).
It is also evident how a strict classification of lithofacies only based on the ratio between rock and soil fraction may lead to misinterpretations of the expected excavation behaviour and, consequently, to the wrong selection of the tunnel support section type.
At the beginning of the excavation, the application of the support section type A (as anticipated in the design for ALVc formation) was initially confirmed being apparently in presence of rock masses looking at the tunnel face, but tunnel
convergences exceeded the threshold values. This phenomenon was due to the significant volume of clay involved in the excavation, which was characterized by an important clayey component, regardless from what was detected at tunnel face and of the initial design assumptions. From Ch. 43+726, the face mappings highlighted a substantial increase of the clayey component leading, initially, to a classification based on a mixed ALVc and after, from Ch. 43+749, to ALVb/c, as shown in Fig. 9. Once again, the interpretation was not consistent with the geomechanical profile where ALVc was initially foreseen and this led to apply higher support sections types, i.e. type B and C, to ensure stability conditions during the excavation. In particular, a C2v support section type was confirmed even with an apparently fair value of GSI (35÷40), proving a state of stress not in compliance with the initial design assumption. From Ch. 43+836 the rock was classified as ALVc/a thanks to a clearer distinction between the limestone portion and the clayey part of the
Figure 8. Some typical conditions of “varicolori” clays in the “Le Forche” tunnel on the GA16 portal side (first stretch of excavation).
Figure 9. Passages of lithofacies in the “Varicoloured” clays in the “Le Forche” tunnel on the GA16 portal side.
excavation face (Fig. 10). However, the C2v section type was once again confirmed even with GSI of 30÷40.
At Ch. 43+893, given the persistence of a predominantly limestone rock mass on a large part and/or on the whole tunnel face, it was decided apply section type B1. Even in prevalent presence of rock, it was decided to confirm B1 section type since the excavations had shown considerable geological complexity with sudden transition of limestone and clayey portions. The fact of not directly “seeing” clays at the excavation face (apparently also confirmed by some boreholes drilled to investigate the conditions ahead the tunnel face) did not exclude “a priori” that clayey layers could not be present in the immediate “surroundings”, therefore affecting the stress-deformation of the tunnel and leading to an excavation behaviour far to be homogeneous.
In fact, at Ch. 43+922 (Fig. 11), after a few meters of excavation, it was found a significant presence of clay and, consequently, its presence during the previously excavated stretch
was also confirmed, even though it was not directly exposed looking at the previous face mappings.
As the excavations proceeded, support section type C2v was applied again and, once reaching Ch. 43+928, it was decided to adopt section type C2p* (Fig. 11). The application of this support section allowed to achieve evident reduction of convergences, minimising the risk of reduced space to cast the permanent lining, which would otherwise require tunnel reprofiling.
In fact, the support section type C2p* (Fig. 12) includes massive ground improvements through fiberglass bolts at the face and around its contour as well as temporary steel ribs at tunnel invert to “close” the cross section as quickly as possible at a short distance from the excavation face.
The flexibility of the approach described above was the key factor for the success of the excavation, balancing the monitoring results and the constantly updated geological information.
Figure 10. Large limestone inclusions in the “Varicoloured” clays in the “Le Forche” tunnel on the GA16 portal side.
Figure 11. Variation of lithology at the face within a few meters in the “Le Forche” tunnel on the GA16 portal side.
7. Analysis of settlements induced by the tunnel excavation
Another relevant aspect which has been investigated is the analysis of the settlements at ground surface induced by the tunnel excavation in shallow conditions.
It is well-known that, during excavation, deformation arises ahead the tunnel face (in correspondence with the advance core) and evolves downstream along the tunnel as the excavation proceeds.
The deformation process can be seen as composed by extrusion of the face, pre-convergence ahead of the face and convergence behind the face, which represents the last stage of a complex 3D stress-deformation process.
Particularly in case of shallow tunnels, the excavation produces surface deformations with the formation of a settlement trough with variable extension, which depends on several factors, such as the geological and geotechnical structure, the mechanical characteristics of the soil volume involved, the initial state of stress, the topographic context, the hydraulic conditions, the type of face-reinforcement and ground improvement treatments, the installation distances of temporary and permanent linings from the excavation face, etc. These multiple variables, to be considered during the design stage, allow for a purely qualitative prediction of the deformation phenomena induced at the surface.
For this reason, sometimes, classic empirical methods allowing an estimation of the settlement trough can be still considered reliable enough, rather than perform complex FEM analyses which may bring to further variables to be inclu-
ded which become additional parameter of uncertainty, and which are time consuming, hence not compatible with onsite construction requiring almost immediate feedback. Only back analyses carried out starting from the surface settlements measured during the advance of excavation may lead to a realistic interpretation of the rock mass behaviour, having the opportunity to correlate settlements with convergences. Several simplified methods are available in literature, based on real cases and experiences, which consider few variables. The study of the soil deformation response at the surface during the excavation of the “Tuoro S. Antuono” tunnel is presented hereinafter.
Six arrays transversal to the tunnel axis were taken into account for settlement measurement (each one composed by five levelling points 5 m spacing).
The excavation mainly involved the formation of the “Varicoloured” Clays, in the clayey lithofacies (ALVa), despite, only sandy-arenaceous deposits of Miocene age relating to the Caiazzo Formation were found at tunnel face for several meters of advance.
On the analysed tunnel stretch (Fig. 13), with an overburden ranging between 13 and 16 m, the C2vp support section type was applied.
This section (Fig. 14) is composed by tunnel-face reinforcement with 100 fiberglass bolts (length = 24 m), a contour reinforcement with 117 fiberglass bolts (length = 21 m) and by a pipe-roof made by 50 steel pipes diameter Φ127 with 10 mm thick (length = 18 m). The temporary lining is made of 30 cm thick fibre-reinforced shotcrete and HEB240 steel
Figure 12. Tunnel support section C2p*.
Figure 13. Geomechanical profile of the “Tuoro S. Antuono” tunnel with surface monitoring sections.
Figure 14. Support section type C2vp. Transversal and longitudinal sections.
Table 3. Calibration of settlements curve parameters starting from monitoring data.
(*) The excavation face is currently 15m beyond section 7
ribs spaced 80 cm, including a steel rib at tunnel invert as well (which acts as a “strut” element).
The permanent lining is made of a reinforced concrete invert (100 cm thick), casted at maximum one diameter distance from the tunnel face and by a reinforced concrete at crown and sidewalls (thickness ranging from 60 to 135 cm), casted at three diameters from the excavation face.
Full face excavation has been carried out, with an advance length of approx. 1 m and with an advance field of 8.6 m to achieve enough pipe roof overlap to minimize settlements at ground surface.
Referring to some of the well-known empirical approaches (Peck 1969, Myrianthis 1974, Botti 1974, Attewell et al. 1975) assimilating the shape of the settlement trough to a Gaussian curve), it was possible to determine the parameters that best fit the real monitoring data.
The measured settlements for each monitoring section and the main estimated parameter (K factor, volume loss Vp, and the total volume loss Vs) are summarized in Tab. 2.
The estimated volume loss Vp was in the range of about 2÷3%, which are quite standard values for a conventional tunnel excavation with reinforcement at-and-around the face. Looking at the monitoring data, it can be observed that surface settlements become stable when the face crosses the monitoring section by a distance of about 1.5 times the equivalent diameter of the tunnel.
It is also relevant to note that about 70% of the total subsidence registered on the surface develops before the excavation face reaches the measurement section.
For monitoring section 6 this value reached even 80%, due to considerable water inflows intercepted during the excavation while approaching the same measurement section.
Figure 15. Graphical results of the calibration of the subsidence curve parameters.
Figure 16. Monitoring section 5: Calibration of subsidence curve parameters.
The comparison between the monitoring data and the “redefined” Gaussian curve is shown in Fig. 15.
Fig. 16 shows the Gaussian curve that best fits the vertical settlements measured at ground surface from monitoring section 5. By means of the reconstruction of the curve, it was possible to define the parameter “i” and consequently the coefficient “k”.
Due to the ground surface profile (which is not flat), it can be observed that settlements values (measurement points MO01 and MO02) were higher in the area with higher overburden. The elevation difference between MO01 and MO05 is about 1.5 m.
From the field data, values of parameter i ranging from 7.5 to 9.5 were obtained.
These values, in accordance with the literature data, are applicable for cohesive soils and an overburden condition slightly higher than the equivalent tunnel diameter and give settlements troughs of limited extension with a concentration of the maximum settlements close to the axis of the tunnel.
The value of k was obtained by a linear regression of the available data, neglecting data coming from section 4 which were assumed not representative (Fig. 17).
An average value of 0.41 was estimated which was fully in accordance with the ranges proposed in literature by various authors for excavations in clayey soils (Peck 1969, O’Reilly & New 1982, Mair & Taylor 1997).
The study also investigated the correlation between measurements at ground surface and convergences inside the tunnel. In particular, the external monitoring section 5 located at Ch. 30+230 along with the internal monitoring station instrumented at Ch. 30+232 were taken into consideration. The vertical displacements measures at the levelling points
at ground surface were compared with the displacements derived from the optical targets installed in the tunnel starting from the date of “zero reading”, therefore neglecting the settlements measured at ground surface prior to that date. The levelling points at ground surface (MO01, MO03, MO05) showed slightly higher displacements than the ones derived from the optical targets installed on the steel ribs (TM01, TM03, TM05). This difference, despite considered acceptable due to the numerous variables involved, was mainly due to the 3D effect that is generated at ground surface and, partially, also due to the distance of the monitoring system in the tunnel which was located at 2 m distance from the excavation face.
The deformations in the tunnel reached a stable trend approximately when the excavation face was about 10 m ahead the monitoring section. The stabilization of the cavity and, as a consequence, the beneficial effect on the surface settlements, was achieved by casting the permanent lining (invert first and crown later on) as close as possible to the excavation face.
Acknowledgements
The authors would like to acknowledge Rete Ferroviaria Italiana (RFI), Italferr and “Telese Consortium” composed by contractors Ghella, Itinera, Salcef and Coget Impianti. We would like also to thank the Technical Director Eng. Maurizio Ferroni, the Project Manager Eng. Daniele Pizzo and the Construction Site Manager Eng. Marco Cofone.
References
[1] Lunardi P. (2000) – Design & constructing tunnels – ADECO-RS approach. Tunnels & Tunnelling International, special supplement May 2000.
[2] Peck R.B. (1969) – Deep excavations and tunnelling in soft ground – Proc. 7th Int. Conf. on SMFE, Mexico, State of the Art Volume, pp. 225-290.
[3] O’Reilly M.P., New B.M. (1982) – Settlements above tunnels in the United Kingdom their magnitude and prediction –Proc. Tunnelling ‘82 Symp., Institution of Mining and Metallurgy (London), pp. 173-181.
[4] Myrianthis M.L. (1974) – Quelques relations phonomenologiques sur le tassement d’un terrain de faible resistance surmontant un tunnel – Ann. De l’Institut Technique du Batiment et des Travaux Publics, Mai.
[6] Botti E. (1974) – Research of a phenomenological report on the subsidence caused by the construction of a shallow tunnel in an incoherent terrain – F.Inf. n. 2 Sez. Ital. Gall. Of the A.M.S.
[7] Mair R.J., Taylor R.N. (1997) – Theme Lecture: Bored tunnelling in the urban environment – Plenary Session 4, Proc. 14th Int. Conf. on SMFE Hamburg, Vol. 4, pp. 2353-2385.
Figure 17. Calibration of k parameter based on experimental data.
Il blackout Iberico del 28 aprile 2025: analisi delle cause, degli impatti e… lezioni per il futuro
Il 28 aprile 2025, un blackout senza precedenti ha colpito la Spagna continentale, il Portogallo e piccole aree del sud-ovest della Francia, causando il collasso totale della rete elettrica iberica. Questo evento, uno dei più gravi nella storia europea recente, ha messo in luce la fragilità delle reti elettriche interconnesse, specialmente in un contesto di crescente dipendenza dalle fonti rinnovabili. Ettore Accenti, basandosi sui dati ufficiali di ENTSO-E, TERNA e altri documenti tecnici, insieme alla sua vasta esperienza come studioso d’ingegneria elettrotecnica, analizza per noi, qui di seguito, la dinamica dell’evento, le sue probabili cause, gli impatti e le implicazioni per il futuro, con interessanti considerazioni sul sistema elettrico italiano del 2024.
Cronologia del blackout Iberico del 28 aprile 2025: cosa è successo
Secondo il rapporto ufficiale di ENTSO-E del 9 maggio 2025, il blackout è iniziato alle 12:32:57 CET (Centre Europe Time), quando una serie di spegnimenti improvvisi di generatori (trips) nel sud della Spagna ha causato una perdita di 2.200 MW in appena 20 secondi. Questo ha innescato una cascata di eventi:
12:33:18–12:33:21CET: La frequenza di rete è scesa a 48,0 Hz, attivando i piani di distacco automatico del carico (load shedding) in Spagna e Portogallo.
12:33:21CET: Le linee aeree AC tra Francia e Spag-na si sono disconnesse per proteggere il sistema dalla perdita di sincronismo.
12:33:24 CET: Le linee HVDC tra Francia e Spagna hanno cessato di trasmettere energia, portando al collasso totale della rete iberica. Prima dell’incidente, la Spagna esportava energia (1.000 MW verso la Francia, 2.000 MW verso il Portogallo, 800 MW verso il Marocco) con una domanda di 25 GW soddisfatta da 32 GW di produzione, di cui oltre il 50% da fonti solari. Il prezzo dell’elettricità era leggermente negativo, indice di un’abbondanza di energia rinnovabile. Tuttavia, le oscillazioni di potenza e frequenza rilevate tra le 12:03 e le 12:21 CET suggeriscono instabilità pregresse, nonostante le misure di mitigazione adottate dai TSO (Transmission System Operators) spagnolo (REE) e francese (RTE).
Il ripristino è stato graduale: le linee internazionali dalla Francia hanno riavviato le regioni di Aragón-Cataluña e Galicia-León, mentre il Marocco ha fornito 900 MW tramite l’interconnessione Fardioua-Tarifa. In Portogallo, due risorse di black-start (una turbina a gas da 330 MW e una centrale idroelettrica da 346 MW) hanno supportato il recupero. Alle 04:00 CET del 29 aprile, il 99% della rete spagnola e il 96% di quella portoghese erano ripristinate, anche se alcune interruzioni residue hanno colpito il Ministero della Difesa spagnolo e i sistemi di comunicazione.
Impatti: danni umani, sociali ed economici
Il blackout, durato circa 10 ore nella maggior parte della penisola iberica e fino a 18 ore in alcune aree, ha avuto conseguenze devastanti: Vittime: in Spagna, 7 morti (6 in Galizia per avvelenamento da monossido di carbonio da generatori difettosi, 1 a Madrid per un incendio). In Portogallo, 1 morto (un paziente con ventilatore meccanico).
Infrastrutture: metropolitane evacuate, treni e aeroporti (Madrid-Barajas, Lisbona) paralizzati, semafori spenti, e reti telefoniche e internet collassate.
Settoresanitario: gli ospedali hanno dovuto affidarsi a generatori di emergenza, con rischi per i pazienti critici.
Impattoeconomico: stima di 1,6 miliardi di €, pari allo 0,1% del PIL spagnolo.
In Francia, le interruzioni sono state limitate a pochi minuti grazie alla rapida disconnessione dalla rete iberica, dimostrando la resilienza della rete francese, alimentata da 56 centrali nucleari.
Le cause: un puzzle ancora da risolvere
Nonostante l’indagine in corso, guidata da un panel di esperti ENTSO-E, al 9 maggio 2025 la causa esatta del blackout non è stata identificata pubblicamente. Alcune ipotesi sono state escluse preliminarmente: Cyberattacco: smentito da REE e dal premier portoghese António Costa.
Tecnologia Tecnologia
Figura 1. I due grandi blackout che spensero le reti elettriche in grandi aree mettendo nel panico milioni di persone per molte ore e creando danni immensi.
Sopra: il 9 novembre 1965, il guasto della centrale idroelettrica delle cascate del Niagara innescò il fermo di una serie di centrali e rimasero al buio New York con gran parte del Nord-Est degli Stati Uniti e parte del Canada.
Sotto: il 28 settembre 2003 un cortocircuito causato da un albero su una linea ad alta tensione in Svizzera innescò il fermo di tutte le centrali elettriche in Italia e per il ripristino dell’intera rete nazionale occorsero decine di ore con gravi danni per il paese.
Erroreumano: negato da REE. Fenomeniatmosferici: l’operatore portoghese REN aveva ipotizzato una vibrazione atmosferica, ma l’Agenzia Meteorologica Epagnola (AEMet) ha escluso anomalie climatiche.
Un’ipotesi plausibile, ma non confermata, riguarda l’altapenetrazionedi fontirinnovabili (59% di energia solare in Spagna al momento dell’incidente). L’intermittenza del solare, unita alla bassa inerzia delle fonti non sincrone, può aver contribuito all’instabilità della frequenza, come evidenziato nel documento “ParametriStabilitàReti.docx”. REE, tuttavia, nega questa correlazione.
Un’altra pista suggerisce un incendio sul monte Alaric, in Francia, che potrebbe aver danneggiato una linea ad alta tensione, ma manca una conferma ufficiale. Cinque giorni prima, un’interruzione alla raffineria Repsol di Cartagena aveva già segnalato possibili vulnerabilità nella rete.
Lezioni dai blackout storici
Per comprendere il blackout del 2025, è utile richiamare due eventi storici. Il 9 novembre 1965, un guasto alla centrale idroelettrica delle cascate del Niagara causò un blackout nel Nord-Est degli Stati Uniti e in Canada, lasciando milioni di persone al buio per 12 ore. In Italia, il 28 settembre 2003, un cortocircuito in Svizzera, aggravato da un errore di comunicazione tra i gestori, paralizzò il Paese per oltre 24 ore. Entrambi gli eventi sottolineano
Figura 2. In alto: Consumo spagnolo. Il 28 aprile 2025 alle ore 12:33 si è verificato in 15 secondi il crollo dell’energia in rete equivalente al fermo di un numero di centrali elettriche della potenza installata totale pari a 15 GW, pari al 60% della domanda elettrica nazionale spagnola. L’entità dell’energia mancante era ampiamente inferiore alle disponibilità spagnole per pronto intervento e non era prevista come possibile fornitura dalla Francia a cui la Spagna era collegata (al momento del black-out) come fornitrice verso la Francia, ciò ha avuto come conseguenza il black-out di tutta la rete.
In basso: Scambi tra Spagna e Francia. Grazie alla possibilità di trasformarsi da Fornitore a Consumatore, la Spagna ha potuto disporre di energia per ristabilire la propria rete in una decina di ore. Senza quella disponibilità dalla rete europea la Spagna non avrebbe potuto riattivare la sua rete nazionale.
come un singolo guasto possa innescare un effetto domino in reti interconnesse.
Questi precedenti evidenziano l’importanza di tre elementi: riservaoperativa (5-10% della domanda massima), stabilitàdifrequenzaetensione, capacitàdiinterconnessione. Nel caso iberico, la perdita di 2.200 MW ha superato la capacità di risposta immediata, portando al collasso.
Ilcontestoitaliano(dati Terna 2024)
Per contestualizzare l’evento, è utile analizzare il sistema elettrico italiano nel 2024, come riportato da Terna. L’Italia ha consumato 312,3 TWh di energia elettrica, con un picco di domanda di 57,5 GW il 18 luglio. La produzione netta è stata di 264 TWh, con una dipendenza dall’estero del 16,3% (50,9 TWh importati netti). Le fonti rinnovabili hanno coperto il 34,46% del consumo elettrico così ripartite:
Idroelettrica: 52,1 TWh (16,7%).
Fotovoltaica: 36,1 TWh (11,56%).
Eolica: 19,35 TWh (6,2%).
Rispetto all’energia primaria (1570 TWh), solare ed eolico rappresentano rispettivamente il 5,8% e il 3,1%, per un totale dell’8,8%. La potenza installata di rinnovabili è cresciuta del 41,2%, raggiungendo 76,6 GW (37,1 GW solari, 13 GW eolici).
Nonostante il progresso, l’Italia dipende ancora significativamente dalle
importazioni e da fonti tradizionali. L’alta penetrazione di rinnovabili, come in Spagna, richiede sistemi di accumulo, inverter avanzati e smart grid per garantire stabilità, come indicato dai documenti ufficiali sulla sicurezza delle reti. L’Italia, con una capacità di interconnessione inferiore al target europeo del 15% per il 2030, potrebbe affrontare rischi simili in caso di guasti improvvisi.
Sfide e soluzioni per il futuro
Il blackout del 2025 sottolinea diverse vulnerabilità delle reti moderne: Integrazionedelleenergierinnovabili: l’intermittenza di solare ed eolico richiede sistemi di accumulo, previsioni meteorologiche accurate e inverter avanzati per stabilizzare tensione e frequenza. Resilienzadelleinfrastrutture: linee di trasmissione alternative, ispezioni regolari e relè di protezione sono essenziali per evitare effetti domino. Smart grid eintelligenzaartificiale: sensori, algoritmi e software di controllo possono ottimizzare la gestione della rete e prevedere guasti. Interconnessionitransfrontaliere: il coordinamento tra TSO, supervisionato da ENTSO-E, è cruciale per mitigare squilibri.
Sicurezzainformatica: sebbene escluso nel caso iberico, la protezione contro attacchi cibernetici resta una priorità.
Il premier spagnolo Pedro Sánchez ha annunciato una commissione d’inchiesta, mentre il Portogallo ha dichiarato lo stato d’emergenza energetica. Questi passi riflettono la necessità di una risposta coordinata a livello europeo.
Conclusioni
Il blackout del 28 aprile 2025 in Spagna e Portogallo rappresenta un monito per l’Europa: anche le reti più avanzate non sono immuni da collassi. La
transizione verso le energie rinnovabili, pur essenziale, richiede investimenti in tecnologie e infrastrutture per garantire stabilità. L’Italia, con una dipendenza dalle importazioni e una crescente penetrazione di rinnovabili, deve trarre insegnamento da questo evento, rafforzando le interconnessioni, le smart grid e i protocolli di emergenza.
La sfida del futuro sarà bilanciare innovazione e resilienza, integrando l’intelligenza artificiale e le reti intelligenti con una pianificazione che tenga conto delle complessità del sistema energetico globale. Solo così potremo prevenire crisi come quella iberica e costruire un futuro energetico più sicuro e sostenibile.
EttoreAccenti
http://ettoreaccenti.blogspot.ch/
Sitografia
Electrifyng Europe (Entso-e, ensuring pan-European security). https://www.entsoe.eu/
Panel investigation into the Iberian blackout (Entso-e). https://bit.ly/4jOq0el
Expert panel to investigate blackout (Acer). https://bit.ly/4dc6d66 About the Iberian Peninsula’s blackout (Eureelectric). https://bit.ly/3YD2PLF
Warning signs hinted at Spain’s blackout (Reuters). https://bit.ly/4j53fBP Power begins to return after blackout (Reuters). https://bit.ly/3S31IRQ Measures to prevent another blackout (BBC). https://bit.ly/3Z4IoaP Spain declares state of emergency (Reuters). https://bit.ly/4me9VjJ Understanding April 2025 blackout. https://bit.ly/4jUGkKP
Mercato dell’energia e sue implicazioni nell’equilibrio delle reti europee
Il mercato dell’energia elettrica europeo, organizzato in “mercati day-ahead”, infragiornaliero, di bilanciamento e a lungo termine, regola la produzione, lo scambio e la distribuzione attraverso borse come EPEX SPOT e Nord Pool, sfruttando interconnessioni che in Europa nel 2025 valgono 200 GW. I fornitori come Terna, Red Eléctrica e altre ottimizzano le risorse e incentivano flessibilità ma affrontano sfide per la volatilità dei prezzi con priorità al profitto. Il blackout spagnolo del 28 aprile 2025, causato da una quota del 60% di solare a fronte di riserve limitate evidenzia come interconnessioni deboli abbiano impedito importazioni rapide dalla Francia.
Durante la crisi del gas del 2022, in Italia i prezzi day-ahead hanno raggiunto 300 €/MWh spingendo alcuni produttori a ridurre l’offerta per massimizzare i profitti, causando squilibri temporanei nella rete gestita da Terna.
Nel 2023, la Danimarca ha esportato 5 GW di energia eolica verso la Germania tramite il cavo NordLink, stabilizzando la rete tedesca durante una loro bassa produzione eolica/solare. Il Regno Unito, con il suo “capacitymarket” ha garantito 10 GW di riserva con centrali a gas e batterie nel 2024, evitando un blackout durante i picchi di domanda invernali
Nel blackout del 2025, le previsioni inaccurate in Spagna hanno sottostimato la produzione reale causando un deficit di 3 GW non compensato dal mercato infragiornaliero, aggravato dalla mancanza di loro riserve flessibili come centrali a gas o batterie.
Gli operatori transfrontalieri operano in un mercato dove i costi dell’energia variano continuamente in tempi brevi e con programmazioni a lungo termine difficili da programmare.
La stabilità delle reti richiede scelte che bilancino redditività e resilienza, rafforzamento delle interconnessioni e previsioni accurate, senza le quali la volatilità dei prezzi e la dipendenza da fonti variabili spingono gli operatori a favorire le condizioni di mercato più convenienti aumentando il rischio come dimostrato dal blackout spagnolo.
FIBROrinforziamo conciprefabbricati
Giornale dei lavori – giugno 2025
Ecco gli ultimi aggiornamenti dai cantieri di TELT, BBT e ITALFERR & RFI
Tunnel di base del Moncenisio
Superato un quarto di gallerie scavate sui 164 km totali da realizzare per la sezione transfrontaliera della nuova linea ferroviaria Torino-Lione. A giugno 2025 l’avanzamento ha raggiunto i 43 km di gallerie realizzate di cui oltre 17,5 km di tunnel di base. L’approfondimento di questo numero è dedicato ai rivestimenti definitivi delle gallerie già realizzate.
– Saint-Jean-de-Maurienne: SNCF Réseau prosegue i grandi lavori per l’interconnessione ferroviaria nella Piana di Saint-Jean-de-Maurienne dove sorgerà anche la nuova stazione internazionale: le linee guida del progetto sono state presentate l’8 aprile durante un incontro pubblico. Concepita per integrare i vari modi di trasporto, prevede anche una vegetazione integrata e un comfort termico naturale. L’avvio della costruzione è previsto per il 2027, con una prima messa in servizio sulla linea storica nel 2030 per essere poi pienamente operativa con l’entrata in servizio del tunnel di base nel 2033.
– Saint-Julien-Montdenis: prosegue lo scavo con esplosivo sui due fronti dall’imbocco ovest del Tunnel di base, mentre in parallelo è iniziato il getto dell’arco rovescio sulla canna pari, mentre dalla canna dispari si sta scavando l’ottavo ramo di comunicazione.
– Saint-Martin-la-Porte/LaPraz: procede lo scavo sui diversi fronti sia
di tratti di tunnel di base, sia delle caverne tecniche e logistiche necessarie allo scavo, sia di rami di comunicazione per un totale di 143 scavati durante il mese di maggio. Terminato il ribasso dello strozzo della camera di lancio, è iniziata la traslazione dello scudo della TBM Viviana verso l’intersezione tra la caverna tecnica e la canna dispari del tunnel di base. – Villarodin-Bourget/ModaneeAvrieux: iniziate dalla camera di base le operazioni di impermeabilizzazione, armatura e rivestimento definitivo di uno dei quattro pozzi di ventilazione del tunnel di base. Prosegue intanto il rivestimento di prima fase dell’ultimo pozzo con la tecnica del sarcophage
– Chiomonte: dopo il completamento della rampa di uscita verso Torino, sono terminate anche le operazioni di varo dei conci degli impalcati anche sulle ultime due campate della rampa di entrata del nuovo svincolo autostradale di Chiomonte sulla A32 Torino-Bardonecchia, che servirà alla movimentazione dei mezzi del cantiere del tunnel di base, evitando di impattare sulla viabilità locale.
– Salbertrand: in corso la predisposizione dell’area dove verrà costruita la fabbrica dei conci e il sito per la valorizzazione del materiale di scavo proveniente dai lavori del tunnel di base lato Italia.
Figura 1. Mappa dei cantieri d’attacco per i lavori del tunnel di base.
Dai cantieri Dai cantieri
L’approfondimento
Irivestimentidefinitivi
Una volta avviata e ben consolidata l’attività di scavo delle gallerie dall’imbocco ovest in Francia (i fronti d’avanzamento sono ormai dentro la montagna di oltre 2 km), il cantiere si è organizzato ed ha lanciato le attività legate al ri-
La Galleria di Base del Brennero
vestimento definitivo del tunnel di base del Moncenisio, che completa la fase di genio civile in attesa dell’ingresso del treno lavori che attrezzerà il tunnel. Nell’estate 2024, una volta approvati i progetti esecutivi, dei modelli a grandezza naturale del futuro rivestimento definitivo del cantiere di Saint-Julien-Montdenis sono stati positivamente sottoposti ad un test di resistenza al fuoco nel forno Vulcain del laboratorio del CSTB - Centre Scientifique et Technique du Bâtiment à Marne-la-Vallée, simulando una temperatura estrema di 1350°C.
Successivamente, lo scorso mese di febbraio, è stata collaudata in Slovenia la prima delle due attrezzature costruite su misura per impermeabilizzare full-round, armare e gettare l’arco rovescio del Tunnel di base. Dopo lo smontaggio ed il trasporto in cantiere, è stata rimontata sulla piattaforma e traslata in galleria il mese successivo, dove ha già realizzato i primi 142 metri sulla canna pari.
In contemporanea, sono arrivati in cantiere i primi elementi del primo cassero di calotta, di cui è immediatamente iniziato il montaggio, qui imbiancato dalla nevicata eccezionale del 17 aprile, che ha ricoperto tutta la valle della Maurienne
Anche sul cantiere di Avrieux, dopo il completamento dello scavo e del sostegno provvisorio, è iniziata l’ultima fase che comprende le operazioni di impermeabilizzazione, armatura e getto del rivestimento definitivo del primo pozzo di oltre 500 m di altezza, con uno spessore finale di 25 cm, questa volta dal basso verso l’alto a partire dalla camera di base al piede della discenderia di Villarodin-Bourget/Modane.
a cura di TELT
Figura 2. L’attrezzatura per il rivestimento definitivo nel tunnel a Saint-Julien-Montdenis.
Figura 1. Stato di avanzamento lavori a tutto maggio 2025.
La Galleria di Base del Brennero (Brenner Basis Tunnel – BBT), attualmente in una fase avanzata di realizzazione, costituisce un’infrastruttura chiave del tratto di corridoio ferroviario transeuropeo Scandinavo-Mediterraneo (SCAN-MED) che collega Monaco di Baviera a Verona. L’intero complesso di tunnel che costituisce il BBT si estende per poco meno di 230 chilometri di cui, alla fine di maggio, risultavano già scavati oltre 198 chilometri. Il sistema è composto da un’articolata rete di opere sotterranee che, oltre alle gallerie di linea destinate al passaggio dei treni e alle relative interconnessioni con la rete ferroviaria esistente, include il cunicolo esplorativo, le finestre di accesso, i cunicoli trasversali lungo le gallerie di linea, quelli relativi alle fermate di emergenza e numerose altre gallerie con funzioni logistiche e operative. Per la realizzazione della Galleria di Base del Brennero è stata necessaria l’attivazione di sette lotti di costruzione principali, quattro dei quali risultano già conclusi mentre i tre di seguito descritti sono al momento operativi, due in Austria e uno in Italia. Il lotto costruttivo “H41 Gola del Sill – Pfons”, realizza il collegamento tra la Gola del Sill e la località di “Pfons” ed è stato affidato all’ATI “H41 Sillschlucht-Pfons”, composta dalle società Implenia Österreich GmbH, Implenia Schweiz AG, Webuild S.p.A., CSC costruzioni SA, per un importo pari a 651 milioni di euro. I lavori iniziati nel gennaio 2022 si concluderanno nell’estate del 2028. Alla fine di maggio 2025 è stato raggiunto un avanzamento pari a oltre i’89% dei circa 26 km di scavi previsti. È stato completato il 93% circa dei 9,5 km di scavi da realizzarsi con metodo tradizionale. A seguito dell’abbattimento dei rispettivi diaframmi, avvenuti in data 17/09/2024 per la galleria Est e in data 20/05/2025 per la galleria Ovest, entrambe risultano collegate al confinante lotto H21. Per quanto riguarda lo scavo in direzione sud con metodo meccanizzato, le frese a singolo scudo “Lilia” e “Ida” hanno raggiunto un avanzamento di oltre il 86% circa dei 16,5 km previsti. Il lotto costruttivo “H53 Pfons – Brennero”, riguarda il tratto tra la località “Pfons” e il confine del Brennero. Esso rappresenta il più grande lotto costruttivo in territorio austriaco ed è stato affidato al raggruppamento composto da Porr Bau GmbH, Marti GmbH Austria e Marti Tunnel AG Svizzera per un importo contrattuale pari a 959 milioni di euro. La durata dei lavori per questa sezione del progetto è stimata in 70,5 mesi. I lavori sono stati avviati nel maggio 2023 e alla fine di maggio 2025, è stato raggiunto un avanzamento pari a circa 39% dei circa 28,5 km di scavi previsti. È stato completato circa il 56% dei 13,4 km di scavi da realizzarsi con metodo tradizionale mentre, per quanto riguarda lo scavo con metodo meccanizzato, le frese a doppio scudo “Olga” e “Wilma”, avviate in data 18/09/2024, hanno completato lo scavo di circa il 24% dei circa 7,5 km di gallerie previsti per ciascuna canna in direzione nord, fino al futuro collegamento con l’adiacente lotto H41. Sul lato italiano, nel tratto compreso tra il confine di Stato e lotto più meridionale H71, concluso nel dicembre 2023, proseguono le lavorazioni del lotto costruttivo “H61 Mules 2-3”, affidato alla società consortile BTC S.c.r.l, composta da Webuild S.p.A., Ghella S.p.A., Cogeis S.p.A. e PAC S.p.A. Con un importo contrattuale pari a 993 milioni di euro, questo lotto rappresenta il più grande lotto costruttivo di tutto il BBT. I lavori sono stati avviati nel settembre 2016 e, alla fine di maggio 2025, è stato raggiunto un avanzamento complessivo degli scavi di oltre il 99% dei circa 64,9 km da scavare. Attualmente proseguono le attività di scavo con metodo tradizionale dei cunicoli tecnologici trasversali e dei pozzi, mentre, per quanto riguarda la realizzazione dei rivestimenti definitivi in calcestruzzo proseguono i getti nei cunicoli tecnologici trasversali e nel cunicolo esplorativo mentre sono terminati rispettivamente il 09/05/2025 e il 07/05/2025 quelli nella fermata di emergenza di Trens nella relativa galleria di accesso. Il presente articolo è dedicato al completamento degli scavi meccanizzati del BBT nel tratto italiano. Dopo la fresa TMB “1054-Serena”, impiegata nello scavo del cunicolo esplorativo, e la fresa TBM “1072-Virginia”, utilizzata per lo scavo della galleria di linea Est — che hanno raggiunto il Brennero rispettivamente nel novembre 2021 e nel marzo 2023 — anche la fresa TBM “1071-Flavia” ha raggiunto, il 2 maggio 2025, il confine di Stato italo-au-
striaco. Con la posa dell’ultimo anello n. 8142 e dopo aver percorso 14,3 km, si è così concluso lo scavo della galleria di linea Ovest su territorio italiano. La cerimonia ufficiale di fine dello scavo meccanizzato si è svolta in data 15/05/2025 all’interno della galleria centrale della Fermata di Emergenza di Trens, alla presenza degli Amministratori di BBT SE Gilberto Cardola e Martin Gradnitzer e con la partecipazione di autorevoli rappresentanti delle società ÖBB ed RFI, degli enti locali e del membro della Commissione Europea Herald Ruijters, già Deputy Director-General DG MOVE Mobility and Transport, il quale ha sottolineato come il BBT rappresenti un passo fondamentale verso una mobilità sostenibile e un modello di cooperazione transfrontaliera in Europa.
La TBM “Flavia” il cui scavo ha avuto inizio nel mese di aprile 2019, ha completato lo scavo di un tratto della galleria di linea Ovest (binario pari), avanzando per circa 14.250 m in direzione Nord, dal camerone di montaggio fino al confine di Stato, dove si attesta il fronte in attesa di essere raggiunto dallo scavo del lotto adiacente H53 “Pfons–Brenner”, attualmente in avanzamento verso Sud mediante metodo convenzionale.
La TBM “Flavia”, al pari delle altre frese impiegate nel lotto costruttivo “H61 – Mules 2-3”, è stata appositamente progettata e realizzata per conto dell’impresa esecutrice BTC S.c.r.l. dalla ditta Herrenknecht AG, presso lo stabilimento di Schwanau (Germania). Si tratta di una fresa a doppio scudo, la soluzione tecnicamente più avanzata tra le frese a piena sezione per lo scavo di gallerie in roccia. Questa tipologia di macchina integra in un’unica configurazione i principi operativi sia delle TBM aperte (Gripper TBM) sia delle TBM a scudo singolo (Single Shield TBM), risultando particolarmente adatta allo scavo di gallerie in roccia dura su lunghezze estese.
Figura 2. Cerimonia di fine scavo della fresa TBM Flavia all’interno della Fermata di Emergenza di Trens.
Figura 3. Vista della TMB assemblata presso lo stabilimento Herrenknecht AG di Schwanau (Germania).
Dai cantieri Dai cantieri
Di seguito si riportano i dati tecnici principali della TBM:
–Diametro della testa fresante (area di scavo): 10.710 mm (90,1 m2)
–Peso complessivo della TBM (incl. main drive): 2750 t
–Lunghezza dello scudo: 11.350 mm
–Lunghezza totale (TBM incl. main drive): circa 200 m
–Potenza totale installata: 4.200 kW
La testa fresante è composta da 5 elementi dotati di utensili da taglio (cutter) costituti da dischi da 19 pollici; in dettaglio sono presenti n. 4 cutter centrali a doppio disco, n. 46 face cutters, 10 gouge cutters sul contorno e 10 bocche di carico. Si riportano di seguito le caratteristiche tecniche principali della testa fresante:
–Diametro di scavo con cutter nuovi (usati): 10.710 mm (10.680mm)
–Azionamento: n. 12 motori elettrici
–Potenza motrice complessiva: 4.200kW
–Velocità di rotazione: 0÷5,5 rpm
–Coppia nominale: 13.600 ÷ 27.524 kNm
–Coppia di spunto: 15.112÷30.636 kNm
I pistoni principali garantiscono una spinta massima pari a 110.000 kN ca. mentre i pistoni ausiliari garantiscono una spinta massima pari a 150.000 kN. Dal punto di vista geologico geomeccanico lo scavo si è sviluppato nel tratto a Nord del Lineamento Periadriatico, attraversando i paragneiss e micascisti del Basamento Cristallino Antico, gli scisti del Complesso della Falda del Glockner e gli gneiss del Complesso della Falda del Venediger, tutti appartenenti alla Finestra dei Tauri, con coperture fino ad oltre 1700 m. In alcuni tratti si sono registrate condizioni particolarmente severe dovute all’attraversamento di zone di faglia caratterizzate dalla presenza di ammassi rocciosi tettonizzati altamente spingenti. In queste zone per garantire l’avanzamento della TBM si è reso necessario eseguire interventi a tergo degli scudi, mediante l’impiego di idrodemolizione e volate con microcariche. Allo scopo di monitorare l’avanzamento della TBM in funzione delle condizioni dell’ammasso roccioso al contorno, durante lo scavo sono stati rilevati in continuo i parametri medi di funzionamento della macchina e in particolare: –velocità di rotazione della testa [rpm] –spinta dei cilindri principali ed ausiliari [MN] –coppia di rotazione della testa fresante [MNm] –velocità di avanzamento [mm/m] –penetrazione [mm/rot] –energia specifica [MJ/m3] –peso smarino [t]
Tutto il materiale di risulta degli scavi è stato allontanato esclusivamente
mediante nastri trasportatori ed è stato conferito presso i depositi di Hinterrigger e di Genauen.
Il rivestimento messo in opera dalla TMB durante l’avanzamento è costituito da anelli composti da conci di calcestruzzo armato prefabbricato che presentano le seguenti caratteristiche principali:
–Diametro esterno anello: 10.170 mm
–Diametro interno anello: 9.270 mm (spessore: 45 cm)
–Lunghezza dell’anello: 1.750 mm
–Tipo di concio/schema di posa dei conci: universale/ 6+1
–Peso dell’anello completo: 59.0 t ca.
–Classe di resistenza del calcestruzzo: C50/60
La messa in opera dei conci è stata possibile mediante un erettore in grado di sollevare i conci mediante un sistema di presa vacuum, mentre il riempimento del gap anulare tra l’estradosso dei conci e l’ammasso roccioso è stato realizzato mediante malta a presa rapida, per il concio inferiore e mediante pea-gravel sulla restante porzione del contorno.
La produzione degli oltre 32.500 conci necessari per il rivestimento della galleria scavata dalla TBM “Flavia” è avvenuta presso lo stabilimento situato nell’area di cantiere di Hinterrigger, riutilizzando fino al 30% del materiale di scavo. Il trasporto dei conci, insieme all’approvvigionamento degli altri materiali necessari per l’avanzamento della fresa, è stato effettuato su rotaia tramite treni di servizio dedicati direttamente dallo stabilimento di produzione conci, riducendo al minimo l’impatto ambientale e le interferenze con la popolazione residente nell’area di progetto.
a cura di BBT
Figura 4. Modello BIM del rivestimento in conci delle gallerie di Linea.
Figure 5 e 6. Arrivo del treno di servizio in corrispondenza del back-up della TBM (sopra); operazioni di posa del concio di base all’interno del back-up (sotto).
Linea Ferroviaria A.V./A.C. Napoli-Bari
Da agosto 2022 risultano in fase realizzativa tutti i cantieri della nuova linea ferroviaria Napoli-Bari.
Facendo riferimento a quanto già pubblicato nelle precedenti puntate di questa rubrica, qui di seguito si riporta un aggiornamento sullo stato di avanzamento delle principali opere in sotterraneo presenti nei vari lotti:
Napoli-Cancello
Galleria artificiale Casalnuovo (2,3 km)
A maggio 2025 è stato completato lo scavo in condizioni iperbariche sotto falda avviato a maggio 2024, sia per quanto riguarda il fornice dedicato alla linea ferroviaria NA-BA di RFI, sia per quanto concerne quello dedicato alla ferrovia circumvesuviana di EAV. A giugno 2025 risultano in via di completamento le strutture interne.
Intanto, nel tratto di galleria fuori falda, continuano le attività di scavo, impermeabilizzazione e realizzazione delle fodere interne in condizioni nor-
mobariche. Per accelerare i lavori, tale attività sarà estesa anche a un breve tratto inizialmente previsto in condizioni iperbariche, grazie alla realizzazione di 32 pozzi di emungimento che consentiranno l’abbassamento locale e provvisorio della falda.
Contestualmente, sono in via di ultimazione le strutture interne della fermata sotterranea Casalnuovo (Figura 2).
Infine, nel tratto in sottoattraversamento dell’autostrada A16, è stato completato lo scavo ed è stata avviata la realizzazione delle strutture interne (Figura 3).
Cancello–FrassoTelesino
Galleria naturale Monte Aglio (4 km) a singola canna e doppio binario. Lo scavo, con metodo tradizionale, fu avviato a dicembre 2019 e completato a giugno 2022.
A giugno 2025 i lavori risultano pressoché ultimati. Sono in corso di completamento le ultime attività relative agli impianti di segnalamento, il completamento della posa dei dispositivi di manovra dei deviatoi, ed il posizionamento di alcuni cartelli ferroviari. (Figura 3)
L’attivazione della tratta ferroviaria in esame è prevista per il 4° trim. 2025.
FrassoTelesino–Telese
Galleria artificiale Telese (2,8 km) scavata con metodo top-down per minimizzare la durata delle soggezioni lungo le viabilità esistenti interferenti. Vista la lunghezza, sono previste due uscite di sicurezza intermedie. Ad aprile 2025 è stato completato lo scavo a foro cieco – al di sotto del so-
Figura 2. Galleria artificiale Casalnuovo: completamento scavo di sottoattraversamento dell’autostrada A16.
Figura 3. Galleria Monte Aglio: ultimazione impianti di segnalamento.
Figura 4. Galleria artificiale Telese: abbattimento dell’ultimo diaframma.
Dai cantieri Dai cantieri
lettone superiore – dell’intera galleria, con la relativa cerimonia di abbattimento dell’ultimo diaframma (Figura 5). Sono in via di completamento l’ultimo tratto di solettone inferiore e le fodere laterali interne.
Telese – S. Lorenzo – Vitulano
In questa tratta è prevista la realizzazione di 7 gallerie, tutte a singola canna (doppio binario) ed in scavo tradizionale: Tuoro S. Antuono (1,6 km), Cantone (1,0 km), Limata (0,35 km), S. Lorenzo (1,7 km), Ponte (0,45 km), Reventa (0,2 km), Le Forche (2,2 km). Sono inoltre previste altre 4 gallerie (sempre con scavo tradizionale) per realizzare le uscite/accessi intermedi di emergenza, che svolgono in alcuni casi anche il ruolo di finestre costruttive. Ad aprile 2025 è stato completato lo scavo della galleria Reventa (Figura 6).
A giugno 2025, dei 7,9 km totali di gallerie, risultano scavati più di 5km (circa il 65%) attraversando in prevalenza, con coperture medio-basse, depositi alluvionali terrazzati (costituiti da sabbie e ghiaie a luoghi cementate) e formazioni argillose quali le Argille Varicolori Superiori. A breve è previsto il completamento dello scavo della galleria Limata e, nel 3° trimestre 2025, anche quello della galleria Ponte. Tra le principali sfide in corso si segnala che lo scavo della galleria Tuoro S. Antuono sta sottoattraversando la Strada Statale Telesina con soli 7 m di copertura, mentre la galleria S. Lorenzo sta sottoattraversando il torrente Ianare.
Apice – Hirpinia
Gallerie Rocchetta (6,5 km), Melito (4,4 km), e Grottaminarda (2 km), tutte a singola canna a doppio binario con scavo meccanizzato (2 TBM).
A giugno 2025, prosegue lo scavo della galleria Rocchetta (Figura 6) ad opera della seconda TBM, denominata Futura, che sta facendo registrare delle buone performance.
In particolare, nel mese di maggio 2025 si è registrato un avanzamento mensile record di 582 m, portando lo scavo verso il superamento dei primi 2500 m.
La presenza del battente idraulico che sta aumentando progressivamente, ed il cambio di formazione geologica riscontrato a circa 2 km dall’imbocco, non hanno interferito con la continuità dell’avanzamento.
Hirpinia – Orsara
La galleria Hirpina (27 km a doppia canna) si contenderà con la galleria di Valico a Genova il primato di galleria più lunga d’Italia.
A giugno 2025 procede – a partire dall’imbocco lato NA – lo scavo in tradizionale (avviato a gennaio 2025) della singola canna a doppio binario (Figura 7) verso il pozzo di lancio delle 2 TBM lato NA, con un avanzamento complessivo di circa 65 m.
Contestualmente, è in fase di esecuzione il terzo scavo di ribasso del pozzo rettangolare (circa 70 m x 22 m) per il lancio delle 2 TBM lato NA (Figura 8) e la realizzazione del terzo ordine di puntoni in c.a. definitivi con relative travi di ripartizione.
Figura 5 – Galleria Reventa: abbattimento ultimo diaframma.
Figura 7. Galleria Hirpinia: scavo tradizionale a singola canna / doppio binario a partire dall’imbocco lato NA attraverso le Argilliti Policrome del Calaggio (APC).
Figura 6 – Galleria Rocchetta: logistica di cantiere all’imbocco.
Figura 8. Galleria Hirpinia: pozzo di lancio delle TBM lato NA (3° scavo di ribasso).
Orsara – Bovino
La galleria Orsara (9,8 km a doppia canna) viene realizzata con 2 TBM EPB.
A settembre 2024 è stato avviato lo scavo della prima TBM (denominata “Marina”) a partire dall’imbocco lato BA. A giugno 2025 l’avanzamento complessivo è di circa 1300 m.
Nel frattempo, in Cina, è stato completato il Factory Acceptance Test delle 2 TBM in questione (Figura 9).
Infine, prosegue lo scavo in tradizionale della finestra carrabile F1 (avviato a luglio 2024) di cui risultano scavati circa 220 m e che garantirà l’accesso alla fermata di emergenza intermedia in sotterraneo.
Ad aprile 2025 è stato avviato lo scavo della seconda TBM (denominata “Lucia”, Figura 10) sempre a partire dall’imbocco lato BA. Contestualmente, in corrispondenza dell’imbocco lato NA (a valle della SS90) è in fase di realizzazione il terzo ordine di tiranti ed il successivo scavo di ribasso.
a cura di ITALFERR & RFI
Figura 9. Galleria Hirpinia: completamento FAT per le 2 TBM lato NA.
Figura 10. Galleria Orsara: avvio scavo della seconda TBM all’imbocco di Bovino (lato BA).
Una vetrina d’eccellenza per il tunnelling a EXPO Ferroviaria 2025
Forte del successo della scorsa edizione, EXPO Ferroviaria ripropone per il 2025 l’area dedicata alle tecnologie per il tunnelling, confermandola come punto di riferimento per le aziende specializzate nella costruzione e nell’equipaggiamento di gallerie e spazi sotterranei. L’area sarà sviluppata in collaborazione con la Società Italiana Gallerie (SIG) e con il contributo di TELT (Tunnel Euralpin Lyon-Turin), rafforzando ulteriormente il valore del progetto e la qualità della proposta espositiva.
Saranno protagonisti impianti e attrezzature per la costruzione di gallerie, materiali innovativi, tecnologie di perforazione e trenchless, sistemi di sicurezza, comunicazione e ventilazione, oltre a soluzioni elettriche e di illuminazione, in un ambiente progettato per valorizzare la qualità tecnica e stimolare la nascita di nuove sinergie tra settori affini, come quello ferroviario e quello dell’ingegneria civile.
Tunnelling:un’eccellenzaitalianacheguardaalfuturo
L’Italia è storicamente uno dei paesi leader nel settore del tunnelling. La complessità morfologica e geologica del territorio ha portato alla costruzione di un vasto patrimonio di infrastrutture sotterranee, facendo dell’Italia un laboratorio naturale per l’innovazione in questo campo. Grazie all’attività di enti come la Società Italiana Gallerie, la cultura del tunnelling continua ad evolversi, valorizzando la competenza tecnica e progettuale italiana a livello internazionale. Attualmente, grandi progetti infrastrutturali – tra cui la Galleria di Base del Brennero, il Terzo Valico dei Giovi e la galleria Hirpina sulla Napoli-Bari1 – stanno ridefinendo il profilo della rete ferroviaria italiana, generando importanti opportunità per i fornitori di tecnologie e servizi legati al mondo delle gallerie. Allo stesso tempo, si registra un crescente impegno nella riqualificazione del patrimonio esistente, con investimenti mirati alla sicurezza, all’illuminazione e ai sistemi di ventilazione.
1 Società Italiana Gallerie, The Italian Art of Tunnelling – “I principali progetti infrastrutturali attualmente in costruzione includono la Galleria di Base del Brennero, il Terzo Valico e la galleria Hirpina della linea ferroviaria ad alta velocità Napoli-Bari.” Disponibile su: https://www.societaitalianagallerie. it/the-italian-art-of-tunnelling/ (consultato il 24 aprile 2025).
L’incontro tra filiere:costruttori,gestori e innovatori
L’area tunnelling di EXPO Ferroviaria 2025 non sarà solo una vetrina tecnologica, ma anche un catalizzatore di collaborazioni intersettoriali, in particolare tra il comparto ferroviario e quello delle opere sotterranee. Questa sinergia riflette le esigenze reali del mercato e risponde alla crescente complessità dei progetti infrastrutturali moderni. La presenza di espositori specializzati arricchisce l’offerta fieristica, offrendo ai visitatori professionali – tra cui ingegneri civili, società di costruzione, enti gestori di infrastrutture, agenzie di trasporto e autorità pubbliche – una panoramica delle soluzioni soluzioni più innovative nel campo del tunnelling.
Save thedate:EXPOFerroviaria2025
L’edizione 2025 di EXPO Ferroviaria si terrà dal 30 settembre al 2 ottobre, presso Fiera Milano Rho. L’evento continua a rappresentare un appuntamento imprescindibile per gli operatori del settore ferroviario e, con l’area dedicata al tunnelling, si propone come luogo ideale per esplorare nuove tecnologie e sviluppare collaborazioni strategiche.
Inquestocontesto,laSocietàItalianaGallerieorganizzeràil1°ottobre, pressolaSalaMartini,laconferenzadaltitolo “Gestione del Rischio e Aspetti Contrattuali nelle Opere in Sotterraneo”,unappuntamentodanon perderepertuttiiprofessionistidelsettore.
Beneficieopportunitàpergliespositorinelsettoredeltunnelling L’area tunnelling rappresenta un’occasione strategica per le aziende del settore che intendono rafforzare la propria visibilità e instaurare relazioni con i principali protagonisti del mercato ferroviario e delle infrastrutture sotterranee. Le imprese interessate a partecipare come espositori possono consultare le modalità di adesione sul sito www.expoferroviaria.com oppure contattare direttamente il team organizzativo all’indirizzo: expoferroviaria@rxglobal.com
Ulterori informazioni sulla conferenza del 1° ottobre 2025 su “Gestione del Rischio e Aspetti Contrattuali nelle Opere in Sotterraneo”, organizzata dalla Società Italiana Gallerie si trovano sul sito web della SIG: www.societaitelianagallerie.it
Esposizione internazionale per le tecnologie, prodotti e sistemi ferroviari
Se la tua azienda opera nel mondo del tunnelling, questo è il tuo spazio!
• Costruzioni e appalti
• Attrezzature e impianti per gallerie
• Microtunnelling e trenchless
• Sicurezza, ventilazione, illuminazione
• Comunicazione e sistemi antincendio
• Materiali e consulenza tecnica
Gestione del Rischio e Aspetti Contrattuali nelle Opere in Sotterraneo
1 ottobre 2025 | Sala Martini
Assicurati uno spazio nell’Area Tunnel!
Organizzatore:
United. Inspired.
Tutta la potenza di cui hai bisogno
Sosteniamo la transizione verso operazioni minerarie a emissioni zero offrendo una flotta collaudata di veicoli elettrici a batteria (BEV), oltre ai nostri prodotti di ricarica, le batterie e un servizio assistenza su cui puoi sempre contare. Grazie alla nostra vasta conoscenza e al nostro approccio di partnership, possiamo supportarti nella pianificazione dell’infrastruttura durante la transizione dai combustibili fossili. E per accelerare il cambiamento e risparmiare risorse, convertiamo le attuali macchine alimentate a diesel in versioni elettriche a batteria. Per saperne di più: epiroc.it
Epiroc Italia Srl | info.italy@epiroc.com
L’Italia e la SIG ancora protagoniste al WTC 2025 a Stoccolma
Il World Tunnelling Congress 2025, tenutosi a Stoccolma dal 9 al 15 maggio scorsi, ha rappresentato, come ogni anno, l’evento cardine dal punto di vista tecnico, scientifico ed espositivo nel mondo del sotterraneo internazionale.
Come ogni anno, la partecipazione italiana è stata estremamente rilevante, tante colleghe e tanti colleghi coinvolti a vario titolo nelle attività dell’International Tunnelling Association (ITA), numerosi paper presentati e presentazioni condivise con una platea internazionale di esperti, molte colleghe e colleghi coinvolti nei Gruppi di Lavoro, molte società italiane attive nelle aree espositive. Come sempre quindi si è trattato di un buon momento per consolidare il ruolo di assoluto prestigio riconosciuto all’Italia a livello internazionale e avviare nuove collaborazioni. Il programma si è aperto sabato con il ricevimento del Presidente Arnold Dix, al suo ultimo WTC in carica, che si è tenuto nel bellissimo Museo di Arte di Stoccolma. Il ricevimento è stato preceduto da una visita del Museo che contiene opere di grande pregio di artisti europei e non. Domenica 10 maggio è stata una giornata dedicata alle riunioni dei Working Group e all’allestimento dell’area espositiva. La Società Italiana Gallerie, con il grande lavoro di coordinamento di EnricoM.Pizzarotti e FedericoForia, ha presentato un avanzamento delle attività in corso in numerosi WG e ha ricevuto le buone notizie delle elezioni di DiegoSebastiani come Vice Animateur del WG2 “Design and Engineering” e di Alessandro Menozzi del WG22 che si vanno ad aggiungere a CarmineTodaro che già
ricopre lo stesso ruolo nel WG15. Lunedì mattina si è tenuta l’Opening Ceremonyalla presenza delle autorità politiche e civil, hanno fatto seguito l’attesa Muir Wood Lecture e i primi speech. Sempre di domenica si è tenuta la prima General Assembly. Numerosi i temi affrontati relativi all’andamento dell’Associazione da HelenRoth, alla prima esperienza come Executive Director dell’ITA e da Arnold Dix nel suo discorso di apertura che ha accolto la Papua Nuova Guinea come ulteriore Member Nation. In serata il Welcome Reception, presso la City Hall di Stoccolma.
È stato sicuramente interessante seguire lo svolgimento del Think Tank, un nuovo format proposto dagli organizzatori del Congresso per incentivare lo scambio e il dibattito tra i numerosi partecipanti. A seguire il programma ha visto, come ogni anno, numerose sessioni di presentazioni parallele. In merito alla partecipazione italiana vi avevamo già dettagliatamente descritto l’elenco dei paper presentati che comunque trovate sul sito della Società Italiana Gallerie.
Sono invece disponibili in modalità Open Access sul sito del WTC2025 gli atti del Convegno che possono essere gratuitamente scaricati.
Particolarmente scenografica è stata sicuramente la Cena offerta dalle due Member Nation candidate a ospitare il WTC2028, che si è svolta presso il Vasa Museum, dove è custodito l’intero relitto di un antico, sfortunato vascello da guerra del XVII secolo (affondò poco dopo il varo), tra i più ben conservati al mondo.
Lo Stockholmsmassan, la location in cui si è tenuto il WTC 2025.
Notizie SIG/ITA Notizie SIG/ITA
Ulteriori motivi di soddisfazione e orgoglio per l’Italia sono giunti nel corso della seconda e conclusiva General Assembly, che ha segnato un momento storico per la nostra comunità. Con entusiasmo e grande partecipazione, abbiamo assistito all’elezione di AndreaPigorini, Past President della Società Italiana Gallerie, alla carica di Presidente dell’International Tunnelling and Underground Space Association (ITA) per il prossimo triennio. Nello stesso contesto, è stato conferito a Remo Grandori l’onore di tenere la prestigiosa Muir Wood Lecture in occasione del prossimo WTC 2026 a Montreal.
L’elezione di AndreaPigorini rappresenta un traguardo personale di grande rilievo, ma al tempo stesso un successo condiviso da tutta la SIG e dalla comunità italiana del tunnelling. Nel commentare la sua nomina, Andrea ha espresso parole sentite che ben riflettono il significato di questo riconoscimento:
“Sono molto contento ed orgoglioso di rappresentare la mia società Italferr con il grande gruppo FS Italiane alle spalle, la SIG e, più in generale, il saper
fare italiano nella progettazione e costruzione delle gallerie, in questo incarico internazionale di grande prestigio.
So di essere la punta di un iceberg rappresentato dai tanti colleghi progettisti, contractors, mondo accademico e industriale, stimato in tutto il mondo per le grandi competenze, in un momento in cui in Italia, anche grazie ai fondi PNRR, si stanno realizzando importanti infrastrutture ferroviarie –e non solo – con molte tratte in galleria. Insomma, un bel momento e una bella occasione per presiedere l’International Tunnelling and Underground Space Association.”
AndreaPigorini sarà affiancato da tre nuovi vicepresidenti: Timothy McGirr (UK), KlausRieker (Germania) e SanjaZlatanic (USA). A completare il rinnovato Executive Council, l’ingresso di cinque nuovi membri eletti: ElenaChiriotti (Francia), Nobuharu Isago (Giappone), ZhigouZhang (Cina), HamdiAydin (Turchia) e Johan Mignon (Belgio).
Sempre nel corso della General Assembly, l’organizzazione del WTC nel 2028 è stata assegnata aSingapore, la cui delegazione era coordinata dal
City Hall di Stoccolma.
Vista della sala durante la cerimonia di apertura del WTC 2025 a Stoccolma.
Il programma sintetico del WTC 2025 a Stoccolma.
Rinnovati
gli organi
collega italiano MassimoMarotta. Singapore ha prevalso per un solo voto rispetto alla concorrente Brisbane.
Riguardo alle attività degli YoungMembers ITA, dettagliatamente descritte nella Rubrica dedicata, ci teniamo a condividere anche qui l’elezione nel Board YM ITA di LuigiD’Angelo, fresco vincitore a Genova del premio come Young Tunneller of the Year; a lui i complimenti e gli auguri nostri e di tutta la SIG.
Il World Tunnel Congress si è concluso anche quest’anno con una Closing Ceremony di grande impatto, a coronamento di un evento ricco di contenuti tecnici, momenti di confronto e importanti riconoscimenti.
Un sentito ringraziamento va ai colleghi e alle colleghe della Swedish Rock Engineering Association per l’eccellente organizzazione, così come al Board di ITA-AITES, sempre profondamente impegnato nel garantire il successo di questi appuntamenti internazionali.
L’agenda segna già il prossimo appuntamento: il WTC 2026 in Canada, per il quale l’Italia ha già dato prova del proprio entusiasmo e impegno con l’invio di numerosi abstract. Ci prepariamo dunque a una nuova occasione per condividere competenze, esperienze e innovazioni nel mondo delle opere in sotterraneo.
a cura di Diego Sebastiani
sociali della SIG per il triennio 2025-2027
Lo scorso 17 giugno, presso la sede della Società Italiana Gallerie in via Giovanni da Procida 7 a Milano, si è tenuta l’Assemblea Straordinaria Elettiva dei Soci, durante la quale si sono svolte le elezioni per il rinnovo del Consiglio Direttivo e del Collegio dei Revisori dei Conti per il triennio 2025–2027. Di seguito si riportano i risultati:
A tutti i Consiglieri e ai Revisori neoeletti va il nostro più sentito augurio di buon lavoro, con l’auspicio di un mandato ricco di risultati e soddisfazioni per la crescita della SIG e del settore delle opere in sotterraneo nel suo complesso.
La prima riunione del nuovo Consiglio Direttivo SIG è già stata convocata per il prossimo 7 luglio a Bologna. In tale occasione saranno nominati il Presidente, il Vicepresidente, il Segretario Generale e il Tesoriere, ai quali sarà affidata la responsabilità di guidare la nostra Associazione nel prossimo triennio.
Come di consueto, l’esito delle nomine sarà pubblicato nel prossimo numero della nostra rivista. Per aggiornamenti quasi in tempo reale, vi invitiamo a consultare il sito ufficiale dell’Associazione: www.societaitalianagallerie.it
La nave custodita all’interno del Vasa Museum.
IL NOSTRO AMBIENTE IDEALE
Questo è l’ambiente ideale per i piccoli “giganti” Brokk. Con la combinazione perfetta di potenza, operatività e accessibilità, i nostri robot sono il mezzo ideale per una soluzione efficiente per incrementare la produttività.
Brokk Italia | www.brokk.it
AIS propone un nuovo modello partecipativo, tecnologico e sostenibile
Camera dei Deputati - Roma, 13 giugno 2025
Una vera rivoluzione culturale per contrastare l’emergenza infortuni nel settore delle costruzioni. È questo l’obiettivo del nuovo Position Paper n. 9, dal titolo “Sicurezza sul lavoro: dal cantiere edile un modello virtuoso di partecipazione, soluzioni digitali e sostenibilità”, presentato presso la Camera dei Deputati da AIS – Associazione Infrastrutture Sostenibili.
Alla presentazione è intervenuta ChiaraGribaudo, presidente della Commissione parlamentare d’inchiesta sulle condizioni di lavoro, che ha richiamato alla responsabilità collettiva di politica e imprese per mettere finalmente la salute e la sicurezza al centro delle scelte organizzative e progettuali. Secondo i dati INAIL 2024, le costruzioni si confermano il comparto più colpito in Europa per decessi sul lavoro (23,3% del totale UE-27 nel 2022). In Italia, le denunce di infortunio nel settore sono aumentate del 2,8% rispetto al 2023, nonostante una lieve flessione generale.
Il Position Paper propone una strategia fondata su quattro pilastri:
1. Partecipazioneattiva: coinvolgere tutti gli attori – committenti, imprese, tecnici e lavoratori – nella costruzione di un ambiente di lavoro sicuro, trasformando la sicurezza in un processo condiviso.
2. Digitalizzazionedeicantieri: utilizzare tecnologie avanzate (monitoraggio in tempo reale, sensori, BIM) per prevenire i rischi, migliorare l’efficienza e potenziare le competenze umane.
3. Formazionecontinua: promuovere una cultura della prevenzione inclusiva, valorizzando diversità e comunicazione efficace.
4. Sicurezzacomepartedellasostenibilità: ridurre infortuni significa anche limitare sprechi, inefficienze e ritardi, contribuendo alla qualità complessiva dell’opera.
LorenzoOrsenigo, presidente AIS, ha sottolineato come la sicurezza non debba essere vista come un costo, ma come “un asset strategico, parte integrante dell’identità d’impresa. Ogni euro investito in sicurezza è un euro risparmiato in inefficienze, ritardi e sofferenze”.
PaolaSenesi, segretaria nazionale FILLEA CGIL, ha evidenziato il ruolo della contrattazione e degli enti bilaterali, auspicando anche l’istituzione di una procura nazionale per la sicurezza sul lavoro.
ManuelaRocca, vicedirettore generale TELT, ha portato l’esperienza del cantiere del tunnel Torino-Lione, dove la sicurezza è affrontata come una responsabilità condivisa tra tutti gli attori, attraverso il programma Mission S, integrando protocolli, formazione continua e soluzioni tecnologiche all’avanguardia come dispositivi anticollisione e DPI intelligenti. A conclusione dell’evento, GiuseppeAmaro, coordinatore del Gruppo di Lavoro AIS “Responsabilità sociale e Sicurezza sul Lavoro”, ha ribadito il senso dell’iniziativa: “La sicurezza non può essere solo un obbligo normativo: deve diventare un valore condiviso. Il nostro obiettivo è fornire strumenti concreti per ripensare il cantiere come luogo di lavoro sicuro, inclusivo e sostenibile”.
Il contributo degli Young Member della SIG al World Tunnel Congress 2025 di Stoccolma Sfide e Opportunità del prossimo futuro…
Cari Young Members,
Il World Tunnel Congress 2025, tenutosi a Stoccolma dal 9 al 15 maggio, ha rappresentato un’importante occasione di incontro e scambio per i professionisti del settore delle opere sotterranee. Fra i protagonisti di questo evento, i giovani membri della Società Italiana Gallerie, hanno avuto un ruolo di successo e di significativa partecipazione nelle attività dei Working Group
Gli incontri per questi gruppi di lavoro si sono tenuti la domenica prima dell’apertura ufficiale del Congresso Mondiale delle Gallerie, ed hanno visto la partecipazione attiva degli animatori e co-animatori dei WG della SIG insieme ai loro omologhi dell’ITA - International Tunnelling and Underground Space Association. Tali incontri tecnici sono stati un’opportunità unica per presentare i lavori nazionali che ciascun gruppo ha portato avanti, e per contribuire ai progetti internazionali e confrontarsi sullo stato dell’arte del mondo sotterraneo.
Gli obiettivi legati alla presentazione dei singoli Lavori Nazionali hanno offerto ai giovani membri della SIG l’opportunità di illustrare i progetti e le ricerche sviluppate in Italia, mettendo in luce le innovazioni e le best practices adottate nel nostro paese. Per il WG3 Contractual practices in Underground Construction e il WG6 Maintenance and Repair of Underground Structures, in particolare, si è pronti alla pubblicazione di nuovi Report sui temi, rispettivamente, del Time Adjustment per lunghe gallerie transfrontaliere in Italia e dell’Intelligenza Artificiale per l’ispezione delle Costruzioni in Sotterraneo.
Partecipando attivamente ai gruppi di lavoro e progetti internazionali, i giovani professionisti hanno contribuito, con le loro competenze e conoscenze, ai progetti globali, favorendo lo scambio di idee e soluzioni smart, soprattutto per gli animatori italiani che ricoprono lo stesso ruolo anche a livello ITA, ovvero per il WG15 Underground and Environment, WG20 Urban Problems – Underground Solutions e WG22 Information Modelling in Tunnelling. Numerosi Working Group, inoltre, hanno avuto delle delegazioni presenti negli incontri dedicati di domenica 11 maggio e lungo tutta la durata dell’evento.
Gli incontri avuti sono stati un importante ed utile momento confronto e discussione sullo stato attuale delle tecnologie e delle metodologie nel
settore delle costruzioni sotterranee, permettendo ai partecipanti di aggiornarsi sulle ultime tendenze e sviluppi.
Il WTC 25 è stato soprattutto motivo di grande orgoglio italiano in quanto l’Ing AndreaPigorini Past Presidente della SIG dal 2013 al 2022, progettista e profondo conoscitore delle grandi opere in sotterraneo, è stato eletto con maggioranza assoluta dei voti, Presidente dell’ITAe l’Ing. LuigiD’Angelo International Coordinator del Gruppo YM, nonché Young Tunneller of the Year 24, è stato eletto con grande entusiasmo componente del Board del Gruppo ITA Young Member. La presenza di Luigi all’ITAym sarà fondamentale per rafforzare i rapporti e il networking con i colleghi degli altri Paesi, per un crescendo di sempre nuove attività a livello internazionale.
Il WTC 25 è stato un momento emozionante per l’elezione di Carmine Todaro, giovane Professore del Politecnico di Torino e componente del Board YM, a Vice Animatore del WG 15 Underground and Environment dell’ITA.
Inoltre, il WTC 25 è stata anche un’occasione per la presentazione delle linee guida di prossima pubblicazione “Guidelines for the Calculation of Resul-
Figura 1. Discorso del nuovo Presidente dell’ITA Andrea Pigorini.
tant Forces for Hard Rock Shielded TBM Excavation” sviluppate dal WG 14 Mechanisation of excavation da parte del Coordinatore AndreaMarchioni La rappresentanza italiana YM del WG 6 Maintenance and Repairs of Undergroung Structures ha presentato il lavoro in corso di revisione Artificial Intelligence for the Inspection of Underground Structures capitanata dall’Animatore FedericoForia e dal gruppo di specialisti e membri del WG6 SIG AndreaCarigi,MarioCalicchio,ChristianGhilardi e SalvatoreAiello.
Young Members group Young Members
La grande competenza e il know how che i giovani professionisti hanno portato nel mondo è davvero lodevole e di alto profilo, e quanto riconosciuto a livello internazionale è sicuramente stimolo per fare ancora meglio diffondendo la culturale del costruire in sotterraneo.
La Mission dell’interno Gruppo YMs, infatti, continua ad essere quella di raccontare e trasmettere le emozioni di queste esperienze, sicuro che sempre più giovani colleghi possano avvicinarsi al mondo del Tunnelling e con esso diventare soci attivi della SIG nell’organizzazione delle nostre iniziative che ricordiamo sono davvero tante. Vi invitiamo, pertanto a seguirci sui nostri canali ufficiali e a scriverci manifestando il proprio interesse all’indirizzo e-mail: ym@societaitalianagallerie.it
Vi ricordiamo che a Giugno si terranno le elezioni per il nuovo Board dei SIG Young Members. Invitiamo tutti gli interessati a candidarsi per ricoprire questo ruolo di prestigio inviando il proprio CV e una breve lettera di presentazione all’indirizzo e-mail dell’associazione di cui sopra. Questa è un’ottima occasione per contribuire attivamente alle attività del Gruppo e portare nuove idee!
Team Comunicazione
Figura 2. Andrea Pigorini e Luigi D’Angelo al termine delle elezioni.
Figura 4. Il Gruppo EUTF YMs durante gli entusiasmanti momenti social del WTC 25.
Figura 3. ITAym Steering Board 2025-26.
YMs
Rocco Amodeo Elena Consoli
Figura 5. Carmine Todaro eletto Vice Animatore del WG 15.
Figura 6. Federico Foria, Animatore del WG 6 SIG, presenta il lavoro nell’incontro ITA WG 6.
Abbiamo letto Abbiamo letto
I MISTERI DEL SOTTOSUOLO
Storia umana del mondo sotterraneo
Will Hunt
Bollati Boringhieri Editore
L’autore del libro, Will Hunt, a sedici anni ha iniziato a scoprire il fantastico mondo dell’underground quando ha trovato un vecchio tunnel dimenticato sotto la casa dei suoi genitori a Providence, nel Rhode Island. Da quel momento, è iniziata per lui una vera passione per gli spazi sotterranei, che lo ha portato a esplorare metropolitane dismesse, fognature di New York, grotte, catacombe, rifugi sotterranei e persino città interamente costruite nel sottosuolo. Nessun luogo sotto la superficie terrestre sembra essergli sfuggito in quella che è sempre stata a metà tra un hobby e una professione.
Questa passione lo ha condotto in profondità nella storia e nella scienza: ha partecipato a spedizioni con la NASA in miniere abbandonate a mille metri di profondità nelle Black Hills, ha vissuto per giorni nei cunicoli sotterranei di Parigi per studiarne la rete nascosta, è sceso con una famiglia aborigena in un’antichissima miniera d’ocra di 35.000 anni fa, e ha esplorato le profondità della grotta di Actun Tunichil Muknal, in Belize, alla ricerca dei resti Maya noti come la “fanciulla di cristallo”. Attraverso queste esperienze, Hunt ci dimostra che la meraviglia e la fantasia non si trovano solo nel cielo sopra di noi, ma anche nelle profondità della Terra, un luogo ancora ricco di segreti e per lo più inesplorato. Il suo libro “I misteri del sottosuolo” raccoglie storie affascinanti rimaste a lungo nell’ombra, che grazie alla sua abilità narrativa vengono finalmente rivelate.
Per noi che quotidianamente viviamo la realtà delle opere in sotterraneo è estremamente bello vedere come il “nostro” mondo dell’underground possa appassionare persone di background completamente differenti a tal punto da spingersi in profondità sia nello studio che, fisicamente, nelle viscere della terra.
Diego Sebastiani
Estratto del libro
Per più di dieci anni, mi sono calato in catacombe di pietra e stazioni della metropolitana in disuso, grotte sacre e rifugi antiatomici. È iniziata come una ricerca per comprendere i miei stessi timori; tuttavia, a ogni discesa, via via che entravo in risonanza con il paesaggio sotterraneo, è emersa una storia più universale. Mi sono reso conto che noi – tutti noi, la specie umana – abbiamo sempre provato una muta attrazione per il sottosuolo, che siamo connessi a questo regno come lo siamo alle nostre stesse ombre. Da quando i nostri antenati hanno iniziato a narrare storie sui paesaggi che abitavano, le caverne e gli altri spazi sotterranei ci hanno terrorizzati e affascinati, hanno plasmato i nostri incubi e le nostre fantasie. I mondi del sottosuolo, ho scoperto, corrono attraverso la nostra storia come un filo segreto: in maniere sottili e profonde, hanno guidato il nostro modo di pensare a noi stessi e dato forma alla nostra umanità.
Biografia dell’autore
Will Hunt è un giovane saggista statunitense. I suoi lavori sono stati pubblicati su diverse riviste, tra cui The Atavist, The Economist, The Paris Review Daily , Discover , Outside , Men’s Journal e Rolling Stone. Per i suoi viaggi esplorativi ha ricevuto borse dalla Thomas J. Watson Foundation, la New York Foundation for the Arts, la Bread Loaf Writer’s Conference e la Macdowell Colony. Le sue incursioni sotterranee sono state riprese dal «New York Times» e dalla «NPR». Si è laureato in Letteratura alla New York University. I misteri del sottosuolo è il suo primo libro.
Link utili: https://www.bollatiboringhieri.it/autori/will-hunt/
Australia – Suburban Rail Loop
Iniziatiilavoridiscavo
A Clarinda sono iniziati i principali lavori di scavo per la costruzione dell’enorme pozzo di lancio da dove - a partire dal prossimo anno - le TBM inizieranno a scavare la tratta meridionale della tratta Est del Suburban Rail Loop (SRL) di Melbourne. Le macchine arriveranno in cantiere entro la fine dell’anno.
Il consorzio Suburban Connect costruirà 16 km di tunnel a doppia canna tra Cheltenham e Glen Waverley, mentre il consorzio Terra Verde sta costruendo i tunnel a nord di Glen Waverley fino a Box Hill. Quattro TBM saranno lanciate da Clarinda: 2 verso Glen Waverley e 2 verso Cheltenham. Per la prima volta in Australia, le TBM inizieranno il loro percorso tramite “flying launches”. Il flying launch consente di iniziare lo scavo dei tunnel mentre la TBM continua ad essere assemblata nella parte posteriore, partendo da un’area di lancio più piccola. L’assemblaggio di ogni TBM richiederà circa 3 mesi. L’avanzamento massimo si prevede che sarà di 90 m/settimana.
A Burwood sono in fase avanzata i lavori di scavo per un secondo pozzo di lancio per la tratta Est del Suburban Rail Loop (SRL). Anche da qui la partenza della TBM è prevista nel 2026.
La tratta Est del Suburban Rail Loop (SRL) sarà operativa nel 2035.
Australia – Progetto Sydney Metro West
LastazionediHunterStreetprendeforma
Sono stati completati i lavori di scavo della caverna della stazione Hunter Street, una delle opere chiave del megaprogetto Sydney Metro West. La realizzazione della gigantesca cavità sotterranea – lunga 180 metri, larga 28 metri e alta 20 metri – ha richiesto 20 mesi di lavoro ininterrotto, 24 ore su 24, grazie all’impiego di una fresa ad attacco puntuale e di una squadra composta da 57 operatori specializzati. In totale, sono state rimosse oltre 240.000 tonnellate di materiale di scavo. Vista la posizione centrale della caverna nel cuore di Sydney, lo scavo ha richiesto una pianificazione meticolosa e un’esecuzione estremamente precisa: in alcuni punti, le lavorazioni sono avvenute a soli 1,8 metri dalla linea metropolitana esistente M1, e direttamente al di sotto di edifici iconici, come la State Library del Nuovo Galles del Sud, patrimonio mondiale dell’UNESCO, e l’area verde di The Domain. La stazione di Hunter Street, con i suoi ingressi strategicamente posizionati agli angoli tra George Street e Hunter Street, e tra O’Connell Street e Bligh Street, sarà il capolinea della nuova linea Sydney Metro West, un’infrastruttura da 24 chilometri che raddoppierà la capacità ferroviaria tra Greater Parramatta e il centro di Sydney. Si stima che Hunter Street diventerà la stazione più trafficata dell’intera rete Sydney Metro West. L’apertura della nuova linea metropolitana è prevista per il 2032.
India – metropolitana di Lucknow
VialiberadelPIBperilcorridoioest-ovest
Il Public Investment Board (PIB) ha approvato il nuovo Corridoio Est-Ovest della metropolitana di Lucknow, lungo circa 12 km, nell’ambito della Fase 1B del progetto. Resta ora solo l’ultimo passaggio: l’approvazione definitiva da parte del Consiglio dei Ministri dell’Unione.
Il tracciato si estenderà per 11,165 km, di cui 4,286 km in viadotto e 6,879 km in sotterraneo, con un totale di 12 stazioni. Le stazioni Charbagh, Gautam Buddha Marg, Aminabad, Pandeyganj, Stazione Ferroviaria Urbana, Medical Chauraha e Chowk saranno sotterranee, mentre Thakurganj, Balaganj, Sarfarazganj, Moosabagh e Vasant Kunj saranno in sopraelevata.
Il costo stimato dell’intervento è di 598,19 milioni di euro (pari a 5.801 crore di rupie) e il completamento dei lavori è previsto entro cinque anni.
Il nuovo corridoio migliorerà significativamente l’accessibilità nelle aree densamente popolate della Vecchia Lucknow, come Aminabad, Chowk e Thakurganj, e fornirà un collegamento strategico anche alla zona in espansione di Vasant Kunj.
Il tracciato sarà interconnesso con l’attuale Corridoio Nord-Sud (largo 23 km) attraverso la stazione di interscambio di Charbagh, permettendo ai passeggeri di passare facilmente da un asse all’altro della rete.
Con questa estensione, la rete metropolitana di Lucknow, inaugurata nel 2017, raggiungerà una lunghezza complessiva di 35 km. Nonostante questo passo avanti, la rete della città rimane ancora indietro rispetto a quelle di altre grandi città indiane: Delhi vanta oltre 435 km di rete metropolitana, seguita da Mumbai (90 km) e Bengaluru (70 km). Anche le più giovani reti di Hyderabad e Ahmedabad, avviate in epoca simile, hanno già raggiunto rispettivamente 69 km e 59 km.
Filippine - Tunnel della tangenziale di Davao
Breakthroughnellaprimacanna
Lunedì 28 aprile 2025 si è festeggiato l’abbattimento del diaframma della prima canna a due corsie lunga 2,3 km e in direzione nord della tangenziale di Davao (DCBCP -Davao City Bypass Construction Project).
All’evento hanno partecipato diverse autorità, tra cui il Ministro giapponese del Territorio, delle Infrastrutture, dei Trasporti e del Turismo; l’Ambasciatore
Notizie flash Notizie flash
giapponese nelle Filippine; i rappresentanti del Dipartimento dei Lavori Pubblici e delle Autostrade (DPWH), dell’Agenzia giapponese per la Cooperazione Internazionale (JICA), dell’appaltatore Shimizu-Ulticon-Takenaka Joint Venture e della Joint Venture di consulenza Nippon Koei-Nippon Engineering-Katahira Engineers e Philkoei. A testimonianza dei legami culturali tra Filippine e Giappone, la cerimonia ha previsto il tradizionale Kagami Wari giapponese (rottura di una botte di sakè) e il taglio del nastro, a simboleggiare l’unità e la celebrazione comune. Il progetto della tangenziale di Davao, finanziato dall’Agenzia di Cooperazione Internazionale del Giappone (JICA), prevede la realizzazione di una nuova arteria stradale a quattro corsie lunga 29,7 km, comprensiva di ponti e di un tunnel a doppio fornice. Parallelamente, il governo filippino sta realizzando un ulteriore tratto da 15,8 km, portando la lunghezza complessiva della tangenziale a 45,5 km. L’infrastruttura sarà di fatto una superstrada ad alta capacità, progettata per alleggerire il traffico urbano nella città di Davao e potenziare i collegamenti regionali. Attualmente, il tempo di percorrenza tra le tratte Davao–Digos e Davao–Tagum lungo l’Autostrada Maharlika è di circa 1 ora e 44 minuti. Con il completamento della nuova tangenziale, si stima che il tempo di viaggio sarà ridotto a soli 49 minuti, con un significativo miglioramento in termini di efficienza e qualità della mobilità per residenti, pendolari e trasporti commerciali.
La realizzazione del DCBCP è suddivisa in 6 lotti, 5 dei quali sono attualmente in fase di costruzione. Il bando per il lotto finale è previsto per il terzo trimestre del 2025. Il tunnel a doppia canna, realizzato con il metodo NATM o scavo sequenziale, sarà la galleria stradale di montagna più lunga mai costruita nelle Filippine. Il completamento e l’entrata in funzione della tangenziale di Davao sono previsti entro il 2028.
Canada – Tunnel del fiume Fraser
Aggiornamentisulprogetto
Dal 22 maggio al 23 giugno 2025, il pubblico è invitato a presentare osservazioni all’Ufficio per la Valutazione Ambientale in merito alla proposta di Valutazione Ambientale per il Fraser River Tunnel Project. Nell’ambito della consultazione, sono previsti due incontri pubblici in presenza (open house), che si terranno il 4 e 5 giugno 2025. Il progetto prevede la realizzazione di un nuovo tunnel immerso a otto corsie, destinato a sostituire l’attuale George Massey Tunnel lungo la Highway 99. La futura infrastruttura sarà composta da tre corsie veicolari e una corsia riservata al trasporto pubblico per ciascun senso di marcia, oltre a un corridoio separato per pedoni e ciclisti, a supporto della mobilità sostenibile.
Il piano comprende inoltre la sostituzione del ponte Deas Slough e la dismissione del tunnel esistente una volta che il nuovo tunnel sarà pienamente operativo.
Stati Uniti – Tunnel del fiume Potomac
Alvialeoperazionidibrillamentocontrollato
A metà maggio, nell’ambito dei lavori di scavo per il progetto del tunnel del fiume Potomac di DC Water, sono iniziate le operazioni di brillamento sotterraneo controllato presso il cantiere del West Potomac Park e proseguiranno fino a febbraio 2026. Il cantiere si trova lungo il fiume Potomac, all’incrocio tra Ohio Drive e Independence Avenue Southwest. Le operazioni di brillamento fanno parte della costruzione dei due pozzi necessari per iniziare lo scavo del tunnel del fiume Potomac. Tali pozzi, profondi circa 31 m (103 piedi), saranno utilizzati per calare e lanciare le due TBM, che si chiameranno “Mary” ed “Emily” come le sorelle Edmonson che tentarono audacemente di fuggire dalla schiavitù sul fiume Potomac nel 1848 e divennero eroine del movimento abolizionista.
“Mary” ed “Emily” scaveranno il tunnel di 8,85 km (5,5 miglia) in direzione opposta: “Mary” scaverà in direzione Nord per 3,86 km (2,4 miglia) verso il punto finale del tunnel, vicino all’ingresso della Georgetown University su Canal Road Northwest. “Emily” si dirigerà verso Sud, scavando 4,99 km (3,1 miglia) per collegarsi al sistema di tunnel del fiume Anacostia.
Le due TBM per il tunnel del fiume Potomac sono fabbricate da Herrenknecht, che ha costruito anche le TBM per gli altri tunnel di DC Water nell’ambito del progetto Clean Rivers.
Alla fine di aprile, “Mary”, la prima delle due TBM, ha completato i test di accettazione in fabbrica. La TBM a doppia modalità, con un diametro di 6,4 m (41 piedi), attraverserà l’oceano e raggiungerà Washington nell’autunno del 2025. La costruzione di “Emily” è già in corso e i test di accettazione in fabbrica sono previsti per ottobre. Sarà quindi spedita a Washington e la sua consegna è prevista nel 2026.
Il Potomac River Tunnel è progettato per ridurre del 93% il volume di acque reflue e piovane immesse nel fiume in un anno di precipitazioni medie. Ciò equivale a oltre 2,27 miliardi di litri (600 milioni di galloni) di acque reflue e piovane che saranno catturate e inviate all’impianto di trattamento delle acque reflue di Blue Plains. Il completamento è previsto per il 2030.
Regno Unito – Progetto HS2
PrimobreakthroughneltunnelBromforddiBirmingham
Il 9 maggio 2025 la TBM “Mary Ann” di HS2 ha abbattuto il diaframma della prima canna del tunnel Bromford, che presto diventerà la galleria ferroviaria più lunga delle West Midlands.
A luglio 2023 la macchina, lunga 125 m e pesante 1600 t, aveva iniziato a scavare il tunnel Bromford – lungo 5,8 km, tra il villaggio di Water Orton, nel Warwickshire e Washwood Heath, un sobborgo nord-orientale di Birmingham. La TBM è stata battezzata “Mary Ann”, in omaggio alla scrittrice nata nel Warwickshire, meglio conosciuta con lo pseudonimo di George Eliot.
La caduta del diaframma del tunnel – il primo di HS2 a Birmingham – rappresenta un’importante pietra miliare per il progetto, che ridurrà quasi della metà i tempi di percorrenza tra le due città più grandi della Gran Bretagna, liberando al contempo prezioso spazio sui binari della congestionata West Coast Main Line per un maggior numero di servizi locali, regionali e merci. Balfour Beatty VINCI (BBV) prevede di completare lo scavo della seconda canna entro la fine dell’anno con la TBM “Elizabeth”. La TBM “Mary Ann” nei 22 mesi di scavo ha lavorato sino ad una profondità di 40 m, passando sotto la Riserva Naturale di Park Hall, l’autostrada M6 e il fiume Tame, che ha attraversato quattro volte, con una copertura minima di cinque metri. In fase di avanzamento ha estratto circa un milione di tonnellate di smarino che - in linea con la politica di sostenibilità di HS2 - sarà riutilizzato per la costruzione del vicino Delta Junction, una complessa rete di 13 viadotti che permetterà ai treni ad alta velocità di viaggiare tra Londra, la stazione di interscambio di Solihull e la stazione di Birmingham Curzon Street. Il cantiere di Washwood Heath, dove è stata assemblata la “Mary Ann”, diventerà presto il centro nevralgico delle operazioni di HS2. Accanto all’imbocco del tunnel, sorgeranno il Deposito e il Centro di Controllo Integrato di Rete di HS2.
La TBM ha raggiunto un avanzamento massimo di 30 m/giorno e ha installato in contemporanea 20.797 conci prefabbricati – pesanti sino a 7 t - per i 2.971 anelli di rivestimento del tunnel. I conci sono stati prodotti presso lo stabilimento di Balfour Beatty VINCI ad Avonmouth, vicino a Bristol.
Svezia – Linea Ferroviaria Norrbothnia/Botnia settentrionale, tunnel Ersmark
Giàscavatometàtunnel
Procedono secondo programma i lavori di realizzazione dell’Ersmark Tunnel, il primo tunnel della futura linea Norrbothnia (Botnia settentrionale), lungo 1,6 km tra Fäboberget ed Ersmarksberget. Lo scavo ha già superato la metà dello sviluppo complessivo, grazie all’avanzamento simultaneo da entrambe le estremità.
La parte centrale del tunnel, ancora da scavare, presenta le maggiori complessità geologiche e viene eseguita con metodo drill & blast. Questa parte attraversa infatti un’area situata sotto una vecchia discarica, rendendo necessarie misure di controllo ambientale: sono stati realizzati tre bacini di monitoraggio per la misurazione regolare del volume e della qualità delle acque, al fine di prevenire e gestire eventuali infiltrazioni.
Implenia, l’impresa appaltatrice, sta portando avanti in parallelo ai brillamenti anche i lavori di movimento terra all’interno del tunnel, oltre all’installazione delle reti impiantistiche, comprendenti condotte per acque reflue, drenaggi, rete antincendio e fognatura.
L’obiettivo è completare l’opera entro l’estate del 2026. Le circa 870.000 tonnellate di materiale di scavo saranno in gran parte riutilizzate per la costruzione della linea Norrbothnia a nord di Umeå, contribuendo a ridurre l’impatto ambientale e i costi di approvvigionamento dei materiali.
Romania - Metropolitana di Bucarest, linea 6
LanciatalaprimaTBMsullatrattaSud
Il 9 aprile 2025 nel cantiere della futura stazione Tokyo si è svolta la cerimonia di lancio della prima delle due TBM che scaveranno la tratta Sud, lunga 6,6 km, tra le stazioni di Tokyo e 1 Mai, della linea 6 della metropolitana di Bucarest che collegherà la rete metropolitana con l’Aeroporto Internazionale Henri Coanda – Otopeni. La linea avrà 6 stazioni. Le due TBM sono state battezzate “Sfanta Maria/Santa Maria”, simbolo della protezione divina e della cura per tutta l’umanità e “Sfanta Ana/Sant’Anna”, simbolo di saggezza, pazienza e fede incrollabile. La TBM “Santa Maria” era giunta in Romania l’8 settembre 2024, giorno in cui si celebra la Natività della Vergine Maria. Essa è lunga 97 m, pesa circa 600 t e la sua testa misura 6,60 m di diametro. Avanza in media 1,5 m all’ora, estraendo circa 60 m3 di terra e installando contemporaneamente gli anelli di rivestimento del tunnel. Il trasporto di questi viene effettuato da un MSV (Multi Service Vehicle) in grado di trasportare sino a 50 t. In media vengono montati 13-14 anelli in 24 ore. La TBM è in funzione ininterrottamente, ad eccezione delle pause necessarie per la manutenzione e Il personale che la gestisce lavora 24 ore al giorno, su tre turni. Dopo l’avvio della TBM “Santa Maria”, anche la TBM “Sant’Anna” partirà dalla futura stazione Tokyo in direzione 1 Mai, per scavare la seconda canna della tratta Sud.
Francia - Metropolitana di Tolosa
BreakthroughdellaTBM“MargueritedeCatellan” Il 24 marzo 2025 il consorzio Horizon, composto da Bouygues travaux publics (leader), Soletanche Bachy e Bessac ha festeggiato l’arrivo della TBM “Marguerite de Catellan” nella stazione di Limayrac - Cite de l’espace, Lotto 4, linea C della metropolitana di Tolosa. Ad oggi la TBM, partita dalla stazione Montaudran Gare - Piste des Gean, ha scavato 2,7 km; in autunno è previsto il suo breakthrough nella futura stazione di Cote Pavee. A novembre arriverà infine al pozzo Saint-Sauveur concludendo lo scavo della propria tratta di 4,2 km.
Notizie flash Notizie flash
Austria-Italia – Traforo ferroviario del Brennero (BBT)
Con il completamento dello scavo da parte della TBM “Flavia”, dopo oltre 14 chilometri di scavo nel cuore delle Alpi, si è conclusa l’attività di avanzamento meccanizzato sul versante italiano della Galleria di Base del Brennero. Si tratta di una pietra miliare nella costruzione del tunnel ferroviario più lungo al mondo: 64 chilometri complessivi che costituiranno l’asse portante del Corridoio Scandinavo-Mediterraneo della rete transeuropea dei trasporti (TEN-T).
L’arrivo della TBM “Flavia” è stato celebrato il 15 maggio 2025 da BBT SE, società promotrice dell’opera, con un evento simbolico svoltosi nella spettacolare cornice della Fermata di Emergenza di Trens, trasformata per l’occasione in un palcoscenico sotterraneo. Alla cerimonia hanno preso parte autorità italiane, austriache ed europee, sottolineando l’alto valore ambientale, sociale e infrastrutturale dell’opera, che mira a promuovere un sistema di mobilità efficiente, sicuro e a basse emissioni.
CaratteristichetecnichedelleTBM a confronto
“Flavia” è l’ultima delle tre TBM impiegate nel lotto Mules 2-3, realizzato dal consorzio guidato da Webuild e Ghella per conto di BBT SE, ad aver raggiunto il confine austriaco. L’hanno preceduta la TBM “Virginia”, che ha completato nel marzo 2023 la galleria di linea est, e la TBM “Serena”, che ha concluso nel novembre 2021 lo scavo del cunicolo esplorativo. Tutte e tre le TBM, di tipo doppio scudo e prodotte da Herrenknecht, hanno operato in condizioni geotecniche estremamente complesse e variabili. Lo scavo si è sviluppato sotto coperture fino a 1.600 metri, affrontando condizioni difficili: fenomeni di instabilità al fronte, squeezing, infiltrazioni d’acqua e fango. Il superamento di queste criticità è stato possibile grazie all’elevata competenza delle maestranze e all’impiego di tecnologie all’avanguardia, con TBM dotate di elevata potenza, coppia, spinta e conicità degli scudi, garantendo l’avanzamento continuo in condizioni estreme.
TBM Flavia / VirginiaSerena
Diametro scavo10,71 m 6,85 m
Lunghezza totale204 m 280 m
Potenza installata4.200 kW 5.300 kW
Spinta operativa95.000 kN43.000 kN
Spinta massima213.000 kN97.000 kN
Coppia operativa24.000 kNm10.000 kNm
Coppia massima31.000 kNm14.000 kNm
Taglienti (cutter) 19” 19”
Il completamento dello scavo meccanizzato non rappresenta solo un’impresa ingegneristica di livello internazionale, ma anche un traguardo simbolico per la mobilità integrata europea.
Con il suo completamento previsto nei prossimi anni, la Galleria di Base del Brennero si affermerà come asse chiave per il trasferimento del traffico merci dalla strada alla ferrovia, con benefici concreti in termini di riduzione delle emissioni, ottimizzazione logistica e sostenibilità ambientale su scala continentale.
Italia/Campania-Puglia – Linea ferroviaria AV/AC Napoli-Bari
CompletatoscavodeitunnelTeleseeReventa
Il 9 aprile 2025 è stato abbattuto l’ultimo diaframma della galleria artificiale Telese (3 km) sul lotto Frasso Telesino-Telese e della galleria naturale Reventa (150 m) sul lotto Telese-Vitulano sulla nuova linea AV/AC Napoli-Bari.
I lavori relativi al Lotto Frasso Telesino - Telese erano stati affidati da RFI nel 2019 al Consorzio Frasso Scarl, composto dalle imprese Pizzarotti, Ghella, Itinera, Salcef ed EdS Infrastrutture per un investimento complessivo di circa 245 milioni di euro. Il tracciato si sviluppa per una lunghezza complessiva di 11,2 km, di cui circa 5 km in affiancamento alla linea esistente e i restanti 6 km in variante. E’ prevista la costruzione della nuova fermata di Amorosi e l’ampliamento della stazione di Telese, nonché l’attraversamento del fiume Calore mediante un opera significativa in viadotto lungo 765 m. Grazie alla Galleria artificiale Telese, si migliorerà l’ingresso nella città di Telese Terme, eliminando l’impatto del transito ferroviario sul centro abitato. Quest’opera sotterranea, lunga 2,9 km e realizzata con il metodo Milano (cut&cover), è stata completata attraverso l’avanzamento simultaneo da 4 fronti di scavo. I lavori relativi ai Lotti Telese - S. Lorenzo - Vitulano erano stati affidati da RFI nel 2020 al Consorzio Telese Scarl, composto dalle imprese Ghella, Itinera, Salcef e Coget Impianti per un investimento complessivo di circa 500 milioni di euro. Il tracciato si estende per una lunghezza complessiva di 19 km collegandosi alla tratta Vitulano - Benevento già raddoppiata e attualmente in esercizio. Sono previste tre nuove fermate a Solopaca, San Lorenzo e Ponte Casalduni. Per un tratto di circa 1,5 km si sviluppa in affiancamento alla linea storica, mentre la restante parte procede principalmente in variante di tracciato, attraverso 14 viadotti e 7 gallerie naturali. In linea con gli obiettivi PNRR sono state completate le elevazioni delle principali opere in viadotto e sono attivi 18 fronti di scavo per la realizzazione delle 7 gallerie naturali, tra le quali la prima ad essere completata è la galleria Reventa lunga 215 m. La nuova linea AV/AC Napoli-Bari, del valore complessivo di circa 6 miliardi di euro, finanziati anche con fondi PNRR, rientra tra le opere strategiche del Gruppo FS per migliorare la mobilità nel Sud Italia. Il primo lotto Bovino - Cervaro è attivo dal 2017 e sono in corso i lavori su tutte le altre tratte. Il completamento dell’opera velocizzerà il collegamento trasversale tra il Tirreno e l’Adriatico, ottimizzando le connessioni tra la Puglia e le aree interne della Campania con la dorsale AV Napoli-Roma-Milano. L’opera rientra nel progetto Cantieri Parlanti, iniziativa del Gruppo FS in collaborazione con il Ministero delle Infrastrutture e dei Trasporti che punta a informare e comunicare in modo chiaro e trasparente le opere ferroviarie in corso di realizzazione. La nuova linea Alta Velocità/Alta Capacità Napoli-Bari è parte integrante del Corridoio ferroviario europeo TEN-T Scandinavia-Mediterraneo. Con l’attivazione della tratta Cancello-Frasso Telesino entro la fine del 2025, sarà possibile viaggiare direttamente da Bari a Napoli in 2h 40’; al completamento dell’intera opera sarà possibile spostarsi da Bari a Napoli in due ore, fino a Roma in tre ore e da Lecce e Taranto verso la Capitale in quattro ore.