


MAGAZINE | APRIL 2024


Euromel® Melamine - the leading and most advanced technology for the production of high-quality melamine used in wood-based products, laminates, moulding compounds and fire-extinguishing foams in the last 40 years.
Delivers high purity, high consistency melamine with total zero pollution (TZP) with extremely lower energy consumption using 30% lesser steam import and 20% lower fuel utilisation than the closest competitor.
Euromel® Melamine Process is now used in 28 plants worldwide, accounting for more than 8 million tonnes of melamine produced cumulatively, making it the most traded and widely used melamine worldwide.


03 Comment
05 News
10 North America’s Fertilizer Market: Opportunities To Prosper
Gordon Cope, Contributing Editor, discusses the recent activity in the North American fertilizer market, and examines the prospects for growth in the coming decade.
16 Fuelling The Future
Gary Bennington, UNICAT Catalyst Technologies, LLC, APAC, discusses how breakout catalyst technology can deliver enhanced profitability within the ammonia industry.
21 Embracing Change
Peter Maas, Grandperspective GmbH, explains why a sea-change in emissions monitoring is needed if green ammonia is to become the future of farming.
25 Maximising Hydrogen Electrolyser Capacity
Todd Cartwright, Nel Hydrogen, USA, examines why the capacity for hydrogen electrolysers must be increased.
28 Green Ammonia From A Business Perspective Rochman Goswami, Black & Veatch, USA, discusses the business opportunities that green ammonia presents in the quest to decarbonise across industries.


Maria Acevedo and Brian Clancy, Kimre Inc., USA, examine often overlooked plant design considerations and emphasise the critical role of mist eliminators.
40 A Mist Opportunity
Marilia Davidson, Damion Adams, USA, and Ali Goudarzi, the Netherlands, CECO, explain how droplet collection mechanisms operate and help distinguish different types of mist eliminators.
47 Put To The Test
Alexandre Rossi, Breno de Almeida Avancini, Laryssa Lobo, and Vitor Sturm, Clark Solutions, Brazil, discuss the importance of testing systems in validating and updating models, highlighting the example of Brownian diffusion mist eliminators.
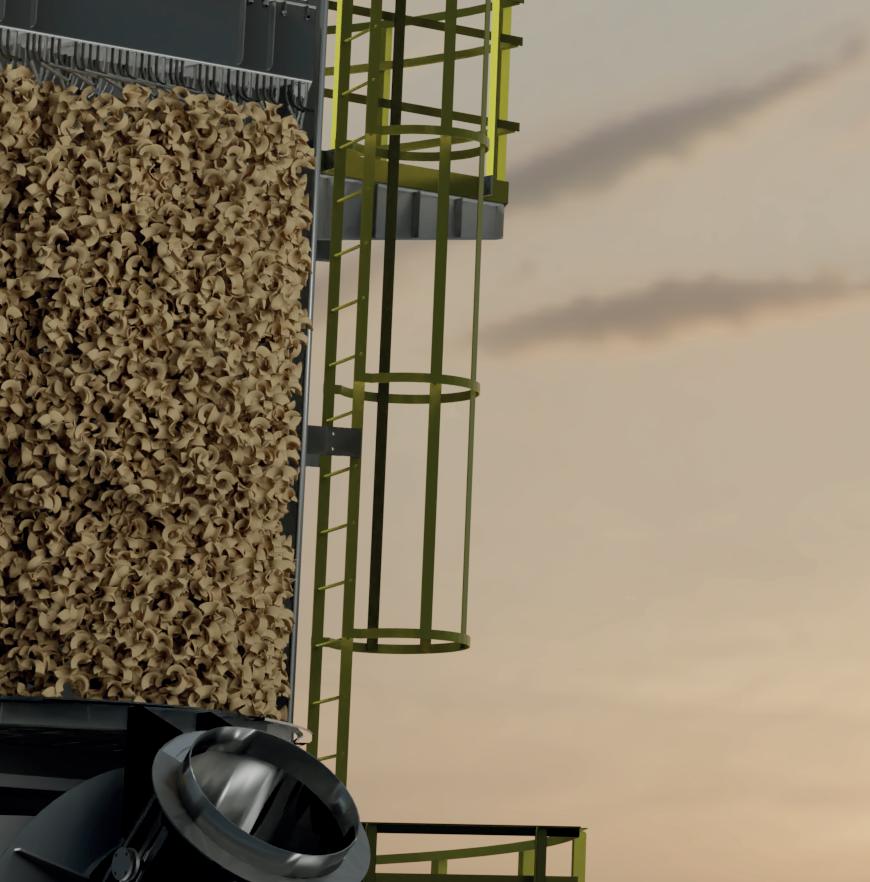
Todd Swinderman, Martin Engineering, USA, discusses how issues with dust control in the fertilizer industry can be addressed through effective conveyor skirtboards and curtain design.
Maxine Schuetz, RHEWUM GmbH, Germany, underlines why the integration of advanced screening machines, along with efficient feeders and under-pressure dedusting systems, represents a leap forward in managing the hygroscopic dust challenge in fertilizer production.
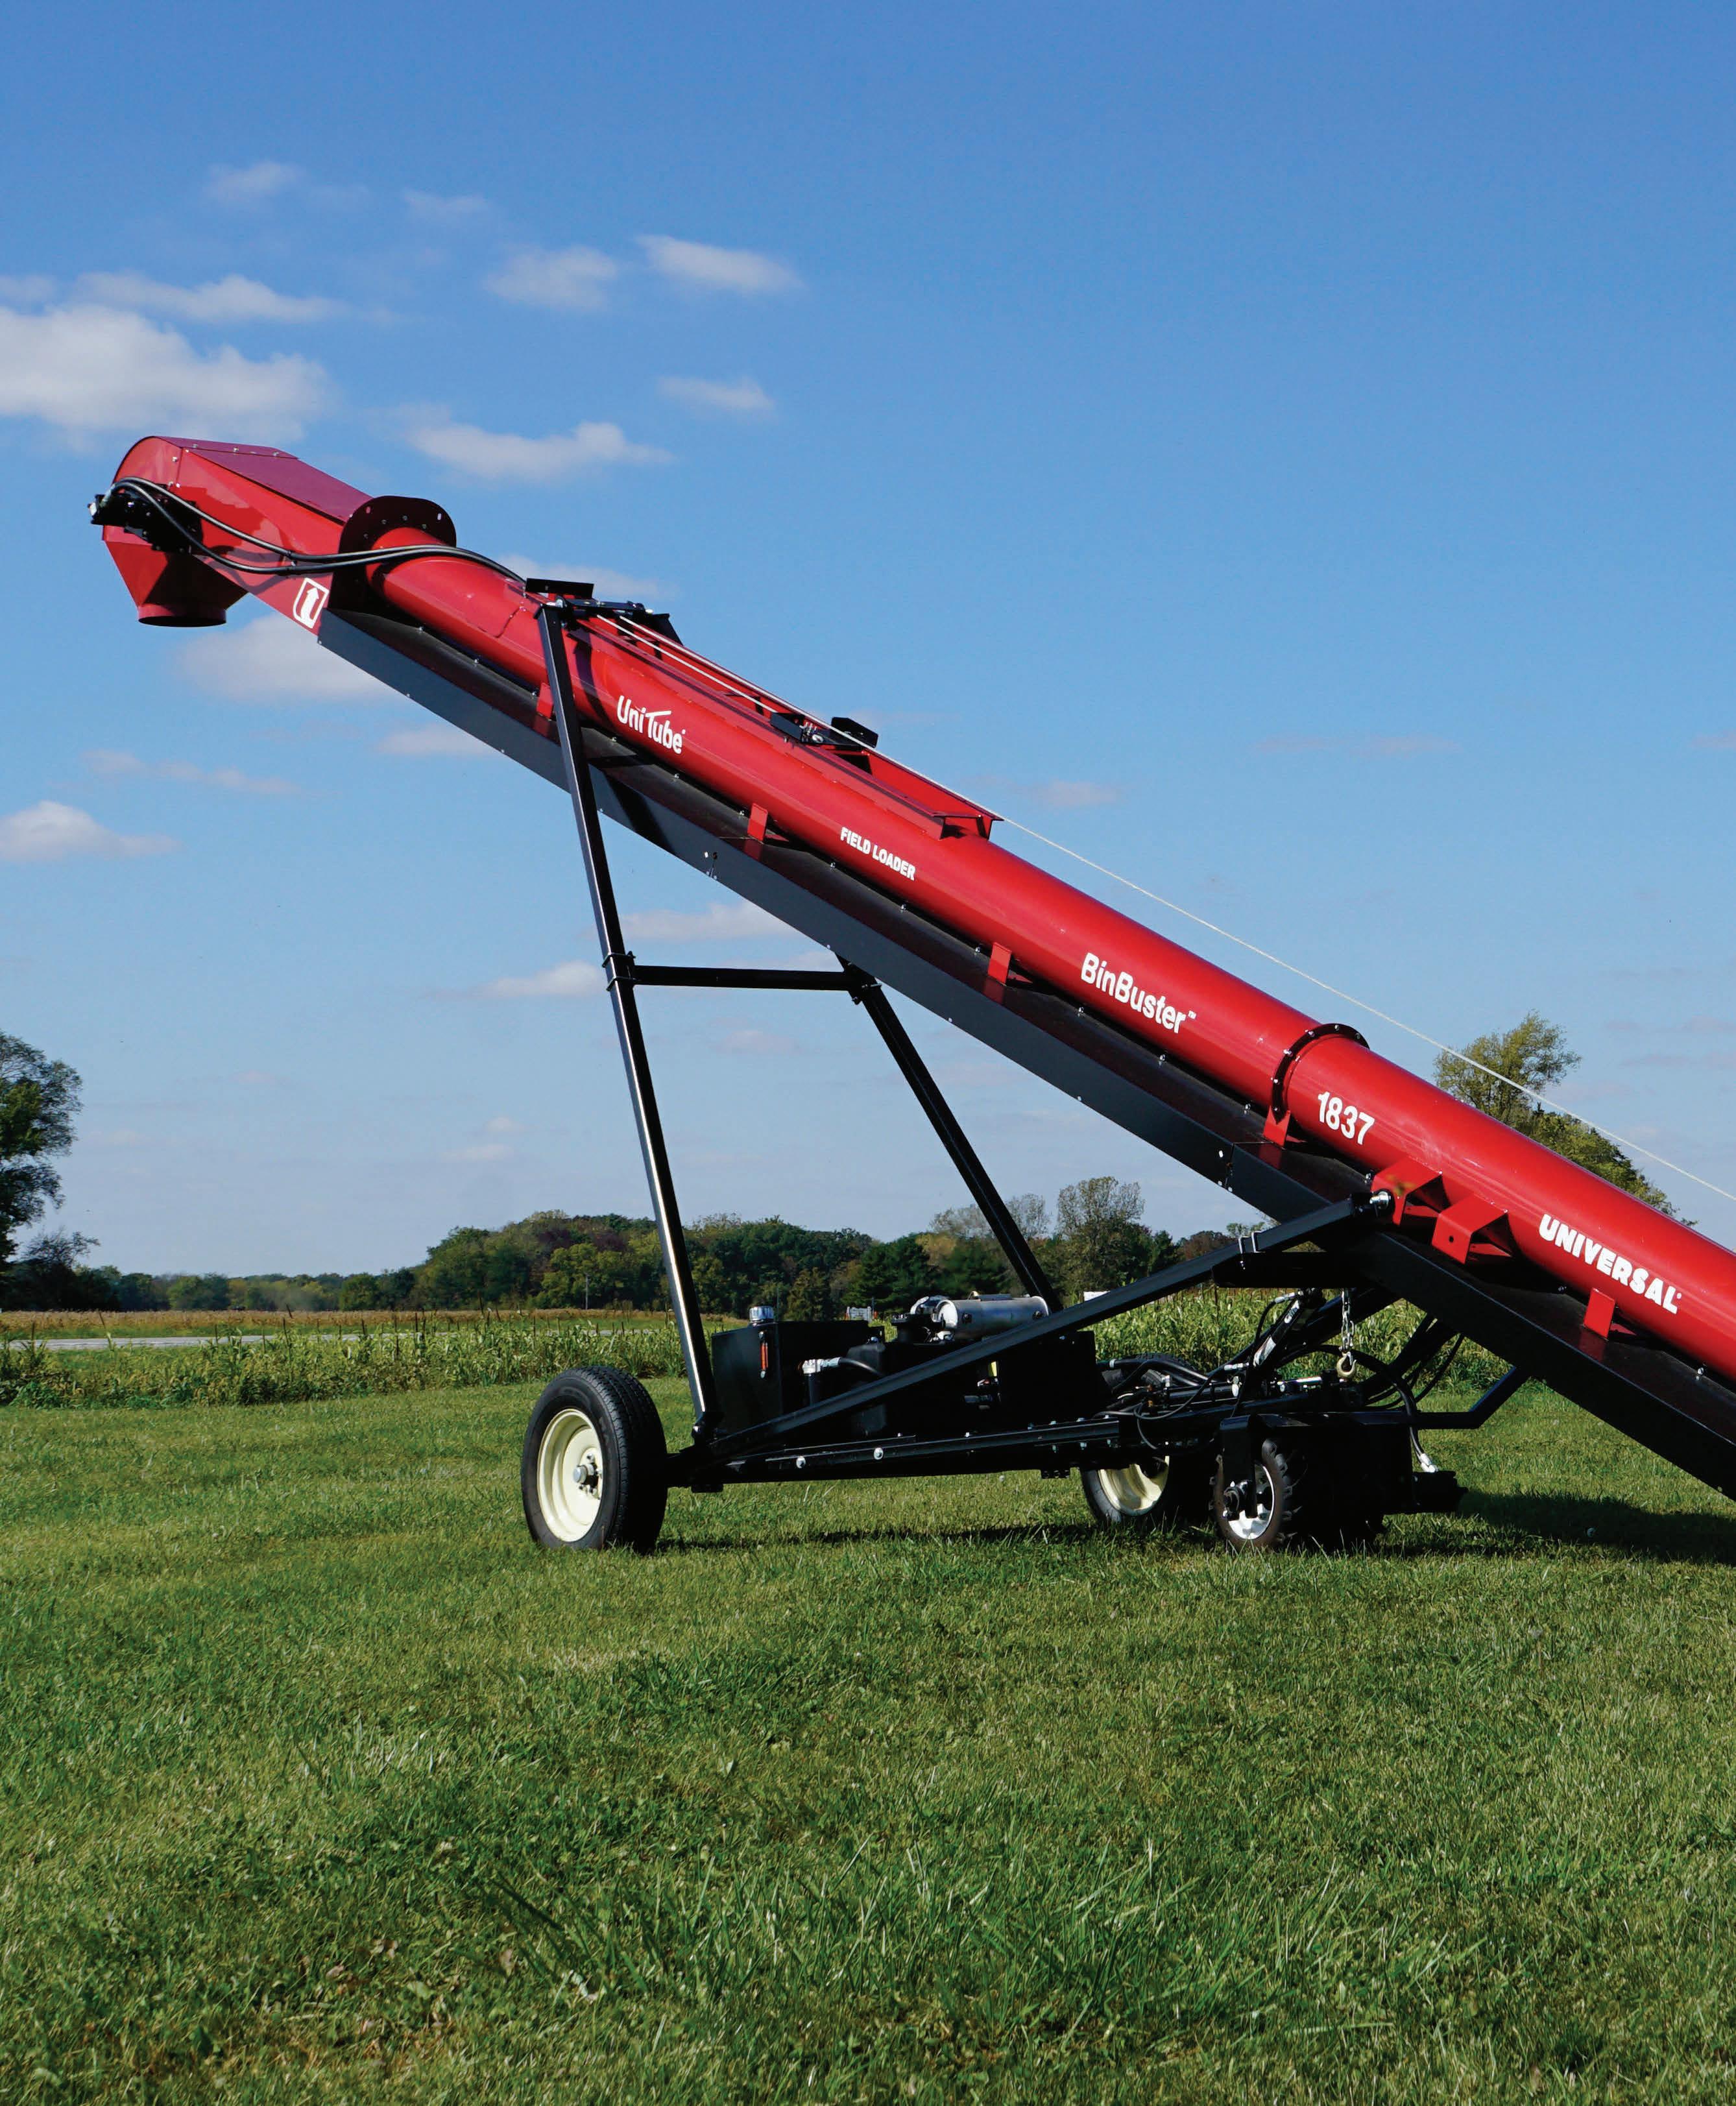
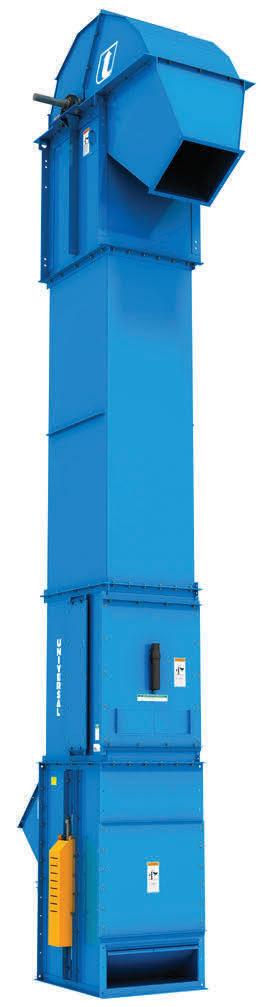
Zico Zeeman, EMT, the Netherlands, showcases how the fertilizer industry is shifting towards customisable, efficient, and technologically advanced production systems.
Phillip E. Prueter, The Equity Engineering Group, Inc. (E2G), USA, shares the company’s insights into common industry practices for understanding, anticipating, detecting, and mitigating ammonia SCC afflicting pressure equipment.


ASME PCC-2 Compliant Heat Exchanger Tube Plugging System
Trusted by fertilizer plants around the world as their go-to solution for heat exchanger tube leaks, Pop-A-Plug Tube Plugs from CurtissWright are engineered for optimal performance throughout the life cycle of equipment. Controlled hydraulic installation eliminates welding and time-consuming pre-/post-weld heat treatments that can cause damage to tubes, tube sheet ligaments, and joints.
• Simple hydraulic installation − no welding
• Helium leak tight seal to 1x10 -10 cc/sec
• 100% Lot tested to ensure unmatched quality
• Pressure ratings Up to 7000 PsiG (483 BarG)
• Wide range of sizes and ASME/ASTM certified materials available


877.383.1029
MANAGING EDITOR
James Little james.little@palladianpublications.com
SENIOR EDITOR
Callum O’Reilly callum.oreilly@palladianpublications.com
DEPUTY EDITOR
Emily Thomas emily.thomas@palladianpublications.com
EDITORIAL ASSISTANT
Jack Roscoe jack.roscoe@palladianpublications.com
SALES DIRECTOR
Rod Hardy rod.hardy@palladianpublications.com
SALES MANAGER
Ryan Freeman ryan.freeman@palladianpublications.com
PRODUCTION
Iona MacLeod iona.macleod@palladianpublications.com
ADMINISTRATION MANAGER
Laura White laura.white@palladianpublications.com
EVENTS MANAGER
Louise Cameron louise.cameron@palladianpublications.com
DIGITAL EVENTS COORDINATOR
Merili Jurivete merili.jurivete@palladianpublications.com
DIGITAL CONTENT ASSISTANT
Kristian Ilasko kristian.ilasko@palladianpublications.com
DIGITAL ADMINISTRATION
Nicole Harman-Smith nicole.harman-smith@palladianpublications.com
Palladian Publications Ltd, 15 South Street, Farnham, Surrey GU9 7QU, UK
Tel: +44 (0) 1252 718 999
Website: www.worldfertilizer.com

While sailing through the Bab el-Mandeb Strait on 18 February, a UK-owned, Belize-flagged ship carrying around 22 000 t of fertilizer was struck by missiles launched by the Houthi movement, as part of a campaign over Israel’s war against Hamas in Gaza. The strikes caused catastrophic damage to the ship, which is said to be the most severely impacted vessel since the rebel group began attacking Western commercial ships in November last year. After taking on water and suffering a fuel leak, the ship eventually sunk, leaving behind the threat of the vessel’s fertilizer load and fuel leaking into the Red Sea, and therefore the possibility of a monumental environmental disaster.1
Julien Jreissati, Programme Director at Greenpeace MENA, has expressed huge concern over the impact a potential fertilizer spill could have on marine life and ocean food chains, as well as the Red Sea’s unique coral reefs.
“This disruption could have far-reaching consequences, affecting various species that depend on these ecosystems and, in turn, potentially impacting the very livelihoods of coastal communities,” Jreissati said. “Immediate access to the shipwreck site is imperative for an expert response team to assess the situation and swiftly devise and implement an emergency plan.”2
Recent weeks have also seen a significant fertilizer spill into the East Nishnabotna River in Iowa, after liquid nitrogen and ammonia leaked from a tank at NEW Cooperative. Contamination is said to extend to Missouri, where small, native species of fish have been killed, likely affecting the wider food chain.3
The uncertain fate of the Red Sea and damage to the ecosystem in Iowa serves as a stark reminder of the potentially detrimental effects of the fertilizer industry on our environment. Farmers have even reported fears that fertilizer has become a ‘dirty word’, having often taken the blame for poor water quality standards – but things may be about to change.4
The BBC recently reported on a flurry of companies looking to make fertilizer production more environmentally friendly. For some time, the sector has excitedly examined the concept of green ammonia, and with a number of start-ups now looking to demonstrate how clean and controllable production can be, a renewable fertilizer future is looking more and more viable.
Starfire Energy, for example, is working towards modular green ammonia production, seeking to reduce transportation emissions and increase efficiency by enabling production closer to the point of use. The technology required will be stored within spaces as small as shipping containers.
Jupiter Ionics has also recently received funding to accelerate its electrolysis technology and scale up a self-contained system that takes in renewable energy, air and water to produce ammonia for fertilizer production.5
While this all sounds promising, there are still barriers to a completely green ammonia economy. McKinsey & Company notes that significant renewables capacity expansion is necessary to ensure green power is both available and economical. Furthermore, producers are facing uncertainty over green ammonia prices – the higher costs of the product must be absorbed throughout the value chain and become more competitive with grey ammonia, in order for new projects to be considered worthwhile.6
Still, the concept of green ammonia is filled with potential and opportunity for the fertilizer industry and beyond. The challenge lies in harnessing this potential in order to transition to a carbon-neutral economy by 2050, a goal which can only be reached with the availability of renewable electricity, and scalable technological and policy solutions.
* References available upon request.
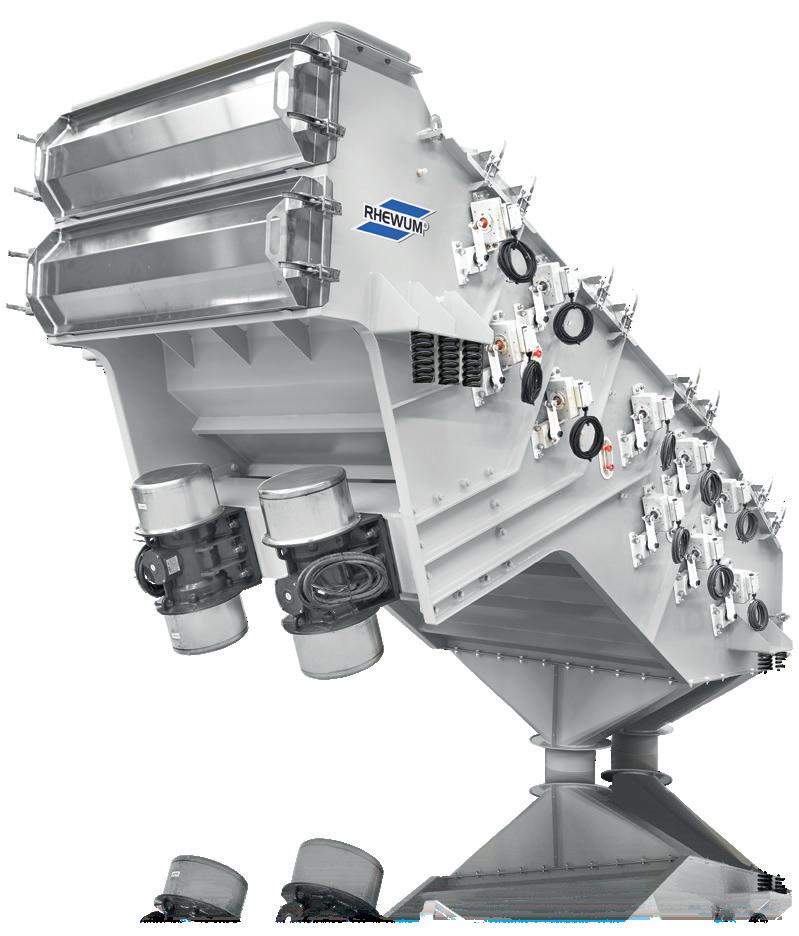
Perfect separations for fertilizers
Screening machines for high product purities at maximum throughput thanks to direct excitation sieving with extreme acceleration.

Atlas Agro has announced that it has awarded a dual competitive engineering contract to two engineering and construction consortiums to perform parallel competitive project engineering development for the company’s first Brazilian green nitrogen fertilizer plant in Uberaba, MG, Brazil.
After this first development phase, Atlas Agro plans to roll the project over into FEED (front-end engineering design). The company expects to start construction in 2025 and enter commercial operation in 2028.
Atlas Agro’s plant will consume 2.5 TWh of renewable energy annually. In an integrated industrial operation, it will produce green hydrogen, green ammonia, and green ammonium nitrate. The final products will serve local Brazilian farmers.
The plant will leverage Atlas Agro’s know-how and experience gained at the company’s first green nitrogen fertilizer project in the Pacific Northwest in the United States.
“We are excited to start engineering for our first plant in Brazil,” says Knut Karlsen, Atlas Agro’s Co-Founder and President of South America. “Today, Brazil imports more than 90% of its nitrogen fertilizer, all produced using fossil fuels like natural gas and coal. By leveraging the country’s natural advantages in green energy, Brazil can substitute its fossil nitrogen fertilizer imports with local, green production. We at Atlas Agro are excited to contribute to the green re-industrialisation of Brazil.”
The Fertilizer Institute has praised the US Senate for introducing bipartisan legislation to include phosphate and potash on the final list of critical minerals of the Department of the Interior.
Introduced by Senators Sherrod Brown (D-OH), Thom Tills (R-NC), Tammy Baldwin (D-WI), Roger Marshall (R-KS), Pete Ricketts (R-NE), and Rick Scott (R-FL), the legislation will recognise the importance of ensuring a strong and sustainable domestic fertilizer supply for American farmers.
“We thank Senators Brown, Tillis, Baldwin, Marshall, Ricketts, and Scott for coming together and introducing this important legislation,” said TFI President and CEO, Corey Rosenbusch. “The majority of the world’s phosphate and potash resources are concentrated in only a few countries, leaving them open to supply chain vulnerabilities and geopolitical instability. The events of the past few years have shown us that food security is national security and now is the time to change how we talk about these vital resources.”
The United States imports roughly 95% of its potash needs, the bulk of which come from Canada. Only 14 countries in the world produce potash, with Belarus and Russia comprising nearly 40% of global production. Regarding phosphate, China accounts for over 40% of global production. “It is vital that we, as a country, take proactive steps to secure our own agricultural future by recognising the role these minerals play in putting food on our tables,” Rosenbusch continued. “Without these two minerals, modern agricultural systems would crumble and the ability to feed our growing population would be nearly impossible.”
The US has both phosphate and potash production, but expanding mines and opening new ones is a costly and time-consuming process measured in years and in the tens of millions of dollars for permitting alone. Being listed as critical minerals would not exclude these projects from environmental reviews, but would assign a single permitting agency to be responsible and streamline the process.
“By adding phosphate and potash to the critical minerals list, we can take a significant stride towards securing our own future and sending the clear message that safeguarding our nation’s food supply is not only an economic imperative, but a strategic priority that ensures our well-being,” Rosenbusch concluded. “We look forward to working with Congress to support this vital legislation.”
Yara Growth Ventures has invested in Dynelectro, a company which develops technologies to unlock the potential of solid oxide electrolysis (SOE). While SOE yields the highest possible efficiencies to produce renewable hydrogen and e-fuels, it has been suffering from system lifetime issues up to now. The investment is part of Yara’s ambition to decarbonise fertilizer production and enable the hydrogen economy.
Dynelectro’s approach increases the lifetime of SOE systems dramatically from typically 2 – 10 years, and it also allows for integration of SOE with intermittent renewable electricity – a key requirement for large scale adoption.
“Electricity is the key driver for the cost of renewable hydrogen. While solid oxide electrolysis has the best potential for low cost, it suffers a niche existence due to system lifetime issues. We believe Dynelectro will overcome these issues and pave the way to make low-cost renewable hydrogen a reality,” says Björn Heinz, Investment Director and part of the Yara Growth Ventures team.
EuroChem has announced the opening of its new phosphate fertilizer production facility in Serra do Salitre, State of Minas Gerais, Brazil.

Topsoe electrolyser manufacturing facility receives environmental permit
Input materials have been received ahead of Cinis Fertilizer’s start of production
Iowa DNR continues to investigate New Cooperative fertilizer spill
NextEra awarded loan for fertilizer facility Visit our website for
With a total project investment of nearly US$1 billion, the new phosphate mine and plant complex will have an annual production capacity of 1 million tpy of advanced phosphate fertilizers, significantly increasing the reliability of domestic phosphate fertilizer supplies to Brazilian farmers.
The facility offers integrated phosphate fertilizer production, with low water consumption, a fully closed water circuit, and a clean energy generation system that re-uses its own steam and generates up to 40% of the entire facility’s energy needs.
“EuroChem has a long-standing and successful history in South America, a key growth market for us, where there is a high demand for our products,” said EuroChem Group President, Oleg Shiryaev. “The launch of our new facility moves us one step closer to our customers and allows us to provide Brazilian farmers with access to the highest quality fertilizers via our well-established distribution network in this important global breadbasket. EuroChem operates on a mine-to-farm basis, ensuring reliability and quality across the entire fertilizer supply chain, from raw material extraction to production and delivery to the end consumer.”
In celebration of its 12th anniversary, PT Pupuk Indonesia (Persero) has reaffirmed its commitment to enhancing agricultural productivity and ensuring food security through various innovations.
In line with this commitment, Pupuk Indonesia has met the government’s 100% target by distributing 6.19 million t of subsidised fertilizer to farmers. This was achieved by the company amidst the complex global challenges of 2023, including the geopolitical conflicts affecting fertilizer commodity prices.
Rahmad Pribadi, President Director of Pupuk Indonesia, stated during an event with the media in Jakarta on 18 March 2024, “Pupuk Indonesia not only survived but also thrived in 2023. This year, we will remain steadfast in our commitment to enhancing agricultural productivity and ensuring food security through innovation and best performance.”
In 2023, the company realised a production output of 18.8 million t, consisting of 11.6 million t of fertilizer and 7.1 million t of non-fertilizer products. Various efforts were made to ensure the smooth and targeted distribution of fertilizer. This included the digitisation of the fertilizer redemption process using the I-Pubers (integrated subsidised fertilizer) application and collaboration with stakeholders.
The I-Pubers application is a result of collaboration between Pupuk Indonesia and the Ministry of Agriculture. This application is aimed at facilitating farmers in the subsidised fertilizer redemption process by implementing integrated data in distributor partners (kiosks) between the e-allocation subsidised recipient list and the fertilizer stock data available at Pupuk Indonesia. As of 01 February 2024 the implementation of I-Pubers has reached 100% nationwide and is available at more than 27 000 kiosks across the country.


Nitrogen + Syngas USA 2024
15 – 17 April 2024
Oklahoma, USA events.crugroup.com/nitrogenusa/ home
Casale has announced a significant milestone as its subsidiary, Casale Project A.S., has secured a turn-key contract with BorsodChem MCHZ, S.R.O., based in the Czech Republic, for the construction of a cutting-edge nitric acid plant.
This strategic collaboration marks the continuation of a long-standing venture between Casale and BorsodChem.
The contract involves the design, engineering, procurement, and construction of a 450 million tpd of weak nitric acid (WNA) plant, showcasing Casale’s knowledge of the nitric acid process as well as the company’s expertise in providing turnkey solutions. The project aims to meet the growing demand for aniline production contributing to the expansion and sustainability of BorsodChem’s operations.
ACHEMA 2024
10 – 14 June 2024 Frankfurt, Germany achema.de/en
Turbomachinery and Pump Symposia 2024
20 – 22 August 2024 Texas, USA tps.tamu.edu
ANNA 2024
29 September – 04 October 2024 Montréal, Canada annawebsite.squarespace.com
A distinctive feature of the project is its ability to generate electrical energy without the use of fuels. Instead, it harnesses surplus steam produced during the nitric acid production process through a carefully optimised approach. This not only enhances the overall energy efficiency of the entire site, but underscores the companies’ commitment to sustainable practices and resource optimisation.
supports Indorama Eleme Fertilizer and Chemicals’ expansion plans
British International Investment (BII) has committed US$65 million to support Indorama Eleme Fertilizer and Chemicals’ expansion plans in Nigeria.
The investment forms part of a US$1.25 billion financing package which will allow Indorama to increase its fertilizer production and build a new port terminal for exports, bolstering global food production and food security.
BII’s investment forms part of a consortium led by IFC and includes commercial banks, impact investors and other DFIs. This is BII’s fourth investment in Indorama since 2013 and signifies the DFI’s longstanding commitment to strengthening value chains in Nigeria’s agricultural sector and increasing the country’s export potential.
YKNOW2024
28 October – 30 October 2024
Texas, USA yokogawa.com
Sulphur + Sulphuric Acid Conference & Exhibition 2024 04 – 06 November 2024 Barcelona, Spain events.crugroup.com/sulphur/ home
Indorama’s two operational urea fertilizer lines currently serve Nigeria’s domestic market, supporting the country’s agricultural sector, which accounts for a quarter of its GDP and employs approximately a third of its labour force. This investment will finance the development of Indorama’s third nitrogenous urea fertilizer production line, which is expected to increase its annual capacity to 1.4 million tpy of urea, one of the most used fertilizers worldwide.
Nigeria’s economy has historically relied heavily upon revenue from the oil and gas sector, making it vulnerable to external shocks and the price volatility of commodities. By supporting Indorama’s expansion, BII aims to accelerate Nigeria’s economic diversification and progress its delivery of the National Development Plan, which outlines ambitions to boost Nigeria’s global competitiveness and build on its strong foundations for industrialisation.
The new production facility will be complemented by a shipping terminal currently under construction at Indorama’s operations in Port Harcourt, Nigeria. Both will help meet the growing global demand for fertilizer and are expected to create up to 8000 direct and indirect jobs.
Manish Mundra, Group Director for Africa, Indorama Corporation said, “The establishment of this fertilizer plant underscores Indorama’s unwavering commitment to Nigeria’s industrial growth, economic diversification, and leveraging its strategic geographic location. This landmark financing represents a pivotal moment in Nigeria’s journey towards becoming a major player in the global fertilizer market. With the addition of Line 3, Nigeria is prepared to significantly ramp up its export capacity, thereby enhancing its position as a key exporter of fertilizers to Africa and the world.”

Innovation is about more than bringing something new to the table. Black & Veatch is built on a foundation of collaboration where your teams work with a true partner in asset development. Between disruptive global challenges and rapidly evolving technologies, the opportunities to continuously improve project development are ever-present. Redefine what’s possible for your asset acquisition programs—all the while staying ahead of the curve. Learn more at bv.com

Gordon Cope, Contributing Editor, discusses the recent activity in the North American fertilizer market, and examines the prospects for growth in the coming decade.
The world fertilizer market has experienced tumultuous times over the last several years, with war, sanctions, export restrictions and wild weather all taking farm commodities, international trade and consumption patterns on a roller coaster ride. Fortunately, North America is a major producer of potash, phosphate and nitrogen products, giving it both flexibility and opportunities to prosper.
The US and Canada produce over 15 million tpy of potash fertilizers, with abundant room for capacity growth. Since 2021, the potash market has been experiencing increased volatility due to international sanctions imposed against Belarus and repercussions against Russia after it invaded Ukraine. Both were major exporters, and the injunctions have had a profound effect; Russia’s output dropped 45% to around 5 million tpy, and output from Belarus dropped over 60%, to around 3 million tpy.
North American producers responded to the market upheaval by increasing production. Nutrien, the world’s largest potash producer, upped 2022 production from an initial 14 million tpy to almost 15 million tpy by the end of 2022. Mosaic announced that it would add 1.5 million tpy of capacity to its Esterhazy K3 mine in Saskatchewan. Both were caught off-base when farmers responded to higher fertilizer prices by cutting back on consumption. Mosaic subsequently temporarily shuttered its Colonsay mine near Saskatoon, Saskatchewan, which reopened in August 2023. The market rebounded in late 2023, and Nutrien now predicts that full-year shipments for 2024 will return to longer-term trend levels of 68 – 71 million t.
Plans for major new mines are still going ahead. BHP recently announced that stage one of the Jensen mine, at a cost of CAN$7.5 billion, is over 30% complete, and is on track to begin production in 2026. In October 2023, BHP gave the green light to the second stage of the project. The CAN$6.4 billion investment will double the mine’s output capacity to 8.5 million tpy when it comes on stream in 2029. At that point, it will be one of the largest potash mines in the world; the company has plans for stage three and stage four, but will await market conditions as the decade progresses before making further investment decisions.

North America produces about 7 million tpy of phosphate fertilizer, but such output is dwarfed by China, which churns out over 17 million tpy. Since 2021, China has taken various steps, including quotas and red tape, to limit its exports of fertilizers in order to protect its domestic market. As a major exporter of phosphate and urea, the interventions have had a significant impact on the international market as buyers have scrambled to meet requirements. Over the latter part of 2023, benchmark prices for di-ammonium phosphate (DAP), have climbed 26%, to over US$600/t.
The search continues for new sources of phosphate in North America. In Quebec, First Phosphate continues to expand its discovery at the Bégin-Lamarche project located in the region of Saguenay-Lac-St-Jean. Recent sampling during the 2023 – 2024 exploration season has extended the strike zone, which measures approximately 1.5 km long and 400 m wide. Testing has indicated levels of P2O5 as high as 39.45%; at this purity, the mineral qualifies as direct shipping ore (DSO). Samples are devoid of high concentrations of harmful elements, facilitating preparation.
Fox River Resources awaits further financing for an integrated phosphate operation at its Martison phosphate discovery in Ontario, Canada. The facility includes an open pit mine capable of producing 4 million tpy of phosphate ore, which will be concentrated into 1.4 million tpy of 37% P2O5. It will then be turned into phosphoric acid feedstock in order to produce up to 730 000 tpy of mono-ammonium phosphate (MAP) and 250 000 tpy of nitrogen phosphate sulfur (NPS) mix, primarily for the western Canadian fertilizer market.
The global ammonia market is currently approaching 170 million tpy, with about two thirds consumed by agriculture. It is expected to grow at a rate exceeding 7% CAGR, reaching 310 million tpy by 2030. North America is a major producer of fertilizer, with approximately 16 million tpy of nitrogen produced.
GlobalData has calculated that new and expansion projects in North America could add over 31 million tpy of capacity by 2028.1 The numbers include Ascension Clean Energy’s Donaldsonville Ammonia Plant, with a capacity of 7.2 million tpy, expected to enter service in 2027.
The health of nitrogen fertilizer in North America is critically dependent on the fortunes of domestic farming. Currently, the sector is being roiled by a series of challenges. After two highly profitable years spurred by market disruptions due to the Ukraine war and drought, prices for corn and soybeans have hit multi-year lows. From a price exceeding US$6/bushel in mid-2023, corn futures had plunged to US$4/bushel by February 2024. Soybean futures dropped under US$12/bushel, their lowest level since November 2021. Several factors have contributed to lower commodity prices:
n When drought and cold conditions threatened crop yields in the spring of 2023, farmers held on to crops awaiting higher prices. When a rebound in weather helped create ideal growing conditions later in the year, corn stockpiles hit a record high of almost 8 billion bushels.
n Thanks to a strong dollar, US grain crops face weak demand internationally.
n Ethanol production, which consumes roughly 30% of US corn production, is stagnating as EV sales bite into the fuel market.
n Costs for production remain high; agriculture economists at the University of Illinois calculate that some farmers may see a US$160 loss per acre of corn, vs a profit of US$340 the year before.
The reduced prices for nitrogen, phosphate and potash fertilizers offer a ray of sunshine. “We saw a continuation of strong fertilizer market fundamentals in North America during the fourth quarter driven by improved affordability, an extended fall application season and low channel inventories,” said Ken Seitz, President and CEO of Nutrien, during a Q423 investor presentation. “As we look ahead to 2024, we expect to deliver higher fertilizer sales volumes and retail earnings, supported by increased crop input market stability and demand.”2
In Canada, the federal government wants to reduce carbon emissions in all sectors by 45% by 2030, primarily through carbon taxes and restrictive legislation. Currently the carbon tax stands at CAN$65/t, and is scheduled to climb by CAN$15/t annually to CAN$170/t by 2030. Grain farmers use large amounts of natural gas to dry and maintain stored grain, however, and greenhouses use natural gas and propane to sustain their operations through the winter months. Both are facing massive increases in energy bills, threatening their livelihoods. In addition, Ottawa is pondering ways to reduce agricultural emissions by 30%, through a combination of tilling methods and fertilizer restrictions. The latter, especially, has the sector concerned; reductions in applications would severely impact productivity.
In the US, federal agriculture policy is at an impasse. The 2018 – 2023 Farm Bill expired on 01 October 2023 and Congress extended the legislation until 30 September 2024. The proposed bill is massive, with an estimated US$1.5 trillion cost over the next 10 years. The majority is targeted to the USDA's main food-aid programme, the Supplemental Nutrition Assistance Program (SNAP). The remainder funds a host of farm-aid programmes, generally referred to as the farm safety net. Republicans favour farm aid, while Democrats prioritise help to the poor. The Biden administration also proposes programmes to entice farmers to adopt greener practices that could create significant revenue streams through conservation and green initiatives. The current dysfunctional climate in Congress has paralysed the passage of bilateral legislation, however, and the 2024 election cycle makes any resolution unlikely until it is determined who controls both houses and the White House.
While net zero legislation is creating challenges for farmers, government incentives to decarbonise major sectors of the economy by producing clean-burning hydrogen fuel is creating immense opportunities for nitrogen manufacturers.
Hydrogen fuel is becoming popular around the world. Not only does the energy-dense element produce nothing but water when burned, it can also be manufactured anywhere using electrolysis powered by wind and sun, reducing geopolitical risk.
Transporting and burning hydrogen itself is rather costly and complex, however; a much easier method is to convert the gas into liquid ammonia, which can then be consumed in ICE engines with minor alterations.
This appeals greatly to the maritime sector. Rystad Energy, a consultancy, predicts that, by 2035, there could be over 170 marine
export terminals focusing on converting hydrogen into clean ammonia, causing total exported volumes to surge from around current levels of 19 million tpy (most of which is used in fertilizer products), to 76 million tpy by 2035 (most of which will be transport and utility fuel related). By 2050, that figure could be over 120 million tpy.3
The US is expected to be the leader in North America, spurred on by incentives in the Biden administration’s Inflation Reduction Act that could provide up to US$3/kg in subsidies for clean hydrogen.
Companies are making plans for major investments. In September 2023, OCI Global reached an agreement with New Fortress Energy to buy all clean hydrogen output from the latter’s ZeroPark 1 project in Texas. The 200 MW plant is expected to produce approximately 17 000 tpy of hydrogen, which OCI will then convert to 80 000 tpy of green ammonia at its Beaumont complex. Plans are underway to double capacity to 160 000 tpy by 2026, as OCI is eyeing exports to Europe, where the EU has established a target of renewable fuels of non-biological origin (RFNBOs) in industrial usage of 42.5% by 2030.
In addition, OCI and Linde are building a new plant in Beaumont capable of producing 1.1 million tpy of blue ammonia, while capturing 1.7 million tpy of CO2 for sequestration. The plant is being designed to convert to green ammonia as economical sources of wind and solar power become available. Production is likely to be consumed in North America and Asia when the plant comes on-stream in 2025.
Yara, based in Norway, is planning on building a blue ammonia plant with Enbridge, a major North American pipeline company, in Texas. The unusual joint venture was announced in 2023 when the two partners realised that their respective assets and goals would optimise the joint project.
Enbridge operates one of the largest pipeline networks in North America, gathering crude and natural gas and delivering them to consumers throughout the US and Canada. Over the last several years, it has been working to expand the Enbridge Ingleside Energy Center (EIEC), a massive terminal located in Corpus Christi, Texas, on the Gulf of Mexico. The company is intent on exporting not only conventional energy commodities, but also low-carbon products, and has plans for carbon capture and solar power generation.
In order to lower its carbon footprint, Yara has been working with Orsted, a Netherlands-based offshore wind-farm developer, to convert a portion of its ammonia output at its existing plant in the Netherlnads to 75 000 tpy of green ammonia using wind-generated electricity and hydrolysis. Green ammonia is still very expensive to produce, however, and Yara has been searching for a greenfield site to produce large amounts of blue hydrogen, (which captures carbon emissions during hydrogen production) for use in both fertilizer and marine transportation purposes. Like Enbridge, Yara is committed to reaching net zero emissions, and the EIEC provided an excellent location to offer carbon capture, solar energy and export potential. If confirmed through front-end engineering and design (FEED), production will start up in 2027/2028. Once operational, the plant will have a capacity of up to 1.4 million tpy of blue ammonia.
German-based RWE, LOTTE Chemical of Korea, and Japan’s Mitsubishi plan to build a clean ammonia production and export facility in the port of Corpus Christi, Texas. The complex will feature a series of units with a final capacity approaching
10 million tpy by 2030. Output will be in the form of both blue and green ammonia, and will be exported to Asia and Europe for use as both fuel and a source of renewable hydrogen.
Not all projects are moving ahead, however. In early 2023, Nutrien announced plans to build the world’s largest clean ammonia facility at its existing complex in Geismar, Louisiana, near tidewater ports in New Orleans. The 1.2 million tpy plant would permanently remove up to 90% of CO2 emissions using carbon capture and sequestration (CCS) technology. But later that year, the Canadian company placed the project on hold, citing increased building costs and uncertainty over the premium market for clean ammonia.
Fertilizer production has a significant impact on the environment. Ammonia producers emit over 500 million tpy of GHG, primarily from the use of coal and natural gas as both feedstock and energy. While blue and green ammonia initiatives are helping to reduce GHG intensity per t, it will be a costly challenge to meet net zero targets by 2050.
Waste from potash and phosphate mines is also a major issue. For instance, there is over 1 billion t of phospho-gypsum, a mining waste product, being sequestered in gypsum stacks throughout Florida. The material releases radon, a toxic radioactive gas, for up to 1600 years. There are few safe uses for the material, but the state legislature recently authorised the Florida Department of Transportation to conduct tests on roads using phospho-gypsum as a construction ingredient. Mosaic has offered to build three 200 ft sections of roadway on its property, but the EPA, which currently bans its use in roadways, must first evaluate the risk to the public prior to approval.
Environmental critics note that even if approved, the amounts required in roadbuilding would be miniscule in relation to the massive amounts needing remediation.
The growth in agricultural demand for nitrogen, potash and phosphate fertilizer is expected to remain healthy due to a growing world population and a shift of diets towards animal protein. Low natural gas prices gives North American nitrogen producers a significant advantage over Europe and Asia. Immense, untapped potash reserves in Canada present large-scale, low-cost expansion opportunities. Tax incentives offer ammonia producers significant new demand opportunities in the transportation and utility sectors. The regulatory push towards net zero emissions in the agricultural sector creates challenges, but also offers new revenue streams.
North America’s fertilizer producers have adapted well to recent challenges. While volatility is unlikely to abate in the near-term, long-term trends in the food commodities market and the opportunities presented by new uses of ammonia will create significant prospects for growth in the coming decade.
1. https://www.globaldata.com/media/oil-gas/north-america-account44-global-ammonia-capacity-additions-2028-reveals-globaldata/
2. https://nutrien-prod-asset.s3.us-east-2.amazonaws.com/s3fspublic/2024-02/024-002%20-%20Nutrien%20Reports%20Fourth%20 Quarter%20and%20Full-Year%202023%20Results.pdf
3. https://www.rystadenergy.com/news/hydrogen-exports-shiftammonia-production-2035


Much has been written of the future needs of ammonia (NH 3 ) to match the global future energy mix; whether it be in the form of fuel itself or hydrogen from ammonia cracking. The use of ammonia as a zero-emission fuel, power source, energy storage solution or feed source leading to fertilizer could provide the world’s growing population sustainable access for these future needs. Producers are continuously working to increase efficiency, become more environmentally friendly, and are often asked to produce even more.
Steam methane reforming (SMR) is currently, for the foreseeable future, the most effective way of producing NH 3 in large quantities. As this process requires hydrocarbons as a feed source, along with supplementary heating, operating an SMR unit efficiently (whether primary or secondary) and being able to increase the output without expensive capital investment, will be key to achieving targets and goals in the future ammonia economy.

Gary Bennington, UNICAT Catalyst Technologies, LLC, APAC, discusses how breakout catalyst technology can deliver enhanced profitability within the ammonia industry.
This article addresses such issues with a case study on an innovative SMR catalyst that is achieving results in efficiency, profitability, and increased NH 3 production capabilities from existing and new-build assets, without the introduction of complex technology, expensive materials of construction, or major changes to typical operating or handling procedures.
The traditional way of significantly increasing output from an existing plant is to add a pre-reformer. Installation of a pre-reformer will typically increase syngas production by 10 – 15% with an expected cost in the range of 20 – 30%
of the cost of the original plant. This feed preparation stage increases the syngas yield from the SMR and allows a wider range of high molecular weight streams to be used as feeds to the ammonia plant, such as LPG and naphtha. However, the costs of installation plus the additional catalyst and running costs of the pre-reformer are prohibitive. Introducing operational complexity adds further unseen or unappreciated costs to the project and does not consider the numerous process complications inherent when installing new equipment. Adding a new process unit requires process operators to learn new procedures and intricacies associated with incoming equipment.
Recently, catalytic solutions have emerged that offer the promise of increasing the output of NH 3 from an existing SMR. This can be advantageous if plot space or capital expenditure limits the ability to install new process units. To fully realise the potential to increase ammonia production, the enhanced catalytic solution proposed should be deployable in the same way as the current catalyst in use to avoid changes in operating installation or removal procedures. Furthermore, the solution should be flexible to handle the wide range of different feed stocks. The optimum future SMR catalyst should also not use complex raw materials in its construction or require made-to-order manufacturing to ensure availability when required, which can, unfortunately, include unplanned change-outs due to a poisoning event, power failure or tube ruptures.
Case study data
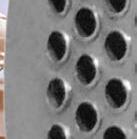
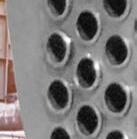
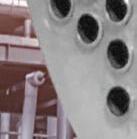
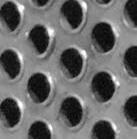
The basic functionality of Magcat by UNICAT is built upon the same catalytic pathways of using nickel as the active ingredient in the steam reforming reaction. The role and functionality of the support is approached in a new way. SMR catalyst pellets have traditionally involved multiple holes, doming, and fluting, in order to achieve a combination of high surface area, low pressure drop, maximum surface contact with reformer tube walls and acceptable crush strength. The design of these pellet shapes is constrained by the manufacturing method used whereby the shape must be regular enough to be produced using a high-frequency pelleting machine. This restricts further innovation and due to reaching a plateau in developments, some companies have been seen to depart from the standard pelleted catalyst and move into various complex and intricate alternative methods, such as structured packing,
to achieve higher syngas yields from the SMR. UNICAT found a way to break the paradigm and achieve increases in ammonia in a way that can be easily implemented without additional costs.
The polymer-matrix-based ceramic used in the formulation aids the carrier strength with crosslinking across the polymer chains. The high temperature calcination sinters the base material to produce a strong ceramic matrix whilst also adding subsurface porosity. Higher strength results in reduced pressure drop evolution over time and this is especially key in units that are expected to experience multiple shutdowns over the cycle length or regular variations in throughput and heat load. The strength of the catayst will not put reformer tubes under stress, as the force in thermally contracting tubes is significantly higher than the strongest catalyst. The preferred spherical shape characteristics of the technology rearrange and push back up to the normal level in the reformer tube. Moreover, the ceramic carrier is designed to snap into larger pieces, when it eventually breaks, in comparison to a cement-based catalyst which will often crumble, resulting in steep pressure drop increases over the cycle length.
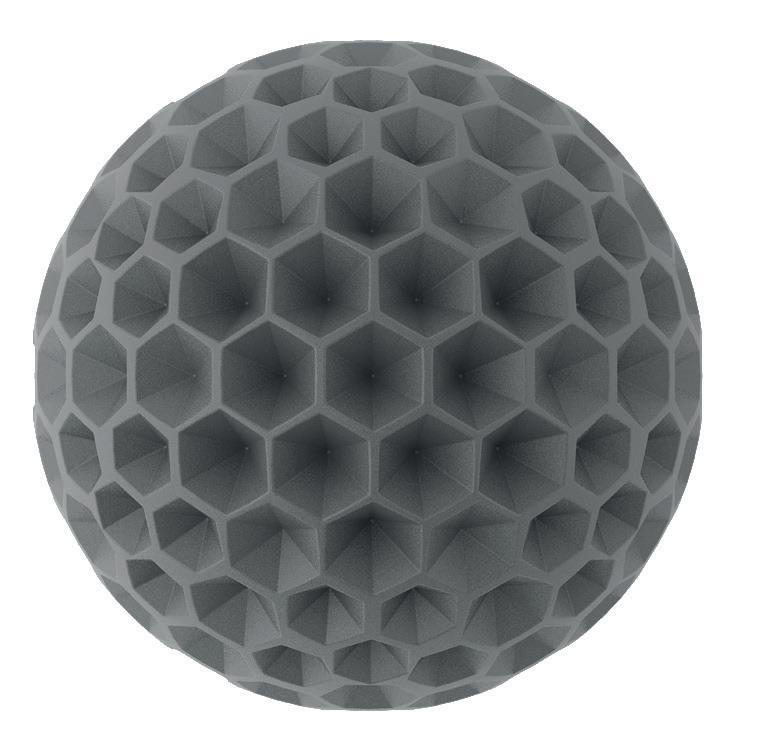
SMR catalyst activity is directly proportional to the total surface area of active nickel available to reactants. This SMR catalyst increases nickel availability through two key mechanisms; the first is the external texturing. A significant increase in geometric surface area (GSA) provides additional activity to generate higher amounts of ammonia and also gives the opportunity to scale down, at significant cost savings, new build SMR installations if a higher ammonia production can be achieved from a lower volume of catalyst.
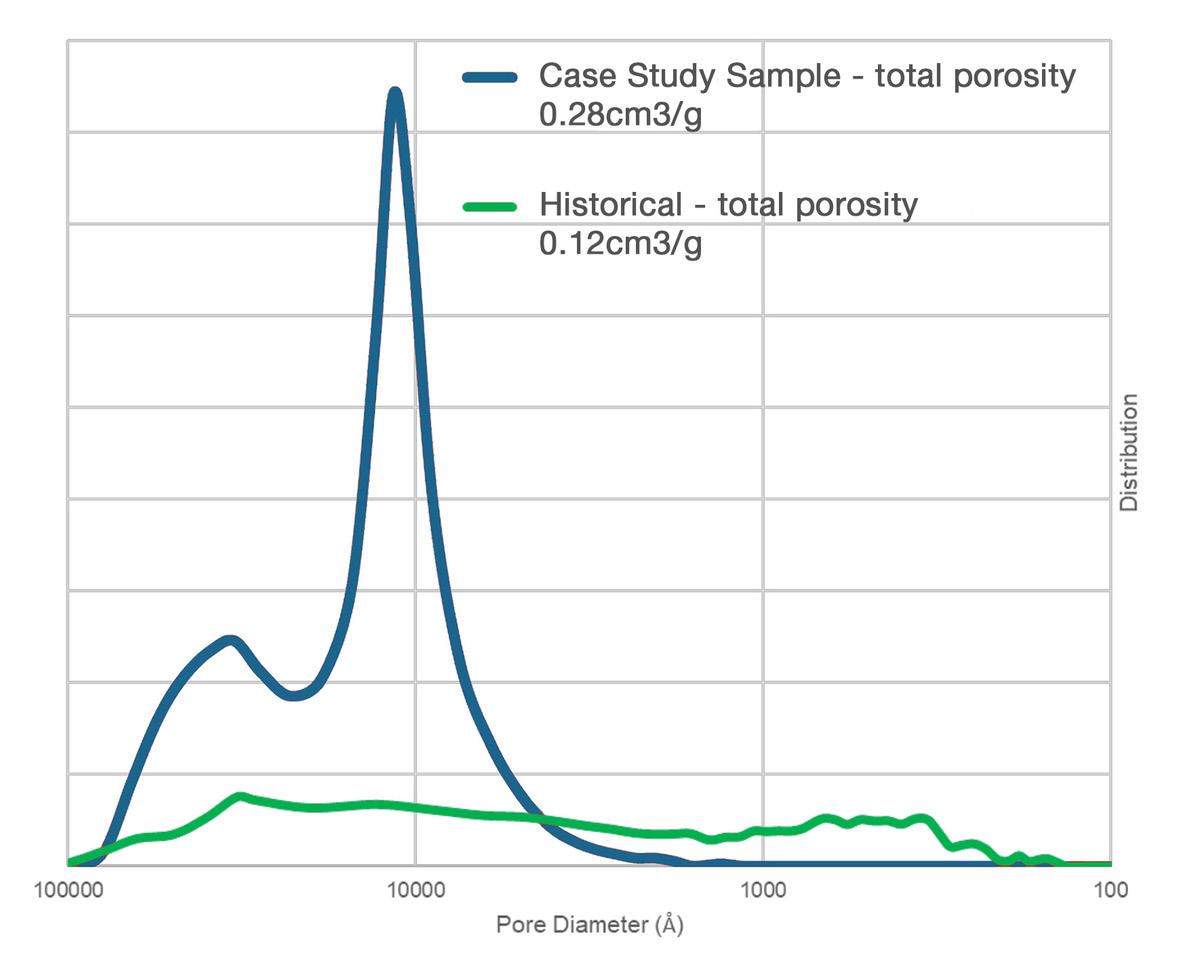
Secondly, activity is increased through subsurface porosity. During calcination of the polymer binding ingredient, a network of interconnected macropores (150-micron diameter) are opened without a negative decrease in strength. Furthermore, in a reformer tube, gases move at high velocity over the catalyst surface so only large pores will
allow the permeation of reactant gases to subsurface catalytic sites (Figure 1.)
The SMR catalyst has a high availability of additional surface area and catalytic sites to complete the reaction through to equilibrium. Good access to catalytic sites throughout the parts of the catalyst that are in contact with feed gases minimises carbon formation and maintains catalyst life.
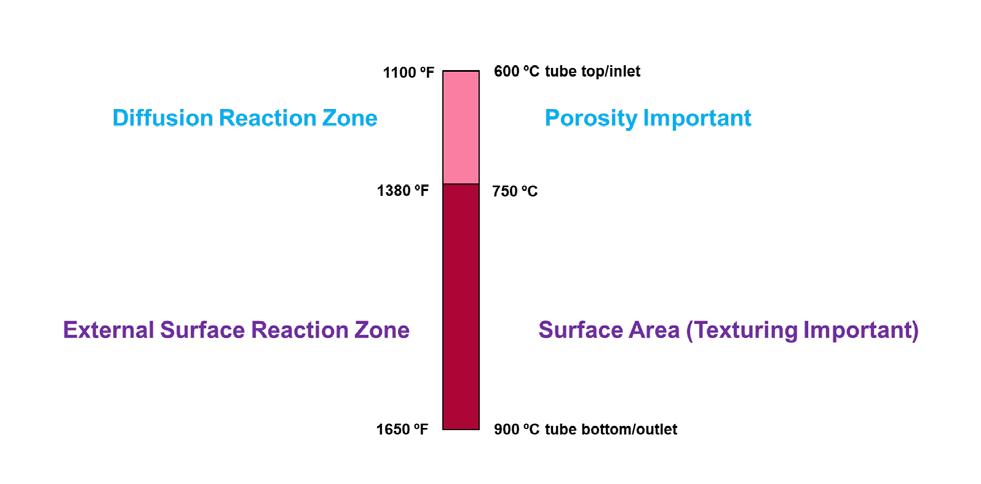
Regarding the optimisation of reformer loading, UNICAT considers the different flow regimes in play and the relative permeability of reactant gases at increasing temperatures when moving from the inlet to outlet of the reformer tube. When reactants first enter the reformer, the temperature is lower, meaning the kinetic rate of reaction is low. The volumetric flow of the gas is also low and the reaction has not yet moved to completion, meaning fewer molecules of gas. Reactants have the residence time required to permeate into the catalyst structure to contact subsurface nickel, making high porosity critical (Figure 2). As the
volumetric flow of the gas increases, the reactant gases have little opportunity to penetrate into the catalyst structure. Therefore, surface reactions dominate, making maximum external surface area, i.e. surface texturing, the critical variable to ensure methane slip is minimised by the time gases leave the tube.
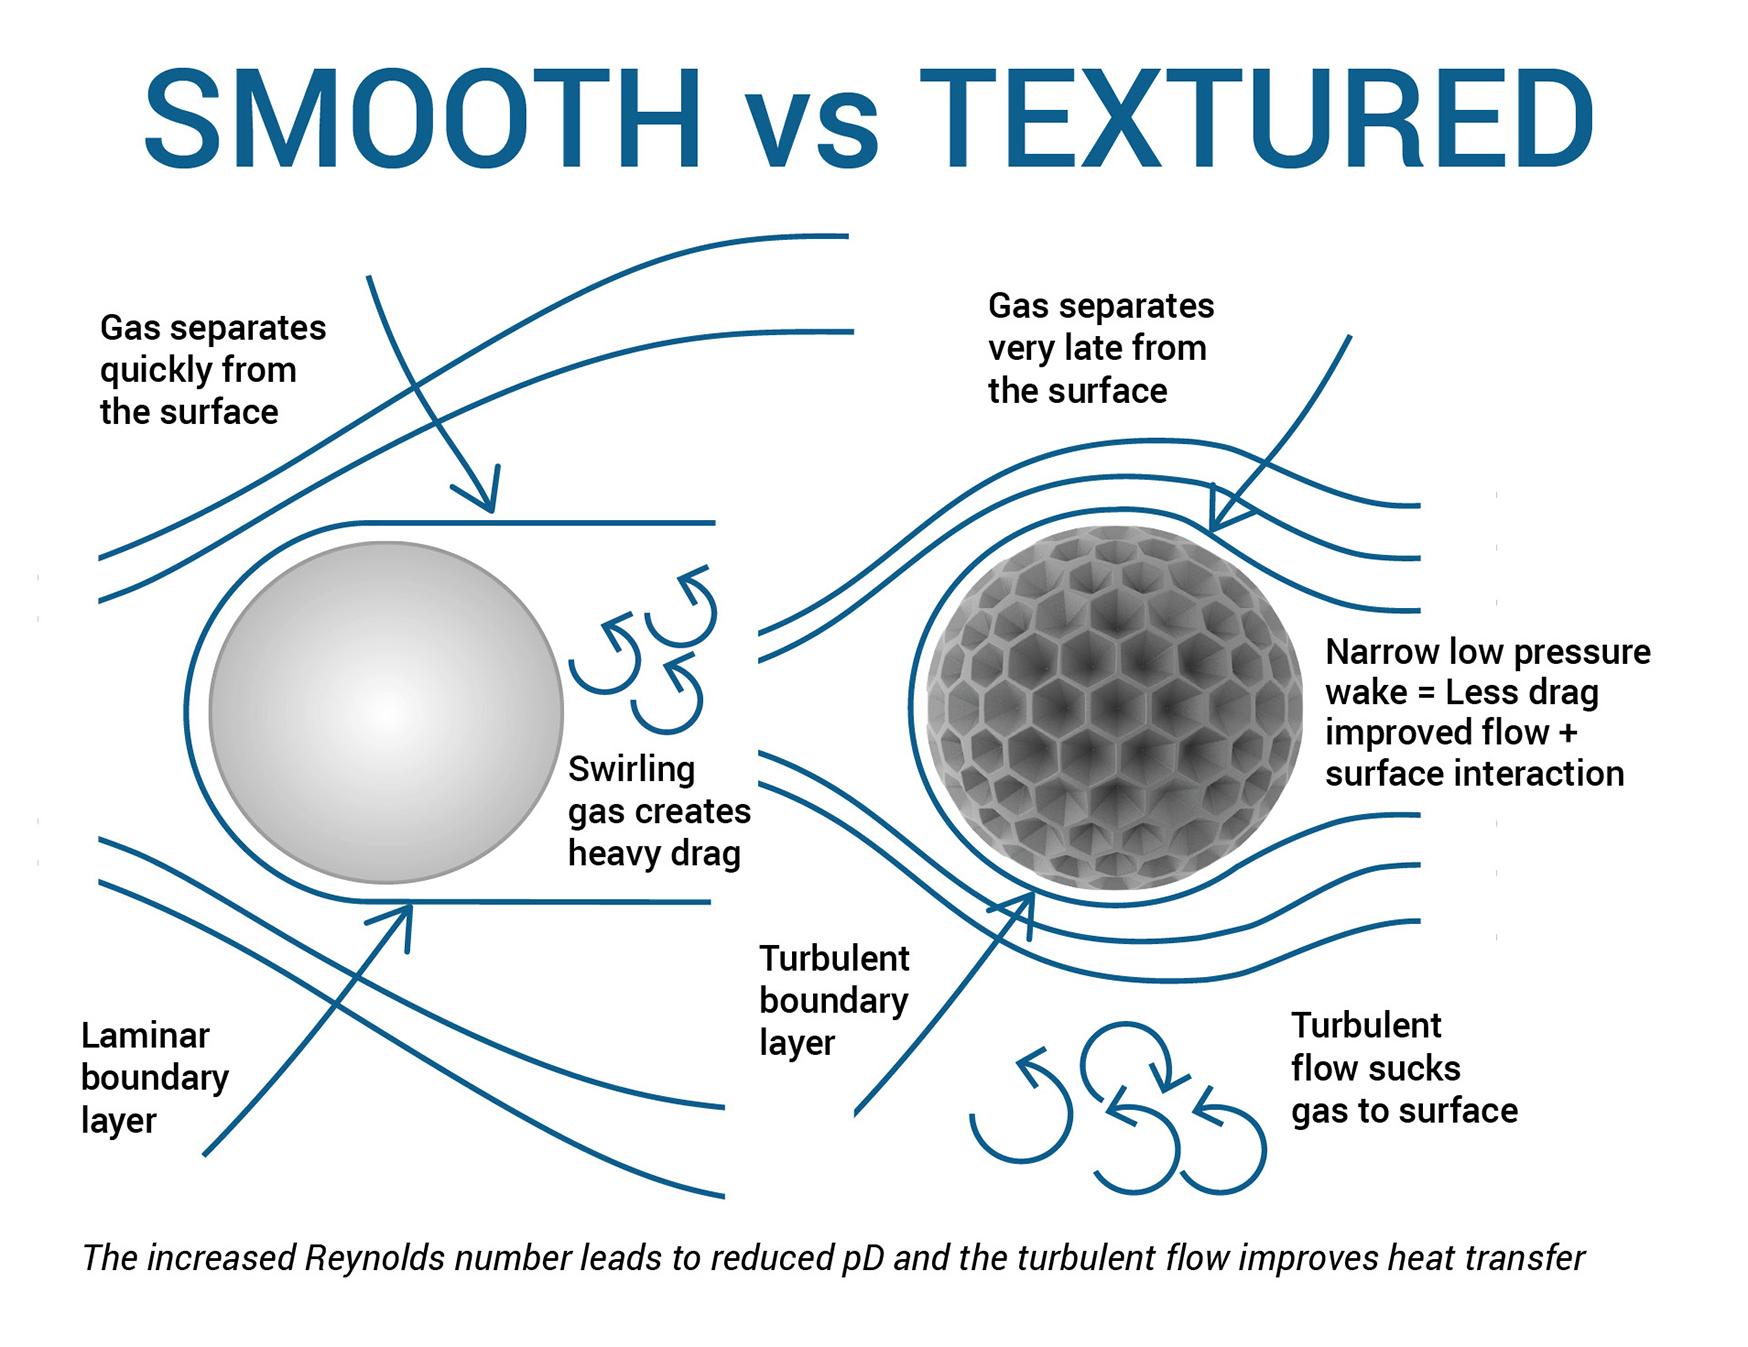
Beside the activity increases, the most advantageous and useful benefit of the catalyst could be the differentiation it provides in heat transfer and pressure drop that allows for full ammonia production increases. Standalone activity benefits will mostly be realised in cases where feed rates can be increased without hydraulic or other bottlenecking limitations. Due to steam reforming being an equilibrium reaction, the amount of syngas produced on a composition basis will be limited by the set of fixed conditions. By adding more feed into an SMR unit, a limit will be reached when pressure drop exceeds the maximum for the plant or methane slip increases without further possibility of increasing the outlet temperature. The textured surface of the catalyst also disturbs the laminar flow of gases over the particle surface. Turbulence over the surface of a body reduces the drag coefficient, which in this context of passing a gas over a fixed body, is realised as a lower pressure differential over the length of the reformer tube. The direct analogy used to explain this is that golf balls are dimpled because when are hit, they travel further; the drag forces are lower due to this increased turbulence.
Gas flowing through the bed of spheres is more uniformly spread, with all exposed surface area being in contact with gases, increasing the effective reaction zone with nickel. Traditionally, pressure drop is reduced in an SMR by moving to a larger catalyst pellet, however, the trade-off is a lower overall surface area, which results in higher methane slip. The catalyst decouples these concerns with additional surface area, porosity, catalyst shape, and surface texture, giving a baseline reduction in pressure drop (Figure 3).
Another limiting factor when attempting to increase ammonia production is heat transfer, specifically, radial heat transfer. Even in low internal diameter steam reformer tubes, a temperature gradient will exist between the heated wall and the centre point of the tube. This temperature gradient increases as feed flowrate increases, due to the reduction in time for heat to travel from the wall to the centre in the gas moving as a plug flow. As temperature is required to drive the overall endothermic reaction, this sets the equilibrium position between reactants and products; the widening temperature gradient at higher flowrates results in an increased methane slip at the exit of the tube. The solution, therefore, is to increase the radial heat transfer to minimise the radial temperature gradient to ensure heat is supplied to the full cross-sectional area of the tube.
Conduction is an important heat transfer mechanism, meaning contacts between the catalyst, the tube wall, and catalyst to catalyst should be maximised. Magcat spheres have an even packing and higher consistent ‘coordination number’ (number of pellets touching other pellets), meaning there is more packing at the tube wall. This decreased voidage and increased tube wall contact will disrupt the flow at the wall, causing turbulence and bringing the heat from the outside into the centre of the tube.
The catalysts’ textured spheres minimise the pressure drop, allowing a smaller size to be selected to maximise heat transfer. This attention to the physical requirements of the system is simultaneously coupled with the activity led inlet and outlet requirements of the catalyst previously mentioned to give the end-user a fully customised and optimised catalyst system.
This promotion acts to minimise carbon deposition through the enhancement of the carbon gasification reaction. A common hazard of potash is that the potassium quickly elutes from the catalyst. In conventional SMR catalysts, potash is added as a post-production step during catalyst manufacture and is easily driven out at reformer temperatures. This means the loss of protection from coking, but potassium will leach downstream, where it combines with other disassociated materials to cause fouling, most commonly on the heat exchange surface of the process gas boiler. Magcat helps to avoid this situation by offering potassium promotion locked within the polymer structure of the unique carrier where it remains active but cannot escape from the carrier structure to cause issues downstream.
Ammonia producers will fall into one of two camps in terms of their primary objective: increased ammonia production or furnace fuel and/or CO2 emissions reduction. Although these two benefits are not necessarily mutually exclusive, and the flexibility of the technology means fuel and CO2 savings can be realised during periods of lower ammonia demand and vice versa without the need to change the catalyst type, further incremental cost-benefits are also apparent.
When combining the advantages of Magcat, two directions can be taken by the end-user to, effectively, reduce costs:
n Lowering the feed and fuel rates but still making the same amount of H2
n Making more H2 which does increase the rate of use of feed and fuel but improves the overall economics per mole of H2 produced.
UNICAT simulated a large ammonia unit for both scenarios to compare the use of Magcat with the previously installed catalyst. When running at the same operating conditions, feed and fuel reduced by 812 665 Nm3 per year with the same quantity of H2 produced.
When running at the same operating conditions, H2 production increased by 267,891 Nm3 per year with the same feed and fuel consumption.
With Magcat, there is no requirement to change loading, start-up, normal operation, upset operation, shutdown or unloading procedures.
UNICAT’s Magcat textured technology offers increased ammonia productivity leading to increased profitability, furnace fuel and/or CO2 emissions reductions. These advances are available without the introduction of complex changes to procedures and with the flexibility to handle a full range of upcoming alternative feedstocks and incoming environmental challenges.

Peter Maas, Grandperspective GmbH, explains why a sea-change in emissions monitoring is needed if green ammonia is to become the future of farming.
Last December, policymakers representing 200 nations struck an historic deal to transition away from fossil fuels at COP28.
Some of these policymakers may have been influenced by the potential of the green ammonia sector. According to Persistence Market Research (PMR), a firm based in New York, it is a sector which is expected to ‘witness explosive growth’ in the coming years.1
The research, which was published in December 2023, forecasts that the market for green ammonia could increase from US$97.8 million to US$4517.6 million by 2030.
One of the largest areas of growth, says PMR, will be the fertilizer production market, which is expected to increase by over 75% between now and 2032.
The Royal Society, the world’s oldest, independent scientific academy, says that between 70 – 80% of ammonia is currently used to make fertilizer.2 However, figures from the Greenpeace Research Laboratories show that ammonia-based fertilizers are responsible for over 2% of the world’s carbon footprint, while agriculture accounts for nearly a quarter of the world’s emissions. Recent research by McKinsey & Company states that if farms switched to
green ammonia, greenhouse gas emissions from agricultural end products could be reduced by about 5%. 3

There are concerns that without more precise emissions monitoring, a significant scaling up of green ammonia production in farming might end prematurely.
Dr Reyes Tirado, a Research Scientist for Greenpeace Research Laboratories, says that if large scale industrial emissions occur, they might have potential impacts on air quality for human health (depending on the range of exposure) and more widely can increase N 2 O emissions as greenhouse gas in the atmosphere. 4
This has not stopped governments ploughing large amounts of resources into developing a green ammonia production capability. With green ammonia now being widely regarded by scientists as a fuel that can help to drastically lower our carbon footprint, nations around the world are setting up specialist research institutes to unlock its rich potential.
In the UK, the Science and Technology Facilities Council is building a small-scale plant to generate ammonia using only renewable energy sources. 5 Dr Tristan Davenne, Principal Engineer at the STFC Energy Research Unit, says that if the prototype is successful, it could prove to be a watershed moment, as it will enable the UK to scale up production, and begin to "build the foundation of a green ammonia economy to decarbonise large swathes of society."
Several nations are one step ahead, however. Saudi Arabia will soon be home to what will be the world’s biggest green ammonia plant. According to the Ammonia Energy Association, by 2026, the facility at Al Muwaileh is expected to produce 1.2 million t of renewable ammonia. 6
If the world is to follow Saudi Arabia’s lead, innovative green policy in the form of carbon taxes and subsidies will be required. Energy plants will also need to invest in ammonia cracking technologies as well as hydrogen separation and purification systems. But, if green ammonia is to replace ammonia in farming, entire ammonia distribution networks equipped with leak detection technology will be needed.
Ammonia, whether it is green, blue or turquoise, presents significant safety challenges. It is toxic, highly poisonous, and extremely difficult to detect with conventional sensor point technology. If it is not identified instantly, it can cause immediate burning of the eyes, nose, throat and respiratory tract. Without the right monitoring systems in place, it can leak uncontrollably in confined spaces, such as a green ammonia plant, and in the worst case scenario, it can result in blindness, lung damage or even death. Needless to say, it is also harmful to the environment and therefore emission-limited.
If plant managers are to protect their staff, and the large population centres who live beyond the perimeter fence, then they need to ensure that the right detection technology is in place.
Many plants have built a world-class safety culture within their operations. Not only do they comply with safety standards, they exceed them. But what about those who do not?
UNLOCK YOUR GOALS WITH

Reduce stack emissions
Decrease CAPEX
IT’S THE SAME, BUT BETTER
Lowest cost construction
Produce CO2free power
Use of green ammonia/ hydrogen O2
Better integrated, more efficient and cleaner production of CO2-free phosphate fertilizers
Leveraging oxygen from water electrolysis / ammonia production, CORE-SO2™ technology decreases acid plants’ environmental footprint and greenhouse gas emissions while recovering clean energy and enhancing plant profitability.
• No fossil fuels required
• 98% lower emissions
• 60% less plot space
• 55% fewer construction materials
• 50% decrease in CAPEX CORE-SO2™
LEARN MORE chemetics.info@worley.com chemetics.equipment@worley.com
Before surveillance technology, AI and open source data became widely available, local communities had no choice but to blindly place their trust in process plants. Now, thanks to sophisticated cameras and drones which are providing greater visibility and have given them a much more powerful voice, they do not have to.
Driven by economies of scale, almost anybody, anywhere can now deploy a drone-mounted camera equipped with sensor technology along the perimeter fence of a green ammonia facility, or sight a fixed camera on a nearby building, to detect, track and monitor emissions. Moreover, open-source data has levelled the playing field. Those with greater resources – such as a government agency, an insurance company or an environmental pressure group, can go even further. They can access satellite imagery to detect leaks, or mount state-of-the-art sensors onto helicopters or fixed-wing aircrafts.
This points to the fact that energy plants have lost control of the emissions narrative. Now, they are wondering who might be watching them and their facilities. However, if green ammonia facilities have rigorous and robust detection systems in place to detect, identify and monitor leaks, then what does it matter if others are also tracking their emissions?
Within the confines of a green ammonia plant, a leak is often impossible to detect using conventional sensor technology. This is because conventional point sensors, which are traditionally used by plants to identify ammonia leaks, have two major weaknesses.
The greatest technological limitation is that conventional points sensors are only capable of providing a local reading. Therefore, to suitably cover a three dimensional production site would require an inordinate number of sensors. One way of doing so, would be to install hundreds of point sensors across the facility, but the installation and maintenance costs would be crippling.
Secondly, for a point sensor to detect ammonia, the chemical needs to be in direct contact with the sensor point in order to trigger an alert. But, even if this were possible, gases rarely behave in the way that we expect. They are unpredictable and can change direction and trajectory very quickly, which means that plants simply cannot always rely on them.
Grandperspective GmbH has developed Fourier-Transform infrared spectroscopy (FTIR) remote sensing technology. With each scanfeld® remote sensor unit covering over 1 km in radius, one, or a few sensors can deliver 3D area coverage to an entire green energy facility.
The technology provides autonomous detection rates of typically 0.05 kg/hr and less. The instrumentation is sensitive, meaning it can identify ammonia and hundreds of other chemicals, whilst at the same time, offering quantification and monitoring capability.
The risk of employing such sensitive detection technology is that it is unable to distinguish technical emissions from an actual incident. This would of course
render the technology unusable. Therefore, it is important to ask how can such precise instrumentation make this critical differentiation? The system recognises normal behaviour of a technical emission which enables remote sensors to spot unconventional behaviour automatically and in real time. It is only then that the system will send an alert to the operator.
The remote sensing technology analyses radiation in the same way finger print detection technology identifies an individual. It allows for forensic detection of ammonia, while accurately pinpointing the source of a leak and the quantity of ammonia in the air.
FTIR technology is not new. It was first developed in the 1940s and the first FTIR spectrum was recorded in 1949. It is an incredibly established method for identifying chemicals in the laboratory, or in space science. What is a development is that the spectrometer is used to analyse omnipresent infrared radiation autonomously 24/7. The technology is highly automated. The light from a kilometre’s distance to find the gas composition in the air is analysed. This is how the precise information is collected, which reveals the exact type and quantity of chemicals in the air. Then, the entire gas cloud is made visible. In doing so, the analytical precision of the laboratory analyser with the overview of camera technology 24/7 is combined.
Additionally, the installations, once set-up, continuously learn more about the normal emission cycles of the plant. Throughout the production cycles, including loading procedures, start-ups, cleaning and maintenance, the system learns to differentiate between technical emissions and potentially dangerous gas leaks.
Furthermore, the system enables plant safety teams to map a gas cloud in real time. This is absolutely key, as in providing facilities with the exact location of a hazardous area, they can take immediate action to stop the leak.
While producers may no longer be in control of the emissions narrative, due to the ubiquitousness of surveillance technology, AI-enhanced remote sensing technologies, which provide low detection rates that conventional sensor technology cannot match, can help them to wrestle it back.
This is why plants who are producing and distributing ammonia are likely to opt for an FTIR spectroscopy-based remote monitoring solution in the near future. It is also the reason why green ammonia facilities will follow in their footsteps. The stakes for them – and the future of green ammonia – are simply too high for them not to.
1. https://finance.yahoo.com/news/green-ammonia-marketexplodes-72-121000094.html
2. https://royalsociety.org/-/media/policy/projects/greenammonia/green-ammonia-policy-briefing.pdf
3. www.mckinsey.com/industries/agriculture/our-insights/fromgreen-ammonia-to-lower-carbon-foods
4. Information obtained via an interview between freelance writer, James Gordon, and Dr Reyes Tirado.
5. www.ukri.org/news/designs-for-green-ammonia-plant-becomereality/
6. www.ammoniaenergy.org/articles/neom-project-reachesfinancial-close-30-year-offtake-secured/

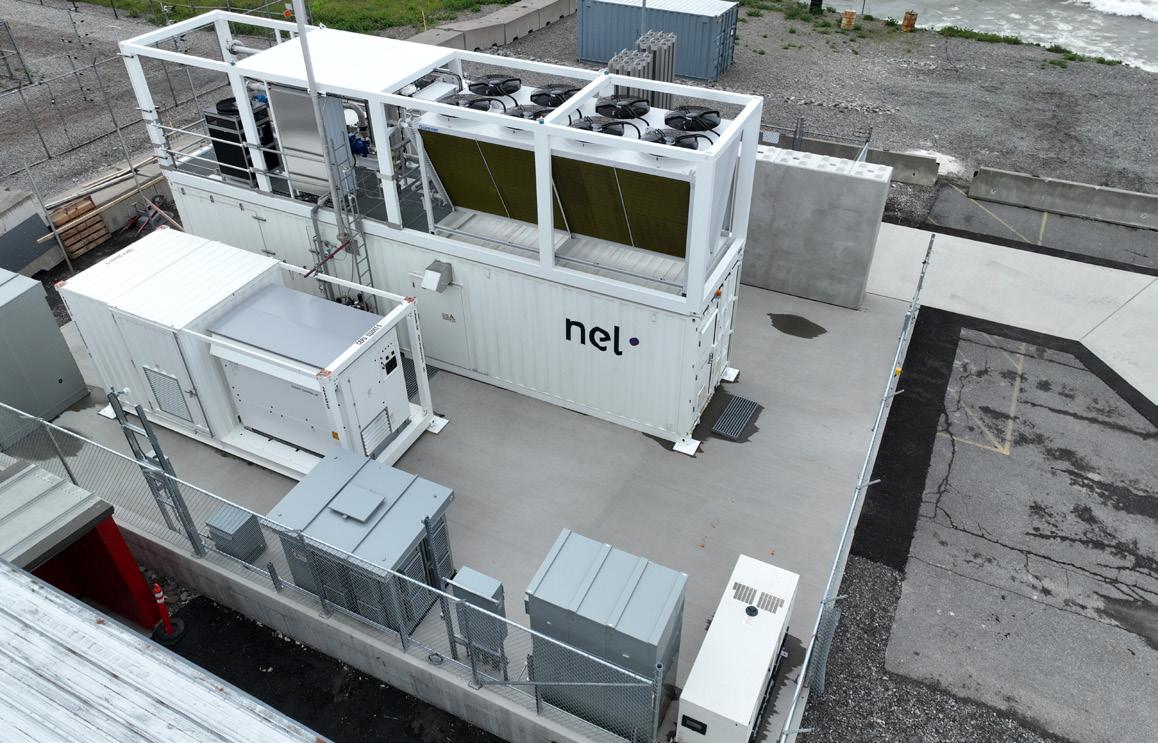
Todd Cartwright, Nel Hydrogen, USA, examines why the capacity for hydrogen electrolysers must be increased.
According to Statista, the global green ammonia market stood at around 5800 t in 2021, an increase of 3700 t from the previous year. Over the next decade, this figure is forecast to increase at a compound growth rate of 90%, reaching approximately 1.6 million t by 2030. 1 As roughly 80 – 85% of all the ammonia produced is used in the fertilizer industry, the pressure is on in virtually every market sector in the world to reduce fossil fuel usage and carbon emissions. To that end, different countries have different policies and incentives to promote the development and use of green ammonia.


In Europe, the EU Renewable Energy Directive will require 42% of ammonia to be green by 2030 – just six years from now. This regulation will also introduce a carbon border adjustment mechanism which will force ammonia and fertilizer importers to report emissions and pay a carbon tax at the border.
In India, the government has announced a new green hydrogen policy which offers a range of incentives to green hydrogen and green ammonia manufacturers, including allocation of land in renewable energy parks, waiving of interstate transmission charges for 25 years, and banking of renewable power for up to 30 days. The policy also aims to
create bulk demand and scale up green hydrogen by specifying a minimum share of consumption by designated consumers as energy or feedstocks. In Canada, the government has launched a hydrogen strategy which includes investing in blue hydrogen projects that use natural gas with carbon capture and storage technology. The strategy also supports the development of green hydrogen projects that use renewable electricity to produce green ammonia. These are just some examples of how governments around the world are trying to encourage the use of green ammonia.
Green hydrogen is the feedstock that enables green ammonia. Hydrogen plays a vital role in ammonia production, as it is the main reactant for the Haber-Bosch process, which converts atmospheric nitrogen and hydrogen into ammonia. Hydrogen can be produced from various sources, including water electrolysis. This process uses electricity to split water into hydrogen and oxygen. The advantages of this method are that it produces pure hydrogen without any carbon emissions or by-products. When the electricity source for the electrolyser is carbon free, then the ammonia production process is carbon free.
There are two types of electrolysis systems that are generally considered commercially mature today. One is alkaline electrolysis, and the other is proton exchange membrane (PEM) electrolysis. There are other types in development which also show promise for the green ammonia industry, such as solid oxide, but for now alkaline and PEM are the field-proven methods. Alkaline technology has historically been used for large capacity hydrogen plants. Alkaline cell stacks costs less on a per kW basis because they do not use precious metal catalysts as PEM does, and alkaline equipment has been commercially deployed for almost a century. PEM electrolysers are compact and can ramp up quickly with variable energy sources. They can also achieve a similar range of hydrogen production, up to thousands of kilograms each day. Contrary to common belief, PEM electrolysis is a long-proven technology, and has been operating in the field commercially for about 50 years. Electrolysis begins with the electrolyser’s cell stack. That is the technology core of the electrolyser, akin to a computer chip or a car’s engine. Each cell stack is made up of many electrolytic cells, each of which is an electrochemical reactor. Add water and a DC power source, and the cell stack creates hydrogen and byproduct oxygen.
There are several advantages of containerised PEM electrolysis. They include predictable availability and limited on site integration risk. The equipment is made in a factory; it is not assembled in the field. There are minimal technology and supply chain risks. There are also minimal infrastructure requirements in the field, in particular the cost of a building. Basically, the needs are deionised water, electricity, the ability to dispose of waste water, and the downstream gas and water processing. Highly skilled tradespeople are not necessary to do field fabrication and integration, and systems can be installed quickly and seamlessly.
Because the systems are highly standardised, companies receive an assured level of support from manufacturers who have made hundreds of such systems. It is believed that PEM electrolysers, at least initially, will play the larger role when coupling to renewable energy sources, because of their ability to respond instantly to electrical supply changes and downstream process needs.
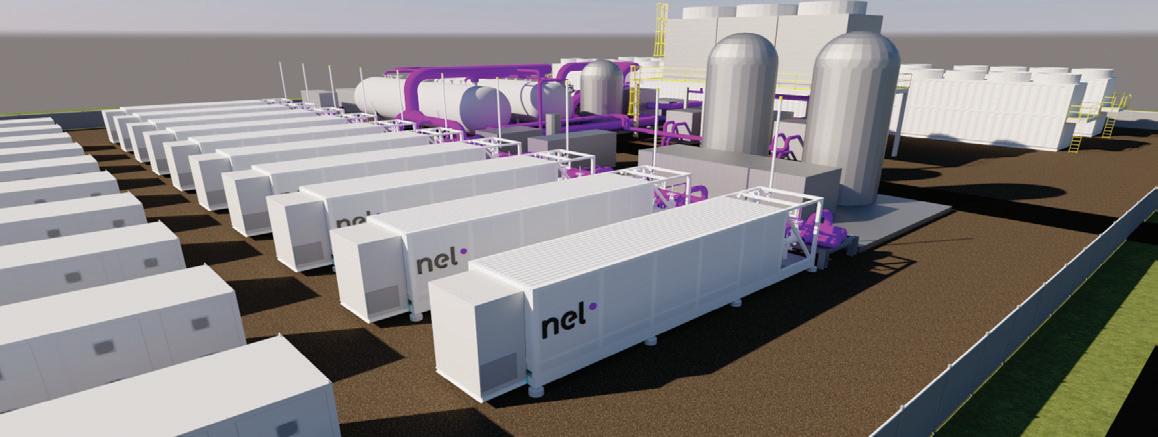
To match the ramp-up of hydrogen needs for the green ammonia market and others, the electrolysis industry is investing to meet these growing needs.
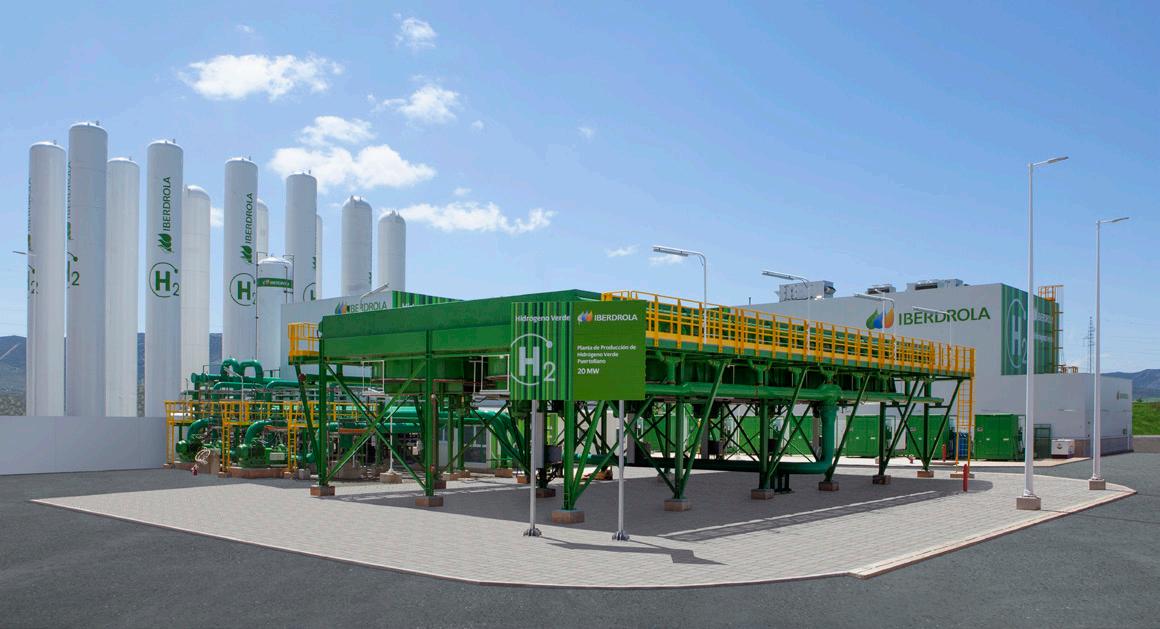
Several projects are underway around the world to ramp up green hydrogen and green ammonia supply. It starts with the foundational infrastructure. As an example, Iberdrola, a multinational electric utility company based in Bilbao, Spain, selected Nel Hydrogen a few years ago to turn Spain into a technological and industrial benchmark in green hydrogen.
Iberdrola and Nel have developed and deployed large-scale electrolyser projects to promote the green hydrogen supply chain in Europe and the United States. Specifically for green ammonia for fertilizer, the Iberdrola-Fertiberia alliance is producing green hydrogen for the Puertollano ammonia plant in Spain. The electrolyser solution is a 20 MW PEM system, the largest electrolysis plant for green ammonia production currently in operation.
According to the Ammonia Energy Association, Fertiberia’s low-carbon fertilizer has been successfully used in pilot programmes by Heineken and PepsiCo.2 This green fertilizer has been used on barley and potato crops in Spain, drastically reducing overall agricultural emissions and paving the way for
future supply chains. Both Heineken and PepsiCo are aiming to reduce agricultural emissions from their product supply chains and intend to scale up the use of green fertilizer based on the success of their 2023 pilot programmes.
Another company making strides in green hydrogen/green ammonia production for fertilizer is Yara International ASA. They have also applied electrolyser technology to help achieve the company's mission to “responsibly feed the world and protect the planet”. According to published press materials on its website, Yara has already removed half of its direct greenhouse gas emissions over the past 30 years and is striving towards carbon-neutrality by 2050.3
According to Recharge, the cost of green hydrogen is expected to fall to US$1.50/kg by 2030 as electrolyser capacity increases; more than 100 GW of electrolysers will be manufactured each year by 2030, up from 2 GW in 2020.4 As one example, Nel is building a new electrolyser equipment manufacturing plant near Detroit, Michigan. When fully developed, the Michigan plant alone will have a production capacity of up to 4 GW/year of alkaline and PEM electrolyser stacks.
1. www.statista.com/statistics/1351122/global-green-ammonia-marketvolume/#statisticContainer
2. https://www.ammoniaenergy.org/articles/fertiberia-low-carbonfertilizer-alliances-with-heineken-pepsico/
3. https://www.yara.com/news-and-media/news/archive/2019/yaraand-nel-carbon-free-hydrogen-for-fertilizer-production/
4. https://www.rechargenews.com/energy-transition/average-cost-ofgreen-hydrogen-to-fall-to-1-50-kg-by-2030-as-electrolyser-capacityramps-up-50-fold-analyst/2-1-1287093.


Rochman Goswami, Black & Veatch, USA, discusses the business opportunities that green ammonia presents in the quest to decarbonise across industries.
The urgency for accelerated decarbonisation has never been better recognised. Green ammonia and low carbon ammonia are critical to decarbonisation efforts across the industrial landscape. This article lays down some key business considerations, as diverse industry players embark on ventures involving green ammonia.
Ammonia has always been a strategic molecule, with strong socio-political and commercial implications, due to its link to food security. Hydrogen-driven decarbonised energy has further amplified ammonia’s strategic profile with the molecule recognised as the leading carrier of hydrogen.
Conventional ammonia production is carbon intensive, with every ton emitting between 1.5 – 3 t of CO 2 , contributing around 1.5% of total global carbon emissions. Green ammonia refers to the production of

renewable and carbon-free ammonia. Other colours include grey ammonia produced from fossil fuels (natural gas or coal) or blue ammonia, which also utilises fossil fuels but with carbon capture and sequestration.
Green or reduced-carbon ammonia is seen as a key solution with tremendous potential for decarbonisation across industries, using:
n Eco-friendly fertilizers to help decarbonise the food chain.
n Decarbonised fuel (transportation, shipping, etc.).
n Green ammonia as a hydrogen carrier for the whole energy supply chain and power generation, in the new hydrogen driven ‘molecules to electron’ economy.
There are many key drivers affecting green ammonia businesses. Analysis of these business drivers aids in setting realistic goals towards developing a successful green ammonia business.
Although the current market is dominated by the fertilizer and food security aspects of ammonia, understanding the ammonia markets provides a good perspective in developing a green ammonia business plan. Over 70% of ammonia production is linked to fertilizers and therefore food security, with its deep socio-political implications. The market is dominated by a sentiment of insecurity that drives every geo-political constituency to seek control over its ammonia supply. After the end of cold war in the 1990s, and with increased global free trade, that sense of insecurity temporarily diminished. However, supply chain disruptions due to the recent global events are triggering these tendencies again. Already, countries like Brazil, with over 85% reliance on imports, are calling for domestic captive production of ammonia. Any business plan that crosses geopolitical boundaries needs to take this into account.
Ammonia’s entanglement with energy, as a carrier of hydrogen, will further exacerbate uncertain situations, and all aspects of the ammonia market will be affected by geo-political occurrences, alliances, manipulations, and tensions.
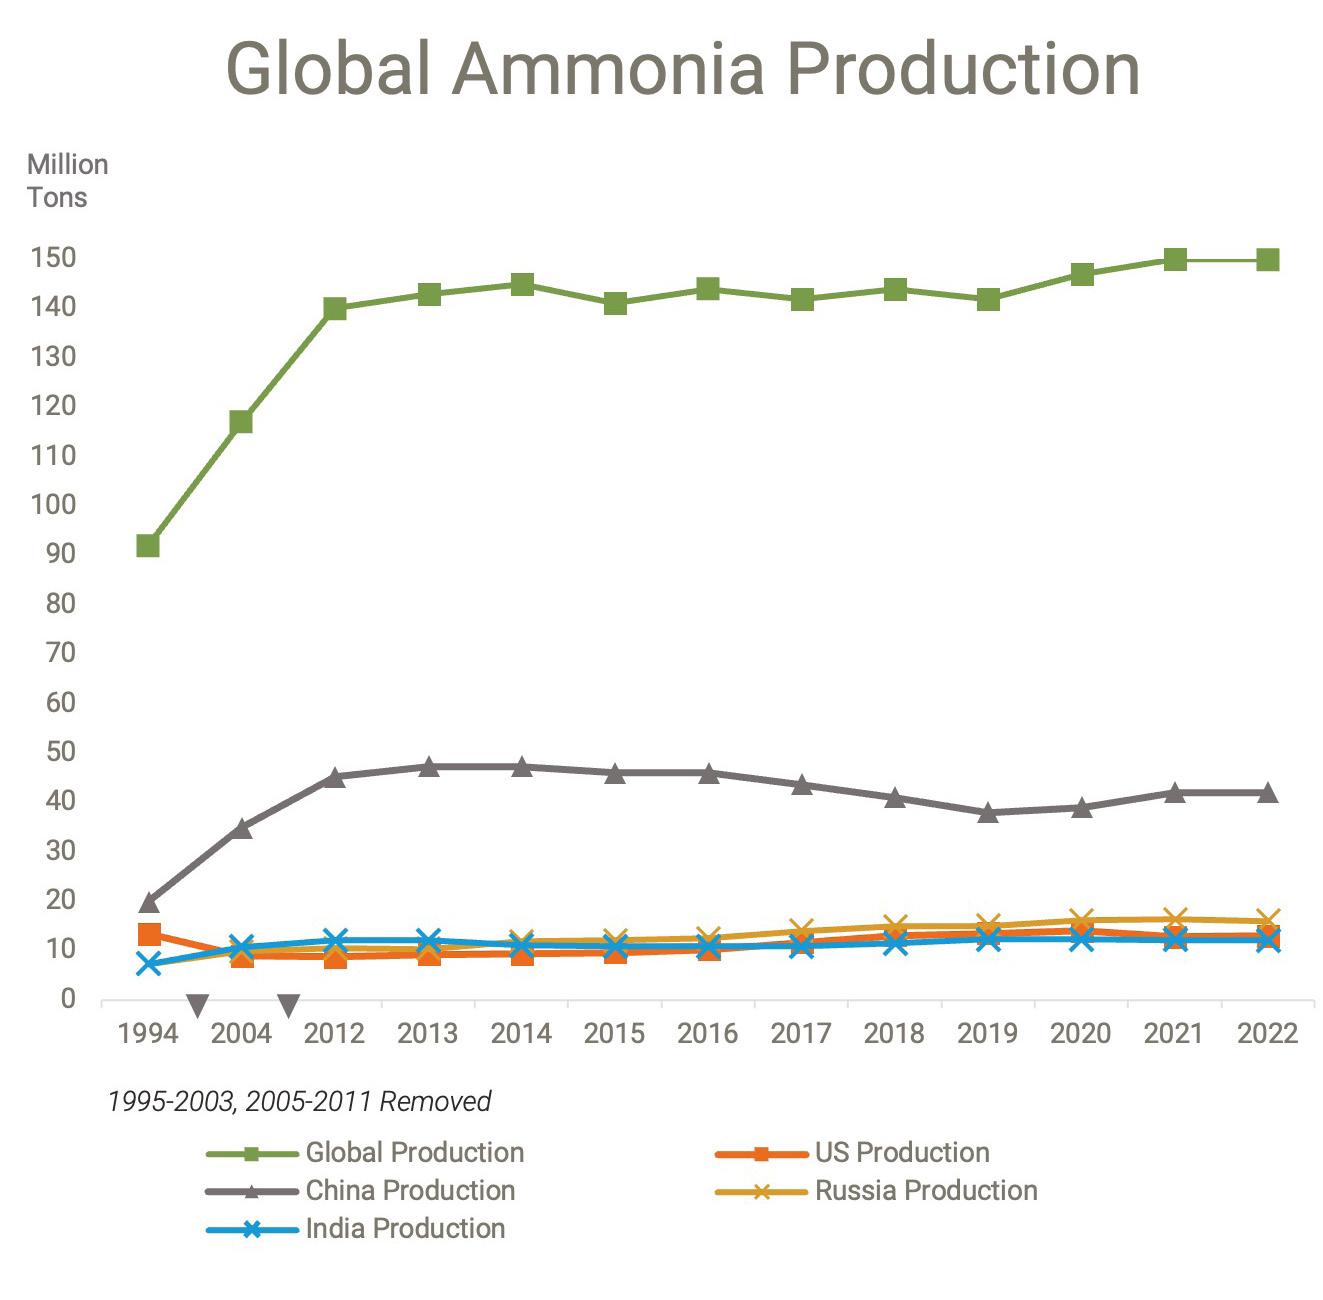
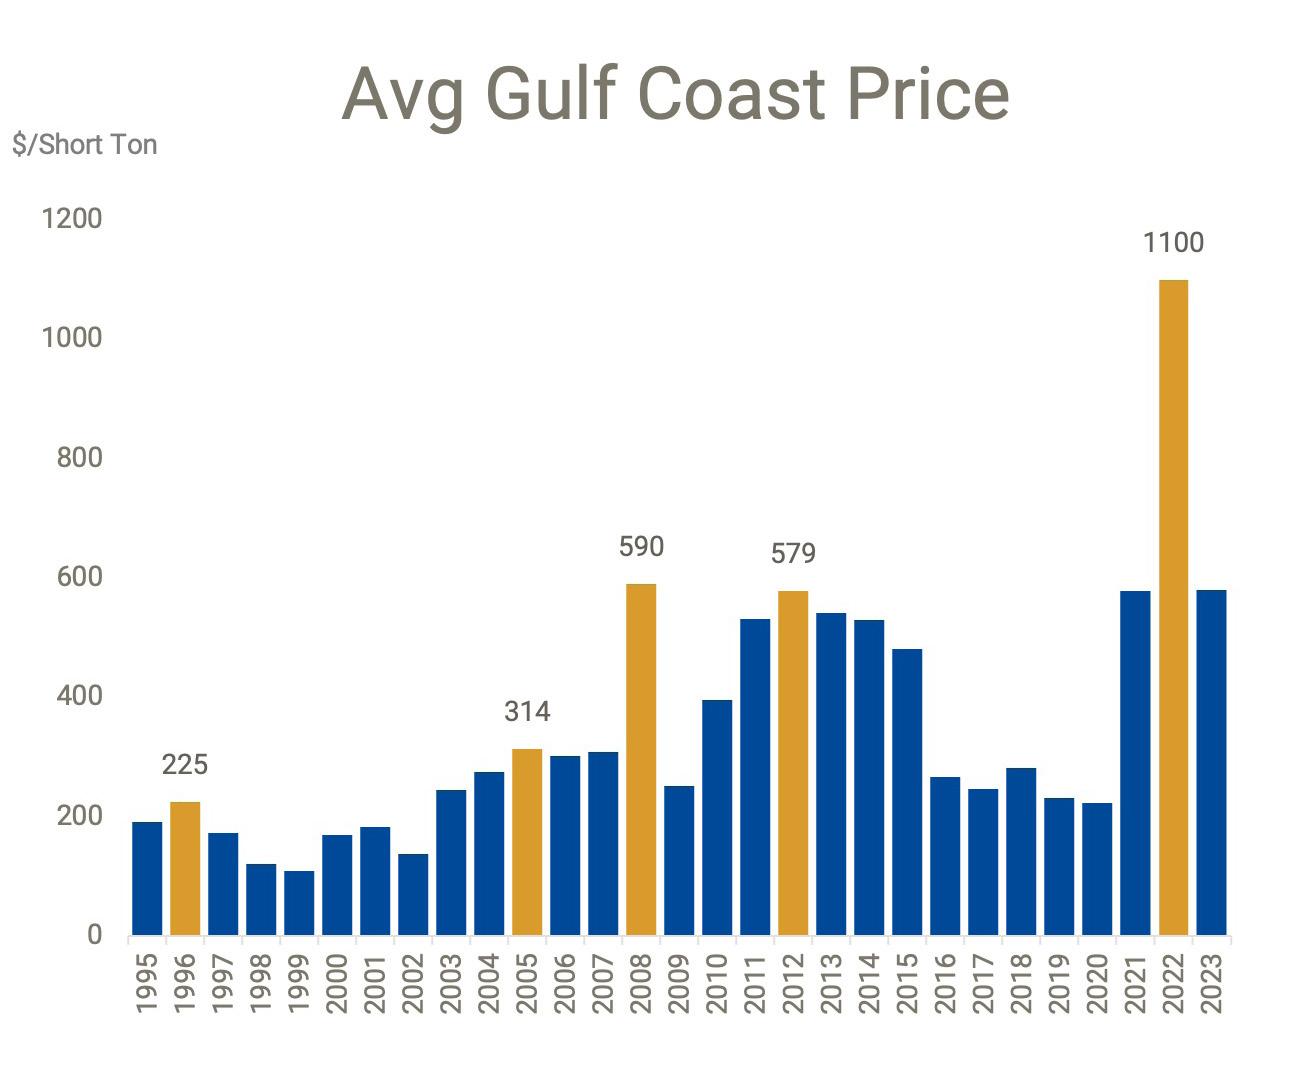
Figure 1 shows that the production of ammonia has grown steadily since 1994 (globally, as well as in major producing countries such as China, USA, Russia, and India). Demand growth is also generally steady, however, the prices of ammonia fluctuate widely (Figure 2). Between 2012 and 2022, production globally has been stable between 140 – 150 million t, but the price has fluctuated from US$600/t in 2012 down to US$220 in 2020, and then skyrocketed to over US$1100 in 2022. Prices are currently down to around US$350 – US$450/t. Sensitivity to economic cycles and geo-political tensions are significant factors in ammonia markets.
Every economic crisis leaves an imprint on the ammonia market (Figure 2). The 1997 Asian currency crisis led to some of the lowest ammonia prices historically due to its effects on the demand side. The 2008 market meltdown caused a temporary spike followed by a steep decline in prices. Global events since 2020, including the pandemic, have led to an unpredictable market situation with unprecedented price levels (while global production is still holding steady).
The ammonia market is affected by natural gas/energy prices, with natural gas being the primary raw material. However, it is much more sensitive to socio-political and economic drivers. For instance, between 2012 and 2020, natural gas prices were fairly stable, between US$2 – 5 per BTU band, while the fluctuations in ammonia prices were much wider.
Farmer affordability is another key driver in ammonia markets, which means crop markets also affect ammonia pricing. Higher crop prices allow
Developing a repeatable, in-service inspection strategy for ammonia storage tanks will help improve operational reliability and minimize the probability of failure from several damage mechanisms, including ammonia stress corrosion cracking (SCC). Fertilizer and renewable hydrogen manufacturers need to identify the optimal balance between the need for an internal inspection versus the potential consequences of performing those inspections.
At E²G | The Equity Engineering Group, Inc., our consulting team helps to navigate the challenges of high-consequence ammonia storage tanks with a multidisciplinary approach to inspection strategies. Our team integrates risk-based inspection (RBI), fitness-for-service (FFS), and materials and corrosion expertise to provide a comprehensive and practical inspection strategy for your ammonia storage tanks.

Your team’s expertise on this topic made completing this project very professional. I appreciate your insight and look forward to working with you again.”
International Fertilizer Manufacturer, August 2023
farmers to afford more use of fertilizers and leads to increased prices. On the other hand, higher ammonia prices mean lower affordability for farmers. The price spike influenced by effects from the war in Ukraine was so steep that it caused fertilizer usage to drop significantly, lowering overall crop yields. Green ammonia is not likely to be directly affected by farmer affordability in the short to medium term, due to pricing levels. However, being in the market for the same commodity, and the strength of the international energy lobby, can weaken a farmer's position in the equation.
The emergence of China as a major supplier of cheap ammonia, sourced from coal gasification, brought down the local production in the US to 8 million t in 2008. Subsequently, China has had to shut down many coal gasification facilities and the continuing rise in global demand has led to current production levels of 13 million t in the US.
US consumption has remained steady, with a slight downward trend, peaking at 18 million t in 1998 and now to current levels of around 13 million t. Some factors driving the trend are:
§ More efficient technology driven fertilizer delivery methods to the roots of the plants.
§ Increased responsible use of fertilizers with soil protection in mind.
§ Growth in bio-fertilizers and organic farming practices.
In the development of a business case for green ammonia, including financial analysis and proforma financial statements, it is recommended to include a sensitivity analysis in relation to the following key drivers:
n Energy markets, oil, natural gas, coal, etc.
Green ammonia is likely to compete in the fuel space until cost levels are brought down to compete with grey and blue ammonia.
n Grey ammonia markets are here to stay for some time due to capacity needs and pricing differentials.
n Farmers are sensitive to pricing. Also, socio-political establishment must keep a sharp eye on food pricing, especially for the vulnerable sections of society. Therefore, natural gas and coal prices as raw material for grey ammonia will have sensitivity for green ammonia as well.
n Major crop markets – farmer affordability is affected, hence the demand side of ammonia is also impacted.
n Geopolitical plays and disruptions – both China and Russia are major players in the space, as is Europe.
n Economic cycles will have a multi-pronged impact on green ammonia markets.
n Financial markets, interest rates, and currency markets have profound impacts on the green ammonia sector. Some recent financial models show interest rates as the most critical driver through sensitivity analysis for green ammonia projects.
n Interplay between grey, blue, and green ammonia markets – an area which is still evolving. Blue ammonia and green ammonia market mechanisms are not yet instituted globally.
n Regulatory and taxation framework across the globe. Various geo-political constituencies are competing in creating a framework that supports green ammonia and other decarbonisation initiatives. These may create temporary financial opportunities, and it is imperative that financial modelling considers availability as well as the absence of these incentives. It is recommended to frame short-term and long-term analysis separately. The current regulatory regime gets reflected in the short term and facilitates access to finances, while the long-term financial modelling considers when incentives may no longer be available.
While the ammonia synthesis part of green ammonia is a well-established technology, there are other parts that are susceptible to disruptions. Green ammonia business plans need to build in flexibility in terms of adapting to the trends that we see today. Some of the potential disruptors and risks are discussed, which need to be appropriately analysed as risks and incorporated into financial modelling where applicable. Due to the complexities of these technologies, as well as the relation of their performance to the regulatory framework, it is imperative that independent specialists and engineers are engaged, and optimised decisions are taken while configuring the business:
n Growth of green ammonia is closely linked to ammonia staying as carrier of choice for hydrogen. Development of an alternative hydrogen carrier will completely disrupt the green ammonia markets.
n The development of an ammonia engine technology for shipping is imminent. It is projected that 25% of bunkering fuel by 2050 will be ammonia. The success of this initiative is key to keeping ammonia growth projections on track.
n The ammonia cracking technology used to retrieve hydrogen will be critical in keeping green ammonia as an essential component of a hydrogen-drive sector. Efficiency, as well as lowering the energy input for cracking, is the area of technological development to watch.
n With renewables as the backbone of green ammonia, developments in PV technology are a critical part of the green ammonia development. Increases in efficiency and lowering of costs will support the business case for green ammonia.
n Wind energy efficiency and cost improvements are also important to green ammonia business configurations, where applicable.
n Nuclear energy safety and scalability improvements can completely disrupt the renewables landscape, not forgetting research on the fusion side of energy sourcing. Molten salt reactors (MSR) have potential and promise; this is another area of technology that green ammonia businesses should watch closely.
n Developments in technology and efficiency of water electrolysis: the choice of technology between proton exchange membrane technology and alkaline technology, for example, can have a profound impact
on the business case and needs to be analysed for each project development, based on its own merits. Similarly, key decisions with regards to pressurised and non-pressurised hydrogen systems need to be taken early and with appropriate techno-commercial analysis.
n Developments in battery technology and appropriate incorporation into the renewable energy configuration is an important part of the business case development.
n Energy integration between water desalination and ammonia synthesis can offer a competitive advantage, especially in areas by the sea, with scarcity of fresh water. An added advantage would be the potential adjacency of port facilities.
n It is essential that front end development is carried out diligently, evaluating alternatives and options both technically and commercially, arriving at optimum decisions towards key financial investment milestones.
Green ammonia business case assumptions will set market projections, and the following set of market projections will provide the direction, shape, and size of the market that a facility with 30 years of life may address:
n By 2050 the market for ammonia is projected to grow to 600 million t, of which about 400 million t is expected to be coming from low carbon ammonia (both green and blue).
n The renewable energy potential related to wind, solar, hydro and geothermal is unevenly distributed across the world. A tremendous increase is expected in global trade for ammonia, with an increase of 8 – 10 folds from current levels of 20 million t at about 150 million tpy.
n Ammonia as shipping fuel itself is projected to require an additional 150 million tpy of ammonia by 2050, and that is just at 25% conversion of shipping fuel to ammonia.
n By some projections, blue ammonia will be competitive compared to grey ammonia by 2030. However, green ammonia will require further policy support before it can compete. Recently announced US tax clarifications have set an interesting trend in that direction. The current cost structure of green ammonia needs careful financial analysis before major financial investment decisions.
Green ammonia presents an unprecedented business opportunity in the quest to decarbonise across industries, and indeed the whole energy supply chain. Given that many technical and commercial drivers are unique and still evolving, it is important to understand, analyse them, and incorporate them into financial modelling.
Decarbonisation is imperative, and green ammonia is surely part of the potential solution, if not the solution. Effective business analysis has the potential to define better timelines and configurations in support of bringing successful green ammonia businesses to reality.
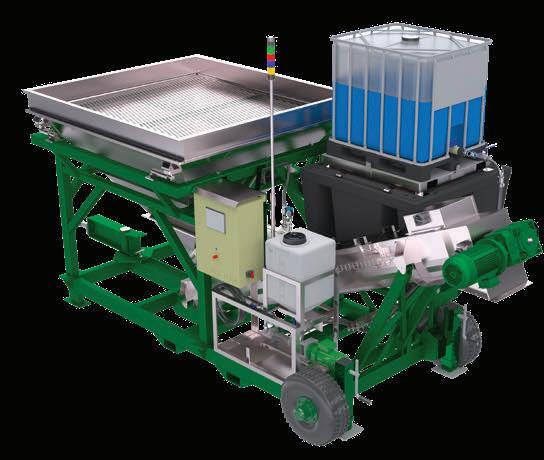
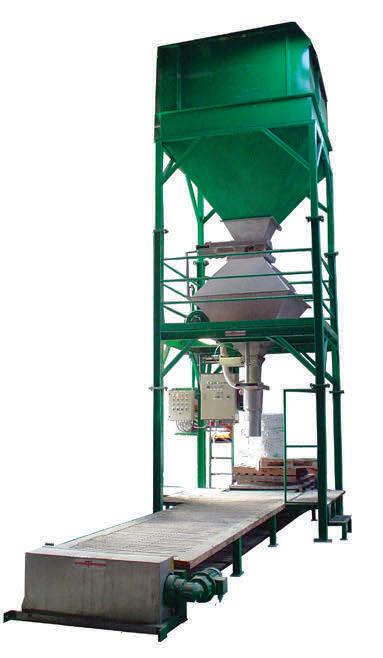
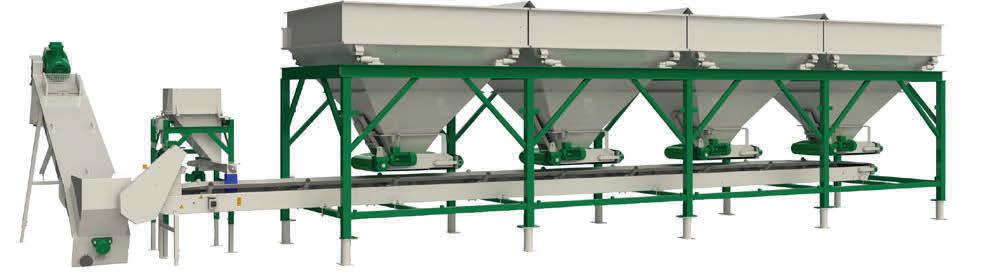
Maria Acevedo and Brian Clancy, Kimre Inc., USA, examine often overlooked plant design considerations and emphasise the critical role of mist eliminators.
Scrubber systems rely on carefully designed internals to function effectively, which have often been tailored for specific applications. While mist eliminators are sometimes overlooked in scrubber operations, they are vital for ensuring optimal scrubber performance. Mist elimination technology plays a crucial role in meeting environmental regulations and standards. With most scrubber systems requiring some form of mist eliminator, manufacturers collaborate closely with clients, particularly in the phosphate fertilizer industry, to mitigate hazardous pollutants from process gas streams. This collaboration ensures that gas cleaning technologies operate safely within established emissions limits.
A blend of chemical and mechanical engineering designs are utilised by engineers to advance mist elimination technology into a comprehensive solution, addressing both compliance requirements and operational efficiency. Design engineers collaborate closely with customers to meticulously design a mist eliminator, seeking clarification

on usual challenges such as ensuring overall environmental compliance, controlling the pluggage rate of the mist eliminator technology, and minimising downtime associated with media set replacements.
When a company wants to resolve environmental compliance or pluggage issues, the initial step involves an assessment of the existing abatement requirements and process. Once the expectations are clarified, a comprehensive review is carried out of the current conditions, or if the facility is not built yet, the design conditions. The review centres around three primary assessments: mist removal, drainage rate, and determination of pressure drop.
When assessing the performance of a mist eliminator for a fertilizer plant, engineers must ensure that the mist eliminator does not outperform the scrubber itself. It is essential to confirm that the upstream scrubbing equipment effectively removes most particulates entrained in the gas flow. Failure to do so may lead to excessive pluggage in the mist eliminator system and premature system failure.

Evaluating removal effectiveness involves considering various gas cleaning mechanisms within the system.
Inertial Impaction
Interception
Brownian Diffusion

Three main mechanisms for particle filtration, specifically mist droplets in this application, include inertial impaction, interception, and Brownian diffusion.
When the particle size is greater than one micron, the predominant particulate capture mechanisms are inertial impaction and interception. When the particle size is less than one micron, the predominant particulate capture mechanism is Brownian diffusion (Figure 1).
Aside from contaminant emission levels, pluggage resistance stands out as the chief concern expressed by clients in fertilizer operations. As a result, the designer will centre their efforts around mitigating and managing the impacts of pluggage, deeming it a crucial aspect of the design process. In Tables 1 and 2, common compounds that impact the pluggage of mist eliminators can be observed with the expected size distribution of each compound. Based on the data, it becomes clear why the design calculations focus on impaction and interception for removal efficiency.
In gas cleaning, a trade-off exists between contaminant removal efficiency and energy consumption, determined by the applied pressure drop (∆P) in the process. However, the trade-offs between technologies may not always be apparent if the benefits of removal efficiency are not fully realised or recovered.
All mist elimination technologies, including wire mesh demisters, vane separators, fibre bed filters, and structured monofilament demisters, operate based on similar collection mechanisms; however, it has been found that the structured monofilament pads, featuring approximately 93% of fibres positioned perpendicular to the airflow, have been beneficial in the fertilizer service. Having nearly 50% more perpendicular fibres than knitted mesh, structured monofilament pads result in a lower pressure drop per removal efficiency and are able to be cleaned and re-used multiple times. The structured monofilament mesh pad is constructed from durable materials and designed with a large surface area and void fraction, making it both robust and cost-effective.
The structured monofilament media (Figure 2) induces significant flow turbulence, promoting thorough gas-liquid mixing across extensive contact surfaces. This design facilitates:
n Efficient mass transfer.
n Particle separation through inertial impaction, interception, and Brownian diffusion, ensuring a high recovery of particulate matter and pollutants in vent air.
The monofilament material achieves this by ensuring adequate liquid drainage through a predetermined void space, tailored to each application. These pads can be configured for various functions, including:
n Removal of heavy liquid load through proper drainage.
n Plugging resistance to prevent blinding.
n Coalescing or removal of small particles, ranging from 0.8 to 3µ, to large droplets (10+µ).
n Entrainment separation for the removal of large particles using B-GON media.
Given that fertilizer plants are characterised as dirty environments, it becomes imperative to clean the mist eliminator pad(s) periodically, and in some cases, continuously. Various methods for periodic cleaning should align with the following guidelines:


10-80kg filling weight openmouth bags for

up to
1500 bags per hour

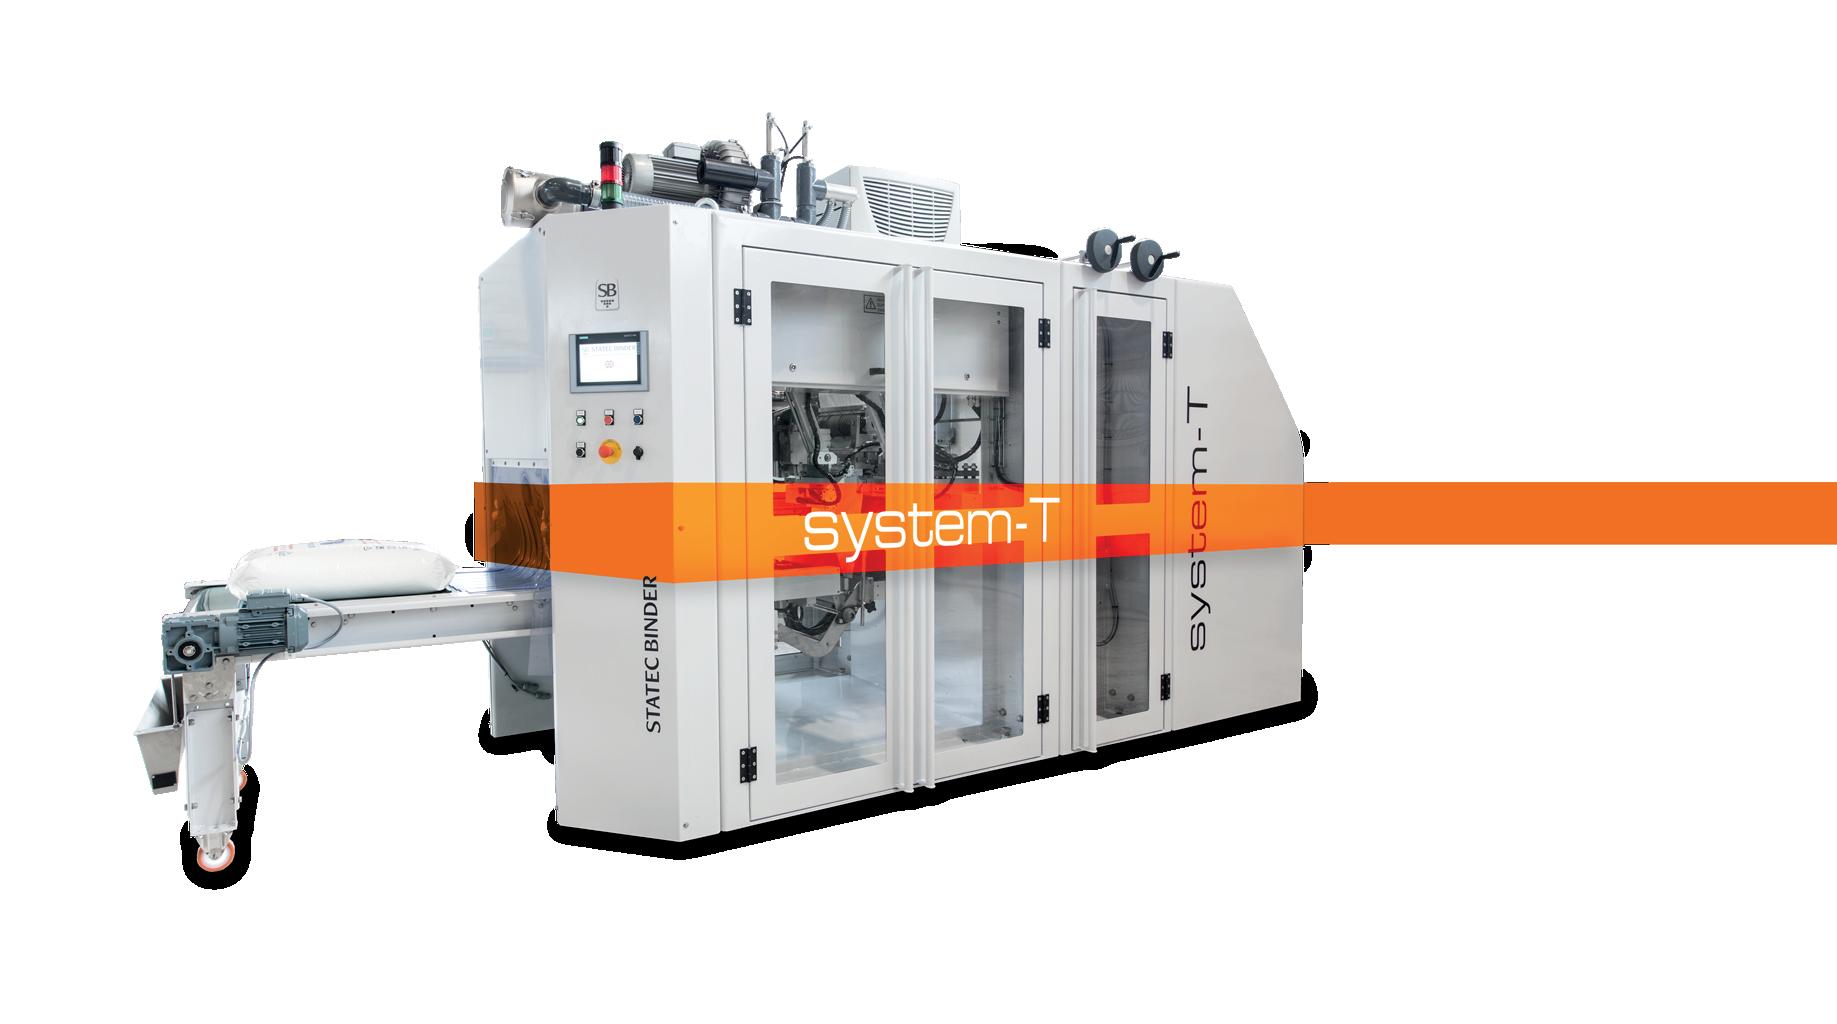


2400 bags per hour
up to 5-50kg filling weight
FFS bagging machine
more than 1,800 machines successfully installed worldwide
more than 1,800 machines successfully installed worldwide
more than 45 years of experience in customized and flexible packaging and palletizing solutions
more than 45 years of experience in customized and flexible packaging and palletizing solutions
global customer service with various service programs
global customer service with various service programs

Take a look at our Youtube channel!

Take a look at our
www.statec-binder.com
www.statec-binder.com

n High pressure/volume washing to remove pluggage material. Experienced operators might use pressure from 600 psig and up to 2000 psig with fan nozzle to get rid of pluggage from the pad(s).
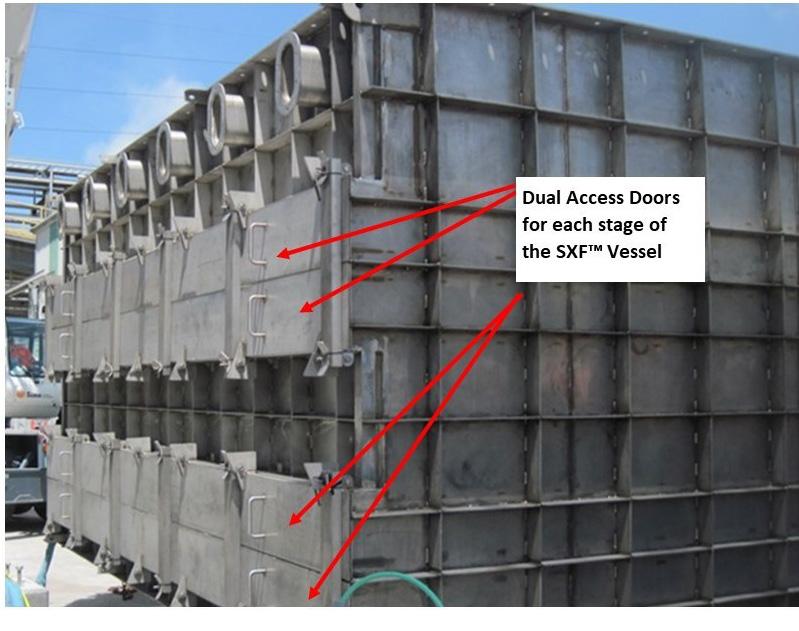
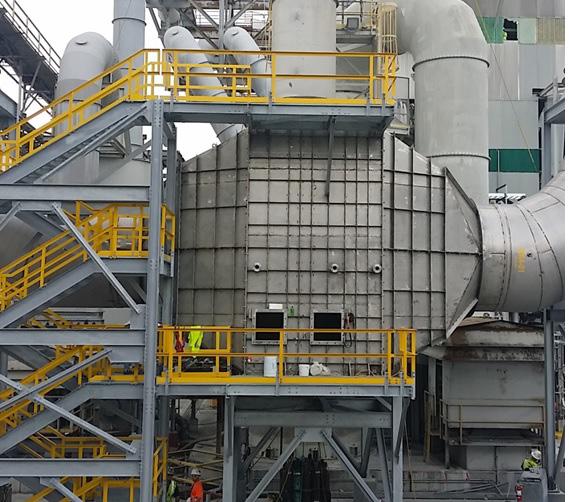
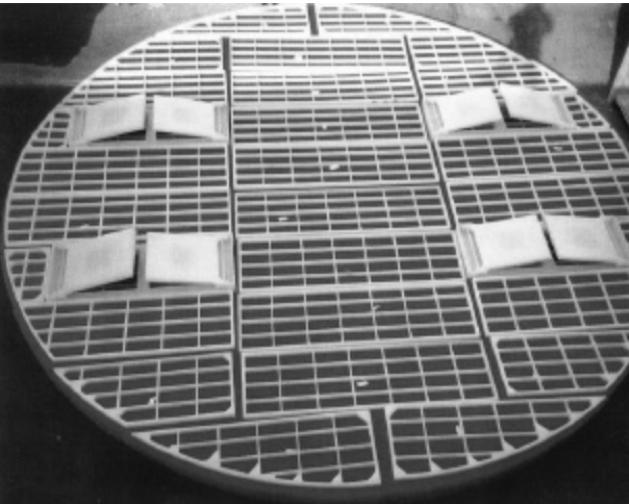
n Chemical cleaning until complete saturation occurs to remove all contaminants.
n Flexing/rolling pads are considered extremely efficient in releasing scale build up. Contingent on the style of the material, in some cases walking on the pad or rolling with a lawn roller is vastly efficient.
Some fertilizer plants may demand ongoing cleaning. To facilitate continuous irrigation and cleaning, spray headers with a specified geometric orientation of the material and a predetermined rate will be implemented. Continuous cleaning can involve the use of a fresh makeup liquid or a chemical cleaning solution.
In a recent installation, KimreTM Clean Air Technology, was contacted by an engineering firm to help design and supply an SXFTM scrubber/mist eliminator to treat primarily coarse dust from a DAP granulation plant. The gases to be treated would come from the RGCV tail gas scrubber. The client, a phosphate fertilizer producer, was revamping one of its granulation lines. Additionally, additives would be introduced in the granulation process that reduce the solubility of the dust to be collected. In similar facilities, the client has experienced high degrees of pluggage, resulting in frequent shutdowns and cleaning of the current mist eliminators. Along with assuring proper performance of the mist eliminators to meet the mandated limits for PM emissions, the client requested that the design allowed for an increase in operating uptime as well as a significant reduction in the time required for maintenance of the pads. The resultant design of the SXF incorporated:
n On-line irrigation of the Stage 1 B-GON® pad to help reduce pluggage in service.
n Two-stage mist eliminator design with custom-designed media for maximum pluggage resistance and collection efficiency, while maintaining a minimum pressure drop.
n Designed mist eliminator supports and access for change-out of media.
n Focus on proper flow-distribution.
Irrigation of mist eliminators to provide on-line cleaning is a common design for scrubbers in phosphate fertilizer production. The purpose is to reduce and flush build-up of insolubles from the media to extend operating life. However, during irrigation cycles, the potential for flooding and re-entrainment of PM increases. While a single stage of the B-GON Media would have provided the necessary collection efficiency, a modified two-stage design was provided with the second stage installed to minimise any potential for re-entrained mist or dust which would negatively impact PM emissions.
To minimise the downtime for cleaning of the pads, the vessel was designed with two sets of slots and supports for each mist eliminator stage (Figure 3). With this design, during shut-down for maintenance, a clean pad is lifted into place using a crane and spreader bar. Once inserted into place, the same spreader bar assembly connects to the dirty pad and is lifted out, therefore reducing the downtime for the scrubbing system.
Lastly, since the vessel would be installed downstream of the vertical tower, there was concern that the ducting leading
to the vessel may create a poor gas flow distribution through the vessel, leading to premature blockage of the B-GON media. Ideal flow conditions allow for an inlet angle to the first stage B-GON pad of 60°, and an outlet angle of no more than 90°.
Figure 4 shows that the transitions to the vessel allowed for proper flow distribution. After start-up, the plant’s emission compliance test reported that the system successfully met the permitted limits on PM. Moreover, the client saw improvement in operations and maintenance:
n The new design increased the operating uptime between maintenance by approximately 400% over similarly designed mist eliminators in another of their granulation facilities.
n The dual-slotted design allowed a complete replacement of the media in less than 30 minutes, resulting in faster turnarounds.
Kimre Clean Air Technology was contacted by a phosphoric acid plant to design six fluorine scrubbers, each with an inside diameter of 6400 mm and the following design conditions:
n Gas flow rate: 468 000 m3/hr.
n Temperature: 45°C.
n Pressure: 58.4 mm Hg, absolute.
n Composition: water vapour with 4.5% fluorine.
The mist eliminator pads were to provide 99+% collection efficiency for all droplets 10 µm and larger. Mist elimators were provided in style 37/97 to provide the maximum resistance to pluggage from silica scale, and the highest liquid handling
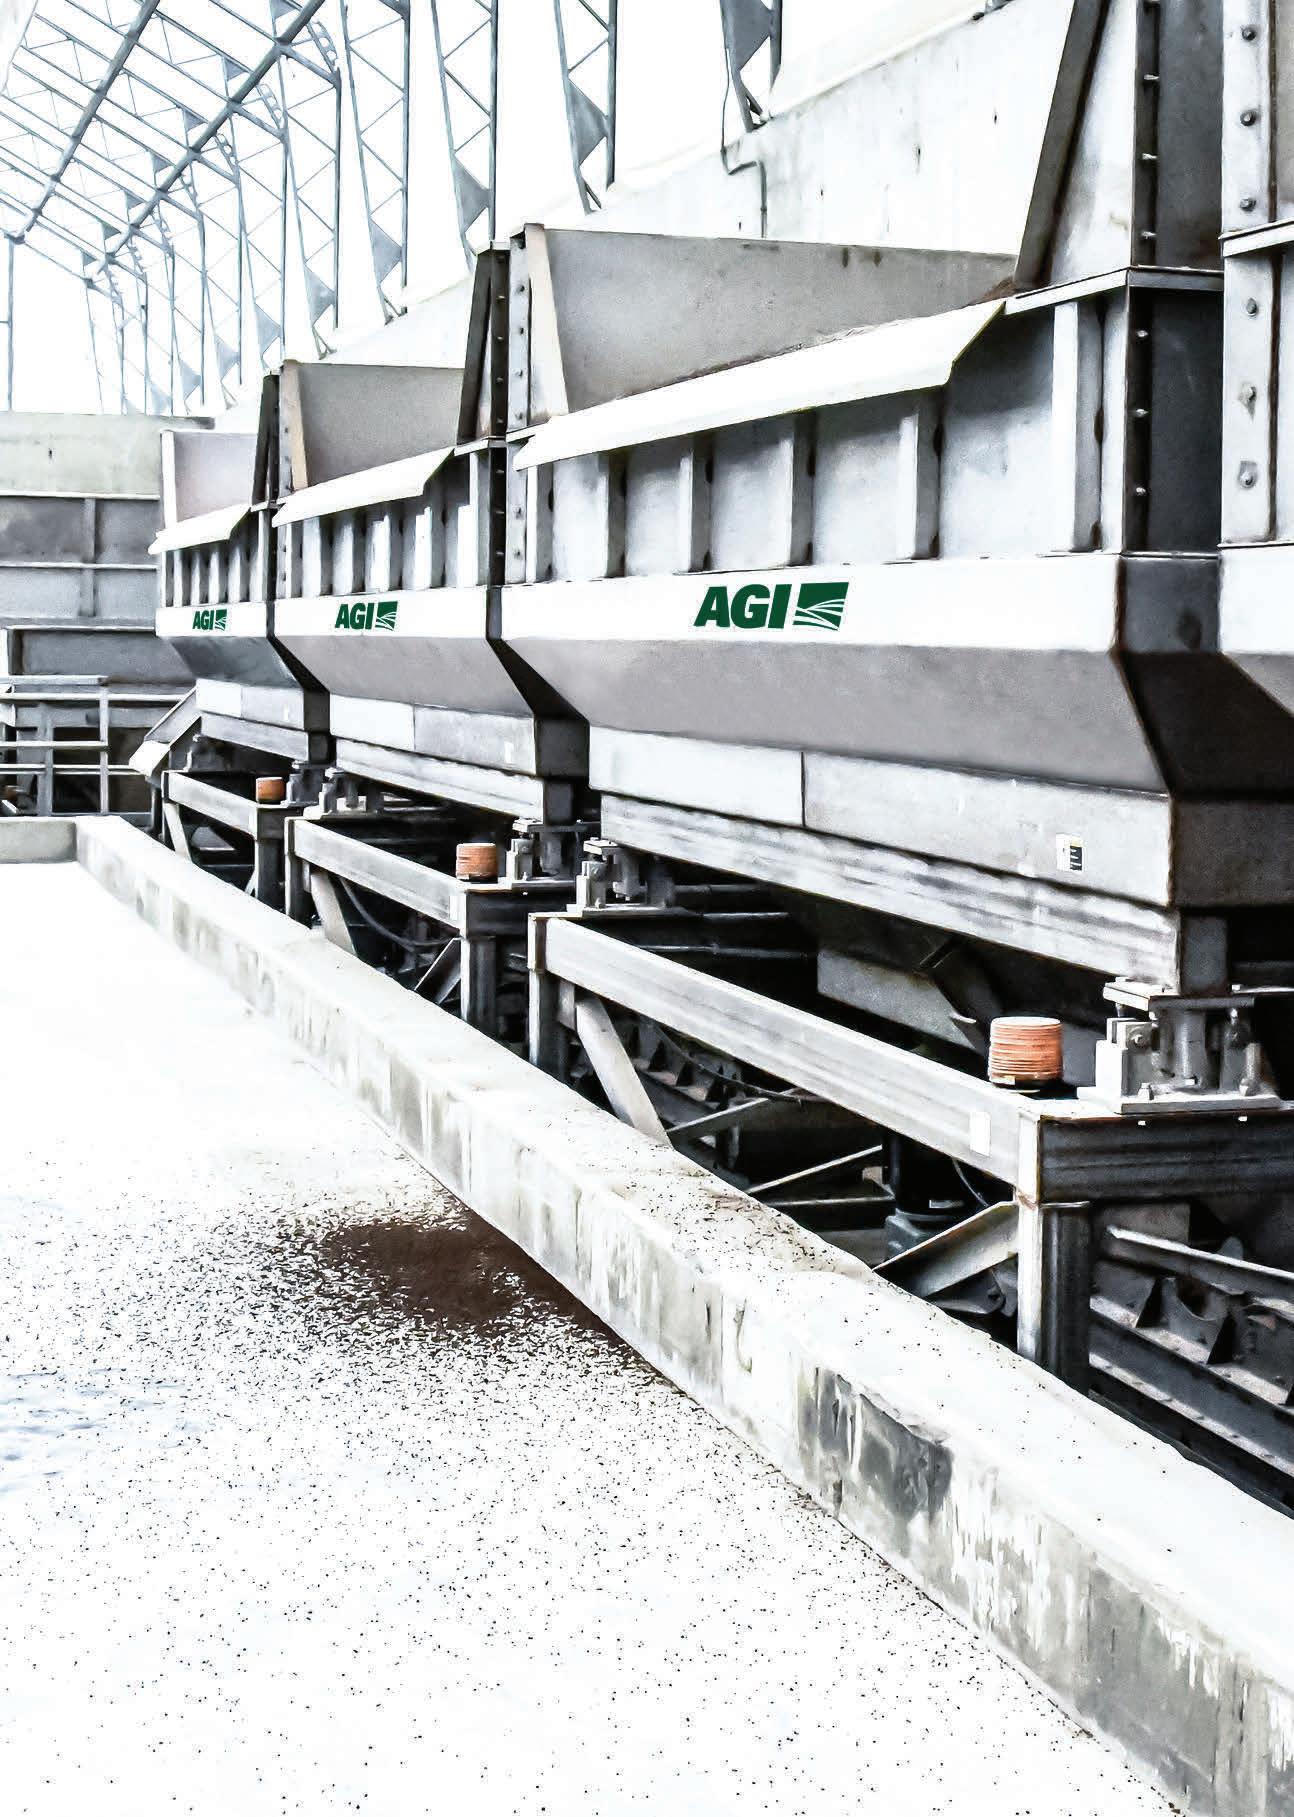
capacity possible. Adding to the design, the vessels are rubber lined and, therefore, sensitive to temperature. If the pressure drop across the pads were to increase excessively, the temperature in the vessels would increase excessively and could damage the rubber lining. Therefore, the pressure drop across the mist eliminator was to be always limited to a maximum of 50 mm WC (when clean) – even when pluggage of the mist eliminator occurs. To meet this requirement, each mist eliminator was designed with pressure-relief doors. The pressure relief doors are strategically located across the pad’s cross-section (Figure 5). The doors are designed with a specific weight that would allow them to open when the pressure drop across the pad reached 50 mm WC. The doors would open and allow the gas to bypass the material to avoid temperature excursions within the vessel. The entire construction was supplied in PP.
Advancements in gas cleaning technology have been achieved through the practical applications of theoretical concepts, integrating them with real-world experiences across various chemical processes in the fertilizer industry. Addressing gas cleaning challenges hinges on a thorough comprehension of the process system, adherence to sound engineering practices to anticipate potential chemical interactions, and the ability to recognise both common and less obvious issues based on experience. Clients must decide whether to implement solutions, considering their financial and liability concerns. However, this article underscores often overlooked design considerations and emphasises the critical role of mist eliminators as an integral component of the chosen control technologies.
Industry-leading blend accuracy figures are just the beginning of the benefits AGI brings to your operation. Rely on AGI Fertilizer Systems for full product manufacturing capabilities, engineered to order solutions, high quality stainless steel construction and much more. Discover for yourself how AGI is working to deliver on the ultimate measure of quality: 100% customer satisfaction.
Mist eliminators are often utilised in the fertilizer industry to prevent mist carryover and reduce air pollution and loss of product during the production of various fertilizers and precursors such as sulfuric, phosphoric and nitric acids. Applications in ammonium nitrate operations include the purification of steam from the neutralisation and evaporation processes, removal of ammonia and ammonium nitrate from the prilling operations, and sulfur dioxide discharge reduction from sulfuric acid plants.
There are different categories of mist eliminators, such as vane or baffle-type, mesh pads, and fibre bed or candle filters, each with unique mist collection mechanisms. Therefore, selecting the appropriate mist eliminator type for a process requires careful evaluation and comparison of various factors. Understanding how mist droplet collection mechanisms operate helps distinguish the different types of mist eliminators:
n Impaction – applicable for larger droplets, 2 microns in diameter and greater, that move along with the gas stream until the particle comes to an obstacle, such as a fibre in the filter media. The gas stream flows around the fibre, and the large diameter particle, controlled by its momentum, continues its original trajectory and ‘impacts’ onto the fibre.
n Interception – applicable for smaller droplets, between 0.5 – 3 microns in size. The particle has less momentum, and the centre of gravity path goes in the same direction as the gas around the fibre. However, the particle has a finite diameter, and the edge of the particle is ‘intercepted’ by one or more fibres and is collected.
n Brownian diffusion – applicable for sub-micron mist droplets that have very little mass and therefore little momentum, so the mean path of these particles follows the gas stream around the fibre. However, the sub-micron particle movement mimics the random movement of a


Marilia Davidson, Damion Adams, USA, and Ali Goudarzi, the Netherlands, CECO, explain how droplet collection mechanisms operate and help distinguish different types of mist eliminators.
gas molecule (Brownian motion), causing deviations away from the mean stream. With a given fibre diameter, residence time, gas velocity, bed depth, and packing density, these deviations cause the submicron particle to collide with the fibre and be collected.
Vane mist eliminators offer an efficient and cost-effective solution for mist collection and operate on the principle of inertial impaction. They consist of parallel corrugated sheets, often referred to as vanes or chevrons, which are
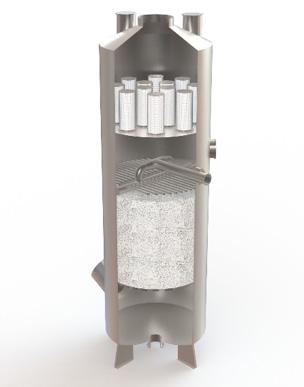
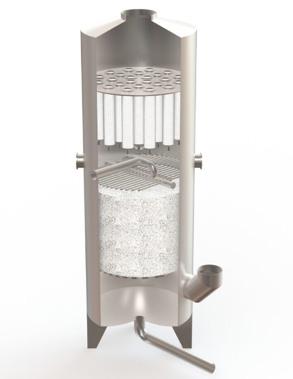
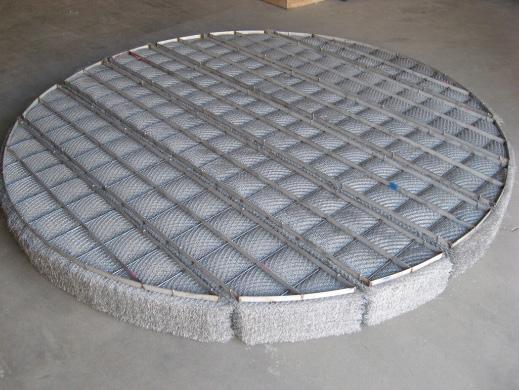
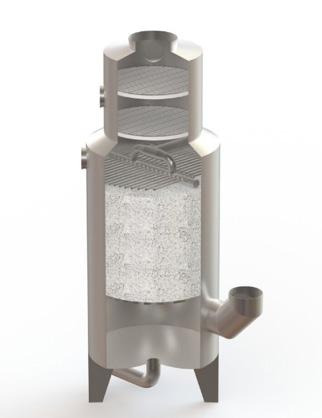

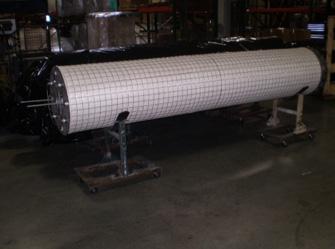
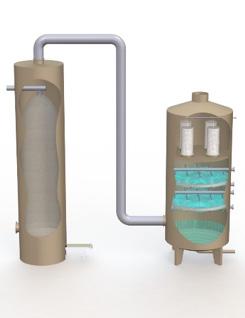
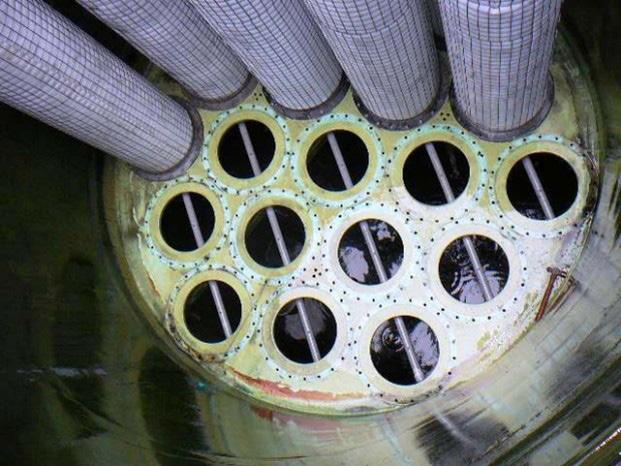
held at a fixed distance apart to create a sinuous flow path for the mist-laden gas. As the gas navigates through the twists and turns of the vane, the heavier liquid droplets cannot change direction as quickly as the gas due to their momentum. This difference in inertia causes the droplets to impinge on the vane surfaces, where they coalesce into larger drops and eventually drain away.
Standard vanes are particularly useful in applications where fouling is a concern. Their robust design and ability to efficiently separate droplets as small as 10 – 40 µ m at low-pressure drop makes them suitable to handle heavy-particulate environments upstream of a more efficient polishing filter.
Mesh pad mist eliminators are made of layered knitted mesh that is individually crimped to the desired height to maintain density and specific surface area. The mesh arrangement has a high open area for gas flow to reduce pressure drop and a fine wire surface area to increase droplet collection efficiency. Mist droplets collide on wire surfaces (impaction and interception collection mechanisms) and/or coalesce together to form larger droplets, which then drain to the bottom of the pad by gravitational force.
Fibre bed filter elements are typically constructed in annular cylindrical form (candle-style filters) with outer and inner screens where the fibre bed filter material is placed between the two screens. Particle-laden gas passes horizontally perpendicular to one side of the fibre bed and cleaned gas exits from the opposite side.
These filters remove liquid mist, droplets, and soluble particulates from a process air or gas stream. They excel at high efficiency, up to 99.9 at wt % removal of fine aerosols and particulates as low as 0.2 microns and may also be used to collect insoluble solids. They are particularly useful for preventing contamination of subsequent processes and corrosion damage to downstream equipment, eliminating undesirable atmospheric emissions, and valuable product recovery.
The fibre bed filter elements can be a standing type, which rests on a tube sheet, and gas flows from inside the filter to the outside, or a hanging type, where filters are suspended from the tube sheet and gas flows from outside to inside (Figure 1).
CECO's Graded Bed TM media bed is constructed of multiple layers of different media types. Specific media layers are selected to improve flow distribution and solid particle depth loading on the inlet side and higher-density media to achieve a high collection efficiency of sub-micron particles on the downstream side. This technology provides performance for sub-micron droplets (~ 0.2 – 1 micron range), with lower pressure drop, while extending the filter's lifetime.
Filters like the TWIN-PAK® by CECO are designed to increase capacity by ~ 60% or decrease pressure drop by ~ 40% compared to a single wall filter. They utilise smaller and less expensive filter systems and the inner filter is nested inside an outer filter, both equal in design, taking advantage of the unused space inside the standard filter element and increasing the effective surface area for


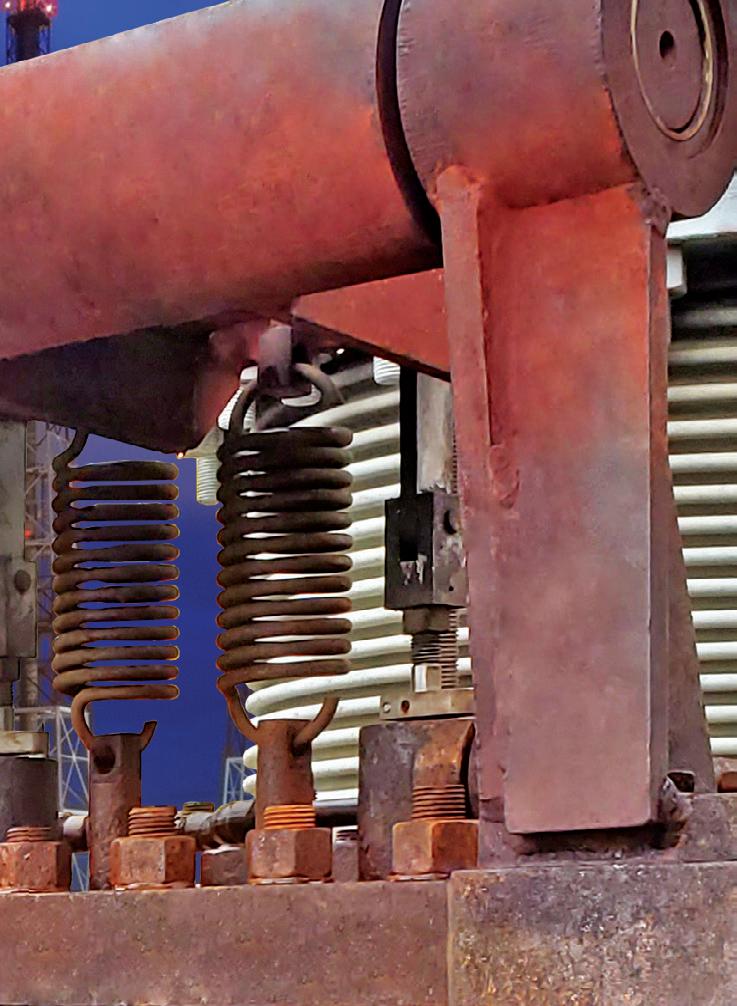

mist collection. This design is also convenient for retrofit projects where increased throughput is desired without
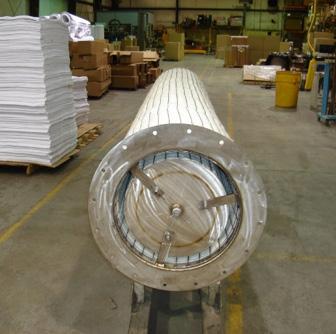
vessel modifications since the TWIN-PAK filters are often installed on the existing tube sheet.
It is important to consider the size, distribution, and characteristics of the droplets to be removed, as well as gas flow rate, pressure drop, and liquid load in the gas stream. These factors help determine optimum and efficient performance.
Gaseous contaminants in phosphate fertilizer processes include phosphorous-containing particulates, fluorides, and heavy metals. In nitrogenous fertilizer processes, nitrogen-containing particulates and ammonia are the predominant contaminants.
During fertilizer production, aerosols and mists with varying droplet sizes are created due to chemical reactions, thermodynamic changes, or mechanical shearing. It is often difficult to get a droplet size distribution in the design phase of a new project, but fortunately, pollution control equipment targeting specific fertilizer applications has already been established as an industry standard over the years.
Most often in retrofit projects, there is an allowance for the maximum pressure differential between the inlet and outlet of the mist eliminator that can be tolerated. This can significantly impact the selection and design of a mist eliminator while targeting for the highest possible mist removal efficiency. The pressure drop directly correlates to velocity and can be influenced by many factors, including solid and liquid loadings and varying gas and liquid densities.
The velocity of the gas is a critical design parameter. Vane-type mist eliminators are more suitable for high gas velocities, up to approximately 1950 fpm, and fibre bed mist eliminators are more suitable for low velocities, up to 45 fpm.
Similarly, the liquid handling capability varies among different mist eliminators. High liquid loads, for example, can quickly flood a fibre bed filter and negatively impact its mist collection performance. Above the liquid load, droplets go through the mist eliminator and re-entrain the gas stream.
A large fertilizer production company in the US approached CECO Environmental to support a retrofit project to increase high-density AN prilling capacity by 20% without costly CAPEX.
The existing system consisted of a dual-stage vertical scrubber with a heavily irrigated mesh pad and candle filter to remove ammonia gas, sub-micron AN from the gas stream and to control opacity from the prill tower exhausts.
The first stage mesh pad was sprayed at the top and bottom with nitric acid solution to remove ammonia gas in the form of aqueous ammonium nitrate, and to remove prill particulates greater than 2 microns.
The second stage had a higher efficiency and targeted particulates smaller than 2 microns in size. Candle filters were the last step in the filtration system and provided the highest removal efficiency, collecting submicron
particulates, which are often the culprits of visible stack opacity. All the mist eliminators were irrigated with process water to solubilise and dissolve the trapped AN particulate to prevent pressure buildup.
The new design is comprised of filters packed with graded bed media featuring a double filtration design, utilising the inner annular filter space and providing more surface area while keeping the original filter's outside diameter and length intact.
Before the retrofit, 62 standard filters were installed into the 6.4 m diameter vessel. After the retrofit, 50 filters were installed, and 12 openings on the tube sheet were capped.
The new design significantly improved the efficiency at every particle size exclusion.
In addition to the filter changes, the spray system was redesigned to provide extra spray locations, which improved the washing of AN dust upstream of the filters, preventing rapid solid buildup and, as a benefit, reducing maintenance shutdowns.
The modifications enabled the system to be in full compliance with ammonia, AN dust, and opacity emission requirements while minimising OPEX through a list of benefits highlighted below:
n Lower quantity of filters.
n Reduction of fan power consumption due to lower pressure drop.
n Extended filter service life (two additional years) due to lower pressure drop when combined with better washing.
Parameter Before retrofit After retrofit
AN dust content target < 2.5 mg/Nm3
Ammonia content target < 0.7 lb./h or 0.32 kg/h
5 – 6 mg/m3 < 2.5 mg/Nm3
0.5 lb./h or 0.23 kg/h 0.4 lb./h or 0.18 kg/h
Opacity target < 5% 9% < 5%, with no visible plume emissions
Total pressure drop target 450 mm W.C.
Maximum = 550 mm W.C.
350 mm W.C. across the fibre bed filters. 550 mm W.C. total pressure drop, max.
300 mm W.C. across the fibre bed filters. 420 mm W.C. total pressure drop.
Mist eliminators are widely used during the production of fertilizers to remove liquid droplets from gas streams, which are often sources of pollution or nuisance mist damaging downstream equipment. Vane, mesh pads and fibre bed filters are the three main categories of mist eliminators, each operating via impaction, both impaction and interception, and Brownian diffusion mechanisms, respectively. A careful consideration of design factors, including, but not limited to, droplet size and characteristics, gas flow rate, pressure drop, and liquid load, can provide significant savings in the operational costs of a process under retrofit planning with no changes to existing equipment.
 Table 3. AN Prill tower exhaust conditions before and after retrofit.
Conrad Abu Dhabi Etihad Towers
CRU and UniverSUL Consulting, with the support of event host, ADNOC, are delighted to announce dates for the Middle East Sulphur Conference (MEScon), taking place at The Conrad, Abu Dhabi Etihad Towers 20-23 May 2024.
MEScon is devoted to networking, thought leadership, innovation and best practice operations across the entire sour gas and sulphur value chain. With the region’s prominence in the global sulphur industry, MEScon is where the sulphur and sour gas community meet to discuss and debate the key strategic themes driving the industry.
• Develop practical solutions to common operational problems
• Share know-how and best practice with industry peers
• Learn about new projects and technology developments
• Understand key drivers of supply and demand
• Meet with key industry contacts to negotiate new business
• Address your technology and engineering needs with a exhibitors
The Middle East, and in particular, Abu Dhabi, are at the epicentre of global sulphur and sour hydrocarbon production, making this the ideal location; Join us this May.


Measurements in industry can sometimes be unreliable due to a series of factors, and bad data can hinder evaluations and modelling. Testing systems are important to validate and update available models. This article evaluates a simplified product model in a prototype test bench and shows a comparison of expected to measured data of dry and wet pressure drop in a Brownian diffusion mist eliminator.
Brownian diffusion mist elimination relies heavily on residence time, which is attainable by low velocities in laminar flow (low Reynolds). This is due to the probability dependency of efficiency in the Brownian motion collection mechanism.
Pressure drop for laminar flow depends directly on fluid viscosity and fluid velocity, seeing as a low Reynolds number

Alexandre Rossi, Breno de Almeida Avancini, Laryssa Lobo, and Vitor Sturm, Clark Solutions, Brazil, discuss the importance of testing systems in validating and updating models, highlighting the example of Brownian diffusion mist eliminators.
represents that viscous forces are relevant in comparison to inertial forces:
vu/L 2 ν μ
Lower Reynolds means that viscous forces are important.
This causes a linear pressure drop profile in respect to both velocity and viscosity (∆P∝u∙µ). This profile is different than the typical second-degree polynomial
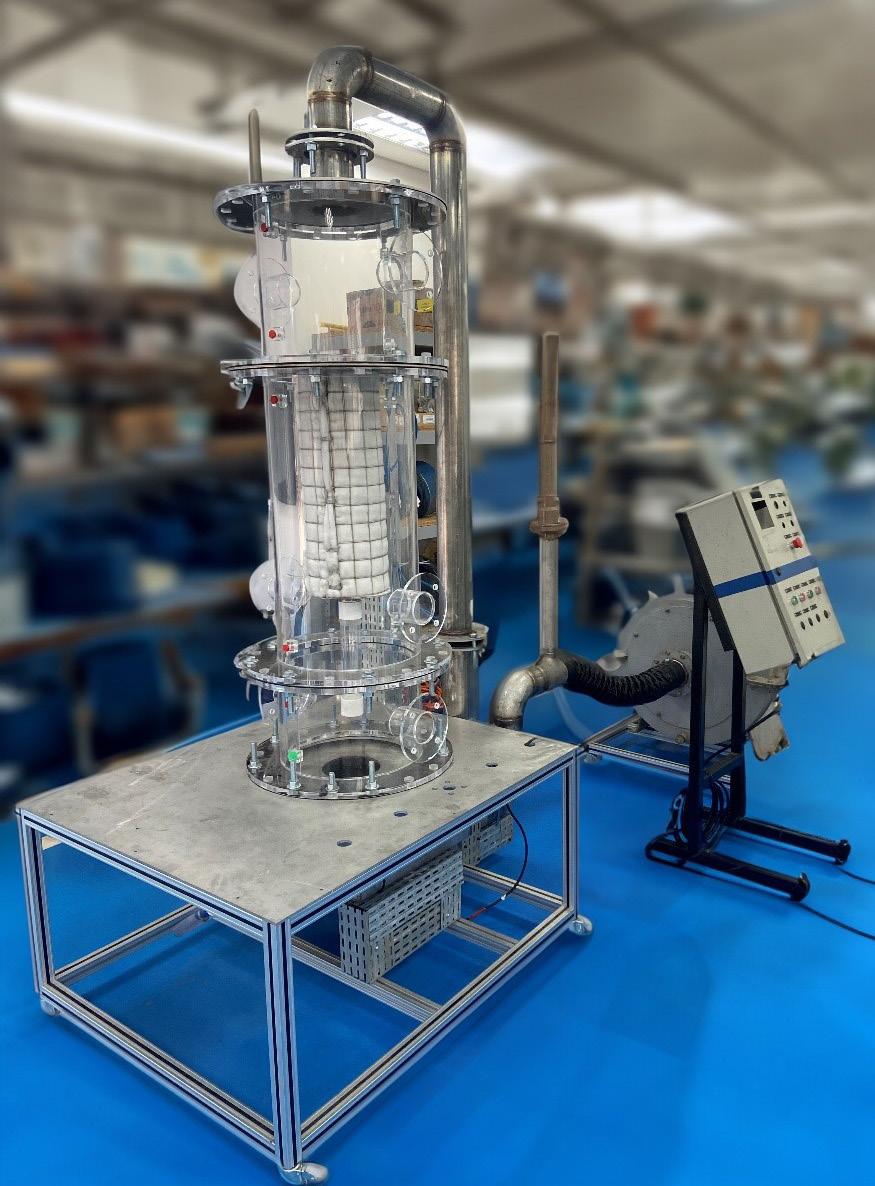
pressure drop curves seen in inertial impaction mist eliminators that rely mainly on momentum and inertia.
Dry pressure drop can be written as a function of gas velocity ( u ), gas viscosity ( μ ), bed thickness (t), bed porosity (ε) and fibre characteristic length (l).
The above is a simplified model due to proprietary knowledge. For a given element, the thickness, porosity, and fibre characteristics are set, so the pressure drop can be expressed as:
In the above equation, α represents the combination of filter element geometric parameters and characteristics. This equation indicates that a given element will produce a linear dry pressure drop regarding both velocity and viscosity.
A new prototype test bench was designed, manufactured and assembled by the R&D Clark Solutions teams (Figure 1).
The main objective of the prototype test bench was to assemble a system capable of investigating FiberBed TM candles of different sizes and attributes, obtaining important characteristics such as pressure drop and efficiency. This article will focus on the dry and wet pressure drop measurements. A comparison of experimental data and theoretical values was also carried out.
The secondary objective was to assemble a versatile bench, capable of carrying out tests with the FiberBed but also other relevant internals. This objective was also achieved, with tests run using mesh pad mist eliminators as well as successful runs with the DrySeal TM device.
The prototype test bench consists of an acrylic vessel with integral flanges, differential pressure transmitters, temperature transmitter, a pitot tube, a fan, and a nebulising unit. The prototype test bench is controlled by a PLC panel that has the capability of being controlled from any location with internet access. This kind of capability enables engineers to control and analyse data recorded by the test from any location with internet access (Figure 2).
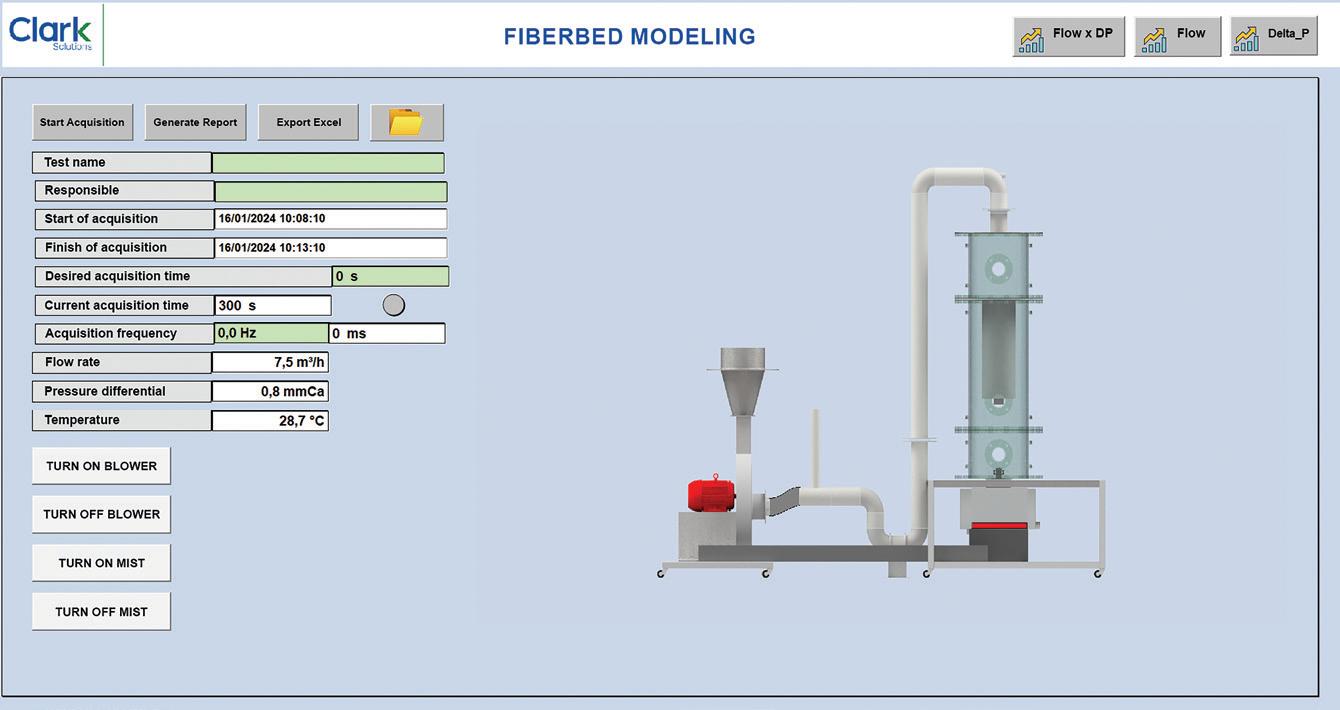
Several experiment runs were carried out to deliver a set of points, allowing for the analysis of the model's results when compared to data recorded in experiments.
After processing the experiment's data, this was plotted against the model (Figure 3). As expected, the pressure drop profile was linear. Alignment of the experimental and model results is verified,
although model calculations predict slightly higher values of pressure drop for the same value of volumetric flow.
During testing, uncertainty was observed for flowrate measurements, while a negligible uncertainty was observed for differential pressure measurements. Better results can be achieved with a more controlled fan and more precise flowrate measurement. The results show a 5 – 10% difference comparing theoretical and experimental data, which is within flowrate uncertainty, but was mainly caused by the slope difference between model and experimental data interpolation.
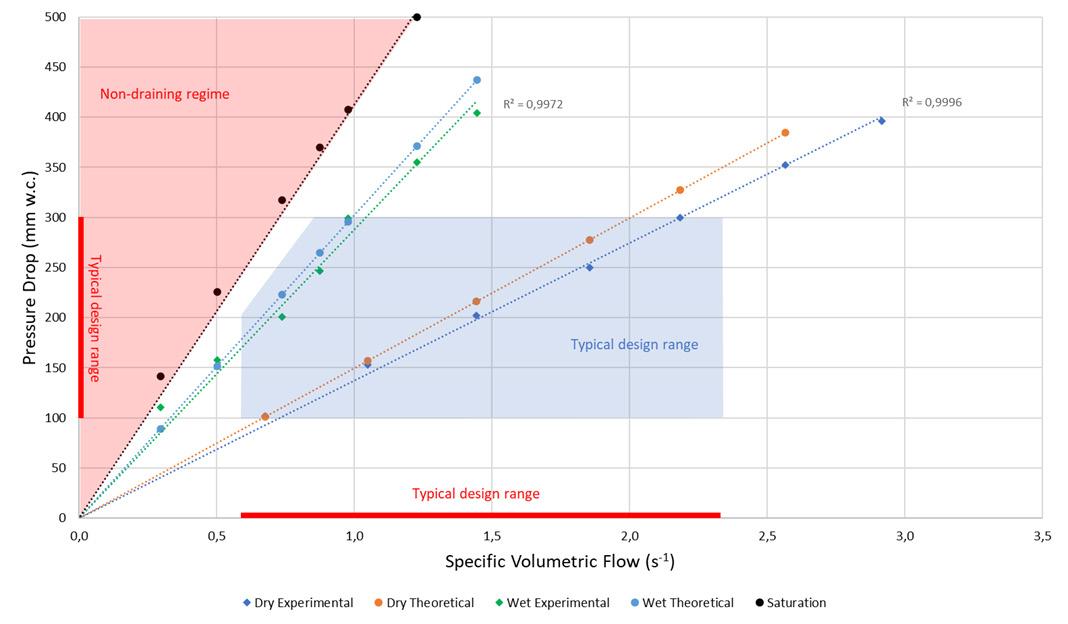
The slope difference between theoretical and experimental results can be attributed to characteristics such as bed density and fibre diameter which have tolerances that can contribute to the observed difference in the results. In a set of elements, marginal differences in slopes would be expected, producing an array of lines around the presented theoretical lines. Further testing will either regress the experimental line back to the theoretical, validating the model, or will show the need for a model update. However, the current results are within deviation and the current model stands.
In practice, when arranging sets of elements, new projects are designed to operate in the 100 – 250 mm water column standard range, while compact designs should operate in the 250 – 350 mm water column range. Knowing fluid properties during operation is extremely important as viscosity is a key factor for model predictions.
For instance, chlorine gas has a viscosity of 0.013 cP in the typical 15 – 40°C temperature range whereas air has 0.018 to 0.020 cP in the typical 15 – 80°C range. Chlorine applications are usually in the lower pressure drop range, as chlorine's viscosity is around 30% lower than air.
Conclusion
Testing units are important to validate and update models as well as observe behaviour of the product, especially in the operational envelope. A new generation of mist eliminators is under development with enhanced capacities, as prototypes can be quickly tested and their capabilities verified. As a result of the presented test, there is evidence that the current Fiberbed mist eliminator model is appropriate to predict its behaviour in applications.
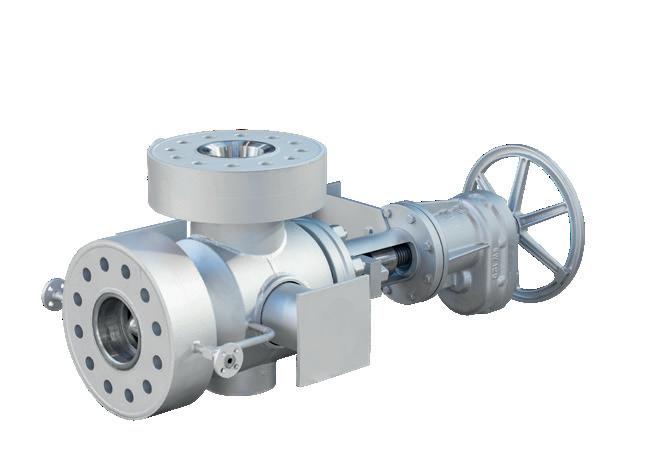
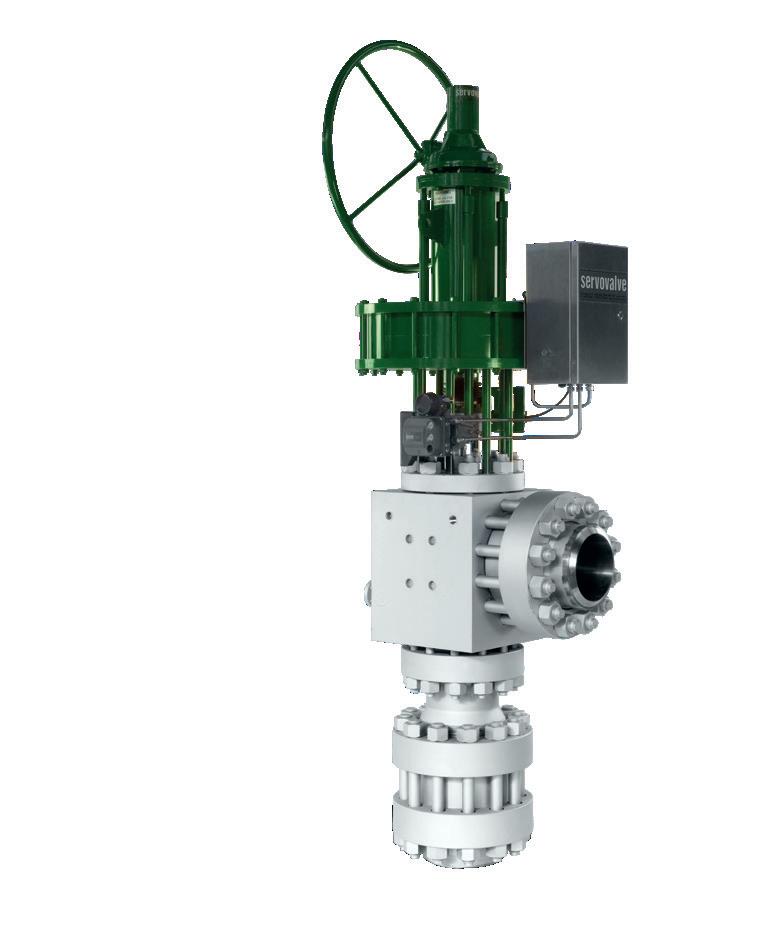


Todd Swinderman, Martin Engineering, USA, discusses how issues with dust control in the fertilizer industry can be addressed through effective conveyor skirtboards and curtain design.
The fertilizer is industry is unique in that it handles several types of bulk materials, both organic and inorganic, many with sticky, acidic, or powdered properties. What the conveyed materials all have in common is the ability to leave the cargo flow in the form of dust or spillage upon transfer if not properly contained.
Failing to control material loss from spillage, dust and carryback emissions has consequences of unplanned downtime, excessive cleaning costs, regulatory actions, poor public relations and safety incidents. Addressing the issues with workable long-term solutions improves availability, housekeeping and safety, ultimately enhancing the company’s cash flow.
The skirtboard enclosure is essentially a low-efficiency settling chamber. The basic concept is that a dust particle will settle out of a laminar air stream based on the speed of the air flow, V air , and the terminal velocity, V t , of the dust particle (Figure 1).
There are many rules of thumb, along with traditional and industry-based practices for skirtboard sizing and dust curtain placement in an attempt to contain the dust in the skirtboard enclosure. Most of these practices are without proof of performance other than merely habit.
Current practice for conveyor skirtboard enclosures is to design for V air ≤ 1.0 m/s by increasing the height of the enclosure. Two common
rules of thumb for the enclosure length are two times belt width or 0.6 m for every 1.0 m/s in belt speed. If H is increased, the distance (L) that the average dust particle must travel also increases.
A ‘standard conveyor’ was established as the baseline for the study. The standard conveyor is a 1200 mm wide belt

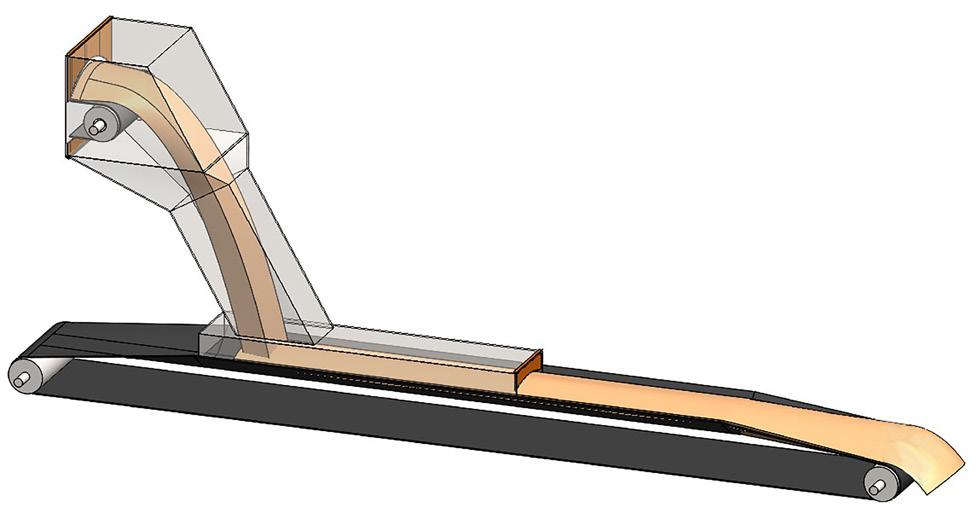
with a 35° trough angle, travelling at 2.0 m/s. A generic material was used to produce the baseline data, with a bulk density of 1442 kg/m 3 and a nominal 50 mm minus particle size distribution with a 20° surcharge. The discharge chute was sized based on a material volume equal to or less than 40% of the chute cross section. A drop height of 3 m, an open area of 0.9 m 2 , an average particle size of 25 mm and bulk flow of 1680 tph were used to calculate the induced air volume (Figure 2).
Several variables were investigated to simplify the analysis. The complete conveyor with discharge and receiving belts was modelled and, while there were significant regions of recirculation in the upper discharge section, the air flow in the chute was reasonably consistent. So, the chute was simplified, with the air volume and dust particles injected into the last 2 m of the chute (Figure 3).
The combination of variables studied are given in Table 1. Both external and internal analyses were conducted, with complete moving discharge and receiving conveyors. The bulk material surface was set to absorb particles and the walls were set to reflect particles. The effectiveness of the enclosure variations was determined by counting the number of each size particle that escaped the end of the enclosure compared to the number injected.
The results of the external analysis indicated that escaped dust particles increased in speed, as the air current is affected by travelling around the belt and the discharge pulley. This phenomenon is known as the Magnus effect and emphasises the need for effective belt cleaning as close to the discharge as possible. A space of 1 mm between the bottom of the skirtboard and the belt was used to simulate leakage (Figure 4).
Several experienced maintenance technicians were surveyed, and their preferred curtain arrangements modelled. In addition, multiple curtain designs and placement schemes were studied, including staggered, slit, curved, angled, with and without slits, with holes and no curtains. Several unconventional skirtboard enclosures were modelled in an attempt to create recirculation in the enclosure and improve dust settling (Figure 5). The optimum design for the standard conveyor was determined to be a conventional enclosure with a height of 600 mm, a length of 3.6 m and three dust curtains placed in defined locations (Figure 6).
Worn exit curtains were also modelled, and as the spacing above the load increased, the dust settling performance deteriorated. The use of a single curtain right at the exit proved problematic in all cases, acting to speed up the exit air flow even further when close to the belt and re-entraining dust in the exiting air stream, while being ineffective in creating recirculation within the enclosure. When the curtain placed at the exit was worn too much, it was as if there was no curtain at all. A curtain placed right at the exit and adjusted close to

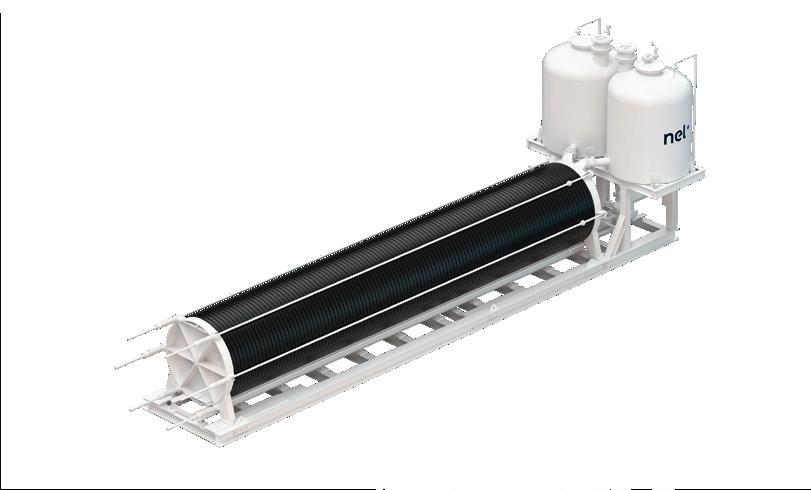
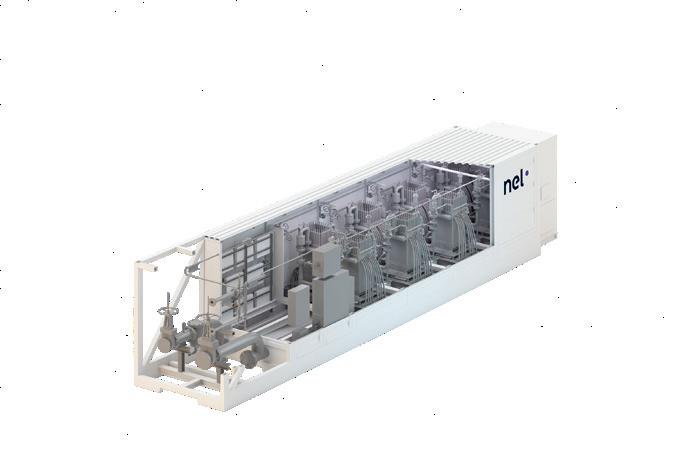
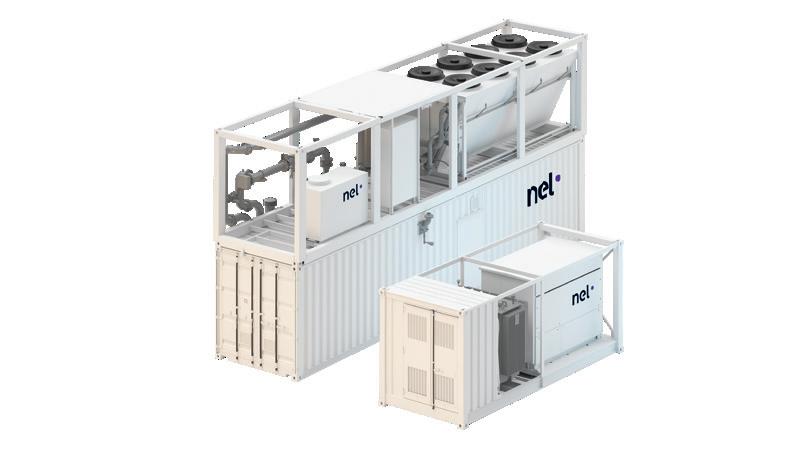
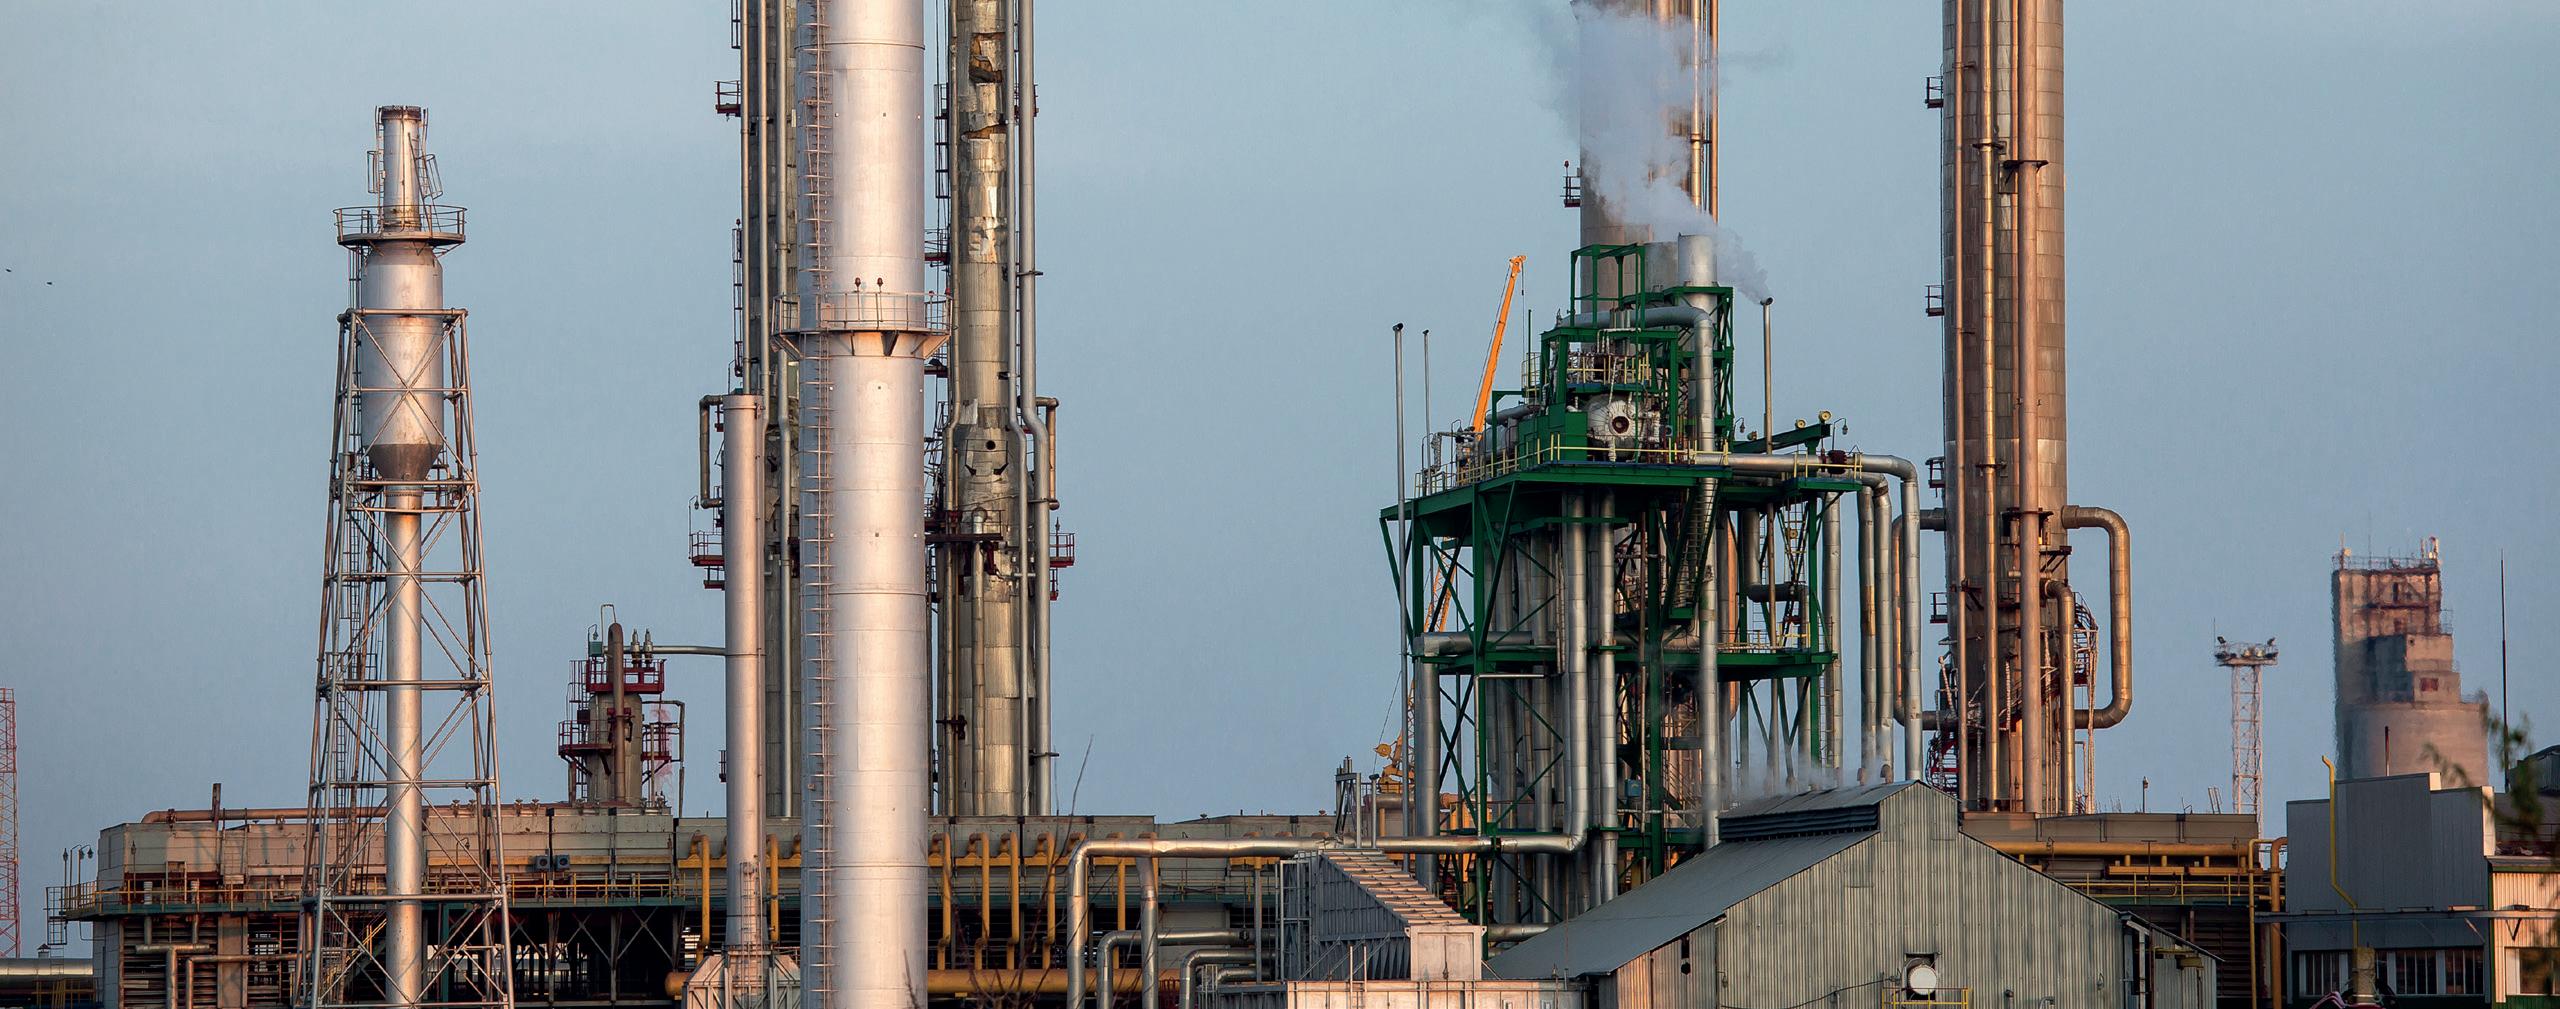
• Market analysis
• In-depth technical articles
• In-depth regional analysis by key players in the industry
• Comprehensive technical reviews covering all aspects of fertilizer production, from plant optimisation and automation to blending, bagging, and dispatch
the load creates another fugitive material problem, sometimes called the popcorn effect, where the curtain causes spillage by knocking material off the belt.
Solid density had little effect on the settling of nuisance dust particles from 100 – 25 μ m. In every case, 100% of the
100 and 40 μ m particles settled almost immediately. As the bulk density increased, there was a moderate reduction in respirable dust emissions.
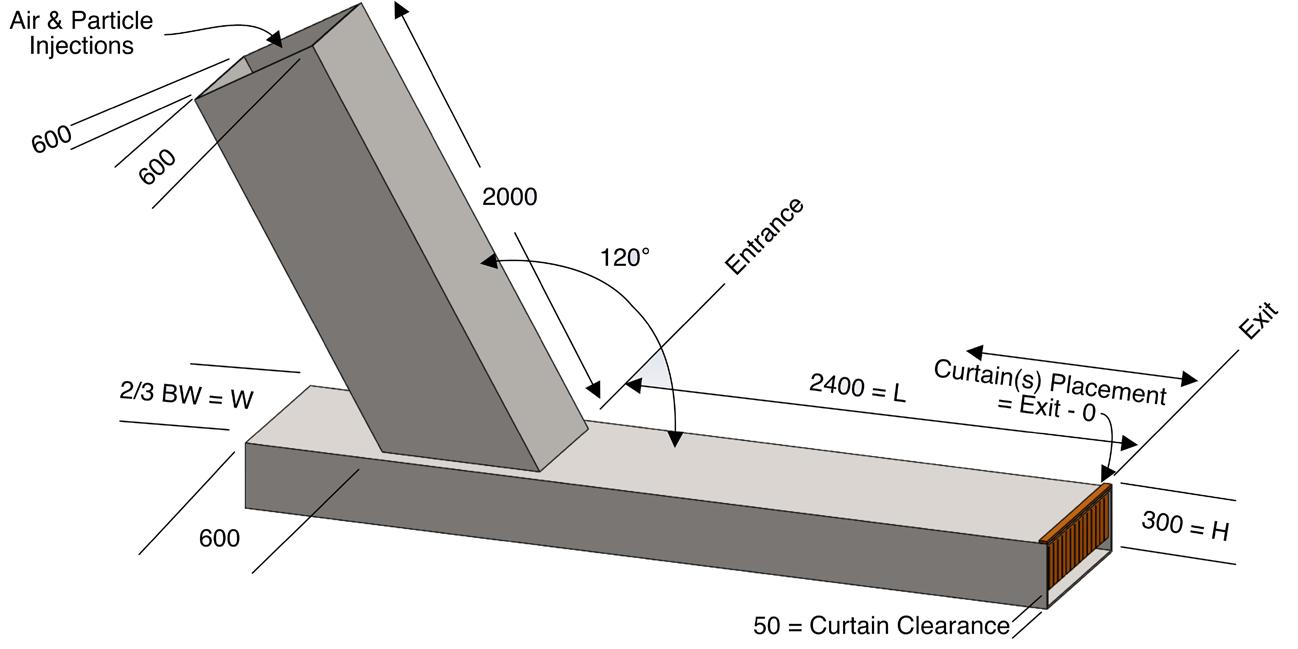
The junction between the discharge chute and the skirtboards was found to be an important design detail for creating recirculation. Making the width of the discharge chute narrower than the width of the skirtboard helps to fold the air flow going into the first curtain, and that encourages distribution of the air flow towards the top of the enclosure, rather than along the surface of the material. The retrofit and mitered junctions were significantly more effective than a simple butt connection and 300 mm height. The tail box had little effect on dust emissions out of the exit end of the skirtboards. In most configurations, the height of the tail box was set at 300 mm. The tail box length was set at 600 mm to match the typical 600 mm idler spacing used in the load zone by most conveyor manufacturers and engineers.
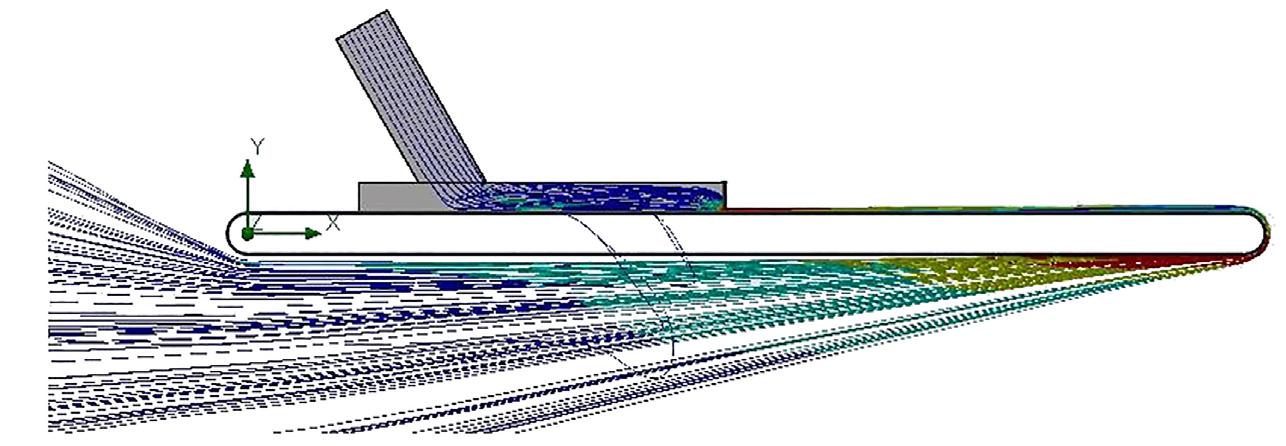
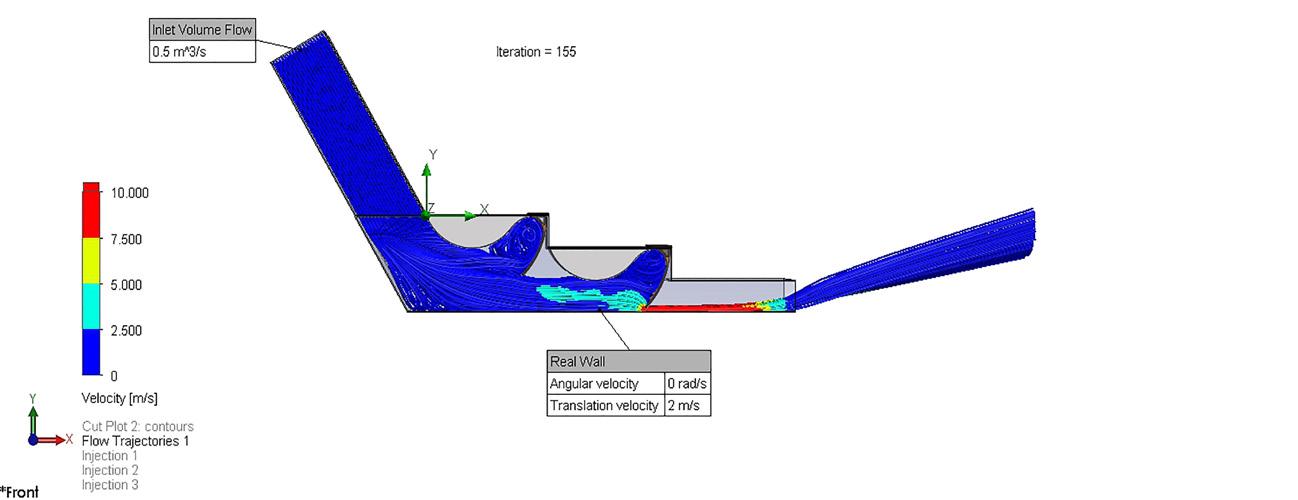

It was found that for most situations, a 3600 mm long skirtboard produced the best results. Increasing the length to 4800 mm and height to 900 mm had some marginal effect, but may not be worth the extra investment.
An enclosure height beyond 600 mm for the standard conveyor with a single exit curtain did reduce nuisance emissions but tended to increase respirable dust discharge, because the average settling path was greater with the higher enclosure.
As would be expected, the average air velocity through the skirtboards was directly proportional to the induced air flow and cross-sectional area. Average velocities in the skirtboards due to induced air ranged from 0.8 to 2.8 m/s. Belt speed has a minor effect on the average velocities. The maximum air velocities were almost always found where the air flows under the skirtboard curtains. These high air speeds kept the respirable dust suspended, so reducing induced air into the chute is also important in improving performance.
The best results were obtained with three or more curtains. The design of the slits in the curtains is important to allow air to

pass through, allowing the airflow paths to fill the entire chamber and not just flow at high speeds under the curtains. It was found that the individual flaps should be about 50 mm wide, with slits at least 5 mm wide and the curtains extending the full width of the enclosure (Figure 7).
Preferred embodiments
The best value for the cost of the skirtboard enclosure and its effectiveness is judged as skirtboards 600 mm high and 3600 mm long and three full width slit curtains
using either the retrofit or mitered discharge chute-to-skirtboard connection (Figures 8 and 9).
Design recommendations
n Discharge chute width across skirtboards 200 mm < width between skirtboards.
n Skirtboard outside width based on horizontal dimension of free belt edge for sealing and belt wander edge allowance ≥ 115 mm per side (Foundations™ method). 1
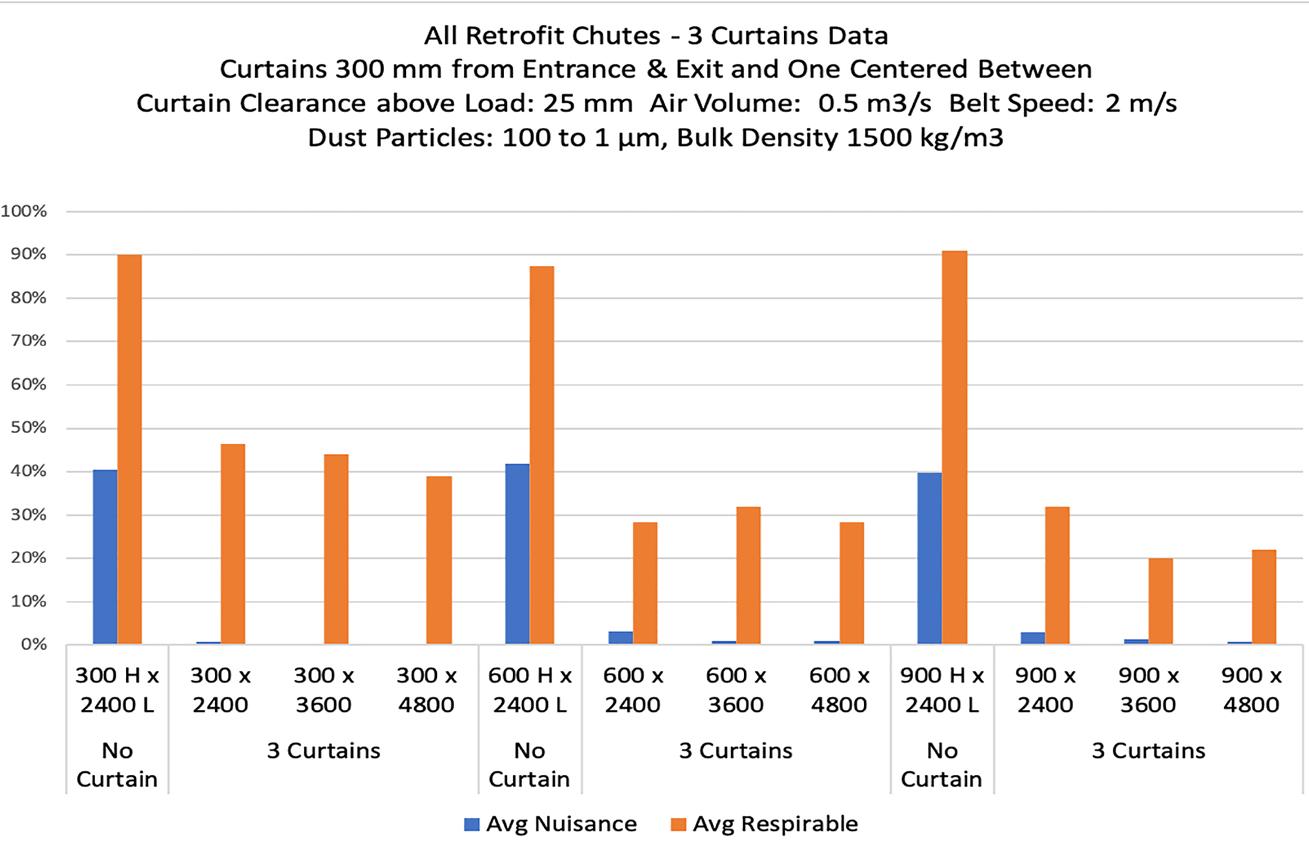
n Skirtboard height ≥ 600 mm.
n Inlet to skirtboards air volume flow ≤ 0.50 m 3 /s.
n Length of skirtboards for material loading turbulence ≥ 1000 mm when required.
n Length of skirtboards for dust settlement ≥ 3600 mm plus extra allowance for loading turbulence if necessary.
n Skirtboard dust curtains:
§ Entrance (first) curtain 300 mm past end of extra allowance for material turbulence and distributing air flow.
§ Middle second) curtain centered between entrance and exit curtains.
§ Exit (third) curtain 300 mm from end of skirtboards.
§ Curtain clearance above the bulk material: 25 mm preferred, 50 mm max.
§ Curtain flaps: ~ 50 mm wide strips separated by slots ≥ 5mm.
While some operational improvement is seen with increased skirtboard height and length, it is doubtful that it can be economically justified merely on the reduction of respirable dust alone. The true return on investment for new and retrofit conveyor transfer designs in fertilizer production is realised by reducing cleaning labour, increasing equipment life and eliminating dust emissions. If the improvements reduce the TWA of respirable dust emissions to the point where engineering or administrative controls could be less stringent, then a financial case could also be made based on improvements in labour productivity. 2
1. Foundations, The Practical Resource for Cleaner, Safer, More Productive Dust & Material Control, Martin Engineering, 4 th edition, copyright 2009.
2. Foundations for Conveyor Safety, The Global Best Practices Resource for Safer Bulk Material Handling, 1st edition, copyright 2016.
Maxine Schuetz, RHEWUM GmbH, Germany, underlines why the integration of advanced screening machines, along with efficient feeders and under-pressure dedusting systems, represents a leap forward in managing the hygroscopic dust challenge in fertilizer production.

As the world's population continues to grow, the demand for various fertilizers is constantly increasing, while the requirements for product quality and product manufacture are becoming more and more challenging. Usually, fertilizer producers have a daily output of several hundred tons to provide enough product and only tolerate
low deviations. Even small efficiency deficits in the screening process can mean large losses. Additionally, any maintenance work that requires the production to be switched off results in high and avoidable costs and again creates large losses.
Hence, dusty fertilizer not only causes challenges during production, but also later during its utilisation. The dust contaminates the production environment as well as the machinery equipment, therefore it is more difficult to handle, dose and distribute, not only in the production but also for the farmers on the field later. Ultimately this leads to a product loss and therefore loss of profit. Furthermore, it jeopardises the environment and the health of workers,
and both agglomerates and dust can be reliably removed by a screening machine.
The hygroscopic behaviour of the material is a difficult task during the screening process of urea or other nitrogenous fertilizers. In fact, there are different types of dust containing elements such as phosphorus, calcium, ammonia or urea, depending on the type of fertilizer. The combination of ambient moisture with the dust and the fines of the material creates agglomerates that stick to the screen mesh and clog it permanently. This significantly impacts the overall quality of the product and poses a particular challenge, due to its hygroscopic properties.
Additionally, during packaging and storage of the product, during the process, the presence of dust and its tendency to form lumps can lead to product instability, affecting shelf life and potentially leading to losses during the last process. As a result, high concentrations of dust can be an indicator of poor manufacturing processes, which can affect both quality control and compliance with environmental and health standards, as well as the perception and acceptance of the product on the market.
RHEsono® from RHEWUM GmbH, works with a high-frequency vibration directly on the screen cloth. Thanks to automatic cleaning impulses, which can achieve acceleration values of up to 50 g, the machine's screen cloth is free of clogging particles while it is in operation and kept ready for use. In addition, it features a static housing, which enables a dust-tight operation with a connection to a dedusting system. This feature enables dust emission prevention during the screening process, protecting both the working environment and the external ecosystem. In addition, this type of static machine not only protects the building and the surrounding steel structure from dynamic loads, but also allows the production flow to be inspected during operation. As a result, a smooth production flow can be achieved without production downtime and therefore without losses.
Another solution is the RHEsonox® machine type. It was developed to separate the screened material in the finest range and reliably remove dust, even with a flat screening inclination of the screen cloth. A combination of linear movements and direct excitation of the screen cloth is used as the drive. Two counter-rotating unbalance motors generate a linear movement that transports the material. Additionally, the direct excitation of the screen cloth prevents clogging of the screen surface by stuck particles. This drive combination achieves even better separations and applications.
As a product screen in fertilizer production, the machine type RHEsono is often used. It separates the grains according to their size, thus ensuring consistency in the fertilizer – a decisive factor for both the efficiency of the fertilizer and the yield of its process. On the other hand, flatter screens, e.g. RHEsonox, are used as polishing
screens, to remove the dust immediately before packaging in the final production phase. This step is important for the purity and quality of the end product.
Moreover, both machine types have a direct vibration transfer to the screen mesh, which enables automatic cleaning impulses to make sure that there is no clogging. Another benefit of these machines is that the production process is additionally guaranteed by the large number of smaller drives, as the process can continue if a single drive fails and still secure the production.
Nevertheless, the particle size distribution of the compound fertilizer is of key importance. Only a balanced particle size distribution without unwanted dust enables modern fertilizer spreaders to achieve the optimum throwing range, which can be up to 25 m.
A controlled and consistent material flow is a basic principle in screening technology, hence it is decisive for preventing even more dust. By distributing the material evenly and reliably on the entire width of the screen cloth, a consistent screening process can be achieved and support the material production. In addition, integrated pre-screening in the feeder can be used to remove larger lumps before the material reaches the screening machine. This pre-screening reduces the load on the screening surface, which enables better results. To ensure a safe operation in industrial applications and minimise the risk of leaks, fixed flange connections are foreseen. At the same time, the feeding equipment ensures dust-free operation, especially in environments where the prevention of dust contamination is crucial. This makes feeders the ideal partners for screening machines, supporting their efficiency quickly and easily.
Another approach in managing dust in screening machines is so-called 'under pressure dedusting.' This system works by creating a negative pressure environment within the screening machine, which helps in capturing dust particles more effectively. The under pressure system is connected to dedusting units, which extracts the dust from the screened material. It ensures that the output is not only of high quality but also free from excessive dust. This method is particularly effective in environments where dust control is paramount, not only for product quality but also for environmental and worker safety.
The integration of advanced screening machines, along with efficient feeders and under pressure dedusting systems, represents a significant leap forward in managing the hygroscopic dust challenge in fertilizer production. These technologies not only enhance the quality of the final product but also contribute to a safer, more environmentally friendly, and efficient production process. As the demand for high quality fertilizer continues to grow, these technological solutions are set to play an increasingly vital role in meeting both industry and environmental standards. Let us shape a world together in which progress and responsibility go hand in hand.


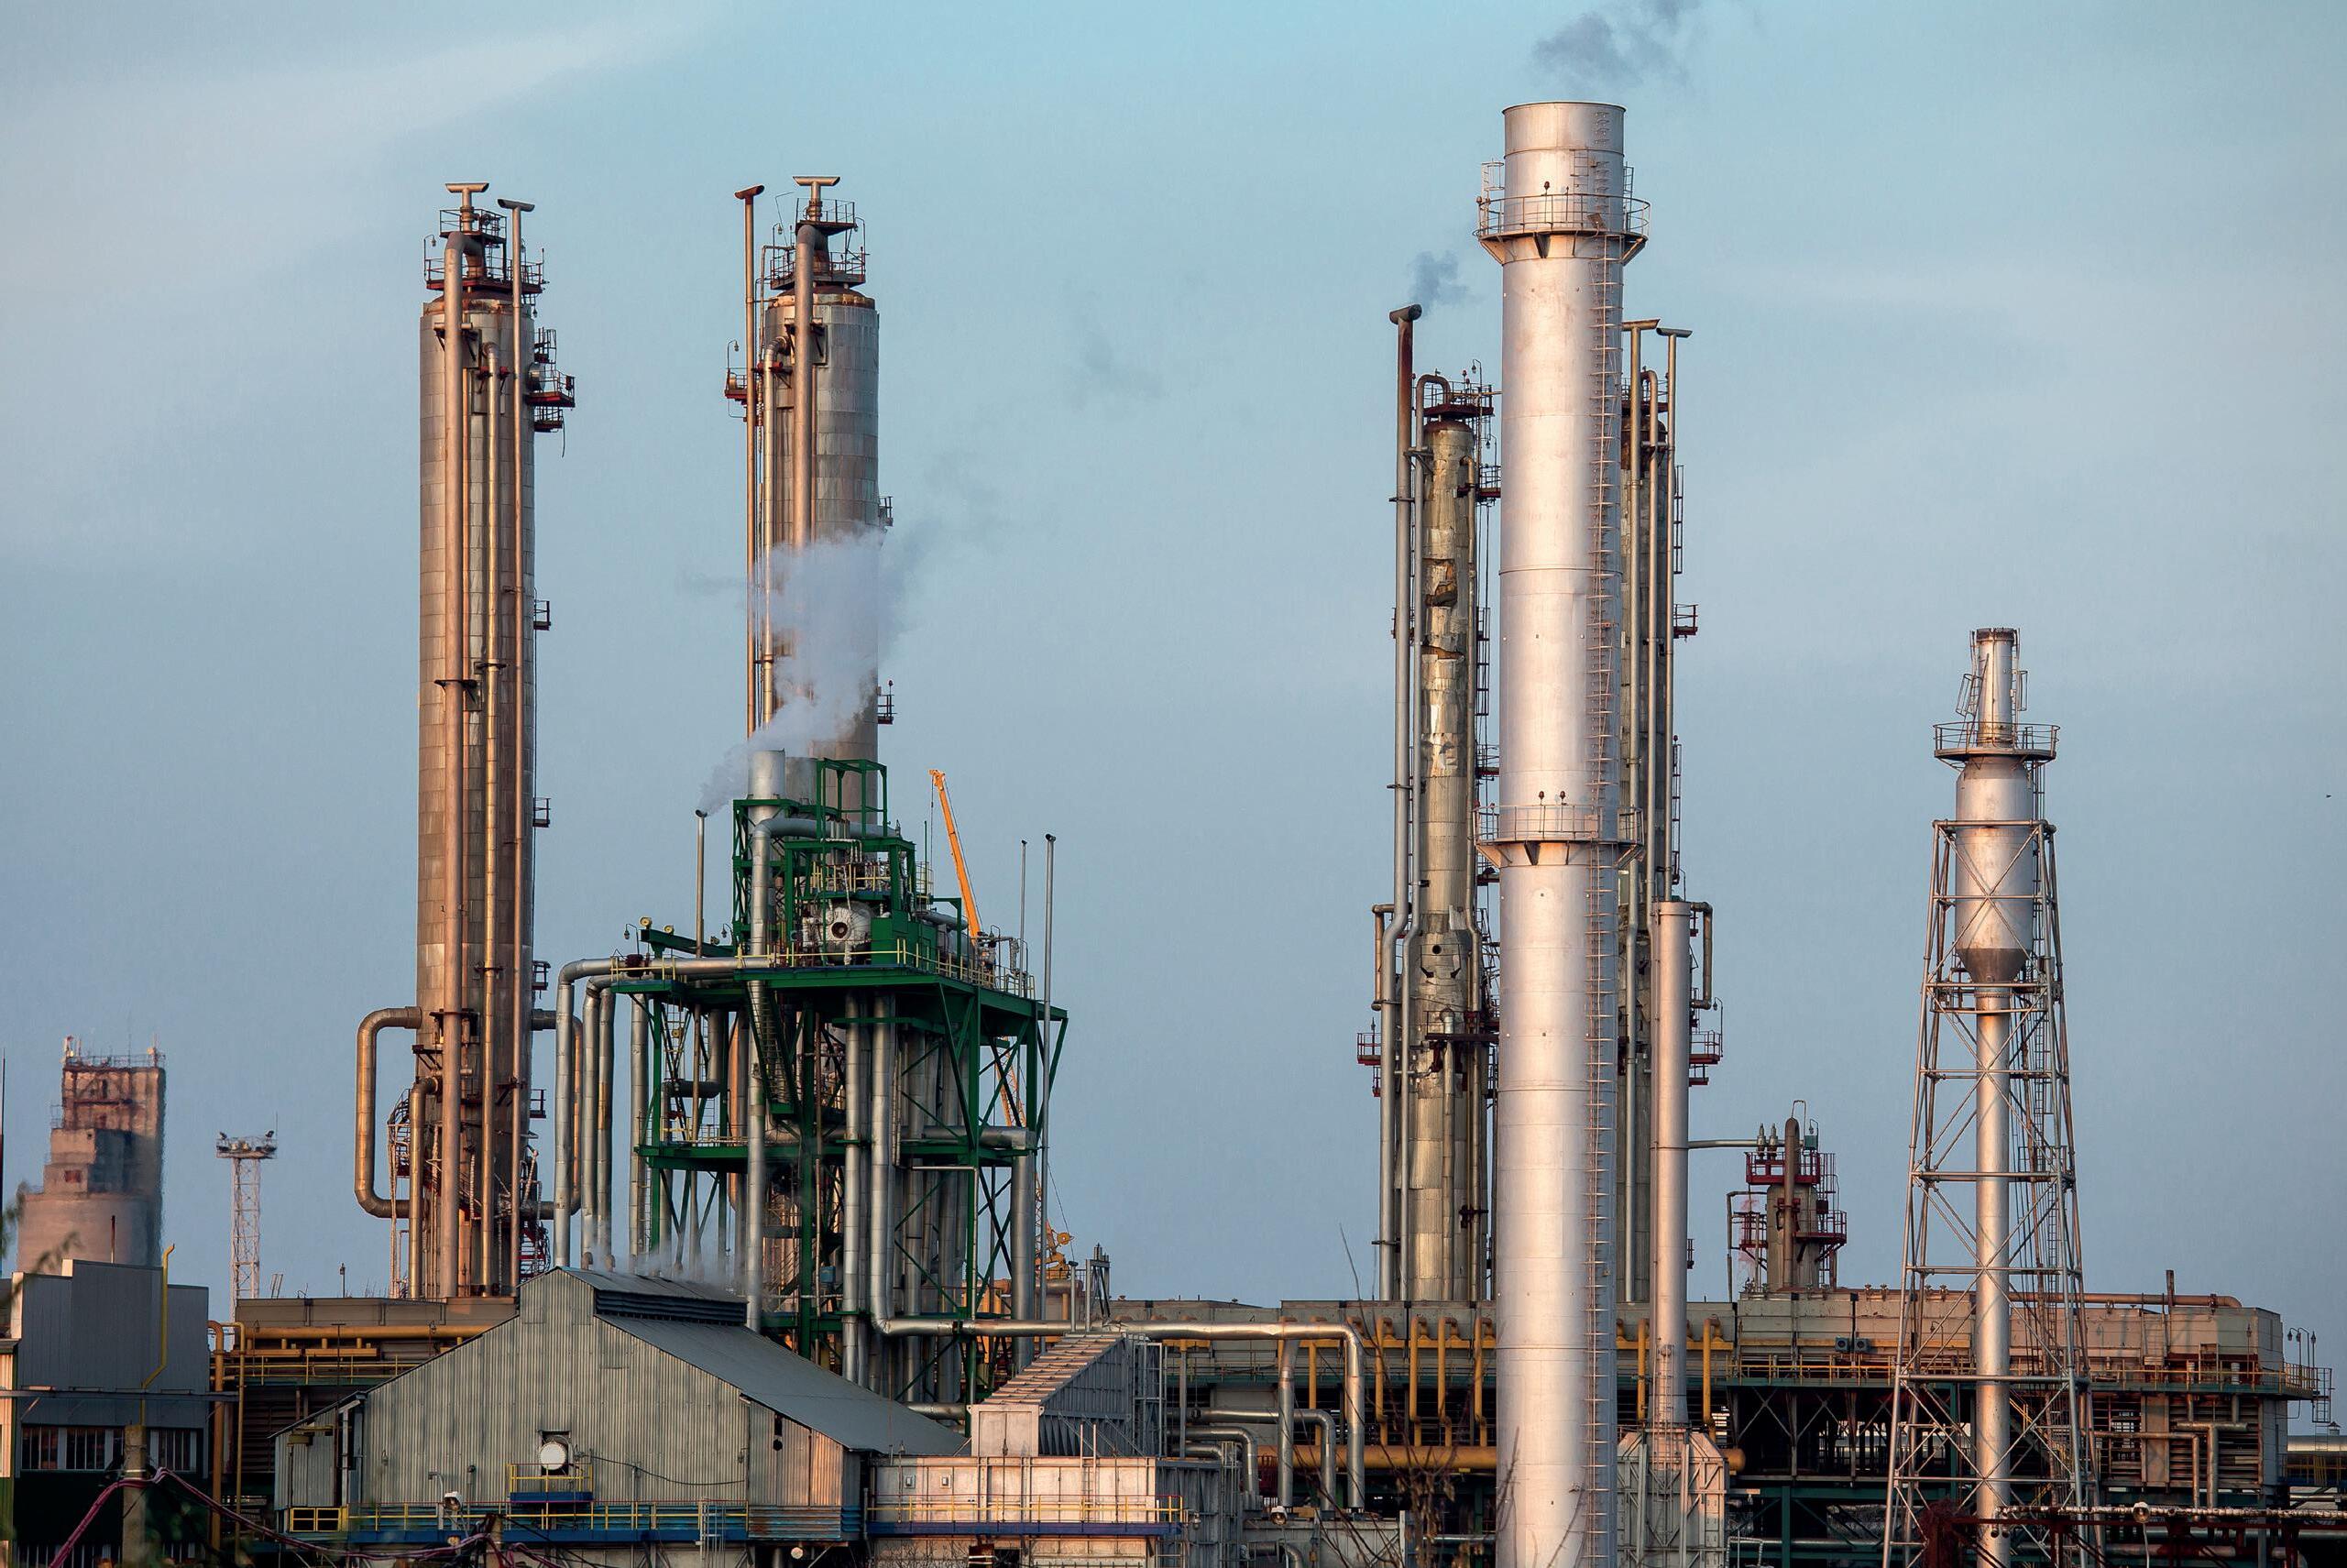
A


For companies engaged in the fertilizer industry or the handling of bulk materials, managing the flow of products, whether incoming, within the facility, or outgoing, stands as a critical operational aspect. The decision-making process in this domain is influenced by a great number of factors. While investment costs on certain solutions is a primary consideration, other elements often play a more significant role. This article delves into these factors, offering a detailed examination of the technical solutions available.
The process of product intake is significantly affected by external factors, including the logistical infrastructure of the country. The availability of a railroad or waterway directly connected to major fertilizer suppliers, for instance, presents a cost-effective alternative to truck-based intake.
Internally, the method of raw material handling leading to a blending unit necessitates a careful selection of storage solutions. This decision is influenced by various factors, including local humidity, the types of fertilizers in use, and the structural and
flooring specifications of the warehouse. If the conditions allow for it, storing raw materials in bulk bays on the floor might be the most efficient approach, utilising a bulk intake system complemented by distribution conveyors. In such scenarios, employing a front loader or forklift equipped with
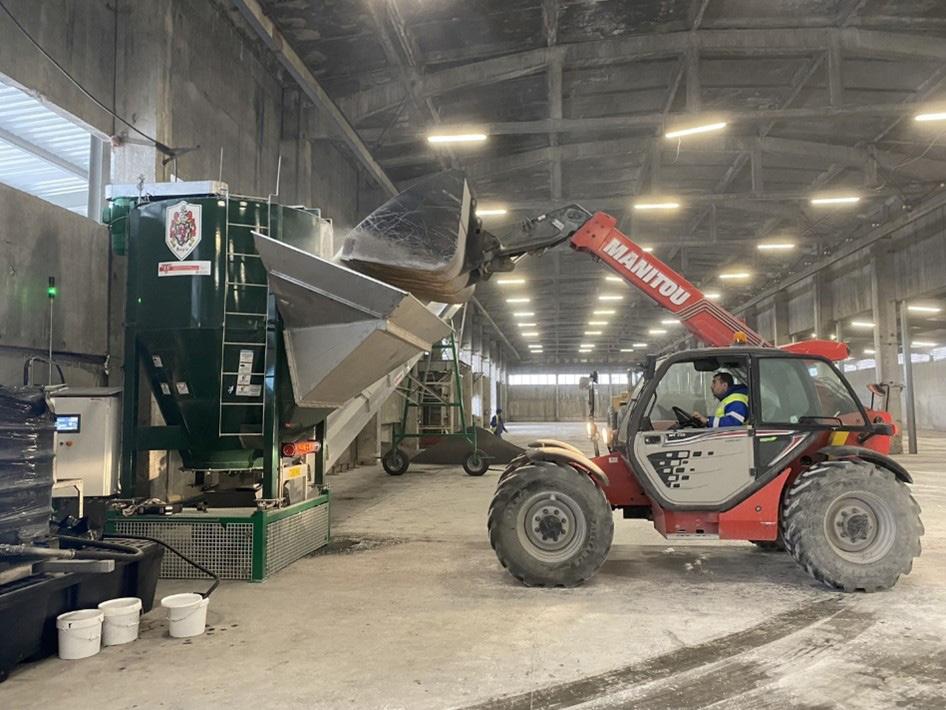
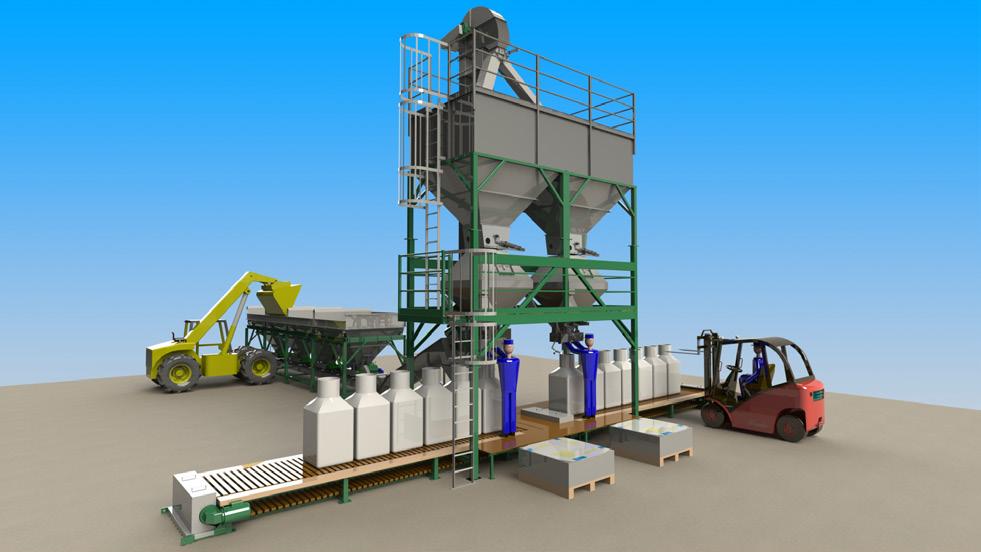
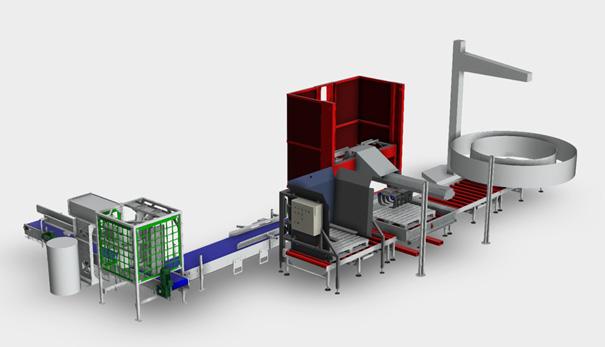
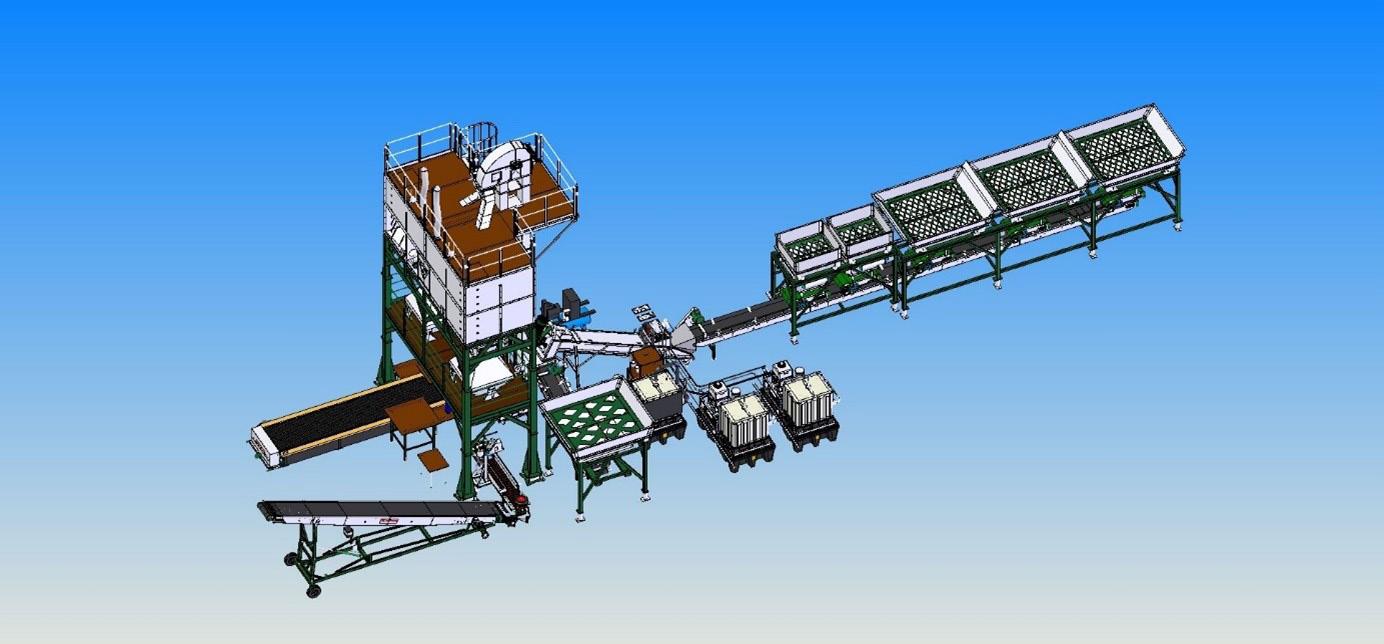
a dumping bucket facilitates the transfer of materials to the blending unit. Conversely, when storage involves flexible intermediate bulk containers (FIBC) or smaller bags, the loading process into the blending unit might necessitate intermediate bulk storage, depending on the blender type.
The strategy for handling outgoing products is likewise influenced by external logistics and customer capabilities. The preferred transport method and product form factor vary by region and customer segment. In many European countries, for instance, farmers are equipped to handle FIBC Jumbo bags, making this the optimal choice for suppliers serving this demographic. Other segments may require bulk delivery or smaller bagged products.
Following the exploration of various intake methodologies, each tailored to accommodate the diverse logistical and operational needs of fertilizer handling and blending facilities worldwide, it is time to transition to the critical phase of blending. This stage is where the precision and efficiency of the previously selected intake systems converge with the technological sophistication of blending equipment to produce fertilizers that meet the exacting standards of quality and composition demanded by the market.
Blending represents the heart of the fertilizer production process, a stage where multiple raw materials are transformed into the final product through mixing.
The choice of blending technology is not merely a matter of operational preference but a strategic decision that impacts product uniformity, efficiency, and customer satisfaction. When delving into the blending segment, it is essential to understand that the blending process is as varied and nuanced as the intake methods that precede it. The industry's evolution has led to the development of several blending systems, each with its unique advantages and suited to specific types of materials and production goals.
In this section, the intricacies of blending technologies will be explored, focusing on the distinction between batch and continuous systems, and the specialised equipment within these categories, such as paddle blenders, vertical and horizontal mixers, and the innovative approaches to adding micronutrients, inhibitors, or additives.
The ultimate goal of blending is to achieve a homogeneous product that adheres to strict quality standards while optimising production throughput and minimising costs. The blending phase is a testament to the industry's commitment to innovation, precision, and environmental stewardship, ensuring that the fertilizers produced not only enhance crop yields but do so in a manner that is sustainable and aligned with global agricultural practices.
Each type of blender offers specific advantages tailored to different operational needs within the fertilizer industry, from the precision and cleanliness of vertical blenders to the simplicity and effectiveness of horizontal rotating blenders.
Batch blenders operate on a cyclical basis, processing materials in specific batches that typically range from 2 – 16 t. The blending cycle comprises three primary stages: filling, blending, and discharging, with the overall capacity usually
Take a look at our ABC Certificate. It shows our circulation has been independently verified to industry agreed standards. So our advertisers know they’re getting what they paid for.
ABC. See it. Believe it. Trust it.

falling between 20 – 70 tph. The filling process for batch blenders often utilises a bucket capable of dosing the precise quantity needed for a specific recipe. Alternatively, weighing hoppers positioned before the blender can be used, effectively bridging batch and continuous blending systems. This latter approach is particularly advantageous when dealing with bagged raw materials, as it facilitates more accurate dosing.
Widely used across various industry sectors, the horizontal rotating blender employs a simple yet effective blending process. The blender's drum rotates, with internal flighting moving the different raw materials together, resulting in a highly homogeneous blend with minimal degradation or segregation. Capacities for these blenders range from 2 t (2 m³) – 14 t (14 m³), with the weigh hopper matching the blender's capacity and mounted on a digital weighing system. With this blender type, the weighing and blending processes are distinct, ensuring accuracy and efficiency.
Paddle blenders represent a versatile category within batch blending equipment, adept at processing both granular and powdery materials. This makes them particularly suitable for a wide range of fertilizers, including water-soluble types.
The twin shaft high-speed paddle mixer stands out in this category. It features two shafts that rotate in opposite directions at high speeds, facilitating the efficient mixing of powdery substances. Typically, paddle blenders are designed to handle batches ranging from 1 – 4 t, offering precision and effectiveness for smaller-scale operations.
The vertical blender features a unique blending principle, utilising a conical screw within the housing to create a wave motion that ensures consistent mixing. This design also incorporates a 60˚ angled bottom cone to prevent product buildup inside the container. A salem valve at the blender's base, combined with a sweep at the bottom of the auger, guarantees a complete cleanout after each batch. With a capacity of up to 60 tph and mounted on a digital weighing system, the vertical blender stands out for its small spatial footprint.
In contrast to batch blenders, continuous blenders operate without interruption, allowing for simultaneous filling and discharging of materials. The blending process is facilitated by a screw mechanism, with capacities reaching up to 300 tph. This type of blender incorporates cutting-edge technology, with computerised systems overseeing the continuous weighing and blending processes. Such automation ensures optimal product quality through precise control mechanisms. The operational workflow of a continuous blender involves the use of a wheel loader or forklift with a bucket to fill the hoppers with raw materials. Each hopper is equipped with a digital weighing system, which, in conjunction with stainless steel dosing conveyors, helps guarantee accurate dosing of the raw materials. The blending capacity of this system ranges from 20 – 300 tph, with the flexibility to accommodate an unlimited number of hoppers. Constructed entirely from
stainless steel, the blender not only promises durability but also a hopper capacity of 4 – 15 t/m3 making it a robust solution for high-volume, continuous blending operations in the fertilizer industry.
Incorporating micronutrients, inhibitors, or additives into fertilizer blends significantly enhances the value of the product for customers. Both batch and continuous blenders are capable of this integration, but the choice between adding these components as either powders or liquids depends on the specific requirements of the blend. Implementing a dedicated powder or liquid adding unit to the blender can precisely dose these valuable additions, ensuring the final product meets the desired specifications and quality.
Intermediate handling processes, such as conditioning the fertilizers post-blending (or occasionally pre-blending), play a crucial role in maintaining the quality of the final product. Screening is a beneficial step to remove dust or large foreign particles, ensuring a homogeneous blend.
Additionally, incorporating fertilizer conditioners like lump breakers can further refine the product quality, whether applied to specific materials like urea or across the entire production line.
Following blending, the material typically moves directly to the bagging units, minimising handling and preserving blend integrity. The choice of bagging unit, whether for big bag filling or small bag filling, depends on the output requirements and operational preferences.
After the meticulous process of blending, where raw materials are transformed into high quality fertilizer blends, the focus shifts to the final stages of production: bagging and storage. These processes are not merely about packaging or warehousing but are critical to maintaining product integrity, ensuring ease of transport, and meeting diverse market demands.
Small bagging operations cater to a segment of the market that requires fertilizers in manageable, retail-friendly packages. Typically, these bags can hold up to 50 kg, designed for ease of handling by individual farmers or customers. The small bagging process demands precision in weight control and packaging integrity to ensure that the product reaches the end-user without loss of quality.
Modern small bagging lines can be highly automated, featuring advanced weighing and filling systems, sealing mechanisms, and quality checks to ensure each bag meets stringent standards. These systems can adjust to different bag materials and sizes, offering flexibility to manufacturers in catering to various market preferences.
Big bagging, involving flexible intermediate bulk containers (FIBC) or jumbo bags, typically caters to commercial and industrial clients who require larger quantities of fertilizer,
usually ranging from 500 kg – 1 t/bag. This method is favoured for its efficiency in handling and transport, significantly reducing the cost per ton of product delivered.
The big bagging process is characterised by its use of specialised equipment designed to fill large bags accurately and safely. These systems ensure that the bags are filled uniformly, maintaining the product's quality and making them stable for storage and transport. The bags themselves are designed for durability, capable of withstanding the rigors of shipping and handling while protecting the contents from environmental factors.
Effective bulk storage solutions are designed to minimise product degradation and contamination. They often incorporate features such as temperature control, ventilation, and moisture regulation to preserve the fertilizer's quality. Moreover, the layout and design of bulk storage facilities are critical, ensuring smooth flow of product in and out of the storage area, reducing bottlenecks, and optimising space usage.
Bulk storage systems may include silos or warehouses with bulk bays, each selected based on the specific needs of the operation, including the type of fertilizer, local climate conditions, and distribution logistics.
Belor, a fertilizer company from Romania, recently enhanced its operational capabilities with the installation of an innovative blending and bagging filling system. This configuration includes three weighcont hoppers complemented by two micronutrient adding hoppers, which, along with a liquid adding feature within the blending screw, ensures precise formulation control. Additionally, a direct filling hopper is integrated, offering a bypass option to the primary blending process. This strategic integration facilitates the precision blending of materials with the option to incorporate liquid additives, tailored to meet specific product quality and customisation needs.
A crucial aspect of this system is its versatility in handling the post-blending process. After materials are mixed and elevated, they can be efficiently packaged into both large and small formats, thanks to the implementation of a dual-function filling station. This station comprises a high-speed big bag filler and a small bag combi unit, enabling the swift and flexible packaging of blended products to suit varying distribution and market demands.
Looking towards the future, Belor plans to further enhance its packaging line with the introduction of an automated small bag palletiser. This addition is expected to streamline the final stages of the packaging process, improving efficiency and reducing manual labour requirements. The integration of this automated solution should not only bolster operational throughput but also significantly advance commitment to leveraging technology for operational excellence.
The installation at Belor Romania showcases the agricultural industry's shift towards customisable, efficient, and technologically advanced production systems.
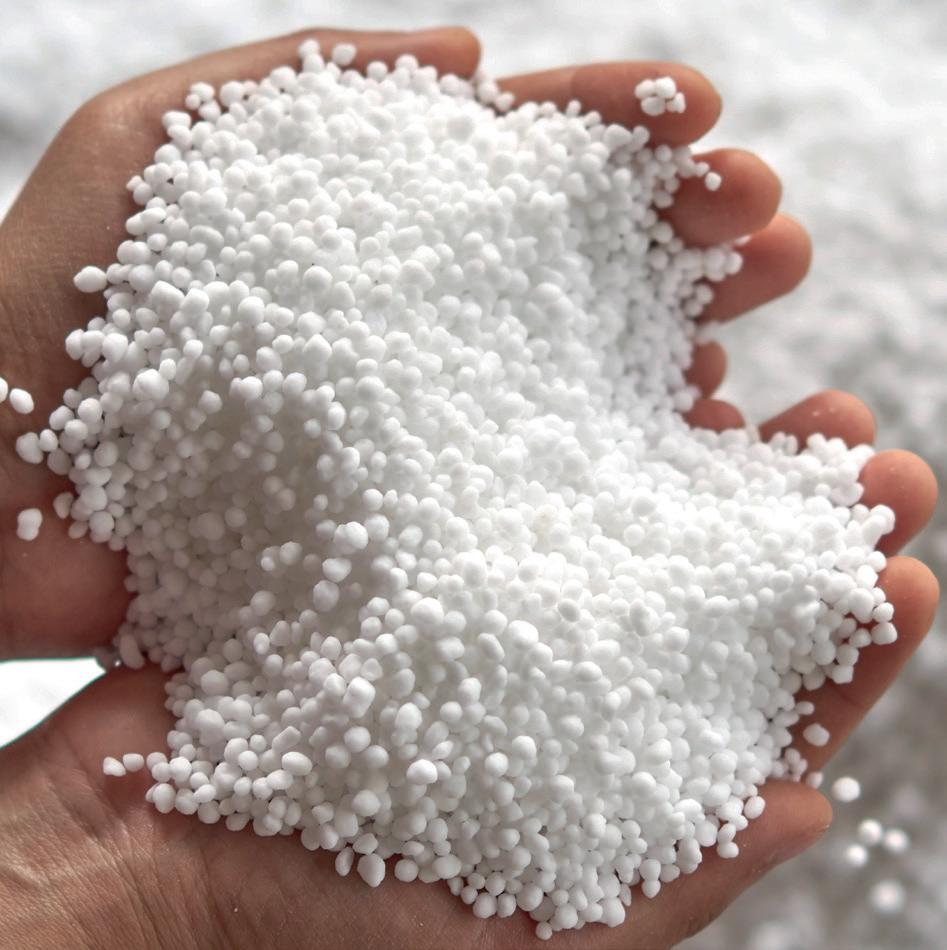
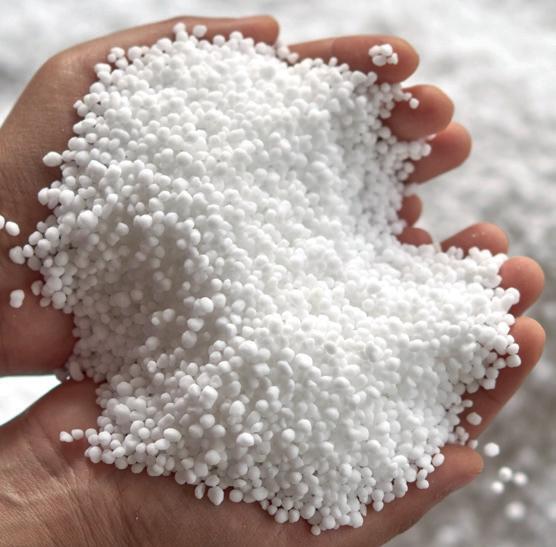


Phillip E. Prueter, The Equity Engineering Group, Inc. (E2G), USA, shares the company's insights into common industry practices for understanding, anticipating, detecting, and mitigating ammonia SCC afflicting pressure equipment.
Stress corrosion cracking (SCC) is a metallurgical damage mechanism characterised by the presence of sub-critical cracking under sustained loads (applied or residual), occurring most commonly in corrosive liquid environments, but sometimes gaseous environments.1 The chemical composition of the process environment (e.g., ionic species/concentration, pH, dissolved oxygen content, temperature, and electrode potential) and material of construction (e.g., alloy composition, microstructure, and microchemistry) heavily influence overall SCC damage susceptibility. While there are many different types of SCC, this article focuses on ammonia SCC in pressure equipment, including critical factors that influence damage
susceptibility, practical observations on damage morphology, and recommended best practices to mitigate cracking in carbon steels.
In general, the propensity for different types of SCC in pressure equipment is dependent on many specific fabrication and process operating variables, such as material properties and chemistry, weld procedures/geometry, weld deposit and heat affected zone (HAZ)
hardness/microstructure, original heat treatment, external environmental conditions, process stream composition, pH, temperature, operating stress level, and proximity to local stress concentrations. The confounding influence of these variables on SCC susceptibility and on distinctly unpredictable
crack propagation rates, makes SCC notably complex and difficult to manage in aging pressure components.2,3 Ammonia SCC is most prevalent in carbon steel (especially high strength steel) equipment in anhydrous ammonia service or in copper-zinc alloys, such as admiralty brass or aluminium brass, in aqueous ammonia environments (or process conditions that contain ammoniated chemical compounds). In general, cracking can either be transgranular or intergranular in copper alloys, and is usually more intergranular in nature for carbon steels, with potential oxide-filled crevices. An example of ammonia SCC in a carbon steel ammonia storage tank is shown in Figure 1, which depicts both inside surface and through-thickness perspectives of the cracking morphology (note the oxide filled cracking regions on the micrographs). In this case, the crack's tips are relatively blunt, and it is believed that overall crack propagation was occurring at a relatively slow rate.4
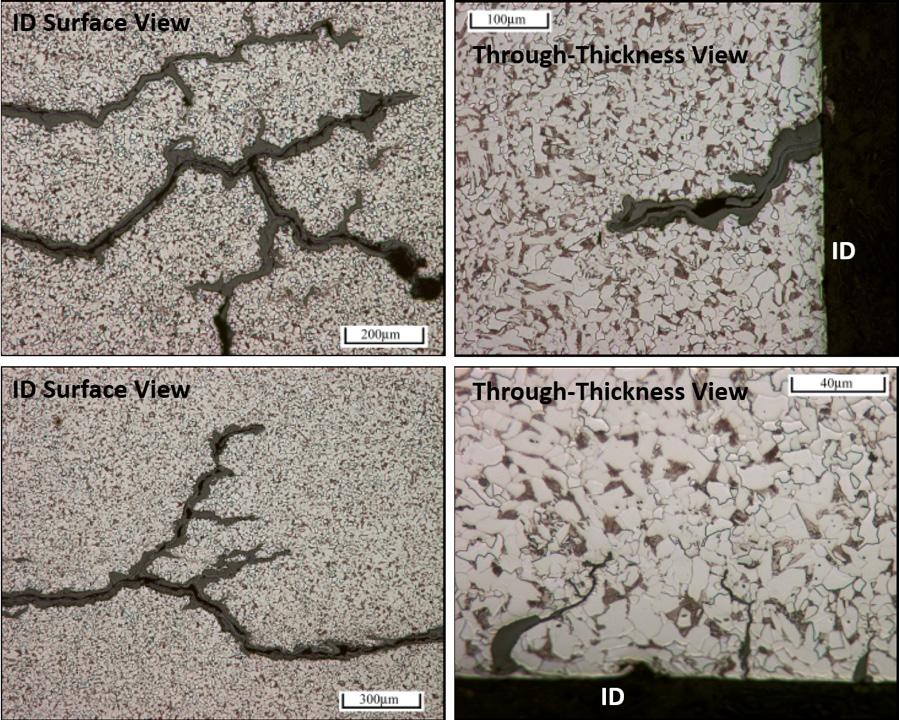

In carbon steels, the following critical factors generally influence ammonia SCC susceptibility and damage progression in anhydrous ammonia service.4, 5, 6, 7
n Operating temperature – crack initiation and propagation typically intensify with increasing temperature. Initiation of ammonia SCC at low temperatures (e.g. less than -27°F [-33°C]) is unlikely; however, growth of existing cracks has been observed at these temperatures, although at significantly slower rates.
n Water content – anhydrous ammonia with less than 0.2% water has been known to cause cracking, and this is an often-cited threshold for damage concern. To this end, water acts as an inhibitor to ammonia SCC, and most literature suggests ammonia must meet this minimum water content threshold to effectively inhibit damage progression.
n Oxygen concentration – oxygen contamination from air exposure contributes to the onset and acceleration of ammonia SCC damage. Even oxygen concentrations below 5 ppm have been known to lead to cracking under certain conditions, possibly even as low as 1 ppm.6 7
n Weld residual stress – the highly transient thermal behaviour that occurs during the welding process induces tensile residual stresses at/near welds. As such, ammonia SCC typically appears as surface breaking cracks near welds and HAZs. Non-post weld heat treated (PWHT) welds are distinctly prone to damage given the typically elevated weld residual stresses, and original fabrication defects can serve as SCC initiation sites. It is worth noting that even equipment subjected to PWHT can still experience ammonia SCC under the appropriate conditions.8
n Material strength – in general, high-strength carbon steels are more prone to ammonia SCC than lower strength materials – a common minimum tensile strength threshold used to quantify vulnerability is 70 ksi (483 MPa).
n Weld hardness – in general, high-hardness welds promote crack initiation and can lead to accelerated ammonia SCC. PWHT offers a means to temper (soften) welds in addition to relaxing residual stresses. Appropriate preheat and controlled deposition (e.g. temper bead) welding techniques also tend to promote tempering at/near weld deposits, although these approaches are known not to significantly relax weld residual stress, and as such, are usually not recommended in lieu of PWHT.
To highlight the overall dependency of ammonia SCC on both operating temperature and oxygen concentration, Figure 2 shows empirical test results that quantify crack depth as a function of time for varying oxygen concentrations, with data points at 64°F (18°C) and -27°F (-33°C). These experiments were carried out at a crack tip stress intensity factor (K) of 73 – 77 ksi (0.5 in.) [80-85 MPa (m0.5)]. These correlations intuitively confirm that ammonia crack growth rates are more severe for higher temperatures; that is, measured crack depths at -27°F (-33°C) were approximately one third of the depth of cracks at 64°F (18°C). While there is some scatter in data points relative to oxygen concentration, further investigation into

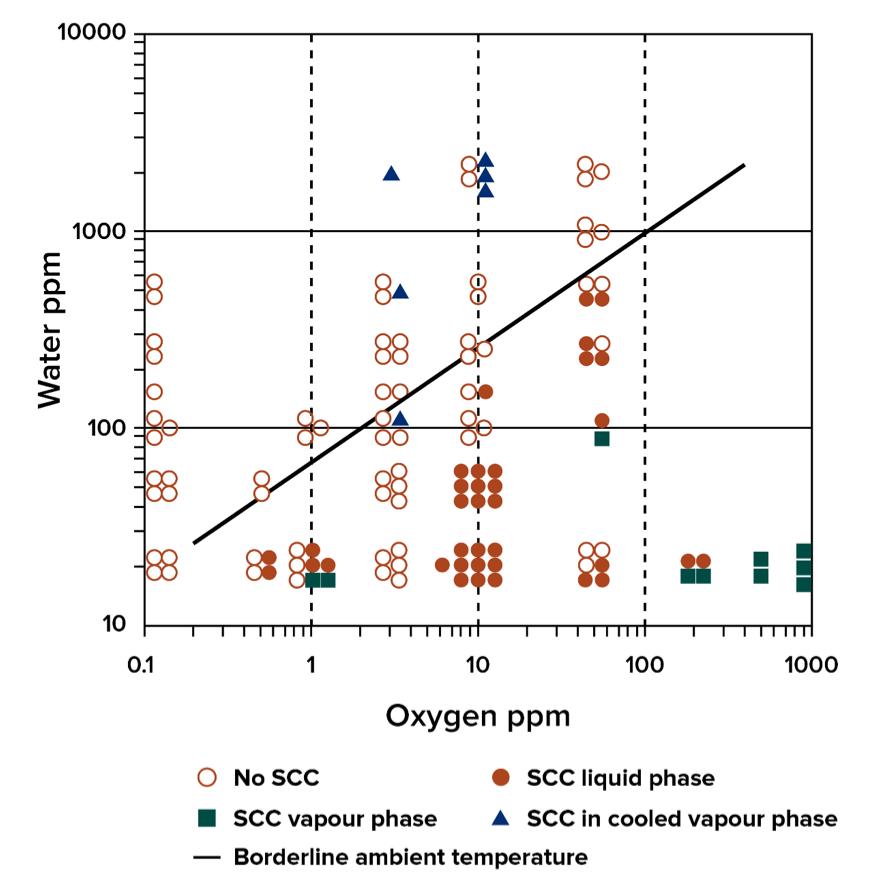
the individual specimen test results indicated ammonia SCC susceptibility with 0.5 – 10 ppm oxygen at -33°C is highest at about 10 ppm oxygen and 50 ppm water. A similar trend was observed for ambient temperature tests. An important conclusion from this study is that crack initiation can occur even with 0.5 – 1 ppm oxygen and up to 100 ppm water at -27°F (-33°C), although the overall propensity for cracking is much weaker than at higher oxygen concentrations.9
In general, ammonia storage tanks, piping, and related components in ammonia refrigeration units are prone to ammonia SCC damage. It is important to consider that in pressurised ammonia storage tanks or vessels, if there is a vapour zone present above the liquid level, this region of the pressure boundary can be susceptible to ammonia SCC because of condensation of the ammonia vapour (with no water) on the inside surface.4,7 For this reason, the vapour space (above the liquid line) can be especially damage-prone in ammonia storage equipment and may require special attention concerning inspection strategies and long-term maintenance plans. Additionally, given ammonia SCC’s dependency on oxygen concentration, it may be more detrimental than beneficial, in many cases, to open ammonia storage equipment during planned outages to facilitate internal inspections. To this end, the risk of oxygen ingress often outweighs the benefit of identifying potentially shallow surface breaking cracks. If feasible, external volumetric inspection methods (e.g. ultrasonic techniques) or potentially acoustic emissions testing offers a means to check equipment for ammonia SCC damage and specifically, to document any crack propagation of known flaw locations, without necessitating direct access to the internal surface.
Ammonia SCC was first reported in the mid-1950s in agricultural service tanks. Early on, cracking propensity was
associated with areas of high residual stress such as welds and cold-formed dished heads. Over the years, industry experience indicated that high strength, quenched and tempered steels were distinctly prone to damage as well. Furthermore, research in the 1980s and 1990s has led to a better understanding of the most effective damage mitigation techniques.4 In anhydrous ammonia service, SCC propensity in carbon steels is generally influenced the most by water content and oxygen concentration. Water content should be maintained at a minimum level of 0.2% to effectively inhibit SCC.4, 5, 6 Careful consideration should be given to vapour spaces (above the liquid level) in ammonia storage tanks and vessels as this region can contain less than 0.2% water due to the separation of ammonia in the water phase (that is, the condensed ammonia is in a non-equilibrium phase and may contain less water and more oxygen). As such, avoiding condensation in such a vapour space is preferred.4
Maintaining oxygen levels below 0.5 ppm – 1 ppm reflects an ideal scenario for mitigating ammonia SCC (under certain conditions, oxygen levels below 5 ppm have been known to promote cracking). Equipment designs and inspection/maintenance practices should also eliminate the potential for oxygen ingress. Moreover, nitrogen purging should be used prior to the introduction of ammonia to effectively remove oxygen from inside atmospheric or pressurised ammonia storage systems. Increasing the operating temperature is also known to accelerate cracking. Figure 3 illustrates the effect that water content and oxygen concentration can have on ammonia SCC susceptibility. This figure presents instances of ammonia SCC for varying levels of water and oxygen (ppm) at 65°F (18°C), based on experimental results. To the left (and above) the trend line drawn, no SCC was identified. This figure also supports the assertion that ammonia SCC susceptibility generally increases with increasing oxygen concentration, up to a certain point, and then decreases with increasing water content.9 It is recognised that some of these experiments were performed with internal cooling of the specimen in the vapour phase (results included in Figure 3). These experiments confirm that ammonia SCC can occur in a condensed vapour phase when cracking is inhibited in the liquid phase by the addition of water.
From an equipment fabrication standpoint, PWHT represents a favourable means to mitigate ammonia SCC due to the relaxation of tensile weld residual stresses, which represent a significant crack driving force that increases the risk for both crack initiation and brittle fracture.10 PWHT involves heating a welded component to a temperature high enough to reduce the yield strength of the steel to a small fraction of its magnitude at ambient temperature. Since the material can no longer sustain the weld residual stress level, it undergoes plastic deformation until the stresses are relaxed to the PWHT soak temperature yield strength, with some amount of additional relaxation due to creep occurring if post-heating is continued for longer hold times.11, 12
For typical PWHT temperatures, stress relaxation is on the order of 70 – 80% for carbon and low-alloy steels. It is recognised that PWHT is often impractical for large
aboveground ammonia storage tanks. Given this, utilising lower strength steels (<70 ksi minimum tensile strength) offers a secondary approach to suppress ammonia SCC. It is noted that lower strength steels may necessitate a thicker pressure boundary, which can lead to increased material cost and more required welding. More recent studies have proposed performing PWHT on several work pieces of ammonia storage tanks prior to assembling them in the field, followed by mechanical stress relief of the entire tank after construction.13 To this end, nozzle attachment welds in lower shell courses are often PWHT prior to tank assembly, as these locations are subject to elevated local stress due to a relatively high magnitude of applied internal hydrostatic pressure from liquid ammonia fill. Mechanical stress relief methods, such as shot peening, attempt to introduce a compressive residual stress layer local to the surface, with the idea being it will prevent crack initiation. While this can be beneficial, any mechanical stress relief procedure should be carefully engineered, optimised, and carried out by an experienced vendor to achieve desired results.4
Documented SCC failures of anhydrous ammonia nurse tanks (used for transporting ammonia) between 2003 and 2007 have led to federally mandated PWHT for such tanks by the US Occupational Safety and Health Administration (OSHA), per 29 CFR 1910.111.14 Regarding welding procedures, it is recommended to ensure proper filler metal selection such that the weld deposit has similar yield properties to that of that base metal. This tends to minimise weld residual stresses and high hardness regions near the weld deposit and HAZ. Intuitively, avoiding sharp geometric features and weld defects (e.g., lack of fusion, porosity, slag inclusions, etc.) is critical to reduce the number of potential crack initiation sites. Detailed surface and volumetric inspection offer a means to detect and repair any such detrimental fabrication-related flaws before placing a newly constructed component into service.
Additionally, conventional cathodic protection (CP) approaches (e.g., galvanic or impressed current anodes) do not inherently inhibit ammonia SCC because of the high resistivity of anhydrous ammonia.13 Furthermore, CP does not work in vapour spaces either, regardless of the conductivity of the liquid ammonia. Studies have shown that cathodic polarisation techniques, where steel is galvanically coupled with aluminium, may result in protection from ammonia SCC. To this end, flame spraying zinc or aluminium onto welds may be effective as a means of cathodic polarisation.13 In copper-zinc alloys (e.g., admiralty and aluminum brass), material composition with <15% zinc is known to have improved resistance to ammonia SCC. Preventing air ingress is also an important consideration, and for critical applications, upgrading to austenitic stainless steels or nickel-based alloys may be warranted.4,5,6
This article offers practical insights into common industry practices for understanding, anticipating, detecting, and mitigating ammonia SCC afflicting pressure equipment. Focusing on ammonia SCC mitigation during the design phase for equipment represents the ideal proactive approach for achieving long-term reliability. This often
requires taking deliberate steps and invoking design features/fabrication techniques that go beyond typical construction code minimum requirements (such recommendations are typically specified in engineering best practices documents). Examples of this include using favourable weld geometries, upgrading materials of construction, requiring PWHT to relax weld residual stresses and regulate weld hardness, and mandating stringent inspection strategies to identify any fabrication-related defects. Furthermore, as outlined herein, understanding these cracking assuagement techniques along with proper damage detection (i.e. knowing where to look for damage and what inspection techniques to leverage) is also important. While not described herein for the sake of brevity, engineering assessment methods can be used to qualify unanticipated crack-like flaws and estimate crack propagation rates, although SCC damage progression rates are notoriously unpredictable, in general.4 Lastly, carefully monitoring and controlling process conditions such as temperature, water content (e.g. maintaining 0.2% minimum), and limiting oxygen concentration can dramatically minimise SCC propensity and can significantly improve long-term pressure equipment reliability.
1. RAJA, V.S. and SHOJI, T., “Stress Corrosion Cracking – Theory and Practice”, Woodhead Publishing Limited. Oxford, 2011.
2. PAPAVINASAM, S., “Corrosion Control in the Oil and Gas Industry,” Gulf Professional Publishing, Waltham, MA. 2014.
3. HEIDERSBACH, R., “Metallurgy and Corrosion Control in Oil and Gas Production,” 2nd Edition. John Wiley & Sons, Inc. Hoboken, NJ. 2018.
4. PRUETER, P.E., "A Guide to Stress Corrosion Cracking Management," eBook. Inspectioneering LLC, https:// inspectioneering.com/content/2022-09-30/10300/a-guide-tostress-corrosion-cracking-management, Spring, TX, September 30, 2022.
5. DOBIS, J.D., CANTWELL, J.E., and PRAGER, M., “WRC Bulletin 489 (2nd Edition): Damage Mechanisms Affecting Fixed Equipment in the Refining Industry”. 2019. The Welding Research Council. Shaker Heights, Ohio.
6. API, American Petroleum Institute, API Recommended Practice 571 – Damage Mechanisms Affecting Fixed Equipment in the Refining Industry. 3rd Edition, 2020. American Petroleum Institute. Washington, D.C.
7. NACE, “Publication 5A192: Integrity of Equipment in Anhydrous Ammonia Storage and Handling,” NACE International. Houston, TX. 2004.
8. STEPHENS, J.D., and VIDALIN, F., “Stress Corrosion Cracking in Ammonia Field Storage Tanks,” Proceedings of the AIChE Symposium on Safety in Ammonia Plants, 1987.
9. NYBORG, R. and LUNDE, L., “Life Prediction of Ammonia Storage Tanks Based on Laboratory Stress Corrosion Crack Data,” Application of Accelerated Corrosion Tests to Service Life Prediction of Materials. ASTM STP 1194, Gustavo Cragnolino and Narasi Sridar, Eds., American Society for Testing and Materials, Philadelphia, 1994.
10. RADAJ, D., “Heat Effects of Welding,” Springer-Verlag, Berlin, 1992.
11. STOUT, R., “Weldability of Steels,” 4th Edition, Welding Research Council (WRC), New York, 1987.
12. PRUETER, P.E., “Observations on Flaw Tolerance and Brittle Fracture: The Effect of Post Weld Heat Treatment,” Inspectioneering Journal, January/February 2018.
13. NACE/AMPP, “Guidelines for Maintaining Integrity of Equipment in Anhydrous Ammonia Storage and Handling,” NACE TR5A1922021, Sept. 2021, Association for Materials Protection and Performance, Houston, TX.
14. U.S. Code of Federal Regulations (CFR) Title 29, Section 1910.111, “Storage and Handling of Anhydrous Ammonia,” Office of the Federal Register. 2011. Washington, D.C.