September 2025


Accelerate your journey to net zero


September 2025
Accelerate your journey to net zero
Superior Defense. Optimal Catalyst Performance.
In coker naphtha hydrotreating, silicon isn’t just a nuisance, it’s a threat to performance, cycle length and profitability. Topsoe’s third-generation TK-461 and TK-467 SiliconTrap™ catalysts provide refiners with breakthrough silicon pick-up capacity on a volume basis.
Designed with next-level alumina support, they offer superior silicon pick up, higher HDS/HDN activity and seamless compatibility with your existing unit. The new SiliconTrap™ catalysts feature increased surface area per volume resulting in improved silicon adsorption.
Topsoe’s SiliconTrap™ catalysts system is built to improve profitability by providing longer cycle lengths.

43 Guarding against silicon contamination
08 Geopolitical pressures in North America
Gordon Cope, Contributing Editor, considers how the pressure from the US administration has prompted Canada and Mexico to reconsider the continent’s energy infrastructure.
14 Reinventing the crude argon column design
Quan Yang, Ming Yang Lee, Laurent Zuber, and Jiao-Jiao Dong, Sulzer Chemtech, Switzerland, alongside Feng-Jie Xu and Feng-Hua Zhou, China National Air Separation Engineering Co., explore how to effectively mitigate liquid maldistribution through crude argon (CAR) column design.
23 Engineering the future
Emily Ruhl and Michael Krela, Koch-Glitsch, USA, explore the development of distillation tray valve types and consider how operators can best align valve selection with current demands and future challenges.
29 Effective filtration: a downstream necessity
Neil Richards, PS Filter, Canada, discusses how effective filtration through best-practice strategies ensures production integrity, operational efficiency, and regulatory compliance.
33 Beyond the brochure
Michael Clements, Filtration Technology Corp. (FTC), explores how technical evaluations in filtration trump so-called ‘brochure engineering’.
37 A new era in top-bed design and reactor performance
In reactors with high-velocity gas inlets, maintaining top-bed stability is essential for operational efficiency and profitability. Austin Schneider and Tanvi Rao, Crystaphase, USA, explore how a new type of reticulated ceramic technology can provide a comprehensive solution for top-bed management in fixed-bed reactors.


Henrik Rasmussen and Xavier E. Ruiz Maldonado, Topsoe, describe how new third generation catalysts for coker naphtha can improve performance.
47 Optimising catalyst selection
Marlene Führer, Daria Otyuskaya, Maria de la O Masa Lorenzo, Rodrigo Duarte Oliveira Silva, Francisco Maroto de la Puente, and Tiago Vilela, Avantium R&D Solutions, provide the results of a comparative study testing commercial acetylene hydrogenation catalysts, which highlights the importance of catalyst selection in line with plant requirements.
53 Reuse, recycle, repurpose
Brian Visioli, Evonik Catalysts, USA, explores how catalyst reuse can aid sustainability within the refining industry, through improving operational efficiency and providing environmental benefits.
57 Electrifying industrial process heating
Roly Juliano, and Gregoire Quere, Watlow, discuss how low voltage and medium voltage electrification of industrial process heating is emerging as an advantageous solution to reduce emissions and improve performance, moving toward industrial decarbonisation.
Kevin E. Siters, Alkegen, USA, outlines why corrosion under insulation (CUI) remains a significant challenge in the downstream sector, and introduces an insulation solution that can help combat this problem.
65 Enhancing safety in the downstream sector
Andy Cull, Total Safety UK, explores how safety can be enhanced in the oil and gas sector through advanced safety management and gas monitoring.
Gilles Revial, Aggreko, explores how turnarounds for petrochemical refineries can present a strategic opportunity to streamline and improve processes.
Accelerate your net-zero goals with Sulzer’s advanced separation technologies for carbon capture. The company’s proprietary solutions deliver maximum capture efficiency with the lowest pressure drop, reducing energy use and capital costs. Achieve reliable, cost-effective, and sustainable carbon capture with Sulzer’s expert engineering, cutting-edge products, and end-to-end global support.
Cut your CO2 emissions by 50% with the future of carbon black production
Compliant and innovative
Meets stringent environmental regulations, keeping your business future-ready

Unparalleled flexibility
Produce all ASTM grades and specialty grades seamlessly in a single plant
Sustainable Uses thermal decomposition of aromatic oils for cleaner production

MANAGING EDITOR James Little james.little@palladianpublications.com
SENIOR EDITOR Callum O'Reilly callum.oreilly@palladianpublications.com
EDITORIAL ASSISTANT Ellie Brosnan ellie.brosnan@palladianpublications.com
SALES DIRECTOR Rod Hardy rod.hardy@palladianpublications.com
SALES MANAGER Chris Atkin chris.atkin@palladianpublications.com
SALES EXECUTIVE Ella Hopwood ella.hopwood@palladianpublications.com
PRODUCTION MANAGER Kyla Waller kyla.waller@palladianpublications.com
HEAD OF EVENTS Louise Cameron louise.cameron@palladianpublications.com
DIGITAL EVENTS COORDINATOR Merili Jurivete merili.jurivete@palladianpublications.com
DIGITAL CONTENT COORDINATOR Kristian Ilasko kristian.ilasko@palladianpublications.com
DIGITAL ADMINISTRATOR Nicole Harman-Smith nicole.harman-smith@palladianpublications.com
JUNIOR VIDEO ASSISTANT Amélie Meury-Cashman amelie.meury-cashman@palladianpublications.com
EVENTS COORDINATOR Chloe Lelliott chloe.lelliott@palladianpublications.com
ADMIN MANAGER Laura White laura.white@palladianpublications.com
CONTRIBUTING EDITORS Nancy Yamaguchi Gordon Cope
SUBSCRIPTION RATES
Annual subscription £110 UK including postage/£125 overseas (postage airmail). Two year discounted rate £176 UK including postage/£200 overseas (postage airmail).
SUBSCRIPTION CLAIMS
Claims for non receipt of issues must be made within 3 months of publication of the issue or they will not be honoured without charge.
APPLICABLE ONLY TO USA & CANADA
Hydrocarbon Engineering (ISSN No: 1468-9340, USPS No: 020-998) is published monthly by Palladian Publications Ltd GBR and distributed in the USA by Asendia USA, 701C Ashland Avenue, Folcroft, PA 19032. Periodicals postage paid at Philadelphia, PA & additional mailing offices. POSTMASTER: send address changes to HYDROCARBON ENGINEERING, 701C Ashland Ave, Folcroft PA 19032.

CALLUM O'REILLY
As summer comes to an end, so too does the season for music festivals here in the UK. Back in June, our largest festival, Glastonbury, welcomed Alanis Morissette to its famous Pyramid Stage for the coveted pre-headliner slot on a Friday evening. It was the first time Morissette had played the festival, and she treated the crowd to a set of her greatest hits, including ‘Hand in My Pocket’, ‘You Oughta Know’ and, of course, ‘Ironic’ – Morissette’s timeless anthem that is, infamously, almost entirely devoid of irony.
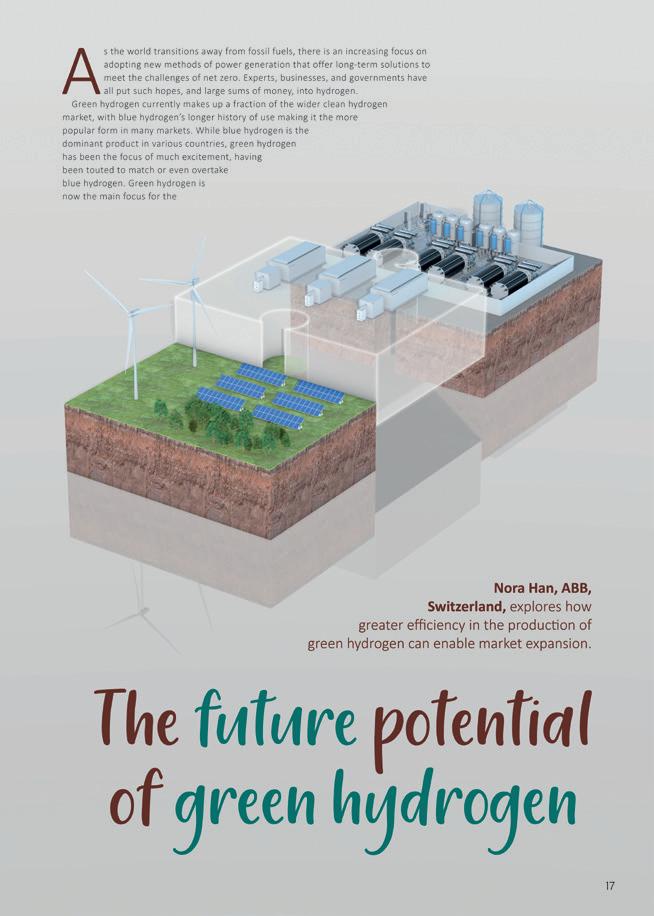
No doubt the experts at Wood Mackenzie were humming along to this tune as they penned their latest report, titled: ‘Isn’t it ironic: how Europe’s oil refiners could offer a route to scale green hydrogen production.’ Apologies if I have passed the ear worm onto you, but I promise that the report is well worth a read.1 In a rather paradoxical turn of events, Wood Mackenzie reveals that European oil refining, often seen as emblematic of carbon intensity, could hold the key to unlocking demand growth for green hydrogen.
EU regulations are forcing refiners to decarbonise faster than anywhere else on the planet, and Wood Mackenzie’s analysis suggests that the continent’s refiners are set to become significant producers or buyers of green hydrogen in order to meet this requirement.
The refining sector, alongside ammonia and methanol production, accounts for approximately 98% of all hydrogen demand. But producing this essential ingredient using traditional methods is costly, both from an environmental and economic perspective. European refiners are part of the EU Emissions Trading Scheme, which sees them charged for the CO2 that they emit beyond a certain free allowance. However, producing green hydrogen on-site would eliminate many of the CO2 emissions and, therefore, the carbon costs.
The latest edition to the EU’s Renewable Energy Directive (RED III) provides essential support for green hydrogen adoption as it promotes “renewable fuels of non-biological origin”, which includes green hydrogen. Wood Mackenzie forecasts that European refiners will require around 0.5 million tpy of green hydrogen production to comply with regulations, which would replace approximately 30% of the continent’s fossil fuel hydrogen production, at an investment of more than US$15 billion. Many refiners are now looking to produce green hydrogen on-site to decarbonise their operations and supply fuels compliant with RED III. As Wood Mackenzie points out, both Repsol and TotalEnergies confirmed in recent earnings calls that green hydrogen is the most competitive route to regulatory compliance.
While RED III bodes well for green hydrogen’s near-term growth in the European refining sector, Wood Mackenzie warns that much more is required in order to ensure significant longer-term growth. It outlines three key areas that require further action: costs, technology, and the wider regulatory environment. “Parts of the refining sector can be decarbonised quickly – and at an acceptable cost. But it requires policy intervention to lower green hydrogen production costs and increase the refineries’ offtake. Without such policies, the incentives will not emerge.”
15 South Street, Farnham, Surrey
GU9 7QU, UK
Tel: +44 (0) 1252 718 999
Perhaps the biggest irony here is that in striving to decarbonise through green hydrogen, Europe’s refiners face costs that could make their operations less viable –a paradox that only strong and consistent policy can resolve. Don’t you think?
1. DOUGLAS, M., GELDER, A, and THOMPSON, G., ‘Isn’t it ironic: how Europe’s oil refiners could offer a route to scale green hydrogen production’, (August 2025), https://www.woodmac.com/ horizons/europes-oil-refiners-scale-up-green-hydrogen/?utm_campaign=wm-press-release&utm_ medium=email&utm_source=pr-email&utm_content=horizons-august-green-hydrogen

An Asset Performance Framework Grounded In Operations Reality, And Empowered To Elevate Your Outcomes
• Straightforward configuration and user interface
• Integrated Asset Lifecycle, Production Loss, and Economic Analysis to maximize value and minimize operating and maintenance costs
• Organizational performance enhancements including MOC, Audits, and integrated Risk Assessments

Learn More
The US Energy Information Administration (EIA) expects a significant decline in the price of oil as growth in the global supply of oil vastly surpasses growth in demand for petroleum products.
In its August ‘Short-Term Energy Outlook’ (STEO), the EIA said that it expects the Brent crude oil spot price to average less than US$60/bbl in 4Q25 – the first quarter with average prices that low since 2020.
OPEC+ has announced that it will unwind its oil production cuts by
September 2025, which is a year ahead of its previous schedule. For the first time since EIA began publishing an OPEC+ production forecast in 2023, it expects most global oil production growth to come from OPEC+ countries. EIA forecasts the supply growth will outpace demand, leading to quickly growing inventories.
EIA expects lower oil prices to lead to lower US retail prices for gasoline and diesel and to pull domestic oil production down from the record highs in 2025.
Wood has secured a contract extension to provide maintenance solutions at Ampol’s Lytton refinery in Brisbane, Australia. Under the two-year agreement, Wood will continue to ensure safe, reliable, and efficient fuel production at the refinery by providing maintenance management as well as multi-disciplined technical and brownfield modification field services.
In addition, Wood will deploy maintAI, its proprietary digital maintenance technology, to optimise maintenance strategies at the refinery through AI-powered data analysis. maintAI will identify and prioritise critical activities, reduce non-essential tasks, and enhance asset reliability.
The Lytton refinery is critical to Australian domestic energy security and has the capacity to process 6.5 billion l/yr of crude oil.
Bilfinger has been awarded a major front-end engineering design (FEED) contract from Kuwait National Petroleum Co. (KNPC) for the new North Oil Pier at the customer’s Mina Al Ahmadi (MAA) Refinery in Kuwait.
The modernisation of the oil pier represents a pivotal step in Kuwait’s ongoing efforts to modernise its energy infrastructure.
With the current oil piers at MAA nearing the end of their operational lifespan by 2030 and deemed unsuitable for further rehabilitation, KNPC is taking proactive measures to
secure the future of Kuwait’s petroleum exports. The New North Oil Pier Project, along with upgraded onshore facilities, will ensure the uninterrupted export of the country’s petroleum products well beyond 2030, reinforcing Kuwait’s position as a key player in the global energy market.
Christian Rugland, President Engineering & Maintenance International at Bilfinger, said: “By providing front-end engineering solutions, we aim to enhance operational efficiency and integrate sustainable practices, thereby
Lummus Technology has announced that Vioneo has selected its Novolen® polypropylene (PP) technology for a new grassroots plant in Antwerp, Belgium.
The plant will be part of Vioneo’s complex that, once complete, will be the world’s first industrial scale fossil-free plastics production complex. The complex, based on green methanol as feedstock, will also be highly electrified using renewable electricity and use renewable hydrogen as key components to its operations.
The plant will have a capacity of 200 000 tpy and will use 100% segregated green propylene and ethylene as feedstock to produce a wide range of PP grades. With high-purity feedstock and proven technology, PP will serve as a direct drop-in replacement for fossil-based alternatives. The plastics produced will be fully traceable and CO2 negative, allowing customers to reduce their Scope 3 emissions.
reducing environmental impact and supporting Kuwait’s long-term energy goals.”
The engineering team at Bilfinger Engineering & Maintenance Middle East will provide FEED services, which include site surveys, feasibility studies, conceptual and detailed engineering, cost estimation, and risk assessment, among others.
These aim to help optimise the pier’s operations, minimise resource consumption, and ensure compliance with the highest environmental standards.

21 - 24 September 2025
GPA Midstream Convention San Antonio, Texas, USA
www.gpamidstreamconvention.org
23 - 25 September 2025
1st Annual Aboveground Storage Tank Conference & Trade Show
Long Beach, California, USA www.nistm.org
20 - 23 October 2025
API Storage Tank Conference & Expo Phoenix, Arizona, USA events.api.org/2025-storage-tank-conference-expo
03 - 06 November 2025
ADIPEC
Abu Dhabi, UAE
www.adipec.com
17 - 20 November 2025
ERTC
Cannes, France
worldrefiningassociation.com/event-events/ertc
03 December 2025
Global Hydrogen Conference
Virtual
www.globalhydrogenreview.com/events/global-hydrogen-conference-2025/
09 - 11 December 2025
18th Annual National Aboveground Storage Tank Conference & Trade Show
The Woodlands, Texas, USA www.nistm.org
10 - 12 February 2026
NARTC
Houston, Texas, USA
worldrefiningassociation.com/event-events/nartc
17 - 20 February 2026
Laurance Reid Gas Conditioning Conference Norman, Oklahoma, USA
www.ou.edu/pacs/lrgcc
15 - 17 March 2026
AFPM Annual Meeting
New Orleans, Louisiana, USA www.afpm.org/events
Amajor reconfiguration project is set to begin at ExxonMobil’s Baytown, Texas, US, complex that will increase the production of products such as base stocks and diesel.
The strategic investment is planned to start up in 2028 and will support the continued delivery of essential energy products while allowing greater flexibility to meet future demand.
As gasoline demand declines over time, the need for high quality base stocks and liquid fuels, especially diesel, will remain strong. This investment
allows ExxonMobil to shift production toward these higher-value products. Specifically, the investment enables the expansion of the product offering to include high-quality Group III base stocks, key building blocks for lubricants.
ExxonMobil’s product solutions portfolio is highly integrated, with more than 80% of sites having co-located refining and petrochemical operations. The company has said that it will also evaluate similar reconfigurations at other US Gulf Coast sites.
Chevron Phillips Chemical has completed the expansion of its low-viscosity polyalphaolefins (POA) production unit in Beringen, Belgium, significantly boosting its manufacturing capacity in Europe.
The project has doubled the site’s LV PAO production capacity to 120 000 tpy, establishing it as the largest decene-based LV PAO facility in Europe by volume.
LV PAOs are essential components in a wide array of applications, including automotive and industrial lubricants, as well as emerging technologies such as electric vehicles, wind turbines, and immersion cooling. As industries worldwide seek more sustainable and high-performance solutions, demand for LV PAOs continues to rise.
Nikkiso Clean Energy & Industrial Gases Group (Nikkiso CE&IG) has been contracted by NPG (a joint venture to be formed by Shell and a subsidiary of FOCOL Holdings Ltd) to provide LNG regasification and cryogenic equipment for the New Providence Gas Project in Nassau, the Bahamas.
The project involves an LNG receiving terminal in support of additional power generation at Clifton Pier. It aims to deliver lower-carbon infrastructure by using
LNG to feed new and retrofitted gas turbines which previously used diesel. Nikkiso CE&IG will manufacture and deliver the LNG packaged regasification system, which includes high-pressure submerged centrifugal pumps installed in a modular pump skid; a gas-fired water bath vaporiser and associated power distribution and control systems; an insulated pipeline featuring Nikkiso CE&IG’s vacuum jacketed system; and site critical ancillary equipment. The company will also provide engineering services in support of the project.


Gordon Cope, Contributing Editor, considers how the pressure from the US administration has prompted Canada and Mexico to reconsider the continent’s energy infrastructure.
North America has benefitted from the integration of crude, natural gas, and refined fuels between Canada, the US, and Mexico for the better part of a century. Producers, pipeline companies, refineries, and petrochemical plants can choose the most efficient and cost-effective way of delivering energy and related goods irrespective of international borders. In practice, this has meant billions of dollars in savings.
Since the election of President Trump, however, this has faded away. In February 2025, the White House issued energy tariffs against Mexico, Canada, and other nations. While the tariffs were followed by temporary stays of execution, the mere threat has forced both neighbouring jurisdictions to take a look at a relationship founded on trust. Several major changes are likely to emerge over the next few years.
In 2024, Canada exported approximately 4.4 million bpd of crude and 8 billion ft3/d of natural gas, primarily to the US West Coast, Midwest, and the US Gulf Coast. The US, in turn, supplied 300 000 bpd and 2.8 billion ft3/d of gas to Eastern Canada. The US also supplied about 7 billion ft3/d of gas and 1.2 million bpd of diesel and gasoline to Mexico. The primary factors governing the transactions were economic, such as supply, demand, and costs of transportation.
Canada is especially susceptible to Trump’s geopolitical manoeuvrings. It relies on the US as its primary energy customer, shipping over 85% of its crude and half of its gas to American consumers. While the reason for this dependency is primarily due to economic forces, national politics have also played a role.
Almost two decades ago, Enbridge proposed Northern Gateway, a 525 000 bpd pipeline that would transport diluted bitumen from Alberta to the Pacific port of Kitimat, British Columbia, Canada. In 2017, the Trudeau government cancelled this to assuage environmental critics, citing the dangers of marine shipments to west coast waters.
In 2013, TC Energy proposed re-purposing the natural gas mainline that ran from Alberta eastwards across Canada to Ontario, creating the 4000 km Energy East network to deliver up to 1.1 million bpd of crude all the way to tidewater in New Brunswick. The project quickly met stiff opposition from environmental groups, First Nations, and the province of Quebec, resulting in the company shelving the plan in 2017.
When the threat of US energy tariffs arose, pundits called for the resuscitation of the projects. But Enbridge has expressed little interest in revitalising Northern Gateway, citing a horde of restrictive federal regulations that would have to be repealed in order to justify the investments needed to build the line. Likewise, TC Energy has expressed no interest in renewing its proposal, having spun off its oil transportation business in order to concentrate on natural gas opportunities in the US and Mexico.
On a positive note, the expansion of the Trans Mountain pipeline (TMX) finally entered service. When the TMX project was originally announced by Kinder Morgan in 2012, expansion of the 300 000 bpd line that ran over 1000 km from Alberta to tidewater in British Columbia would cost CAN$5 billion and add almost 600 000 bpd capacity. Opposition from the government of British Columbia, First Nations, and environmental groups forced Kinder Morgan to sell the project to the federal government. While costs ballooned to CAN$34 billion, the line now has the capacity to ship almost 900 000 bpd to the Pacific market.
The newly-elected government of Canadian Prime Minister Mark Carney also campaigned on the need to diversify energy markets. While onerous federal legislation governing tanker movements on the West Coast alongside strict community and First Nations consultations hamper the development of new pipelines, TMX could relatively quickly add another 300 000 bpd capacity by installing new pumping stations and adding drag-reducing agents.
A new market for Canadian gas is also opening up. After lagging behind the US for two decades in the development of LNG export plants, Canada is belatedly realising their value. Because Pacific-coast projects are situated thousands of kilometres closer to Asian markets than those in the US Gulf Coast, transportation costs are far lower, and thus more competitive. LNG Canada, Shell’s massive 14 million tpy complex in the Pacific port of Kitimat, began delivering LNG in 2025. It is being followed by nearby Cedar LNG, which will use a floating liquefaction plant to produce 4 million tpy by 2028.
The government of British Columbia, a long-time opponent to fossil fuel development, is now promoting the 12 million tpy Ksi Lisims LNG project, the 3 million tpy FortisBC plant, and the 2.1 million tpy Woodfibre LNG project. Feedstock for the plants will come from the massive unconventional gas reserves in Northern British Columbia and Alberta.
Regardless of tariffs, US refiners will continue to buy Canadian crude. The majority of the 4.4 million bpd of heavy oil shipped to the US is in the form of ‘dilbit’, where the viscous output from the oil sands is thinned with a diluent to make it transportable by pipeline. Refineries in the US Midwest (PADD 2), which account for over 20% of American refining, are precisely configured to take the relatively inexpensive feedstock; swapping to lighter, more expensive shale crude from Texas would require billions of dollars in retrofits. It is therefore very unlikely that PADD 2 refineries would abandon Canadian crude; in fact, Enbridge announced plans in March 2025 to expand its mainline network into the US, spending CAN$2 billion to add up to 300 000 bpd capacity by 2027.
Mexico is also vulnerable to energy geopolitics. Over the last decade, state-owned electricity monopoly CFE has been converting its generators from bunker fuel to natural gas, tapping into cheap, abundant sources in Texas, US. It imports around 7 billion ft3/d; long-term plans call for doubling that amount as LNG plants in various stages of design and construction come on-stream.
Mexico has had previous experience with the White House interfering in energy matters; when the Biden administration announced a pause in LNG approvals in order to assess their environmental impact, the move side-swiped LNG projects in Mexico. While Trump cancelled the pause upon his inauguration, the Mexican government has little doubt that the US administration could leverage its dependency on US energy imports for political gain. In order to reduce the threat, Mexico’s President Sheinbaum also announced plans for Pemex to increase its current domestic production from 3.3 billion ft3/d to 5 billion ft3/d by 2030 through a multi-billion dollar exploration and drilling programme.
Pemex is also belatedly spending funds to rejuvenate its existing six refineries and increase output. Theoretically, the state-owned company has enough capacity to meet all domestic needs for diesel and gasoline, but a combination of theft, mismanagement, and neglect has seen utilisation drop below 50%. To help ween Mexico off imports, former president Andrés Manuel López Obrador (AMLO)

Process heavier FCC feedstocks without compromise. Grace’s FUSION® catalyst technology transforms heavy resid operations. It’s built on a breakthrough process platform and a proprietary matrix binding system that fuses two of Grace’s most advanced technologies into a single-particle powerhouse.
FUSION® delivers unmatched coke selectivity and bottoms-cracking performance, enabling refiners to run heavier, higher-metal feedstocks without added catalyst or circulation bottlenecks.
Units running FUSION® operate with Ecat metals levels exceeding 12,000 ppm Ni+V.
Talk to your Grace representative to learn how FUSION® can handle your heaviest feedstocks.
championed a new refinery, the 340 000 bpd Dos Bocas facility in the state of Tabasco. The project (also known as Olmeca) has been beset by delays and price inflation from the original estimate of US$8 billion, to over US$20 billion. In addition, the company used plans that had been drawn up several years ago, and the specifications are antiquated and not suited to the coastal site. So far, output has been below 50 000 bpd, but the uncertainty engendered by Trump will likely incentivise the current administration of President Sheinbaum to iron out production bottlenecks. Other nations further afield are working to leverage White House policy to their advantage. In January 2025, the US Department of Energy (DOE) officially backed the development of LNG in Alaska. The Alaska Gasline Development Corp. (AGDC) seeks to commoditise up to 34 trillion ft3 of gas that is stranded on the North Slope adjacent to the Prudhoe Bay field. The US$44 billion project would require an 800 mile mainline capable of delivering up to 3.3 billion ft3/d to the Pacific port of Nikiski, where a liquefaction plant would produce up to 22 million tpy of LNG for export to Asia. Japan is urging Tokyo-based Mitsui to invest; the massive conglomerate would bring LNG technology and marketing skills to the project.
Tariffs on steel and aluminium are having a detrimental effect on the LNG sector. Export plants are heavily dependent on specialty cryogenic metals that can withstand temperatures of -160°C; adding up to 50% to costs compounds the burden of labour wage pressures. Additionally, LNG projects need committed, long-term buyers; Trump’s willingness to unilaterally alter trade agreements motivates potential international clients to look to non-US suppliers, like Canada, Qatar, and Australia.
In June 2025, the US administration cancelled US$3.7 billion in awards to 24 green energy projects. The Office of Clean Energy Demonstration had made the awards under the Biden administration to help companies develop new technologies that reduce carbon emissions. One of the awards cancelled was US$332 million to ExxonMobil’s Baytown, Texas, refinery project, where the company was creating green hydrogen to replace natural gas in the production of ethylene petrochemical feedstock. Environmental advocates decried the move as short-sighted; the Center for Climate and Energy Solutions estimated that the cuts could result in the loss of 25 000 jobs and US$4.6 billion in economic output. Trump’s attitude toward the environment may also affect investment decisions on carbon reduction. Many major energy companies are heavily committed to clean hydrogen and carbon capture and storage (CCS) projects to lower their carbon footprint, especially after the Biden administration established subsidies of up to US$3/kg for green hydrogen, as well as US$12 billion in aid for CCS in the Inflation Reduction Act (IRA). Now that the White House and Congress are controlled by Republicans, the loss of subsidies would have made most low-carbon projects economically nonviable; a last-minute, 2-year extension in the Trump administration’s latest budget provided temporary relief.
Still, worrying trends are starting to emerge. In March 2025, Nippon Sanso Holdings Corp. announced that it would be cancelling its hydrogen plant in Mobile, Alabama, US. The plant, which was under construction, was expected to produce 30 million ft3/d of low-carbon hydrogen for use in making 75 000 bpd of renewable diesel.
In April 2025, Dow announced that it would be delaying construction of its Path2Zero project at its existing site in Fort Saskatchewan, Alberta, Canada. Phase 1 of the CAN$9 billion expansion would have added 1.3 million tpy of polyethylene production capacity to existing facilities, and phase 2 a further 600 000 tpy by the end of the decade. The project included 1 million tpy of carbon capture and sequestration equipment. Dow cited slumping market demand as the main reason for its decision.
In May 2025, Air Products announced that it would be selling a portion of its planned Louisiana Clean Energy Complex, located in Ascension Paris, Louisiana, US. The plant is designed to produce low-carbon hydrogen and ammonia by capturing and sequestering the CO2 emitted from burning natural gas. The company announced it would be selling the carbon capture and ammonia production components, citing a desire to de-risk the investment.
ExxonMobil is moving cautiously forward with its Baytown project, which is designed to produce 1 billion ft3/d of blue hydrogen by capturing and storing 98% of the CO2 produced.
Europe, which entered crisis mode when natural gas from Russia was cut off after the invasion of Ukraine, is developing a hydrogen economy in order to ensure security of energy supply and to meet environmental goals of net zero emissions by 2050. Canada faces no gas shortage, but does have a federal goal of net zero by 2050. Ottawa is encouraging hydrogen as one of a number of environmental initiatives, but it is unlikely to reach the EU’s target of over 20 million tpy of green hydrogen production by 2050. Under the Trump administration, the US may see stagnation if the subsidies and tax credits necessary to create a low-carbon economy continue to be withdrawn.
In conclusion, the integrated energy network that was the envy of the world will be a thing of the past as geopolitical considerations trump market forces. Over the next decade, Canada will invest billions of dollars to restructure its pipeline system, seeking out new markets in Asia and Europe, in order to reduce its massive reliance on the US as a customer. Mexico will continue to import Texas gas, but it will explore and develop new domestic sources and build renewable solar and wind farms to diversify its sources of electricity. It will also strive to rectify problems in its downstream sector in order to reduce fuel imports from the US Gulf Coast. On the low-carbon energy front, the EU and other jurisdictions in Asia and the Middle East will establish market dominance over their American counterparts. While Trump will eventually leave the White House, the consequences of his policies will likely resonate within the continent for decades to come.

Quan Yang, Ming Yang Lee, Laurent Zuber, and Jiao-Jiao Dong, Sulzer Chemtech, Switzerland, alongside Feng-Jie Xu and Feng-Hua Zhou, China National Air Separation Engineering Co., explore how to effectively mitigate liquid maldistribution through crude argon (CAR) column design.
Air contains approximately 78 vol% nitrogen, 21 vol% oxygen, and 1 vol% argon. It is often desirable to produce a pure argon stream in air separation units (ASUs). In the low-pressure (LP) column, argon concentration peaks at 8 - 15 vol% in the middle section. Consequently, a gaseous stream is drawn from this section and fed to the bottom of the downstream crude argon (CAR) column. In the CAR column, argon is the top product, whereby oxygen is reduced at or below 1.5 ppm-vol. Due to the close boiling points of argon and oxygen, and the high purity required, the CAR column operates with up to 200 theoretical stages (NTS) and a reflux ratio of up to 40. The CAR column is therefore considered as a super fractionator in the industry.
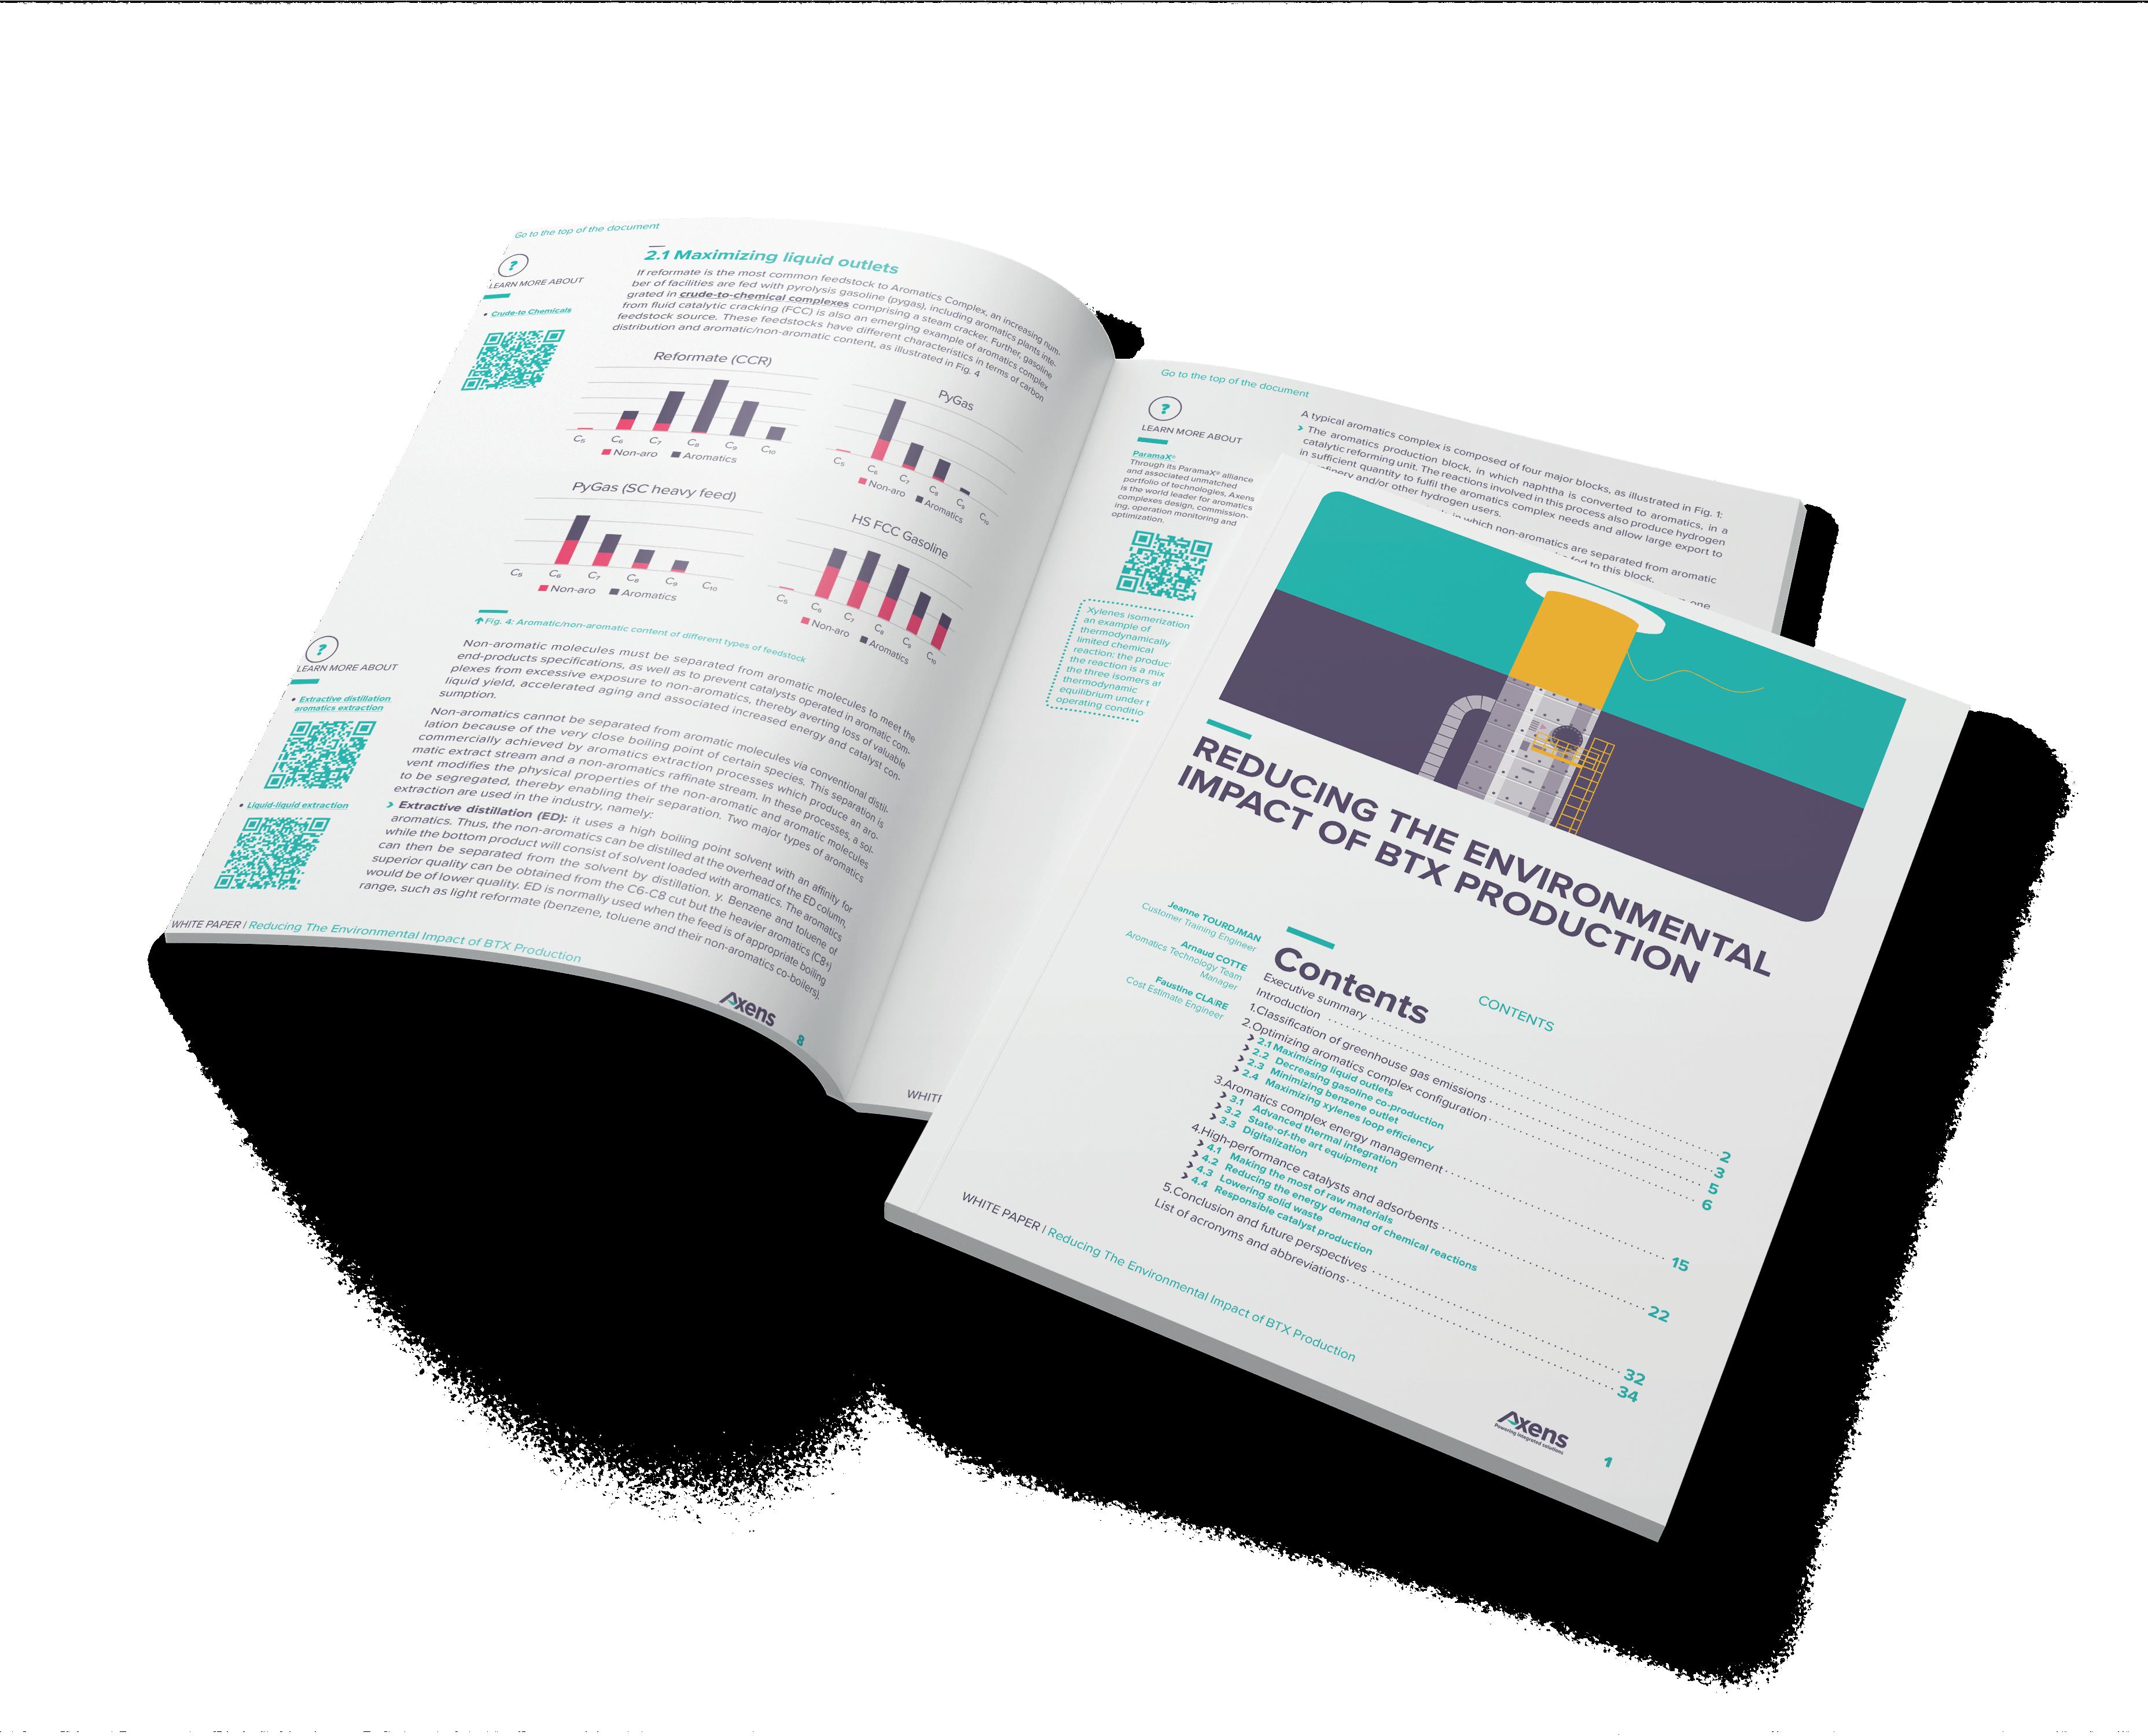
The CAR column is often physically split into two columns due to height constraints imposed by the cold box surrounding the cold section of the ASUs. Figure 1 shows the dual-column design, which necessitates a cryogenic pump, some instrumentation, as well as tortuous and large piping catering for thermal expansion and

contraction due to an up to 200°C change in temperature during start up and shutdown. In recent years, the industry is increasingly moving towards a single column solution. While this reduces overall capital expenditures (CAPEX) and enhances space efficiency within the cold box, innovations on mass transfer equipment is required, including the structured packings and column internals.
The industry has observed a decline in the separation performance of long packed beds, with laboratory research reported in 1993.1 The tests confirmed that the packing efficiency deteriorates as the bed length increases. It is now understood that, despite an effective initial liquid distribution by the liquid distributor, the liquid tends to segregate and maldistribute as it flows down the bed, worsening along the bed length. Today, standard industrial practice limits the number of theoretical stages in a packed bed to between 15 - 20. A liquid redistributor


placed between two packed beds, without intermediate feed or product streams, primarily corrects liquid maldistribution and improves liquid mixing, thus reducing radial concentration gradients caused by uneven liquid distribution.
With 200 NTS, the CAR column must be split into multiple sections to maintain the separation efficiency of the packing. However, liquid collectors and redistributors increase the column height. To keep the overall height of the column short, particularly to arrive at a one-column solution, process engineers are compelled to minimise the number of packed
beds to reduce the number of redistributor sets, each up to 1.5 m in height. Table 1 illustrates the decision-making process.
The 8-bed Option A is commonly used in CAR columns, even though it features 25 NTS per bed, which exceeds the standard range of 15 - 20 used in general applications. The preference for reducing the number of beds is understandable, but it introduces process risks. Despite advances in CAR column design, unpublished reports of periodic underperformance are communicated within the industry. In order to prevent insufficient separation performance, the bed height of the 8-bed configuration has gradually increased by up to 20%, by adding more packing layers within each bed. However, this approach can result in an overall column height greater than that of other options, potentially exacerbating the very issues it seeks to address. Furthermore, increasing bed height to counteract loss of NTS due to liquid maldistribution in an already long bed may not be an effective solution.
Process studies are showing the sensitivity of a CAR column to liquid maldistribution and the NTS per packed bed. Rather than further increasing bed heights in an 8-bed configuration, preferred column configurations are presented to design the CAR column.
To quantify the impact of liquid maldistribution on separation efficiency, a method2 using a two-column model was introduced in the 1980s. This methodology is now widely used by both researchers and industry professionals in various applications, including columns operating under tilt and motion conditions, e.g., FPSOs.3,4
A CAR column with 200 NTS serves as the basis for this study. Due to the condenser at the top, this column has a single degree of freedom, meaning the product and reflux rates cannot be independently adjusted. The crude argon product at the top is set at 2200 Nm³/h, with a feed rate of 70 000 Nm³/h (F) at the bottom. Simulations show that 90% of the oxygen in the gaseous feed is removed, achieving a 1 ppm purity level at the top. The internal liquid load at stage 175 is calculated to be 71 032 Nm³/h (L). For simplicity, a maldistribution sensitivity study is performed only for the lowest bed of the CAR column.
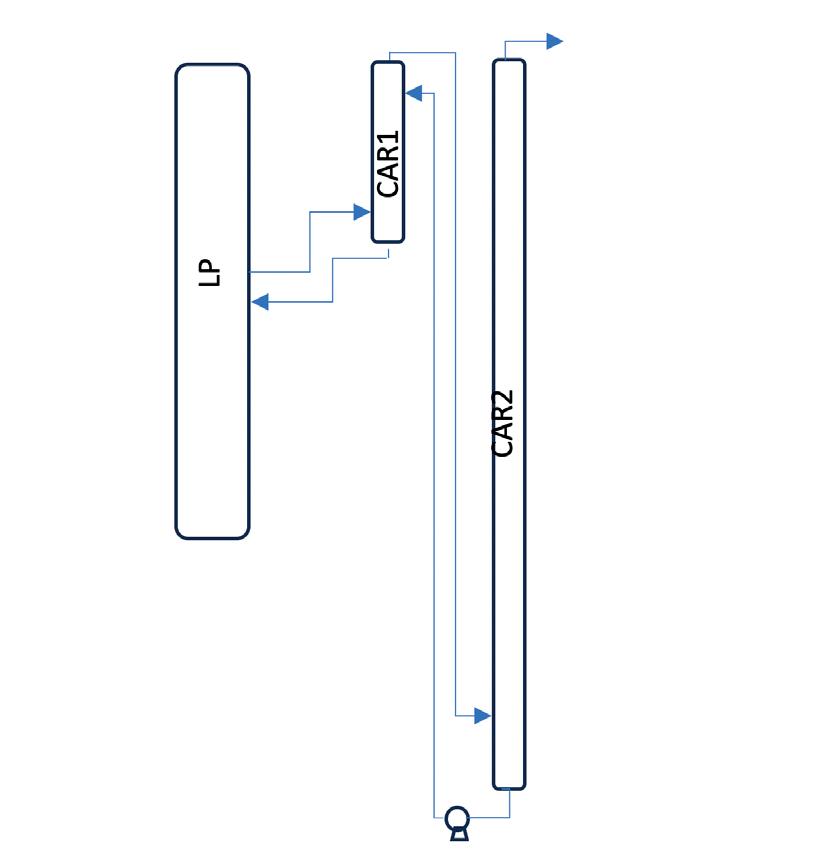
A two-column model is set, as shown in Figure 2. The CAR column lowest bed is simulated as two parallel beds of the same height and half of the section area. The columns receive an equal split of the vapour feed at 35 000 Nm³/h each at the column bottom. The liquid flow to the column top, which is the internal liquid load at stage 175, is
it to us!
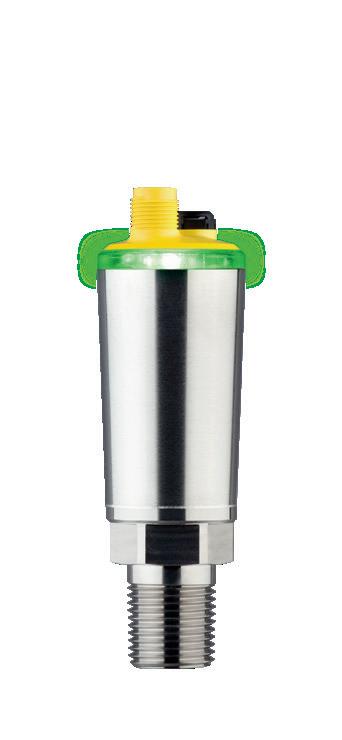
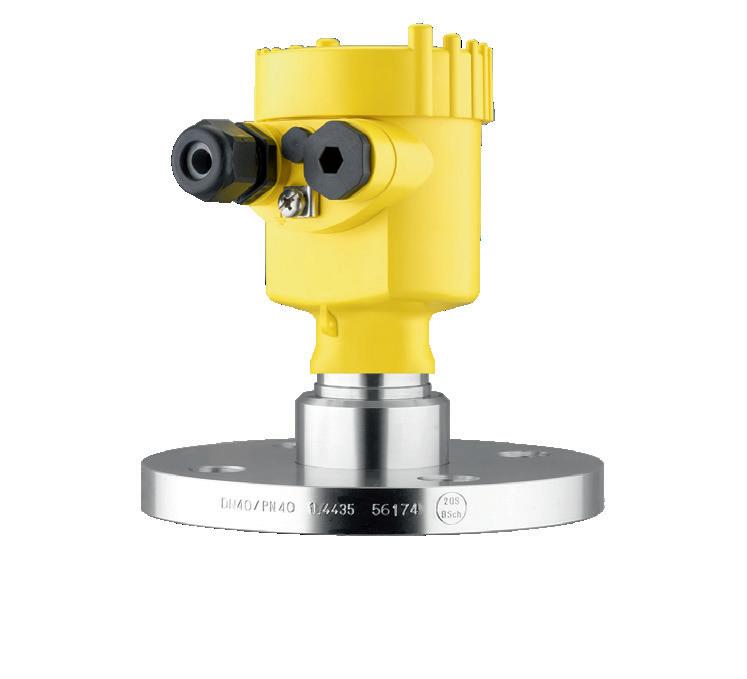
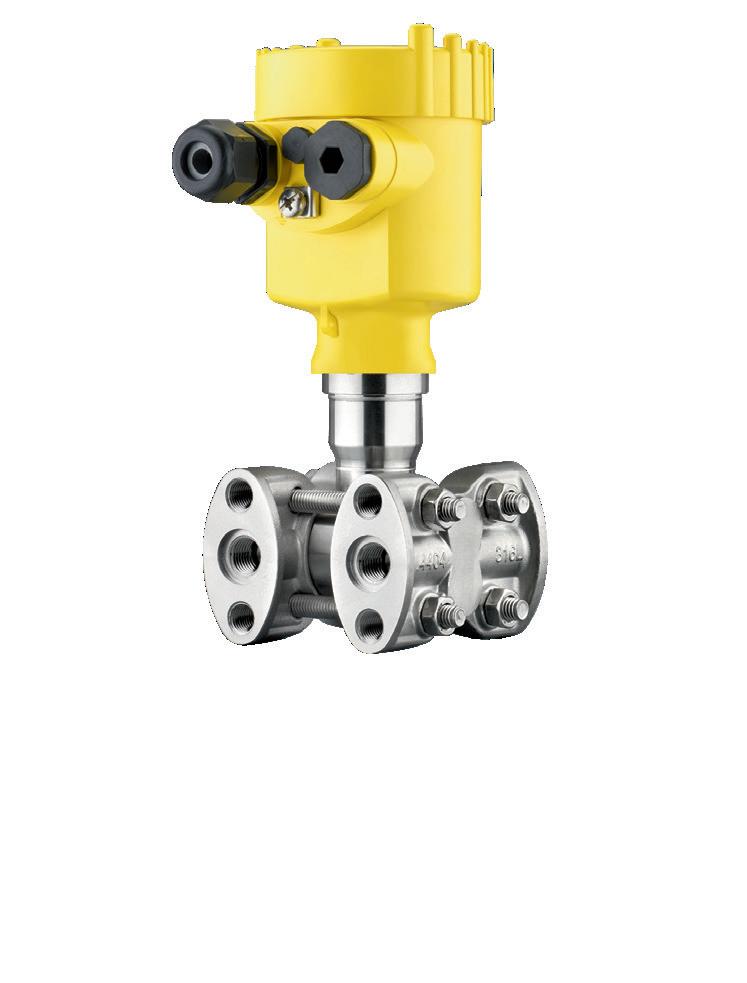
Our technologies offer everything you need for process, hydrostatic, and differential pressure for process automation. Around the world, VEGA pressure solutions stand for proven reliability and trend-setting innovation. Our pressure measurement solutions go beyond just efficient, optimised processes – they provide you with peace of mind, knowing that you’ve chosen the best technology available. Everything is possible. With VEGA.


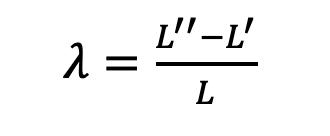
unevenly split to simulate liquid maldistribution (Table 2). Column 1 receives less liquid (L’), while Column 2 receives more liquid (L”).
The maldistribution parameter λ is defined by the relative difference of the liquid stream: (where L = L’’ + L’)
Consequently, the purities of the vapour products from Columns 1 and 2 of Figure 2 differ, represented as x1 and x2 respectively. The two product streams (Product 1 and Product 2) are then combined, and the average concentration of the mixture (x m) is determined.
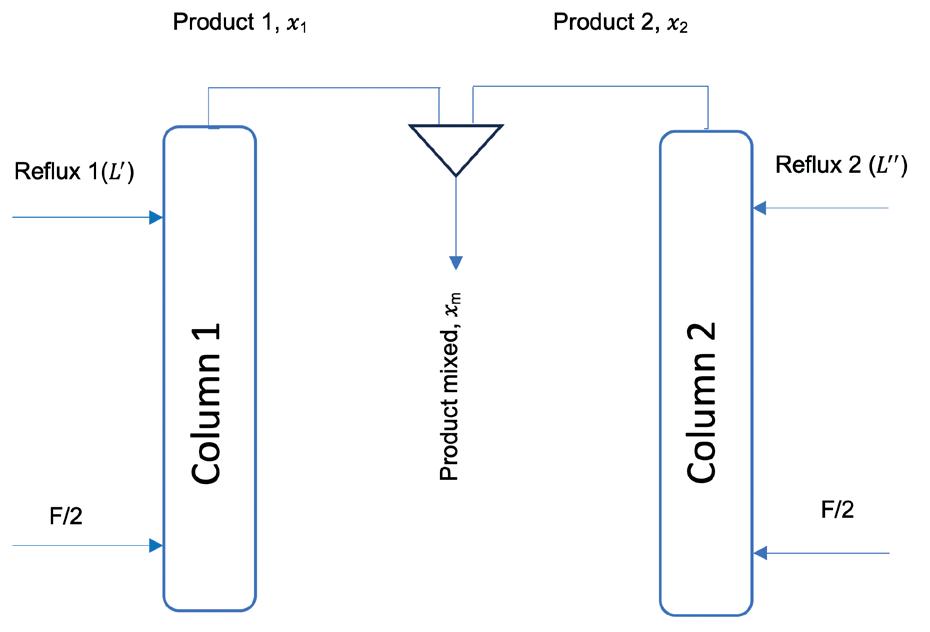
The final step involves determining an ‘apparent’ NTS value, which quantifies the efficiency loss due to liquid maldistribution. The bottom bed is then simulated as a single column (Column 3), and its NTS is adjusted until the product purity matches the mixed concentration x m .
This study is repeated considering three scenarios: 20 NTS, 25 NTS, and 28 NTS in the bottom-most bed.
The bottom-most bed is the most sensitive one to liquid maldistribution compared to the top seven beds, hence this represents the worst-case scenario for a packed bed in the CAR column. The cumulative effect of liquid maldistribution across all eight beds has not been considered in this study.
Results and discussions
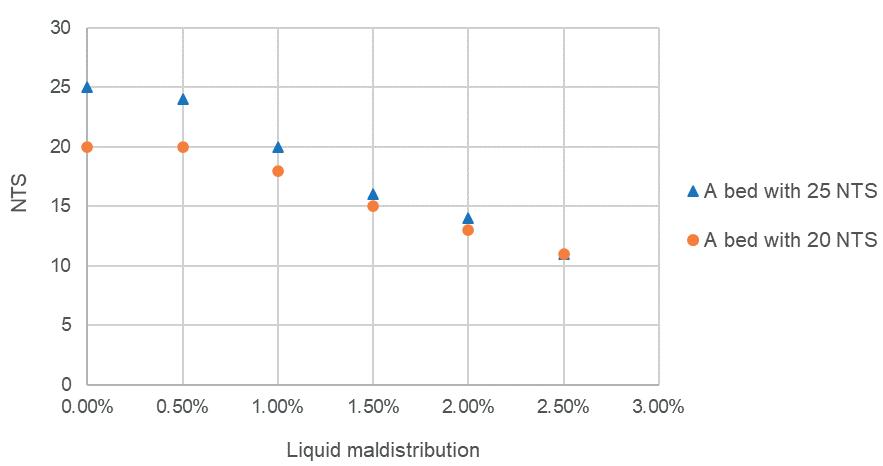
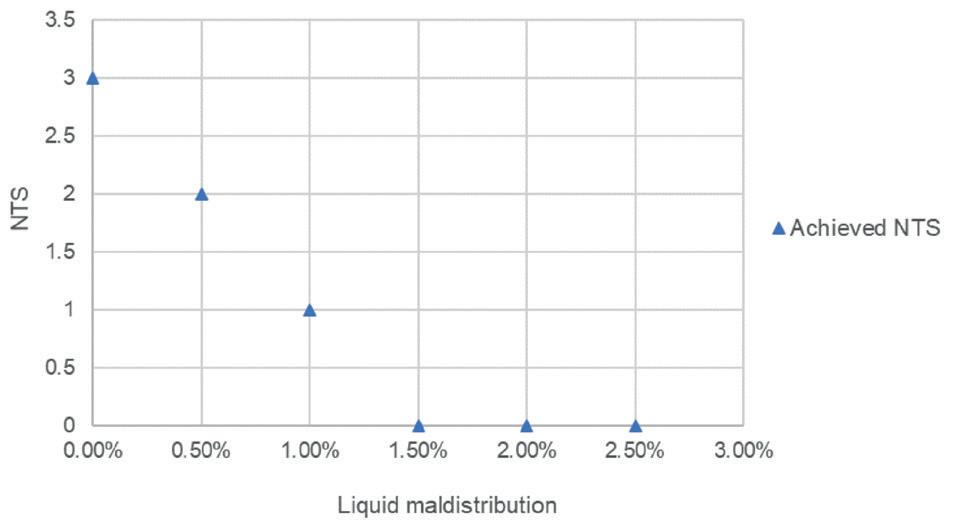
Figure 3 compares the maldistribution sensitivity of the bottom-most bed with 25 NTS (Case 1) vs 20 NTS (Case 2), while varying liquid maldistribution from 0 - 2.5% in 0.5% increments.
At 0.5% maldistribution, Case 1 loses 1 NTS, whereas Case 2 is mostly unaffected. As maldistribution increases to 1.0%, Case 1 loses 5 NTS, while Case 2 loses only 2 NTS. The disparity in lost NTS between the two cases grows with increasing maldistribution, reaching a 5 NTS difference at 1.5%, at which point the benefit of having 5 more NTS in the design phase disappears.
Figure 4 examines the effectiveness of adding extra packing height to mitigate maldistribution risks in an 8 bed CAR column, where each bed contains 25 NTS. An additional height of packing is added, expected to contribute 3 extra NTS. As shown in Figure 4, at 0.5% and 1.0% maldistribution, this added packing height contributes with 2 and 1 additional NTS, respectively. However, when maldistribution exceeds 1.5%, the extra height does not improve performance at all.
The key observations from these studies are:
n The lower section of the CAR column exhibits high sensitivity to liquid maldistribution.
n In long beds, the impact of liquid maldistribution intensifies.
n Adding extra packing height to mitigate liquid maldistribution risks becoming ineffective beyond a certain threshold.
It should be noted that besides inherent liquid maldistribution along the bed, even more severe maldistribution can be caused by other factors, such as inconsistencies in packing uniformity or excessive liquid by-passing the packed bed along the column wall. Issues with column internals, like blocked liquid discharge holes, or unevenly levelled redistributors and poor verticality of the column, especially in large-diameter columns, can also contribute to severe liquid maldistribution.
In this study, the bottom-most section of the CAR column is isolated, and interactions among beds were not considered. It is important to note that various types of redistributors exist on the market, and some mix the collected liquid better than others. Poor liquid mixing between the beds worsens the radial liquid concentration differences in each bed, as it lets it propagate to the beds below.
Based on these findings, splitting the column into 8 beds with 25 NTS each introduces process risks due to liquid maldistribution. Introducing additional packing height as a design margin has limited ability in increasing the NTS achieved. It is, however, possible to improve the CAR column designs for more robust and effective column operations.


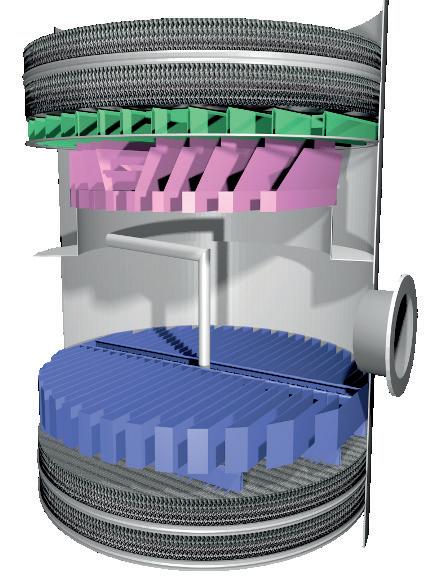
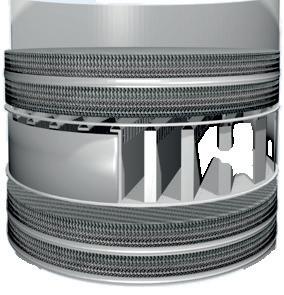
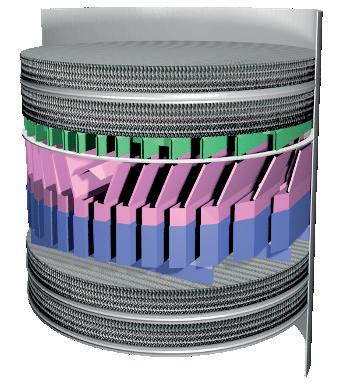
Figure 5. Various types of liquid redistributors: a standard type (left), a pan-type (middle), and a 3-in-1 type (right).
Table 3. Possible configurations for the CAR column
Sensitivity to liquid maldistribution Base High
* Between the top of the first bed and the bottom of the lowest bed
It was previously mentioned in this article that a redistributor set between two packed beds requires 1.5 m in height for the CAR column size considered in this study. This refers to the traditional standard design (Figure 5 left) comprising a packing support grid, a liquid collector, a support ring, sometimes a mixing box, and a trough-type liquid redistributor. This design offers the best minimisation of liquid maldistribution, equalising radial hydraulic and concentration gradients before redistribution to the packed bed below. However, this design is being phased out in the CAR column due to the tall height, leading to a dual-column design.
To achieve single-column designs, a pan-type redistributor is often used instead (Figure 5 middle), which can be installed at heights as low as 400 mm. It collects liquid but does not feature any liquid mixing; hence only equalises hydraulic gradients and not concentration gradients. Furthermore, it tends to have a lower distribution quality compared to the trough-type traditional redistributor shown in Figure 5 left. Therefore, CAR columns built with conventional pan-type redistributors can become prone to liquid maldistribution and suffer from a deterioration in the separation efficiency. Such columns seem to lose NTS during operation.
To solve this challenge, Sulzer has developed a 3-in-1 redistributor which performs liquid collection, mixing, and redistribution similar to the traditional standard design, while offering an average height 500 mm shorter than the traditional standard redistributor (Figure 5 right).
Because the CAR column height must be minimised, structured packing with high separation efficiency is specified for the CAR column. The MellapakPlusTM 752.Y is often the preferred structured packing for the CAR column, as it has the highest separation efficiency in the MellapakPlus family.
Since the CAR column has a low vapour load compared to the LP column, there is an opportunity to optimise the structured packing for the CAR column, focusing on efficiency more than capacity. Therefore, Sulzer recently developed the MellapakTM Air structured packing, which can offer up to 20% more efficiency compared to MellapakPlus 752.Y.
By incorporating the 3-in-1 redistributor and/or the Mellapak Air structured packing, new possibilities to configure the CAR column are unlocked while maintaining the single-column design and increasing the robustness of the column performance.
As can be seen in Table 3, a simple upgrade from the pan-type redistributor to the 3-in-1 redistributor in an 8-bed configuration already offers better liquid mixing and redistribution at a modest increase in column height. However, using 9 beds of Mellapak Air with 3-in-1 redistributors offers the best solution to assure column performance while minimising the column height.
The design of the CAR column remains a complex engineering challenge due to the close boiling points of oxygen and argon, and the extremely high purity requirements. Traditional design choices – such as limiting the number of packed beds to minimise column height – come with trade-offs in efficiency, particularly when bed lengths exceed 20 theoretical stages. This study has demonstrated that long beds are especially sensitive to liquid maldistribution, and that increasing packing height alone provides diminishing returns, especially beyond a certain maldistribution threshold.
The findings emphasise that effective mitigation of liquid maldistribution requires more than just conservative design margins. Instead, innovations in column internals – particularly improved redistributor designs and high-efficiency structured packing – offer a more robust solution. Overall, a careful rethinking of both internals and configuration allows for a better-performing, single-column CAR design that meets industry demands for purity, reliability, and compactness.
1. Fractionation Resarch Institute, ‘Progress Report: November/December Issue’, (1993).
2. YUAN, C.H., and SPIEGEL, N.H., ‘Theoretical and Experimental Investigation of the Influence of Maldistribution on the Performance of Packed Columns at Partial Reflux’, Chemie Ingenieur Technik, Vol. 54, (1982), pp. 774 - 775.
3. DUSS, M., and ROZA, M., ‘Columns Subject to Motion: Maldistribution Sensitivity and Susceptibility’, 10th International Conference on Distillation & Absorption, Germany, (14 - 17 September 2014).
4. ZUBER, L., and ROZA, M., ‘How to design distillation columns for moving conditions’, AIChE Spring National Meeting, Houston, US, (April 2001).
5. JAFARI., S., et al, ‘CFD study of mixing performance of redistribution systems for packed columns’, Hydrocarbon Processing, (June 2017).
6. MORILLO, E., and YANG, Q., ‘Optimized height is key for cryogenic ASU column design’, BIC Magazine, (September/October 2023).

Mellapak™ is the most widely used structured packing worldwide introduced by Sulzer in 1977.
The newest generation MellapakCC™, structured packing specifically developed for carbon capture, decreases operational costs through improved carbon dioxide capture, absorbing it more efficiently from flue gas streams of fossil-fueled power plants.
Sulzer MellapakCC™ significantly reduces the column size and the pressure drop across the carbon dioxide absorber, thus reducing capital and operational expenses and minimize the energy consumption. Carbon capture and storage or utilization (CCS/CCU) is a key strategy that businesses can adopt to reduce their CO2 emissions. By selecting the right technologies, pressing climate change mitigation targets can be met while benefitting from new revenue streams.
This packing is currently applied in several leading CCS/CCU facilities worldwide, delivering considerable process advantages. By partnering with Sulzer Chemtech – a mass transfer specialist with extensive experience in separation technology for carbon capture – tailored solutions that maximize return on investment (ROI) can be implemented. With highly effective CCS/ CCU facilities, decarbonization becomes an undertaking that can enhance sustainability and competitiveness at the same time. sulzer.com/chemtech

A podcast series for professionals in the downstream refining, petrochemical, and gas processing industries


Sponsored by

EPISODE 10
Lara Swett, Vice President of Technical & Safety Programs, American Fuel & Petrochemical Manufacturers (AFPM), explains how the downstream sector continues to improve its process safety record.
EPISODE 11
Graham Faiz, Head of Digital Energy, DNV, explores the current state of digitalisation in the energy sector and the key drivers behind digital transformation. Graham explains how companies can move from pilot projects to full-scale deployment of AI and digital tools.
EPISODE 12
Omar Sayeed, Centre of Excellence Leader for Reliability, and Rahul Negi, Director of AI and Industrial Autonomous, Honeywell Process Solutions, consider how new, innovative technology can help to overcome some of the challenges facing the downstream oil and gas sector.
EPISODE 13
Sarah Miller, President and CEO of the GPA Midstream Association and CEO of the GPSA, outlines the vital importance of midstream operations, and some of the key challenges and opportunities facing the sector.

Emily Ruhl and Michael Krela, Koch-Glitsch, USA, explore the development of distillation tray valve types and consider how operators can best align valve selection with current demands and future challenges.
As the refining and chemical industries evolve, so does the focus on maximising energy efficiency and operational capacity. Distillation accounts for approximately 40% of energy consumption in refining and chemical processing1 and 6% of total energy use in the US.2 The design of distillation internals, particularly the selection of tray valve types, is an important decision that can strongly influence the energy efficiency and capacity goals of a plant. A poorly operating tower can significantly increase its energy consumption. Understanding how different valve types perform under varying conditions can simplify valve selection decisions and better align column design with long-term energy and capacity goals.
Distillation trays have been used for centuries, with the earliest consisting of simple holes in the deck (sieve trays). Another early design was the

‘bubble cap’, a large, formed cap patented by Cellier-Blumenthal in 1815.3 Both devices served the industry for over a century, with the bubble cap tray used in services with a wide operating range. In the 1950s, movable valve trays were developed. These were smaller devices than bubble caps and improved on sieve trays with additional capacity and turndown by providing a cover over the hole. In the early 1990s, valves that are punched directly from the deck material were developed, which enhanced both capacity and reliability. In recent years, valve performance has been further optimised, and several new valve devices have been developed to increase capacity and efficiency compared to earlier generations.
Valve performance is directly related to the active area performance of the tray. While the valve type has some effect on the downcomer performance, the main impact of valve


performance is on the deck area. Tray efficiency depends on effective vapour and liquid interaction, which is achieved through uniform contact across the tray and thorough mixing at the deck level. Any inefficiencies in vapour and liquid contact across the tray will result in a greater energy requirement to make the separation, leading to energy inefficiency which is counter to plant sustainability goals.
The upper limit of efficient operation is defined by jet flooding, which is where a large percentage of the liquid hits the tray above (entrainment). Eventually, this leads to the column filling with liquid which makes the column inoperable.
Weeping, the lower limit of efficient operation, occurs when there is insufficient vapour pressure and liquid falls down onto the tray below through the openings in the deck, bypassing the contacting area on the tray. Weeping at the inlet of the tray is the worst type since the liquid misses contact on two tray levels, dropping near the downcomer below. This can cause inefficiency at minimum rates where more energy is required to maintain the vapour pressure and keep the efficiency at an operable level.

The feature set of an active device will have a direct influence on its performance. By examining the specific features a device has, operators can directly correlate this to the performance in the tower.
The most basic deck device is the sieve hole. This is simply a hole in the deck without any added features to direct vapour flow or prevent liquid from weeping through the opening.
Movable valves, such as type T valves, have a cage and moving valve cap over the deck hole. This gives the hole some protection from liquid weep at low vapour rates and blocks the hole as the valve closes.
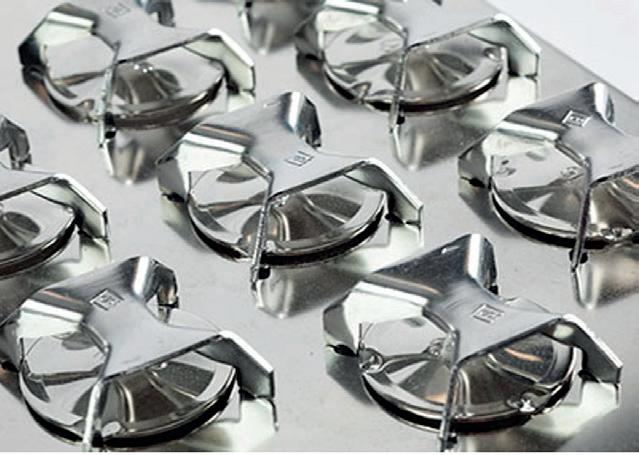
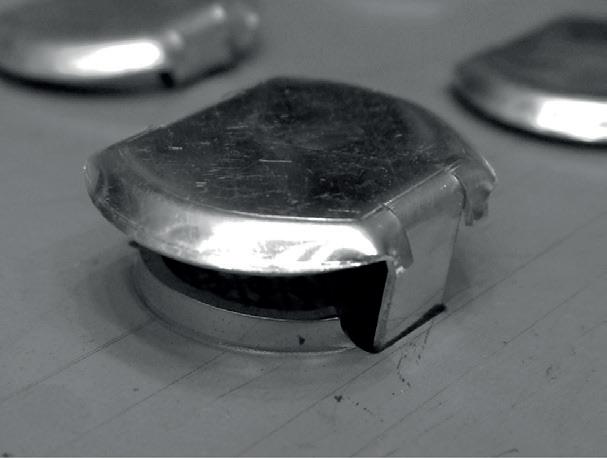
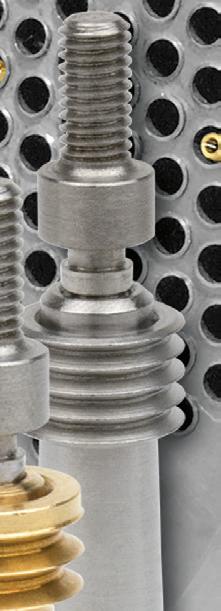
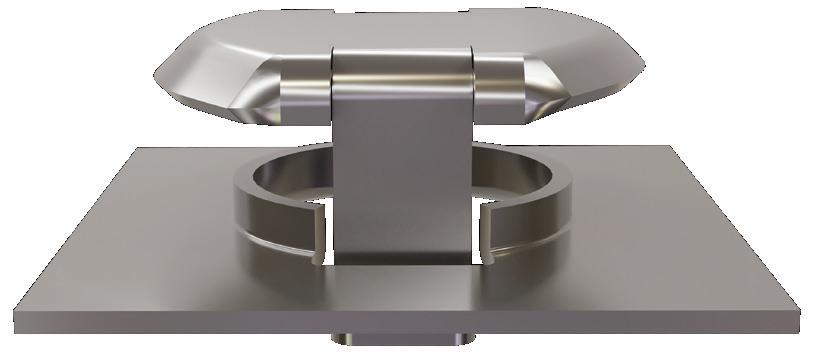
The latest generation of valves have a variety of features to enhance efficiency, capacity, and turndown performance. FLEXIPRO® floating valve trays have a shaped cap that directs the vapour flow to leave the valve in a downward fashion. The valve shape, with a narrower downstream leg, helps create a forward pushing action which helps minimise gradients in the froth. The hole is extruded upward, creating a barrier to help prevent liquid from weeping through the hole. The floating valve also includes a moving cap that is able to close at reduced vapour rates to improve vapour distribution and further prevent the liquid from weeping through the cap (Figure 1).
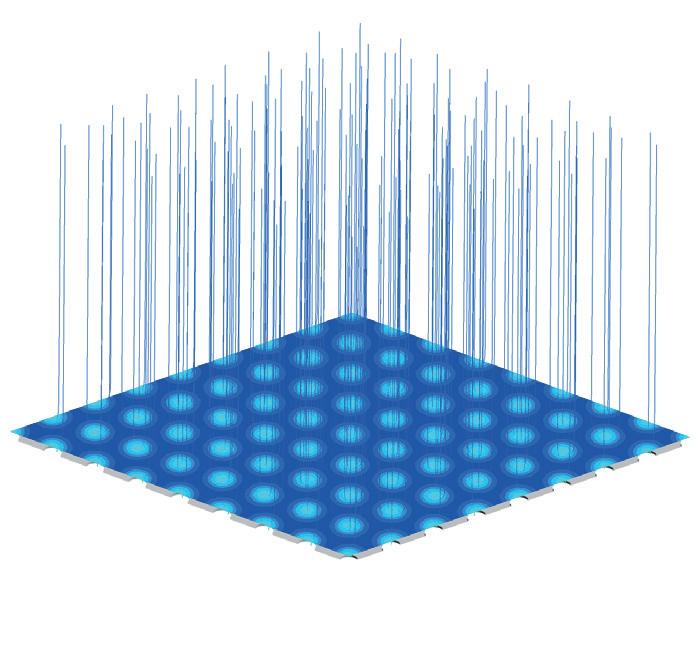
Computational fluid dynamics (CFD) simulations model fluid behaviour by using numerical methods to solve equations governing fluid flow. CFD techniques have been specifically developed to help analyse valve efficiency and capacity. These techniques can be used to model the valve features that were previously discussed and to provide a visual representation of how the features impact performance.


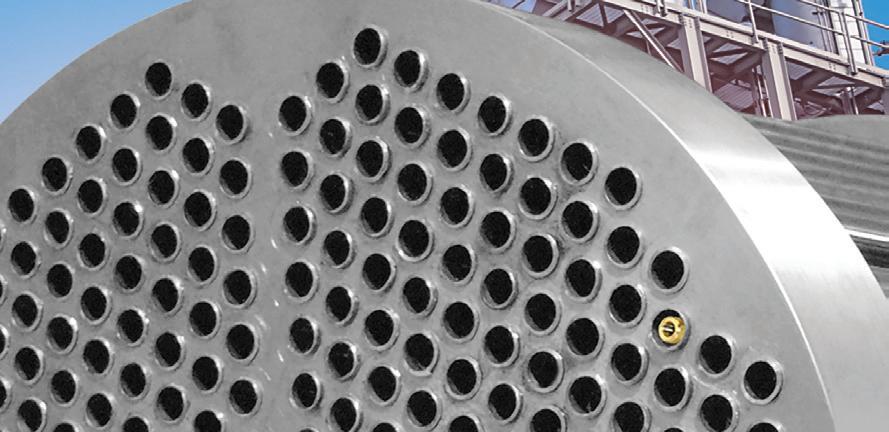


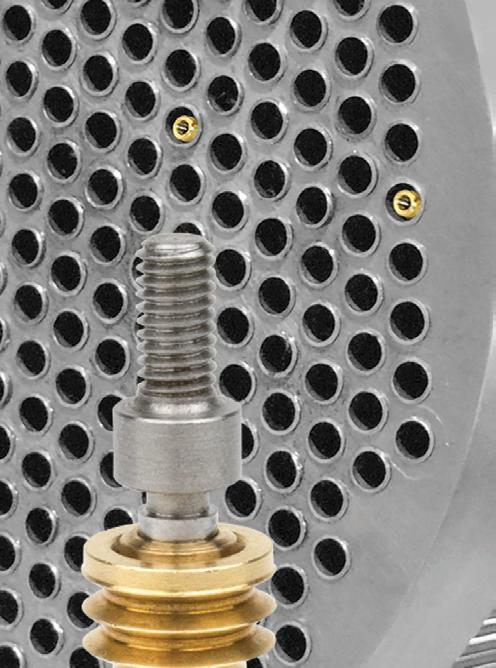


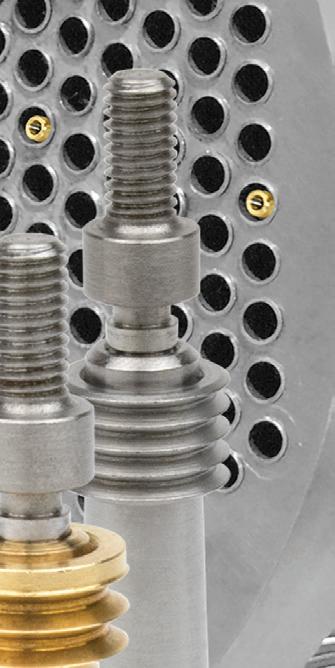


ASME PCC-2 Compliant Heat Exchanger Tube Plugging System
Trusted by power and process plants around the world as their go-to tube leak solution, Pop-A-Plug Tube Plugs from Curtiss-Wright are engineered for optimal performance throughout the life cycle of heat exchanger equipment. Controlled hydraulic installation eliminates welding and time-consuming pre-/post-weld heat treatments that can cause damage to tubes, tube sheet ligaments and joints.
• Simple hydraulic installation − no welding!
• Helium leak tight seal to 1x10 -10 cc/sec
• 100% Lot tested to ensure unmatched quality
• Pressure ratings to 7000 PsiG (483 BarG)
• Wide range of sizes and ASME/ASTM certified materials available

Ask about our Smart Ram 640T for fast & reliable cordless installations!


877.383.1029 l est-sales@curtisswright.com l cw-estgroup.com/HydroEng25


Vapour velocity vectors leaving the valve correspond to how well the vapour and liquid mix, and are also related to the capacity of the device.
Looking at the basic sieve hole, vapour exiting the hole has an upward only trajectory and no mixing on the deck level. This can be seen in the CFD image of that device in Figure 2a.
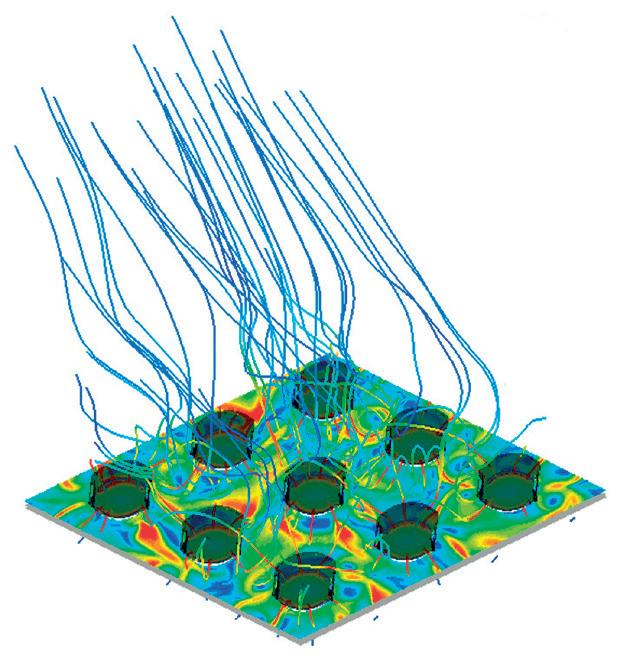
Conventional moving valves, like the T valve, have a cover over the deck orifice to help prevent the liquid from weeping when the tray is operating at reduced vapour loads. The trajectory of the vapour is still generally in the upward direction and there is little mixing between the vapour and liquid at the deck level, as seen in the CFD image in Figure 2b, with the lowest vapour velocity (blue zones) witnessed at the deck level. This means there is minimal vapour-liquid contact close to the tray deck.
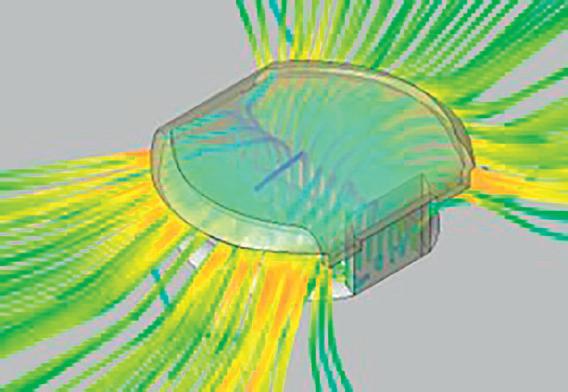
Moving to the latest generation of valves, the CFD of a FLEXIPRO floating valve tray shows how the downturned cap on the valve directs the vapour to leave the valve downwards (Figure 2d). The downward vapour trajectory reduces the entrainment of liquid to the deck above, which directly translates to greater capacity. The CFD image (Figure 2c) shows that the downward turn also results in more intense mixing at the deck level which enhances the efficiency as shown by the high vapour velocity zones (in red and yellow).
In addition, the forward motion to the vapour as it leaves the valve results in a pushing action, as shown in the CFD image (Figure 2c) by the vapour profile lines pointing in the direction of the liquid flow on the deck. This reduces the amount of entrainment and gradients in the froth profile.
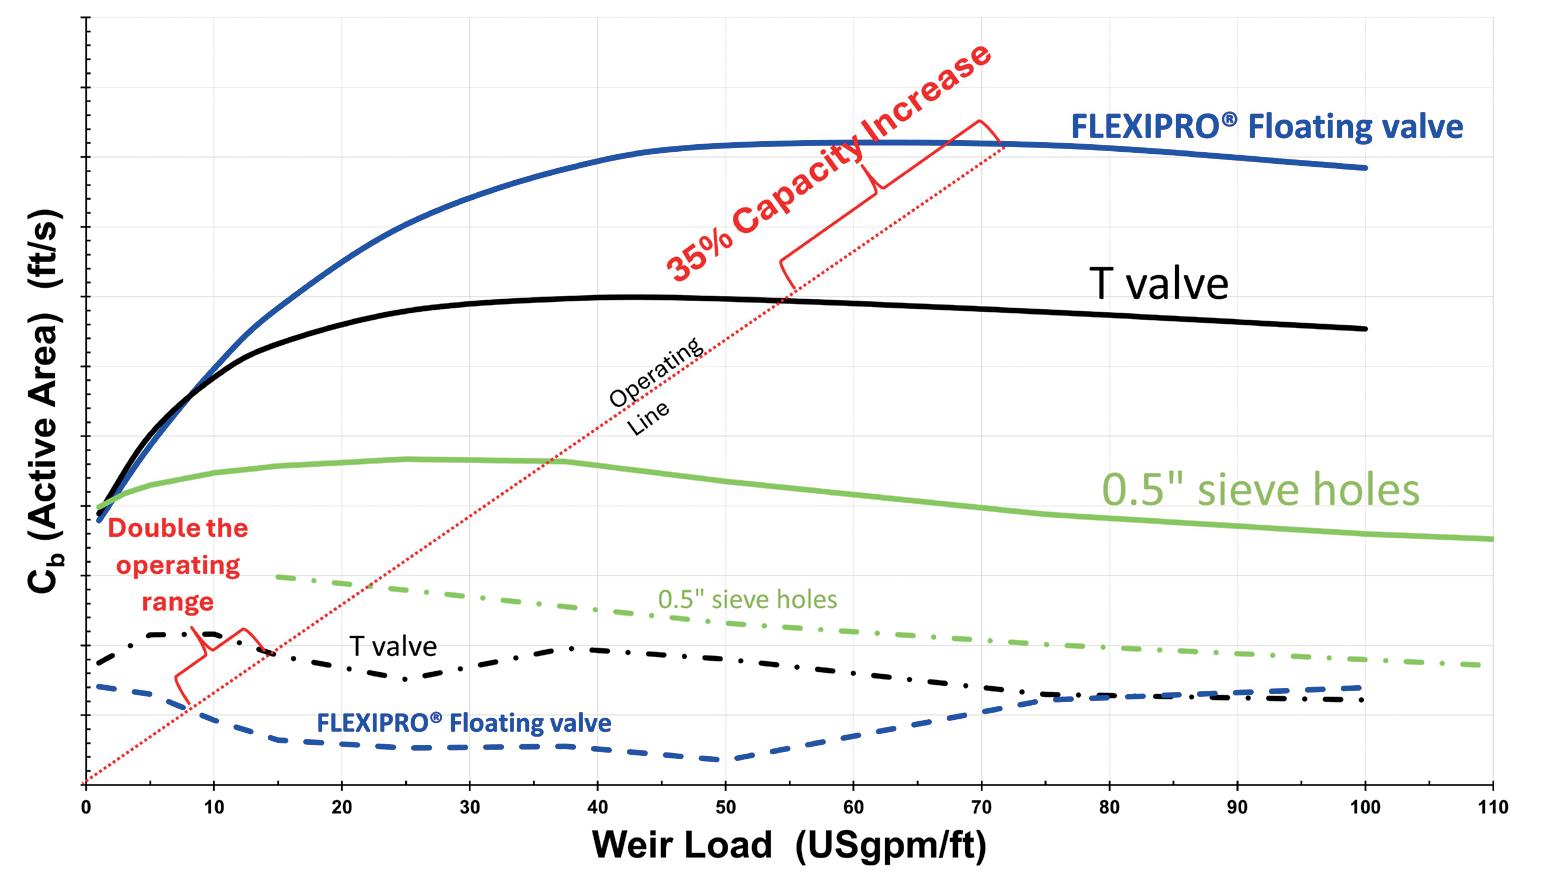
The differences in features can be seen in the data for these valves (Figure 3) in an air/water system comparing sieve holes, the moving T valve, and FLEXIPRO’s floating valves. The sieve tray has the lowest capacity and the narrowest operating range. And on the upper end, the floating valve trays have approximately 35% higher capacity than the T valve tray, which is in the middle. The tapered cap and the forward push help contribute to the valve tray’s reduced entrainment. The upwards


We’ve reimagined valve tray design to help operators increase capacity by up to 30%, extend operating range and enhance efficiency at turndown. The FLEXIPRO® floating valve tray delivers high performance you can trust.
Discover game-changing performance at www.koch-glitsch.com/flexiprofloatingvalve
koch-glitsch.com

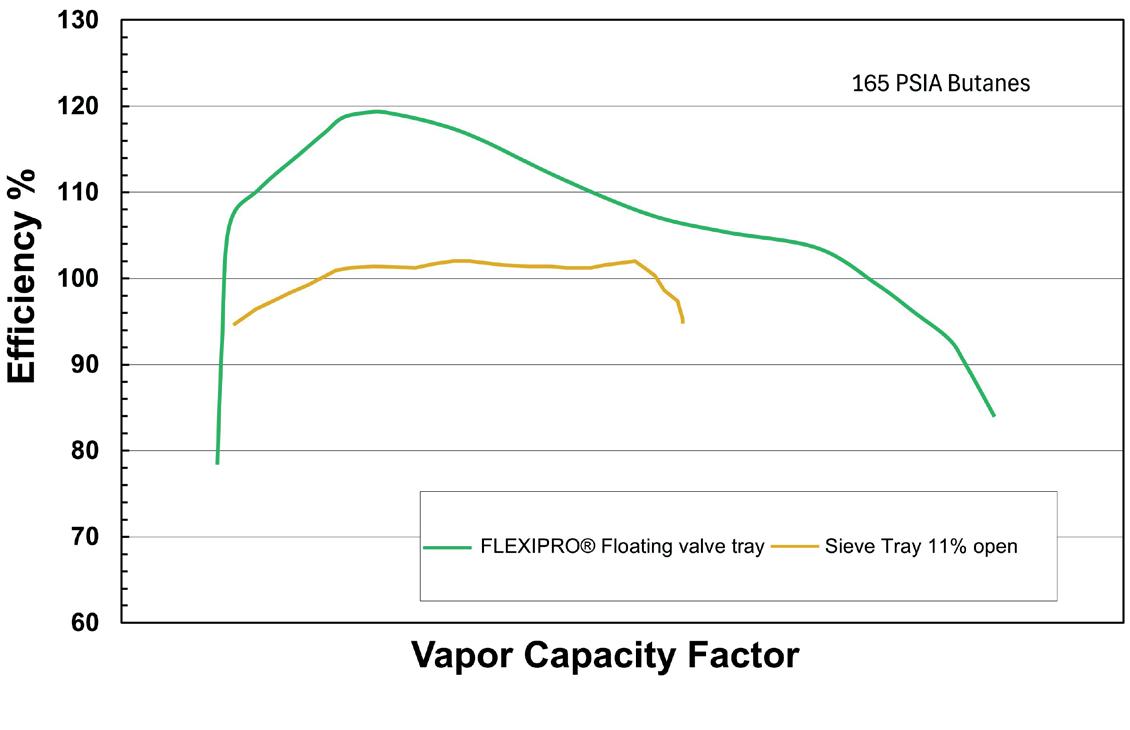
extruded hole results in enhanced turndown performance by preventing liquid from entering the hole. The floating valve provides double the turndown performance compared to T valves due to its advanced features.
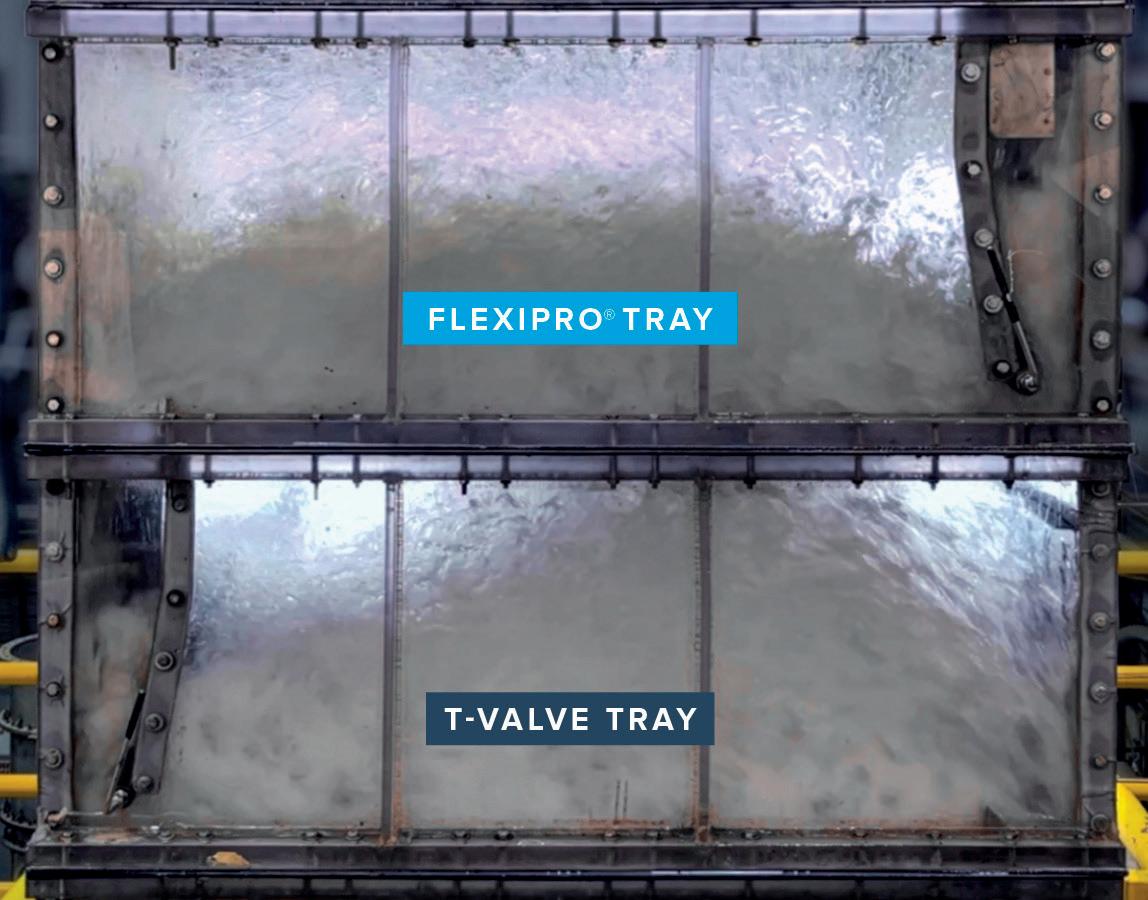
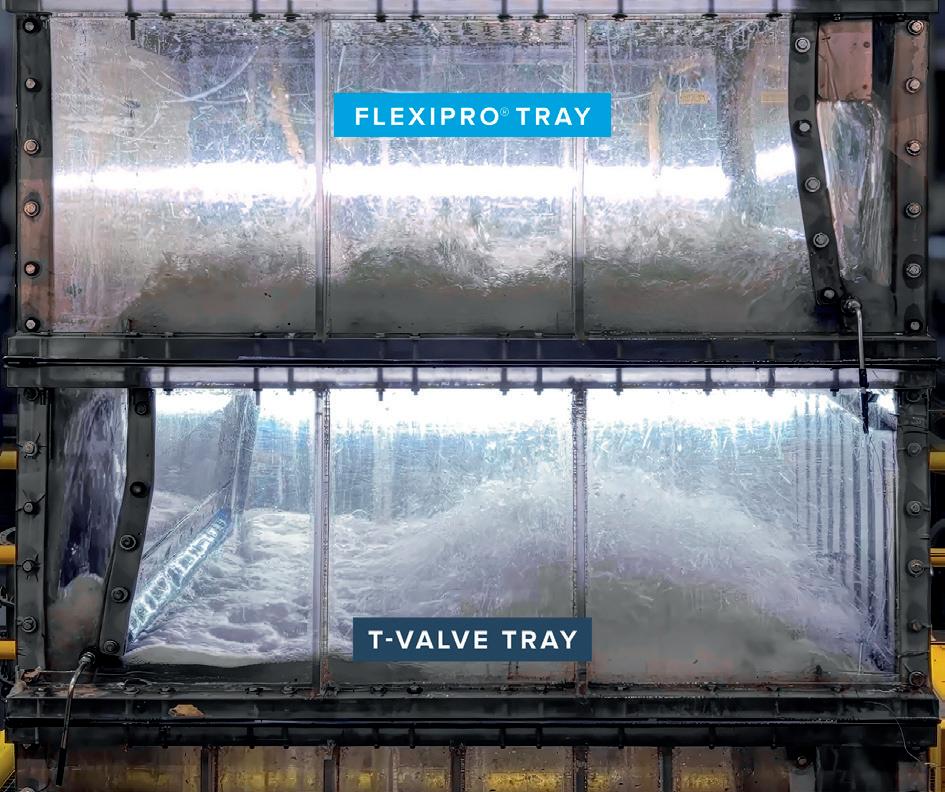
The various valve features can be best compared in an operating pilot column. Koch-Glitsch’s air/water test apparatus offers a clear view into the column at various flow conditions. From this, operators can simultaneously see two trays in operation, with the floating valves on the top tray and T valves on the bottom tray. Each tray has the same tray design, with the only difference being valve type. The left image in Figure 4 shows conditions at high vapour rate, where the T valve tray on the bottom level is entraining 10% of the liquid to the tray above, and the floating valve tray on top is in normal operating conditions. The downward turn of the FLEXIPRO valve cap and the push effect of the valve can be seen in the flat froth profile across the flow path. The first few rows of the T valve tray are less active, creating a mountain-like profile that peaks around the middle of the flow path, indicating vapour maldistribution. The disengagement area is less clear above the froth on the T valve deck, which translates to less capacity, while the floating valve tray offers additional capacity. This allows for either a diameter or height reduction for grassroot towers or an increase in capacity for existing columns.
At a relatively low weir loading of 25 gal./min per ft, some of the turndown enhancement features create a noticeable difference in the froth profile on the tray (Figure 4 right). The T valve tray has no upstream leg protecting it from liquid coming out of the downcomer and the liquid is scooped into the valve opening, particularly at the first row of valves next to the downcomer exit. This inlet weep is detrimental to the efficiency of the tray. The upward trajectory of the vapour creates a clear layer of liquid at the deck level on the T valve tray deck where there is no vapour liquid contact at all. At these conditions, additional energy would be required to maintain the efficiency of the column. The wider upstream leg and extruded orifice protect the floating valve tray from weeping. The contoured cap and pushing action of the valve create a well-mixed, uniform froth across the tray deck and at the deck level. This means that for applications with low liquid load, less vapour is required to maintain the efficiency of the tower, resulting in less energy use.
If the efficiency of these devices in a hydrocarbon system is considered, there is a large difference in the efficiency of a simple sieve hole compared to the floating valves (Figure 5). This improved efficiency can directly translate into less energy required for the same separation.
As shown in the visual analysis, the various features of the latest generation of tray valves translate into better performance. Looking at a deisobutaniser as an example, the vessel size can be reduced, which will result in a large reduction in the capital cost of the tower (Table 1).
In addition, the turndown performance will be enhanced for the valve tray, eliminating the energy inefficiencies that the sieve trays would experience at lower rates.
Decades of tray valve innovation, from early sieve holes to modern floating valve designs, highlight the critical role of advancements in distillation technology. Supported by CFD simulations, test data, and visual observation, these enhanced valve features have been shown to improve energy efficiency, increase capacity, and expand operational flexibility. As the industry continues to prioritise operational excellence and performance, such technologies represent the ongoing evolution of mass transfer equipment to meet current demands and future challenges.
1. WHITE, D., ‘Optimize Energy Use in Distillation’, Chemical Engineering Progress, (March 2012).
2. CAHILL, J., ‘Reducing Distillation Column Energy Usage’, https://www.emersonautomationexperts.com/2010/industry/ downstream-hydrocarbons/reducing_distil/
3. NIEUWOUDT, I. and PENCIAK, J., ‘Best of both’, Hydrocarbon Engineering , (July 2007), pp. 85 - 91.
The traditional energy sector can be broadly segmented into three interlinked domains: upstream, midstream, and downstream. Each component plays a vital role in ensuring the secure and efficient delivery of energy to end users. While upstream operations focus on exploration and production, and midstream activities manage transportation and storage, it is in the downstream segment where raw hydrocarbons are refined and processed into the high-quality fuels and materials essential to modern life.
This article will highlight the often overlooked but essential role of filtration as it relates to the downstream sector. From refining to distribution, and across pipelines, trucks, and storage facilities, the reliability
and efficiency of filtration systems directly impact product quality, safety, and compliance.
Downstream operations encompass a diverse range of activities, including crude oil refining, natural gas processing, petrochemical production, and distribution of end products such as: gasoline, diesel, and jet fuel; LNG and processed natural gas; lubricants, waxes, and asphalts; and chemical feedstocks for plastics, solvents, and resins.
The downstream segment culminates in the delivery of these refined products to commercial, residential, and industrial consumers. A clean and stable fuel or feedstock stream is not just a preference – it is a requirement. This is where filtration is of paramount importance.

Neil Richards, PS Filter, Canada, discusses how effective filtration through best-practice strategies ensures production integrity, operational efficiency, and regulatory compliance.
Where filtration fits in
Filtration also provides a critical role in downstream processes, where it is an integral thread woven into multiple critical steps, including:
n Feedstock pre-treatment: before crude oil or gas is processed, particulates, water, and solids are removed to protect downstream units.
n Catalyst protection: solid and liquid contaminants can poison costly catalysts in reactors and reformers.
n Amine and glycol systems: used for acid gas removal and dehydration, these systems rely on fine filtration to eliminate degradation byproducts and extend solvent life.
n Final product polishing: filtration ensures that final fuels meet ISO cleanliness codes and remove haze, colour bodies, or residuals.
n Volatile organic compounds (VOCs) and vapour phase control: activated carbon and specialty medias are used for vent filtration, odour control, and vapour-phase recovery to protect the environment.
n Transportation assurance: filters on loading racks, tanker lines, and rail terminals help avoid contamination during delivery.
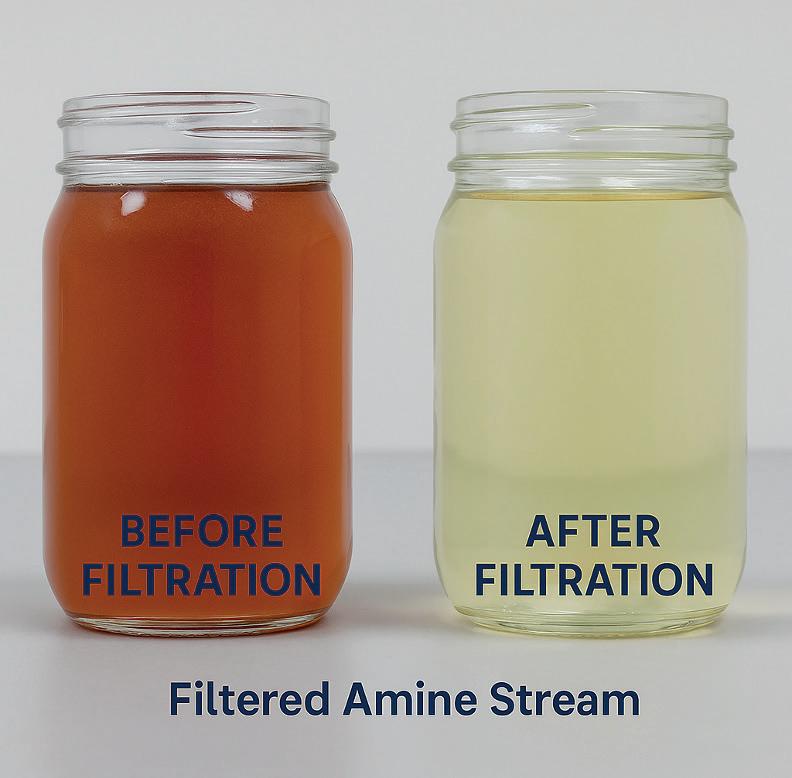
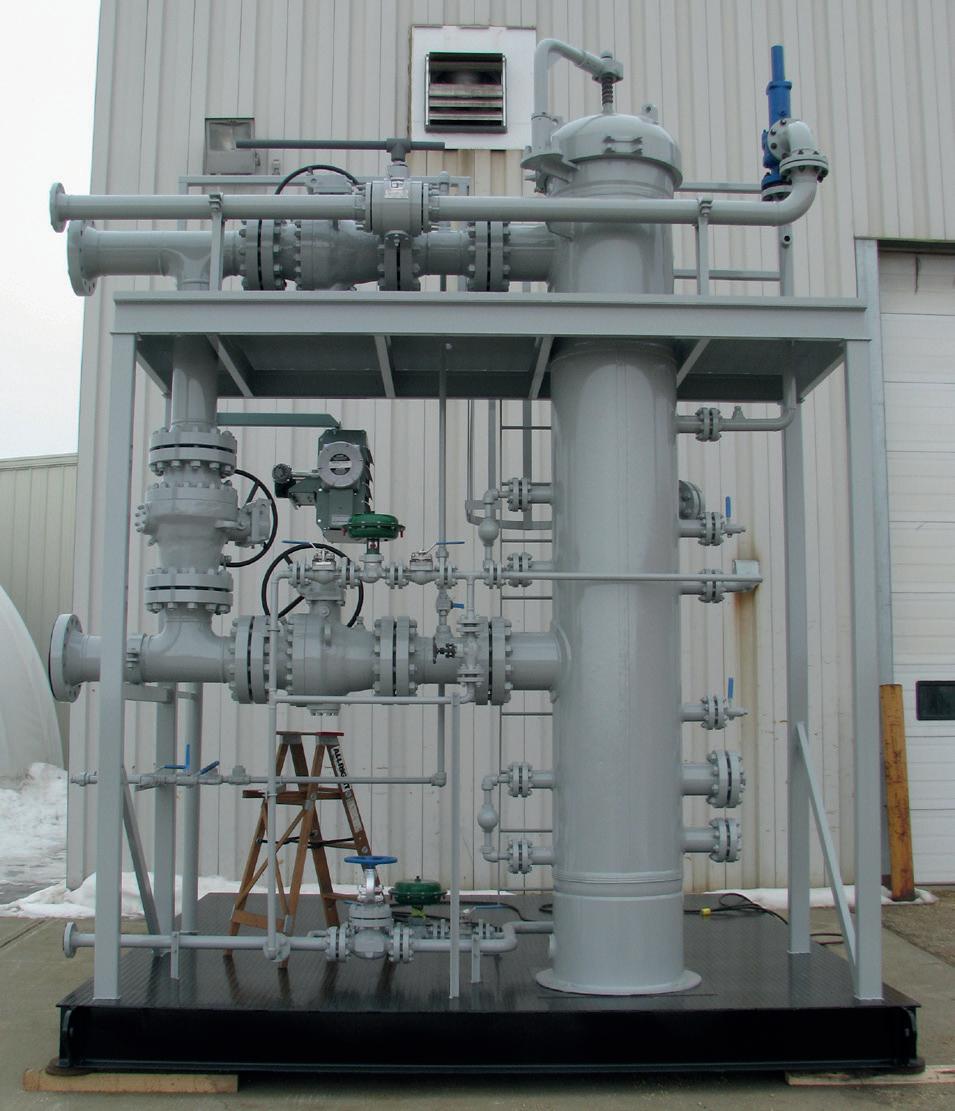
Amine systems are used in gas processing to remove CO2 and H2S (Figure 1). Over time, amines degrade and form heat-stable salts (HSS), which cannot be removed by simple mechanical filtration. They can, however, be removed by the combination of several different mechanisms in a multi-stage process.
Multi-stage filtration setup for diethanolamine (DEA): stage breakdown
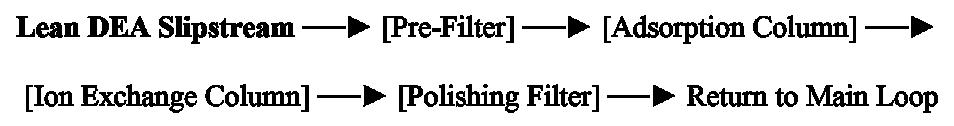
Pre-filter (particulate removal)
n Removes suspended solids, corrosion products, and debris.
n Prevents clogging of downstream media.
Adsorption column (organic catch)
n Activated carbon or synthetic media to adsorb organic degradation products.
n Targets HSS precursors and surfactants.
n Helps reduce foaming tendency.
Ion exchange column (HSS removal)
n Packed with strong base anion exchange resin.
n Removes acetate, formate, and other acid anions.
n Regenerated periodically with caustic solution (NaOH).
Polishing filter (final clean-up)
n Traps trace particulates or resin fine.
n Ensures maximum amine clarity and purity.
n Equipment: efficient one micron filter or membrane filtration.
This setup gives reliable HSS control with minimal solvent loss and operational downtime.
In addition to HSS control, PS Filter® utilises process specific filter designs to mitigate the build up of particulate contaminants in amine systems. When paired with adsorbent media to remove dissolved organics, this is an effective strategy to reduce foaming tendency and protect downstream equipment fouling.
Ensuring the final product meets tight cleanliness standards is not just a box to tick – it influences everything from regulatory compliance to engine performance to the longevity of processing assets downstream. Fuel producers, pipeline operators, and petrochemical exporters all benefit from downstream filtration strategies that offer clarity and stability, longer equipment life, reduced maintenance and downtime, compliance with ISO and ASTM specifications, enhanced end user safety, and final product performance.
While filtration is well recognised in upstream production and water treatment applications, its role in downstream operations is of equal importance and should not be overlooked. From fuel desulfurisation, liquid and natural gas performance, amine and glycol loop protection, to final polishing of fuels, precise filtration can ensure that every drop of product meets the stringent clarity and quality requirements demanded by end users and meets regulatory compliance.
Even in post-refining and processing, filtration continues to play a vital role across transportation network-pipelines, tanker trucks, railcars, and storage facilities. Clean, stable products are essential to avoid fouling, ensure flow assurance, and maintain product shelf life and performance.
Downstream success depends not only on chemistry and engineering, but on cleanliness, stability, and confidence in all the products that are produced. As global fuel and gas specifications become stricter, and transportation chains more complex, filtration remains the silent enabler of product integrity. For companies engaged in the downstream sector, investing in robust filtration strategies is essential.
PS Filter has developed and implemented solutions that address real-world operational pain points, such as the following:
n LNG dew point control: coalescing filters with high-pressure housings protect cryogenic exchangers from aerosol contamination.
n Polishing systems for diesel backup power: skid-mounted modular systems are used to maintain diesel fuel clarity to meet critical standards.
n VOC scrubbers and vapour phase units: liquid-phase and vapour-phase activated carbon systems are tailored to site conditions to optimise processes and meet environmental regulations.
n Blending and loading line protection: in-line cartridge filters at terminals and truck racks ensure clean loading into transport vehicles to reduce any contamination that may be present.
In LNG applications, filtration is most critical in areas where contamination can compromise safety, efficiency, or equipment integrity. It matters most in:
Gas turbine air intake systems
n Why it matters: turbines drive refrigerant compressors in LNG trains. Ingested particulates, salts, and hydrocarbons can cause fouling, corrosion, and catastrophic failure.
n Filtration focus: multistage air filters with hydrophobic media to block water and salt-laden aerosols.
Amine and glycol systems (gas sweetening and dehydration)
n Why it matters: contaminants like hydrocarbons and solids cause foaming, solvent loss, and off-specification gas.
n Filtration focus: liquid and gas coalescers and particle filters upstream of contactors and re-generators.
Main LNG heat exchangers and condensers
n Why it matters: fouling from aerosols or particulates reduces heat transfer efficiency and increases downtime.
n Filtration focus: high efficiency coalescers and particle filters to protect cryogenic equipment.
Molecular sieve driers
n Why it matters: protecting the bed from fouling extends cycle life and prevents off-specification gas.
n Filtration focus: high efficiency coalescers and fine particle filters upstream.
Compressor protection
n Why it matters: entrained liquids and solids can damage valves and pistons.
n Filtration focus: coalescing filters and separators to remove aerosols and lube oil carryover.
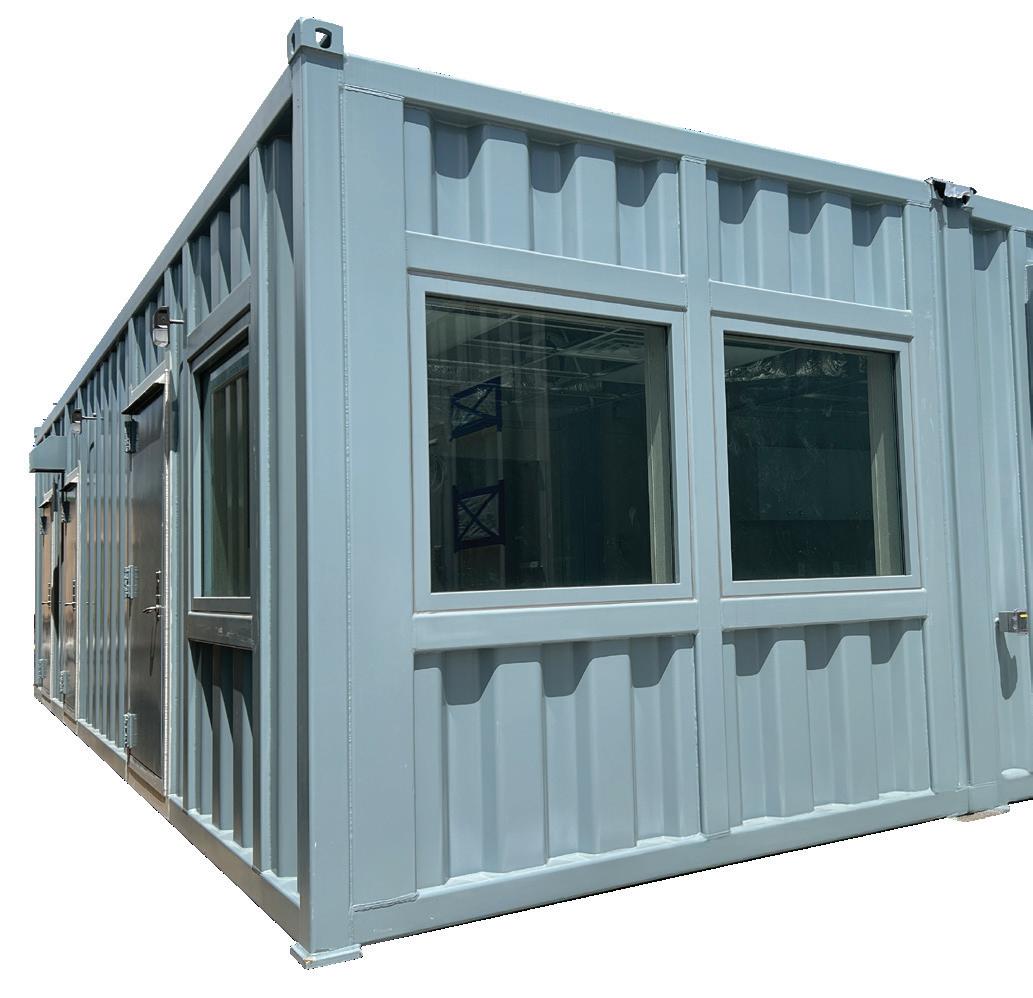
Hunter’s custom modular buildings are purpose-built to support seamless maintenance, optimize reliability and meet unique operational needs. Engineered for rapid deployment and long-term performance — and designed to adapt as projects evolve — Hunter structures bring trusted protection on every front
Occupied Structures Control Rooms, Operator
Lab Buildings, Guard Shacks & Accommodations

Condensate water and rich amine treatment
n Why it matters: hydrocarbon contamination affects downstream processing and can contribute to off-specification product.
n Filtration focus: liquid and liquid coalescers for hydrocarbon removal.
practices in downstream filtration
Several key best practices have emerged for successful downstream filtration such as:
n Size for flux rate, not just flow: optimising for lower flux improves filter life and clarity.
n Use beta-rated elements: filters with Beta 5000 ratings provide consistent particulate removal vs some ambiguous products that fail to meet efficiency specifications.
n Pre-filter to protect final polishing: layered defence prevents premature fouling.
n Consider media compatibility: for amine and glycol systems, and VOC applications, ensure filters resist chemical degradation and meet the required effluent quality.
n Monitor pressure drop and changeout indicators: predictive maintenance is more efficient than reactive swaps.
n Integrate VOC recovery: storage tank breathers and media filter units to reduce emissions and mitigate environmental risks.
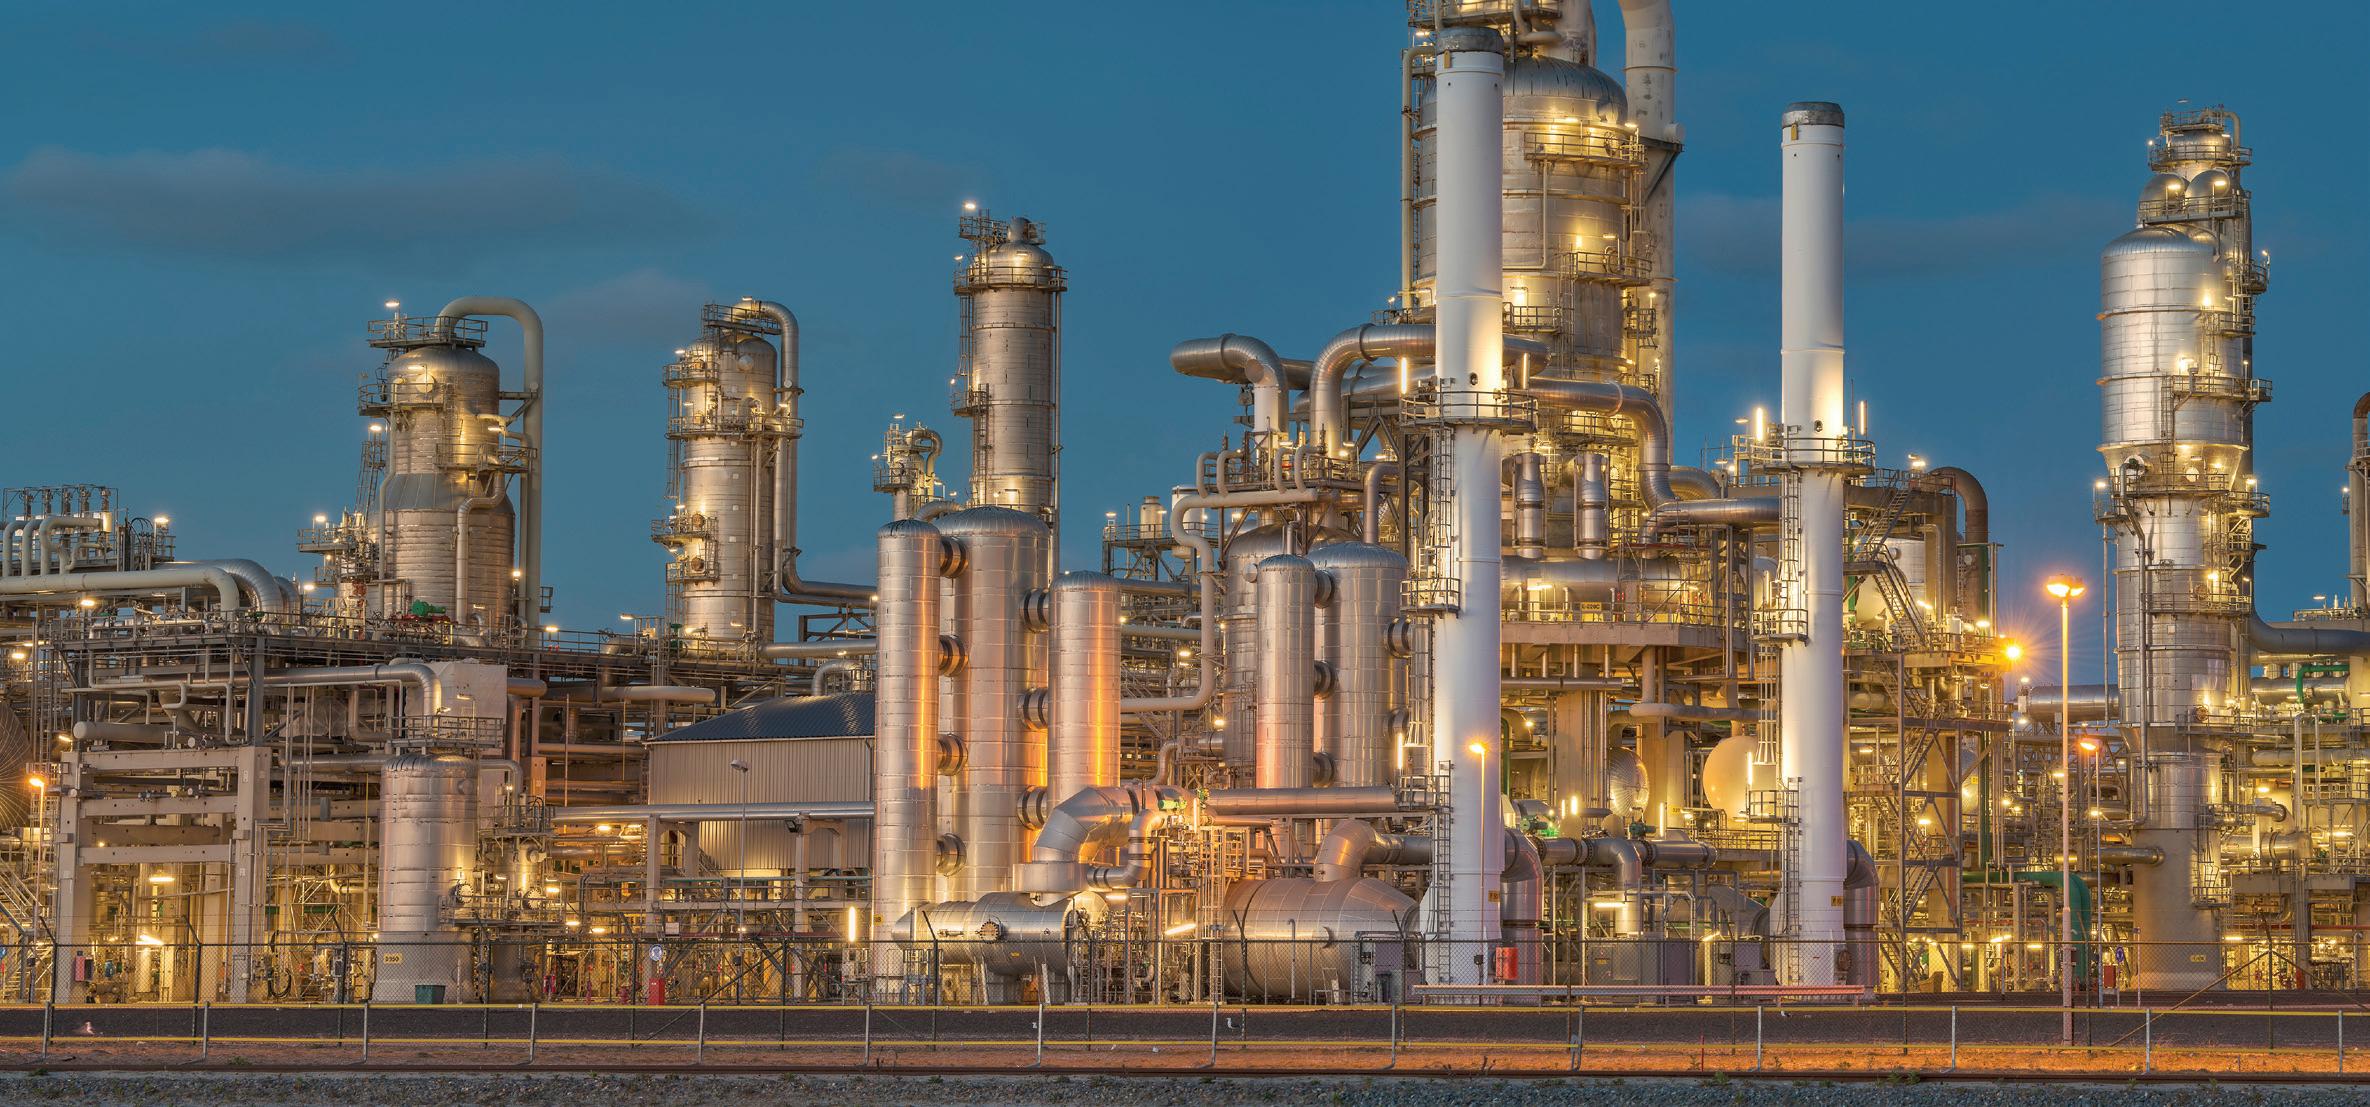
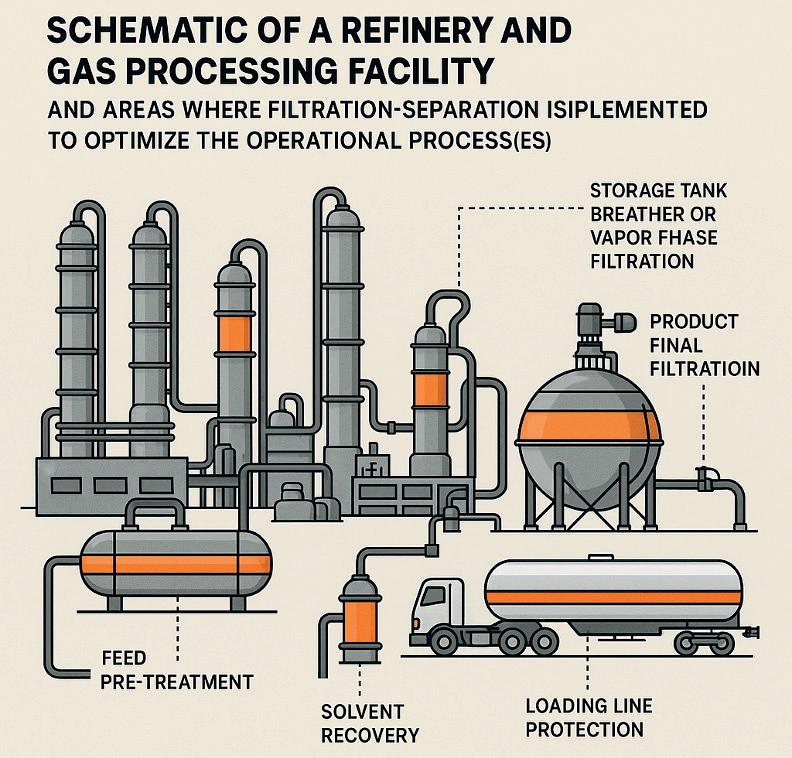
Figure 2 highlights some filtration integration points across a refinery or gas processing facility.
Filtration is embedded in feedstock pre-treatment, catalyst protection, amine and glycol systems, final product polishing, vapour phase control, and transportation, safeguarding equipment and product integrity. Each stage represents a risk point for contamination – and a strategic opportunity for filtration to enhance reliability and performance.
As the energy landscape evolves, downstream filtration principles are increasingly applied to the production of renewable natural gas (RNG). Raw biogas, typically derived from anaerobic digestion or landfill sources, contains high levels of moisture, particulates, H 2 S, siloxanes, and VOCs, all of which must be removed to meet pipeline specifications or end use requirements.
PS Filter designs and supplies multi-stage purification systems that integrate particulate filters for bulk solids removal, coalescing elements for fine aerosol separation, activated carbon beds for VOC and odour control, specialty media for siloxane and sulfur compound removal, and cartridge or bag filtration for pre-treatment and polishing.
These systems are modular, scalable, and customisable to meet varying flow rates, feed gas conditions, and gas quality standards. By transferring proven downstream oil and gas filtration methods into the biogas sector, companies can ensure operational uptime, regulatory compliance, and reliable gas quality – helping bridge the gap between conventional and renewable energy infrastructure.
In the increasingly complex and interconnected downstream sector, effective filtration is no longer a passive afterthought – it is a proactive strategy for delivering consistent product quality, operational efficiency, and customer trust. As environmental standards tighten and market expectations evolve, investing in fit-for-purpose filtration is essential.
Michael Clements, Filtration Technology Corp. (FTC), explores how technical evaluations in filtration trump so-called ‘brochure engineering’.
In the world of hydrocarbon processing, the smallest inefficiencies in filtration can have oversized consequences. From unscheduled shutdowns and soaring filter spend to unnecessary health and safety risks, selecting filtration systems with little more than a brochure and a price point to guide the decision – what might be called ‘brochure engineering’ – fails to account for the complexity of real-world operations.
Yet all too often, this is exactly how decisions on filtration are made. Without proper technical evaluation and validation, refineries risk implementing changes that fail to address root issues, waste capital and, in some cases, exacerbate operational problems.
A data-driven technical evaluation and validation is not only prudent – it is essential.
The process begins with a critical first step: establishing a detailed baseline of the existing system. From there, potential improvements can be designed and validated based on specific goals, such as improved fluid quality, extended

run times, reduced operational costs, and improved safety and environmental outcomes.
Before considering any filtration changes, the most crucial step, which is oftentimes skipped, is establishing a baseline for the existing system. This includes evaluating the filter element, filter vessel, and process parameters in detail.
Filter element:
n Retention, efficiency, and test method must be understood to know what performance is currently being achieved. Without all three, companies cannot truly know what the filter is doing. Listing only one or two offers clues, but not a complete or reliable picture.1
n Materials of construction matter. Media type, support layers, core structure, elastomers, and netting all influence compatibility, durability, and filtration performance.
Filter vessel:
n Ideally, access to a full drawing package ensures accurate understanding.
n Inlet/outlet line sizes, schedule, flange type/rating, and materials of construction (including pressure and non-pressure retaining components) are vital for compatibility and sizing.
n Design conditions must be reviewed to ensure safe operation under all flow and pressure conditions.
Process information:
n Operating conditions such as temperature, pressure, and flow rates need to be evaluated across their minimum, normal, and maximum values. Time duration of excursions from the norm must also be understood.
n Fluid composition should include not just the primary stream but also start up, shutdown, and blend scenarios.
n Fluid quality at both the inlet and outlet of the filter must be measured. Key data points include total suspended solids (TSS), particle size distribution (PSD), hydrocarbon and water content, and microscopy.
n Contamination profile should be established, using tools like Fourier transform infrared spectroscopy (FTIR), energy dispersive spectroscopy (EDS), and X-ray diffraction equipment (XRD) to identify particulate and fouling agents.
Equally critical is understanding the filter’s purpose. Many times, filter vessels are just considered a piece of fixed equipment – a tag number in a piping and instrumentation diagram (P&ID) or a ‘piece of the puzzle’. But a filter vessel in a processing unit serves a purpose much greater than that.
Evaluating whether the filter is achieving its intended performance is also essential. Are foaming events occurring in the amine loop? Is differential pressure (dP) in the catalyst reactor trending up? Are downstream components fouling? These questions help define the real-world effectiveness of the existing setup and identify targets for improvement.
Two case examples demonstrate how applying a structured technical evaluation process can uncover root causes, challenge long-held assumptions, and lead to practical, high-impact improvements.
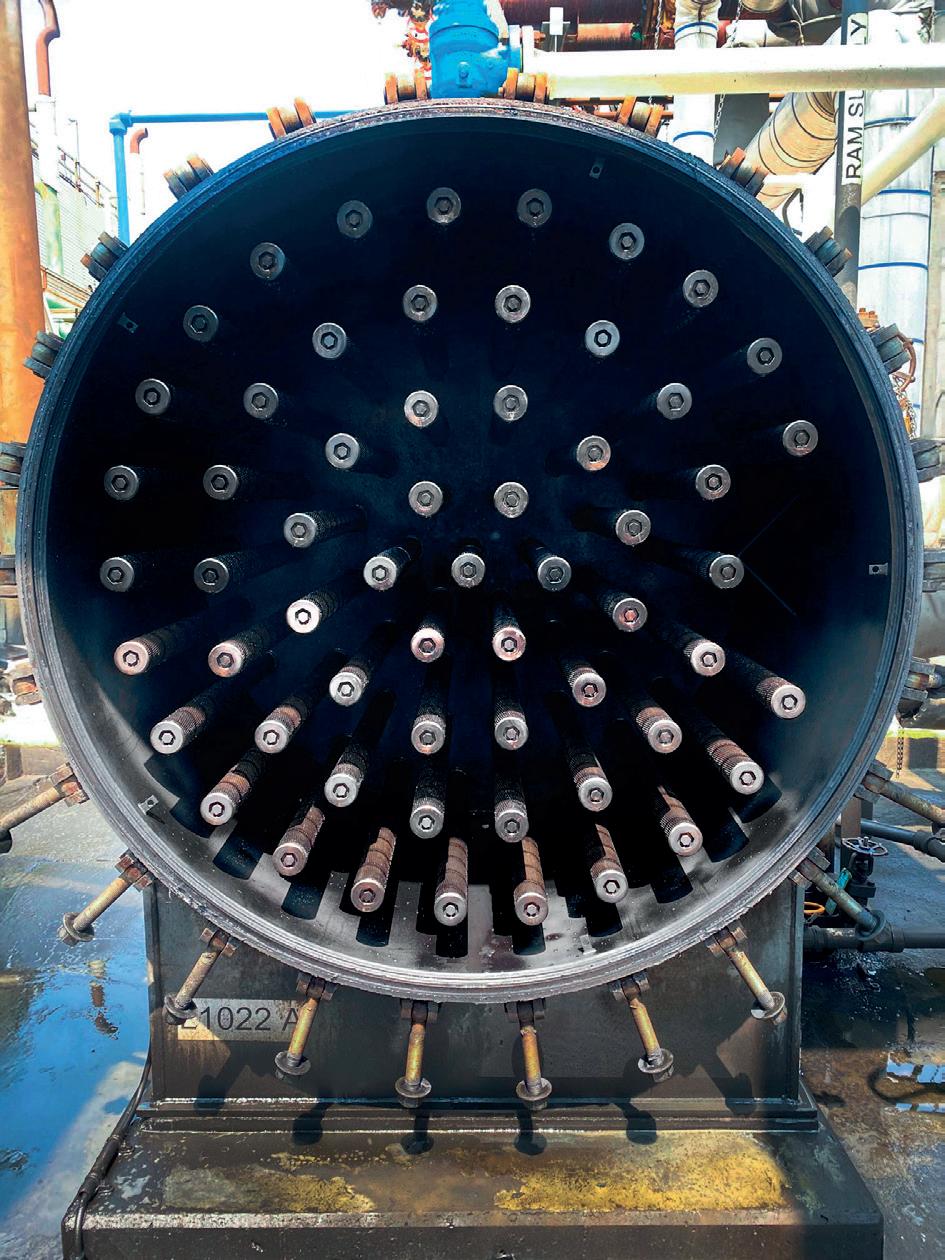
At a US refinery, the naphtha hydrotreater catalyst was not achieving full scheduled service life. The reactor was fouling and therefore reaching terminal dP prior to the scheduled replacement. This recurring issue led to costly, unplanned shutdowns and premature catalyst replacements.
Following a complete technical evaluation, the problem was traced to two root causes: an underperforming 25 µm filter and an undersized filter vessel. Although the filter was a ‘high-efficiency filter cartridge’ as described in the manufacturer’s brochure, test data showed that the element lacked adequate efficiency to protect the catalyst. Moreover, the vessel’s size limited surface area and flow distribution, allowing solids to pass through and gradually plug the reactor – a slow failure process that took about four years for the problem to arise (target life was five years).
The combination of the undersized vessel and the elements being used resulted in a higher media flux rate, which contributes to inefficient particle removal, leading to a build-up of solids in the reactor over time. Because dP in the reactor did not spike immediately, filters were never questioned. But this common assumption – that poor filtration always causes rapid dP increase – is false, as build-up can take months or even years.
Rather than recommending a costly, years-long capital project for a new vessel, FTC proposed a retrofit solution. While technically sound, the new vessel was not prioritised because OEM brochures suggested everything was within specification, masking the filtration issue, and other maintenance and upgrade projects took precedence. With the
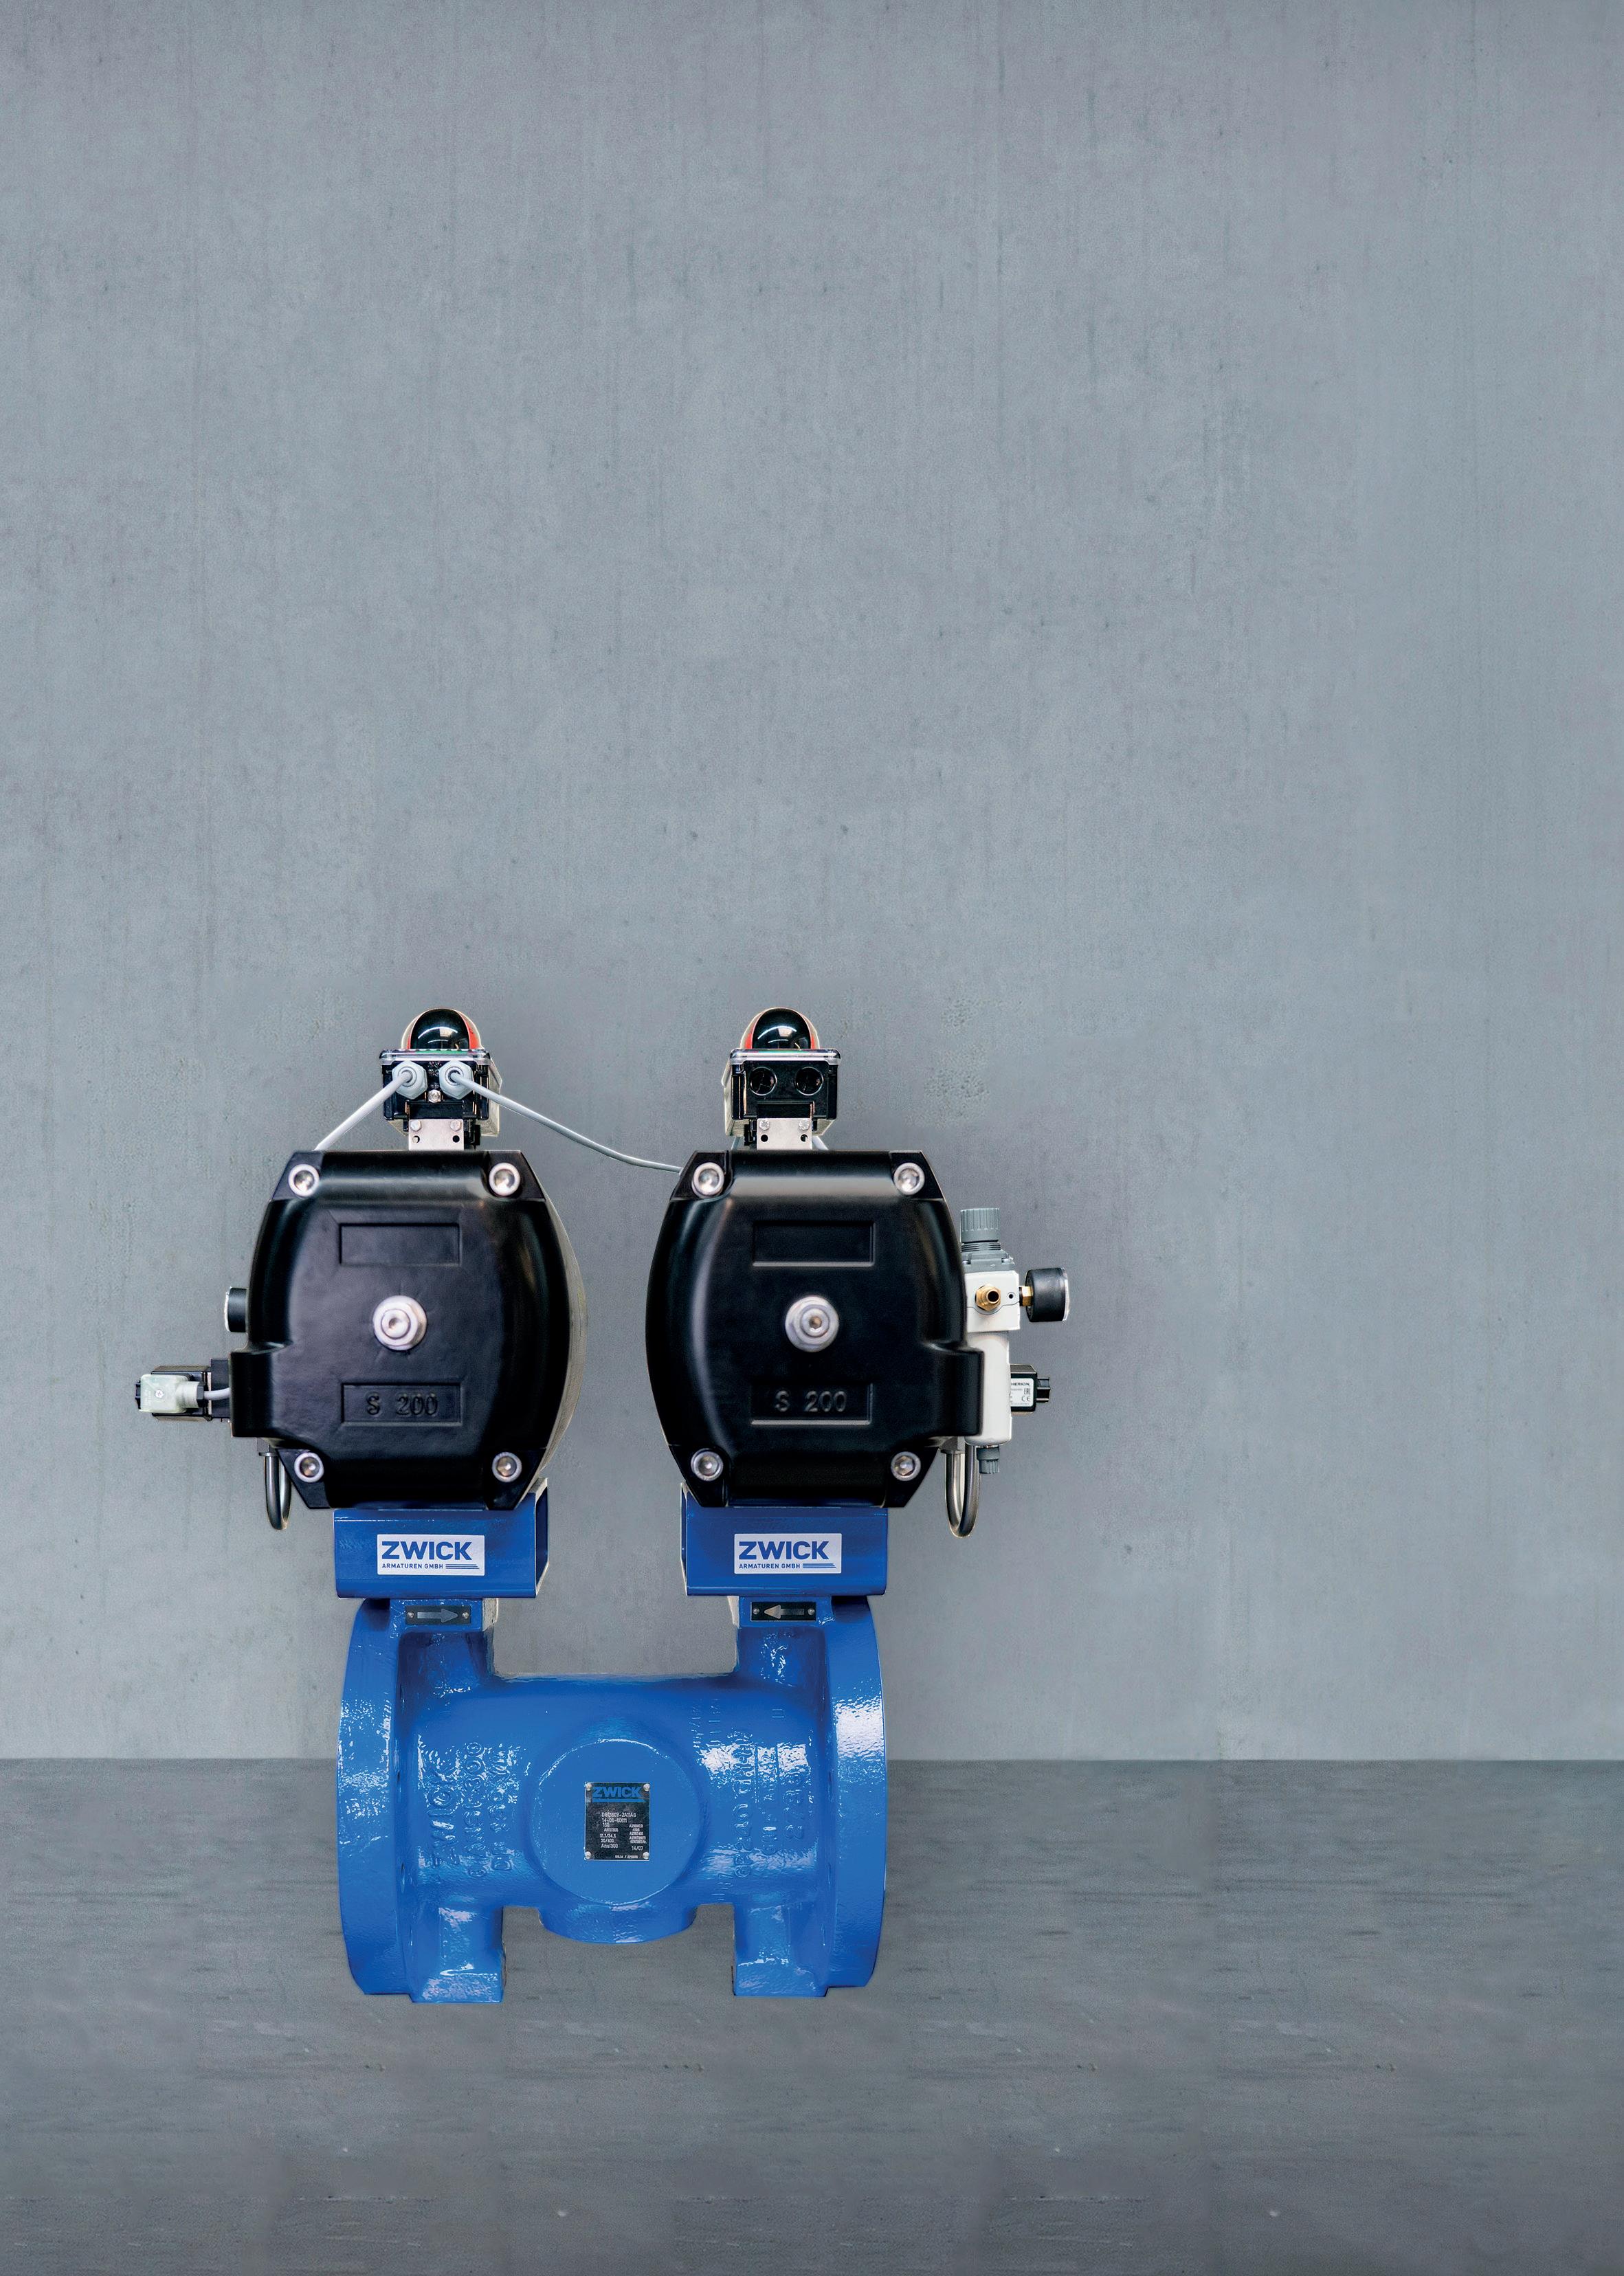
unit operating this way for years, the perceived compliance and lower urgency made funding difficult to justify.
The upgrade doubled surface area and improved filtration performance to 70 µm at 99.98% efficiency (ASTM F795-88). While it increased annual filter spend by US$18 000,
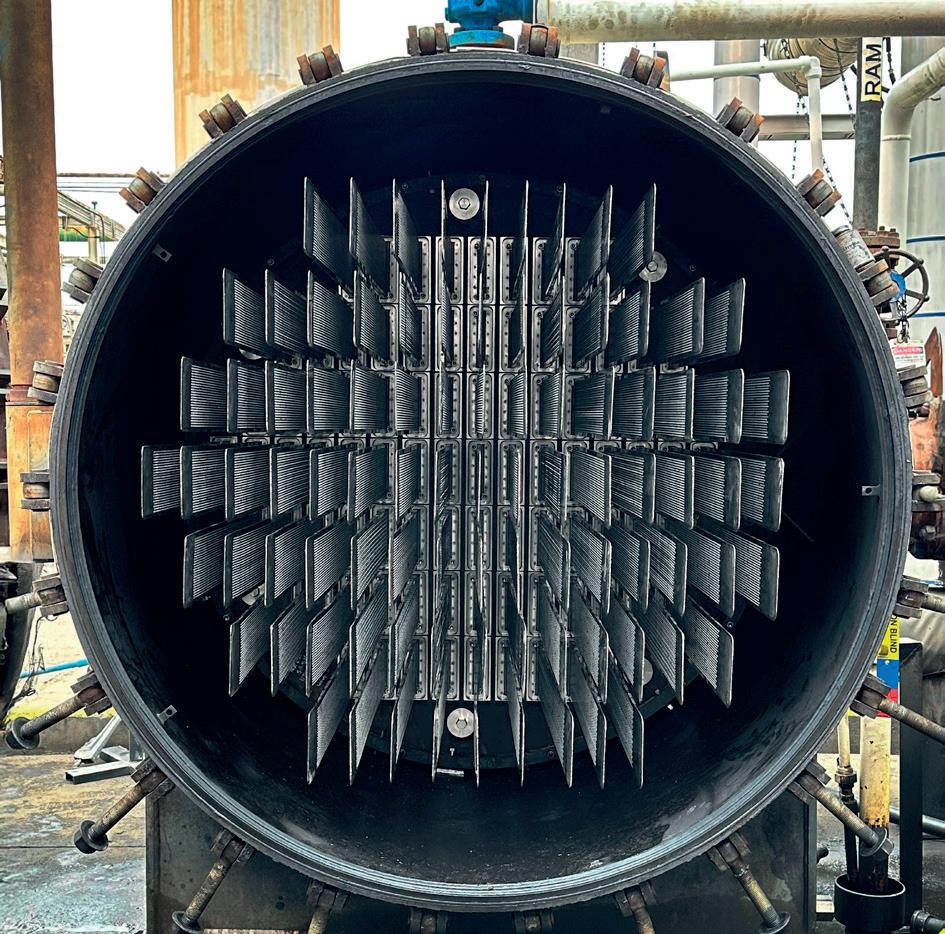
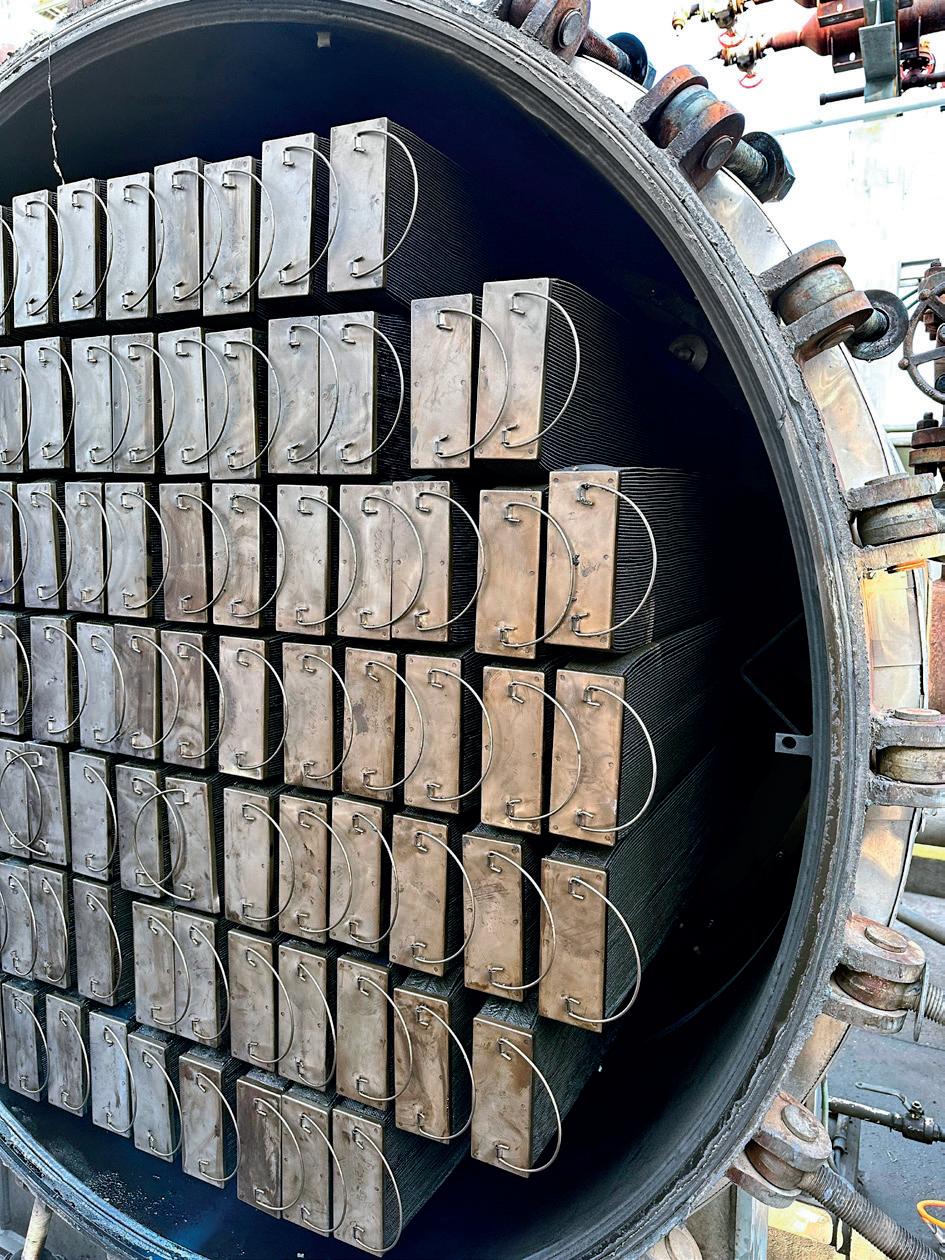
it prevented US$700 000 in premature shutdown and catalyst replacement costs.
This outcome reinforces a central truth: without a detailed baseline and evaluation, the more effective 70 µm filter –despite outperforming the 25 µm incumbent – would never have been justified. Data made the difference (see Table 1).
At another US refinery, filter usage on one of the units was among the highest operating costs across the entire refinery. The issue was compounded during periods when low-cost opportunity crudes were run. These feeds typically contain higher levels of suspended solids and contaminants, necessitating frequent filter changes and often forcing the refinery to reduce throughput to keep up with maintenance.
After completing a technical baseline evaluation, a solution was developed to improve filter service life while maintaining effluent quality. The selected upgrade increased service life by four times, while holding the same filtration performance metrics.
The impact was immediate and substantial. The average annual savings on filter spend was US$180 000. Beyond operational cost reduction, the real breakthrough was the ability to maintain full feed rates even with opportunity crudes. This increase in throughput and yield improved unit profitability significantly.
This case example highlights how filtration optimisation is not just about cutting direct filtration costs – it is about unlocking broader operational potential. By understanding the full system context and tailoring a data-driven solution, the refinery was able to move from reactive filter maintenance to a more strategic, performance-based approach (Figures 1 and 2).
‘Brochure engineering’ relies on assumptions or incomplete information. A true technical evaluation grounded in baseline data, defined goals, and validated test methods enables confident decision-making. Whether the objective is improved fluid quality, lower operating costs, or enhanced safety and compliance, the data-driven approach ensures upgrades deliver measurable value.
In both examples, long-standing operational challenges were solved not by defaulting to expensive capital projects, but by understanding system constraints, validating performance, and applying engineered solutions.
The result? Smarter spending, longer run times, and better outcomes.
The takeaway for refineries across the board is clear: before considering changing any filtration system, invest in understanding what you have and what you need. It is the only way to ensure the solution is not just new – but right.
1. WALLACE, C., and WORRELL, J. ‘Considerations When Specifying Filtration Equipment with a Focus on Amine Solvent Units’, paper presented at the 75th Annual Laurence Reid Gas Conditioning Conference, (24 - 27 February 2025).

In reactors with high-velocity gas inlets, maintaining top-bed stability is essential for operational efficiency and profitability. Austin Schneider and Tanvi Rao, Crystaphase, USA, explore how a new type of reticulated ceramic technology can provide a comprehensive solution for top-bed management in fixed-bed reactors.
Fixed-bed reactor performance in high-velocity applications depends critically on top-bed stability. When top-bed materials fail to maintain their position under operational conditions, refiners can face a cascade of problems such as bed movement, material attrition, fines generation, and ultimately, increased pressure drop that can necessitate a premature shutdown. These issues can directly impact profitability through reduced throughput, increased maintenance costs, and lost production time.
Traditional approaches to top-bed stability management have relied on conventional ceramic materials that can provide adequate hold-down but can lack the sophisticated internal structure necessary for effective filtration. This limitation has forced operators to choose between mechanical stability and fouling protection, often requiring multiple layers of different top-bed materials to achieve both objectives. Additionally, when a conventional layer is employed for mechanical stability upstream of fouling protection, it may become blocked by solid contaminants,
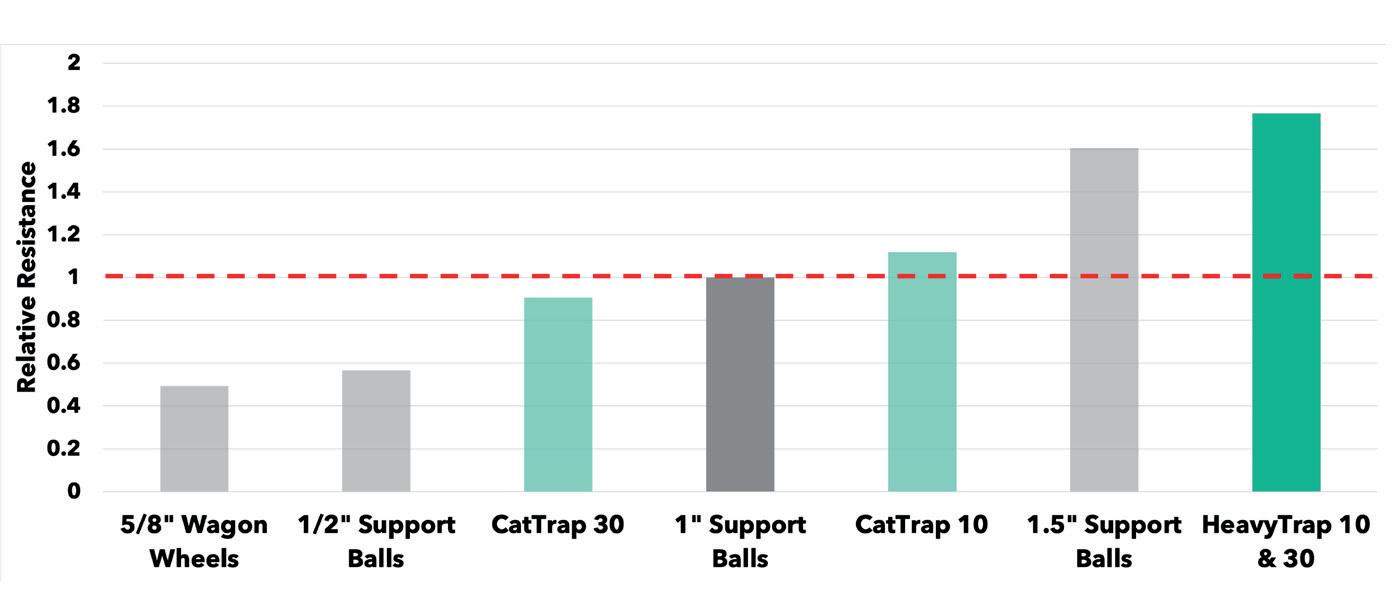
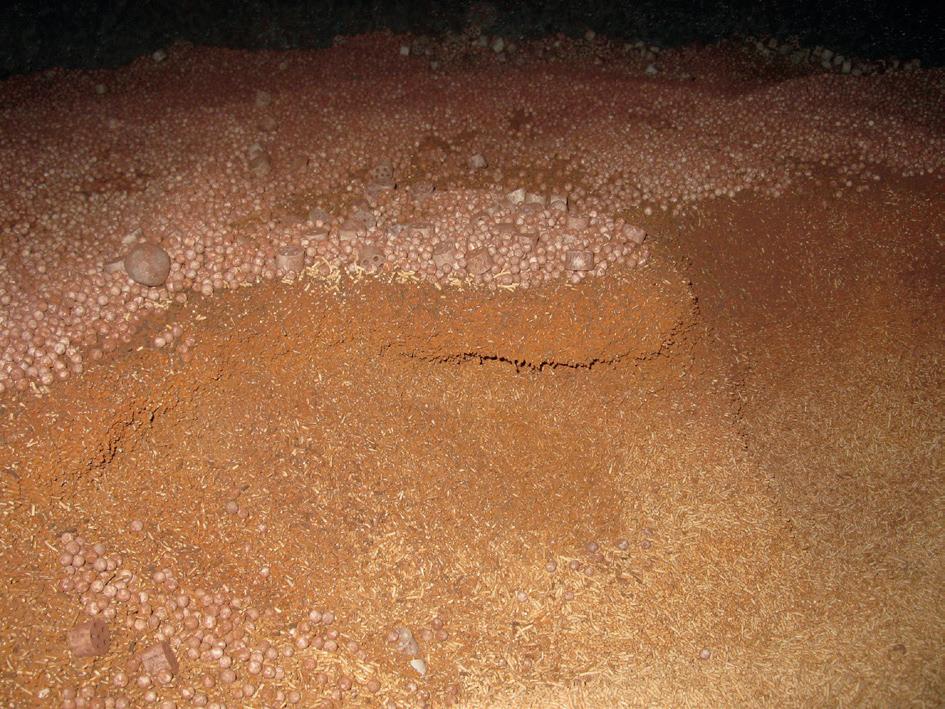
obstructing the fouling protection layers, rendering them ineffective, and squandering valuable reactor space.
This article will introduce a patented technology that can address these dual challenges of hold-down and filtration within a single material. Crystaphase’s HeavyTrap® technology is a reticulated ceramic hold-down solution that integrates robust mechanical properties with a high-void ceramic structure optimised for filtration.
Top-bed movement – the shifting of a notable percentage of the top of a packed bed in a fixed-bed reactor – can result in catalyst shift, thermal shock, or uneven flow, leading to reduced performance and premature reactor failure. Bed movement in fixed-bed reactors results from the complex interaction between fluid dynamics and material behaviour wherein high-velocity flows create lift and drag forces that often overcome the gravitational and frictional forces that hold bed materials in place.
This issue manifests in several notable, characteristic patterns observable during reactor inspections and unloading. These include:
n Coning – this occurs when vertical displacement creates a raised mound at the bed centre.
Coning typically indicates localised high-velocity zones where upward forces exceed material weight, creating a configuration that disrupts flow distribution and can lead to hot spots in the catalyst bed below.
n Dishing – presents as a central depression in the bed surface, often resulting from fines accumulation or material redistribution due to unbalanced flow patterns. Dishing creates preferential flow paths that reduce catalyst utilisation efficiency.
n Gouging – the most severe form of bed disruption, which is characterised by linear erosion channels that can penetrate through protective layers into the catalyst bed itself. Gouging can create bypass flows that dramatically reduce conversion efficiency.
The economic consequences of bed movement extend beyond immediate operational concerns. A typical high-velocity reactor experiencing bed instability may face significant operational impacts including reduced efficiency, substantial reductions in cycle length, throughput limitations, unplanned shutdowns, and premature catalyst replacement expenses.
The selection of top-bed materials requires careful consideration of multiple factors beyond simple density measurements or historical precedent. Where a common misconception in the industry equates bulk density with stability (leading to suboptimal material choices), for effective hold-down, it is the weight of individual pieces that affects stability more than overall bulk density.
Individual pieces that are heavy resist movement better than many lightweight pieces packed together. Sand illustrates this principle well; while a bed of sand has high bulk density, each tiny grain is easily swept away by high-velocity flows. Support balls, with a similar bulk density, stay in place as each piece is heavy enough to resist fluid pressures.
Beyond weight, internal structure plays a crucial role in overall performance. Traditional support balls, wagon wheels, or other hold-down materials may offer adequate weight but lack the porosity, tortuosity, and bypass required for effective filtration. The ideal top-bed material combines the necessary weight per piece with an internal structure that enables optimal filtration.
HeavyTrap technology represents a fundamental departure from conventional top-bed materials through its dual function as both a hold-down material and an

In the oil and gas industry, ensuring highest safety and plant availability is crucial, while achieving decarbonization goals has also become a critical imperative. Our comprehensive portfolio and expertise enable process improvements that increase operational reliability and move us towards net zero targets.
effective filter. The technology utilises a reticulated ceramic structure that maximises both the weight per piece and the available surface area for contaminant capture.
Key design features include: 1
n Enhanced piece weight – four times more weight per piece compared to 1 in. Si/Al ceramic support balls.
n Hold-down ability – approximately 75% greater resistance to movement compared to 1 in. Si/Al ceramic support balls.
n High total void fraction – 85% total layer void comprising 70% internal porosity and 50% external packing void.
n Optimised pore structure – interconnected channels providing high tortuosity for particle interception.
n Mechanical robustness – crush strength approximately 1400 lb per piece.
The reticulated structure of HeavyTrap technology creates a 3-D filtration network within each piece. This design enables the simultaneous achievement of mechanical stability and fouling protection.
For applications involving soluble contaminants, Crystaphase’s HeavyTrap ActiPhaseTM technology, a catalytically active variant, triggers precipitation of dissolved particulates within the reticulated structure. Applications can include metal precipitation in hydrotreating services and organic polymer containment in cracked feedstocks processing.
The combination of mechanical stability, physical filtration, and catalytic activity provides comprehensive protection against the full spectrum of fouling mechanisms and hold-down needs encountered in modern refining operations.
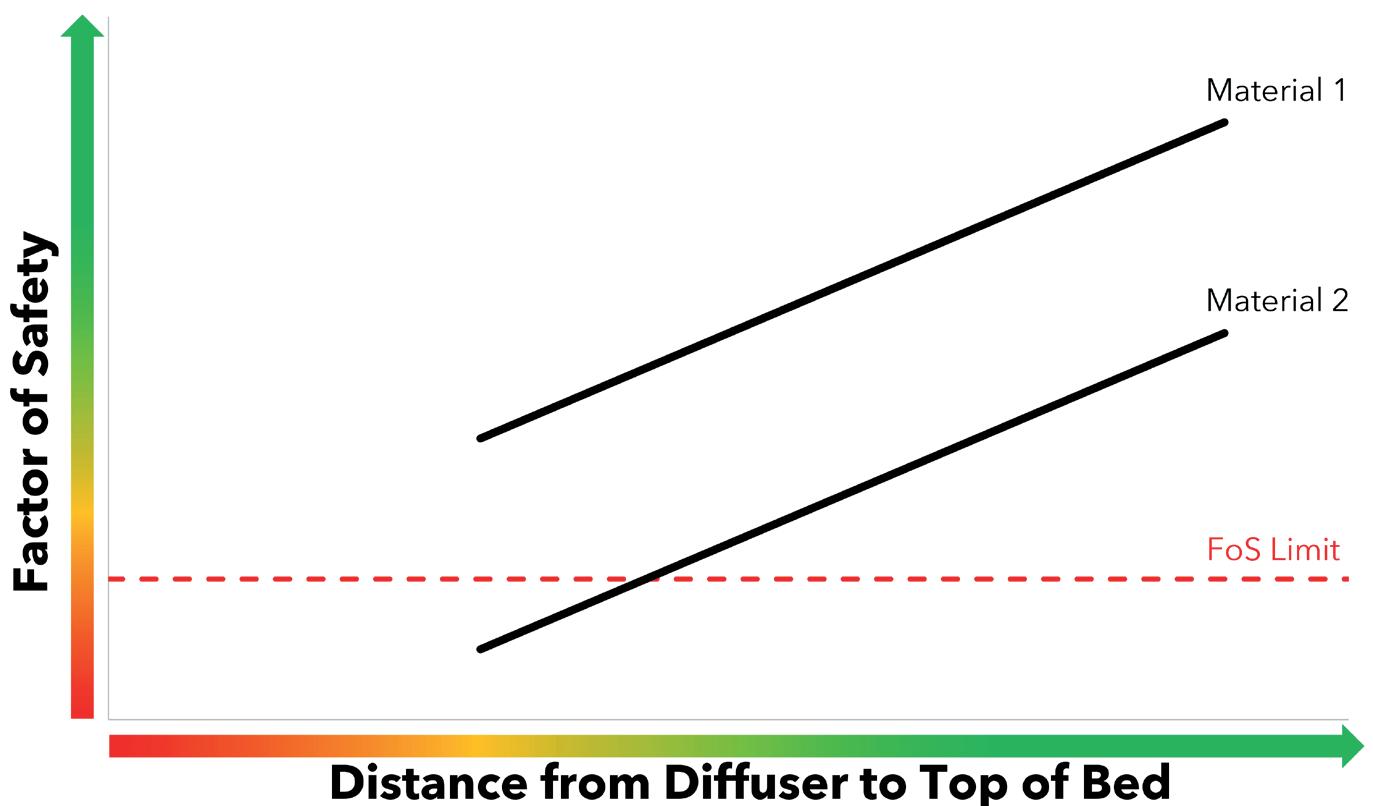
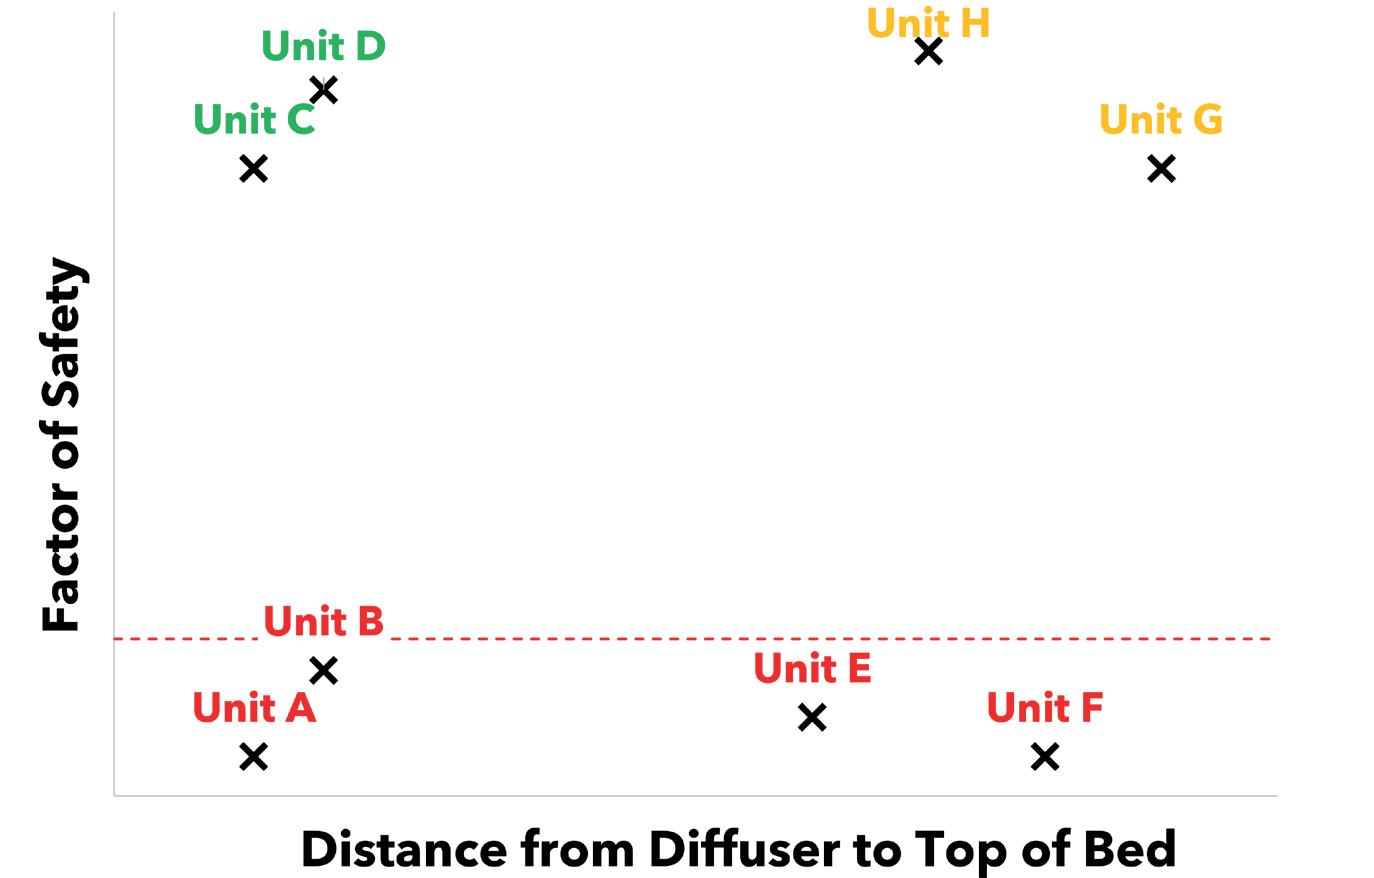
Bed movement presents a unique challenge in reactor operations; it occurs hidden from view inside sealed vessels, often revealing itself only through pressure drop trends or after shutdown inspections discover disturbed beds. By the time operational data indicates a problem, significant catalyst damage and production losses have already occurred. This reality underscores the critical importance of modelling estimates that can help anticipate bed stability issues before they manifest.
To provide loading recommendations tailored to each unit’s specific conditions, Crystaphase has developed a proprietary Hold-Down Model that estimates the risk of top-bed movement under actual and anticipated operating conditions. This computational tool calculates Factor of Safety (FoS) values –a metric developed by Crystaphase specifically for reactor top-bed applications – across a range of material types and bed heights, providing insight into how close a system may be operating to conditions that could compromise top-bed stability.
The Hold-Down Model analyses unit-specific operating conditions such as:
n Reactor geometry and internals configuration.
n Fluid properties and flow rates.
n Material properties (including shape factors and drag coefficients).
n Bed height relative to diffuser clearance.
The combined result is a matrix of FoS values that quantify the relationship between flow dynamics and material resistance. Operators can evaluate risk across different scenarios – varying bed heights, changing throughputs, and alternative top-bed material choices – to understand how each parameter actively affects stability. Rather than relying on conservative rules of thumb or historical loading practices, operators can make data-driven decisions about material selection and bed height specific to their reactors. Applied across an entire network, these seemingly small optimisations can add up to big savings.
Technical foundation: laboratory analysis and field experience
Effective top-bed design requires more than theoretical modelling; it demands a deep understanding of actual fouling mechanisms and material behaviour under real operating conditions. Crystaphase maintains a highly specialised analytical laboratory that has processed over 10 000 samples from operating units worldwide. This extensive sample analysis forms the technical foundation for loading recommendations and material selection.
The technical service team approaches each sample with scientific rigour, conducting detailed characterisation of:
n Filtration capacity and efficiency.
n Particle size distribution and morphology.
n Chemical composition of deposits and foulants.
n Material degradation and attrition mechanisms.
This analytical depth, combined with decades of field experience, enables development of loading strategies based on actual fouling patterns rather than generic assumptions. These loading strategies have been validated across thousands of reactor cycles, creating a robust knowledge base that informs every recommendation.
Design philosophy and implementation
The successful implementation of HeavyTrap technology extends beyond material selection to encompass a comprehensive approach to reactor loading. Each application begins with a thorough analysis of operating conditions, historical performance, and specific challenges facing the unit.
Key implementation considerations include:
n Feed characterisation – understanding contaminant types, concentrations, and deposition mechanisms through sample analysis and operational data review.
n Performance objectives – establishing clear goals for cycle length extension, pressure drop management, and throughput optimisation.


n Risk assessment – using the Hold-Down Model to evaluate stability under current and potential future operating scenarios.
n Economic optimisation – quantifying the value of different loading configurations through detailed cost-benefit analysis.
This methodology ensures that each loading plan reflects the unique requirements and constraints of the specific application. By combining laboratory insights, predictive modelling, and field experience, operators can achieve optimal performance while minimising risk.
A major Gulf Coast refinery sought to increase throughput in a hydrotreating unit but was limited by a history of bed movement at higher flow rates. Traditional hold-down materials had restricted operation to conservative unit throughput and limited their ability to decrease the distance from the inlet diffuser to the top of the bed.
During the first cycle with HeavyTrap technology, the refinery was able to operate at or above the maximum historical rate – where bed movement had traditionally been observed – for 55% of the cycle. Post-cycle inspection revealed no evidence of significant bed movement, validating the enhanced stability provided by HeavyTrap.
Building on this success, the second installation of the technology moved the top-bed loading 9 in. higher in the reactor, creating space for an additional silicon-trapping catalyst while maintaining bed stability. At current rates, and assuming a similar cycle length, cumulative barrels processed during this cycle are expected to increase by 8% as compared to the most recent cycle without HeavyTrap technology (Figure 5). With a conservative
uplift value per barrel, this could result in millions of dollars in additional annual profit.
Crystaphase collaborated with a major refining company, proactively applying the Hold-Down Model across the majority of its naphtha hydrotreating (NHT) network, and identified several key opportunities for optimisation. The systematic analysis revealed potential for significant space savings and performance improvements across multiple units. Implementation of HeavyTrap technology across the network enabled increased filtration capacity and additional catalyst volume tailored to each unit’s specific needs.
The network-wide approach demonstrated how systematic application of hold-down modelling and optimised materials can deliver cumulative benefits across entire refinery systems, not only individual reactors. By treating top-bed design as pathways toward optimisation rather than a fixed constraint, the refiner achieved meaningful, data-driven, quantifiable improvements in reactor utilisation.
HeavyTrap technology represents an advancement in top-bed design for reactors with high-velocity gas inlets. For operators facing top-bed challenges or seeking to optimise reactor performance, the technology offers a proven solution backed by rigorous analysis and extensive field validation. Crystaphase combines innovative materials design with quantitative modelling tools to transform traditionally problematic aspects of reactor operation into opportunities for performance enhancement.
As refining margins continue to tighten and feedstock quality challenges intensify, technologies such as HeavyTrap – which deliver measurable performance improvements backed by actionable data – will become increasingly critical for maintaining competitive operations.
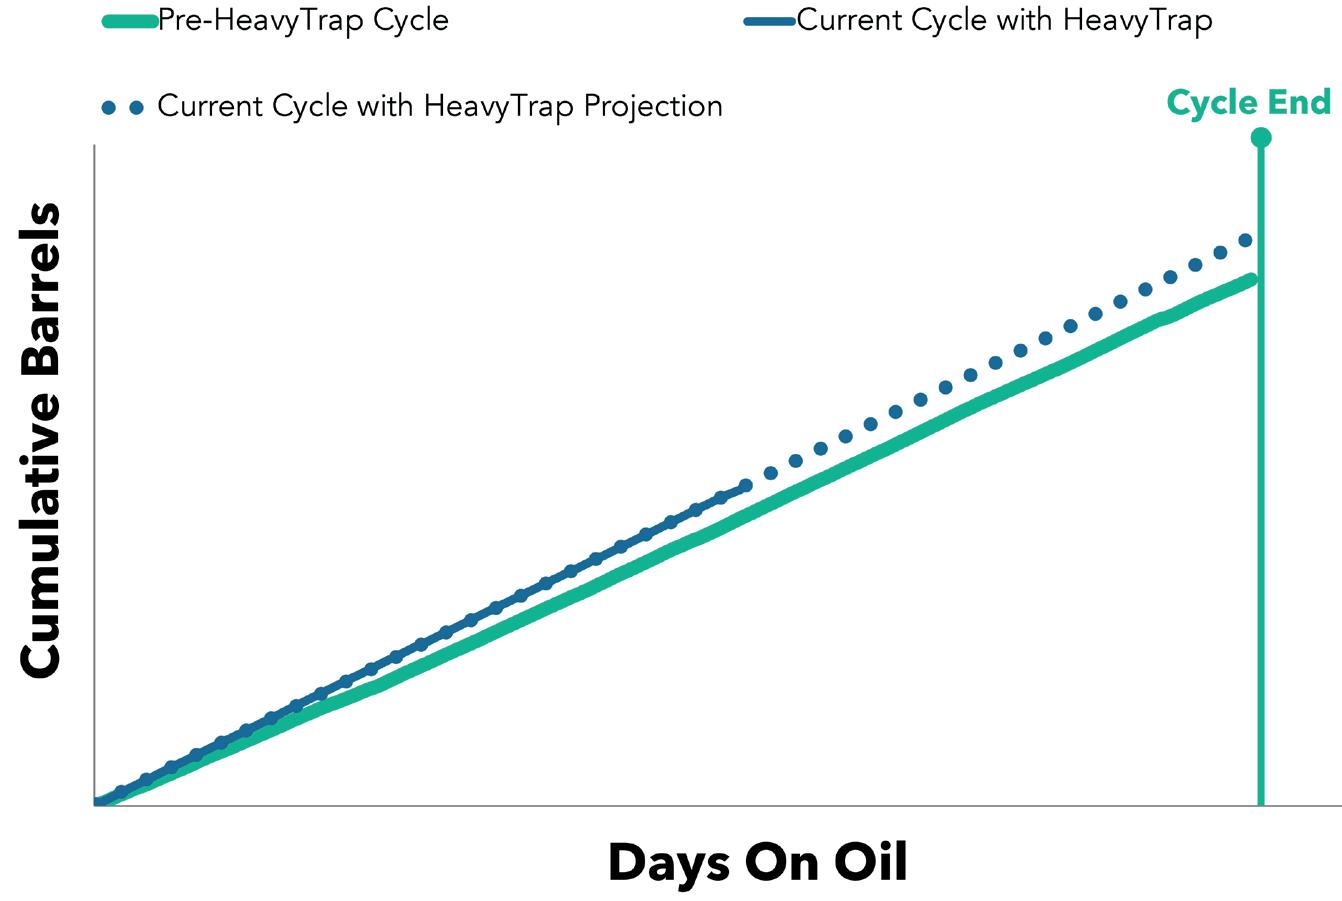
1. Based on internal Crystaphase hold-down testing using support balls of average weights.
2. The Crystaphase Hold-Down Model relies on information provided by refinery sites as well as assumptions relating to diffuser design and the density of the top-bed materials. Changes to these inputs will change the results. The model calculates risk of bed movement and does not predict whether actual bed movement will occur. Actual bed movement depends on a variety of operational factors that Crystaphase cannot control and Crystaphase cannot guarantee no bed movement will occur.
3. A higher FoS indicates less risk of bed movement, while a lower FoS indicates more risk of bed movement. The FoS limit provides a threshold below which the risk of bed movement is likely higher than preferred, but is not a guarantee that no bed movement will occur above that limit. Figure 3 is provided for illustrative purposes only and does not refer to any specific material or operating conditions.
Henrik Rasmussen and Xavier E. Ruiz Maldonado, Topsoe, describe how new third generation catalysts for coker naphtha can improve performance.

Organic silicon compounds are widely recognised as critical contaminants in refining, particularly due to their detrimental impact on catalytic processes such as hydroprocessing, catalytic reforming, and isomerisation. Among these, hydroprocessing units face significant challenges when treating coker-derived feedstocks, especially coker naphtha, due to the elevated and variable silicon content.
The silicon concentration largely depends on the decomposition behaviour of anti-foaming agents, primarily polydimethylsiloxane (PDMS), within the coker unit and its subsequent partitioning into the various product fractions that feed into the hydrotreater. PDMS consists of six and eight-membered cyclic siloxane
structures (Table 1) and is extensively used as an anti-foaming additive in delayed cokers, visbreaking units, pyrolysis, and distillation operations.
Under high-temperature conditions, PDMS thermally degrades into smaller cyclic siloxane fragments of varying molecular sizes. These fragments tend to adsorb onto catalyst surfaces, leading to active site blockage and a consequential decline in catalytic performance.
In delayed cokers, PDMS thermally cracks into smaller cyclic siloxane fragments, typically ranging from 7 - 12 Å depending on boiling point. Each ‘D’ unit is representing a (CH3)2SiO group, which is about 1.64 Å and serves as a building block for siloxane molecules. Expressing molecular size in ‘D’ units helps predict diffusion, adsorption, and catalyst interactions. This sizing is
essential for designing catalysts with pore structures optimised to trap siloxane fragments effectively.
Inorganic silicon in refinery feedstocks largely stems from fluid catalytic cracking (FCC) catalyst fines and mineral clays naturally occurring in crude oils. FCC fines are especially troublesome due to their fine particle size, which hinders complete removal during upstream processing. Moreover, crudes derived from oil sands frequently contain silicon-laden sand particles, further complicating feedstock purification. Additional suspended solids may form through contaminant degradation or agglomeration during storage and transportation. The build-up of these inorganic particulates within reactor beds contributes to elevated pressure drop in hydrotreating units.
A summary of organic and inorganic silica sources can be found in Table 2.
Characterising the origins and behaviour of organic vs inorganic silicon is key to optimising reactor loading approaches.
Designing effective silicon guard layers for naphtha units requires a clear understanding of silicon contaminant sources to avoid under or over-engineering. Accurate estimation of the average silicon concentration in the feed is essential for proper sizing.
Analytical methods play a vital role in differentiating between organic and inorganic silicon. GC-AED selectively
Table 1. Siloxane typical properties2
Siloxane type D-size Boiling point
detects organic silicon with a sensitivity of ~0.1 wt ppm, while ICP-MS and ICP-OES measure total silicon. The inorganic fraction can be estimated by subtracting the GC-AED value from the total.
This distinction is important because organic silicon, mainly from additives like PDMS, breaks down into cyclic siloxanes that deposit on catalyst surfaces. In contrast, inorganic silicon originates from mineral sources in crude and contributes to solid fouling. The silicon guard must be designed to handle both types to ensure reliable operation.
In conclusion, combining GC-AED, ICP-MS, and ICP-OES enables accurate silicon quantification and supports the development of optimised guard solutions that improve catalyst protection, extend run length, and enhance unit performance.
The mechanism for silicon poisoning of hydrotreating catalysts is generally accepted to be the reaction of PDMS with the surface acidic hydroxyl (OH) groups of the alumina present in the carrier of hydrotreating catalysts. The irreversible formation of a Si-O bond instead of a Si-C bond is the driving force.1
To better manage silicon poisoning, companies should utilise a tailor-made guard to trap the maximum amount of silicon. As the refiners are limited by the volume of the reactor, a maximum surface area per reactor volume is desired, i.e. the grading is aimed at having the highest possible accessible surface area per volume.
Hexamethylcyclotrisiloxane D3 SILOXANE 273˚F (133˚C) typically in light naphtha
Octamethylcyclotrisiloxane
Decamethylcyclopentasiloxane
(176˚C) typically in heavy naphtha
403˚F (206˚C) heavy naphtha to middle distillate fraction
Antifoaming agents, e.g., PDMS Frequently used in delayed cokers, vis-breaking units, pyrolysis, and distillation processes Catalyst fines from FCC units
Flow improvers, drilling fluids additives
Emulsion breakers (silicone-based demulsifiers)
surfactant, lubricant
Utilised primarily in desalting units or crude stabilisation processes, especially for heavy oils
Naturally in crude oils, especially heavy or extra-heavy crude (Canada, Venezuela, broken clay filters)
Oil sands Silicon-rich sand particles in crude feedstocks
General suspended solids
Particulates present due to degradation or agglomeration of contaminants during storage and pipeline transport
Topsoe conducted a direct comparative evaluation of two catalyst support formulations to investigate the effect of support composition on silicon uptake. One support was made of high-purity alumina, while the other consisted of alumina modified with silicon dioxide (SiO2). Both supports were tested in a side-by-side reactor configuration under identical operating conditions using a silicon-rich feedstock to ensure comparable exposure.
The spent catalysts were analysed using X-ray fluorescence (XRF) and BET surface area analysis to assess silicon uptake and surface area changes. Results showed that although the composite support (Al2O3 + SiO2) exhibited a 6% higher total surface area, it delivered approximately 30% lower silicon uptake per unit volume compared to the pure alumina support.
This discrepancy is attributed to the inert nature of SiO2 in
silicon capture. While alumina’s intrinsic porosity and surface chemistry, especially its OH groups, are active in retaining silicon species, SiO2 merely inflates the surface area measurement without contributing to actual uptake. Thus, relying on nominal BET surface area values can be misleading when evaluating a material’s functional performance in high-silicon environments.
It is therefore critical to formulate catalyst carriers such that the reported surface area reflects only the active contribution from alumina, excluding any inert surface area introduced by additives like SiO2. This principle is demonstrated in Table 3, highlighting the importance of aligning material design with functional performance metrics in silicon-sensitive applications.
Topsoe’s formulations contain no silicon in the catalyst carrier, meaning that any silicon detected in the spent catalyst originates solely from the feed. In contrast, other commercially available catalysts may include silicon as part of the support structure, requiring correction or normalisation during spent catalyst analysis to accurately assess silicon uptake from the feed.
Topsoe’s TK-400 series SiliconTrapTM catalysts have been in the coker naphtha market for over 25 years. In 2016, the original TK-43x series was upgraded to the TK-44x SiliconTrap line, featuring an enhanced alumina formulation with increased surface area and improved physical properties. These advancements significantly boosted the catalyst’s ability to capture silicon, reinforcing its performance in high silicon containing feedstock.
In late 2024, the new TK-461 SiliconTrap and TK-467 SiliconTrap catalysts were launched with a further increased surface area per volume by applying Topsoe’s HyBRIMTM technology.
The selection of the optimal SiliconTrap catalyst should be based on the type of siloxane size present in the coker naphtha stream as show in Table 4.
Examples of the distribution of ‘D’ siloxanes molecules in light and heavy coker naphtha detected by atomic emission detection (AED) are also displayed.
Enhanced surface roughness plays a pivotal role in improving metal dispersion by introducing more anchoring sites, resulting in a highly uniform distribution of active phases. This uniformity enhances catalytic activity in hydrodesulfurisation (HDS) and hydrodenitrogenation (HDN) reactions and improves reaction kinetics by increasing the effective contact between feed molecules and active sites.
The increased surface roughness also contributes to greater silicon uptake per reactor volume, as it provides more accessible sites for silicon adsorption. This improved capture efficiency helps maintain catalyst activity over longer cycle lengths, reducing operational interruptions and associated costs.
In essence, the engineered increase in surface area and roughness delivers dual functionality: enhanced catalyst activity and superior silicon retention. This combination is key to achieving improved unit performance,
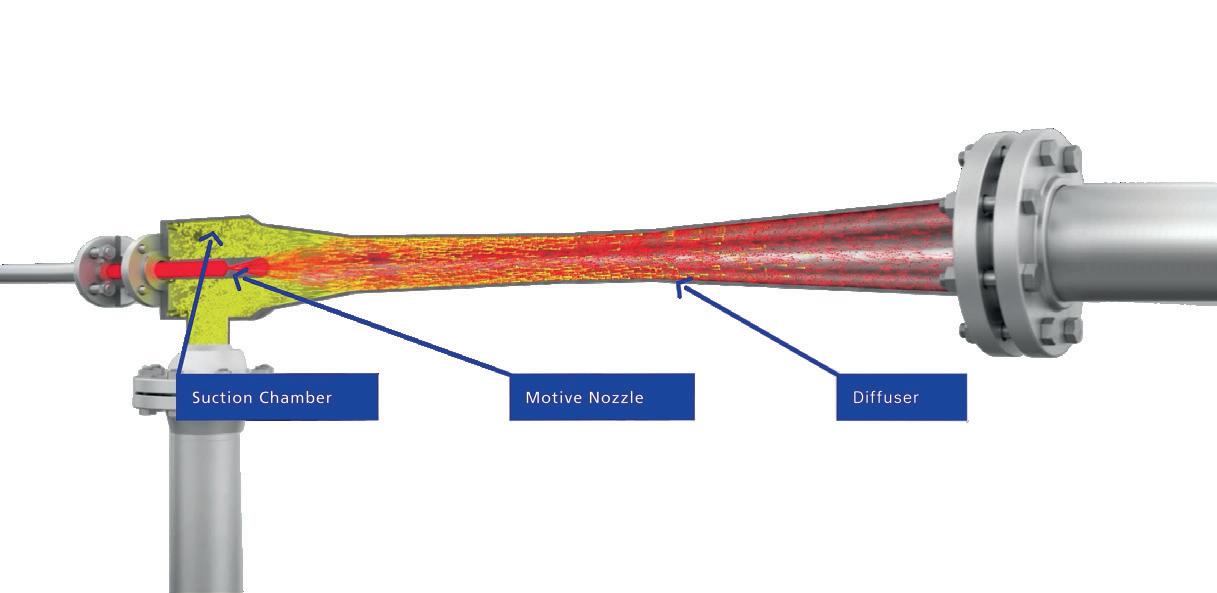
GEA ejectors are the proven technology for all your mixing, heating, compressing or material transport needs.
•Reliable & durable.
•Long-term profitability with sustainable OPEX optimization.
•Wide range of materials available, even in corrosive environment.
•High-quality manufacture in line with current worldwide design codes.

Watch our video: Ejectors Working Principle
2
Table 3. Effect of silicon
Table 4. Silicon sizes and typical distribution in naphtha fractions
Siloxane
Optimal catalysts selection TK-461/467 SiliconTrap TK-461/467 SiliconTrap TK-453 SiliconTrap
The results, listed in Figure 2, show that the advanced formulation of TK-46x SiliconTrap products provides notable enhancements in both HDS and HDN activities. The HDN performance improved by 8 - 13%, while the HDS activity increased by approximately 5 - 7% when compared to the prior generation products.
The technical value proposition of these enhancements lies in the strategic flexibility they offer. With the improved catalytic activity, refineries can now redesign the catalyst loading more efficiently by either maximising bulk catalyst loading to process more barrels or processing feeds with higher silicon concentrations. Higher silicon capacity together with higher catalyst activity will increase the profitability of any coker naphtha unit.
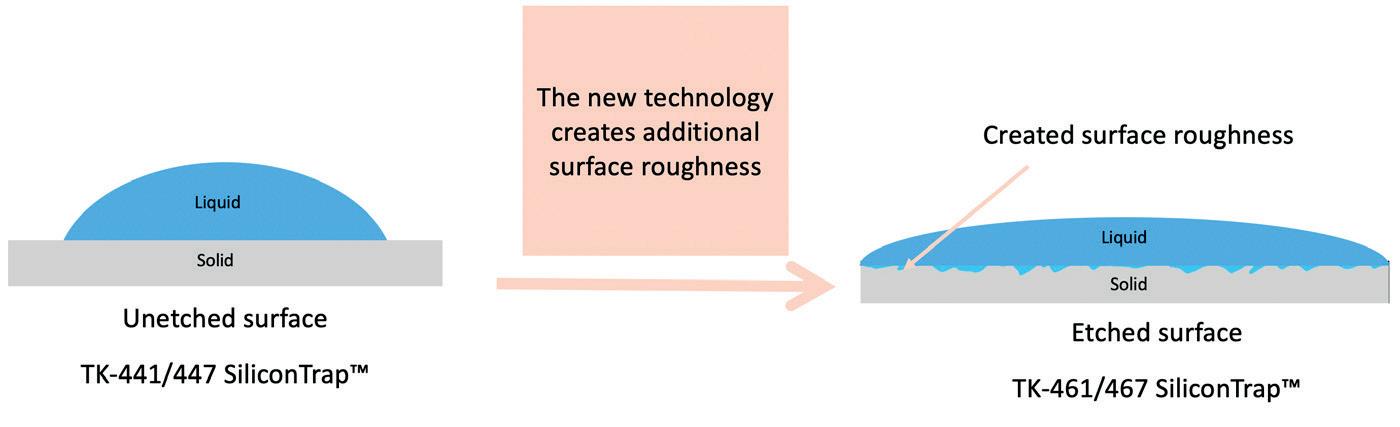
1. New technology developed by Topsoe to enhance alumnia roughness.
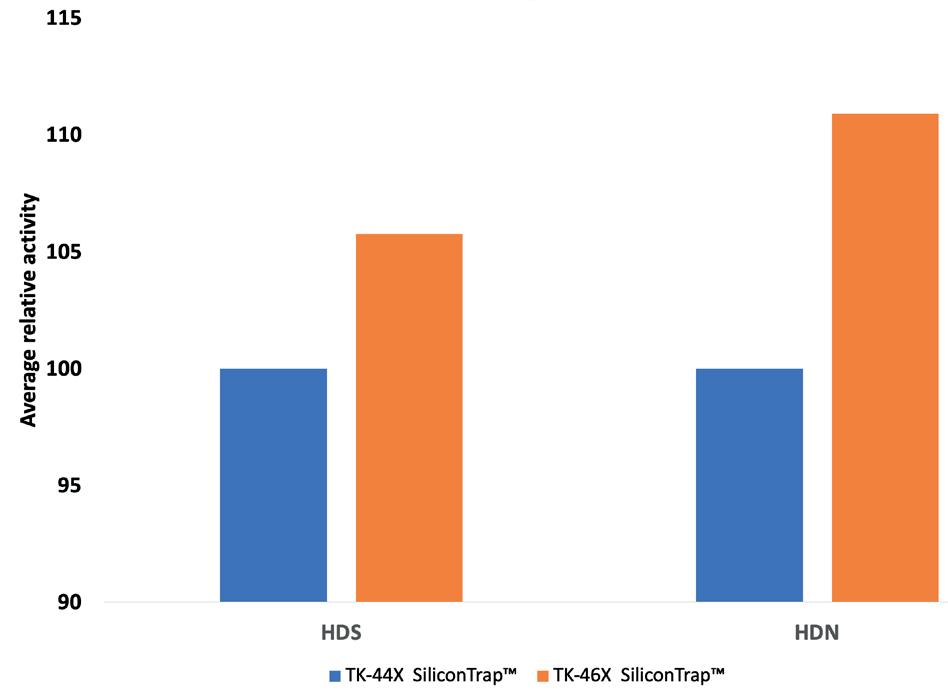
Figure 2. Average HDS and HDN activity in TK-46Xs SiliconTrap.
higher reliability, and extended catalyst life in silicon-laden feed environments.
This effect is clearly demonstrated in Figure 1: the left image shows the earlier TK-44x SiliconTrap with a non-etched surface, while the right highlights the new TK-46x SiliconTrap, featuring an intentionally etched surface designed to maximise performance.
The new formulation provides an enhanced surface area, resulting in a significant increase in the silicon pick-up per volume.
In addition to the demonstration of the enhanced silicon pick up via canister installations, comprehensive pilot testing was conducted at Topsoe’s R&D facilities to evaluate the hydrotreating performance of the TK-46x SiliconTrap products relative to the prior generation products.
Topsoe’s TK-44x SiliconTrap generation has been installed in over 50% of coker naphtha units worldwide.
The improved silicon uptake and enhanced catalytic activity directly contribute to longer cycle lengths. For instance, with the new catalyst generation, a typical 24-month cycle can be extended by an additional three to five months. At a processing rate of 20 000 bpd, this translates to approximately 1.8 - 3 million bbl of additional throughput. The added production volume alone can offset the full catalyst cost multiple times over, delivering substantial economic value alongside operational benefits in the reforming and isomerisation units.
Silicon contamination remains a persistent challenge in refining, particularly for coker naphtha processing. Topsoe’s SiliconTrap technology offers a robust solution through an optimised alumina-based guard catalyst, engineered for maximum silicon capture while maintaining high HDS and HDN activity.
The transition to the next-generation TK-461 and TK-467 SiliconTrap catalysts represents an advancement in catalyst design. With enhanced silicon uptake and excellent catalytic performance, these formulations enable longer cycle lengths, lower operating costs, and improved unit profitability. They also help safeguard the performance of downstream units such as reforming and isomerisation.
This new generation delivers both protection and performance in high-silicon environments.
1. KELLERBERG, L., ZEUTHEN, P., and JACOBSEN, H.J., Journal of Catalysts, Vol. 143, No. 1, p. 45 - 51 (1993).
2. RUIZ, X. and FREDERIK C. W., Catalyst PTQ (2025).
• TOPSOE, H. and TOPSOE, N., Journal of Catalyst, Vol. 84, p. 386 (1983).
• TOPSOE, H. and TOPSOE, N., Journal of Catalyst, Vol. 139, p. 631 - 640 (1993).
• BREIVIK, R. and EGEBJERG. R., Catalyst PTQ Q1 (2008).
• RASMUSSEN, H. and SCHMIDT, M., Catalysts PTQ (2016).

Marlene Führer, Daria Otyuskaya, Maria de la O Masa Lorenzo, Rodrigo Duarte Oliveira Silva, Francisco Maroto de la Puente, and Tiago Vilela, Avantium R&D
Solutions, provide the results of a comparative study testing commercial acetylene hydrogenation catalysts, which highlights the importance of catalyst selection in line with plant requirements.
Selective acetylene hydrogenation is a critical process in the petrochemical industry, primarily used to purify ethylene streams by removing trace amounts of acetylene. Acetylene is a highly unsaturated compound that can poison downstream polymerisation catalysts and degrade the quality of polyethylene. Therefore, it is essential to reduce the acetylene content in polymer-grade ethylene to acceptable levels (typically below 5 ppm) through selective hydrogenation.
Acetylene conversion units (ACUs) are essential for purifying polymer-grade ethylene in steam cracker plants. These units come in various designs depending on where the acetylene hydrogenation reactor is situated. The two primary configurations are generally referred to as front-end and tail-end (or back-end).1 Regardless of their placement, the common goal is to selectively hydrogenate acetylene.
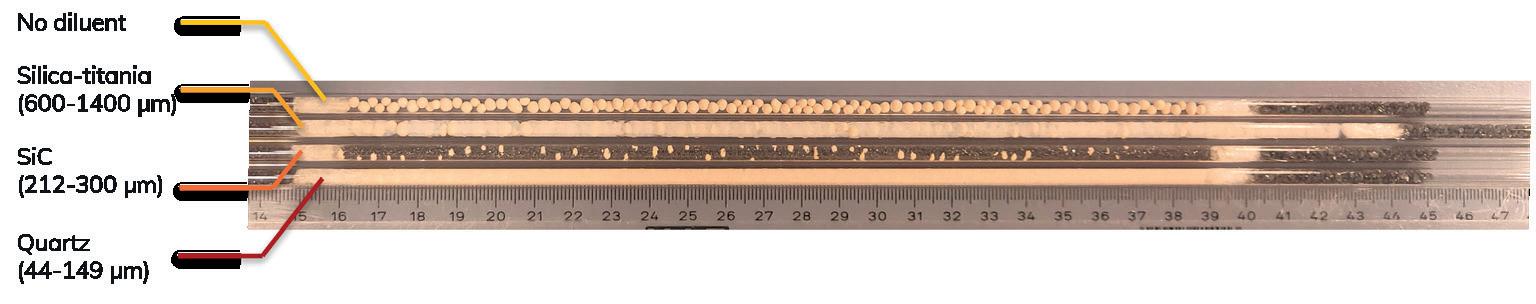
1. Image of a filled single-pellet-string quartz reactor to visualise the reactor loading of the spherical shaped catalysts.
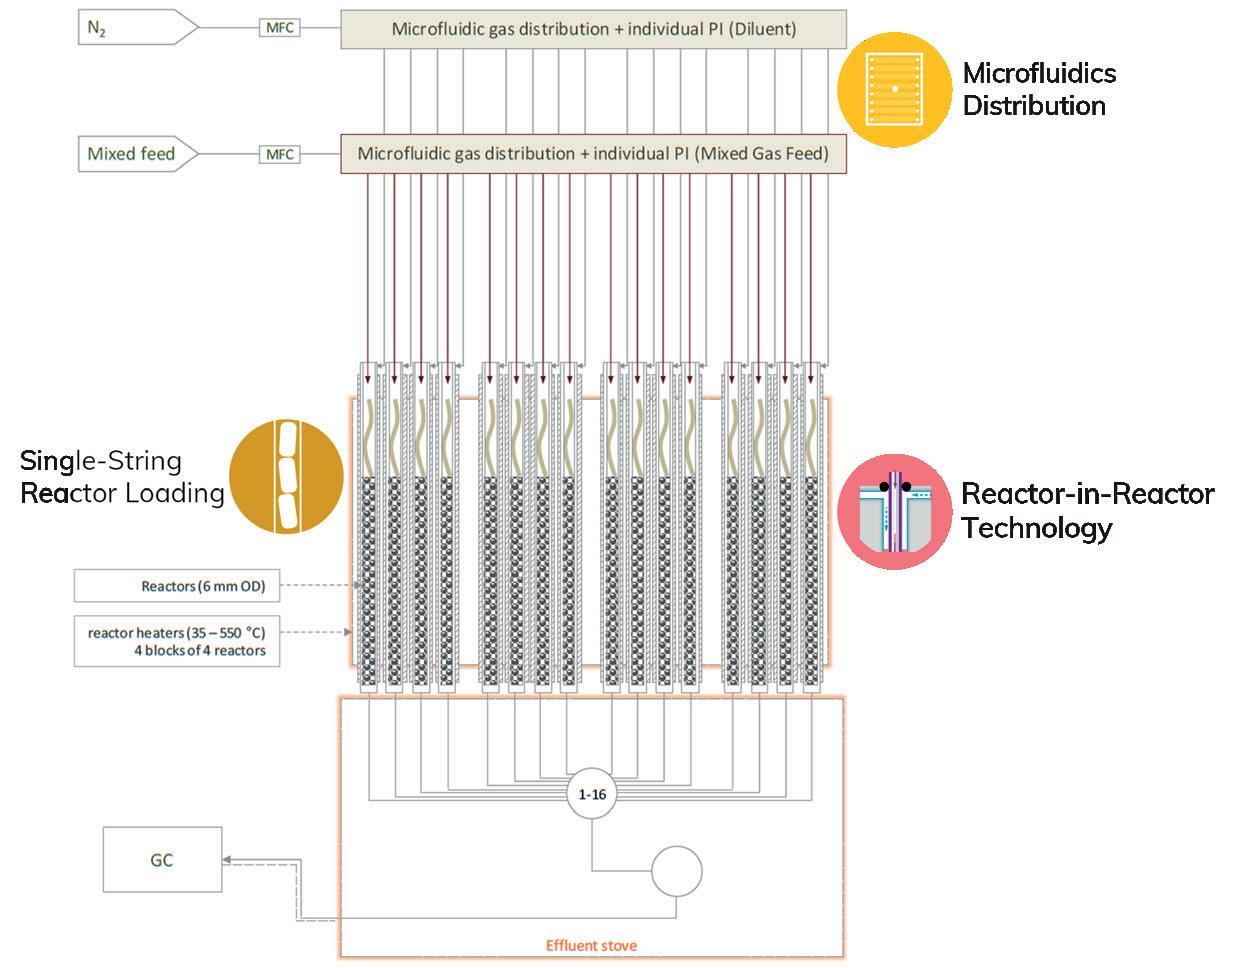
2. Schematic of the 16 reators Flowrence unit, configured to evaluate the performance of acetylene hydrogenation catalysts.
Acetylene hydrogenation in fixed bed catalytic reactors is widely used in refining processes. Fixed bed reactors allow selective hydrogenation of acetylene to ethylene without over-hydrogenation to ethane. However, ethylene can also hydrogenate to ethane, reducing selectivity. Additionally, heavy hydrocarbons can also be formed from liquid and solid parts known as ‘green oil’ that contribute to catalyst deactivation.2
Multiple suppliers provide acetylene hydrogenation catalysts with different performance characteristics and cost benefits. Each catalyst offers distinct advantages in terms of performance and cost, suitable for different applications and process requirements. When selecting a supplier for acetylene hydrogenation catalysts, it is important to consider multiple factors to ensure optimal performance, cost-effectiveness, and reliability.
A study of an 800 000 tpy plant showed that a differential in catalyst selectivity of 75% over its lifetime will result in an additional 48 million lb/yr (21 800 tpy) of ethylene – or over 2.7% of the plant’s ethylene capacity.3
Catalysts for front-end hydrogenation have been evolving over several decades. Repsol notes significant improvements in catalyst generations, including more stable operations, reduced runaway risk, and cycles lasting over 5 - 6 years without major activity loss, with some catalysts operating for over 10 years without regeneration. Those catalysts are more expensive than the older generations, so it is important to justify their
selection with an economic model that ensures gains in the produced ethylene and minimises ethylene losses (ethane production). The relationship between activity and selectivity is crucial for making an informed decision, and one of the best tools to evaluate these aspects is a supported palladium-based catalyst.
ACUs play a critical role in steam cracker plants, where significant financial investments are tied to their proper operation and the selection of appropriate catalysts. Choosing the optimal catalyst requires comparative testing of multiple catalysts to select the most suitable catalyst.
Avantium offers high throughput testing with 16 parallel reactors for evaluating acetylene hydrogenation catalysts. This article provides the results of a comparative study for Repsol of various catalyst suppliers.
Avantium tested seven catalysts from five different suppliers under industrial front-end conditions for Repsol. The goal was to assess the catalysts’ performance at three different CO levels in the feed: 400 ppm, 1000 ppm and 1400 ppm.
All the catalyst samples were sent anonymised to Avantium to maintain supplier anonymity. The catalysts in this article are labelled CAT 1 to CAT 7. Avantium’s Flowrence® technology uses pellets that automatically align as a string of beads in the reactor, avoiding maldistribution of gas over the catalyst bed.4 This eliminates catalyst-bed channelling and incomplete catalyst wetting. The eight catalyst beads were loaded in the reactors, each having an internal diameter of 5.0 mm and a length of 561 mm. An inert diluent is introduced over the full length of the tube after the catalyst pellets are loaded, resulting in embedded beads. Figure 1 shows a picture of four filled (quartz) reactors, visualising the catalyst loading. In the top reactor, only catalyst beads were filled (with no diluent). The other three reactors show different diluent options: silica titania, SiC, and quartz. During these experiments, the SiC diluent of 212 - 300 µm was chosen. Additionally, a SiC diluent (1.0 - 1.4 mm) is added on the bottom and top of the reactor to make sure that the catalysts bed is within the isothermal zone (30 cm in the middle of the reactors). For a more detailed understanding of the theory supporting the use of single-pellet-string reactors, this article refers to the publications by Ortega et al4 and Moonen et al.5
This comparative test was carried out in a high throughput unit with 16 parallel stainless steel reactors. The reaction zone is split
Gulftronic® Electrostatic Separators are significantly more efficient at reducing ash in support of decarbonization when compared to mechanical filtration systems. Greater efficiency means maximum per barrel returns from FCC/ RFCC and hydrocracking, with lower operating costs. The result is a higher yield and a better return from the bottom of the barrel.
gulftronic.info@ga.com
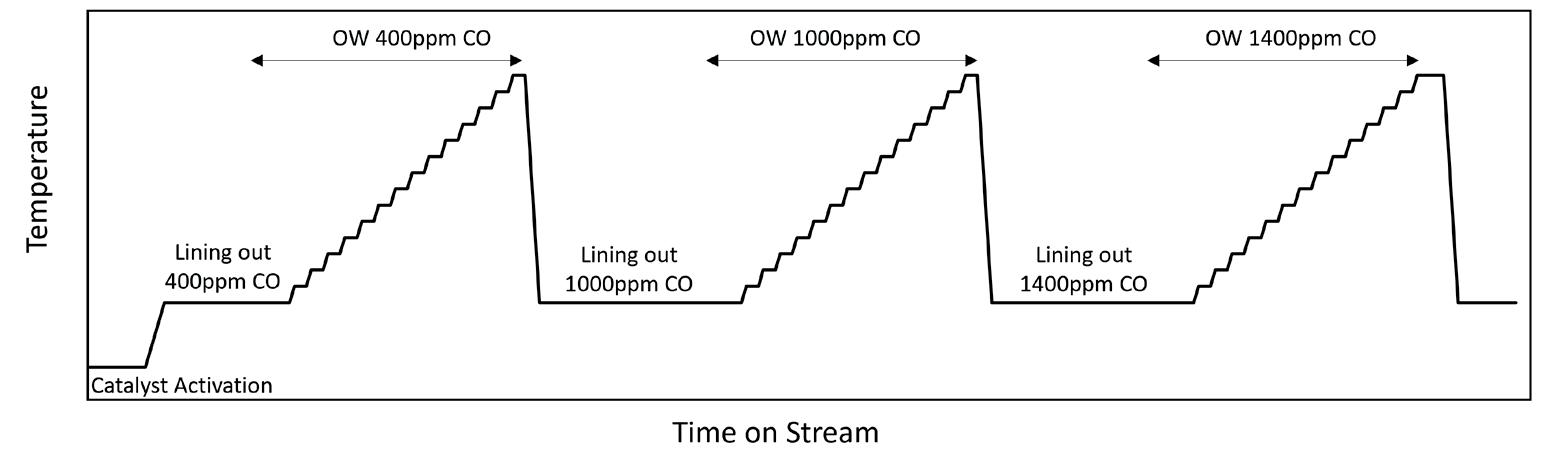
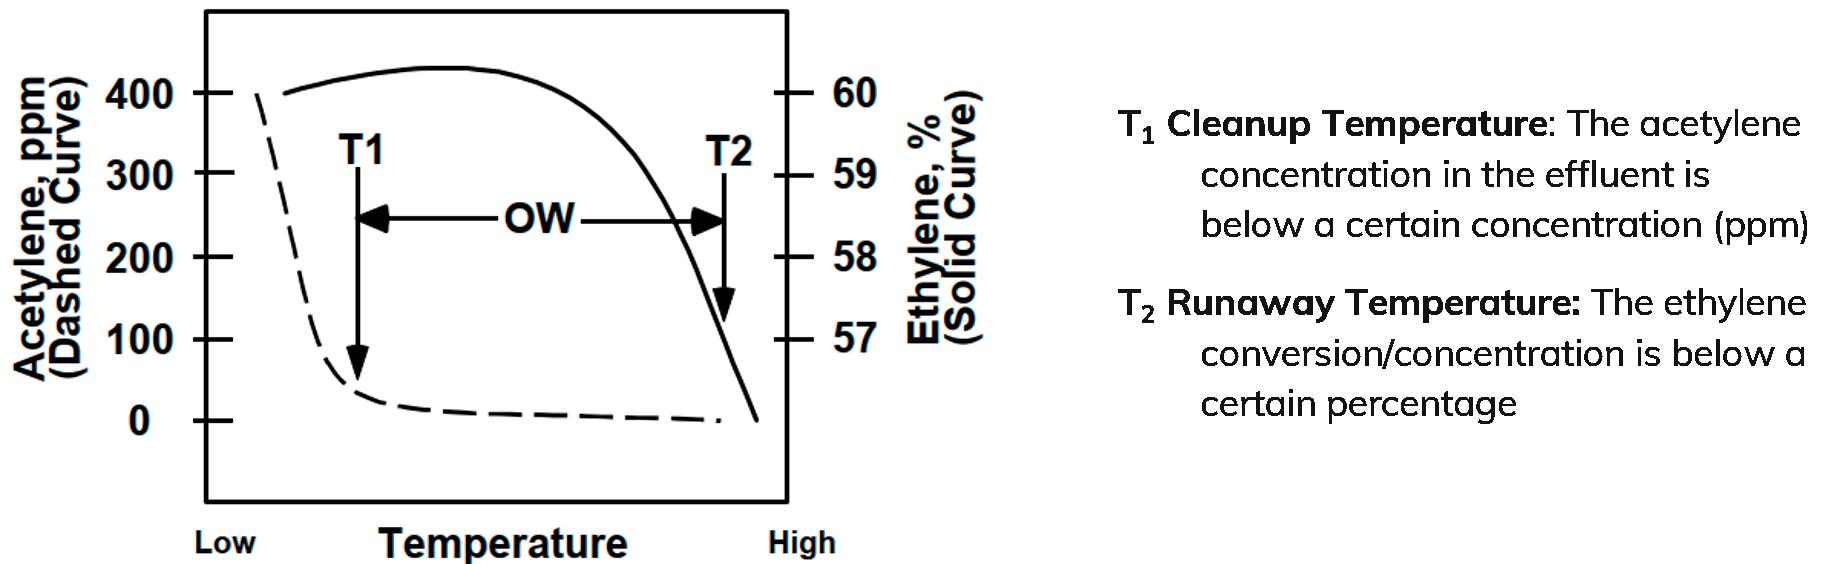
into four independent temperature-controlled blocks, each containing four reactors. Figure 2 illustrates a simplified schematic of the unit.
The gas feeds are measured with mass flow controllers (MFC) and are evenly distributed over the 16 parallel reactors (flow ± 0.5% RSD), using a microfluidics distribution glass chip. The microfluidics distribution glass chips are inserted in a tiny pressure module that also allows for pressure regulated within a bandwidth of ± 0.1 barg.6 The gaseous product was analysed using an online gas chromatograph (GC). The effluent stream is diluted with nitrogen (N2) to control the GC concentration.
The test feeds were pre-mixed in gas cylinders of 50 litres and 120 barg filling pressure. Three different feeds were tested with 400 ppm, 1000 ppm, and 1400 ppm CO concentration, mixed with H2, CH4, C2H2, and C2H4 Helium (3 mol%) was assessed as internal standard.
The testing programme is schemed in Figure 3. The activation procedure was discussed with each catalyst’s supplier and adjusted where it was feasible. Since all the catalysts are activated in parallel, the temperature was adjusted per catalyst, while the feed composition, flowrate, and pressure remain identical for all the catalysts.
After activation, a lining-out procedure is performed. During this step, the reactors are flushed with N2, and both temperature and pressure are stabilised at the target values corresponding to the starting conditions of the temperature scan. Once stable, the feed is introduced at the target gas hourly space velocity (GHSV).
To evaluate the activity and selectivity of catalysts used in front-end applications, the effluent gas composition is analysed using GC as the reactor temperature is
gradually increased. Two key temperatures are identified during this process:
n Cleanup temperature (T1): the temperature at which the acetylene concentration in the effluent is below 20 ppm.
n Runaway temperature (T2): the temperature at which ethylene loss reaches 3 wt% of the ethylene in the feed, signalling the onset of significant ethylene hydrogenation.
The difference between T2 and T1 defines the operating window (OW) of the catalyst.
A wider OW indicates a more robust catalyst against CO fluctuations, while a narrower OW may suggest thermal instability. This relationship is illustrated in Figure 4, which shows how temperature affects ethylene and acetylene concentrations and highlights the importance of OW in assessing catalyst performance.
To measure the OW, the reaction temperature is increased in steps of 2.5 - 5°C. At each step, once the desired temperature and pressure are reached, the system is allowed to stabilise for 30 - 60 minutes. The product stream composition is then measured, typically collecting three data points per reactor. After reaching T2, the reactors are cooled back to the initial temperature under the same feed conditions (CO at ppm level). The feed is then switched, and the procedure is repeated to determine the OW for the new conditions.
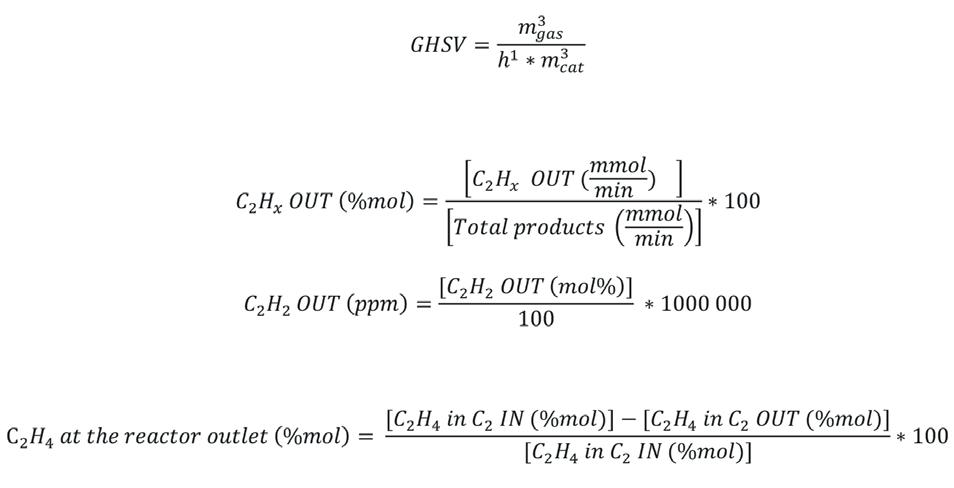
The performance of the seven catalysts has been evaluated in the selective hydrogenation of acetylene in front-end conditions. Figure 5 displayed the C2H2 content on the reactor outlet and the C2H4 conversion as a function of reaction temperature for the run with 400 ppm CO2 feed. Clear differences can be observed between the conversion and
selectivity’s within the different catalysts. For instance, CAT 1, CAT 3, and CAT 5 reached the lower level of C2H2 OUT (T1) at much lower temperatures than the remaining catalysts. In contrast, CAT 4 and CAT 6 reached the conversion targets towards C2H4 (and thus lower selectivity towards C2H6) clear at higher temperatures. It should be noted that CAT 4 has not even reached the target level for T2 within the tested temperature range.
Lower cleanup temperatures (T1) optimise energy consumption, while a larger OW results in longer cycles and potentially reduced costs associated with catalyst replacement. Each ACU features its own integration to ensure proper heating of the inlet and balancing between effluent-feed exchangers, outlet temperatures, and potentially steam consumption.
Lower inlet temperature requires measures to minimise contamination and procedures for unexpected events, as these factors directly impact the time needed to reach end of run (EOR) inlet temperature, ultimately limiting ethylene production.
A common operational challenge for front-end hydrogenation is the fluctuation of CO concentration in the feed. CO acts as an activity inhibitor to hydrogenation as it is adsorbed on the catalyst’s active sites (the adsorption priorities are CO > acetylene >> conjugated diolefins). On conventional catalysts, when CO levels increase, a higher temperature is required to produce on-specification product. Higher selectivity can be achieved at higher CO concentrations because it functions as a favourable modifier. However, when CO concentration suddenly drops, more catalyst sites become available, and ethylene hydrogenation occurs more readily. This sudden drop can lead to temperature runaway. Therefore, evaluating catalysts at varying CO values is essential due to their impact on the stable operation of the ACU. Controlling upstream operations is particularly important when working with mixed feedstocks, such as propane, hydrocarbons, and ethane, or even circular, bio, and heavy feedstocks.
Exploring the response to CO levels, which imitate the CO swing, is a critical aspect. The rationale behind testing three levels of CO lies in preparing for temporary poisoning scenarios and ensuring catalyst stability and ethylene specification maintenance. Lower CO levels pose challenges, but higher levels may impact throughput due to ACU unit constraints. CO influences the activity and selectivity of palladium-based catalysts as a transient poison that competes with acetylene for adsorption sites on the catalyst, thereby reducing the catalyst’s activity. It is important to maintain a minimum level of CO to prevent ethylene from accessing the reaction sites. Additionally, changes in CO levels can impact the inlet temperature and the extent of acetylene hydrogenation.7
This is evident from the test results of this run, as shown in Figure 6, which shows the OW of the different catalysts with the three different CO ppm levels. Notably, the OWs vary in length depending on the CO concentration in the feed. As previously explained and further supported by the results, higher CO concentrations require elevated T1 and T2 temperatures. It should be noted that for CAT 4 and CAT 6, T2 was not reached within the tested temperature range at higher CO levels. Therefore, the actual OW for these catalysts is wider than what is shown in the figure.
Figure 7 presents the results of Figure 6 reorganised by the three feeds to make it easier to compare the catalysts performance among different CO levels.
In summary, the data in Figures 5, 6, and 7 provide a detailed comparison of the performance of different catalysts under varying CO levels. The results indicate a narrow performance gap among the catalysts, highlighting the subtle differences among them.
The primary goal is to selectively convert acetylene into ethylene. However, during this process, ethylene can also be
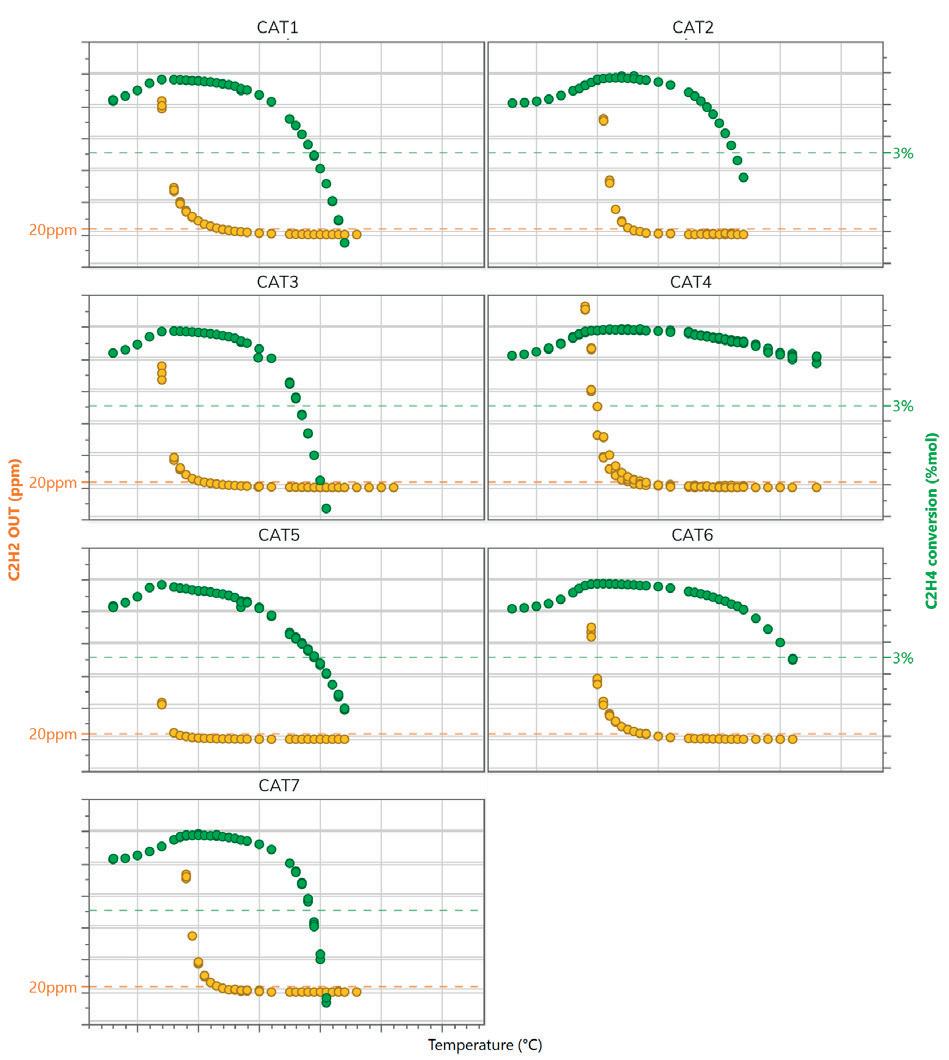
Figure 5. Operating window (OW) of the seven different catalysts with feed of 400 ppm CO.
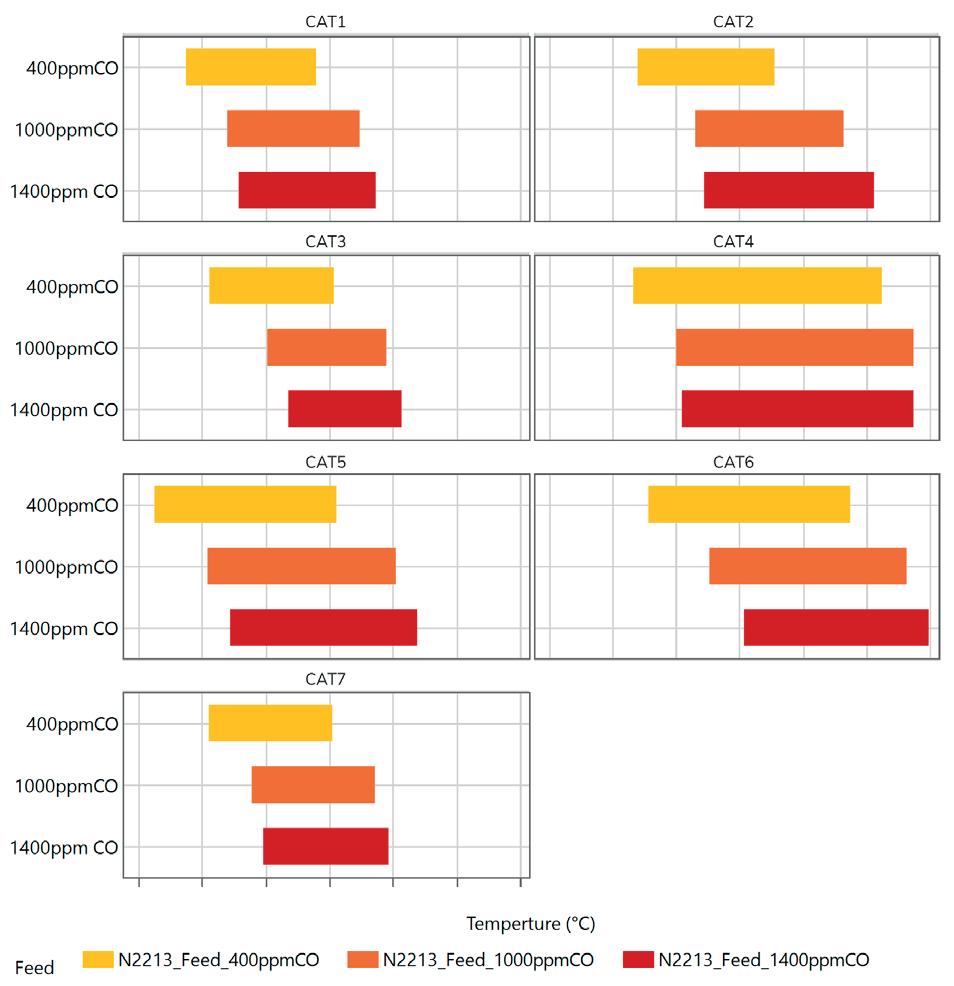
Figure 6. OW temperature ranges in comparison to different CO levels sorted by catalysts.
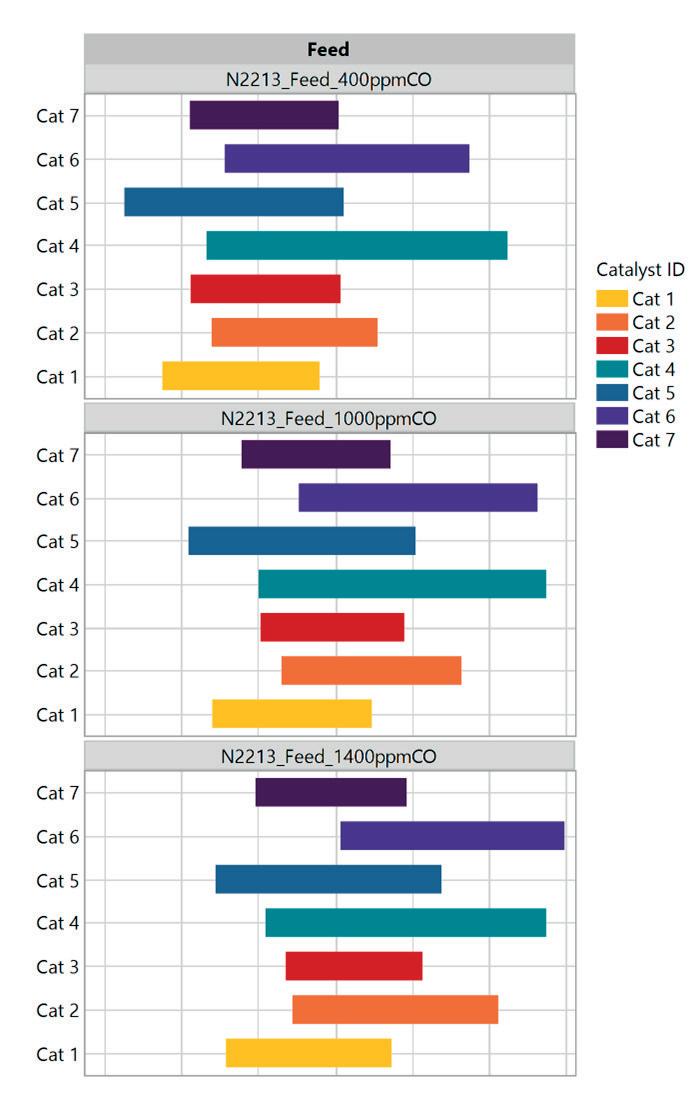
Figure 7. OW comparison of different catalysts sorted by feed with different CO levels.
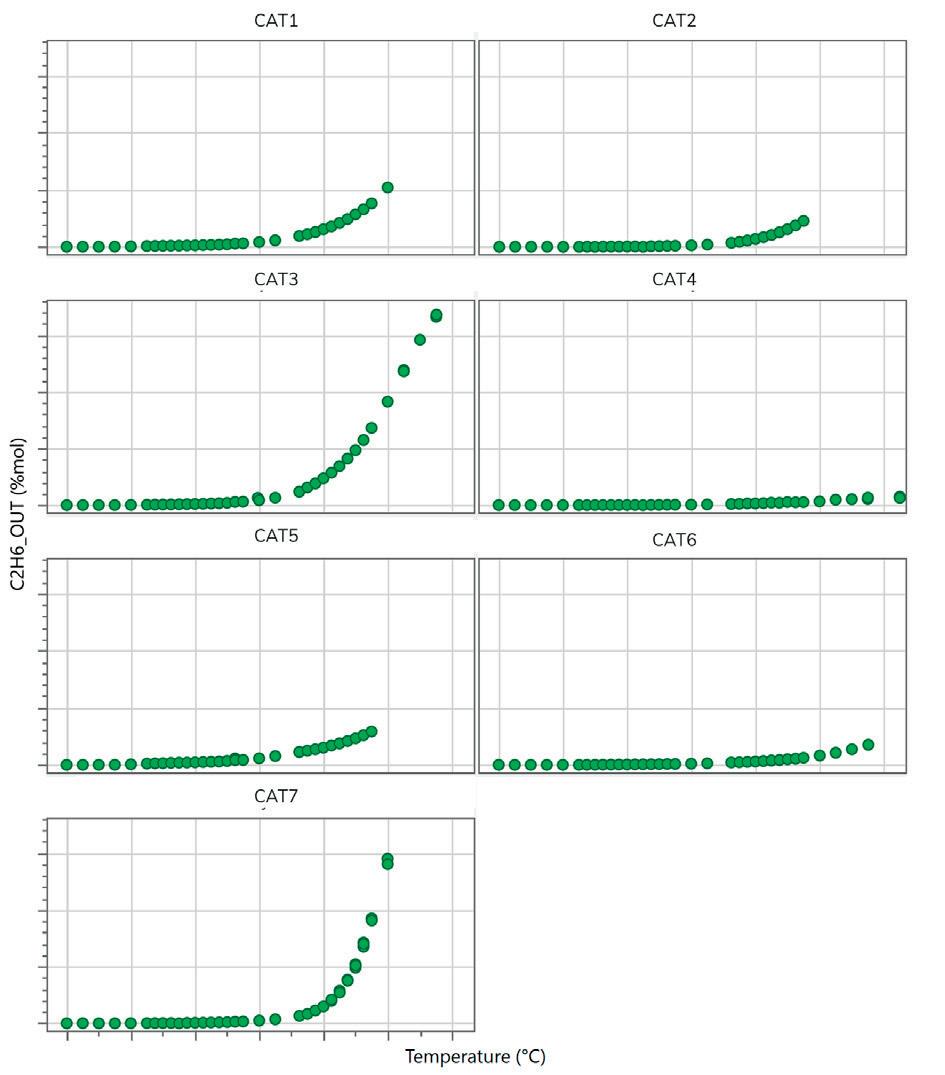
Figure 8. Ethane production of the seven different catalysts with the feed of 400 ppm CO.
hydrogenated into ethane, which reduces the selectivity for ethylene. Additionally, acetylene can undergo overhydrogenation to form ethane (C2H6). Ideally, a catalyst should prevent the further hydrogenation of ethylene to ethane. Figure 8 illustrates the production of ethane with the feed of 400 ppm CO, showing that different catalysts exhibit varying behaviours. Catalysts 7 and 3 produce relatively high amounts of ethane, while the others produce less. When selecting the final catalyst, the selectivity for ethane production is an important factor to consider as avoiding ethane production during acetylene hydrogenation is crucial because ethane is a less valuable product compared to ethylene.
The testing results underscore the importance of independent comparative testing in making informed decisions. The detailed examination of the catalysts’ response to varying CO levels, their stability under temporary poisoning scenarios, and the ability to maintain ethylene specifications are crucial factors that influence the final selection.
Repsol selected the best catalyst based on the results of this study considering operational constraints and economic considerations. Through this study, Repsol has underscored the importance of independent comparative testing. Such evaluations offer a clear and impartial assessment of catalyst performance under actual operational conditions. This approach ensures that the selected catalyst is not only economically viable but also optimally suited to the plant’s specific requirements, thereby enhancing overall efficiency and reducing operational constraints.
As emphasised above, economic considerations are integral to the decision-making process. The balance between activity and selectivity, as well as the importance of lower T1 vs a larger OW, are also pivotal. For this ACU, a lower T1 is essential due to physical limitations that prevent maximum OW from being achieved.
In summary, the economic gains associated with reduced ethane production, lower recycling needs, and energy savings due to lower inlet temperatures, underscores the financial benefits of optimal catalyst selection.
• Flowrence is a registered trademark from Avantium.
1. MOHUNDRO, E. L., ‘Overview on C2 and C3 Selective Hydrogenation in Ethylene Plants’, Session: Ethylene Plant Technology C2 and C3 Hydrogenation Technology Review, AIChE, (2003).
2. XIE, K., XU, K., LIU, M., SONG, X., XU, S., and SI, H., ‘Catalysts for selective hydrogenation of acetylene: a review’, Materials Today Catalysis, Vol. 3, (November 2023).
3. TIEDTKE, D. B., CHEUNG, P., LEGER, J., and ZISMAN, S., ‘Chemicals influencing the activity of palladium-based catalysts for the selective hydrogenation of acetylene to ethylene in acetylene converters’, 13th Ethylene Producers’ Conference, Vol. 13, Session 80, AIChE, (2001).
4. ORTEGA, C., et al., ‘Experimental methods in chemical engineering: High throughput catalyst testing’, The Canadian Journal of Chemical Engineering, Vol. 99, No. 6 (2019), pp. 1288 - 1306.
5. MOONEN, R., ALLES, J., RAS, E-J., C HARVEY, J., Chemical Engineering Technology (2019).
6. VILELA,T ., ‘Data quality obtained in refinery catalyst testing’, Catalysis (2022).
7. TIEDTKE, D., et al., ‘Chemicals Influencing The Activity of PalladiumBased Catalysts For The Selective Hydrogenation Of Acetylene To Ethylene in Acetylene Converters’, Ethylene Producers Conference, Vol. 10, AIChE, (2001).
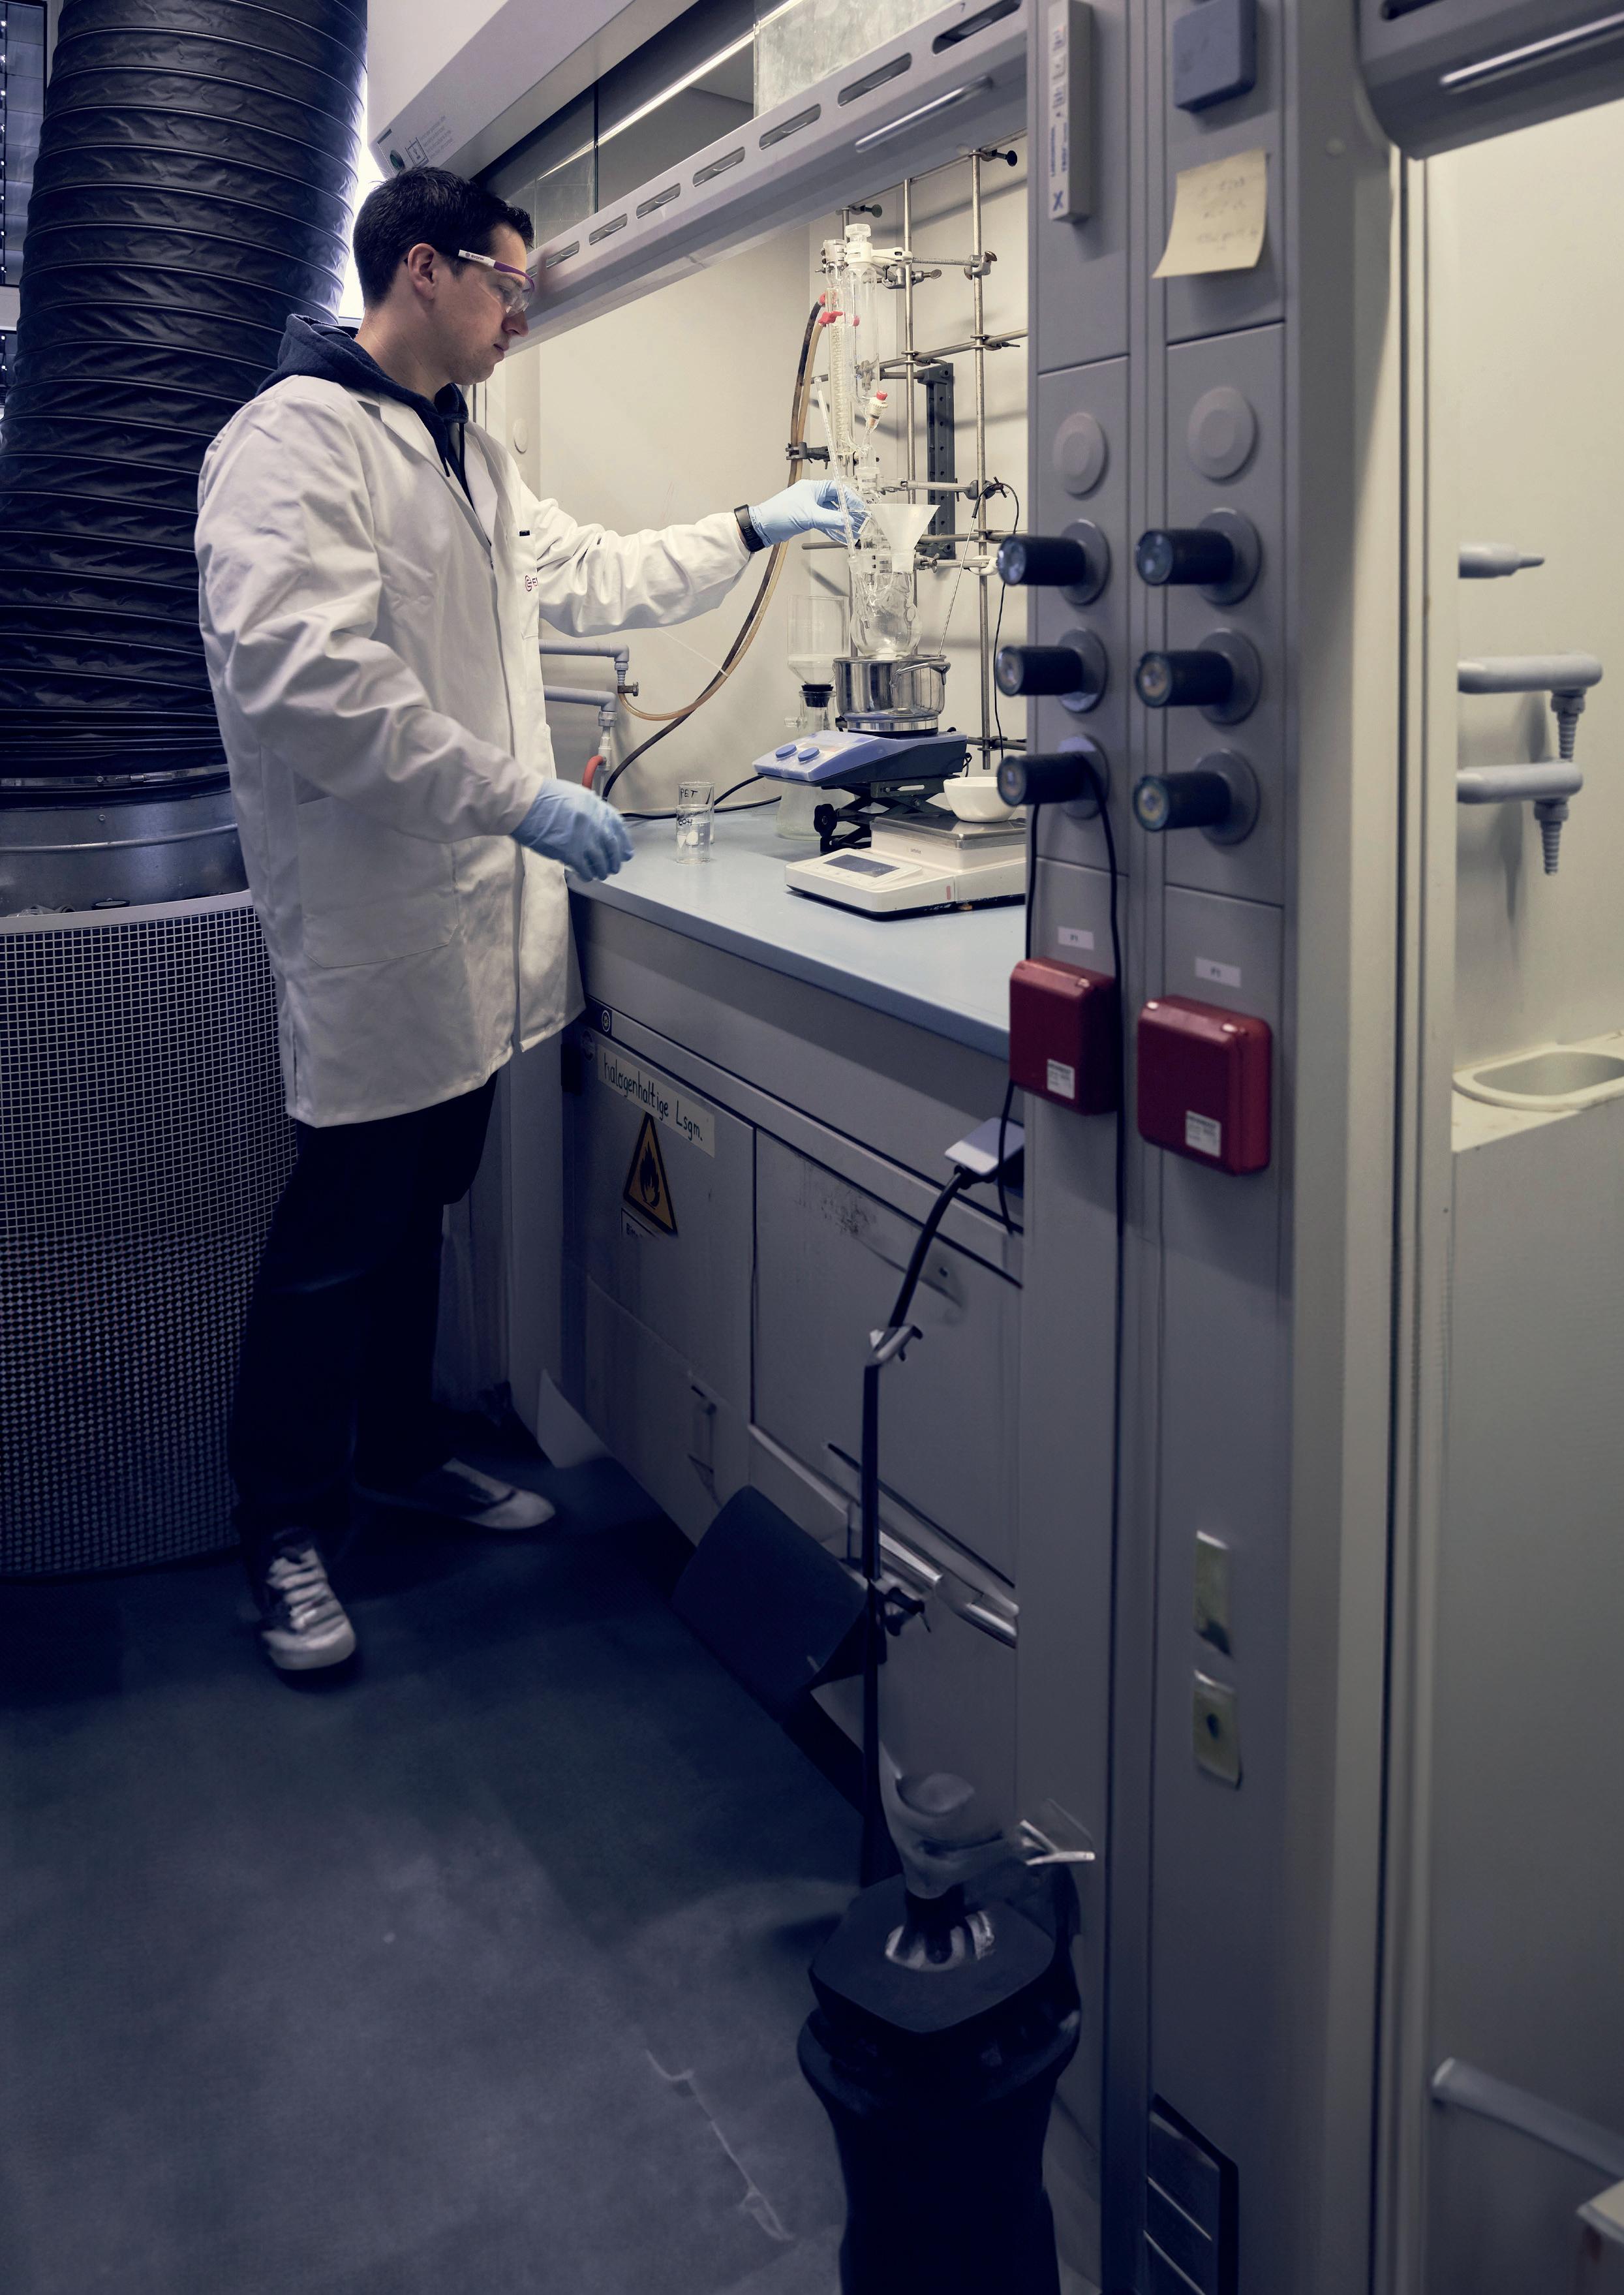
Brian Visioli, Evonik Catalysts, USA, explores how catalyst reuse can aid sustainability within the refining industry, through improving operational efficiency and providing environmental benefits.
Picture a worn-out car tyre, no longer fit for the road, but far from useless. With the right approach, it can be retreaded, repurposed, or reimagined for a second life, just like catalysts in today’s refining and chemical industries.
Many industries are undergoing a fundamental shift in thinking that is moving away from a linear model of use and disposal to one that values reuse, reactivation, and sustainability. Just as the tyre found a valuable new
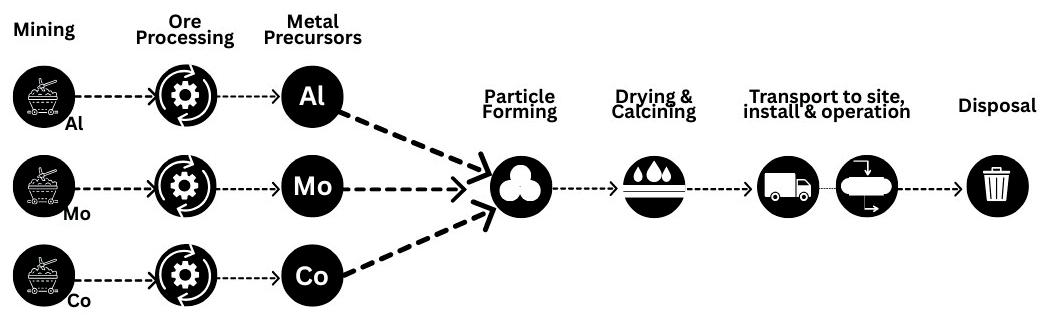
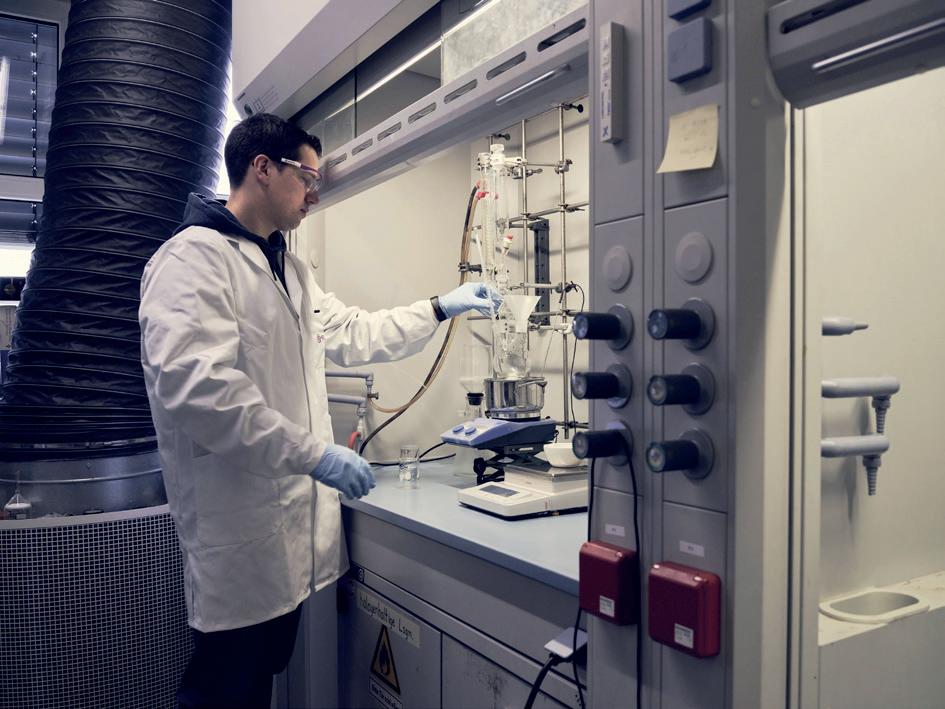
purpose, so can catalysts, bringing cost savings, environmental benefits, and operational performance to refiners, gas processors, and the broader chemical industry.
Catalysts are indispensable to modern chemical and refining processes, playing a role in the production of around 80% of all chemical products. In sulfur recovery, for example, tail gas treating relies on catalysts to meet stringent emissions requirements by converting residual sulfur compounds after the Claus process. Across the industry, there is growing momentum to rethink how catalysts are sourced, used, and reused, unlocking meaningful gains in efficiency, circularity, and sustainability, while reducing reliance on raw materials like cobalt, molybdenum, and alumina.
In the past, a tail gas hydrogenation catalyst, once spent, was considered obsolete and either sent to landfill or processed for metal reclamation. But the industry is becoming more conscious that these approaches come at a cost, not only to business and the planet, but also to people. Disposal in hazardous waste landfills forgoes the residual value in spent material and contributes to long-term environmental risk, while ongoing demand for virgin metals like cobalt, often mined under harsh
conditions in regions such as the Democratic Republic of the Congo, raises ethical concerns. And reclamation, which refers to the extraction of valuable metals (such as cobalt and molybdenum) from spent catalysts, remains energy-intensive and often results in discarding parts of the catalyst that might otherwise be reused.
As refineries face ever growing pressure from regulators, shareholders, and customers to cut emissions, reduce costs, and demonstrate their commitment to sustainable practices, the case for the reuse of catalysts is becoming stronger than ever.
Catalyst reuse refers to the practice of recovering, regenerating, or repurposing spent catalysts to extend their useful life instead of disposing of them.
Regeneration involves removing contaminants such as carbon and sulfur to restore the catalyst’s activity. Rejuvenation, where applicable, involves redistributing active metals or modifying catalyst structure to improve the catalyst’s performance, though this is not a standard part of all catalyst reuse practices.
This partnered approach has proven highly successful in giving catalysts a second lease on life, while preserving performance. Reactivated hydroprocessing catalysts often match the performance of fresh new catalysts, with the added benefit of reducing both capital expenditure (CAPEX) and environmental impact, contributing to circularity for refiners. Industry data suggest these practices can reduce catalyst costs by as much as 35% and carbon footprint by up to 70%, all while maintaining comparable or even improved performance.
Catalyst reuse is not a new concept and has long been standard in hydroprocessing; more than 30 000 t of reactivated hydroprocessing catalysts are installed in refineries each year. 1 However, its application is now expanding into a new and promising area: tail gas treating units (TGTUs).
TGTUs are essential in sulfur recovery systems, and ensure that emissions from Claus processes, including compounds such as hydrogen sulfide (H 2 S), sulfur dioxide (SO 2 ), carbonyl sulfide (COS), and carbon disulfide (CS 2 ), meet strict environmental regulations. These units commonly use catalysts with cobalt and molybdenum active metals supported on alumina, similar to those used in hydroprocessing. Given this similarity, a compelling question arises: could spent hydroprocessing catalysts, once properly reactivated, be reused effectively in tail gas treating applications?
The answer is yes and is best understood through a zoomed-out lens. The traditional lifecycle of a catalyst is linear; mined ores are processed into metal precursors, combined in particle formation, dried, calcined, and shipped to end users. Once spent, the catalyst is

This special supplement focuses on decarbonisation pathways for the downstream sector, highlighting innovative technology and solutions that will help you thrive within the energy transition.

Scan the QR code to download your free copy of EnviroTech 2024.
discarded or broken down for metal recovery at the end of its lifecycle, incurring significant energy, emissions, and cost at each stage. This model is wasteful, but is no longer the only option.
Today, sustainability strategies in catalysts fall into two main camps:
n Improved raw materials: developing catalysts that still use traditional active metals, like cobalt and molybdenum, but are manufactured with more sustainable raw materials or processes. Certain newer catalysts have been found to lower the carbon footprint by around 30% and reduce costs by about 15%, all while maintaining equivalent catalytic performance.
n Reuse and reactivation: extending the life of existing catalysts by recovering and reactivating them for new applications, such as repurposing spent hydroprocessing catalysts for TGTUs. This approach significantly reduces the need for virgin raw materials and waste generation.
By embracing these approaches, refineries can reduce their reliance on virgin raw materials, minimise waste, and achieve performance parity at a lower environmental cost.
Catalysts in TGTUs facilitate critical reactions such as hydrogenation and hydrolysis under challenging conditions, often operating at lower temperatures and handling difficult gas compositions including COS and CS 2 . These demanding environments require catalysts with high activity that can withstand variable loads while ensuring complete SO 2 conversion.
Recent advances show that reactivated hydroprocessing catalysts, such as Evonik’s EcoMax TM TG, can meet or even exceed these rigorous requirements. By carefully requalifying spent cobalt-molybdenum catalysts through thorough performance and pressure drop testing, these reused materials have demonstrated:
n Complete SO 2 conversion.
n Excellent conversion rates of COS and CS 2
n Stable operation at low temperatures.
n Up to 70% reduction in carbon footprint compared to traditional TGTU catalysts.
n Cost savings of up to 35%.
In essence, it is the tyre story revisited. Not only is the catalyst far from broken but, repurposed in a new context, it delivers value that may surpass its original function. Because this method uses less energy than forming particles for a fresh catalyst, numerous Scope 3 emissions from upstream processes are effectively avoided.
A US Gulf Coast refinery selected Evonik’s EcoMax TG catalyst for installation in its TGTU. The subject unit is a conventional temperature TGTU which processes Claus tail gas from one upstream sulfur recovery unit (SRU).
The catalyst was sulfided in situ and operated for four months prior to performance testing.
Performance testing was completed by a well-known SRU and tail gas unit (TGU) performance testing company. Gas samples were taken at the inlet and outlet of the tail gas reactor at a variety of conditions and analysed by gas chromatography. Reactor bed temperatures ranged from the baseline of 271°C to as low as 254°C, corresponding to reactor inlet temperatures from 263°C down to 248°C. The gas chromatography analysis indicated that no SO 2 was present at the tail gas reactor outlet throughout the testing, and conditions in the quench water system confirmed that complete SO 2 conversion was taking place in the tail gas reactor.
The operating conditions were challenging. Very high levels of CS 2 were observed at the reactor inlet, ranging from 8000 to 25 000 ppmv. Throughout the testing, zero CS 2 was observed in the tail gas reactor effluent at any test condition, indicating complete conversion over the catalyst at all conditions tested – far exceeding performance of typical fresh tail gas catalysts.
Overall, the refinery reported a positive experience with the catalyst, meeting emissions targets while benefiting from lower investment costs and alignment with its sustainability goals. This case study demonstrates that businesses can achieve both environmental responsibility and operational excellence without compromise on performance.
Sustainability, by definition, is about meeting today’s needs without compromising those of tomorrow. Catalyst reuse strategies hit both targets as they reduce the immediate cost and carbon impact of catalyst sourcing and disposal, while preserving finite metal resources for future use.
They also reflect a broader industry trend toward circularity. Just as we learn to see worn tyres not as waste, but as materials with untapped potential, so too can refineries see spent catalysts not as liabilities, but as assets with a second life.
Breaking away from linear thinking and embracing circular strategies requires change, investment, and collaboration from the industry as a whole. But together refiners, customers, and the chemical catalyst industry can benefit from a payoff that means lower costs, reduced emissions, and a pathway toward a more sustainable, responsible refining sector.
The story of the tyre is not just a metaphor, it is a model. What once seemed like waste becomes, with creativity and care, something new. In the case of catalysts, that something new just might be the future of sustainable refining.
1. VISIOLI, B., ‘Reducing the carbon footprint of tail gas treating with reactivated catalysts’, Decarbonisation Technology, (May 2023), https://decarbonisationtechnology.com/article/158/reduce-thecarbon-footprint-of-tail-gas-treating-with-reactivated-catalysts

As the world accelerates toward a low-carbon future, the industrial sector faces intense pressure to reduce its environmental footprint. Long viewed as one of the most difficult sectors to decarbonise, industry accounts for a significant portion of global energy use and associated greenhouse gas (GHG) emissions. Within this sector, process heating represents a substantial share of the total energy consumption: often supplied by fossil fuels through direct combustion systems such as fire-tube boilers, gas-fired reboilers, and radiant tube furnaces.
The electrification of industrial heating is now gaining momentum as a technically viable and economically compelling alternative. With advancements in heater design, power management, and control systems, electric heating solutions can now meet the demands of complex, high-power industrial processes while delivering superior efficiency, precision, and environmental performance.
Electrification is not a new concept, but its scope and relevance have expanded dramatically in recent years. As part of the broader energy transition, electrification has emerged alongside other decarbonisation strategies including hydrogen fuel adoption, renewable power generation, energy efficiency improvements, and carbon capture and storage (CCS). However, among these strategies, electrifying process heat is one of the most immediately actionable steps for reducing carbon intensity.
Electric heating technologies, particularly mineral insulated (MI) heaters, have been proven in industrial environments for decades. What is new is their scalability,
Roly Juliano, and Gregoire Quere, Watlow, discuss how low voltage and medium voltage electrification of industrial process heating is emerging as an advantageous solution to reduce emissions and improve performance, moving toward industrial decarbonisation.
affordability, and compatibility with digital control systems and renewable electricity. Today’s electric heaters can be deployed in applications once considered too energy-intensive or complex, including high-capacity reboilers, chemical reactors, hot oil systems, and drying operations.
A key motivator for this shift is the superior efficiency of electric heating. Unlike combustion systems, which suffer from stack losses, thermal lag, and incomplete combustion, electric heaters convert electrical energy directly into thermal energy with efficiencies approaching or exceeding 95%. This direct conversion also eliminates local emissions, simplifying permitting and environmental compliance.
Reliability of mineral insulated electric heaters is the backbone of industrial electrification. These heaters consist of a resistance wire, typically an 80% nickel, 20% chromium alloy,

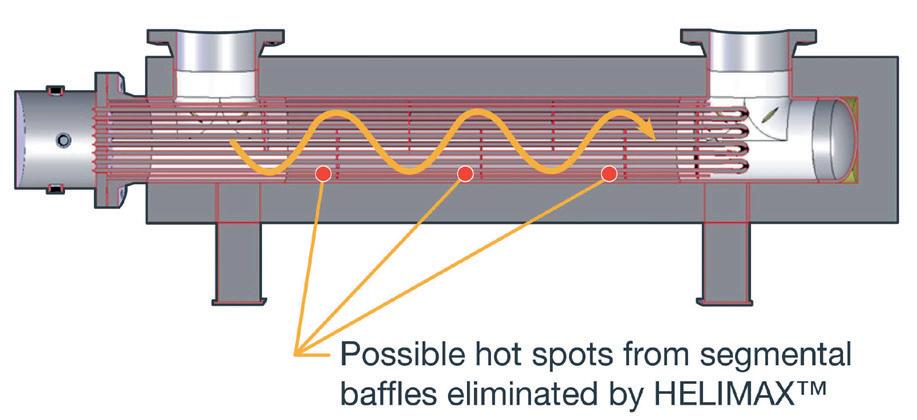
surrounded by compacted magnesium oxide (MgO) insulation and encased in a metal sheath. The MgO serves a dual role: it electrically insulates the wire while efficiently conducting heat to the sheath, which then transfers thermal energy to the process fluid by convection, conduction, or radiation.
This design enables electric heaters to deliver consistent, uniform heat flux: a critical feature that mitigates common problems associated with fired heaters such as hot spots, localised overheating, coking, and fouling. In liquid systems, uniform heat transfer reduces the risk of film boiling and thermal degradation. In gas applications, it improves energy distribution and enhances system stability.
Different heater configurations are available depending on process needs. Cartridge heaters place the coil closer to the sheath for faster heat transfer and higher watt densities. MULTICELTM and tubular heaters are suited for larger systems or applications with significant temperature gradients. These heaters can be built into circulation-style packages, complete with process fluid inlet and outlet nozzles, terminal enclosures, and control panels.
Historically, most electric heaters operated at low voltages and served loads under 250 kW. These were ideal for localised heating but unsuitable for large scale applications requiring megawatts of power. The rapid expansion of electrification initiatives in refining, chemical processing, and renewable fuels has pushed the need for higher-capacity solutions.
Medium voltage (MV) electric heating has filled this gap. Operating at voltages up to 7.2 kV, MV systems allow large power transfer through smaller conductors, reducing the need for oversized cables and heavy-duty switch gear.
A 5 MW medium voltage heater, for example, requires significantly fewer and smaller cables than its low voltage equivalent, cutting capital expenditures and simplifying installation.
The internal construction of MV heaters is similar to that of their low voltage counterparts, using the same nickel-chromium (NiCr) resistance wire and sheath materials. However, they feature a thicker layer of MgO insulation to accommodate the higher operating voltage and ensure electrical safety. This thicker insulation does limit maximum temperature slightly, but current designs can still operate reliably at up to 400°C, more than sufficient for many industrial heating applications.
Watlow has deployed POWERSAFE, its MV heating solution and has active design proposals for installations up to 200 MW. These systems are often modular, with multiple heating bundles connected in parallel or series. This modularity improves scalability and enables better load management, as operators can adjust power delivery by energising only the necessary number of heaters. It also introduces redundancy, so system uptime is not compromised by a single component failure.
Several real-world projects have demonstrated the viability and benefits of electrifying industrial heating systems.


17-20 November Cannes, France


New speakers for ERTC 2025 include:


Four days of valuable insight, inspiration, and collaboration to help future-proof refining’s role in the long-term energy mix.


What to expect from ERTC 2025 :


• 1200+ downstream business leaders in one place


• 11 specialised technical streams, across 3 fully themed days of content
• Hear from Industry leaders at ENI, Repsol, Galp, OMV & more
• Using a double opt-in system, meet relevant industry peers for focused and meaningful discussions
• The ERTC Industry Awards and The Rising Star Award is back!


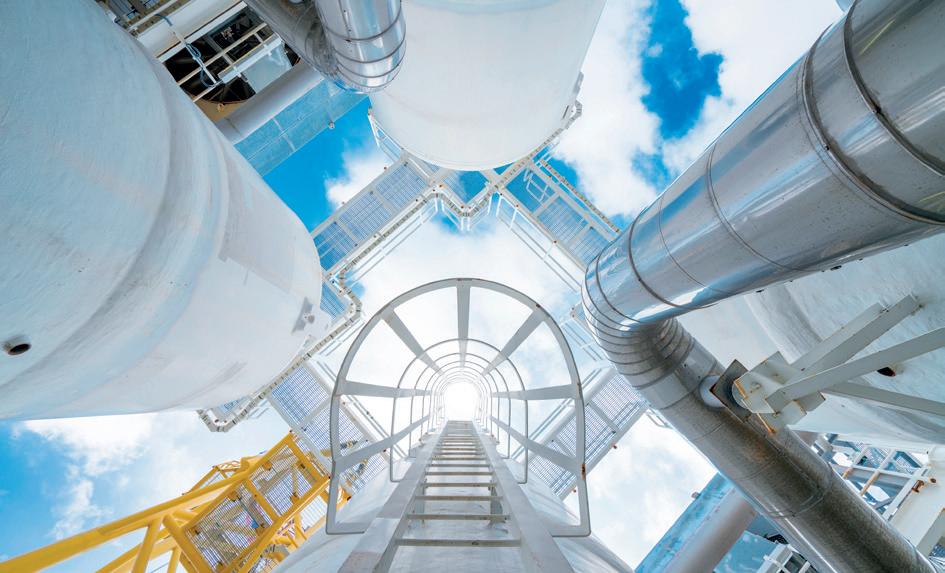
In France, a refinery upgraded its bitumen heating system, from steam heat exchangers to 4.8 MW direct electric heaters. This change cut over 13 000 t of CO2 emissions annually, equivalent to roughly 1% of the refinery’s total emissions, and reduced natural gas use by nearly 5000 t.
In Singapore, a renewable diesel facility replaced a 2 MW gas-fired hot oil system with a medium voltage heater. This change was driven by rising carbon taxes and the need for better process safety and control. The result was not only a reduction in emissions but also improved process efficiency and lower long-term costs.
In Canada, a 33 MW electric heating system has been installed and is operational in lieu of traditional gas fired drying of gypsum. There is also a wood drying plant converted from the use of fossil-fuelled kilns to electric duct heaters powered by hydroelectricity. These projects aligned with corporate sustainability goals and capitalised on the low-carbon power mix of the local grid. 20 duct heaters and four control panels now manage the drying of softwood lumber with precision and reliability.
Watlow has also supported TEG reboiler upgrades in offshore environments such as the Gulf of America, where space and emissions constraints favour compact, clean technologies. In these projects, electric bundles replaced ageing shell-and-tube systems with minimal changes to process piping, demonstrating the ease of retrofit when power infrastructure is available.
One of the most promising and technically transformative applications is the direct electric heating of catalytic and non-catalytic reactors. Traditional ethylene crackers and similar reactors rely on combustion chambers with multiple burners to heat radiant coils, often achieving only 40 - 45% thermal efficiency. These systems are inherently slow to respond, difficult to control, and maintenance-intensive due to refractory degradation and burner fouling. By contrast, direct electric heating applies current directly to the reactor tube or conductive structure. This approach
drastically simplifies the system by eliminating fireboxes, chimneys, and heat recovery systems. It delivers ultra-fast temperature control with a higher degree of spatial uniformity. The lower skin temperature of the reactor also extends component life and reduces unplanned downtime.
Advanced control systems support these benefits. Rather than relying solely on slow-responding PID loops based on process outlet temperature, direct electric systems incorporate high-speed power controllers that sample and adjust input every 20 milliseconds. This enables faster, more stable control and supports predictive modelling for complex reactions.
For industries seeking to optimise yield, reduce fuel variability effects, and increase plant uptime, direct electric heating presents a substantial competitive advantage.
While the benefits are clear, successful electrification requires careful planning. Engineers must begin with a detailed assessment of process heat demand, thermal characteristics of the media, existing equipment layout, and electrical infrastructure. Calculating the equivalent electric load from current Btu or steam consumption is essential. For example, a 6 million Btu/h gas heater with 85% efficiency can be replaced with an electric heater rated approximately 1.55 MW, assuming 96% electric system efficiency.
Voltage selection is a critical decision. For loads under 1 MW, low voltage systems may suffice. Above that threshold, MV becomes increasingly attractive due to cost and space savings. In applications with multiple megawatts of demand, MV heaters may be the only practical option.
Utilities must also be engaged early in the planning process, especially for brownfield installations. Grid capacity, transformer availability, and demand changes can influence feasibility. In some regions, carbon pricing or emissions regulations may help justify investment by reducing long-term operational costs.
Hybrid approaches may provide a stepping-stone, allowing facilities to augment existing systems with electric heaters for peaking or fine control. Over time, as grid infrastructure improves or renewable electricity becomes more accessible, these hybrid systems can transition toward full electrification.
The electrification of industrial process heating is no longer a future aspiration; it is an active, accelerating shift supported by proven technologies and real-world success stories. As industries face mounting regulatory, economic, and social pressure to decarbonise, electrification offers a pathway that enhances both environmental and operational performance.
Electric heating technologies are ready to meet the scale, complexity, and reliability expectations of today’s industrial operations. With efficient designs, modular scalability, and advanced control integration, electric heaters now represent a viable alternative to fossil-fired systems in everything from reboilers to reactors.
For engineers, energy managers, and plant operators, now is the time to rethink heating strategies. Electrification is not just a compliance tool. It is an opportunity to modernise process infrastructure, reduce emissions, improve control, and build a more resilient and sustainable future.
Kevin E. Siters, Alkegen, USA, outlines why corrosion under insulation (CUI) remains a significant challenge in the downstream sector, and introduces an insulation solution that can help combat this problem.

Corrosion under insulation (CUI) continues to be a major challenge in the petrochemical industry with unplanned maintenance events costing companies millions of dollars each year in downtime and repairs. Petrochemical asset owners also need to employ or outsource teams of people to monitor and inspect pipe systems and equipment to maintain processes and reduce the incidence of catastrophic failures, spills, and potential health and safety incidents caused by CUI.
Petrochemical plants typically have a great deal of process piping open to the external environment. These metal pipes must be insulated to reduce heat losses, and the insulation is often clad externally with metal, rubber, or glass reinforced plastic (GRP) cladding. Water will often find its way past the cladding and into the insulation layers, causing corrosion of the pipes. Heat losses may also be excessive since insulation is not as effective when wet. To reduce CUI, petrochemical applications require an insulation with low water absorption and high permeability that can also cope with the temperatures in the CUI range.
Long-term durability issues and a need for improved CUI performance have led many asset owners to seek alternatives to traditional products, such as mineral wool and calcium silicate.
One such alternative is Alkegen’s Insulfrax RTW250 Blanket (Figure 1), a needled blanket that is not reliant on binders to maintain


strength and durability over time, and is suitable for high-temperature wrap insulation applications. The blanket is an alkaline earth silicate (AES) wool that is exonerated from classification by virtue of Note Q, as detailed under regulation (EC) No 1272/2008 (CLP) and as such is considered to be a low biopersistent (LBP) substance.
C167 Density (lb/ft3)
ASTM C356 % linear shrinkage at 300°C <5 <5
ASTM C447 Maximum use temperature (°C) 1200 600
ASTM C1388 Fungal growth Not observed Not observed
ASTM C1763 Water absorption (% vol)
C1104 Water sorbed (%)
ASTM C795 ASTM C692 and C871 Acceptable Acceptable
ASTM C692 Cracks observed? No cracks No cracks
ASTM C871 Acceptable Within acceptable limits Within acceptable limits
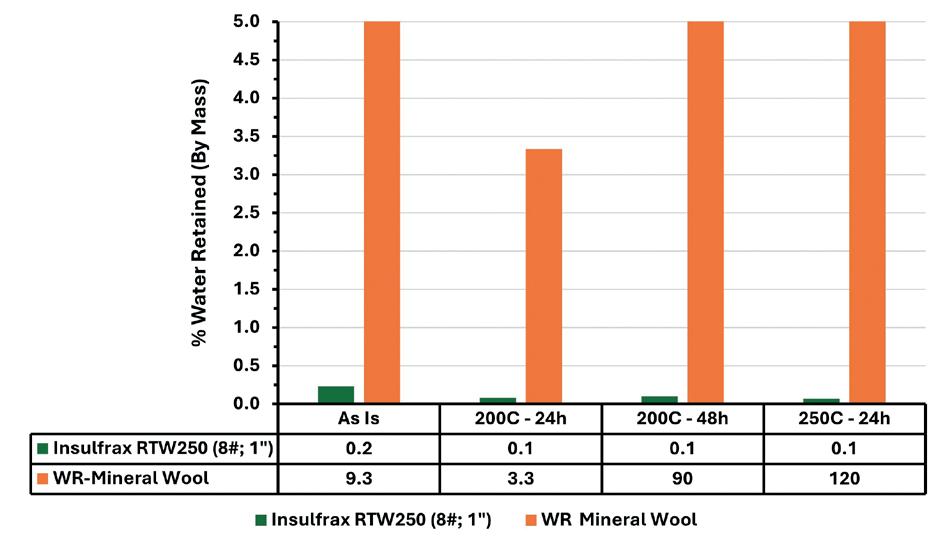
Figure 2. Thermal stability of water repellent properties on Insulfrax RTW250 and traditional water resistant mineral wool after sample is soaked at temperature. Insulfrax RTW250 has excellent water repellent properties up to 200°C and allows for brief excursions up to 250°C.
The blanket has been engineered to bring water repellent technology and protection against CUI in external pipe insulation. It can fit a wide range of insulation needs in a petrochemical facility while allowing for fast installation without the need for wire backing or specialised cutting tools. The self-supported product is offered in various densities (6 and 8 lb/ft3) and thicknesses (1 and 2 in.) to accommodate the broad and often complex piping needs in a refinery. CUI occurs when transient or condensed water penetrates insulation and comes into contact with the metallic substrate. Corrosion is accelerated with the release of ions from the steel and can be exacerbated when ions like chlorine or fluorine are present and therefore promote localised corrosion. Therefore, removing water from a system limits corrosion as moisture enables CUI. In accordance with several ASTM methods, Insulfrax RTW250 Blanket has exhibited its effectiveness as a water repellent insulation solution (Table 1), demonstrating minimal water vapour sorption, absorption, and retention.
When operating at high temperatures there becomes a risk that hydrophobicity and water repellency will be compromised – Insulfrax RTW250 Blanket maintains water repellency throughout the body of the product at temperatures up to 200°C, with allowable brief incursions up to 250°C. It has been developed to hold waterproofing through the entire blanket, making it resilient to temperature swings, sustained water exposure and degradation – without using per- and polyfluoroalkyl substances (PFAs), which cannot be used indoors, or formaldehyde-based waterproofing. The blanket does not require additional curing, and provides protection from transient water sources such as gaps in cladding, pooling of water around joints, humidity and rain, and flooding.
With more stable and consistent waterproofing, equipment and piping is better protected from corrosion and rust when operating in temperature ranges susceptible to CUI (Figure 2).
Even as transient water infiltrates the insulation package, steam can be transmitted through the insulating material, which prevents condensation in the blanket and allows for drying of accumulated water on the steel substrate. With temperature resistance up to 200°C, the hydrophobic agent does not allow for condensation or entrapment of retained water between the mat and the substrate responsible for CUI. At low temperatures, such as 45°C, a fully saturated blanket dries completely within two hours by allowing steam to pass through, thereby limiting contact between bare steel and water (Figure 3).

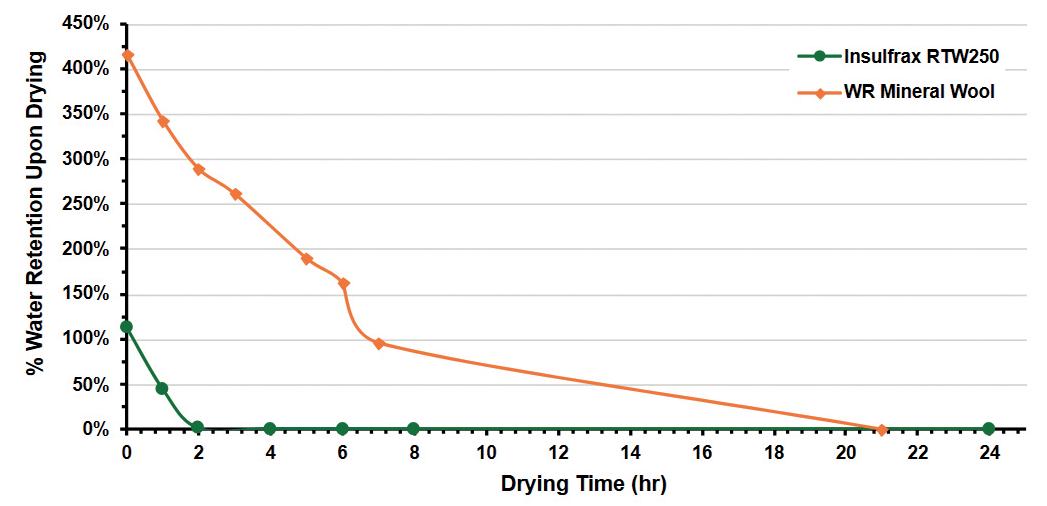
Figure 3. Steam is incredibly permeable throughout the Insulfrax RTW250 Blanket when saturated with water, providing a quick drying solution. Traditional water resistant mineral wool loses water repellent properties after submersion in water and is much slower to dry; requiring at least 8 hours at 45°C.
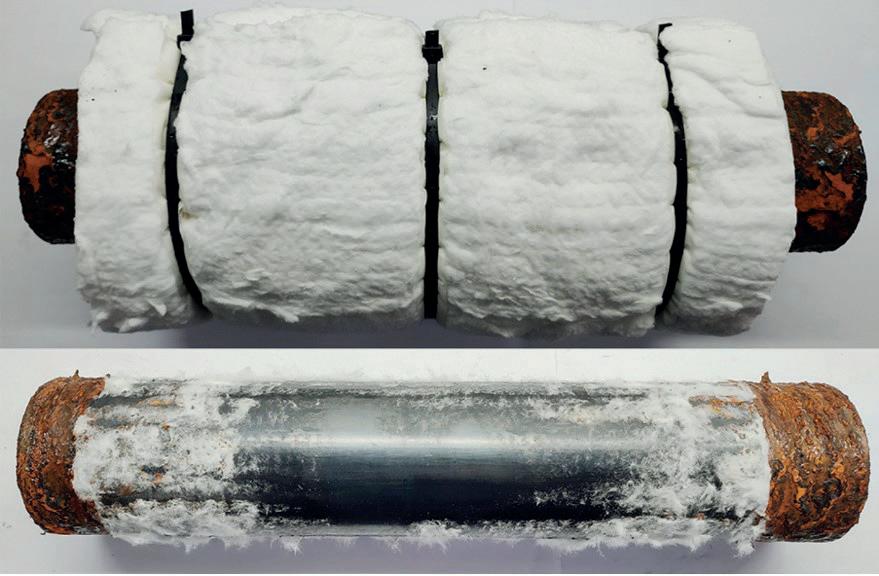
Figure 4. Insulfrax RTW250 with advanced water repellent technology throughout the core of the blanket keeps moisture and salt away from the substrate – protecting it from corrosion over the life of the blanket, under even harsh conditions.
Under simulated conditions, Insulfrax RTW250 Blanket effectively protects against CUI under highly corrosive conditions. A stainless steel pipe was wrapped in the insulation and exposed to a 5% NaCl solution at 35°C for 21 days (Figure 4). Visual inspection of the pipe sample after the 21-day exposure shows the pipe is protected from corrosion under highly corrosive conditions. Areas of the pipe that were exposed to the conditions demonstrated considerable rust and corrosion. Slight corrosion was observed at the edges of the blanket, which highlights a crucial need for the blanket to be tight to the equipment that is being protected.
By maximising contact with the steel substrate, Insulfrax demonstrates excellent protection against corrosion and protection of essential equipment when the substrate or surface comes in contact with intrusive water. After 96 hours of exposure to a water drip at temperatures of 200°C and room temperature for two 24-hour cycles, the pipe, at a 4° angle, insulated with Insulfrax RTW250, showed significantly less corrosion than a pipe insulated with traditional water-repellent mineral wool. The barrier created by Insulfrax RTW250, with banding, gives a smooth and even surface that prevents migration of transient water down the surface of the pipe – which can induce corrosion. Figure 5 shows the water repellent nature of the blanket as the water is pooled on the top of the fixed blanket and drains over the surface – not down the length of the pipe. The only significant corrosion detected is where the water was intentionally added to the pipe, unlike the water-repellent mineral wool where the water migrated down the pipe, resulting in significant corrosion.
CUI remains a critical issue for the petrochemical industry, often leading to costly maintenance and safety risks. While traditional insulation materials can struggle to meet modern performance expectations, high-cost alternatives are not always economically feasible or readily available. However, as discussed in this article, other options are available that offer excellent water repellency, thermal durability, ease of installation, and effective protection against CUI. By minimising water ingress and enhancing drying capabilities, it is possible to help petrochemical facilities protect critical infrastructure, extend equipment life, and reduce unplanned downtime – ultimately offering a practical, scalable solution for long-term CUI mitigation.
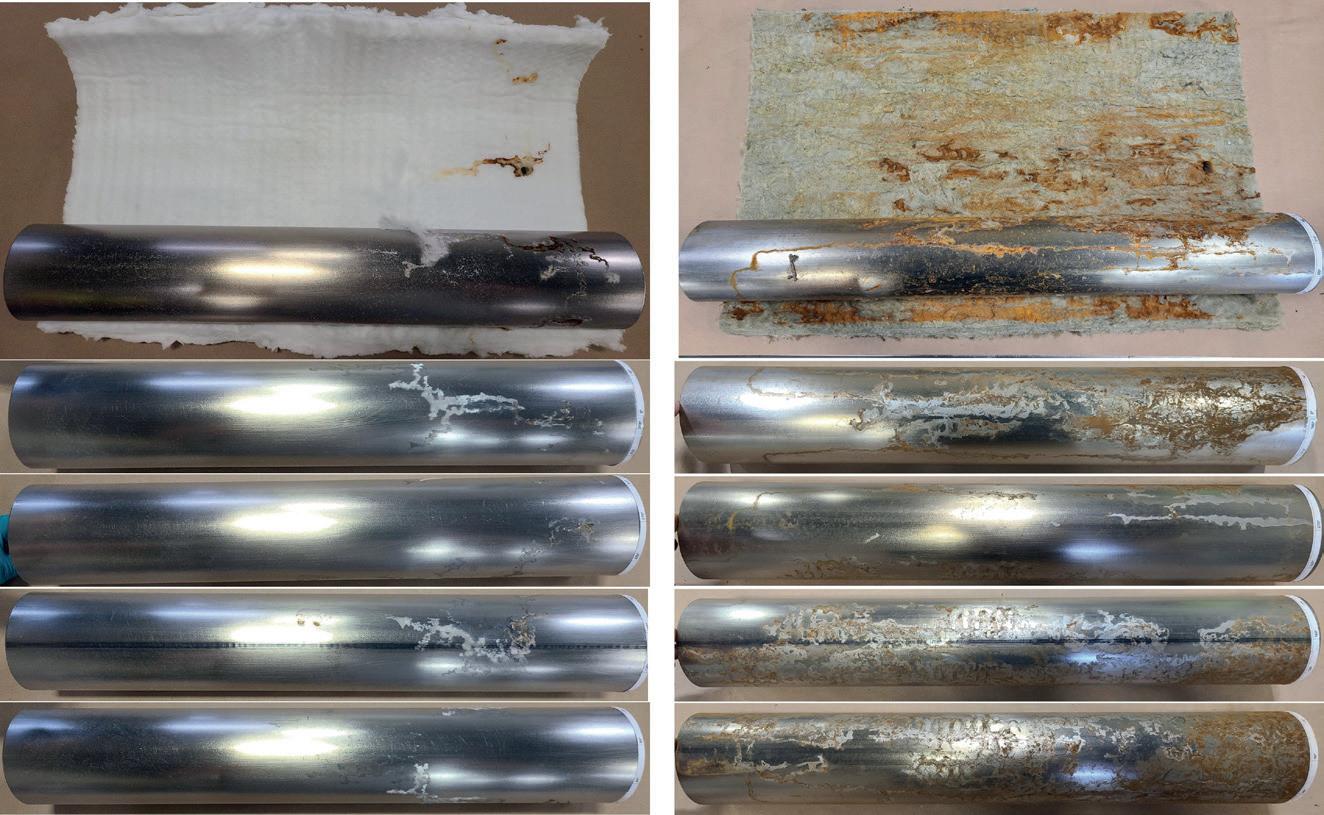
Figure 5. Insulfrax RTW250 provides excellent protection from corrosion despite direct contact of water on steel.
Chris McMahon and Willian Nascimento da Silva have also contributed to this article.
Andy Cull, Total Safety UK, explores how safety can be enhanced in the oil and gas sector through advanced safety management and gas monitoring.

The downstream sector of the oil and gas industry encompasses a range of high-risk operations, from refining crude oil to transporting and distributing petrochemical products. These processes frequently expose personnel to flammable substances, toxic gases, high-pressure systems, and complex machinery.
In recent years, rapid technological advancements have enabled operators to adopt more robust safety strategies, helping them to navigate volatile environments, uphold compliance with stringent regulations, and protect the health of their workforce.
This article explores how modern safety management and next generation gas monitoring technologies can bolster downstream safety, reduce risk, and improve operational continuity.
Refineries, petrochemical plants, and distribution hubs often operate under constantly changing conditions. Shutdowns, maintenance turnarounds, and equipment overhauls introduce additional variables that can complicate established safety processes.
Workers in downstream facilities are frequently reassigned or required to move between different units or locations. Consequently, portable and reliable safety measures –

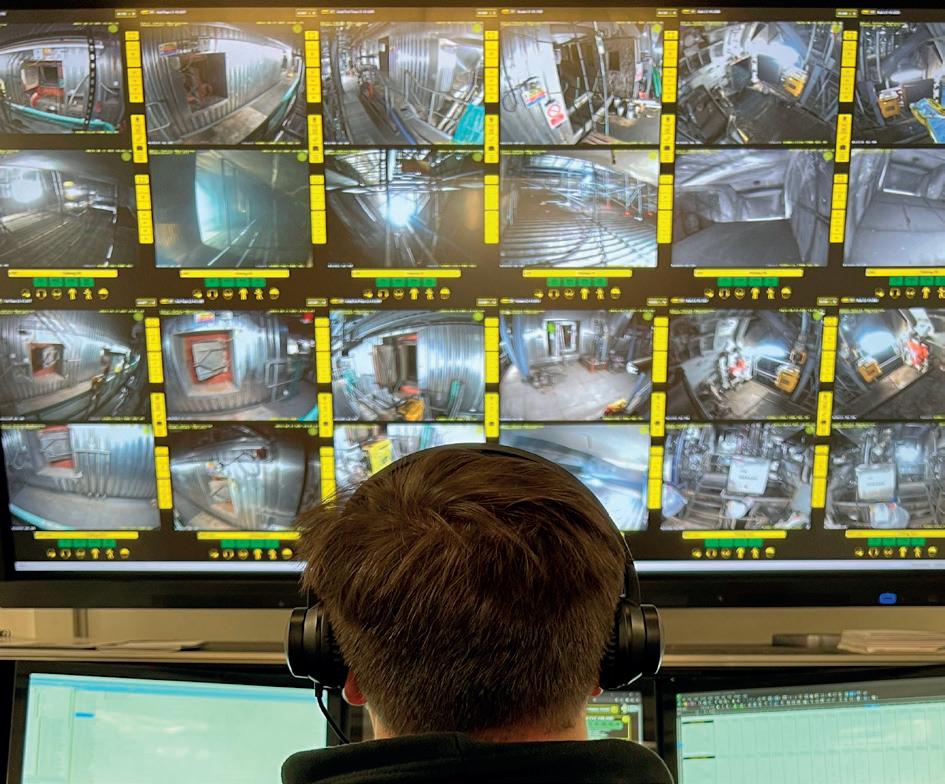
particularly gas detection and streamlined communication – are critical.
Regulations governing downstream operations typically mandate continuous hazard monitoring, clear emergency response protocols, and thorough documentation of safety performance. Non compliance can have severe financial and reputational consequences.
A key development in industrial safety is the emergence of Centralised Confined Space Management (CCSM) solutions. These systems integrate real time communication, continuous data gathering, and geolocation tracking to provide a comprehensive view of confined spaces and other high risk areas.
While specific features may vary between vendors, CCSM systems offer:
n Real time communication: digital platforms ensure clear and instantaneous communication among workers, supervisors, and emergency responders. In many cases, voice, text, and data can be transmitted seamlessly, reducing response times.
n Continuous monitoring and tracking: advanced sensors and video or location tracking can confirm worker locations, ensuring that safety managers maintain visibility of all personnel even in confined spaces.
n Centralised data collection: performance metrics, gas readings, and incident logs are captured automatically. This data can be used for analytics, compliance reporting, and process improvement.
A UK-based petrochemical refinery recently implemented Total Safety’s CCSM system for its annual turnaround as part of a wider package of support.
The solution deployed monitoring cameras to support contractor and employee activities whilst entering and working inside confined spaces. Using the system meant that there was continuous oversight of the confined spaces and improved visibility levels. The data collected enabled the company to provide data that gave increased levels of compliance in line with the clients’ goals. By equipping each worker with wearable devices linked to a central control room, the safety team received live updates on worker locations, atmospheric conditions, and potential hazards.
The centralised command centre enabled Total Safety to:
n Utilise visualisation software to centralise, analyse, and report all incoming data through one video recording.
n Provide continuous oversight of the confined space(s) by trained technicians.
n Complete checklists to verify work permits, required personal protective equipment (PPE), and potential atmospheric hazards.
n Project clear and visible alarm conditions and status.

n Receive visual and audible information via ‘pop-ups’ in case of incoming calls.
n Reduce the entry controller headcount during the outage.
Gas detection remains a cornerstone of downstream safety, as many hazardous substances, such as hydrogen sulfide, methane, and carbon monoxide, are odourless or highly toxic at low concentrations. Modern gas monitoring solutions aim to provide real time alerts, robust connectivity, and actionable data analytics.
Wearable gas detectors – often incorporating multiple sensors – continuously measure environmental conditions and alert the wearer if threshold values are exceeded. Some systems also transmit data to cloud-based dashboards where safety managers can monitor conditions remotely.
n Multi-gas capabilities: single devices can detect multiple gases, allowing comprehensive hazard identification without requiring multiple units.
n Connected safety: many wearable monitors now include wireless connectivity options, such as cellular and satellite-based monitors, enabling real time notifications to safety operations centres.
n Two-way communication: in some advanced devices, workers can communicate directly through the detector in case of an incident, improving emergency responses.
When larger zones need consistent observation –such as tank farms, storage facilities, or loading docks – area gas monitors can be strategically placed. These autonomous units often feature extended battery life (some exceeding 100 days), making them suitable for long-term deployment in remote or hard-to-reach sites.
n Rapid deployment: portable designs reduce setup time, adapting to changing worksites with minimal disruption.
n Cloud connectivity: data collected from area monitors can feed into the same centralised system that manages personal wearables, streamlining supervision, and incident response.
One of the most transformative aspects of modern safety solutions is the ability to capture, store, and analyse large volumes of operational data. Whether collected via personal gas detectors or area monitoring systems, this information gives insight into:
n Historical trends: analysing event logs over time helps identify persistent problem areas or recurring procedural gaps.
n Predictive maintenance: advanced analytics can flag early signs of equipment malfunction, prompting targeted interventions before a critical failure occurs.
n Regulatory reporting: automated reports detailing gas levels, alarm events, and response actions simplify compliance with local and international safety standards.
As the downstream sector evolves, emerging technologies such as artificial intelligence (AI), machine learning (ML), and the Internet of Things (IoT) continue to reshape traditional safety paradigms:
n Predictive hazard modelling: AI-driven algorithms can forecast hazardous conditions based on data patterns, triggering proactive measures and reducing unplanned downtime.
n Augmented reality (AR): wearable AR headsets could provide technicians with real time data overlays, reducing error rates during inspections and repairs.
n Enhanced proximity solutions: improved vehicle and personnel tracking systems (such as radar or sensor-based proximity warnings) may further reduce the risk of collisions or other on-site incidents.
While technology provides powerful tools, it must be integrated into a broader safety framework that includes:
n Training and competency: regular, scenario-based training ensures the workforce can effectively use new devices and follow best-practice procedures in hazardous environments.
n Dedicated safety personnel: in-house or contracted experts can perform site audits, oversee maintenance and calibration of detection systems, and manage emergency response planning.
n Service and maintenance: on-site service centres or mobile calibration teams help keep gas detection equipment accurate and operational, ensuring reliability at critical moments.
By combining safety technologies with well-rounded operational processes, downstream facilities stand to significantly reduce incidents, enhance compliance, and sustain productivity.
The downstream sector’s complex and high-risk nature underscores the importance of robust safety management strategies and reliable gas monitoring solutions. Recent technological advances – ranging from CCSM platforms to connected personal and area gas detectors – are empowering companies to reduce risk more effectively, react swiftly to incidents, and streamline compliance efforts.
As the industry continues to evolve, a holistic approach that blends these emerging developments with on-site expertise, predictive analytics, and dedicated safety practices will be integral to safeguarding workers and assets while driving operational excellence.
Gilles Revial, Aggreko, explores how turnarounds for petrochemical refineries can present a strategic opportunity to streamline and improve processes.
In today’s volatile energy landscape, the European petrochemical sector is under mounting pressure.
High energy costs, ageing infrastructure, and global competition are squeezing margins and forcing refinery stakeholders to rethink how they operate. Among the most critical areas under scrutiny is the turnaround process. This planned shutdown is essential to plant safety and performance, allowing vital maintenance, upgrades, and inspection works to occur.
Traditionally viewed as a costly yet necessary process, the turnaround is increasingly being reimagined as a strategic opportunity. With the right planning, partnerships, and mindset, it can become a launchpad for operational improvement, cost savings, and decreasing overall emissions. But achieving this requires a shift in how the industry approaches every stage of the turnaround lifecycle.
Turnarounds are among the most complex and resource-intensive events in a refinery’s operational calendar. They can take months or years in preparation, and each day offline can cost millions in lost production. The stakes are high, and the margin for error is slim.

This is especially true in Europe, where the average age of petrochemical infrastructure is significantly higher than in other regions. European crackers are around 45 years old on average, which is twice the age of those in the Middle East and three times that of China.1 This ageing infrastructure not only increases the frequency and complexity of maintenance works but can also limit the bandwidth and flexibility of plant teams.
At the same time, the sector is grappling with a shrinking talent pool. A study by Accenture found that nearly 30% of the chemical industry’s workforce is over 50 and likely to retire within the next decade.2 This loss of institutional knowledge presents a serious risk during turnarounds, where experience and expertise are critical to managing safety, logistics, and technical execution.
Given these challenges, the traditional approach to turnarounds, which is often reactive, siloed, and short-term, may no longer suffice. Instead, a more strategic, integrated model is emerging, where turnarounds are treated not as isolated events but as part of a continuous improvement cycle with long-term planning that can extend years into the future.
One of the key shifts is the move from transactional supplier relationships to consultative partnerships. Rather than engaging vendors only when equipment is needed, refinery managers should look to involve supply chain partners early in the planning process. This allows for better scoping, more accurate budgeting, and the opportunity to identify efficiencies that might otherwise be missed.
For example, some third-party providers now offer end-to-end turnaround support, from initial feasibility studies and energy audits to execution and post-project reviews. This holistic approach not only improves project outcomes but also reduces the burden on internal teams, which is particularly important in a sector facing acute labour shortages.
Among the most time-sensitive elements of a turnaround is the cooling process, particularly when it applies to hydrotreaters, hydrocrackers, and reformer catalysts. These procedures often sit on the critical path, meaning any delay can cascade through the entire schedule, with these bottlenecks greatly impacting project timescale and overall profitability.
Traditionally, cooldowns have relied on methods such as liquid nitrogen injection which, while effective, come with logistical, safety, and environmental challenges. In recent years, alternative approaches have emerged that offer greater control and efficiency.
In a standout project, the Aggreko Process Services (APS) team helped a major European refinery transition from traditional nitrogen to hydrogen for a faster reactor cooling process. Its custom-engineered solution included mechanical chillers, heat exchangers, centrifugal pumps, process drums, power generators, and an extensive piping network.
This initiative was driven by the refinery’s goal to cut the standard five day reactor cool-down period to just three days, while also improving maintenance efficiency and potentially saving €1 million per day in downtime. Given the critical role cooling plays in project timelines and the high financial stakes involved, the APS team delivered a complete solution in just three weeks, spanning from design to decommissioning.
The result exceeded expectations, with cooldown delivered in a single day and saving the refinery an estimated €4 million in avoided downtime. This highlights how partnering with experienced specialists can deliver tailored, high-impact solutions grounded in deep industry knowledge.
Power provision is another area where strategic planning can yield significant benefits. During turnarounds, temporary power is often required to support critical systems, tools, and safety equipment. However, poorly specified equipment can lead to inefficiencies, increased emissions, and unnecessary costs.
By working with energy solutions specialists early in the planning process, refinery managers can explore options to mitigate these issues, such as adopting a consultative and holistic approach that begins at the initial planning stage, and continues throughout the turnaround and into a post-project review. This can also reduce workload for stretched, under-pressure refinery managers.
These stakeholders should also consider using existing site power instead of bringing in generators. This approach not only reduces carbon emissions but also leads to significant cost savings. To make this work effectively, it is essential to engage experts with deep experience in petrochemical and refining operations. These professionals should be capable of designing systems that safely transform and distribute power to where it is needed for critical turnaround tasks.
A key advantage of this method is the use of transformers, which can adjust voltage levels to meet varying system demands. With the right expertise, distribution panels and cables can be configured to deliver power efficiently across the site, eliminating the need for temporary generators.
The same principle applies when leveraging expertise to the right-sized generator fleets according to the plant’s specific power needs. This includes implementing automated load-on-demand systems that respond to fluctuating energy requirements by switching engines on or off as needed.
By optimising these power solutions, refineries can achieve significant cost and emissions reductions. More importantly, efficient power management can help shorten overall turnaround times, potentially saving millions and freeing up valuable time to focus on other critical turnaround activities.
One of the most important lessons emerging from recent turnaround projects is the value of long-term planning. Rather than treating each turnaround as a standalone event, leading operators are adopting multi-year planning cycles that align with broader asset management and decarbonisation strategies.

This shift enables better procurement of equipment, more effective workforce planning, and greater alignment with regulatory requirements. It also allows for the integration of sustainability goals from the outset, rather than as an afterthought.
For example, by specifying Stage V generators and


battery energy storage systems (BESS) early in the planning process, refineries can reduce emissions without sacrificing performance. Similarly, the use of drop-in biofuels such as hydrotreated vegetable oil (HVO) and 100% biodiesel (B100) offers a practical path to decarbonisation, especially during periods of high energy demand.
Yet, it cannot be denied that balancing sustainability with commercial viability remains a key challenge for the petrochemical sector. For example, a recent Aggreko report, ‘Rebalancing the Energy Transition’, surveyed 400 European CEOs working in high-energy industries, including the petrochemical sector, and found that 95% of respondents had changed their timescales for net zero in light of recent energy supply and pricing issues.3 However, the pressure to decarbonise continues to grow, driven by regulatory expectations.
Turnarounds offer a unique opportunity to make progress on this front. By integrating greener technologies and practices into the turnaround process, refineries can demonstrate their commitment to sustainability while also improving operational efficiency.
This requires a mindset shift from viewing sustainability as a cost to instead seeing it as a driver for innovation and competitiveness. It also requires close collaboration with supply chain partners that can provide the technical expertise and solutions needed to achieve these goals.
For example, Aggreko’s investment in Stage V generators and BESS’ through its Greener Upgrades initiative complements its consultative approach to turnaround projects, allowing the APS team to demonstrate how emission and cost reductions can be
made simultaneously. The company’s generators can also run on a range of biofuels including HVO and B100, which can be used as drop-in fuels to significantly reduce emissions while powering the turnaround process.
As the European petrochemical sector navigates an increasingly complex operating environment, the importance of collaboration cannot be overstated. Whether for cooling a reactor, powering a critical system, or planning a multi-year maintenance cycle, the most successful outcomes are those built on shared knowledge, a commitment to continuous improvement, and marginal gains adding up to a larger whole.
Turnarounds will always be challenging. But with the right approach, they can also be transformative in unlocking new efficiencies, reducing emissions, and strengthening the resilience of Europe’s petrochemical industry. In this evolving landscape, refinery stakeholders who embrace strategic planning, engage early with expert partners, and prioritise sustainability will be best positioned to thrive.
1. BEACHAM, W., and BERRY, C. D., ‘Cracker closures: facing the inevitable’, Independent Commodity Intelligence Services, https://www.icis.com/ explore/resources/cracker-closures-europe/#:~:text=Europe’s%20 ageing%20cracker%20fleet%20and,times%20the%20figure%20 for%20China.
2. ‘Cracking the labor productivity conundrum in the chemical industry’, Accenture, (29 May 2024), https://www.accenture.com/gb-en/insights/ chemicals/labor-productivity-chemicals
3. ‘Industry report: Rebalancing the Energy Transition’, Aggreko, https://www.aggreko.com/en-gb/resources/rebalancing-theenergy-transition?utm_medium=feature&utm_source=pr&utm_ campaign=wprturnarounds&utm_content=june%202025&utm_ term=hydrocarbonengineering