13 minute read
Tackling unusual desalter challenges


fuels specifications, companies that supply the fuels are being pushed to revamp existing facilities or construct grassroots refineries to meet increasing demand for cleaner burning and environmentally-friendly gasoline.
Alkylate serves as a viable solution for meeting the stricter gasoline regulations and, therefore, will likely make up a larger portion of the future gasoline pool in countries outside of the US.
The economics of alkylate
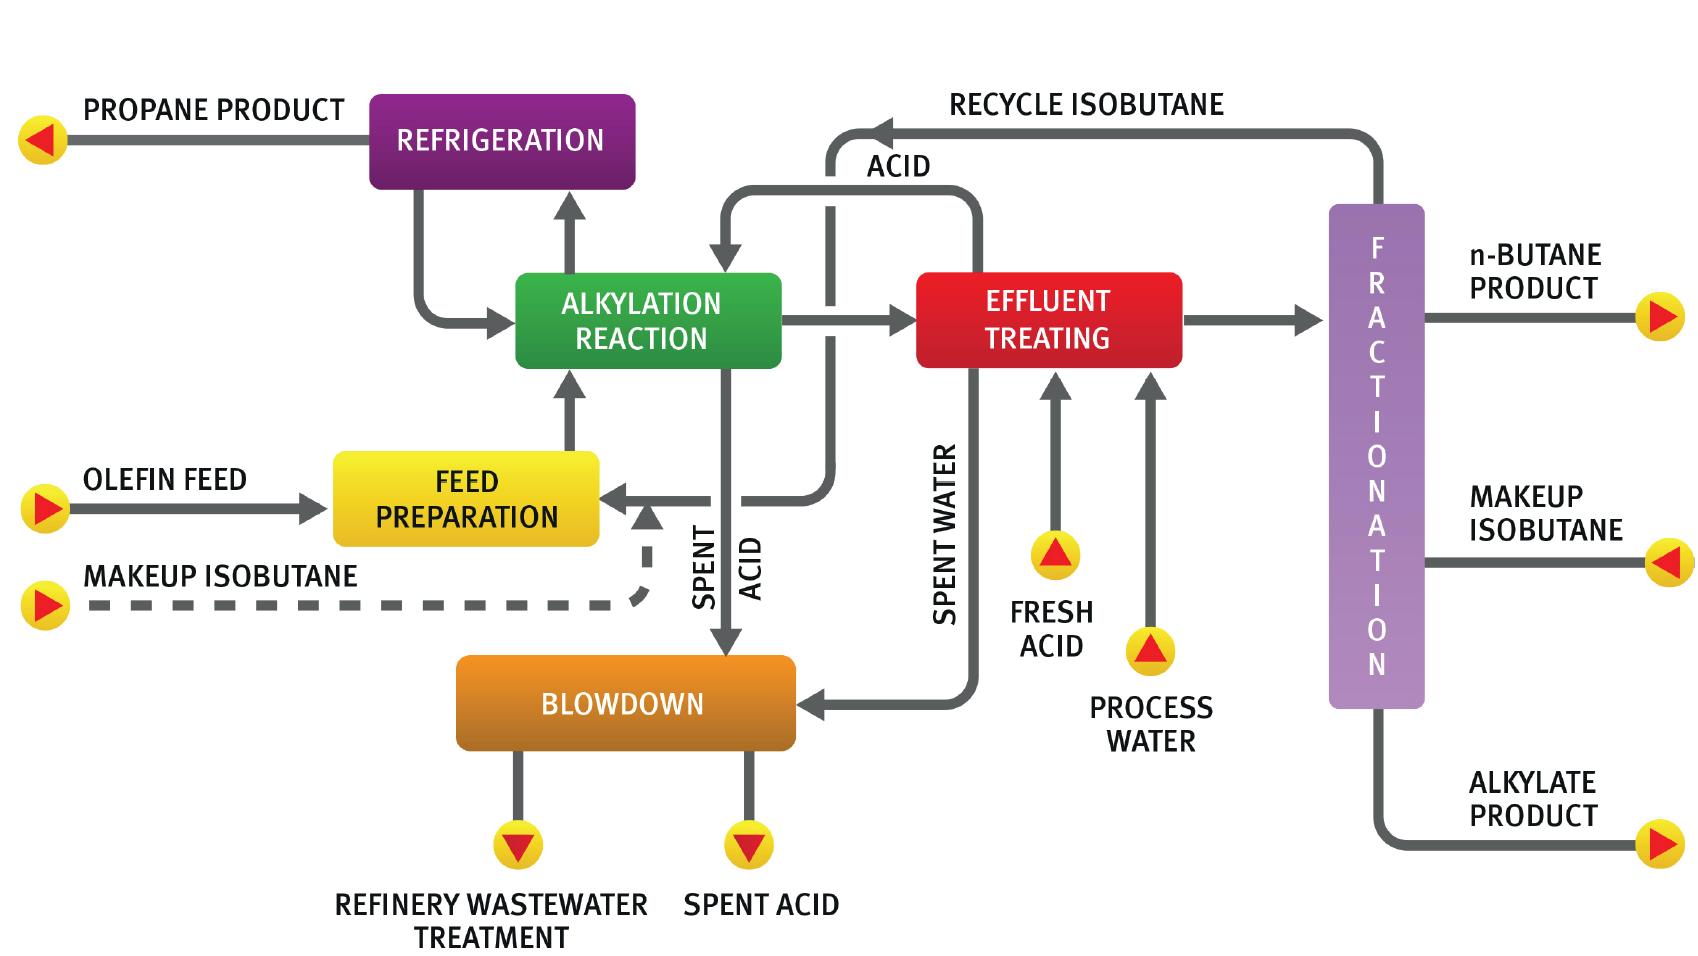
Figure 5. STRATCO® alkylation process.
Under current market conditions including rationalisation of global capacity, the alkylate produced in the alkylation process offers refiners high margins, reflecting the upgraded value of the refinery’s gasoline stream. At the same time, the feedstocks used for alkylation – butylene, amylene or propylene from the refinery’s fluid catalytic cracker, and isobutane sourced from the cracker, reformer, or distillation column – are of greater value as alkylate than they are if used for other applications such as LPG. Alkylation may therefore provide an improvement on gross margins compared to the use of an MTBE unit. Rather than purchasing methanol to make MTBE, refiners can use isobutane to produce a larger volume of alkylate. Similarly, refiners can direct propylene and butylene that are currently supplied to a polymerisation unit, towards an alkylation unit instead, for an even greater yield per volume of olefin (see Table 1). Figure 6. Global shift in gasoline composition by region, 2020. In a new plant, or one without an existing MTBE or poly unit, it is necessary to consider the product requirements such as regulations, Table 1. Yield comparison site-specific octane margins, and economics, in order to decide MTBE Polymerisation Alkylation which methodology is most appropriate for octane enhancement and low-sulfur gasoline production.
Yield vol. (C5+ gaoline from reacted olefin) Conclusion
1.25 0.83 1.78
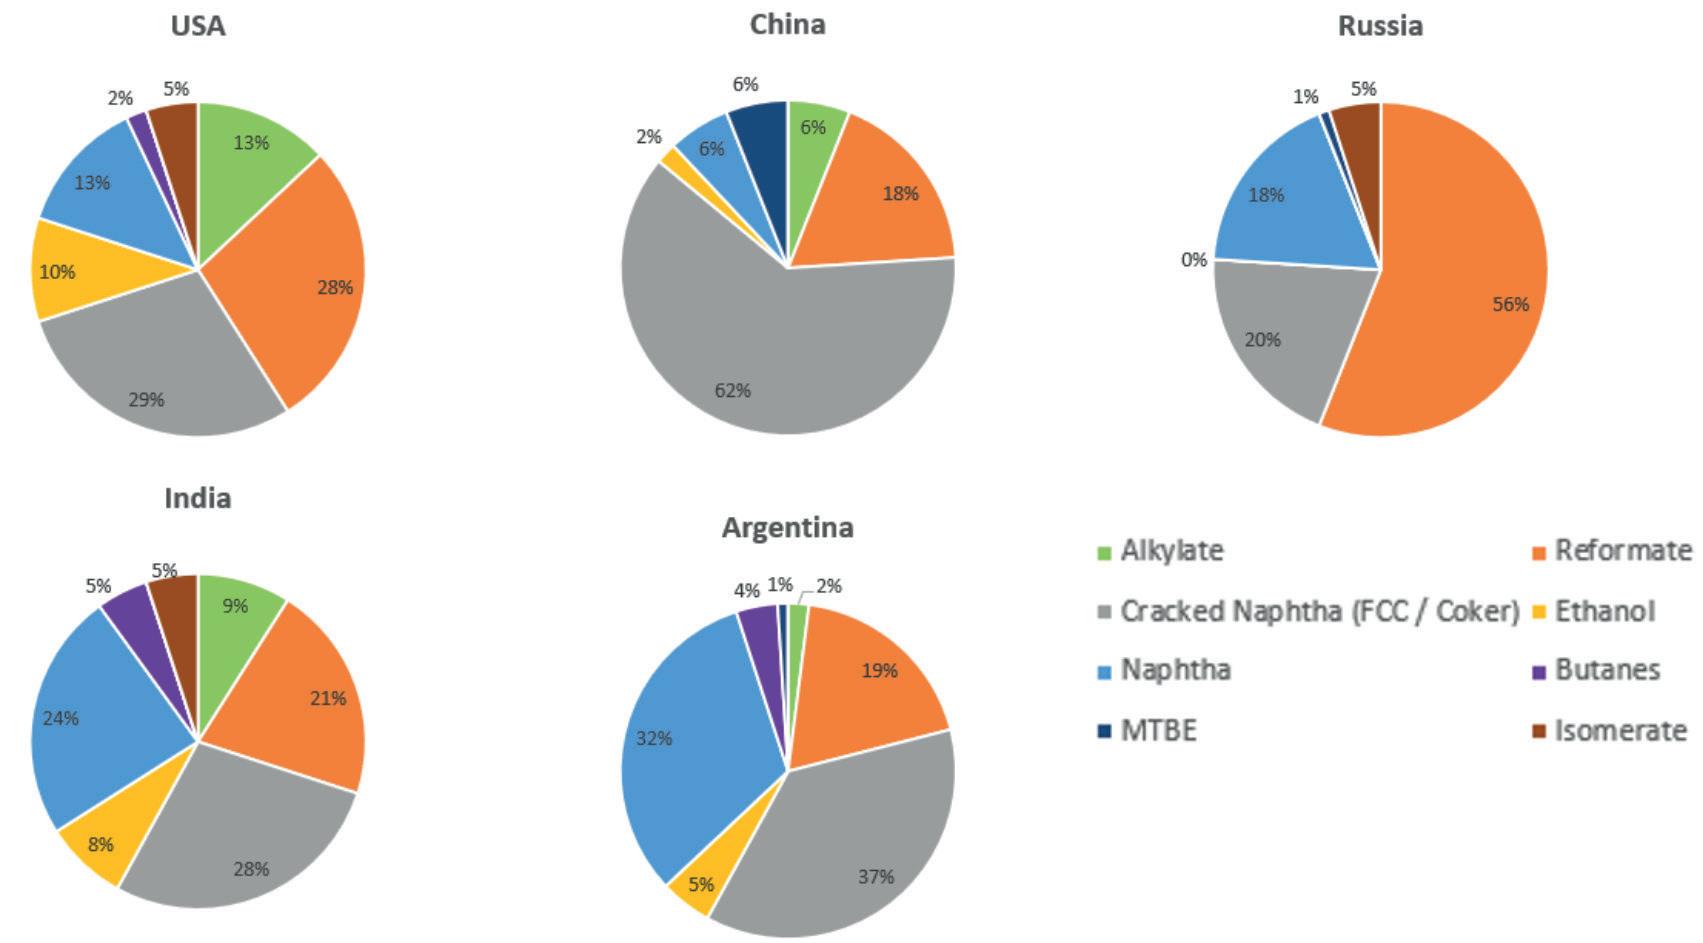
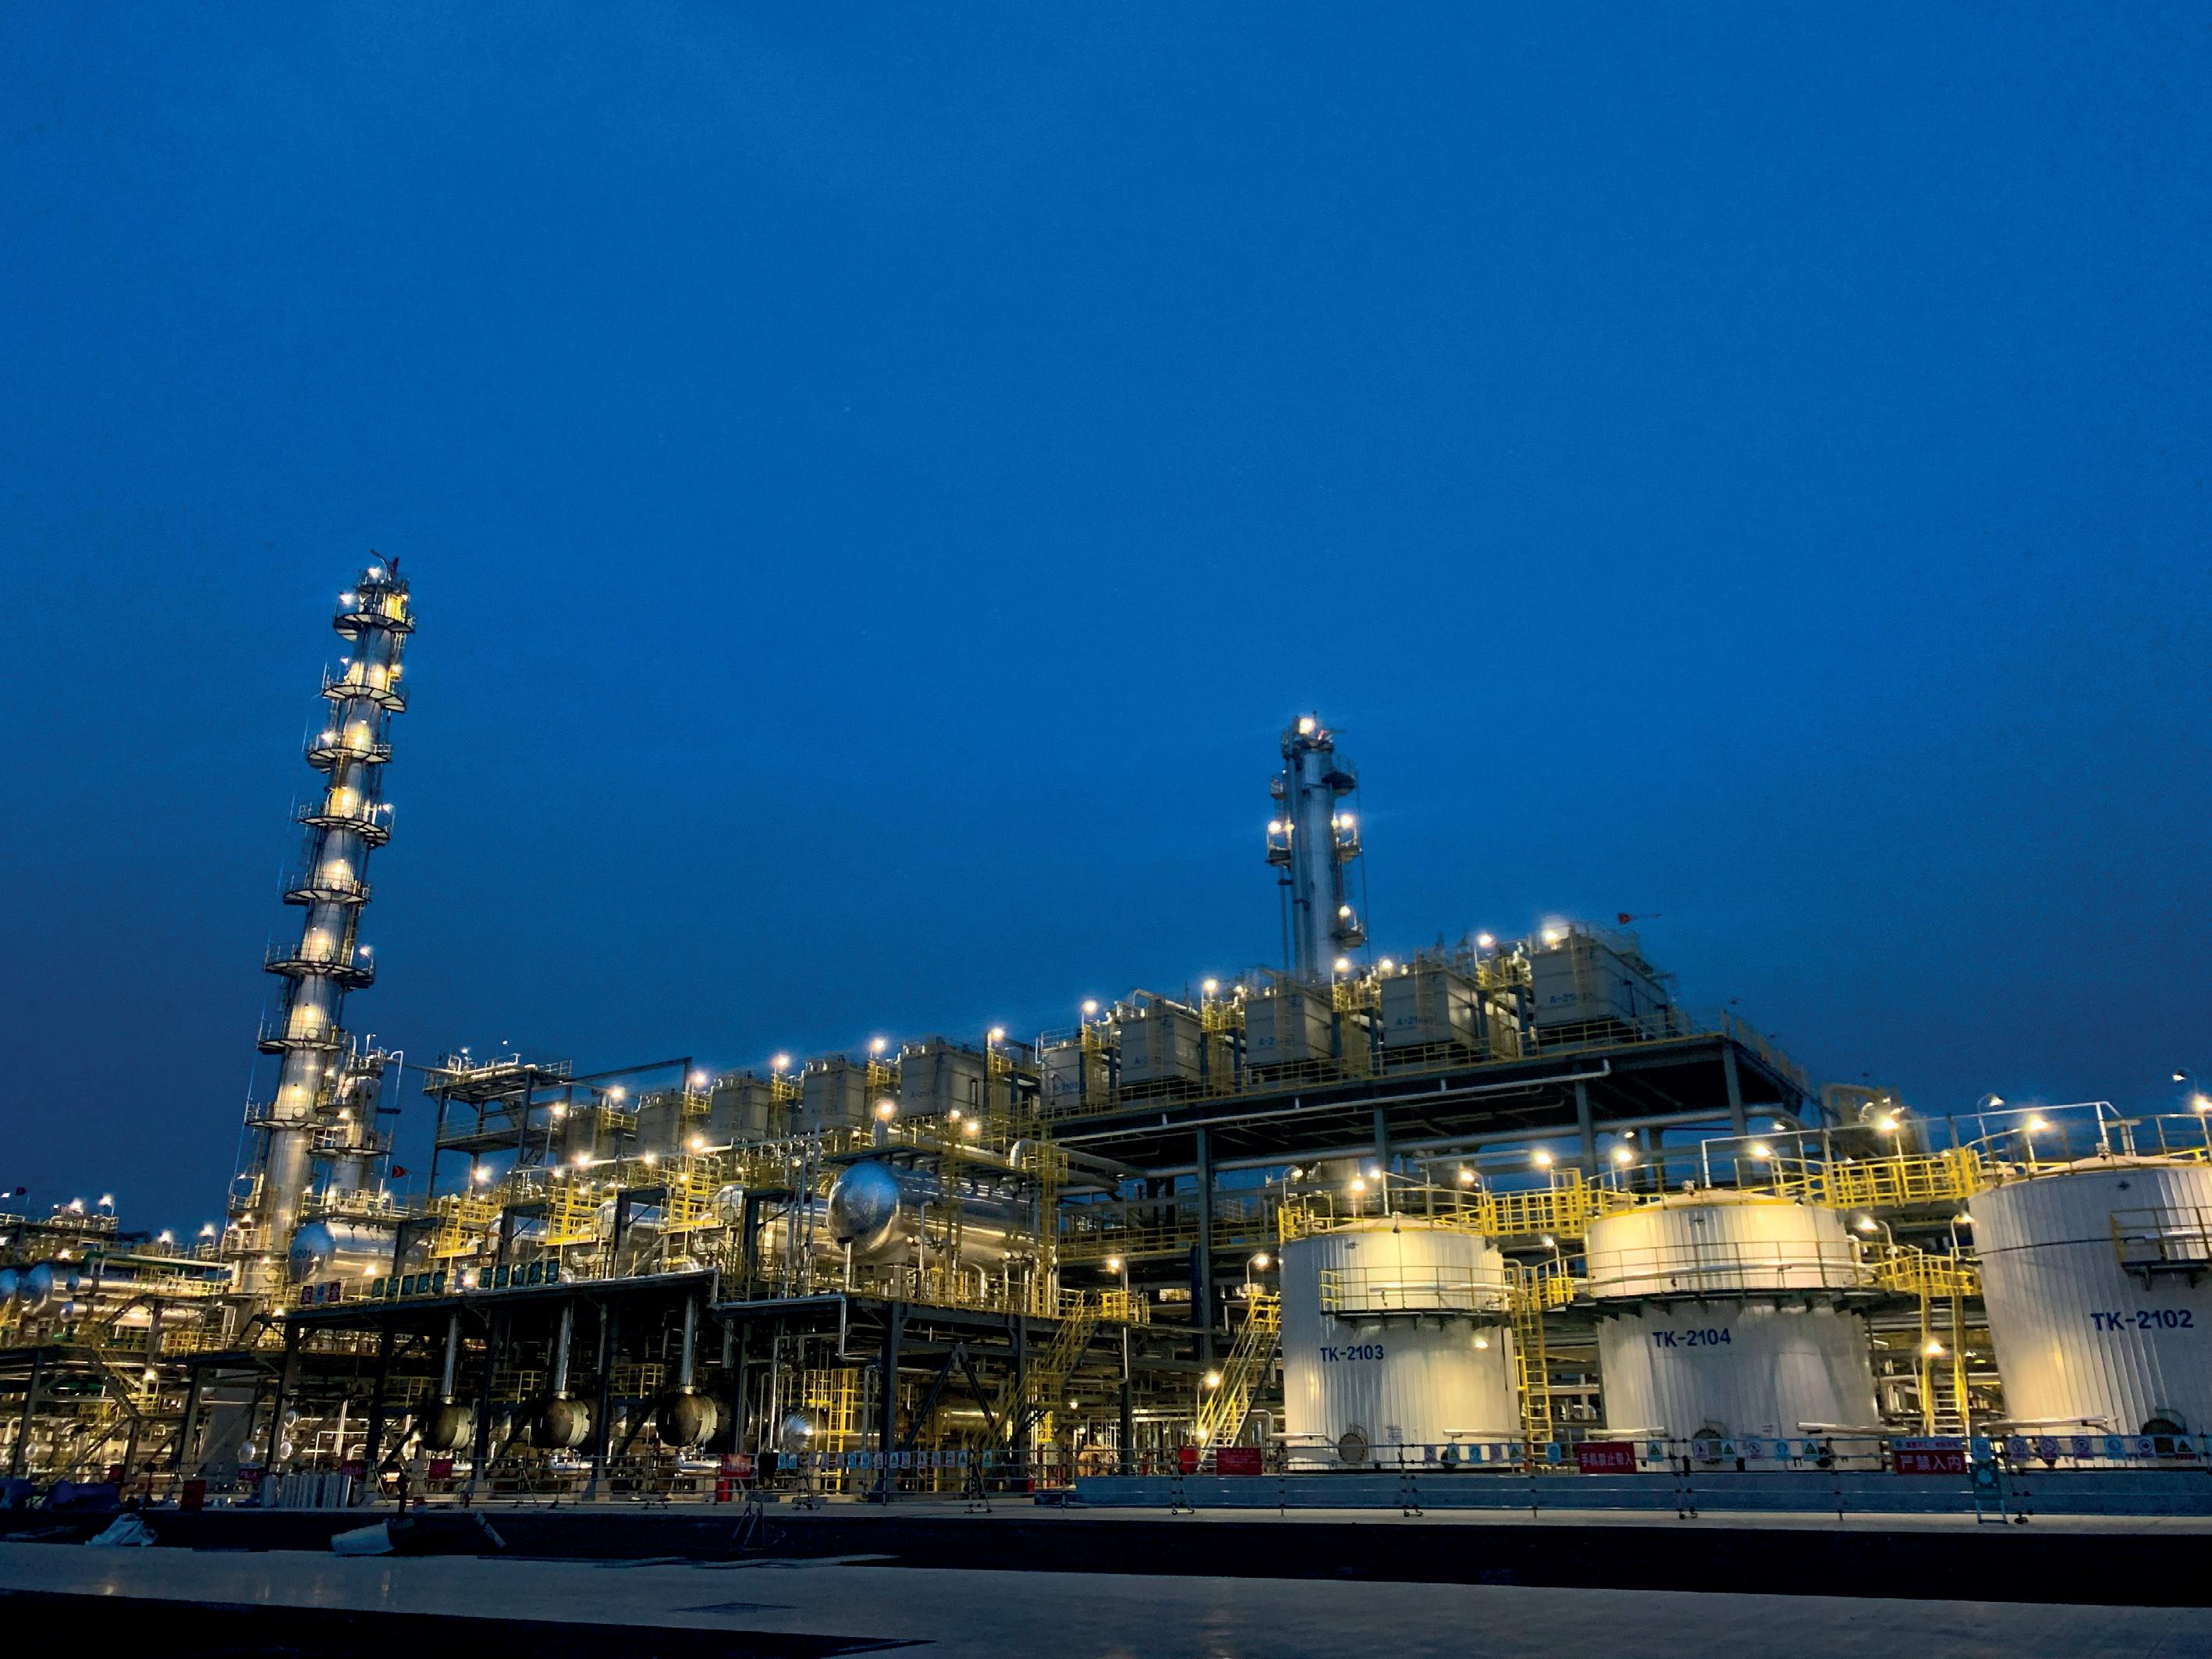
Figure 7. STRATCO alkylation unit. While gasoline alternatives will increasingly come onstream in the next few decades, there will be growing demand for cleaner conventional fuels. Refineries are already adapting. As alkylation is one of the more attractive options for meeting new fuel requirements, this market segment is set to grow.
Since the turn of the century, refiners have overwhelmingly selected sulfuric vs other alternatives such as hydrofluoric acid (HF), solid or ionic liquid acid catalysts when building new alkylation units.
With over 80 years of alkylation research and process design, along with extensive experience in optimising, troubleshooting and analytical testing at customer sites, Elessent has licensed more than 100 STRATCO alkylation units worldwide (see Figure 7), with a combined capacity in excess of 915 000 bpd.
References
1. Stratas Advisors, (December 2021). 2. Stratas Advisors, (May 2021), www.stratasadvisors.com 3. Stratas Advisors, ‘Global Alkylate Outlook’, (February 2021).
Wole Olowu and Tim Oubre, Athlon, a Halliburton Service, USA, offer solutions to some unique desalter challenges that the company has helped refiners to overcome.

For many desalter challenges, there is a proven solution to mitigate the impact on a refinery’s performance and economics. Whilst troubleshooting, companies’ operations teams are often taught the following: when you hear hoofbeats, think horses not zebras. However, once in a while there are zebras. This article details some of the most difficult situations that Athlon team members have encountered over the years, which may offer a solution to the reader’s unusual desalter challenges.
Case one: three phases in a desalter
Challenge
It is very unusual for a desalter to have three phases. Usually, there are only two – oil and water, with an emulsion between the two phases. In Figure 1, clean water is seen at the 3 ft and 2 ft, 6 in. try-lines, but the desalter effluent from the bottom of the vessel shows 10% oil.
In this example, the plant assumed (and had been told by the chemical supplier) that there was heavy oil and/or asphaltenes in the brine. A sample and extraction of the oil in the effluent with heptane revealed that the oil was heptane soluble, which eliminated asphaltenes as the culprit. Somehow, oil was transferring through the water phase to the effluent.
Solution
A skin temperature profile was conducted on the vessel, using corrosion inspection ports on the insulation. Skin temperature vs desalter oil temperature suggested significant mud buildup. A continuous bleed of the two bottom try-lines for approximately 30 minutes eventually
yielded oily water. An extended mud wash of the desalter, employing 50% of the mud wash header at a time, removed a significant amount of solids. Clear water was eventually re-established in the effluent.
Cleaning and inspection of the desalter three months later revealed a large buildup of solids at each end of the vessel, as suspected from the skin temperature profile. The zone around the sample taps for the try-lines had a large, hollow depression carved out of the solids, creating a ‘stilling well’. The three-phase situation was created by a dead zone at the end, near the sample points that allow free water to separate in this large quiescent zone, resulting in a false sample reading. By mud washing, additional water residence time was provided for the oil and water to separate in the desalter, resulting in oil-free effluent.
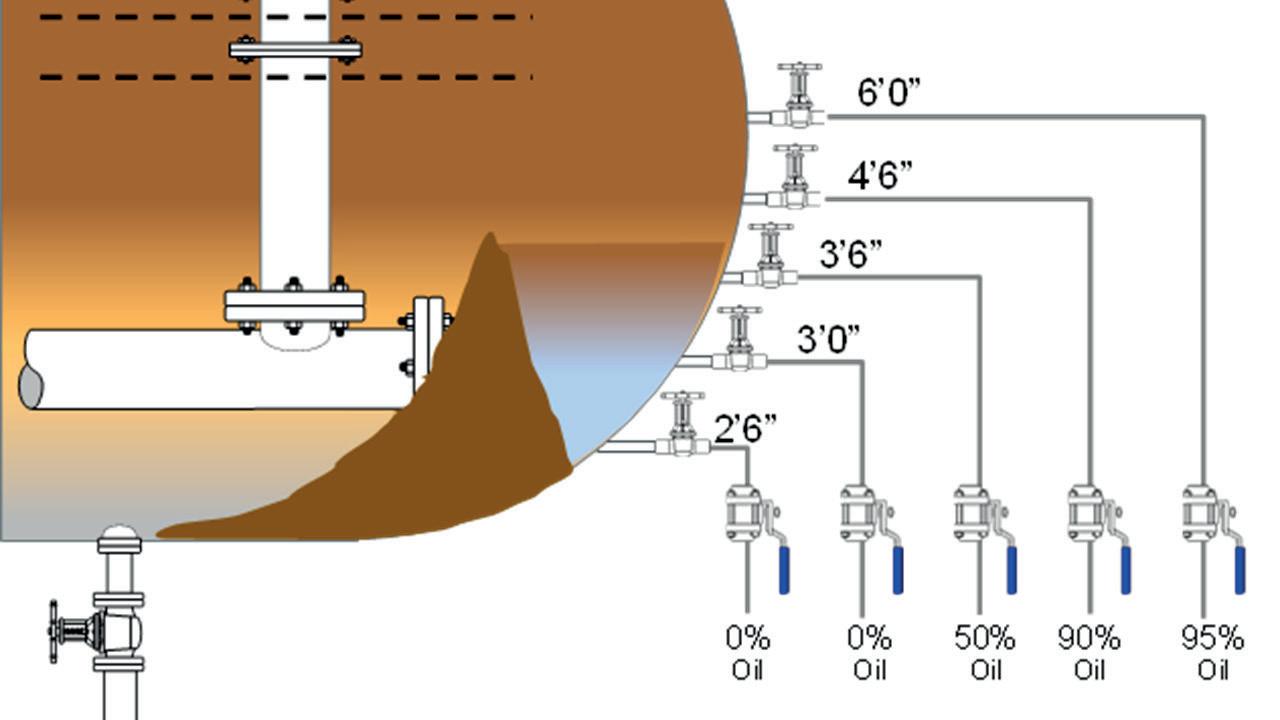
Figure 1. Oily water was being drawn from the bottom of the desalter, containing 10% oil despite samples 2 – 3 ft higher in the vessel showing clean water.
Figure 2. Lower temperatures on the end valves indicated plugged valves and buildup in the desalter, resulting in a vortex over the two unplugged valves, which drew oil into the effluent brine.
Case two: plugged valves created a vortex
Challenge
The bottom two try-lines were running clean water, but the effluent water consisted of 5 – 10% oil more than 75% of the time on average.
It is typical for desalters that have been modified with new internals to have the water draw header removed and the water draw flush with the bottom of the vessel. It is not typical for desalters to have vortex breakers as part of their design. The first step in troubleshooting oily effluent is to carry out a temperature survey of each of the water draw valves to check for any plugging.
Solution
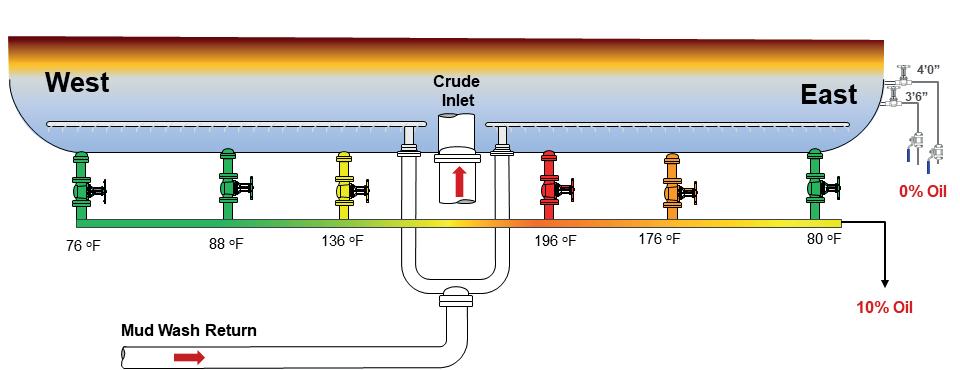
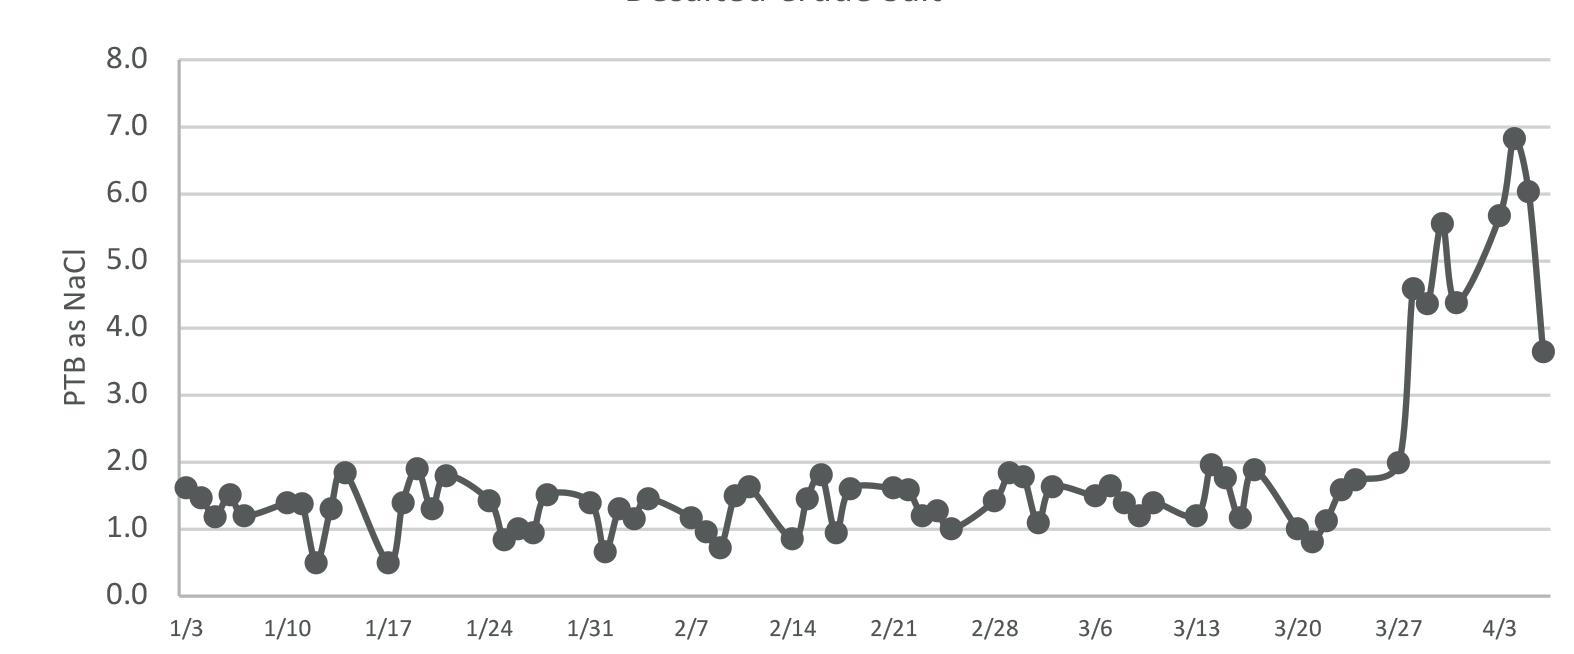
Figure 3. Over a period of approximately one week, the salt content in this refinery’s desalted crude increased to near 7 pounds per thousand barrels (PTB) from a normal 1 – 2 PTB. The temperature readings of the valves on the end of the desalter were up to 125°F cooler than the bulk oil temperature. As the team moved closer to the middle of the desalter, the temperature of the valves rose, indicating more activity and flow.
Three of the valves were completely plugged and one was restricted. With a flow that is supposed to go through six valves only going fully through the two right of the desalter’s centre (see Figure 2), a vortex was created.
The process is similar to water draining from a bathtub. If it is drained too fast or faster than the drain line can handle, it can create a whirlpool at the drain, pulling in air with the water. The energy of all of the brine flowing through two of the six lines was sucking a little bit of oil out of the interface, leaving the desalter in the effluent water.
The team performed a mud wash and also blocked in several of the valves at a time to force out the buildup in the plugged valves. They cleared all of the valves except for those on the end, which had too much buildup. However, once the middle four valves were opened up to good flow, the effluent cleared up.
Case three: maintain material balance
Challenge
Routine analysis showed that the salt content in the refinery’s desalted crude was rising (see Figure 3). Water carryover was less than 0.3%, mix valve settings were within control ranges, and no changes in crude slate or wash water quality or quantity were noted.
Solution
It took a few tests to identify the problem, as this is not normally expected. First, with no excess water carryover, the wash water rate and mix valve pressure drop were increased.
Second, a material balance was performed to compare how much salt the crude was giving up and wash water was being taken on. This did not reveal an obvious issue. Material balance closure error was within 7%. Testing the wash water rate with an external flow meter indicated that the flow to the oil was good.
Finally, the team took a sample downstream of the mix valve, performed a water spin-out, and found that only 2.5% water was entering the valve mix, even though the flow meter indicated that 5 – 6% was being added into the system. Approximately two-thirds of the wash water was getting lost somewhere between the wash water pump, the flow meter, and the desalter.
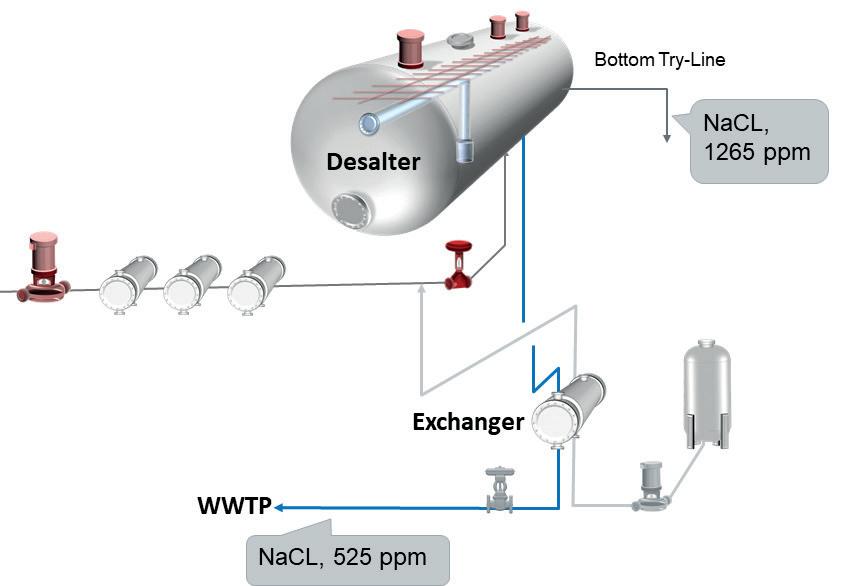
A measurement of the chlorides in the desalter’s bottom try-line measured 1265 ppm, and the brine water after the exchanger measured 525 ppm (see Figure 4). This helped the team to determine that the brine water vs fresh wash water exchanger had exchanged more than just heat between the two water streams. It was assumed that there was a significant leak.
Based on the flow meter and water spin-out, as well as the chloride dilution from 1265 ppm to 525 ppm, it was determined that two-thirds of the wash water was bypassing the desalter. This significant leak was causing the poor salt removal.
The exchanger was bypassed and checked for leaks. Significant general corrosion created failures in at least 40 tubes, with pressure testing resulting in an additional 80 tubes requiring plugging. The bundle was returned to service until a replacement could be delivered and installed.
In all of their years of collective experience, Athlon’s team members have rarely seen a leak in this exchanger service as sudden and significant as this refinery experienced. The current best practice is to sample and test the bottom try-line for chlorides once a month and compare the chloride content to desalter effluent chloride levels.
Case four: control valves created too much shear
Figure 4. A measurement of the chlorides in the desalter’s bottom try-line measured 1265 ppm, while the water after the exchanger contained 525 ppm, demonstrating that something was diluting the water leaving the desalter.
Figure 5. Water in the desalted crude rose to more than 1% after start-up, when the flow control valves over-sheared the emulsion at a lower charge rate. Challenge
Before a crude unit was shut down for a turnaround, it was running at its targeted crude charge rate of approximately 150 000 bpd. When restarting after the turnaround, the charge rate to the unit was initially set at 90 000 bpd, with a plan to ease back up to normal operations. During routine testing after start-up, it was observed that the water content remaining in the desalted crude was much higher than normal. Levels ranged from 0.6 – 0.8% instead of 0.1% (see Figure 5). This was a big and costly problem, as the refinery was losing valuable revenue every day that it could not return to its pre-turnaround charge rate.
Solution

After a review of all of the mechanical changes made during the turnaround, and any procedural changes to identify potential problems, a specific change
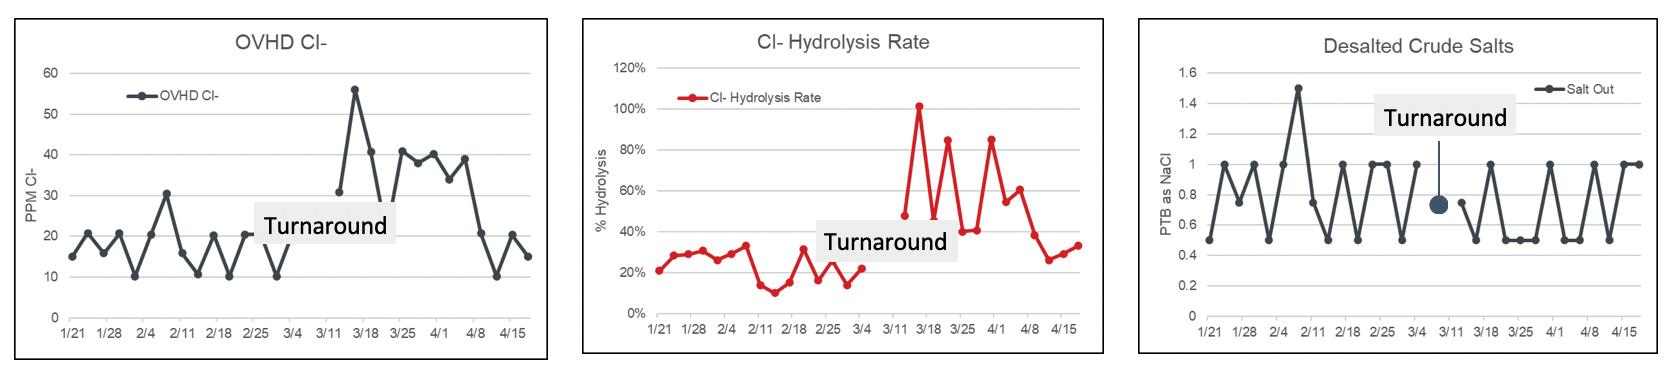
Figure 6. After a turnaround, the chlorides measured in the overhead and hydrolysis rate were significantly higher than pre-turnaround values. The desalted crude salts, however, were in line after start-up.
to control the flow at the lower crude charge rate was identified.
The refinery in question injects all of its desalter wash water upstream of the crude preheat train. Single stage desalting and an undersized brine water exchanger made this an effective way to increase mixing and reduce overhead chlorides. This process change had been made since the previous turnaround. Part of the change modified the start-up procedure so the water was to be injected into the desalter mix valve until the charge rate of 150 000 bpd was established.
After full rates were reached, the wash water was then to be switched to the frontend of the preheat train. This water wash injection was located between the crude charge pump and the flow control valves. The pressure drop through the control valves at 90 000 bpd created an emulsion that could not be resolved in the single-stage desalter. The water was diverted to the mix valve for three days as the charge rate was increased, and the water carryover decreased to less than 0.2%. Once up to full charge, the water was then returned to the frontend of the preheat and dehydration remained at less than 0.1%.
Another lesson to learn from this case is to ensure that the operations teams and supporting vendors review turnaround and start-up procedures. Diverting the water to the mix valve at start-up was already documented in the procedures.
Case five: high hydrolysis rate caused by an open isolation valve
Challenge
After a brief turnaround, a refinery’s desalted crude numbers were within control ranges, but the chloride numbers in the overhead were twice the KPI limit of 20 ppm. This was also reflected in a high hydrolysis rate, which is the percentage of chlorides coming out of the desalter compared to what is measured in the overhead (see Figure 6). The hydrolysis rate was so high that it did not make sense. There was no reason for it to be that high.
Solution
Athlon’s team reviewed the system after start-up. The sample point for the desalted crude was checked, as was the overhead water sample. The desalter had been isolated during the turnaround to repair an entrance bushing. The desalter was isolated and bypassed with two block valves and a bypass valve and associated piping. Inspection of this bypass valve showed that it was partially open. It had not been fully closed after start-up.
The sample point was upstream of where the bypass line joined up with the desalted crude. As a result, a portion of the raw crude was bypassing the desalter, resulting in a higher amount of salt in the desalted crude than in the sample, which was inside the bypass loop. It was reported that 1 lb of salt remained in the desalted crude, when it was actually closer to 3 – 4 lb.
Once the bypass valve was fully closed, chlorides in the overhead came down and the hydrolysis rate returned to a believable range.
Conclusion
Athlon’s toolkit of process treatment solutions is stronger because of these difficult desalter experiences. The company leverages and builds on them each time that it collaborates with teams and customers, as it does not want customers to face challenges such as these. Steady-state operations is always the goal, but it is important to provide support to clients that require a solution.
The following checklist summarises the key take-aways from these unusual desalter situations: n If three phases are being drawn from a desalter (oil, emulsion and water), something is wrong. n Low desalter water draw valve temperatures can indicate plugged valves and solids build-up within the desalter. n Leaky water exchanger tubes can impact desalter performance. n Flow control valves create tremendous shear. They are not mix valves. When used, they can result in an emulsion that is hard to break. n Review shutdown, turnaround and start-up procedures, especially if they have changed since the previous start-up. n Document turnaround activities for a complete start-up checklist and a breadcrumb trail to follow when something goes wrong.
Acknowledgement
The authors would like to thank Harold Eggert, John Jacobson, Jim Devine, Chip Aloisio, Wesley Teasdale, Fred Brown and other process treatment experts, whose experience and expertise over the years have helped prepare this article.


