13 minute read
US fuels emerging from the pandemic


WORLD NEWS
DIARY DATES
13 - 15 March 2022
AFPM Annual Meeting
New Orleans, Louisiana, USA www.afpm.org/events
13 - 15 April 2022
24th Annual International Aboveground Storage Tank Conference & Trade Show
Orlando, Florida, USA www.nistm.org
09 - 11 May 2022
Sulphur World Symposium
Tampa, Florida, USA www.sulphurinstitute.org/symposium-2022
09 - 13 May 2022
RefComm
Galveston, Texas, USA www.events.crugroup.com/refcomm
23 - 25 May 2022
StocExpo
Rotterdam, the Netherlands www.stocexpo.com
23 - 27 May 2022
World Gas Conference
Daegu, South Korea www.wgc2022.org
24 - 26 May 2022
Asia Turbomachinery & Pump Symposium
Kuala Lumpur, Malaysia atps.tamu.edu
07 - 09 June 2022
Global Energy Show
Calgary, Alberta, Canada www.globalenergyshow.com
08 - 09 June 2022
Downstream USA 2022
Houston, Texas, USA www.reutersevents.com/events/downstream
13 - 15 June 2022
ILTA International Operating Conference & Trade Show
Houston, Texas, USA www.ilta.org
22 - 26 August 2022
ACHEMA
Frankfurt, Germany www.achema.de
Singapore | Shell to supply SAF
Shell has announced that it has become the first supplier of sustainable aviation fuel (SAF) to customers in Singapore.
The company has also completed upgrades of its facility in Singapore, which will enable blending of SAF.
Currently, SAF is only approved for use in aircrafts when it is blended in a ratio of up to 50% with conventional jet fuel. Having a blending facility in the region enables a more efficient operation by moving neat SAF in bulk from production sources to the blending facility, and then delivering blended SAF parcels to where it is needed.
The announcement represents a significant milestone for the aviation industry in Asia, as the enhanced SAF supply chain capabilities will increase customers’ access to SAF.
The SAF supplied is made from waste products and sustainable feedstocks, and will be blended with conventional jet fuel. The first batch is blended in Europe and aims to test and verify the supply chain for SAF that Shell has established in Asia. The SAF is being supplied by Shell Aviation, as part of its supply agreement with Neste – the producer of SAF. Shell is seeking to commence blending at its Singapore facilities for subsequent batches.
Egypt | Coalition of energy companies to decarbonise downstream facilities
Acoalition of energy transition leaders – Bechtel, Enppi, Petrojet, GE, Baker Hughes, HSBC, and the National Bank of Egypt – have signed a Memorandum of Understanding under the auspices of Tarek El Molla, Egyptian Minister of Petroleum and Mineral Resources, in Cairo, Egypt.
The coalition will provide execution, technology and financing expertise for a new initiative to support the decarbonisation of select downstream facilities in Egypt, aligning plans with the country’s leadership of the COP27 UN Climate Change Conference 2022.
USA | US demand for residual fuel oil rose late in 2021
In November 2021, more residual fuel oil was consumed in the US than during any month since January 2017 (measured as product supplied), reports the US Energy Information Administration (EIA). Residual fuel oil has several uses, but it is primarily consumed as bunker fuel in the maritime shipping sector.
Consumption in December 2021 was at its highest end-of-year level since 2012, according to the EIA’s ‘Weekly Petroleum Status Report’ (WPSR).
The increase in residual fuel oil demand comes with record increases in maritime shipping volumes and rising high-sulfur fuel oil prices in Singapore.
The Singapore market is a global benchmark for marine shipping. Since the beginning of November 2021, Singapore’s very-low-sulfur fuel oil price premium over high-sulfur fuel oil increased to more than US$20/bbl and neared US$30/bbl throughout December 2021 and January 2022.

Nancy Yamaguchi, Contributing Editor,
explores the state of the US fuels market as the country begins its slow climb back from the COVID-19 pandemic.

The COVID-19 pandemic caused a tectonic shift in the US national economy and its energy market. At the time of writing this article, nearly two years have passed since states announced stay-at-home orders to combat the spread of the coronavirus. The country launched drastic and immediate changes in consumer behaviour, business practices, fuel use, and every facet of economic and social life. In contrast, pulling out of the pandemic is proving to be a lengthy process, with stretches of optimism alternating with surges in infections. No one is exactly sure when it will be formally over. The only certainty is that ‘business as usual’ will not look like it used to. Some economic and behavioural changes will be long-term and structural, and businesses and individuals must adapt.
One of the most momentous changes is the increased use of telework. This must be assumed a permanent change, though the extent will vary from place to place. Many major firms are adopting hybrid working schedules that split time between home and headquarters. Some companies have noted that failure to offer this flexibility limits their ability to attract and keep talented people. It must also be assumed that consumers will retain some aversion to person-to-person interaction in shopping, dining, entertainment and travel. These factors will have profound impacts on fuel demand.
Indeed, forecasting demand for fuel and energy has become far more complicated, and even small variations in the modelling assumptions can result in huge changes in what can be expected for gasoline, diesel and jet fuel demand.
This article examines recent trends in US refining and demand, emphasising the rapid downturn caused by COVID-19 and the slow climb back. The US refining industry is large and sophisticated, but it finds itself in a reactive phase. Refiners are raising throughput in response to market signals, but they are aware that demand has not been fully restored. In the future, demand for petroleum fuels may grow incrementally, and it is possible that demand will shrink.
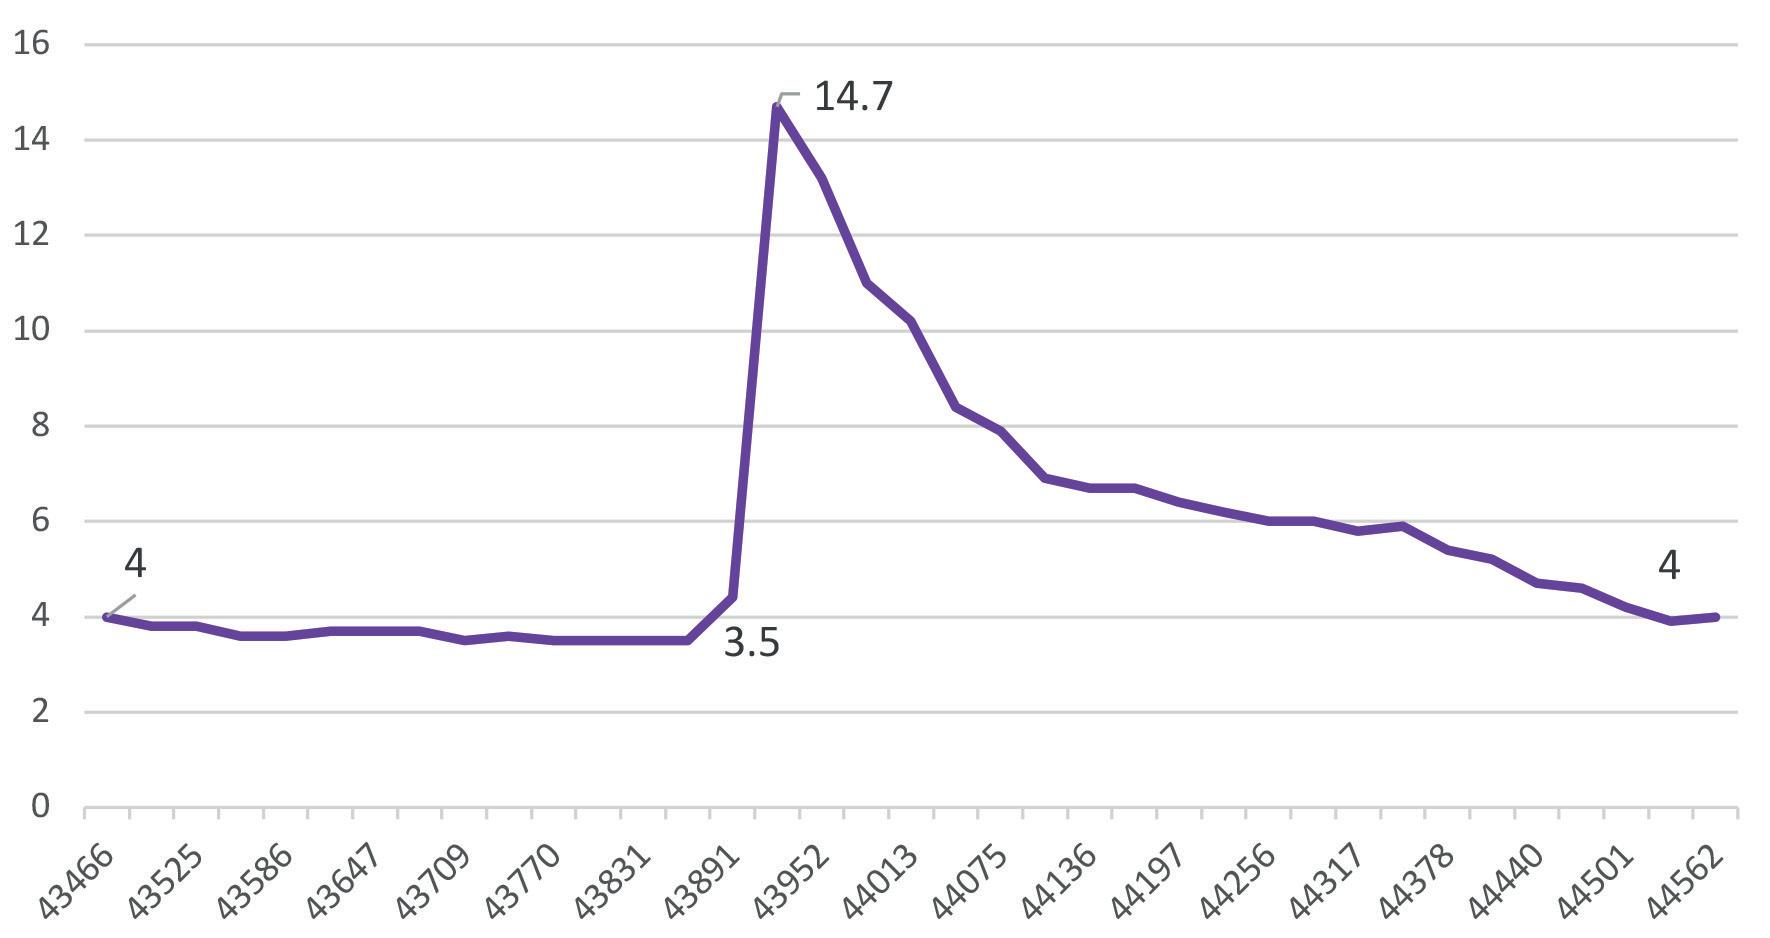
Figure 1 illustrates how the COVID-19 pandemic caused the US unemployment rate to skyrocket, followed by a slow downward path. The pattern is analogous to a swift onset of a disease followed by prolonged recovery, an analogy that will be carried forward in this article in the discussion of refinery behaviour and fuel demand.
The US unemployment rate shot up from 3.5% in February 2019 (one of the lowest rates in history) to 14.7% in April 2019. It then took 20 months until the unemployment rate retreated to 3.9% in December 2021, and the rate increased slightly to 4% in January 2022. The US Bureau of Labor Statistics (BLS) reports unemployment rates stretching back to 1948, and the double-digit rates experienced in the April, May and June 2019 period were the worst in history.1
US refining: capacity changes and inputs
The US refining industry is large and mature, having survived several downturns and phases of rationalisation and downsizing. The challenging work had been done, it seemed. Utilisation rates were respectable, and capacity was creeping up modestly. Then the COVID-19 pandemic hit, and utilisation and capacity retreated. At the beginning of 2021, there were 129 operable refineries in the US with a total crude capacity of 18.1 million bpd. Relative to 2020, this was down by five refineries totalling 0.8 million bpd of crude capacity. The closures included the 335 000 bpd Philadelphia Energy Solutions refinery in Philadelphia, Pennsylvania. This refinery was severely damaged by explosions and fire in October 2019, and the decision was made to close the facility rather than to make investments to repair it, or to find a buyer. The following recent refinery closures were also motivated by the COVID-19 pandemic: n The 27 000 bpd Western Refining refinery in Gallup, New Mexico. n The 161 000 bpd Tesoro (Marathon) refinery in Martinez, California. n The 19 000 bpd Dakota Prairie Figure 1. COVID-19 and the US seasonally-adjusted unemployment rate, % (source: US Bureau of Labor Statistics [BLS]). n refinery in Dickinson, North Dakota. The 48 000 bpd HollyFrontier refinery in Cheyenne, Wyoming. n The 211 146 bpd Shell refinery in Convent, Louisiana. In 2019, US refiners processed an average of 19.371 million bpd of crude oil and other refinery feedstocks. This dropped by 14% to 16.566 million bpd in 2020. Refinery runs rose to 17.661 million bpd during the January to November period in 2021, which was 91% of its 2019 level. The industry is ramping back up, but not yet to pre-pandemic levels. Figure 2 shows the impact of the pandemic on fresh feed inputs to four key downstream refinery technologies: Figure 2. US downstream fresh feed inputs, 2020 and 2021 as % of 2019 catalytic reforming, catalytic cracking, (source: US Energy Information Administration [EIA]). catalytic hydrocracking, and coking. Essentially, all medium and large
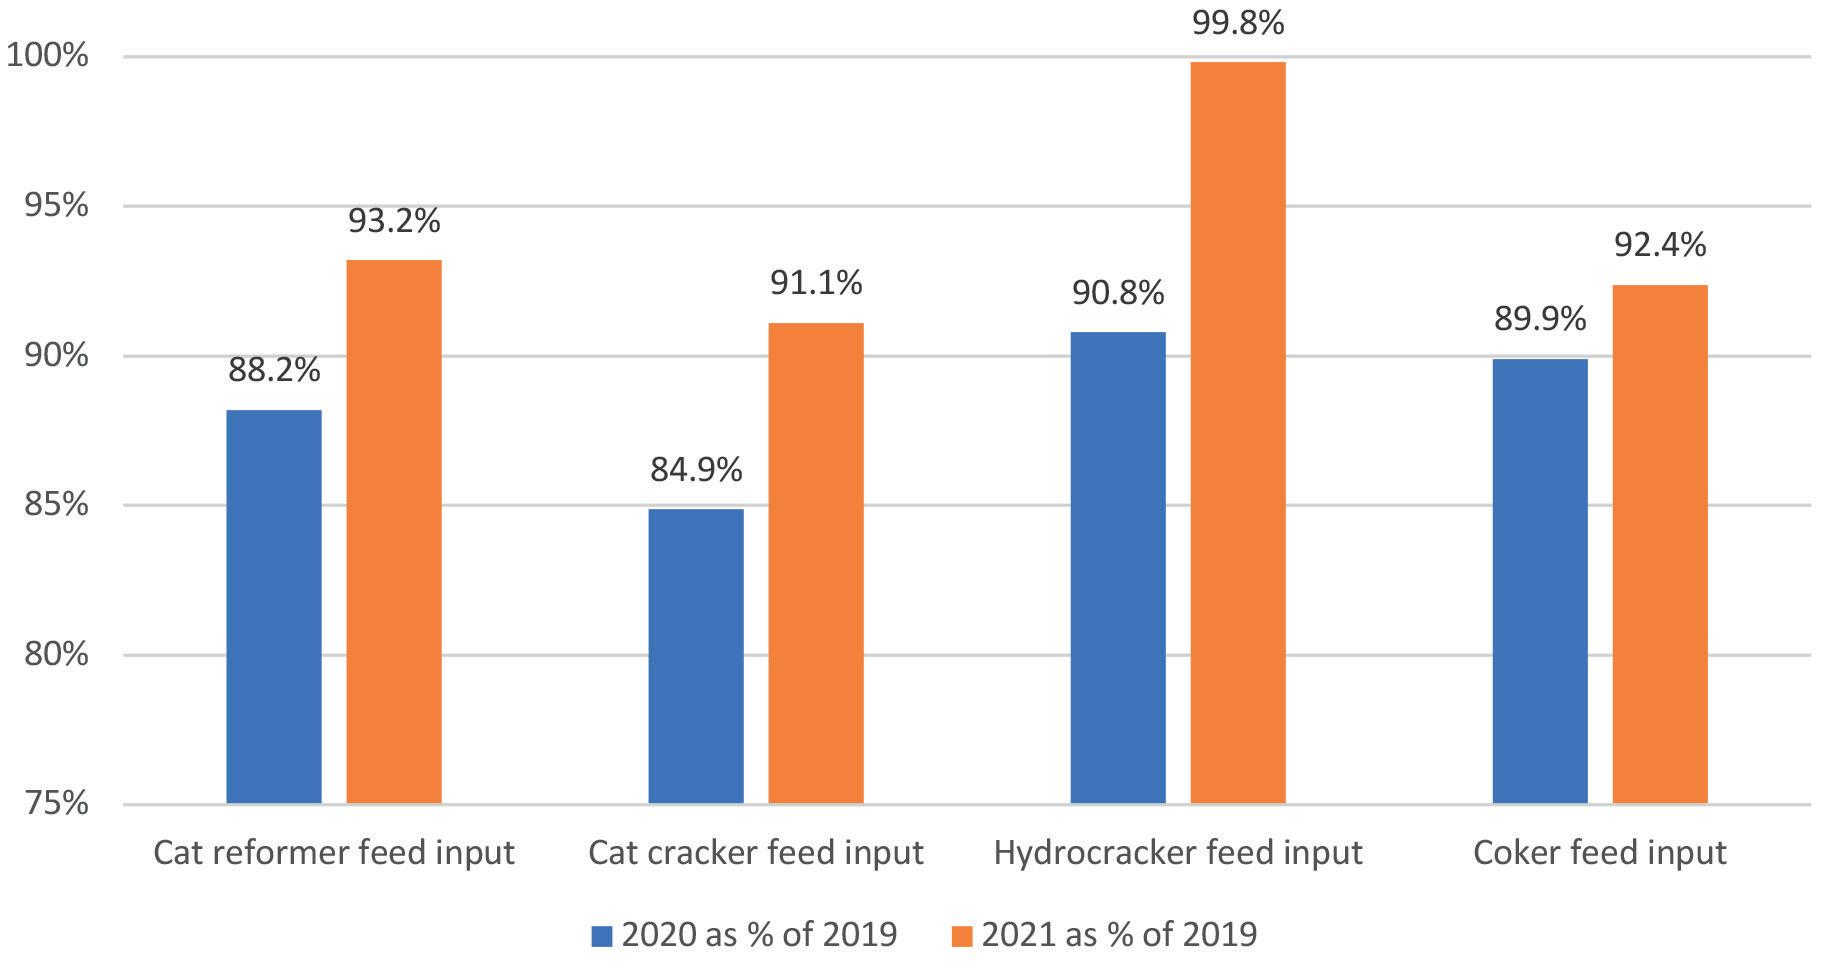
refineries in the US use some combination of these technologies, and some have all four in place (including major refineries in Texas, Louisiana, California and Indiana). In 2020, fresh feed inputs to catalytic reformers fell to 88.2% of their 2019 levels. Fresh feed inputs to catalytic crackers fell to 84.9% of their 2019 levels. Hydrocracker feed inputs fell to 90.8%, and coker feed inputs fell to 89.9%. In the January to November 2021 period, fresh feed inputs began to recover. Relative to their 2019 levels, catalytic reformer feed inputs rose to 93.2%, catalytic cracker inputs rose to 91.1%, coker inputs rose to 92.4%, and hydrocracker inputs were back at 99.8% of their 2019 levels. As will be further discussed in the section on product supplied, diesel demand did not drop as sharply as gasoline demand did, and it rebounded more quickly. Hydrocracking utilisation therefore did not drop as dramatically, and fresh feed inputs to hydrocrackers recovered to nearly 100% as of November 2021.
Refinery production
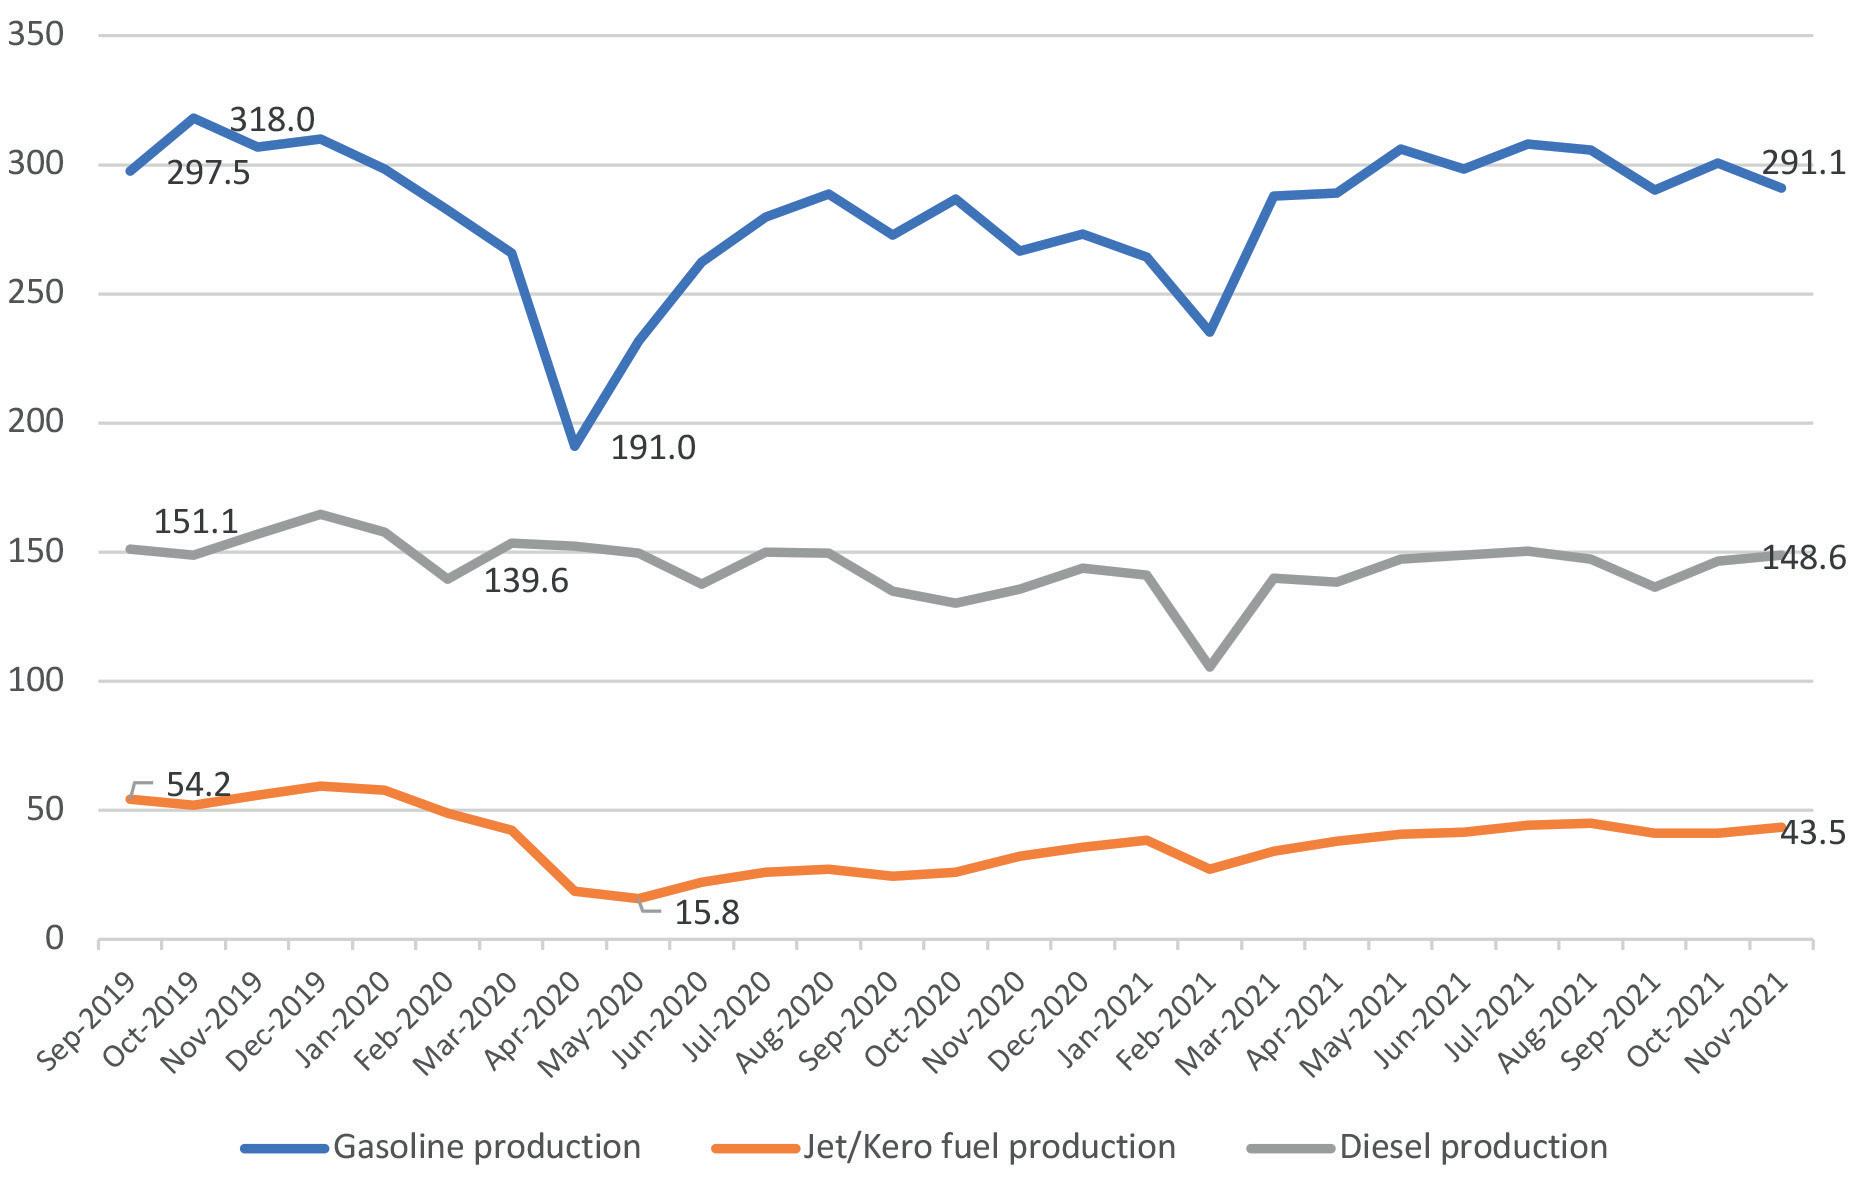
Because US refiners were forced to reduce their throughput, refinery fuel output fell. Figure 3 shows the monthly trend in refiner and blender net production of gasoline, jet/kero, and diesel from September 2019 through to November 2021. Refinery output of gasoline and jet fuel plummeted, while diesel production declined more modestly. Gasoline production averaged approximately 318 million bbl in October 2019, and this collapsed to 191 million bbl in April 2020. Jet fuel production of 59.3 million bbl in December 2019 was slashed to 15.8 million bbl in May 2020. Diesel production of 164.6 million bbl in December 2019 fell to 139.6 million bbl in February 2020.
Of the three key fuels, diesel output was cut the least, and it rebounded the most quickly. In November 2021, refinery output of diesel was 148.6 million bbl – very close to where it was before the pandemic. Gasoline and jet fuel output have risen, but they remain suppressed.
Demand side: US fuel supplied
The future of demand is now the critical unknown. In 2020, the country was optimistic that the pandemic was coming to an end, and economic activity was picking up. By late 2021, however, the Omicron variant had emerged, and infections began to surge. While the Omicron variant has not proven as fatal as feared, it is easily transmissible nonetheless, and US hospitals and healthcare professionals were once again swamped. US oil demand retreated in the fourth quarter. Soaring prices are also tamping down demand growth, and some economic and recreational activities are stymied because of supply chain issues. US fuel demand is visibly recovering, however. Figure 4 compares monthly fuel demand for the three key fuels: gasoline, jet/kero and diesel. The bars compare fuel use in the months November 2019 (before the COVID-19 breakout), April 2020 (a month of severe economic and social disruption as stay-at-home orders took effect), November 2020, and November 2021. Gasoline supplied in November 2019 averaged 9.209 million bpd. Demand collapsed to 5.866 million bpd in April 2020, an Figure 3. US refiner and blender net production of gasoline, diesel and incredible drop of 3.343 million bpd. To jet fuel, million bbl/month (source: EIA). place this in perspective, the drop in US gasoline demand was greater than the entire market demand of all other North and South American countries combined, and almost double the market size of Europe (BP reported European gasoline demand at 1.768 million bpd in 2020).2 Jet fuel supplied was slashed from 1.723 million bpd in November 2019 to 0.681 million bpd in April 2020, a 166% drop. Demand recovered to 1.131 million bpd in November 2020 and 1.501 million bpd in November 2021. Diesel supplied fell from Figure 4. The COVID-19 impact on US fuels supplied, ‘000 bpd 4.201 million bpd in November 2019 to (source: EIA). 3.528 million bpd in April 2020. Demand rose to 3.879 million bpd in
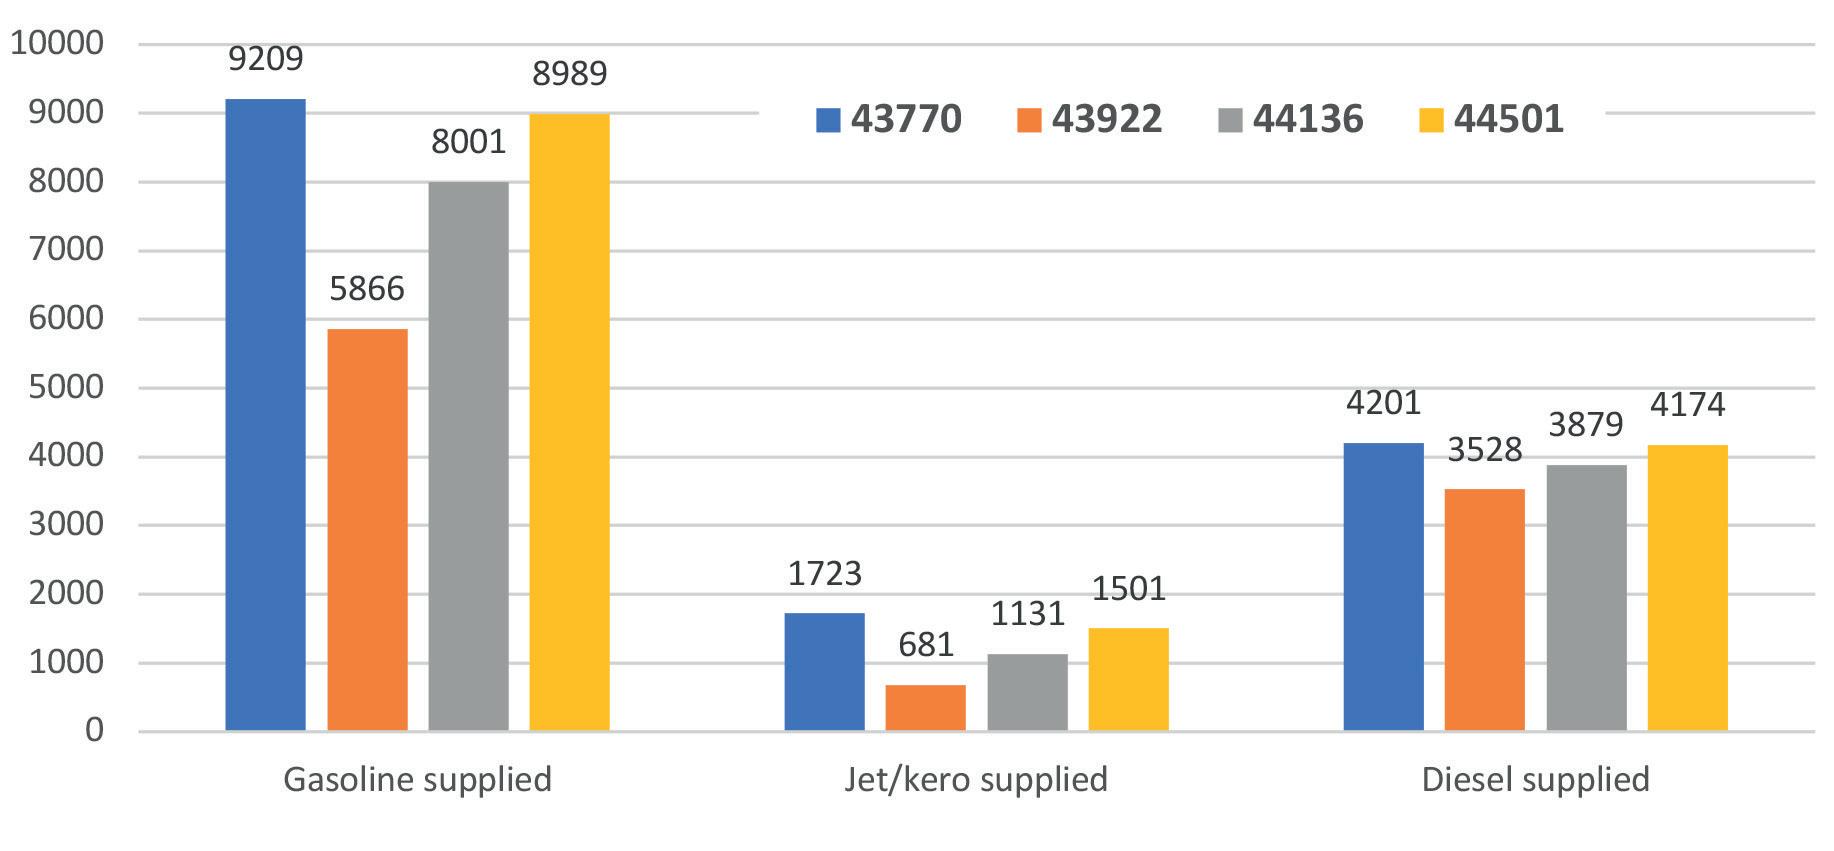
November 2020 and bounced back to 4.174 million bpd in November 2021 – almost its prior level.
Gasoline and diesel retail prices
The COVID-19 pandemic caused immense oil price volatility. As economic activity and travel slumped, prices collapsed. In a historic moment, West Texas Intermediate (WTI) crude oil futures prices closed in negative territory on 20 April 2020. While future prices for crude oil do not fully determine retail prices for gasoline and diesel, the crude price collapse forced retail prices down in 2020.
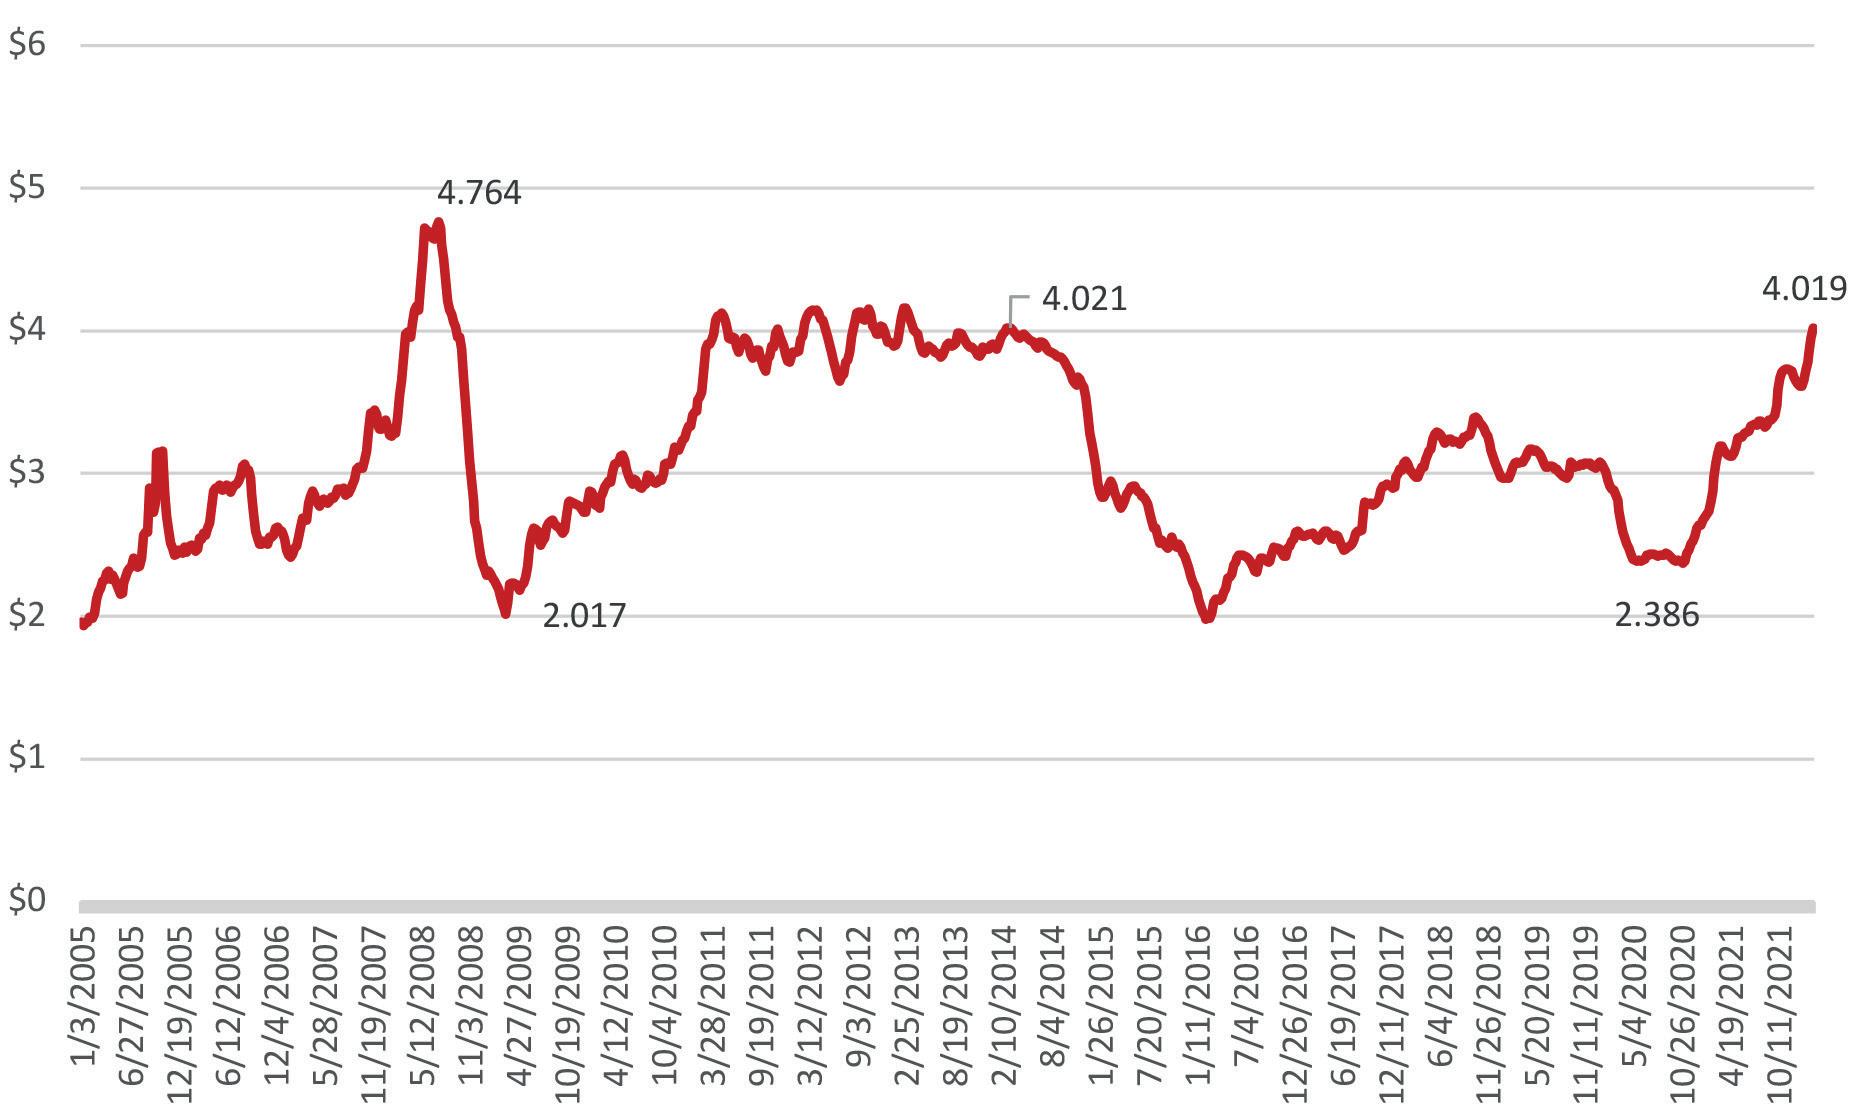
Figure 5 displays weekly retail prices for regular grade gasoline (all formulations) from 2005 through to 7 February 2022. Figure 6 displays the weekly price data for diesel during the same period. Both gasoline and diesel prices spiked in the summer of 2008, with gasoline hitting US$4.11/gal. and diesel hitting US$4.76/gal. during the week of 14 July 2008. Prices then crashed, with gasoline prices bottoming out at US$1.61/gal. in late 2008, and diesel prices dropping as low as US$2.02/gal. in early 2009.
The 2007 – 2008 period was the subprime mortgage crisis, which resulted in the Great Recession, officially defined as beginning in December 2007 and ending in June 2009. Fuel prices recovered subsequently, and they were strong and stable for most of 2011 – 2014 until oversupply dragged prices down in 2015 – 2016.
Oil prices were weak overall from 2015 to 2019, and during this time, OPEC and allied producer countries (known as the OPEC+ group) worked together to place ceilings on production to help drain global inventories and support prices. The COVID-19 pandemic overwhelmed these efforts by eliminating a large chunk of demand, causing the price collapse visible in early 2020. Gasoline retail prices dropped to US$1.77/gal. in April 2020, while diesel retail prices fell to US$2.39/gal. in May of that year.
Since then, however, US retail fuel prices have climbed steadily. Some of this is attributed to the resumption of economic activity after a lengthy period of pandemic shutdowns. Fuel inventories (and inventories of many other goods) were drawn down and have not been replenished over the past two years. Rising prices for fuel, food, and other goods and services are feeding inflation and leading to consumer complaints. The current Russian-Ukraine tension is strengthening oil prices even further. Overall, weekly average retail prices for gasoline have doubled, rising from US$1.77/gal. in April 2020 to US$3.49/gal. in early February 2022. Prices are far above their pre-pandemic levels. Indeed, gasoline retail prices are the highest they have been since August 2014, nearly seven and a half years ago. Diesel prices rose from their nadir of US$2.39/gal. in May 2020 to hit US$4.02/gal. during the first week of February 2022. It has been eight years since US retail prices for diesel have been above US$4/gal. The COVID-19 pandemic caused a severe price crash, and now oil prices are climbing to the point that consumers are complaining, and there are inflationary pressures on many non-energy goods and services. The oil market has been subject to numerous up-down fuel price cycles. It is always possible that prolonged periods of low prices, such as the recent one caused by oversupply and burgeoning inventories, can be followed by price spikes. During the recent glut, compounded by the COVID-19 crash, many investments in the oil sector were postponed. A glut may tip into shortage if the pandemic ends and pent-up demand returns. These cycles are a feature of
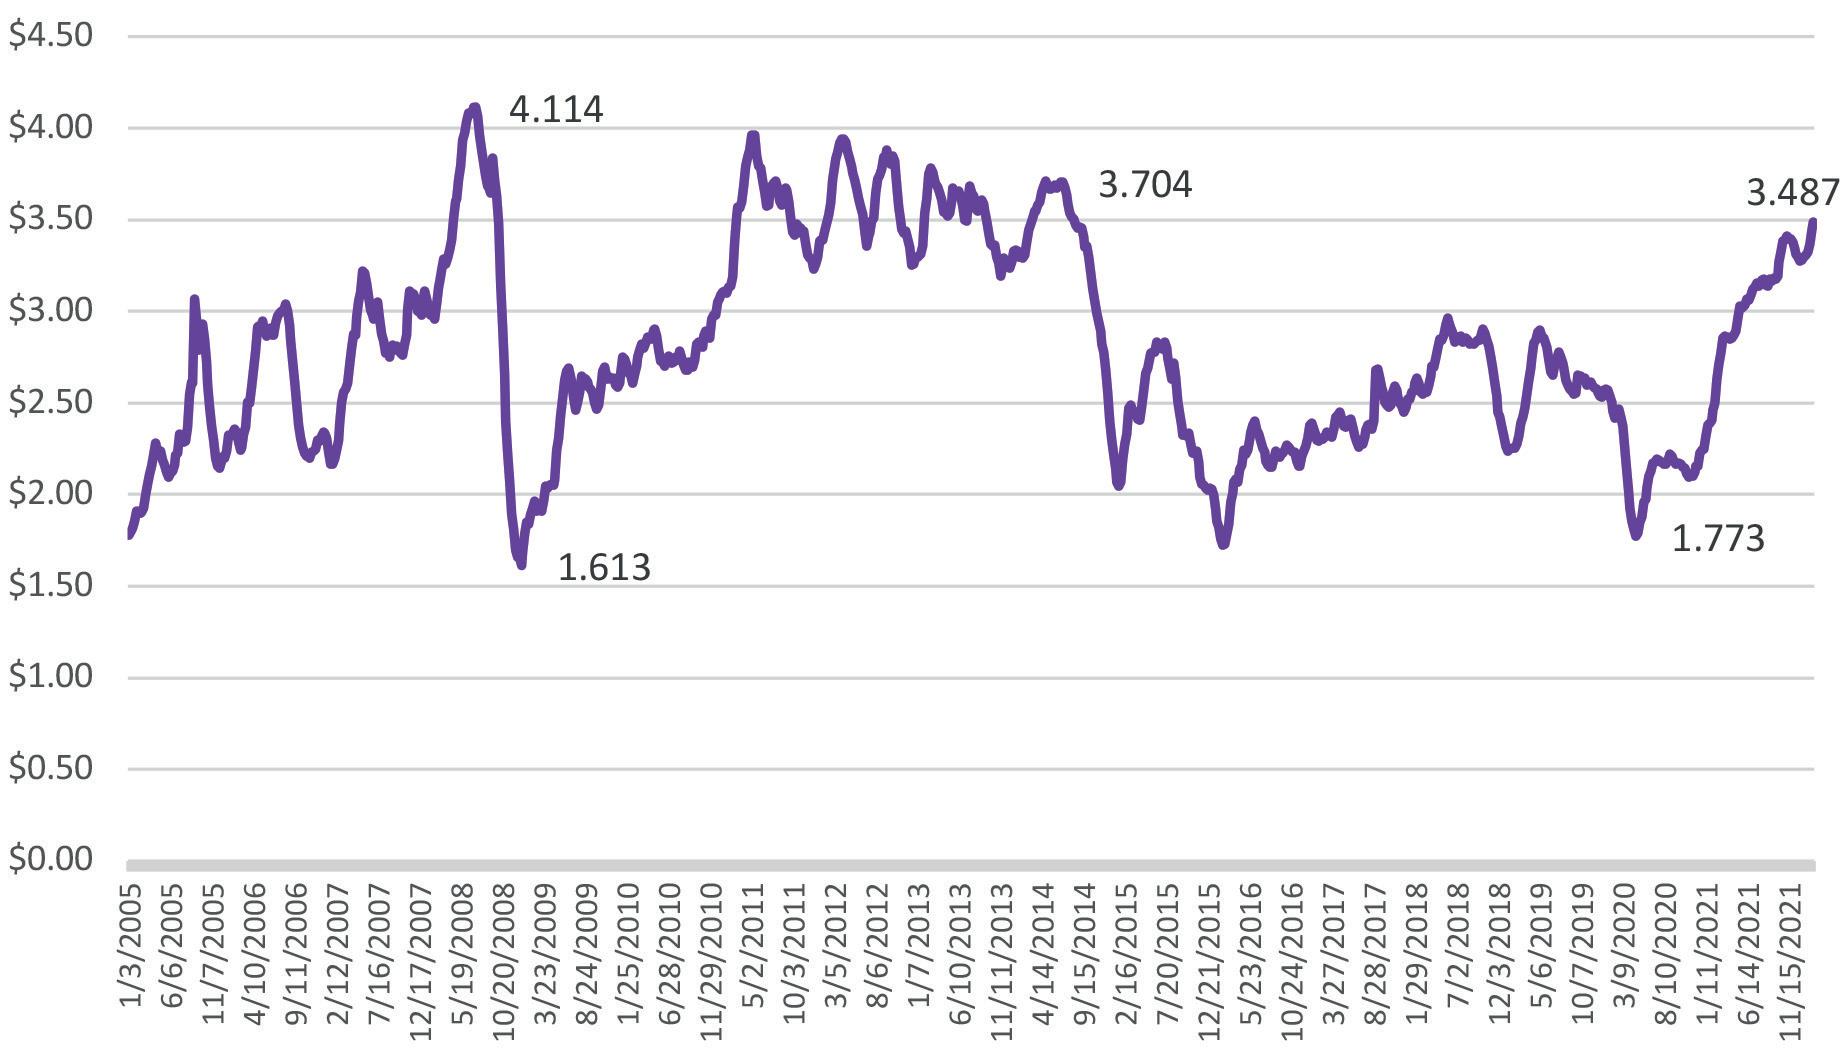
Figure 5. Weekly retail gasoline prices, all regular formulations, US$/gal. (source: EIA). Figure 6. Weekly retail diesel prices, US$/gal. (source: EIA).