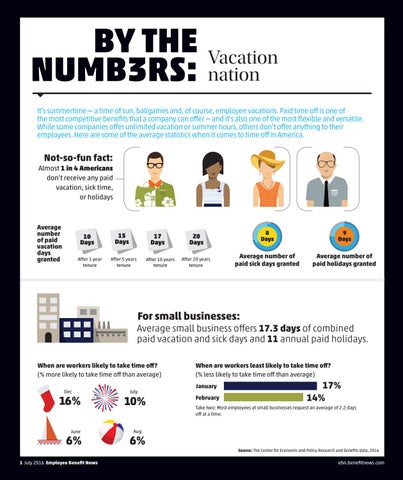
BY THE Vacation NUMB3RS: nation It’s summertime — a time of sun, ballgames and, of course, employee vacations. Paid time off is one of the most competitive benefits that a company can offer — and it’s also one of the most flexible and versatile. While some companies offer unlimited vacation or summer hours, others don’t offer anything to their employees. Here are some of the average statistics when it comes to time off in America.
Not-so-fun fact: Almost 1 in 4 Americans don’t receive any paid vacation, sick time, or holidays
Average number of paid vacation days granted
10 Days After 1 year tenure
15 Days
17 Days
After 5 years tenure
After 10 years tenure
8 Days
9 Days
Average number of paid sick days granted
Average number of paid holidays granted
20 Days After 20 years tenure
For small businesses:
Average small business offers 17.3 days of combined paid vacation and sick days and 11 annual paid holidays. When are workers likely to take time off? (% more likely to take time off than average) Dec
16% June
6%
July
10%
When are workers least likely to take time off? (% less likely to take time off than average) January February
17% 14%
Take two: Most employees at small businesses request an average of 2.2 days off at a time.
Aug
6% Source: The Center for Economic and Policy Research and Zenefits data, 2016
1 July 2016 Employee Benefit News
ebn.benefitnews.com