Great Clarendon Street, Oxford, OX2 6DP, United Kingdom Oxford University Press is a department of the University of Oxford. It furthers the University’s objective of excellence in research, scholarship, and education by publishing worldwide. Oxford is a registered trade mark of Oxford University Press in the UK and in certain other countries.
The moral rights of the author[s] have been asserted First published in 2023
All rights reserved. No part of this publication may be reproduced, stored in a retrieval system, or transmitted, in any form or by any means, without the prior permission in writing of Oxford University Press, or as expressly permitted by law, by licence or under terms agreed with the appropriate reprographics rights organization. Enquiries concerning reproduction outside the scope of the above should be sent to the Rights Department, Oxford University Press, at the address above.
You must not circulate this work in any other form and you must impose this same condition on any acquirer
(ebook)
Paper used in the production of this book is a natural, recyclable product made from wood grown in sustainable forests.
The manufacturing process conforms to the environmental regulations of the country of origin.
Printed in Italy by Rotolito SpA
Acknowledgements
The “In cooperation with IB” logo signifies the content in this textbook has been reviewed by the IB to ensure it fully aligns with current IB curriculum and offers highquality guidance and support for IB teaching and learning.
The Publisher wishes to thank the International Baccalaureate Organization for permission to reproduce their intellectual property.
The Publisher would like to thank the following members of the DP Science 2023 Research Panel for sharing their insights, expertise, and feedback: B. Jane Taylor, Menna Shawky El Sherbiny, Aura Milena Vera, Jessica K. Hartman, Nilan A. Senaratna, Joanne Walton, Holly O'Donal Allen, Gavin Terry, Arnavaz Kollah, Amanda Lockhart, Lisa Privitera, Ioannis Papatheocharis, Anastasia Denisova, Dr. Regina Katz, Srivalli Singh, Emma Nason, Rosanne Jacobs-Sarkin, Aditya Rao, María Cristina Salvador Crow, Tania M Hodges
The publisher would like to thank the following for permissions to use copyright material:
Theory of knowledge 32 End of chapter questions 34
2 Cells 36
A2.1 Origins of cells 37
A2.2 Cell structure 49
A2.3 Viruses 80
Theory of knowledge 92 End of chapter questions 94
3 Organisms 96
A3.1 Diversity of organisms 97
A3.2 Classification and cladistics 116
Theory of knowledge 132 End of chapter questions 134
4 Ecosystems 136
A4.1 Evolution and speciation 137
A4.2 Conservation of biodiversity 156 Theory of knowledge 173 End of chapter questions 175
1 Molecules 178
B1.1 Carbohydrates and lipids 179
B1.2 Proteins 195
Theory of knowledge 208 End of chapter questions 209
2 Cells 210
B2.1 Membranes and membrane transport 211
B2.2 Organelles and compartmentalization 229
B2.3 Cell specialization 240
Theory of knowledge 252 End of chapter questions 253
3 Organisms 254
B3.1 Gas exchange 255
B3.2 Transport 270
B3.3 Muscle and motility 293
Theory of knowledge 305 End of chapter questions 306
4 Ecosystems 308
B4.1 Adaptation to environment 309
B4.2 Ecological niches 321
Theory of knowledge 336 End of chapter questions 337
1 Molecules 338
C1.1 Enzymes and metabolism 339 C1.2
3 Organisms 450
C3.1 Integration of body
4 Ecosystems
C4.1 Populations and communities
1 Molecules 556
Form and function B
4 Ecosystems
The structure of an ecosystem is its form. Ecosystems consist of biotic and abiotic components. The biotic community structure refers to the organisms that are present and the web of interactions between them. Organisms interact in feeding relationships, mutualistic relationships and competitive relationships. Abiotic factors also contribute to the overall form of an ecosystem. High levels of rainfall often result in the development of a forest, moderate levels lead to the development of a grassland ecosystem and sparse rainfall leads to the development of a desert. The community structure of the taiga is influenced by temperature and rainfall. Taiga is a forest biome characterized by high levels of precipitation and cold average annual temperatures. In the taiga, the storage of nutrients in litter is much higher than in tropical rainforests. The rate of flow of nutrients from the biomass to the litter is relatively higher than in the tropical ecosystem.
B4.1 Adaptation to environment
Guiding question: How are the adaptations and habitats of species related?
The thick coat of a musk ox is correlated with the low temperatures of its northerly habitats. The water storage tissue in the stem of a cactus is related to infrequent rainfall in desert habitats. In biology, characteristics such as these that make an individual suited to its habitat are called adaptations. How do adaptations come to exist? What are other examples of adaptations of organisms to extreme environments? What is the reason that we avoid implying a purpose to an adaptation?
Guiding question: What causes the similarities between ecosystems within a terrestrial biome?
The Wallace line marks a division between species present in similar environments despite their geographical proximity. Islands to the east and west of the line have similar environments but very different species of plant and animal. Islands to the west of the line have Asian species and islands to the east have Australasian species. What is a possible explanation for this phenomenon? Wherever any particular type of environment occurs in the world, despite geographic separation, the same forms of plant and animal tend to evolve independently. What is the mechanism that leads to this convergence?
Every terrestrial environment poses challenges and adaptations are needed for plants and animals to survive and thrive. Wherever any particular type of environment occurs in the world, despite geographic separation, the same forms of plant and animal tend to evolve and therefore similar ecosystems. What is the mechanism that leads to this convergence?
SL/HL
B4.1.1 Habitat as the place in which a community, species, population or organism lives
B4.1.2 Adaptations of organisms to the abiotic environment of their habitat
B4.1.3 Abiotic variables affecting species distribution
B4.1.4 Range of tolerance of a limiting factor
B4.1.5 Conditions required for coral reef formation
B4.1.6 Abiotic factors as the determinants of terrestrial biome distribution
B4.1.7 Biomes as groups of ecosystems with similar communities due to similar abiotic conditions and convergent evolution
B4.1.8 Adaptations to life in hot deserts and tropical rainforest
▸ Figure 1 Musk ox (Ovibos moschatus during the fall, Dovrefjell National Park, Norway
▴ Figure 2 The Wallace line runs between Borneo and the K-shaped island of Sulawesi
B4.1.1 Habitat as the place in which a community, species, population or organism lives
Habitat means “he lives” or “she lives” in Latin. In biology, it means the place where an organism lives. This could be the geographical location — where in the world. More usually, it means the type of place inhabited: the physical conditions, the type of ecosystem and where within the ecosystem. It can apply to one organism or a whole population, species or community.
As an example, the habitat of Ranunculusglacialis is at very high altitude in the Alps and other mountains in Europe, on sites that are snow-covered through the winter and where there is little competition from other plants. These sites have a short growing season with intense sunlight. R.glacialis grows on acidic soils that are moist but also well drained.
B4.1.2 Adaptations of organisms to the abiotic environment of their habitat
The environment of an organism is everything that is around it. This includes other living organisms and non-living materials such as air, water and rock. Living things are referred to as biotic factors and non-living things are called abiotic factors. Biotic factors dominate in ecosystems where there are dense communities of organisms — for example, in tropical rainforests. Abiotic factors have more influence in extreme habitats where population densities are low — for example, desert or taiga. All organisms are adapted to their abiotic environment. This is clearly seen in plants that live in extreme habitats such as sand dunes and mangrove swamps.
Adaptations of grasses to sand dunes
Sand dunes are mounds of sand that form from wind-blown sand in deserts and at the top of beaches. The challenges for plants on beach dunes are water conservation and tolerance of high salt concentrations and sand accumulation. Sand retains little water after rainfall and dunes initially contain little organic matter (which helps to store water in soils). Also, sand on beach dunes can contain high salt concentrations which hinders water uptake by osmosis. For these reasons, most types of plant would die of dehydration on sand dunes, so special adaptations are required for growth. Grasses are the dominant plant on beach dunes in many parts of the world. Lyme grass (Leymus mollis) occurs where sand is accumulating at the seaward edge of dunes in North America.
Lyme grass has these adaptations:
• thick waxy cuticle on leaves to reduce transpiration
• stomata in indentations (furrows) where humid air can remain even in windy conditions
• leaves that can roll up during droughts, creating a humid chamber and reducing the surface area exposed to wind
• tough sclerenchyma to prevent wilting during droughts
• rhizomes (underground stems) that grow upwards as sand accumulates and extend deep into the dune to obtain water
• accumulation of carbohydrates known as fructans in root and leaf cells to increase osmotic potential and thus water uptake.
Adaptations of trees to mangrove swamps
Mangrove swamps develop on the coast in the tropics and subtropics where there are sheltered conditions and mud accumulates. These swamps are flooded with seawater at high tide. The dominant species are trees. The environmental challenges are waterlogged anaerobic soils and high salt concentrations. The salt concentration of the mud can be twice as high as that of seawater. This is due to the daily flooding with seawater and evaporation concentrating the salt in the mud.
Mangrove trees have the following adaptations that allow them to thrive in a habitat that would be intolerable for most species:
• secretion of excess salt from salt glands in the leaf
• root epidermis coated in suberin (cork) which reduces permeability to salt and prevents excessive absorption
• cable roots growing close to the soil surface where there is most oxygen
• pneumatophores, which are vertical root branches that grow up into the air and can absorb oxygen for use in roots
• stilt roots that grow out in a downward arch from the central trunk to buttress the tree in the soft mud
• large buoyant seeds that can be carried by the ocean to distant muddy shores
• accumulation of mineral ions and carbon compounds such as mannitol, which increases the osmotic potential of root and leaf cells, allowing water absorption from the very saline environment.
◂ Figure 3 Glacier crowfoot (R. glacialis) growing at over 2,400 m altitude on a northeast facing slope of limestone rock on the Massif des Diablerets in the Alps
▴ Figure 4 Lyme grass on the Ma-le’l Dunes, Humboldt Bay, California
▴ Figure 5 Part of a lyme grass leaf showing tough sclerenchyma (pink) and furrows with stomata at their base
▴ Figure 6 The mud in mangrove swamps is deficient in oxygen. Mangrove trees have evolved vertical roots called pneumatophores which they use to obtain oxygen from the air
the centre of gravity
B4.1.3 Abiotic variables affecting species distribution
The distribution of a species is where it lives in the world, so it can be shown on a map. Distribution maps reflect the factors that affect species, especially abiotic factors. The adaptations of plants and animals suit them for living in some physical environments but not others.
Plant distributions are affected by temperature, water availability, light intensity, soil pH, soil salinity, and the availability of mineral nutrients. Every plant species has a range of tolerance for each of these factors. This means that a plant cannot grow in areas that are outside its range for one or more of the factors. For example, plant species from the tropics are not adapted to survive frosts so they would not survive in northern regions. Plants from these northern regions have chemicals in their cells that act like antifreeze and prevent frost damage caused by the formation of ice crystals. However, the northern plant species do not have adaptations for growth in the tropics. They would transpire excessively, and their method of photosynthesis would be very inefficient at high temperatures.
Animal distributions are affected by abiotic factors such as water availability and temperature. Extremes of temperature require special adaptations. The large ears of elephants with their dense networks of surface blood help to dissipate heat in hot climates, whereas polar bears have relatively small ears, minimizing heat loss in Arctic habitats. Some animals have adaptations for life in arid conditions. For example, desert rats have longer loops of Henlé in their kidneys to minimize water loss. The adaptations required by aquatic animals are very different.
In some cases, animal distribution is limited by requirements for one stage in the life cycle. Salmon require fast flowing freshwater streams no more than 3 m deep for spawning. They must have gravel substrates with particle size between 10 mm and 100 mm and a water pH of between 5.5 and 8.0. As with plants, animals have a range of tolerance for each abiotic factor, based on their adaptations.
B4.1.4 Range of tolerance of a limiting factor
Plant and animal species have ranges of tolerance for abiotic variables. For example, many plant species will only grow in soils within a specific pH range; some require full sunlight and others only grow in shade. Animal species also have ranges of tolerance for variables such as salt concentration in aquatic habitats and temperature.
Ranges of tolerance can be investigated experimentally, or by finding correlations between the distribution of a species and abiotic variables. For example, a study in Taiwan of the mosquito, Aedes aegypti found it requires a minimum night-time temperature of 13.8°C.
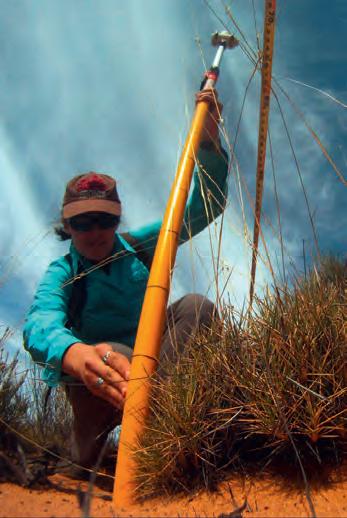
Correlations between the distribution of a species and an abiotic variable can be investigated by mapping the entire species range, by random sampling for example using quadrats, or by sampling along transect lines.
Transects
Transects can be used to investigate the tolerance ranges of species to abiotic variables. A transect used for this purpose should span different levels of the variables of interest. For example, a line taken down a slope from woodland to peat bog might reveal correlations between the distribution of plant species and temperature, light intensity and soil pH. These and other abiotic variables can be measured using electronic sensors and portable data loggers. There are several different methods of sampling using a transect.
• Line intercept sampling a tape is laid along the ground between two poles and all organisms that touch the line are recorded.
• Belt transects the abundance of species is estimated in the area between two lines separated by a fixed distance, often 0.5 m or 1.0 m. Abundance can be assessed using quadrats placed at regular intervals along the belt.
• Observational transects the observer walks along a defined route at a defined pace and records sightings of target species. This method can be used to investigate ranges of tolerance and is also used for monitoring changes in population size over time.
Observations: Making observations with sensors
A sensor is a device that records the level of a parameter. Electronic sensors are now available for many parameters that are of interest in ecological research. A log is a permanent record of measurements taken at regular intervals. Data logging is digital storage of measurements from electronic sensors. Compact, portable data loggers have been designed with a sensor to monitor an environmental condition such as temperature, light intensity or pH and an internal memory to record and store the digital data. These data loggers have many advantages:
• less expensive than many older designs and easy to operate
• designed to be compact and portable with battery power
• available for measuring hundreds of different parameters
• can take repeated measurements very rapidly
• can be left to take measurements automatically over long periods
• stored data can be transferred easily to a computer for analysis or long-term storage.
Because of their advantages, data loggers are widely used, both for ecological research and other purposes such as:
• medical diagnostics in all settings from Intensive Care Units to remote areas far from hospitals
• industries such as food and drink production for example, monitoring of fermentation in wineries
• flight recorders on aircraft.
Data-based questions: Intertidal zonation
The kite diagram in Figure 9 illustrates the distribution of common intertidal species 300 m south of Bembridge Lifeboat Station on the Isle of Wight, UK. The thickness of the shaded region indicates whether the organism was abundant, common, frequent, occasional or rare (ACFOR is a scale of abundance).
▴ Figure 7 Distribution of Ranunculus glacialis in Scandinavia. The species range is shown in green and
of the range in red
▴ Figure 8 Ecologists surveying on a transect extending from unburned to burned woodland at Backhouse Tarn, Tasmania
Enteromorpha / Fucus spiralis
Arenicola marina
Fucus serratus
Sargassum muticum
Littorina mariae
Anemonia viridis
Littorina littorea
Chondrus crispus
Patella vulgata
S.balanoides
Laminaria digitata
Gibbula cineraria
Laurencia pinnatifida
Nucella lapillus
▴ Figure 9 Species abundance as a function of distance from spring tide high water mark (the highest point normally reached by salt water)
1. Examine the kite diagram and explain the methods used to collect the data. [3]
2. State the species that is most abundant in the survey area. [1]
3. Using the scale bar, determine the length of the large shallow rock pool. [2]
4. Deduce one species adapted to:
a. shingle b. sand c. rock pools. [3]
5. Several species are only found near the lower edge of the intertidal zone. Suggest reasons for them being absent from the upper parts of the intertidal zone. [3]
6. Using the data in the kite diagram, predict two species that are adapted to the same abiotic environment. [2]
7. Suggest one way in which the objectivity of the research could have been improved. [1]
Data-based questions: Data-logging pH in an aquarium
Figure 11 shows the pH and light intensity in an aquarium containing a varied community of organisms including pondweeds, newts and other animals. The data was obtained by data logging using a pH electrode and a light meter. The aquarium was illuminated artificially to give a 24-hour cycle of light and dark using a lamp controlled by a timer.
1. Explain the changes in light intensity during the experiment. [2]
2. Determine how many days the data logging covers. [2]
3. a. Deduce the trend in pH in the light. [1] b. Explain this trend. [2]
4. a. Deduce the trend in pH in darkness. [1] b. Explain this trend. [2]
The pH in natural pools or in artificial aquatic mesocosms can be monitored using data loggers. Ecologists have monitored pH in rock pools on seashores that contain animals and photosynthesizing algae. The pH of the water rises and falls in a 24-hour cycle, due to changes in carbon dioxide concentration in the water. The lowest values of about pH 7 are found during the night and the highest values of about pH 10 when there is bright sunlight during the day. What are the reasons for these maxima and minima?
0/14:021/12:072/10:123/08:174/06:235/04:286/02:33
▴ Figure 11 Changes in pH and light intensity in an aquarium
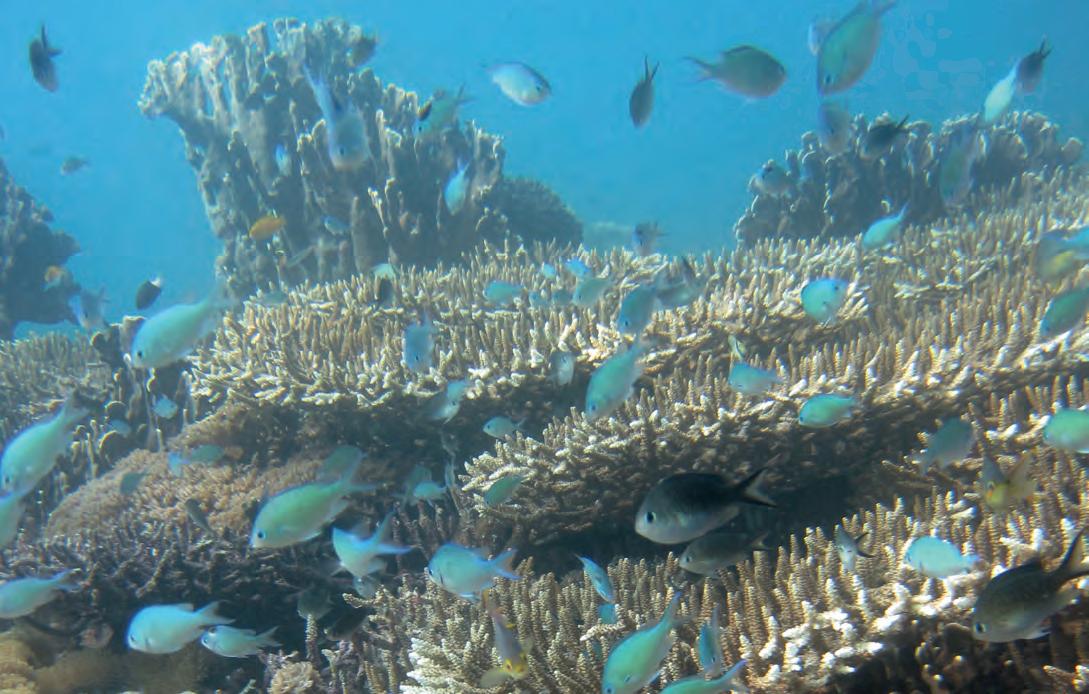
B4.1.5 Conditions required for coral reef formation
Coral reefs are biodiverse marine ecosystems. They can only develop where conditions are suitable for hard corals, whose skeletons form the rocky structure of the reef. Hard corals contain mutualistic zooxanthellae, which need light for photosynthesis. These are the conditions required.
• Depth less than 50 m depth of water, so enough light penetrates.
• pH above 7.8 to allow deposition of calcium carbonate in the skeleton.
• Salinity between 32 and 42 parts per thousand of dissolved ions to avoid osmotic problems.
• Clarity turbidity would prevent penetration of light so the water must be clear.
• Temperature 23–29°C so both the coral and its zooxanthellae remain healthy.
▴ Figure 10 Rock pool at Limerick Point, Ireland
pH changes in rock pools
B4.1.6 Abiotic factors as the determinants of terrestrial biome distribution
With any combination of abiotic factors, one particular type of ecosystem is likely to develop. The species composition of the ecosystem will vary depending on the geographical location, but the adaptations of the species are likely to be similar. All ecosystems of a specific type are a biome.
Two abiotic factors are the principal determinants of biome distribution on Earth: temperature and rainfall. The most likely ecosystem given any particular combination of these factors can be shown using a graph, with mean annual precipitation on one axis and mean annual temperature on the other.
B4.1.7 Biomes as groups of ecosystems with similar communities due to similar abiotic conditions and convergent evolution
Biomes are groups of ecosystems that resemble each other, even though they may be widely separated in the world. The resemblance is due to the similar abiotic conditions, with plants and animals evolving similar adaptations in response to the conditions. This is an example of convergent evolution. By natural selection, distantly related species that face the same problems find the same solutions. For example, plants in deserts develop adaptations for water conservation and storage. Cacti in America and euphorbias in Africa have very similar adaptations, despite not being closely related. In some cases, it is only when they produce flowers that these desert plants can be distinguished.
▴ Figure 12 Coral reefs can develop between 35°north and 35°south of the Equator
▴ Figure 13 Hard corals build the reef and provide a habitat for many other species. The blue-green fish on this Pacific reef are Chromis viridis
▴ Figure 14 Relationship between temperature, rainfall and biomes
▴ Figure 15 Gymnocalycium baldianum (a cactus) and Euphorbia obesa (a euphorbia), both viewed from above 5mm
Tropical forest
Temperate forest Taiga (boreal forest)
Hot desert Grassland Tundra
Temperature high medium low high high/medium very low
Precipitation high high/medium high/medium very low medium medium/low
Light intensity high medium medium/low high high/medium low
Seasonal variation minimal in rainforests warm summers colder winters short summers; long, cold winters
minimal variation variation with a dry season or cold season very short summer; very cold winter
• leaves reduced to spines, to reduce the surface area for transpiration and prevent herbivores from eating the slow-growing cactus
• CAM metabolism allowing stomata to open at night and close during the heat of the day, reducing transpiration.
The fennec fox is a species of mammal that it adapted to life in hot deserts. It has the following adaptations:
• nocturnal so it avoids the highest temperatures during daylight hours
• it builds an underground den where it can stay cool during the day
• long thick hair to provide heat insulation both for the cold nights and hot days
▴ Figure 16 In this satellite image of Mount Kenya, different ecosystems are visible. The summit is snow covered. Descending eastwards, the ecosystems are afro-alpine (light brown), heathland/chaparral (gray-green), upper montane forest (dark green), bamboo forest (light green), lower montane forest (dark green) with farmed land (mixed colours) outside the boundary of the protected area
B4.1.8 Adaptations to life in hot deserts and tropical rainforest
Hot deserts are characterized by very high daytime temperatures and much colder nights. Rainfall totals per year are very low and there can be long periods without any precipitation. Soil development is very limited, with little organic matter of soil organisms. The saguaro and fennec fox are examples of organisms adapted to these conditions.
The saguaro is a species of cactus that is adapted to life in hot deserts. It has the following adaptations:
• a wide-spreading root system to collect water up to 30 m from the stem
• deep tap roots that collect water from up to 1 m down in the subsoil
• fat stems with storage tissue to conserve water after infrequent desert rains
• pleated stems that allow shrinkage in droughts and swelling after rains
• vertical orientation of stems to reduce interception of sunlight at midday and maximize it at cooler times of day
• a thick waxy cuticle on the stem epidermis to reduce transpiration
• hairs covering the pads of the feet to provide insulation when walking on very hot sand
• a pale-coloured coat that reflects sunlight (a darker coat would absorb it)
• large ears that radiate heat and help keep body temperature down
• a variable ventilation rate that can be increased to more than 600 breaths per minute (panting) to cause heat loss by evaporation.
Tropical rainforests are characterized by high temperatures, high precipitation and high light intensity. The yellow meranti and the spider monkey are examples of organisms adapted to these conditions.
The meranti (S faguetiana) is a species of tree that is adapted to life in tropical rainforests. It has the following adaptations:
• it can grow to over 100 m high, overtopping other trees and avoiding competition for light
• trunk of hard dense wood to provide support especially against the wind stress
• trunk is buttressed at the base to provide increased support because rainforest soils are shallow
• smooth trunk to shed rainwater rapidly
• broad oval leaves with pointed tips that shed rainwater rapidly
• evergreen leaves which take advantage of ideal conditions for photosynthesis throughout the year
• enzymes of photosynthesis adapted to tolerate temperatures as high as 35°C
• flowers and seed produced in large quantities about one year in five, with none in other years to deter species that eat the seeds.
The spider monkey (A. geoffroyi) is a species of mammal that is adapted to life in rainforests. It has the following adaptations:
• long arms and legs for climbing and reaching for fruit
• flexible shoulders allowing swinging from tree to tree
• large hook-like hands without thumbs that can grasp branches and lianas and pick fruit
• feet that can act like extra hands, grasping branches and allowing the arms to be used for feeding or other purposes
▴
▴ Figure 17 Saguaro (Carnegiea gigantea) in hot desert in Arizona
▴ Figure 19 Yellow meranti (Shorea faguetiana) near the Kinabatangan River in Borneo
▴ Figure 20 Spider monkey (Ateles geoffroyi in Belize
▴ Figure 18 Fennec fox (Vulpes zerda) at Farafra oasis, Egypt
• long tail that can grip onto branches and act like a fifth hand
• highly developed larynx allowing a wide range of sounds to be made to communicate in the dense rainforest canopy
• sleeping at night and active in the daytime when vision is most acute and distances can be judged between branches.
• breeding at any time of year as there is a constant supply of fruit, nuts, seeds, buds, flowers, insects and eggs.
Linking questions
1.What are the properties of the components of biological systems?
a.Explain the interactions between auxin and cytokinin as a means of regulating root and shoot growth. (C3.1.22)
b.Discuss the statement: “integration results in emergent properties”. (C3.1.2)
c.Outline the role of feedback control in the regulation of the human heart rate. (C3.1.14)
2.Is light essential for life?
a.Explain why the energy content of each trophic level decreases through a food chain. (C4.2.14)
b.Explain how photosynthesis results in an increase in biomass. (C4.2.15)
c.Outline how chemosynthesis represents an exception to the rule that ecosystems are dependent on light as a source of energy. (B4.2.6)
B4.2 Ecological niches
Guiding question: What are the advantages of specialized modes of nutrition to living organisms?
When Charles Darwin was sent a Madagascar star orchid (Angraecumsesquipedale), which has a 300 mm long nectar tube, he predicted that a moth with equally long tubular mouthparts must exist in the same ecosystem to act as the orchid’s pollinator. The moth was finally discovered 21 years after Darwin’s death and named Xanthopanpraedicta Its mouthparts are indeed 300 mm long and have to be coiled up when not in use. They unroll like a party blower when the moth is about to insert them into the nectar tube. On what do you think Darwin based his prediction?
Guiding question: How are the adaptations of a species related to its niche in an ecosystem?
Kettlehole ponds fill landscape features created by retreating glaciers. Circular zones of different plants can be seen at different depths in the pond. The deeper the water, the less light penetrates and the lower the oxygen concentration in mud at the base of the pond. Drying in summer is the main challenge in shallow water near the margins of the pond, so different structural adaptations are beneficial, thus different species dominate at the edges. Which types of plants would thrive in the centre of the pond? Which would thrive at the edges?
SL/HL
B4.2.1 Ecological niche as the role of a species in an ecosystem
B4.2.2 Differences between organisms that are obligate anaerobes, facultative anaerobes and obligate aerobes
B4.2.3 Photosynthesis as the mode of nutrition in plants, algae and several groups of photosynthetic prokaryotes
B4.2.4 Holozoic nutrition in animals
B4.2.5 Mixotrophic nutrition in some protists
B4.2.6 Saprotrophic nutrition in some fungi and bacteria
B4.2.7 Diversity of nutrition in archaea
B4.2.8 Relationship between dentition and the diet of omnivorous and herbivorous representative members of the family Hominidae
B4.2.9 Adaptations of herbivores for feeding on plants and of plants for resisting herbivory
B4.2.10 Adaptations of predators for finding, catching and killing prey and of prey animals for resisting predation
B4.2.11 Adaptations of plant form for harvesting light
B4.2.12 Fundamental and realized niches
B4.2.13 Competitive exclusion and the uniqueness of ecological niches
▴ Figure 2 Kettlehole pond
▴ Figure 1 Xanthopan praedicta
B4.2.1 Ecological niche as the role of a species in an ecosystem
One of the central hypotheses of ecology is that every species in an ecosystem fulfils a unique role, called its ecological niche. Ecological niches have both biotic and abiotic elements.
• Zones of tolerance for abiotic variables determine the habitat of a species — where it lives in the ecosystem.
• Food is obtained either by synthesis using light, water and carbon dioxide or by taking it in from other organisms. To minimize competition, species must specialize. To compete effectively, they must develop adaptations for the mode of nutrition that is their specialism.
• Other species are utilized to provide a diverse range of services — for example, the supply of mineral elements by recycling, pollination of flowers or dispersal of seeds; the support provided by the trunks and branches of trees.
The ecological niche of a species is made up of very many factors — it is multidimensional. Unless all the dimensions of the niche are satisfied in an ecosystem, a species will not be able to survive, grow or reproduce.
B4.2.2 Differences between organisms that are obligate anaerobes, facultative anaerobes and obligate aerobes
Animals and plants require oxygen for aerobic cell respiration, but some other organisms do not have this requirement. Some microorganisms can only live in the total absence of molecular oxygen (O2) including some species of bacteria, archaea and protozoa. Anoxic (lack of oxygen) conditions occur in swamps, water-logged soil or muds, intestinal tracts (guts) of animals and deep in lakes or seas.
Living organisms can be placed in three categories according to their oxygen requirements (Table 1).
CategoryRequirements Examples
obligate aerobes require a continuous oxygen supply so only live in oxic environments
All animals and plants; Micrococcus luteus (a skin bacterium)
Activity: Winogradsky columns
To make a Winogradsky column, mud and water from a pond is placed in a large bottle or measuring cylinder, with a range of other materials. The column is sealed and placed in the light. Concentration gradients for oxygen and other substances develop in the column, with coloured bands due to groups of bacteria and archaea growing where the concentrations suit them.
▴ Figure 3 Two aspects of the niche of the blue-gray gnatcatcher (Polioptila caerulea) are prey size and foraging height. The graph shows the percentage of the diet according to these two variables in oak woodland, in California. There are many other aspects of this bird’s ecological niche
obligate anaerobes inhibited or killed by oxygen so only live in anoxic environments
facultative anaerobes use oxygen if available so live in oxic or anoxic environments
Escherichia coli (a gut bacterium), Saccharomyces (yeast)
B4.2.3 Photosynthesis as the mode of nutrition in plants, algae and several groups of photosynthetic prokaryotes
In photosynthesis, energy from sunlight is used for fixing carbon dioxide and using carbon from it to produce sugars, amino acids and the many other carbon compounds on which life is based. There are three groups of photosynthesizers:
• plants, including mosses, ferns, conifers and flowering plants
• eukaryotic algae including seaweeds that grow on rocky shores and unicellular algae such as Chlorella
• several groups of bacteria including cyanobacteria (blue–green bacteria) and purple bacteria.
Photosynthesis therefore occurs in two of the three domains of life: in eukaryotes and bacteria, but not in archaea.
Figure 4 P. caerulea eating a gnat
▴ Table 1 Oxygen requirements of organisms
▴ Figure 5 Winogradsky column in a glass bottle
B4.2.4 Holozoic nutrition in animals
Animals obtain supplies of carbohydrates, amino acids and other carbon compounds by consuming food. They are heterotrophic, because the carbon compounds come from other organisms. Molecules such as polysaccharides and proteins must be digested before they can be absorbed. Digestion in most animals happens internally, after the food has been ingested. This is holozoic nutrition, meaning that whole pieces of food are swallowed before being fully digested.
This is the sequence of stages in holozoic nutrition:
1. ingestion — taking the food into the gut
2. digestion — breaking large food molecules into smaller molecules
3. absorption — transport of digested food across the plasma membrane of epidermis cells and thus into the blood and tissues of the body
4. assimilation — using digested foods to synthesize proteins and other macromolecules and thus making them part of the body’s tissues
5. egestion — voiding undigested material from the end of the gut.
Some animals digest their food externally so they are not holozoic. Spiders, for example, inject digestive enzymes into their prey and suck out the liquids produced. They absorb the products of digestion in their gut and then assimilate them. absorption assimilation digestion ingestion
or animal kingdoms so
in another kingdom, called either Protista
lumen of gutepidermis of gut
B4.2.5 Mixotrophic nutrition in some protists
Autotrophs make their own carbon compounds from simple substances including carbon dioxide. Heterotrophs obtain their carbon compounds from other organisms. Some unicellular eukaryotes (protists) use both methods of nutrition. Organisms that are not exclusively autotrophic or heterotrophic are mixotrophic. Facultative mixotrophs can be entirely autotrophic, entirely heterotrophic, or use both modes. Euglenagracilis, for example, has chloroplasts and carries out photosynthesis when there is sufficient light, but it can also feed on detritus or smaller organisms by endocytosis, so it is a facultative mixotroph.
Obligate mixotrophs cannot grow unless they utilize both autotrophic and heterotrophic modes of nutrition. This may be because the food that they consume supplies them with a carbon compound that they cannot themselves synthesize. In other cases, a protist that does not have its own chloroplasts obtains them by consuming algae. It uses the “klepto-chloroplasts” obtained in this way for photosynthesis until they degrade and have to be replaced.
Data-based questions: Mixotrophy in golden algae
Two strains of the golden alga Ochromonas were isolated, from the Atlantic Ocean east of New Jersey (isolate 1393) and from the Pacific Ocean east of Taiwan (isolate 2951). Their growth rates were measured in three combinations of conditions: light but no prey (autotrophic), prey but no light (heterotrophic) and both prey and light (mixotrophic). The prey supplied to the algae were Vibrio bacteria.
1.Compare and contrast the growth rates for the two isolates. [4]
2.Deduce, with reasons, whether isolate 1393 is an obligate mixotroph, a facultative mixotroph, or not a mixotroph. [3]
3.Discuss the nutrition of isolate 2951. [3]
▴ Figure 11 Growth rates of two isolates of the alga Ochromonas
▴ Figure 6 Holozoic nutrition
▴ Figure 7 Arabidopsis thaliana — the autotroph that molecular biologists use as a model plant
▴ Figure 9 Euglena — a facultative mixotroph. Organisms such as Euglena do not fit into the plant
are placed
▴ Figure 8 Humming birds are heterotrophic; the plants from which they obtain nectar are autotrophic
▴ Figure 10 Ochromonas sp. can make their own food through photosynthesis, but can also uptake both dissolved organic nutrients and particulate organic matter, including intact cells
12
by secreting digestive enzymes
B4.2.6 Saprotrophic nutrition in some fungi and bacteria
Saprotrophs secrete digestive enzymes into the dead organic matter and digest it externally. They then absorb the products of digestion. Many types of bacteria and fungi are saprotrophic. They are also known as decomposers because they break down carbon compounds in dead organic matter and release elements such as nitrogen into the ecosystem, allowing them to be used again by other organisms.
Activity: Determining trophic level
By answering a series of simple questions about an organism’s mode of nutrition it is usually possible to deduce what trophic group it is in. The questions are presented in Figure 13 as a dichotomous key, which consists of a series of pairs of choices. The key works for unicellular and multicellular organisms, but not for parasites such as tapeworms or fungi that cause diseases in plants.
Feeds on living or recently killed organisms = CONSUMERS
Feeds on dead organic matter = DETRITIVORES
Either ingests organic matter by endocytosis (no cell walls) or by taking it into its gut.
Data-based questions: Fishing down marine food webs
Trophic levels can be represented by a number indicating the position of a species within an ecosystem. By definition, the producers occupy the first trophic level (TL) and so have a TL of 1. For primary consumers, TL=2, and so on.The higher the number, the more energy-transfer steps between the organism and the initial fixing of the sun’s energy. Trophic levels are not always stated as whole numbers. Fish and other animals that feed at more than one level often have estimated mean trophic levels.
One effect of commercial over-fishing is the reduction in the number of fish that feed at higher trophic levels (i.e. long-lived fish). The phrase “fishing down marine food webs” refers to the increased tendency for marine landings to consist of animals that feed at lower trophic levels (Figure 14).
1.Suggest a method that might be used to deduce the trophic level of a fish once it is captured.[2]
2.a. Compare the changes in mean trophic level of landed fish from marine and freshwater fisheries since 1970. [3]
b.Suggest why there is a difference in the two trends. [2]
3.Explain why the mean trophic level might increase with age in an individual fish. [2]
4.Deduce the change in age of captured fish over the period shown. [2]
5.Explain two advantages of humans catching and consuming fish at a lower mean trophic level.[4]
START HERE
Cell walls present. No ingestion of organic matter. No gut.
Secretes enzymes into its environment to digest dead organic matter = SAPROTROPHS
▴ Figure 13 A dichotomous key
Enzymes not secreted. Only requires simple ions and compounds such as CO2 = AUTOTROPHS
▴ Figure 14 How the mean trophic level of landed fish has changed over a 30-year period
B4.2.7 Diversity of nutrition in archaea
There are three domains of life: archaea, bacteria and eukaryotes. The archaea are unicellular and have no nucleus, which is a similarity with bacteria. In other respects archaea are closer to eukaryotes.
Some types of archaea are adapted to extreme environments such as hot springs, salt lakes and soda lakes. Many are difficult to culture in the laboratory, so they are less well researched than the other domains of life.
Archaea are extremely diverse in the energy sources used for ATP production. There are three main categories:
• phototrophic — absorption of light energy by pigments — but pigments other than chlorophyll are used
• chemotrophic — oxidation of inorganic chemicals, for example Fe2+ ions to Fe3+
• heterotrophic — oxidation of carbon compounds obtained from other organisms.
▴ Figure
Saprotrophic fungi growing over the surfaces of dead leaves and decomposing them
▴ Figure 15 Chimpanzees have much larger canines than humans
Activity: Deducing diet
B4.2.8 Relationship between dentition and the diet of omnivorous and herbivorous
representative members of the family Hominidae
The family Hominidae includes the genera that contain humans (Homo), orang-utans (Pongo), gorillas (Gorilla), and chimpanzees (Pan). Some members of the Hominidae have an exclusively herbivorous diet and others are omnivorous — some animal prey is included in the diet. Living members of the Hominidae show a relationship between diet and dentition. This can be studied using physical collections of skulls in natural history museums or digital collections available online such as those found at eSkeletons.org, a database sponsored by the University of Texas at Austin.
The teeth of herbivores tend to be large and flat to grind down fibrous plant tissues. Omnivores tend to have a mix of different types of teeth to break down both meat and plants in their diet. Humans have flat molars in the back of their mouth to crush and grind food, and sharper canines and incisors than herbivores to tear tougher food, like meat.
Once the structure–function relationships have been established, the diet of extinct species in the Hominidae can be inferred from their dentition — for example, in Homo floresiensis and Paranthropus robustus
Figure 16 shows the fossilized jaw and teeth of an individual of Australopithecus anamensis, who lived about 4.1 million years ago. The jaw in Figure 17 is from a female Homo neaderthalensis who lived more than 110,000 years ago (before the last glaciation).
What, if anything, can be deduced about their diet?
Theories: Making deductions about diet from fragmentary evidence
A theory in science is a general explanation that is widely applicable. Theories can be based on observed patterns. Predictions can be generated from these theories by deductive reasoning. If observations are made of dentition in animals with known diets, including herbivores, carnivores and omnivores, theories can be developed about the structure–function relationships of teeth. These theories can be tested by predicting the diet of living animals from the characteristics of their teeth and then checking whether the actual diet matches the
B4.2.9 Adaptations
prediction. This may corroborate the theories or show that they are false and should be rejected.
Theories about dentition can also be used to infer the diet of extinct species of hominid; however, it is not possible to verify these predictions — we cannot be sure what the diet of an extinct hominid was. Are such predictions therefore non-scientific? What if skeletons of prey species are found in the vicinity of the extinct fossil hominid? Can this increase the certainty?
of herbivores for feeding on plants and of plants for resisting herbivory
Animals that feed exclusively on plants are herbivores. They have structural features that adapt them to their diet. Insect mouthparts show great diversity, but are all homologous — they have been derived by evolution from the same ancestral mouthparts. Most insects are herbivores. Insects that feed on leaves can be divided into two broad groups:
• beetles and other insects with jaw-like mouthparts for biting off, chewing and ingesting pieces of leaf
• aphids and other insects with tubular mouthparts for piercing leaves or stems to reach phloem sieve tubes and feed on the sap.
▴ Figure 16 Jaw of Australopithecus anamensis
▴ Figure 17 Jaw of Homo neanderthalensis
▴ Figure 18 Frog beetle (Sagra buqueti) has chewing mouthparts for feeding on leaves
▴ Figure 19 Rose aphids (Macrosiphum rosae have piercing mouthparts
Plants show a variety of adaptations for deterring herbivore attacks. Some have tough sharp-pointed spines, so herbivores risk injury when eating it. Others have stings to cause pain. Many plants synthesize substances that are toxic to herbivores. These substances are secondary metabolites. (Primary metabolites are substances that are part of the basic metabolic pathways of a cell.) They may be stored in any part of a plant, particularly seeds, which are attractive to herbivores because of their high concentrations of protein and starch or oil.
plants
synthesize toxic glycosides to deter herbivores, but the milkweed aphid
) not only tolerates these glycosides, it also makes itself toxic to predators by accumulating them
In some cases, herbivores have responded to toxic compounds in plants by developing metabolic adaptations for detoxifying them. This has resulted in plant–herbivore specificity, with only a few species of herbivore adapted to feed on a particular plant.
B4.2.10 Adaptations of predators for finding, catching and killing prey and of prey animals for resisting predation
Predators are adapted to find suitable prey and then catch and kill it. The prey may be killed before it is ingested, or it may die inside the predator’s digestive system. Prey species are adapted to resist predation. Selected examples of adaptations are shown in Table 2, but there are many others. These adaptations may be structural, chemical or behavioural.
q Table 2 Some adaptations of prey and predators Type Predators Prey
▴ Figure 23 Vampire bats (Desmodus rotundus) have unique dentition, with small premolars and no molars, but relatively large incisors and canines on their upper jaw that are pointed and razor-sharp. These are used to pierce prey, so the vampire can feed on the blood
Chemical
▴ Figure 25 Black mambas (Dendroaspis polylepis) produce venom containing a mixture of neurotoxins, including an inhibitor of the enzyme acetylcholinesterase.
The venom paralyses prey when injected via poison fangs.
The snake can then swallow the prey without it resisting
Behavioural
▴ Figure 27 Grizzly bears (Ursos arctos) learn ambush strategies for catching migrating salmon either by trial and error or copying others. Some bears wait at the top of waterfalls for a fish to jump out of the water. Others put their heads underwater and watch for a fish swimming past
▴ Figure 24 Buff-tip moths (Phalera bucephala) resemble broken birch twigs, giving them camouflage when roosting during daylight hours on twigs or on the ground. This is the time when the night-flying moths are most vulnerable to predation
▴ Figure 26 Caterpillars of the cinnabar moth (Tyria jacobaeae) feed on ragwort and accumulate toxic alkaloids from it. Their black and yellow stripes are warning coloration which deters predators. Adults are day-flying, with red and black warning coloration, indicating that they retain toxins obtained when the larvae fed on ragwort
▴ Figure 28 Blue-striped snappers (Lutjanus kasmira swim in a tight group, often with sudden changes of direction. This “schooling” behaviour reduces the chance of predation, because threats are more likely to be detected and it is difficult for a predator to catch any one individual in the bewildering shoal
▴ Figure 20 Stings on the tree nettle (Urtica ferox) which is endemic to New Zealand
▴ Figure 22 Milkweed
(Asclepias tuberosa)
(Aphis nerii
▴ Figure 21 Spines on a leaf stalk of the fan palm (Saribus rotundifolius)
Behavioural adaptations can change relatively quickly. For example, in the 1920s blue tits started feeding on cream from milk bottles delivered to doorsteps. This behaviour spread rapidly across Europe, but disappeared as rapidly when deliveries of bottled milk with cream diminished in the 1990s. Structural adaptations take longer to develop because there must be genetic change, but research on seed-eating finches on the Galapagos islands shows that their beaks soon start to change in size and shape when the size of seeds available on an island changes. Chemical adaptations are usually the slowest to change, because new enzymes may be needed or new ways of regulating enzymes and this may take millions of years.
B4.2.11 Adaptations of plant form for harvesting light
In environments where there is enough water for abundant plant growth and temperatures are suitable for photosynthesis, plants compete for light. Forest ecosystems develop in such environments. Plants use a variety of strategies in forests for obtaining light, so show great diversity of form.
trees in the forest canopy including emergents which are the tallest individuals
• Trees have a dominant leading shoot that grows rapidly to great height to reach the forest canopy where they are unshaded by other trees.
• Lianas climb through other trees, using them for support. This means lianas do not need to produce as much xylem tissue (wood) as free-standing trees.
• Epiphytes grow on the trunks and branches of trees, so they receive higher light intensity than if they grew on the forest floor, but there is minimal soil for their roots.
• Strangler epiphytes climb up the trunks of trees encircling them and outgrowing their branches, to shade out the leaves of the tree. Eventually the tree dies leaving only the epiphyte.
• Shade-tolerant shrubs and herbs absorb light reaching the forest floor.
B4.2.12 Fundamental and realized niches
Living organisms tolerate a range of biotic and abiotic conditions, but their adaptations do not allow them to survive outside this range. The range of tolerance is the fundamental niche of the species. If the species were living without any competitors, it would occupy the entire fundamental niche. In natural ecosystems, there is competition and typically a species is excluded from parts of its fundamental niche by competitors. The actual extent of the potential range that a species occupies is its realized niche.
B4.2.13 Competitive exclusion and the uniqueness of ecological niches
Where the fundamental niches of two species overlap, one species is expected to exclude the other from that part of its range by competition. This was demonstrated experimentally with the flour beetles Tribolium castaneum and Tribolium confusum. When reared together at different combinations of temperature and humidity, T. castaneum usually excluded T. confusum in some combinations but T. confusum was more successful in other combinations. In the pie charts in Table 3, blue segments indicate the percentage of trials where T. confusum excluded T. castaneum and orange segments indicate the converse.
▴ Figure 29 Blue tit (Cyanistes caeruleus) feeding on cream after pecking through the foil cap of a milk bottle
◂ Figure 30 Tropical rainforest is characterized by great diversity of plant form
lianes strangler epiphyte shade-tolerant shrubs and herbs
q Table 3 Competition between T. castaneum and T. confusum at various temperatures and humidty levels
If two species in an ecosystem have overlapping fundamental niches and one species outcompetes the other in all parts of the fundamental niche, the outcompeted species does not have a realized niche and will be competitively excluded from the whole ecosystem. According to ecological theory, every species must have a realized niche that differs from the realized niches of all other species if it is to survive in an ecosystem.
Data-based questions: Competitive exclusion in cat-tails
Typha latifolia and Typha angustifolia are two species of plant that grow on the margins of lakes. The upper graph shows primary production of each species when growing together in a natural ecosystem. The lower graph shows the biomass of transplants of the two species when grown without any competition. Negative depth means growing out of the water.
1. Compare and contrast the growth of T. angustifolia and T. latifolia in the absence of competition. [4]
2. Distinguish between the growth of T. angustifolia with and without competition from T. latifolia. [2]
3. Analyse the data in the graphs using the concepts of fundamental and realized niches. [4]
Linking questions
1. What are the relative advantages of specificity and versatility?
a. Outline the role of specificity in enzyme function. (C1.1.7)
b. Explain the evidence for evolution provided by the pentadactyl limb. (A4.1.4)
c. Explain what is meant by the universality of the genetic code. (A2.1.7)
2. For each form of nutrition, what are the unique inputs, processes and outputs?
a. Explain what is meant by holozoic nutrition. (B4.2.4)
b. Distinguish between the mechanisms of digestion of detritus feeders and saprotrophs. (C4.2.12)
c. Outline one example of mixotrophy. (B4.2.5)
Are some types of knowledge less open to interpretation than others?
In everyday language, the word “interpretation” implies more than one possibility. In biology, there can be competing explanations for a phenomenon, particularly if there is fragmentary evidence because the subject material is uncontrollable. In such situations, there is greater tolerance for more than one interpretation. However, knowledge such as the structure of skeletal muscle fibres is not open to interpretation. It is a straightforward matter to verify the consensus view about their structure. This is because it is possible to obtain further samples to examine, and the methods of exploring cellular ultrastructure are reliable.
The structure of skeletal muscle fibres is clearly visible through
When a palaeoanthropologist uncovers a skull, it is an artefact of the natural world. Scientists would participate in the analysis of such a bone. However, it is not possible to expand the study by looking at more skulls from the population if only one has been found. This is the case of the short-statured Homo floresiensis discovered on the island of Flores in Indonesia. Only one skull from this species has ever been found, though bones and teeth from 14 other individuals have been uncovered. Tools and bones of prey species have been found along with the H. floresiensis skeletal fragments. Some of the skeletal features suggest a relationship to more primitive species while other suggest it is a more modern species. One interpreation is that H. floresiensis is a descendant of H. erectus that underwent a process known as island dwarfism.
▴ Figure 2 H. floresiensis skull (left) next to computer artwork of a human (H. sapiens) skull (right)
An example of an area where disagreements due to different interpretations persist is in the phylogeny of the red wolf (Canis rufus or C. lupus rufus). The modern population is very small and has hybridized with coyotes. Efforts to bring the population back from extinction have depended on the introduction of animals from other populations. Viewpoints differ as to whether or not the present very small population of red wolves is worth preserving. Conservation efforts are expensive and financial resources for conservation are scarce. The US Fish and Wildlife Service currently recognizes the red wolf as an endangered species and grants protected status. The International Union for the Conservation of Nature has listed the red wolf as a critically endangered species. However, the red wolf is not recognized in the CITES appendices of endangered species. One interpretation is that the historical red wolf is a distinct species whereas the modern red wolves trace some of their ancestry to historic red wolves but hybridization with other wolves and coyotes has continued, threatening the distinctiveness of the population.
End of chapter questions
1. One method used by microbiologists to distinguish between the Archaea and Eubacteria is the conditions they need for survival. Both groups include thermophiles, which are species that are adapted to live at high temperatures. The graph shows the optimum temperature and minimum pH required for growth by selected species of Archaea and thermophilic Eubacteria.
mean surface slope at different wear stages
Archaea Key: thermophilic Eubacteria
a. State the highest optimum growth temperature recorded for the thermophilic Eubacteria. [1]
b. State the relationship between minimum pH supporting growth and optimum growth temperature for Archaea. [1]
c. Compare the results for the Archaea with those for the thermophilic Eubacteria. [2]
d. With reference to the data, suggest why this method would not always be suitable for distinguishing between Archaea and thermophilic Eubacteria. [2]
e. State a possible habitat for methanogenic Archaea. [1]
2. New technologies such as dental topographic analysis are being used to help understand how early Hominids lived. This technique allows the pattern of wear of teeth over a lifetime to be analysed, revealing what types of food were eaten. Teeth from early humans and Australopithecus afarensis were compared. The upper surfaces of the teeth were analysed for slope. The teeth examined were in groups of similar stages of wear to ensure consistency of results. The lower the slope, the flatter the teeth. Flat teeth are best suited to crushing hard, brittle foods. More shaped teeth are better suited to eating elastic foods such as meat. wear stages
early humans Key: A. afarensis
a. State what changes occurred to all teeth with wear. [1]
ii Compare the teeth of early Hominids with those of A. afarensis [2]
b. Using the data, suggest how the diets of early Hominids and A. afarensis differed. [2]
c. Suggest what other evidence would help scientists to determine what food was eaten by early Hominids. [2]
▴ Figure 1
microscopy
▴ Figure 3 A modern red wolf
Interested in evaluation?
Click here to sign up for free trial access to DP Science and discover how our digital offer can support you and your students
Seeking a print only option? Click here to sign up for an online evaluation copy