MYP Mathematics 4&5 Standard Print and Enhanced Online Book Pack - Sample Pages
4 Mathematically speaking
Statement of inquiry:
Understanding health and validating lifestyle choices results from using logical representations and systems.
Key concept:
Logic is a method of reasoning and a system of principles used to build arguments and reach conclusions.
F How can representing language with symbols facilitate the operations?
Representation is the manner in which something is presented.
Is a picture worth a thousand words?
ABCD is a quadrilateral. AB is parallel to CD and perpendicular to BC Angle ADC = 70°. Find angle DAB
● How does drawing a diagram help you solve this problem?
● Could you solve it without a diagram?
C How do axioms enhance the understanding of logic?
Axiomatic system for number
You have been working with the real number system since you first learned to count. The number system is based on a set of axioms, which are assumed to be true for real numbers. Verify the axioms below for real numbers x,y and z.
Addition and multiplication are:
Commutative: x + y = y + x xy = yx
Associative: (x + y) + z = x + (y + z)
(xy)z = x(yz)
Distributive: x(y + z) = xy + xz
These axioms form the basis for all of your number skills.
D What factors validate our lifestyle decisions?
Validation is the use of well-founded, logical mathematics to come to a true and accurate conclusion or a reasonable interpretation of results.
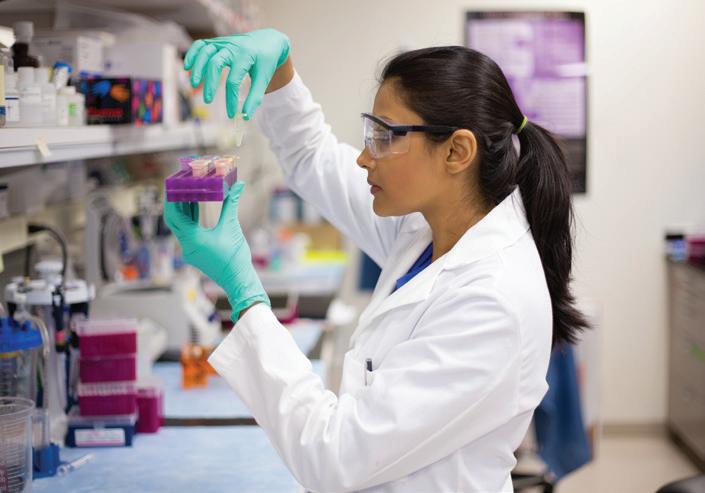
Validation in medical research
Pharmaceutical companies are continually trying to produce new medicines to treat as-yet incurable conditions, or to treat curable conditions more effectively. Before a new drug can go on sale, the company needs to justify that the drug is safe and effective. To do this, they run clinical trials to test the drugs on humans and collect evidence on positive results as well as negative side effects.
All clinical trials have to be approved by a scientific and ethical committee. The researchers must justify that the volunteers in the trial will not be exposed to unnecessary risk, and that the new drug can reasonably be expected to improve patient care.
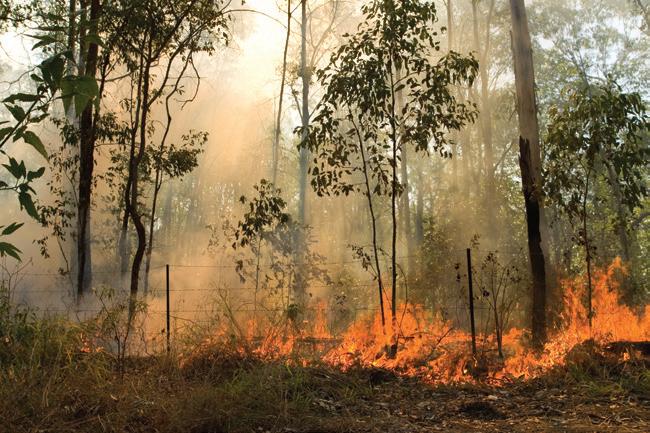
Ecosystems
When an ecosystem is in balance, all the living organisms within it are healthy and capable of reproducing themselves. If one part of the ecosystem is damaged – either by natural events or human activity – every other element of the ecosystem is affected.
Forest fires cause widespread destruction, but fire is a natural and vital element in some forest ecosystems. After a fire, more sunlight can reach the forest floor, which is free from dead wood and leaf litter and has increased nutrient levels from the ash. This creates perfect conditions for some trees and plants to thrive. Some species have evolved to withstand fire (or sometimes even rely on it) as part of their life cycle. For example, sand pine cones open to disperse their seeds only in intense heat.
Global context: Identities and relationships
Exploration: Explore personal and physical health and good lifestyle choices
Launch additional digital resources for this unit.
4.1 Set operations and Venn diagrams
Global context: Identities and relationships
Related concepts: Validity
Objectives
● Finding the intersection and union of sets
● Drawing Venn diagrams to represent real-life situations
● Interpreting Venn diagrams to solve real-life problems
● Applying the language of sets to different areas of mathematics
● Using the language of sets to model real-life problems
ATL
Communication
Organize and depict information logically
Inquiry questions
F C
D
● What are set operations?
● How do you represent sets and their operations?
● Can diagrams and drawings be used to validate mathematical laws?
● How does a Venn diagram help to interpret a real-life situation?
● How useful are sets and Venn diagrams in solving real-life problems?
Statement of inquiry:
Understanding health and validating lifestyle choices results from using logical representations and systems.
Launch additional digital resources for this chapter.
You should already know how to:
● list prime numbers between two given numbers
● find factors and multiples of integers
1 What are the prime numbers between 1 and 30?
2 What are the factors of 3 between 1 and 31? What are the multiples of 4 between 1 and 31?
● find the complement of a set 3 If A = {Odd numbers}, what is A′?
F
Set operations
● What are set operations?
● How do you represent sets and their operations? You have learned an operation used on sets, namely the complement of a set. Just like arithmetic operations, the branch of mathematics called Set Theory also has its own operations. The complement of a set, A′, is defined as the elements in the universal set that are not in set A. There are other set operations that you will learn about in the following exploration.
Exploration 1
1 U = {cats, dogs, monkeys, zebras, kangaroos, horses}
A = {cats, dogs, horses}
B = {cats, monkeys, zebras, horses}
C = {dogs, kangaroos, horses}
Create the following sets, but remember that you use an element only once in a set:
a The set of elements common to both B and C.
b The set of elements in either A or C, or both.
c The set of elements common to all three sets A, B and C.
d The set of elements in either of the sets A, B and C, or all 3 sets.
2 U =
A = {factors of 3}
B = {multiples of 4}
C = {prime numbers}.
Create the following sets:
a Write out the elements of sets U, A, B, and C
b The set of elements common to A and B
c The set of elements common to both A and C
d The set of elements in either A or C, or both.
e The set of elements common to A, B, and C. { x x ∈ !, 0 ≤ x ≤ 20}
Continued on next page
f The set of elements in both A and C ′
g The set of elements in either A′ or B, or both.
h The set of elements that are not in the set of elements common to both A and C.
i The set of elements that are not in the set of elements common to both B and C
j The set of elements that are not in the set of elements in either A or C
Reflect and discuss 1
● Do you think that it would be convenient to have symbols for the operations between sets, ‘elements common to’ and ‘elements in either set’?
● How do symbols in mathematics facilitate doing mathematics?
There are symbols for the sets you have found in the previous exploration. To express the set of elements common to both A and B, mathematicians use the symbol ∩ between the sets. So, to find the set of elements common to both A and B, you would write A ∩ B. This is read as the intersection of sets A and B. In the same way, the symbol for the elements that are in either A or B, or both, is A ∪ B. This is read as the union of sets A and B
Just as you use arithmetic operations to manipulate numbers, sets also have their own operations.
Union and intersection of sets
● Union: A ∪ B = x x ∈ A or x ∈ B { }
● Intersection: A ∩ B = x x ∈ A and x ∈ B { }
If A = {1, 2, 3} and B = {2, 3, 4, 5}, the set that contains all the elements that are in both A and B without repeating any of them is C = {1, 2, 3, 4, 5}. Set C is the union of sets A and B, and is written A ∪ B
The set that contains the elements that both sets have in common is D = {2, 3} D is the intersection of sets A and B, and is written A ∩ B.
Example 1
If U = {1, 2, 3, …, 10}, A = {2, 4, 6, 8}, B = {2, 3, 5, 7} and C = {1, 5, 9}, find:
a A ∩ C
b A ∪ B ′
c (A′ ∩ B) ′ d (A ∪ B ∪ C ) ′
a A ∩ C = ∅
b B ′ = {1, 4, 6, 8, 9, 10}
A ∪ B ′ = {1, 2, 4, 6, 8, 9, 10}
c A′ = {1, 3, 5, 7, 9, 10}
A′ ∩ B = {3, 5, 7}
(A′ ∩ B) ′ = {1, 2, 4, 6, 8, 9, 10}
d A ∪ B ∪ C = {1, 2, 3, 4, 5, 6, 7, 8, 9}
(A ∪ B ∪ C ) ′ = {10}
Practice 1
A and C have no elements in common.
First find B′ .
First find A′ ∩ B. (A′ ∩ B)’ is made up of the elements in U that are not in A′ ∩ B.
1 If U = x x ∈ ! + , 1 ≤ x ≤ 20 { }, A = {2, 4, 8, …, 20}, B = {1, 3, 5, …, 19} and C = x x ∈ primes, 1 ≤ x ≤ 20 { } , find:
a A ∩ B b A ∪ B c ′A ∩ C d A ∩ C ( )′ e ′A ∪ B ( )′
2 If U = ! , R = x x ∈ ! + , x < 10 { } , S = { x 5 < x < 5} and T = { x x ∈ !; x ≤ 15} , find:
a R ∩ S b R ∪ T c ′ R ∩ T d ′ S ∩ T e R ∩ S ( )′ ∩ T
Problem solving
3 The universal set is U = {11, 12, 13, 14, 15, 16, 17, 18, 19, 20}
Write three subsets F, G and H such that:
● n(F ∩ G) = 2
● F ∩ H = ∅
● ′ G = { xx is odd, 11 ≤ x ≤ 19}
Reflect and discuss 2
For any two sets, A and B, explain why the intersection A ∩ B is a subset of their union A ∪ B.
Try with any two sets A and B. Can you generalize your result?
REASONING WITH DATA
Venn diagrams
● Can diagrams and drawings be used to validate mathematical laws?
Venn diagrams
In a Venn diagram, a rectangle represents the universal set.
Circles represent subsets of the universal set.
It is important that you use the forms of representation correctly – for example, remembering to include the universal set in your Venn diagrams, or using curly brackets when listing the elements of a set.
Venn diagram for a set A and its complement A’
Venn diagram of the intersection of the two sets A and B: A ∩ B
This Venn diagram shows that the intersection of the two sets A and B is the empty set: A ∩ B = ∅ Sets A and B are disjoint.
This one shows the union of two sets A and B. The unshaded area outside the circles is therefore the complement of the union of A and B: (A ∪ B) ′ .
Exploration 2
1 Draw two Venn diagrams: in the first one shade the region that represents the set A′ ∩ B ′; in the second diagram shade the region that represents the set (A ∪ B) ′. Describe the relationship between these two sets mathematically.
2 Draw two Venn diagrams: in the first one shade the region that represents the set (A ∩ B) ′; in the second diagram shade the region that represents the set A′ ∪ B ′. Describe the relationship between these two sets mathematically.
3 Draw a Venn diagram to show that for any two sets, A and B, the intersection A ∩ B is a subset of their union A ∪ B. Do you think it was easier to prove this using reasoning in Reflect and discuss 2, or by drawing a diagram?
Reflect and discuss 3
● How many different ways have you represented the set A′ ∪ B ′ in Exploration 2?
● What can you say about A′ ∪ B ′ and (A ∩ B)′?
● How has representing sets using a Venn diagram helped you discover new information about sets?
Example 2
Draw Venn diagrams to represent these sets or relationship between sets.
The relationships you have discovered so far by using Venn diagrams are called De Morgan’s Laws, named after the British mathematician Augustus De Morgan. They are used extensively in the fields of circuitry and electronics, as well as in the field of logic.
Draw a rectangle representing the universal set. Set B is completely contained in A.
Shade the area that contains everything that is not in A, together with all of B
The shaded area represents what A and the complement of B have in common.
The shaded area shows the intersection of all three sets.
Shade the intersection of A and B first, then shade all of C
When drawing Venn diagrams it can be useful to shade one set using vertical lines and the other using horizontal lines. The union will be the total area shaded and the intersection of the sets is where the lines cross.
Practice 2
1 Draw Venn diagrams to represent each set.
a (A ∩ B)′ b A ∪ (A ∩ B)
c (A′ ∩ B)′ d (A′ ∪ B ′)′
A
)
Problem solving
2 Write the set that the shaded part of each Venn diagram represents.
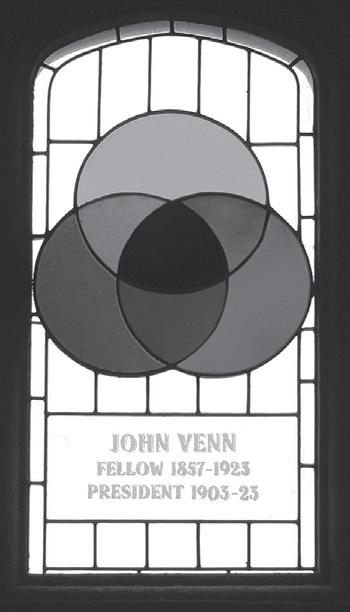
Venn diagrams are named after an English mathematician, John Venn. This stained glass window in Cambridge University commemorates his achievements.
You are already familiar with the properties of real numbers under the binary operations of addition and multiplication. In the following exploration you will determine which of these properties are also valid under the set operations of intersection and union.
Exploration 3
1 By drawing a Venn diagram for each side of the equals sign in the statements below, show that the following properties hold for set operations:
Commutative laws
Associative laws
Distributive laws
2 The additive identity of the real numbers is 0 since n + 0 = 0 + n = n and the inverse of n is n since n + ( n) = ( n) + n = 0.
The multiplicative identity of m is 1 since m × 1 = 1 × m = m and the inverse of m is 1 m since m × 1 m = 1 m × m = 1 (m ≠ 0).
Determine whether or not there is an identity and inverse for the operations ∪ and ∩.
Find sets B and C such that A ∪ B = B ∪ A = A and A ∩ C = C ∩ A = A B and C are the two identities.
Find if sets E and F exist such that A ∪ E = E ∪ A = B and A ∩ F = F ∩ A = C E and F, if they exist, are the inverses.
3 Summarize the properties of the set operations union and intersection.
Modelling real-life problems using Venn diagrams
● How does a Venn diagram help to interpret a real-life situation?
● How useful are sets and Venn diagrams in solving real-life problems?
Venn diagrams are used to model and solve problems in fields such as market research, biology, and social science, where ‘overlapping’ information needs to be sorted.
Example 3
A market research company surveys 100 students and learns that 75 of them own a television (T ) and 45 own a bicycle (B). 35 students own both a television and a bicycle. Draw a Venn diagram to show this information.
a Find how many students own either a television or a bicycle, or both
b Find how many own neither a television nor a bicycle.
c Explain how your diagram shows that 50 students own either a television or a bicycle, but not both.
Set theory is used by online shopping search engines. Data on products for sale is split into sets so that your search query will get a response more quickly.
n (B) = 45 and n (B ∩ T ) = 35, so n (B ∩ T ’) = 45 35 = 10
n (B ∩ T ) 35 10 + 35 + 40 = 85. 100 85 = 15 students remaining
= 100 35 10 40 15 BT
n (T ) = 75 and n (B ∩ T ) = 35, so n (T ∩ B ’) = 75 35 = 40
a The number of students who own either a television or a bicycle, or both is n (B ∪ T ) = 85.
b The number of students who own neither a television nor a bicycle is n (B ∪ T )′ = 15.
c The number of students who own either a television or a bicycle but not both can be seen as the union of the two sets less the intersection, or 10 + 40 = 50.
Practice 3
Objective: C. Communicating v. organize information using a logical structure
These questions encourage students to use Venn diagrams (and a table in Question 1) to organize information logically. The students should be able to draw and interpret Venn diagrams.
1 a i For the Venn diagram, describe the characteristics of only whales, of only fish, and those of both whales and fish.
ii Explain how the diagram has helped you with your descriptions and whether a different form could be more useful.
b i Below is a table describing some characteristics of whales, fish, and shrimp. Create a Venn diagram that illustrates these characteristics. Make sure to choose an appropriate universal set.
ii Explain whether the table form or the Venn diagram form is best to illustrate the given information.
2 In a year group of 50 students, 18 are enrolled in Music, 26 in Art, and 2 in both Music and Art. By drawing a Venn diagram, determine how many students are not enrolled in either Music or Art.
3 In a school of 350 students, 75 are involved in community service projects, 205 in athletics, and 62 are involved in both. By drawing a Venn diagram, determine how many students are involved in either one of these two activities.
4 In a school cafeteria at lunchtime, 93 students chose a soft drink and 47 students chose bottled water. 25 students chose both drinks. If each student chose one of these drinks, determine the total number of students in the cafeteria by drawing a Venn diagram.
5 Of 150 new university students, 85 signed up for Mathematics and 70 for Physics, while 50 signed up for both subjects. By drawing a Venn diagram, determine how many students signed up for:
a only Mathematics
b only Physics
c neither Mathematics nor Physics.
6 There are 30 students enrolled in three different school clubs: chess, archery and cookery. Of these, 5 students are in all three clubs, 6 of them are only in the cookery club, 2 are in chess and cookery but not archery, 15 belong to cookery in total, 2 are only in chess, and 3 are only in archery. By drawing a Venn diagram, determine how many students are in:
a the archery and cookery clubs only
b the chess club.
WHALES FISH
REASONING WITH DATA
7 In a class of 32 students, 5 live in the school town and travel to school by bus, and they have school lunches. 3 live in the school town and travel to school by bus, but do not have school lunches. 9 students do not live in the school town, do not travel to school by bus, and do not have school lunches. 11 students live in the school town and have school lunches. A total of 16 students live in the school town. 9 students travel to school by bus and have school lunches. 13 students travel to school by bus. By drawing a Venn diagram, determine how many students in total have school lunches.
Problem solving
8 The Venn diagrams below represent participants in an after school sports program. The students can choose to select table tennis (T ), basketball (B), or squash (S ).
Write in words what each diagram represents.
Exploration 4
1 n(U ) = 105, n(A) = 37, and n(B ) = 84. All of the elements of U are either in A or B or both.
a Draw a Venn diagram showing A, B and U
b Find a rule connecting the number of elements in A ∪ B with the number of elements in sets A, B, and the intersection of A and B.
c Justify your rule.
2 Apply your rule to the following situation. Your student council held a vote on which charity to support. A mobile library received 47 votes, and a neighborhood watch committee received 36 votes. 24 students voted for both charities. Determine how many students actually voted.
Reflect and discuss 4
In Exploration 4:
● How have you used sets to model the situation in step 2?
● Why was it easier to consider sets of students rather than considering the students individually?
● What set operation models the fact that some students voted for both charities?
Reflect and discuss 5
Working with one or more of your classmates, discuss how Venn diagrams can be used to organize and categorize some of the following situations: your school timetable, your household chores, your homework for different subjects, your test schedules. Create two Venn diagrams with at least three circles to illustrate the different situations you have chosen.
Summary
Union and intersection of sets
● Union: A ∪ B = x x ∈ A or x ∈ B { }
● Intersection: A ∩ B = x x ∈ A and x ∈ B { }
Mixed practice
1 U = { x x ∈ !} , A = { x x ∈ !, x is a multiple of 7} , B = {1, 3, 5, 7, 9, …, 19} and C = { x x ∈ primes 5 < x ≤ 20}
Find:
a A ∩ B
b A′ ∩ C
c A ∩ B ′
d (A ∩ C )′
2 Create Venn diagrams to represent the sets:
a A ∩ B ′ b A′ ∪ B
3 The table shows the facilities at three hotels in a resort.
4 Create a Venn diagram to illustrate the relationships of the following number sets: = {real numbers}, = {integers}, = {rational numbers}, I = {irrational numbers}, = {natural numbers}, and P = {prime numbers}
5 Create a Venn diagram illustrating the relationships of the following geometric figures: U = {all quadrilaterals}, P = {parallelograms}, R = {rectangles}, S = {squares}, K = {kites}, T = {trapezoids}.
6 If U = {−10, 9, …, 9, 10}, A = {0, 1, 2, …, 9}, B = {−9, 8, …, 0} and C = {−5, 4, …, 4, 5}, list the elements of the following sets:
a A ∩ B b (B ∪ C )′
c (A ∪ B ) ∩ C d A′ ∩ (B ∪ C )
e (A ∩ B ) ∪ (A ∩ C )
7 Determine whether the following statements are true or false. If false, explain why.
a 0 ∈
b {primes} ⊆ {odd integers}
c If U = , then ( + ∩ )′ = {0}
d 2 ⊆ {primes}
Draw a Venn diagram to represent this information.
REASONING WITH DATA
Problem solving
8 In a school sports day, medals were awarded as follows: 36 in running, 12 in high jump, and 18 in discus. The medals were awarded to a total of 45 students, and only 4 students received medals in all three events. Determine how many students received medals in exactly two out of three events.
9 A survey of 39 university students found:
● 10 worked part-time while studying
● 18 received financial help from home
● 19 withdrew money from their savings as needed
● 2 financed themselves from all three sources
● 12 received financial help from home only
Review in context
Identities and relationships
1 Below is a Venn diagram used by medical researchers showing the genes associated with different brain diseases.
The sets represent the number of genes associated with:
A = {Alzheimer’s disease}
M = {multiple sclerosis}
S = {stroke}
G = {brain diseases}
Using this diagram:
a Calculate how many genes in total are associated with each of the three diseases: Alzheimer’s, multiple sclerosis, and stroke.
b State how many genes all three diseases share in common.
c Explain how this diagram might be useful to medical researchers.
● 5 received financial help from home and withdrew money from savings
● 6 financed themselves only by working part-time and withdrawing money from savings.
Determine how many students:
a did not finance themselves using any of the three resources
b worked part-time and received money from home
c received financial help from home and withdrew money from their savings
d financed themselves using only one of the three ways surveyed.
Problem solving
2 Venn diagrams are widely used to show ‘overlapping’ concepts. Here are two fields from Sociology and Environmental Science where a Venn diagram can be used to illustrate the interrelation of key concepts.
In each example, identify sets and draw a Venn diagram to illustrate the information given.
a According to Plato there are many propositions. Some of these are true and some are beliefs (some may be neither). Only true beliefs can be justified and those he defines as knowledge.
b There are three main types of development: environmental, social and economic. Development that is both social and economic is equitable, that which is economic and environmental is viable, and that which is environmental and social is bearable. Development that is all three of these is sustainable.
3 Scientists have studied the genome of a number of organisms. The genome contains all the information used to build and maintain that organism. For medical researchers, knowing that different species share particular genes will enable them to unlock the secrets of countless diseases.
The Venn diagram shows the genes of four species: human, mouse, chicken, and zebrafish.
Using the diagram:
a Determine how many genes are shared by all four species
b Determine how many genes does a human have in total.
c Determine how many genes are shared by human and mouse, by human and chicken, and by human and zebrafish.
d Determine the percentage of genes shared by the human and each of these three species
e If you were a medical scientist and you wanted to conduct research into a species that was genetically closest to the human, which of the three – mouse, chicken or zebrafish –would you choose?
Reflect and discuss 6
How have you explored the statement of inquiry? Give specific examples.
Statement of inquiry:
Understanding health and validating lifestyle choices results from using logical representations and systems.
4.2 Probability of single and combined events
Global context: Identities and relationships
Related concept: Representation
Objectives
● Understanding and using formal probability axioms and notation
● Representing sample spaces in tables, lists and diagrams
● Drawing tree diagrams, Venn diagrams and two-way tables
● Calculating probabilities from Venn diagrams and two-way tables
● Using tree diagrams to calculate probabilities with and without replacement
● Understanding informal ideas of randomness
Inquiry questions
F
C D
● What are the axioms of probability?
● What are the different ways of representing a sample space?
● How do you calculate the probability of an event?
● How do you calculate the probability of combined events?
● What are the advantages and disadvantages of the different probability representations?
● Does randomness affect the decisions we make?
Communication
Understand and use mathematical notation
Statement of inquiry:
Understanding health and validating lifestyle choices results from using logical representations and systems.
You should already know how to:
● calculate simple probabilities
● use set notation, specifically the complement of a set
1 This spinner is spun once. What is the probability that it lands on
a blue
b yellow
c blue or white
d blue or yellow
e not yellow?
2 a Using set notation, write the set P of prime numbers less than 10.
b Let the universal set
U = {1, 2, 3, 4, 5, 6, 7, 8, 9, 10}. Write down the elements of P′.
c Write down n(P) and n(P′).
● draw a Venn diagram
3 In a group of 24 children, 10 of them like bananas, 16 of them like apples and 7 children like both.
Draw a Venn diagram to represent this information.
F
The axiomatic system for probability
● What are the axioms of probability?
● What are the different ways of representing a sample space?
● How do you calculate the probability of an event?
Probability theory determines the likelihood of an event happening. For an event A, probability assigns a numerical value P(A), called the probability of the event A. P(A) is a measure of the likelihood or chance that A occurs.
Probability is a system which satisfies a set of axioms.
Exploration 1
1 Use these probability terms to describe the probability of each event listed below.
a You will get full marks on your next English test.
b You will be given homework tonight.
c The last meal you ate was breakfast.
d It will snow tomorrow.
e When you add 2 and 2 you will get 5.
f Brazil will win the next World Cup.
g The Queen of Denmark will come to your maths class tomorrow.
h The sun will come up in the morning.
A system is a group of interrelated elements. An axiomatic system is governed by a set of axioms or rules. Everything in the system obeys the rules.
We use probability in many applications, including weather forecasting, science, social science, philosophy and psychology. certain likely unlikely very likely even chance very unlikely impossible
2 Suggest approximate numerical values for the probability of each event in step 1
3 In a raffle, a total of 500 tickets are sold. Find the probability that you win the prize if you buy:
a 10 tickets b 50 tickets
c 0 tickets d 500 tickets
4 Describe each event in step 3 with a probability term (like those in step 1).
Reflect and discuss 1
● Can you think of real-life events where the probability of the event occurring would be 0?
● Can you think of real-life events where the probability of the event occurring would be 1?
In Exploration 1, you should have seen that that the smallest value a probability can ever take is zero (an impossible event). This is the first axiom of probability.
Axiom 1
For any event A, P(A) ≥ 0. This means that all probabilities have a value greater than or equal to zero.
Exploration 2
A new restaurant in town runs a promotion to generate business. Before a person pays their bill, they are given a sealed envelope with a message inside that either says ‘Your meal today is free’ or ‘Sorry, better luck next time’.
The restaurant owners claim that the chance of a winning message is 1 in 6.
During a one-hour period on the first day, eight customers pay their bill, and three of them get a winning message.
To test that the restaurant’s claim is correct, you can set up a simulation. Assume that they are correct and a winning message indeed appears in 1 out of every 6 sealed envelopes. The probability of winning is therefore the same as rolling a six on a fair die.
1 Roll a die 8 times to simulate 8 people paying their bills.
2 Record the number of 6s you roll.
Continued on next page
An axiom is a statement whose truth we assume without proof.
The probability of 1 in 6 is true for any number on a standard die; you could record 3s or 4s, as long as you were consistent.
3 Repeat this process 30 times. Combine the results for others in a spreadsheet.
Based on the combined results of the simulation:
4 Calculate the percentage of outcomes where 8 bills paid resulted in 3 winners.
5 Calculate the percentage of outcomes with no winners.
6 Deduce the most common number of winners in 8 bills paid.
7 Discuss whether the 8 people who had 3 winners were just lucky. Do you think the restaurant printed too many winning messages?
Reflect and discuss 2
● Aside from rolling a die, what other way(s) could you have used to simulate the probability of 1 winning message in 6?
● What number of winners from 8 people is most likely?
Simulation is a powerful tool to investigate the probabilities of events and predict what might happen in the future. You can also find probabilities by constructing a sample space for the experiment or situation.
When you flip a standard die, it will land on one of six possible numbers, 1, 2, 3, 4, 5, or 6. This forms the sample space, S, where S = {1, 2, 3, 4, 5, 6}. When you flip a coin, you can either get heads (H ) or tails (T ), so S = {H, T}.
The sample space S, is a representation of the complete set of all possible outcomes from an experiment. It can be a list, a table or a diagram.
An event that is certain to occur has probability 1. The whole sample space S includes all the possible events, so the probability that one of those events occurs is 1. This is the second axiom of probability.
Axiom 2
For a sample space S, P(S ) = 1. In other words, the probability of all occurrences is equal to 1.
A natural consequence of axioms 1 and 2 is that the probability of any event happening is a number between 0 and 1, 0 ≤ P( A) ≤ 1
Your GDC or other software can run simulations that perform the experiment thousands or even millions of times.
If you ever calculate a probability which is less than 0 or greater than 1, you have made a mistake.
REASONING WITH DATA
Example 1
Two fair 6-sided dice are rolled. One die is blue and the other is red.
6 (6, 1) (6, 2) (6, 3) (6, 4) (6, 5) (6, 6) As a table As a diagram As a set
The table is the most common representation of a sample space.
Practice 1
Objective C: Communicating iii Move between different forms of mathematical representation
Make sure you list outcomes systematically and include all the possible outcomes in all your representations of sample spaces.
1 The Scandinavian board game Daldøs uses 4-sided (tetrahedral) dice. The roll of one such die results in a score of I, II, III or IV.
Represent the sample space for rolling two of these dice as a list and as a table.
2 A fair coin is flipped three times.
Define the sample space for this experiment.
For question 2, make a list of the possible outcomes.
3 Copy and complete this sample space table for the sum of the scores from rolling two 4-sided dice, each with faces numbered 1, 2, 3 and 4.
In 2009 a woman threw a pair of dice 154 times without throwing a 7, setting a new world record. The chances of this are 1 in 1.56 trillion.
4 A street vendor sells two types of sandwich – a South African Gatsby or a Greek Gyro – and three types of fruit – apple, orange or banana. List the sample space for the possible choices of a sandwich and a piece of fruit.
5 A tetrahedral die (4-sided) and a normal die (6-sided) are rolled simultaneously. Construct a sample space to represent the possible outcomes.
6 Each of two boxes contains five cards numbered 1 to 5. A card is drawn from each box. Draw a sample space to represent the possible outcomes.
7 There are two sets of five cards. One contains the numbers 0 to 4 and the other contains the numbers 2 to 6. You draw a card from each set and multiply the numbers together. Draw a sample space to represent this information.
Problem solving
8 The sample space for an experiment is: S = {(1, H), (2, H), (3, H), (4, H), (1, T), (2, T), (3, T), (4, T)}
Describe the experiment.
In rolling a die, S = {1, 2, 3, 4, 5, 6). If A is the event ‘obtaining the number 3’, then A = {3}. The event ‘not obtaining the number 3’ is A′ = {1, 2, 4, 5, 6}. It therefore follows that A ∪ ′A = S . Since the probability of obtaining the number 3 is 1 6 , P( A) = 1 6 , the probability of not obtaining the number 3 is 5 6 , P( ′A ) = 5 6 . Clearly, P( A) + P( ′A ) = 1, and since A ∪ ′A = S , P(S ) = 1
An event is a subset of the possible outcomes listed in the sample space.
Probability of event A = number of ways event A can occur total number of possible outcomes
P( A) = n ( A ) n (S )
P(A) represents the probability of event A occurring. P(A′ ) is the probability of A not occurring.
P(A) + P(A′ ) = 1
Use capital letters for events, like A, B, C and define the event. For example, A = getting the same number on both dice.
REASONING WITH DATA
Example 2
You roll two 6-sided dice. Calculate the probability of getting:
a the same number on both dice
b two different numbers.
a A = getting the same number on both dice.
1
2
3
4
5
6
P( A) = 6 36 = 1 6
b A′ = getting different numbers on the two dice. P( ′A ) =
Practice 2
Use your sample spaces from Practice 1 to answer these questions.
1 a Calculate the probability of getting two 4s when you roll two 4-sided dice.
b Calculate the probability of not getting two 4s when you roll two 4-sided dice.
2 Two tetrahedral dice are rolled and their scores are added.
a Calculate the probability of getting a sum of 5.
b Calculate the probability of getting a sum not equal to 5.
3 A fair coin is flipped three times. Calculate the probability of getting:
a three heads
b two heads in any order
c no heads.
Define the event.
Identify the outcomes with the same number on both dice.
The outcomes with two different numbers are in the set A′, the complement of A.
Count all the other outcomes . . . . . . or use P(A) + P(A′) = 1
Non-cubical dice are commonly used in role-playing games and trading card games. The numerals 6 and 9 often have a dot or line below them to indicate what value they represent.
Probability diagrams
● How do you calculate the probability of combined events?
● What are the advantages and disadvantages of different probability representations?
● Do all probability events occur simultaneously?
Exploration 3
1 a Write down the sample space for rolling a 4-sided die and flipping a fair coin.
b Based on your sample space, calculate the probability of rolling a 1 and flipping tails.
c How does your answer to 1b relate to the probability of rolling a 1 and the probability of flipping tails?
2 a Write down the sample space for rolling two 4-sided dice.
b Based on your sample space, calculate the probability of rolling an even number on the first die and a 3 on the second one
c State how your answer to 2b relates to the probability of rolling an even number and the probability of rolling a 3.
3 Determine whether the probability of either event is affected by the outcome of the other event.
A tree diagram is a representation of a sample space, so you can see all the possible outcomes and calculate the probabilities of more than one event.
Example 3
By drawing a tree diagram, calculate the probability of rolling an odd number on both of two 6-sided dice.
1st event: rolling the 1st die. 2nd event: rolling the 2nd die.
odd)
Draw a pair of branches to represent the two outcomes (odd or even) for rolling the 1st die.
For each outcome on the 1st die, draw the two possible outcomes for the 2nd die.
There are three odd numbers (1, 3 and 5) and six possible outcomes.
Identify the branches that represent the event P(odd, odd), shown in red in the tree diagram. Multiply the probabilities along those branches.
Reflect and discuss 3
● Would it change the answer in Example 3 if you put the branches for the 2nd die first in the tree diagram?
● What do you notice about the sum of the probabilities on any pair of branches? Explain why this happens.
● Why do we multiply the probabilities on each branch?
Practice 3
1 A box contains three brand-A batteries and seven brand-B batteries. The probability that a brand-A battery is faulty is 0.3, and the probability that a brand-B battery is faulty is 0.4.
a Copy and complete the tree diagram to show all the probabilities.
b A battery is selected at random from the box. Calculate the probability that the battery is: i a faulty brand-A ii not a faulty brand-A.
2 Two fair coins are flipped.
a Draw a tree diagram to represent the possible outcomes.
b Calculate the probability that both coins show heads.
3 James wants to find the probability of rolling two sixes on two fair dice. He starts to draw this tree diagram. 6 not 6 first die second die
Copy and complete the tree diagram. Calculate the probability of rolling two sixes.
Half of all possible outcomes have an odd number on the 1st die, and half of these have an odd number on the 2nd die as well.
4 Nienke and Merel both play netball. The probability that Nienke will score a goal on her first attempt is 0.75. The probability that Merel will score a goal on her first attempt is 0.82.
By drawing a tree diagram, calculate the probability that:
a Nienke and Merel will both score a goal on their first attempt
b neither Nienke nor Merel will score a goal on their first attempt.
5 A drawer contains 3 green and 2 yellow candles. G is the event picking a green candle, and Y is the event picking a yellow candle.
a Calculate P(G) and P(Y).
b A candle is picked from the drawer. Its color is noted and it is replaced in the drawer. A second candle is then picked.
Draw a tree diagram to represent the sample space.
Problem solving
c Verify that picking two green candles is more likely than picking two yellow candles.
Exploration 4
1 Calculate the probability of picking a red card from this set.
2 a If you pick a red card and then replace it, calculate the probability of picking a red card the next time.
b If you pick a blue card and then replace it, calculate the probability of picking a red card the next time.
3 a If you pick a red card but do not replace it, calculate the probability of picking a red card from the remaining cards.
b If you pick a blue card but do not replace it, calculate the probability of picking a red card from the remaining cards.
4 Determine what happens to the probabilities for the second event when you do not replace the card.
Because the candle is replaced, there are still 5 candles to pick from the second time.
REASONING
Tree diagrams show each outcome and its associated probability clearly. Here are two types of tree diagram:
● With replacement – these represent situations where the probability does not change for the second event.
● Without replacement – these represent situations where the probability changes for the second event.
Example 4
A bag contains 3 lemons and 2 limes. A piece of fruit is picked at random from the bag and not put back. Then a second piece of fruit is picked at random.
a Draw a tree diagram to represent the outcomes and their probabilities.
b Find P(Lemon, Lemon) and P(Lime, Lime). a 2nd pick 1st pick
Situations ‘with replacement’ produce independent events; ‘without replacement’ events are dependent.
This is a ‘without replacement’ situation.
The upper arm of the first branch shows the probability of selecting a lemon; the lower arm represents selecting a lime. Since there is no replacement, the first pick affects the probabilities for the second pick , as you can see in the second set of arms.
b P(Lemon, Lemon) = 3 5 × 2 4 = 6 20 = 3 10
P(Lime, Lime) = 2 5 × 1 4 = 2 20 = 1 10
Example 5
In a box are 3 red pens, 4 black pens and 2 green pens. You pick a pen at random and then put it back. Your friend then picks one at random. Calculate the probability that you both select the same color pen.
R = choosing a red pen
B = choosing a black pen
G = choosing a green pen
Continued on next page
This is a ‘with replacement’ situation.
Define the events.
P (R, R) = 3 9 × 3 9 = 9 81
P (B, B) = 4 9 × 4 9 = 16 81
P (G, G) = 2 9 × 2 9 = 4 81
P (R, R) + P (B, B) + P (G, G) = 9 81 + 16 81 + 4 81 = 29 81
The probability that you both select the same color is 29 81 .
Practice 4
Find the probability for getting the same color pen, for each of the three colors.
Probability of (R, R) or (B, B) or (G, G) is P(R, R) + P(B, B) + P(G, G)
1 A bag contains three red peppers and four green peppers. You take a pepper from the bag and eat it. You then take another pepper.
a Copy and label the tree diagram below to show all the probabilities.
b Calculate the probability you eat two red peppers.
c Calculate the probability you do not eat a red pepper.
d Calculate the probability you eat at least one red pepper.
REASONING WITH DATA
2 A bag contains 1 white, 4 red and 2 blue counters. Rose picks a counter and does not replace it. She then picks another counter.
a Draw a tree diagram to show all the probabilities.
b Calculate the probability that she picks 1 white and 1 red counter.
3 Three coins are rolled. Draw a tree diagram and calculate the probability that:
a only one head is rolled
b at least one head is rolled
c no heads are rolled.
d Explain the relationship between your answers to b and c
4 There are 9 numbered cards on a table, each with a number 1 to 9 printed on one side. The other side is blank. The cards are all blank side up. Serena picks two cards from the set.
a Copy and complete this tree diagram. Find the probability that:
b both cards are even
c at least one card is odd.
5 Of a group of five students, two will be selected for a school trip by picking names out of a hat. The five students are Jack, Mary, Rafa, Harry and Pietronella.
a With the aid of a tree diagram or a table of outcomes, find the number of different possible combinations of students that could be selected.
b Find the probability that Mary and Pietronella will go on the trip.
Problem solving
6 Alix has a box of red, yellow and green marbles. She picks a marble from the box, without looking.
The table shows the probabilities of picking the different colors.
a What is the probability that Alix picks a green marble?
b There are 5 yellow marbles in the box. How many red marbles are there?
c Alix picks a marble, then replaces it in the box and picks another. Draw a tree diagram to show the probabilities.
d What is the probability that at least one of the marbles is red?
In question 2b, there are two possible outcomes: (white, red) and (red, white).
‘Mary and Jack’ is the same as ‘Jack and Mary’.
Reflect and discuss 4
Compare your tree diagrams for Practice 4, questions 2, 3, 5 and 6 with others in your class.
● Did you all get the same answers?
● Did you all draw the same tree diagrams?
● For question 6, do you need to draw a branch for each color?
Venn diagrams
Example 6
In a group of 30 children, 9 children like only vanilla ice cream, 13 like only strawberry ice cream and 5 children like both. The remaining children do not like either flavor.
a Draw a Venn diagram to represent this information.
b What is the probability that a child picked at random: i likes strawberry ice cream but not vanilla ii doesn’t like strawberry or vanilla?
a
b i P(likes strawberry but not vanilla) = 13 30 ii P(doesn’t like strawberry or vanilla) = 3 30 = 1 10
Practice 5
1 In a group of 40 people, 35 choose a main course, 10 choose a starter and 7 choose both.
a Draw a Venn diagram to represent this information.
You can use Venn diagrams to represent information and then calculate probabilities from the diagram.
Draw the Venn diagram. Remember to include the 3 children who like neither flavor. n nS (strawberry butnot vanilla) ()
b What is the probability that a person picked at random chooses a main course but no starter?
REASONING
2 A group of 30 children are asked if they play lacrosse (L), basketball (B ), volleyball (V ) or none of these sports. The results are:
● 3 children do not play any of these sports
● 2 children play all three sports
● 6 play volleyball and basketball
● 3 play lacrosse and basketball
● 6 play lacrosse and volleyball
● 16 play basketball
● 12 play volleyball
a Draw a Venn diagram to display this information.
b Calculate the probability that a child selected at random: i plays volleyball and basketball but not lacrosse ii plays only lacrosse iii plays only volleyball.
3 A group of 90 students filled in a questionnaire about their free-time activities. The three most popular choices were: go to the cinema (C ), read (R) and watch television (T ). The results were:
● 26 students watch television, read and go to the cinema
● 20 students watch television and go to the cinema only
● 18 students read and go to the cinema only
● 10 students read and watch television only
● 60 students watch television, 60 students read, 70 students go to the cinema.
a Draw a Venn diagram to display this information.
Calculate the probability that a student picked at random:
b only watches television
c only goes to the cinema.
Problem solving
4 Of 150 new university students, 65 of them study Arabic, 80 study Chinese, and 50 students study both languages. Calculate the probability that a student selected at random studies:
a only Arabic
b only Chinese
c neither Arabic or Chinese.
Two-way tables
A two-way table represents information in rows and columns. This two-way table shows the genders and degree subjects of 150 first-year university students.
Male 40 18 33
Female 15 20 24
From the rows:
● There are 91 male students (40 + 18 + 33)
● There are 59 female students (15 + 20 + 24)
A total of 150 students (91 + 59)
Example 7
From the columns:
● There are 55 Scientists (40 + 15)
● There are 38 Artists (18 + 20)
● There are 57 Linguists (33 + 24)
A total of 150 students (55 + 38 + 57)
From the two-way table of 150 students and the subjects they study:
Male 40 18 33
Female 15 20 24
a Find the probability that a student chosen at random: i is male ii is either male or studies Science.
b A female student is picked at random. Find the probability that she studies Arts.
a i P(male) = 91 150
ii P(male or studies Science) = 106 150 = 53 75
b P(female, studies Arts) = 20 59
There are two ways of calculating the total number of students – adding row totals or adding column totals.
91 male students. Total 150 students.
91 males, plus 15 females studying Science makes 106.
59 female students in total, of which 20 study Arts. Note that since it is given that a female student is being picked at random, the sample space is now 59, not 150.
REASONING WITH DATA
Practice 6
1 The table shows customers’ menu choices in a restaurant.
From this two-way table calculate:
a the number of male diners in the restaurant
b the number of diners who ordered chicken stir-fry
c the probability that a randomly chosen dish was chicken stir-fry for a female diner.
2 a Complete a two-way table to represent this information on snowboarding groups. The students were categorized according to gender (M/F) and ability (advanced/intermediate/beginner).
● There were 60 students in total.
● Half of them were male.
● There were 16 male beginners.
● There were 28 beginners in total.
● There were 12 advanced females.
● There were 10 intermediate students in total.
b A student is selected at random. Calculate the probability that this student is an advanced male snowboarder.
3 The table shows staff preferences for mid-morning drink, grouped by age.
Calculate:
a the percentage of staff under 40
b the fraction of staff who drink water
c the probability that a randomly chosen staff member was under 40 and drank tea.
Problem solving
4 A choir has 51 members in three age groups: under 15, 15 to 20, and over 20.
● There are 4 male under-15s.
● 2 3 of the under-15s are female.
● 26 females are over 15.
● 7 males and 11 females are over 20.
a Calculate the probability that a choir member picked at random is: i female ii male aged 15 to 20 iii over 15.
b The conductor chooses a male soloist at random. Calculate the probability that the soloist is under 15.
Exploration 5
1 Listed below are events that could occur when rolling a fair, six-sided die. Select and write down pairs of events that could not occur at the same time when rolling the die just once.
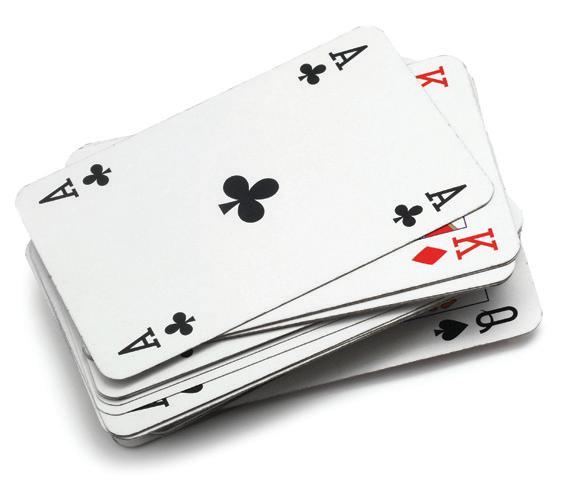
2 Listed below are some of the possible events that could happen when drawing a card from a standard deck of 52 cards.
rolling a 4 rolling an odd number rolling a 2 rolling a multiple of 2 rolling a 3 rolling a factor of 6 rolling an even number rolling a factor of 18 rolling a 5 drawing a red card drawing a face card drawing a factor of 8 drawing a heart drawing a black 6 drawing an oddnumbered card drawing a red ace drawing a multiple of 3 drawing a ten
a Select and write down pairs of events that could not occur at the same time.
b Invent a pair of events that could not happen at the same time if you drew a card from the deck.
A shopping bag contains pearl onions and baby creole onions. An onion is taken from the bag. It is either a pearl onion or a baby creole, but it cannot be both. The events ‘taking a pearl onion’ and ‘taking a baby creole onion’ are mutually exclusive.
In probability, two events are mutually exclusive if only one can happen in any given experiment.
Formally, two events are mutually exclusive when the sets representing the events are disjoint, in other words: A ∩ B = ∅ (the empty set).
For example, when a die is rolled once:
● the sample space S = {1, 2, 3, 4, 5, 6}
● Event A = ‘odd number’ = {1, 3, 5}
● Event B = ‘even number’ = {2, 4, 6}
● A ∩ B = ∅, so A and B are mutually exclusive.
For mutually exclusive events A and B, A ∩ B = ∅.
REASONING WITH DATA
Probability of event A = number of ways event A can occur total number of possible outcomes
or: P( A) = n ( A) n (S )
So P( A ∩ B ) = n ( A ∩ B ) n (S )
For the die example, P(A ∩ B ) = 0 6 = 0. This means the probability that event A and event B both happen is impossible, and therefore equal to zero.
Two events A and B are mutually exclusive if it is impossible for them to happen together. In mathematical language, if A ∩ B = ∅, then P(A ∩ B ) = 0.
Axiom 3
If {A1, A2, A3, … } is a set of mutually exclusive events then P(A1 ∪ A2 ∪ A3… ) = P(A1) + P(A2) + P(A3) +
When the occurrences do not coincide, their associated probabilities can be added together.
Reflect and discuss 5
Why is the term ‘mutually exclusive’ an appropriate term for events that cannot happen at the same time?
Practice 7
1 A fair, six-sided die is rolled once. State whether or not the following events are mutually exclusive (i.e. they cannot happen together).
a ‘rolling a 6’ and ‘rolling a 3’
b ‘rolling a multiple of 2’ and ‘rolling a multiple of 3’
c ‘rolling a 4’ and ‘rolling a factor of 42’
2 The numbers 1, 2, 3, 4, 5, 6, 7, 8 are written on table tennis balls and placed in a bag. A ball is selected at random. State whether or not the following events are mutually exclusive.
a ‘the number on the ball is even’ and ‘the number on the ball is a square number’
b ‘the number on the ball is a multiple of 5’ and ‘the number on the ball is a prime number’
c ‘the number on the ball is a factor of 8’ and ‘the number on the ball is an odd number’
3 Events A and B have probabilities P(A ) = 0.4, P(B ) = 0.65 and P(A ∪ B ) = 0.85.
a Calculate P(A ∩ B ).
b State with a reason whether events A and B are mutually exclusive.
4 A group of 30 students were asked if they’d ever been stung by a bee or a wasp. Of these, 18 students said they’d been stung by a bee, 10 said they’d been stung by a wasp, and 6 said they’d never been stung by either insect.
a Show this information on a Venn diagram.
b Find the number of students who had been stung by both insects.
c Explain why being stung by a bee and being stung by a wasp are not mutually exclusive events.
Venn diagrams –if the circles are intersecting they are not mutually exclusive.
Two-way tables –sections in twoway tables are mutually exclusive unless you are told otherwise.
Write down the possible outcomes for event A and event B. If necessary draw a Venn diagram.
Bee Wasp
U 5 Children in a class of 30 students are asked whether they like strawberries (S ) or bananas (B ).
There are 12 girls in the class: 8 girls like strawberries, 6 girls like bananas and 4 girls like both.
16 boys like strawberries, 13 boys like bananas and 12 boys like both. This information is shown in the Venn diagram. The teacher chooses a student at random.
a Use the information given to find p and q
b Find P(boy) and P(girl). State whether these events mutually exclusive.
c Find P(S ) and P(B ). State whether these events mutually exclusive.
Problem solving
6 For the experiment ‘Pick a card from a standard, 52 card deck’, write:
a two mutually exclusive events
b two events that are not mutually exclusive.
DRandomness
● Does randomness affect the decisions we make? What do you understand by the word random in the following sentence: ‘Choose one piece of fruit at random’? In probability, it means that each piece of fruit has an equal chance of being chosen.
Exploration 6
1 a Pretend that you are flipping a coin. Without actually flipping the coin, imagine the first outcome (H or T) and write it down
b Now, imagine flipping the coin again and record the result.
c Repeat this until you have recorded 50 outcomes.
2 Next, take a real coin and flip it 50 times recording the results.
3 Simulate the flipping of a coin using technology; let the number of flips, n = 100, 1000, 10 000 and so on.
4 The simulation of flipping a real coin give random results. Determine whether your imaginary results are random.
5 Find the longest run of heads and longest run of tails in each set of data. State whether there is much difference in the lengths of run in random and non-random data.
6 Count the number of heads in each set of data. For a fair coin P(Head) = 1 2 , so you would expect roughly half the results in each set of data to be a head. In which set of data is the number of heads closest to half the results?
The probability of an event happening is the proportion of times the event would occur in a large number of trials.
Probabilities describe what will happen in the long run. Sometimes events may not look random because they do not show the regularity that occurs after many repetitions.
These ideas lead to the differences between experimental and theoretical probability. If you take a fair die and roll it 100 times or 1000 times and record the number of 6s, you can calculate the experimental probability of ‘rolling a 6’. As the number of trials increases, this probability gets closer to the theoretical probability value of 1 6
Practice 8
1 Amelia wants to pick 5 students at random from her class for a probability experiment. Which of these methods will ensure a truly random selection?
a Picking the first 5 students to walk into the room.
b Picking the last 5 students on the register.
c Putting the names of all the students into a hat, and picking 5 out.
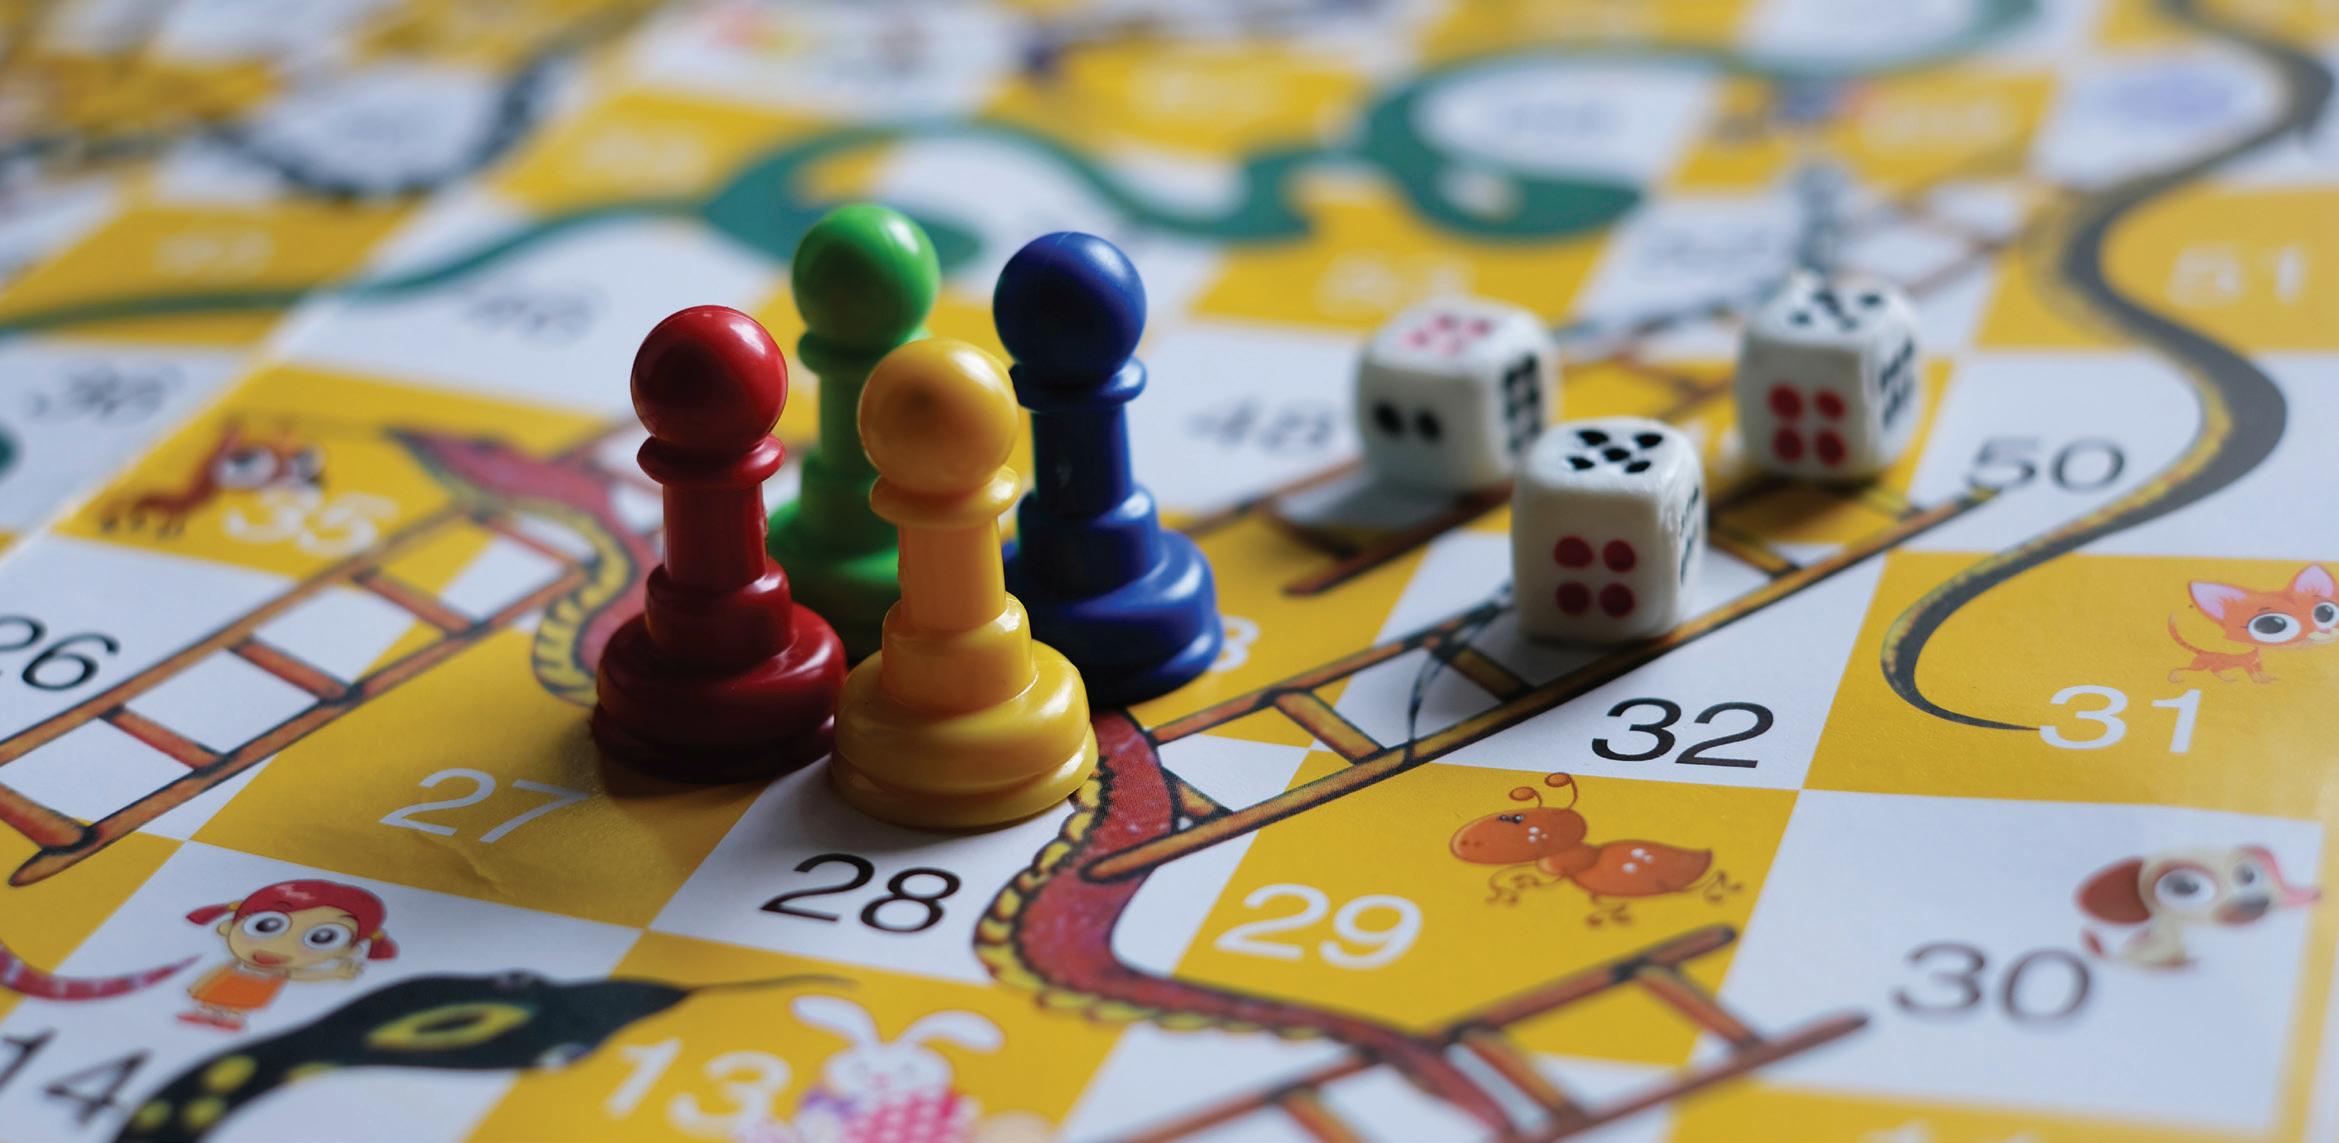
2 Jo, Amy and Sam play a board game where you need to throw a 6 to start. After five rounds, Jo rolled a 6 twice, Amy rolled a 6 three times, and Sam did not roll a 6 at all. Sam thinks Jo and Amy must be cheating. Use the ideas of randomness and probability to explain how these results are due to chance.
3 Max flips a coin 10 times and gets 7 tails.
a Explain whether or not this shows his coin is biased.
b He keeps flipping the coin and counting the tails. The table shows his results.
Biased means unfair.
Do you think the coin is fair? Justify your answer.
4 a Hadley and Morgan each roll a 6-sided die, then sum their scores. Hadley wins if the sum is even, and Morgan wins if the sum is odd.
Draw a sample space to represent the outcome. Is the game fair?
b Hadley and Morgan change the rules. If the sum of the two dice is a multiple of 3, Hadley wins. If it is a multiple of 4 then Morgan wins. If neither multiple, they roll again.
i Determine if this game is fair.
ii Suggest what would happen if they both rolled a 6
5 Peter and Eliott are playing a coin game.
If Peter throws a head he wins; if he throws a tail, it is Eliott’s turn. If Eliott throws a head he wins; if he throws a tail it is Peter’s turn.
a Draw a tree diagram to represent this game.
b Calculate the probability that:
i Peter wins on his first turn
ii Eliott wins on his first turn
iii Peter wins on this third turn.
c Discuss whether or not you think this is a fair game.
Reflect and discuss 6
Design a game for two players using dice, coins or spinners, so that:
● each player has an equal chance of winning
● one player has a greater chance of winning.
Summary
The sample space S, is a representation of the complete set of all possible outcomes from an experiment. It can be a list, a table or a diagram.
A single event is a subset of the possible outcomes listed in the sample space.
Probability of event A = P( A) = number of ways event A can occur total number of possible outcomes = n ( A) n (S )
P(A) represents the probability of event A occurring. P(A′) is the probability of A not occuring.
P(A) + P(A′) = 1
The probability of an event happening is the proportion of times the event would occur in a large number of trials.
●● Two events A and B are mutually exclusive if A ∩ B = ∅ . Therefore P( A ∩ B ) = 0
Axiom 1
For any event A, P(A) ≥ 0. This means that all probabilities have a value greater than or equal to zero.
Axiom 2
For a sample space S, P(S ) = 1. In other words, the probability of all occurrences is equal to 1.
In probability, two events are mutually exclusive if only one can happen in any given experiment.
Two events A and B are mutually exclusive if it is impossible for them to happen together. In mathematical language, if A ∩ B = ∅, then
P(A ∩ B ) = 0.
Axiom 3
If {A1, A2, A3, … } is a set of mutually exclusive events then
P(A1 ∪ A2 ∪ A3… ) = P(A1) + P(A2) + P(A3) + When the occurrences do not coincide, their associated probabilities can be added together.
Mixed practice
1 There are four main blood types: A, B, AB and O. These are paired with something called a Rhesus factor, which is either ‘+’ or ‘ ’
For example, your blood type could be B+
a Write the sample space for the different blood types that are possible.
If all blood types are equally likely, what is the probability that you have:
b type AB blood
c type O blood
d a blood type other than A or B
e a ‘positive’ blood type?
2 Olivia rolls two 6-sided dice at the same time.
One die has three red sides and three black sides. The other die has the sides numbered from 1 to 6. By means of a tree diagram, table of outcomes or otherwise:
a Find how many different possible combinations she can roll.
b Calculate the probability that she will roll a red and an even number.
c Calculate the probability that she will roll a red or black and a 5.
d Calculate the probability that she will roll a number less than 2.
3 Ann has a bag containing 3 blue whistles, 4 red whistles and 1 green whistle.
Simon has a bag containing 2 blue whistles and 3 red whistles.
The whistles are identical except for the color.
Ann chooses a whistle at random from her bag and Simon chooses a whistle at random from his bag.
a Draw a tree diagram to represent this information and write down the probability of each of the events on the branches of the tree diagram.
b Calculate the probability that both Ann and Simon will choose a blue whistle.
c Calculate the probability that the whistle chosen by Ann will be a different color to the one chosen by Simon.
4 A recent study of 24 sodas revealed that 8 have high amounts of caffeine, 12 have high amounts of sugar and 6 have both.
a Draw a Venn diagram to represent this information.
What is the probability that a soda picked at random from the group in the study:
b is high in sugar but not in caffeine
c is high in caffeine only
d is not high in caffeine or sugar?
5 A bag contains four calculators (C ) and six protractors (P ). One item is taken from the bag at random and not replaced. A second item is then taken at random.
a Complete the tree diagram by writing probabilities in the spaces provided.
b Calculate the probability that one protractor and one calculator are taken from the bag.
6 Repeat question 5, but this time the item is replaced.
Calculate how the probabilities change.
7 In a group of 50 people, 10 are healthy and the rest have either high blood pressure, high cholesterol or both; 23 people have high blood pressure and 28 have high cholesterol. Find the probability that a person selected at random:
a has high blood pressure
b has high blood pressure and high cholesterol
c has high blood pressure or high cholesterol
d has high cholesterol only.
8 A group of 30 students were asked about their favorite way of eating eggs.
● 18 liked boiled eggs (B )
● 10 liked fried eggs (F )
● 6 liked neither
a Find
i P(B ) ii P(B ∪ F )
iii P(F ) iv P(B ′ ∪ F ′ )
b Find P(B ∩ F ).
c Represent the information on a Venn diagram.
d A student chosen at random likes boiled eggs. Find the probability that the student also likes fried eggs.
Problem solving
9 A survey was carried out at an international airport. Travelers were asked their flight destinations and results are shown in the table.
Destination Geneva Vienna Brussels
Number of males 45 62 37
Number of females 35 46 25
a i Determine whether or not the destinations are mutually exclusive.
ii Determine whether or not gender is mutually exclusive.
b One traveler is chosen at random. Find the probability that this traveler is going to Vienna.
c One female traveler is chosen at random. Find the probability that she is going to Geneva.
d One traveler is chosen at random from those not going to Vienna. Find the probability that the chosen traveler is female.
For the above data, test whether or not destination and gender are independent.
10 100 students were asked if they liked various toast toppings.
● 56 like avocado
● 38 like marmalade
● 22 like soft cheese
● 16 like avocado and marmalade, but not soft cheese
● 8 like soft cheese and marmalade, but not avocado
● 3 like avocado and soft cheese, but not marmalade
● 4 like all three toppings
a Draw a Venn diagram to represent this information.
b Find the number of students who didn’t like any topping.
c Determine if the toppings are mutually exclusive.
d A student is chosen at random from the group who like soft cheese Find the probability that they also like marmalade.
11 Events A and B have probabilities P(A) = 0.4, P(B) = 0.65, and P(A ∪ B ) = 0.85.
a Calculate P(A ∩ B ).
b Determine whether or not events A and B are mutually exclusive.
12 Stefan rolls two 6-sided dice at the same time. One die has three green sides and three black sides. The other die has sides numbered from 1 to 6.
a Draw a tree diagram to represent this sequence of events.
b Find the probability that Stefan rolls a 5.
c Find the probability that he rolls a number less than 3.
d Find the probability that he gets green on the one die and an even number on the other.
e Determine if the events ‘rolling green’ and ‘rolling an even number’ are independent, and explain your answer.
13 The table below shows the number of leftand right-handed golf players in a sample of 50 males and females.
Left-handed Right-handed
Total
Male 3 29 32
Female 2 16 18
Total 5 45 50
A golf player is selected at random.
a Find the probability that the player is: i male and left-handed
ii right-handed
iii right-handed, given that the player selected is female.
b Determine whether the events ‘male’ and ‘left-handed’ are are mutually exclusive.
Review in context
Identities and relationships
Problem solving
1 The chart shows the risk of developing Type 2 diabetes for different body mass index (BMI) values. BMI is a way of measuring the amount of fat in the body. For adults, a healthy BMI is between 18.5 and 25.
a An adult has BMI 28. What is their risk of developing Type 2 diabetes?
b Describe how the risk of developing diabetes changes as BMI increases.
c An adult has BMI 31. He loses mass and has BMI 26. How many times smaller is his risk of Type 2 diabetes now?
d Write some advice for reducing the risk of developing Type 2 diabetes. Use probabilities to justify your comments.
2 Probability can be used in genetics to predict the likelihood of children inheriting a condition from their parents. Suppose the gene for normal sight is represented by ‘M’ while that of short sightedness (myopia) is represented by ‘m’. A child inherits one allele (gene) from each parent. For instance, if the parents are MM and Mm, then the child would receive an ‘M’ from the first parent and an ‘M’ or ‘m’ from the second.
a Copy and complete the sample space for the different outcomes.
b If a child inherits myopia only when they inherit ‘mm’, calculate the probability that a child born will have myopia.
c Calculate the probability that the child will carry the myopia gene (m).
Suppose two parents, both of whom are Mm, have two children.
d Calculate the probability that the first child will have myopia (mm).
e Calculate the probability that only one child will have myopia.
f Calculate the probability that neither child will have myopia.
g Determine which genes the parents would have to have in order for the probability that their first child has myopia to be 1 2
3 The table shows 60 students’ choices of yoghurt.
a One student is selected at random.
i Find the probability that the student chose vanilla yoghurt.
ii Find the probability that the student chose a yoghurt that was not vanilla.
iii The student chose chocolate yoghurt. Find the probability that the student chose the low sugar one.
iv Find the probability that the student chose a high sugar or vanilla yoghurt.
v The student chose a low sugar yoghurt. Find the probability that the student chose strawberry.
b The 60 yoghurts were then classified according to fat content type: 15 of the yoghurts had high fat, 37 had medium fat and 8 had low fat content. Two yoghurts were randomly selected.
Find the probability that:
i both yoghurts had low fat content ii neither of the yoghurts had medium fat content.
4 All human blood can be categorized into one of four types: A, B, AB or O. The distribution of the blood groups varies between races and genders. The table shows the distribution of the blood types for the US population.
Blood type O A B AB
Probability 0.42 0.43 0.11 x
a Find the probability that a person chosen at random:
i has blood type AB ii does not have blood type AB.
b Determine if the two events ‘have blood type AB′ and ‘do not have blood type AB′ are mutually exclusive.
Reflect and discuss 7
c Find the probability that a randomly selected person in the US has blood type A or B.
d Damon has blood type B, so he can safely receive blood from people with blood types O and B. Find the probability that a randomly chosen person can donate blood to Damon.
e Given that Damon received blood, find the probability that it was type O.
5 This table shows the distribution of blood type in the US by gender. Probability
a Determine if the events ‘gender’ and ‘blood type’ are mutually exclusive.
Let M be the event ‘selecting a male’.
Let F be the event ‘selecting a female’.
b Find:
i P(M )
ii P(F )
How have you explored the statement of inquiry? Give specific examples.
Statement of inquiry:
Understanding health and validating lifestyle choices results from using logical representations and systems.