219
United States Real GDP is anticipated to grow by 5.6% in 2021, before rising by 3.7% and 2.4% in 2022 and 2023 respectively. Supply disruptions will gradually ease, facilitating a rebuild of business inventories and stronger consumption growth in the near-term. With the continued recovery in the labour market, nominal wage growth will pick up further. While price inflation is projected to moderate in some sectors as supply disruptions abate, higher wages, along with recent increases in housing rents and shipping rates, will lead to stronger overall consumer price growth than prior to the pandemic. Monetary policy remains highly accommodative, but the announced tapering of government bond purchases is appropriate as the recovery becomes more firmly entrenched. Sustained price pressures will prompt a gradual increase in the federal funds rate starting in mid-2022. The ongoing withdrawal of fiscal support is now having a dampening impact on economic growth. Nevertheless, accumulated excess savings from earlier stimulus measures and lockdowns will continue to underpin household consumption and business investment over the coming quarters. In plotting a path to achieving net zero emissions by 2050, further investment in clean and resilient infrastructure, as well as enhanced pricing of environmental externalities, will be important. Economic activity is reaccelerating and inflationary pressures have become more pronounced After a surge in COVID-19 cases and supply disruptions caused growth to moderate in the third quarter, recent monthly data suggest a subsequent reacceleration of activity. For instance, indicators of consumer spending and industrial production picked up notably in October. The proportion of the total population fully vaccinated continues to rise steadily, but at around 60%, it is below that in most other OECD countries.
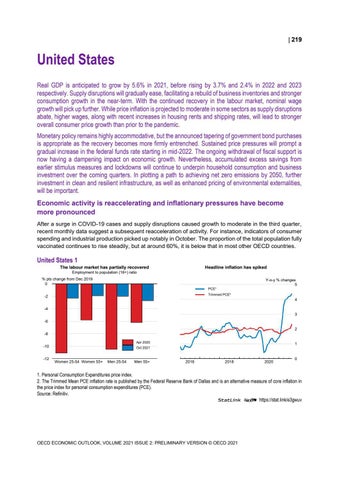
United States 1 The labour market has partially recovered
Headline inflation has spiked
Employment to population (16+) ratio % pts change from Dec 2019 0
Y-o-y % changes 5 PCE¹ Trimmed PCE²
-2
4
-4 3 -6 2 -8 Apr 2020
-10 -12
1
Oct 2021
Women 25-54 Women 55+
Men 25-54
Men 55+
0
0
2016
2018
2020
0
1. Personal Consumption Expenditures price index. 2. The Trimmed Mean PCE inflation rate is published by the Federal Reserve Bank of Dallas and is an alternative measure of core inflation in the price index for personal consumption expenditures (PCE). Source: Refinitiv. StatLink 2 https://stat.link/e3gwuv
OECD ECONOMIC OUTLOOK, VOLUME 2021 ISSUE 2: PRELIMINARY VERSION © OECD 2021