221
New Zealand After a rebound in the second half of 2020 from the COVID-19 slump, economic growth in 2021 will average around 2¾ per cent, with rising unemployment weighing on private consumption and high uncertainty holding back business investment. Assuming that the border re-opens at the beginning of 2022 after a rollout of an effective vaccine around the world, tourism and immigration will drive further the recovery, with economic growth in 2022 of just over 2½ per cent. Until immunisation is attained, the recovery may be interrupted by intermittent localised COVID-19 outbreaks and associated containment measures. The government should stand ready to deploy greater fiscal and monetary stimulus than currently assumed if the economic recovery falters. It should also strengthen measures to support the reallocation of workers from economic activities that are not viable in the long run to those that are. Localised confinement was imposed to curb a potential outbreak After eliminating domestic COVID-19 infections in June, New Zealand saw a localised outbreak in Auckland in the second half of August. The government promptly imposed containment measures in Auckland, shutting down businesses that require close physical contact and prohibiting travel to other parts of the country, while placing the rest of the country under milder restrictions. The containment measures were lifted nationwide in early October after a period without domestic infections. Daily new COVID-19 cases are likely to remain in low, single digits, and mostly involve people in quarantine facilities for international arrivals as New Zealand maintains strict border controls and a pre-emptive containment policy.
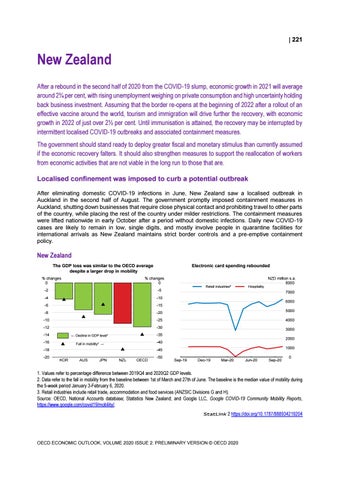
New Zealand The GDP loss was similar to the OECD average despite a larger drop in mobility % changes 0
Electronic card spending rebounded
% changes 0
Retail industries³
Hospitality
NZD million s.a. 8000
-2
-5
-4
-10
-6
-15
-8
-20
5000
-10
-25
4000
-12
-30
3000
-14
← Decline in GDP level¹
-35
-16
Fall in mobility² →
-40
-18 -20
7000 6000
2000 1000
-45 KOR
AUS
JPN
NZL
OECD
-50
0 Sep-19
Dec-19
Mar-20
Jun-20
Sep-20
0
1. Values refer to percentage difference between 2019Q4 and 2020Q2 GDP levels. 2. Data refer to the fall in mobility from the baseline between 1st of March and 27th of June. The baseline is the median value of mobility during the 5-week period January 3-February 6, 2020. 3. Retail industries include retail trade, accommodation and food services (ANZSIC Divisions G and H). Source: OECD, National Accounts database; Statistics New Zealand; and Google LLC, Google COVID-19 Community Mobility Reports, https://www.google.com/covid19/mobility/. StatLink 2 https://doi.org/10.1787/888934219204
OECD ECONOMIC OUTLOOK, VOLUME 2020 ISSUE 2: PRELIMINARY VERSION © OECD 2020