218
Netherlands GDP is set to fall by 4.6% in 2020 before picking up by 0.8% in 2021 and 2.9% in 2022. Consumption will rebound in 2021 as households scale back precautionary savings, while investment recovers only moderately due to lingering uncertainty. Unemployment and bankruptcies are expected to peak in the second half of 2021 when support measures will be phased out. Fiscal policy should remain supportive. The government has extended its main support measures until July 2021, including loan guarantees, grants for small businesses, the job retention scheme and support to the self-employed. Policies should encourage the reallocation of workers and capital, while adapting to the evolving epidemiological situation. The job retention scheme should be adjusted to facilitate worker mobility and training. Public investment should help tackle structural challenges, including low productivity growth and high nitrogen and greenhouse gas emissions, complemented by the EU Recovery and Resilience Facility once available. The Netherlands has entered the second wave of the pandemic The number of new COVID-19 infections has increased rapidly after the summer, recording more cases between September and November than at the peak of the first wave. The number of deaths and hospitalisations were well below the levels of the first wave, but pressure on the health system rose through the autumn. As tracking the virus became more difficult with the surge in case numbers, restrictions were tightened to slow the spread of the virus. Hospitality services were shut down from mid-October, and most public places were temporarily closed in November. Group-gathering restrictions, mask wearing, customer registration and distancing requirements in retail trade have been strengthened. Restrictions are evaluated regularly and adjusted if necessary.
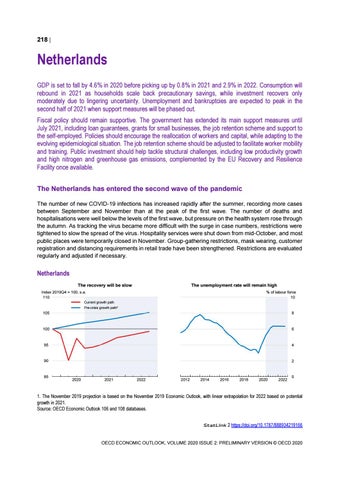
Netherlands The recovery will be slow
The unemployment rate will remain high
Index 2019Q4 = 100, s.a. 110
% of labour force 10
Current growth path Pre-crisis growth path¹
105
8
100
6
95
4
90
2
85
2020
2021
2022
0
0
2012
2014
2016
2018
2020
2022
0
1. The November 2019 projection is based on the November 2019 Economic Outlook, with linear extrapolation for 2022 based on potential growth in 2021. Source: OECD Economic Outlook 106 and 108 databases. StatLink 2 https://doi.org/10.1787/888934219166 OECD ECONOMIC OUTLOOK, VOLUME 2020 ISSUE 2: PRELIMINARY VERSION © OECD 2020