206
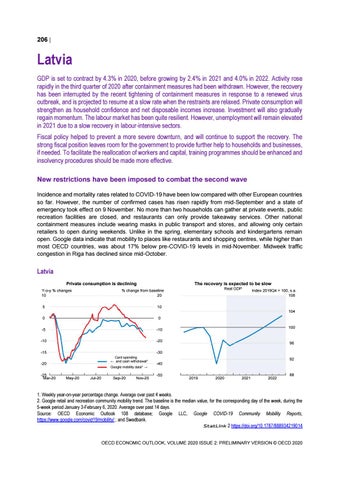
Latvia GDP is set to contract by 4.3% in 2020, before growing by 2.4% in 2021 and 4.0% in 2022. Activity rose rapidly in the third quarter of 2020 after containment measures had been withdrawn. However, the recovery has been interrupted by the recent tightening of containment measures in response to a renewed virus outbreak, and is projected to resume at a slow rate when the restraints are relaxed. Private consumption will strengthen as household confidence and net disposable incomes increase. Investment will also gradually regain momentum. The labour market has been quite resilient. However, unemployment will remain elevated in 2021 due to a slow recovery in labour-intensive sectors. Fiscal policy helped to prevent a more severe downturn, and will continue to support the recovery. The strong fiscal position leaves room for the government to provide further help to households and businesses, if needed. To facilitate the reallocation of workers and capital, training programmes should be enhanced and insolvency procedures should be made more effective. New restrictions have been imposed to combat the second wave Incidence and mortality rates related to COVID-19 have been low compared with other European countries so far. However, the number of confirmed cases has risen rapidly from mid-September and a state of emergency took effect on 9 November. No more than two households can gather at private events, public recreation facilities are closed, and restaurants can only provide takeaway services. Other national containment measures include wearing masks in public transport and stores, and allowing only certain retailers to open during weekends. Unlike in the spring, elementary schools and kindergartens remain open. Google data indicate that mobility to places like restaurants and shopping centres, while higher than most OECD countries, was about 17% below pre-COVID-19 levels in mid-November. Midweek traffic congestion in Riga has declined since mid-October.
Latvia Private consumption is declining Y-o-y % changes 10
The recovery is expected to be slow Real GDP
% change from baseline 20
5
10
0
0
-5
-10
-10
-20
Index 2019Q4 = 100, s.a. 108
104
-15
96
-30 Card spending ← and cash withdrawal¹
-20 -25 Mar-20
100
Google mobility data² →
May-20
Jul-20
Sep-20
Nov-20
92 -40 -50
0
2019
2020
2021
2022
88
1. Weekly year-on-year percentage change. Average over past 4 weeks. 2. Google retail and recreation community mobility trend. The baseline is the median value, for the corresponding day of the week, during the 5-week period January 3-February 6, 2020. Average over past 14 days. Source: OECD Economic Outlook 108 database; Google LLC, Google COVID-19 Community Mobility Reports, https://www.google.com/covid19/mobility/ ; and Swedbank. StatLink 2 https://doi.org/10.1787/888934219014 OECD ECONOMIC OUTLOOK, VOLUME 2020 ISSUE 2: PRELIMINARY VERSION © OECD 2020