72
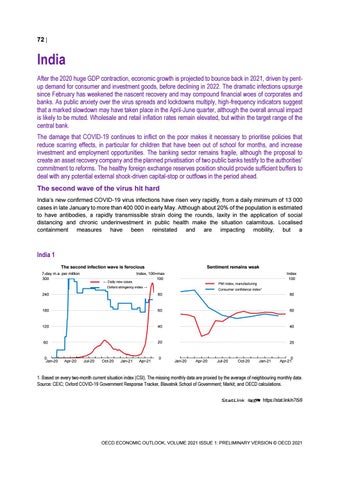
India After the 2020 huge GDP contraction, economic growth is projected to bounce back in 2021, driven by pentup demand for consumer and investment goods, before declining in 2022. The dramatic infections upsurge since February has weakened the nascent recovery and may compound financial woes of corporates and banks. As public anxiety over the virus spreads and lockdowns multiply, high-frequency indicators suggest that a marked slowdown may have taken place in the April-June quarter, although the overall annual impact is likely to be muted. Wholesale and retail inflation rates remain elevated, but within the target range of the central bank. The damage that COVID-19 continues to inflict on the poor makes it necessary to prioritise policies that reduce scarring effects, in particular for children that have been out of school for months, and increase investment and employment opportunities. The banking sector remains fragile, although the proposal to create an asset recovery company and the planned privatisation of two public banks testify to the authorities’ commitment to reforms. The healthy foreign exchange reserves position should provide sufficient buffers to deal with any potential external shock-driven capital-stop or outflows in the period ahead. The second wave of the virus hit hard India’s new confirmed COVID-19 virus infections have risen very rapidly, from a daily minimum of 13 000 cases in late January to more than 400 000 in early May. Although about 20% of the population is estimated to have antibodies, a rapidly transmissible strain doing the rounds, laxity in the application of social distancing and chronic underinvestment in public health make the situation calamitous. Localised containment measures have been reinstated and are impacting mobility, but a
India 1 The second infection wave is ferocious 7-day m.a. per million 300
← Daily new cases
Sentiment remains weak
Index, 100=max 100
Index 100 PMI index, manufacturing
Oxford stringency index →
Consumer confidence index¹
240
80
80
180
60
60
120
40
40
60
20
20
0 Jan-20
Apr-20
Jul-20
Oct-20
Jan-21
Apr-21
0
0 Jan-20
Apr-20
Jul-20
Oct-20
Jan-21
0 Apr-21
1. Based on every two-month current situation index (CSI). The missing monthly data are proxied by the average of neighbouring monthly data. Source: CEIC; Oxford COVID-19 Government Response Tracker, Blavatnik School of Government; Markit; and OECD calculations. StatLink 2 https://stat.link/n7l5i9
OECD ECONOMIC OUTLOOK, VOLUME 2021 ISSUE 1: PRELIMINARY VERSION © OECD 2021