Analysing attitudes to food Personal behaviour and choices in daily life, from what we eat to how we get to work or heat our homes, have a significant – and growing – effect on the environment. But why are some households greener than others? And what factors motivate green household choices? Answering these questions is vital for helping governments design and target policies that promote “greener” behaviour. The OECD’s Environmental Policy and Individual Behaviour Change (EPIC) survey is designed to do just that. Drawing on observations from over 12 000 respondents in 11 OECD countries (Australia, Canada, Chile, France, Israel, Japan, Korea, the Netherlands, Spain, Sweden and Switzerland), this large-scale household survey conducted in 2011 explores what drives household environmental behaviour and how policies may affect household decisions. It focuses on five areas in which households have significant environmental impact: energy, food, transport, waste and water.
Food and the environment In a context of a growing population, rising incomes and lifestyle changes, food production and consumption exert ever-growing pressure on the environment. The intensification of agricultural production methods and a number of food scares have also raised consumer concerns. Coupled with concerns about the environment and health, these have induced some people to increase their consumption of more environment-friendly products, including organic food. The EPIC survey examined what drives household consumption of organic fruit and vegetables and meat products that take animal welfare into account.
This flyer points decision makers towards ways to design well-targeted and effective policies to green household food consumption.
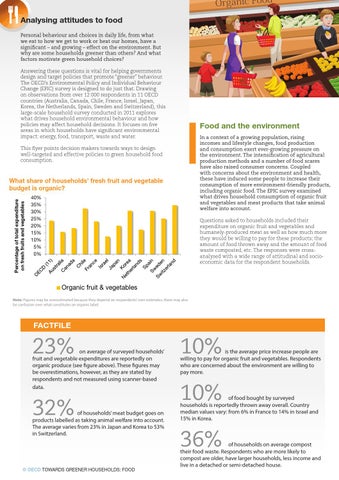
Percentage of total expenditure on fresh fruits and vegetables
What share of households’ fresh fruit and vegetable budget is organic? 40% 35% 30% 25% 20% 15% 10% 5% 0%
Questions asked to households included their expenditure on organic fruit and vegetables and humanely-produced meat as well as how much more they would be willing to pay for these products; the amount of food thrown away and the amount of food waste composted, etc. The responses were crossanalysed with a wide range of attitudinal and socioeconomic data for the respondent households.
Organic fruit & vegetables Note: Figures may be overestimated because they depend on respondents’ own estimates; there may also be confusion over what constitutes an organic label.
FACTFILE
23%
on average of surveyed households’ fruit and vegetable expenditures are reportedly on organic produce (see figure above). These figures may be overestimations, however, as they are stated by respondents and not measured using scanner-based data.
32%
of households’ meat budget goes on products labelled as taking animal welfare into account. The average varies from 23% in Japan and Korea to 53% in Switzerland.
© OECD TOWARDS GREENER HOUSEHOLDS: FOOD
10%
is the average price increase people are willing to pay for organic fruit and vegetables. Respondents who are concerned about the environment are willing to pay more.
10%
of food bought by surveyed households is reportedly thrown away overall. Country median values vary: from 6% in France to 14% in Israel and 15% in Korea.
36%
of households on average compost their food waste. Respondents who are more likely to compost are older, have larger households, less income and live in a detached or semi-detached house.
