86
Bulgaria The economy is projected to grow by 3¼ per cent in 2021 and to accelerate in 2022-23 with GDP growth ranging between 4¼ and 4½ per cent. The renewed dynamism of exports, the strength of investments supported by significant EU funds and the robust momentum of private consumption should stimulate activity. Inflation is rising sharply due to the surge in energy prices and the tightening of the labour market, and is expected to see its underlying level reach 2¼ per cent in 2023, the highest rate since 2010. Speeding up vaccination, which is progressing only slowly, is essential to limit the risk that a further expansion of the pandemic will lead to new containment measures that would hamper the recovery. Effective management and use of the EU funds received by Bulgaria has a key role to play in sustaining activity and boosting potential growth. Strengthening potential growth and the convergence process of the country also requires pursuing and deepening reforms to increase competition, modernise the administration and fight corruption. Bulgaria faces a resurgence of the pandemic A fourth epidemic wave linked to the spread of the Delta variant has been hitting Bulgaria since the beginning of August 2021. With less than 25% of the population fully vaccinated as of 22 November this year, the lowest rate among EU countries, the increase in contamination is accompanied by a marked rebound in COVID-19-related mortality. To stem this new wave, the authorities reintroduced containment measures in early September. The use of a COVID-19 “green certificate” is mandatory for all indoor activities since 21 October. These include access to bars, restaurants, sports centres, cinemas and
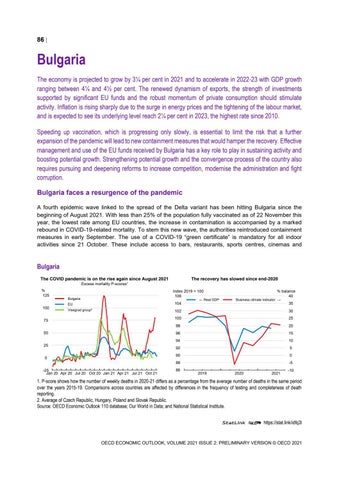
Bulgaria The COVID pandemic is on the rise again since August 2021
The recovery has slowed since end-2020
Excess mortality P-scores¹ % 125 100
Index 2019 = 100 106
Bulgaria
← Real GDP
% balance 40
Business climate indicator →
EU
104
Visegrad group²
102
30
100
25
98
20
96
15
94
10
92
5
75 50 25 0 -25 0 Jan 20 Apr 20 Jul 20 Oct 20 Jan 21 Apr 21 Jul 21 Oct 21
35
90
0
88
-5
86
2019
2020
2021
-10
1. P-score shows how the number of weekly deaths in 2020-21 differs as a percentage from the average number of deaths in the same period over the years 2015-19. Comparisons across countries are affected by differences in the frequency of testing and completeness of death reporting. 2. Average of Czech Republic, Hungary, Poland and Slovak Republic. Source: OECD Economic Outlook 110 database; Our World in Data; and National Statistical Institute. StatLink 2 https://stat.link/idfq3l
OECD ECONOMIC OUTLOOK, VOLUME 2021 ISSUE 2: PRELIMINARY VERSION © OECD 2021