Presented to the House of Representatives pursuant to section 44 of the Public Finance Act 1989.
The NIWA Annual Report for 2022 is presented in two parts –the Year in Review and the Annual Report (Financial Statements). Collectively, these two documents fulfil our annual reporting responsibilities under the Crown Research Institutes Act 1992.
The Year in Review is an illustrated document containing the Chairman and Chief Executive’s report, descriptions of our research capabilities and performance, including our partnerships with Māori, work with collaborators and stakeholders, and an overview of our people.
Both reports are available digitally at www.niwa.co.nz/about/annual reports
Published by: NIWA
Market Place
Central 1010 New Zealand www.niwa.co.nz
1172 8140 (print)
2423 0901 (online)
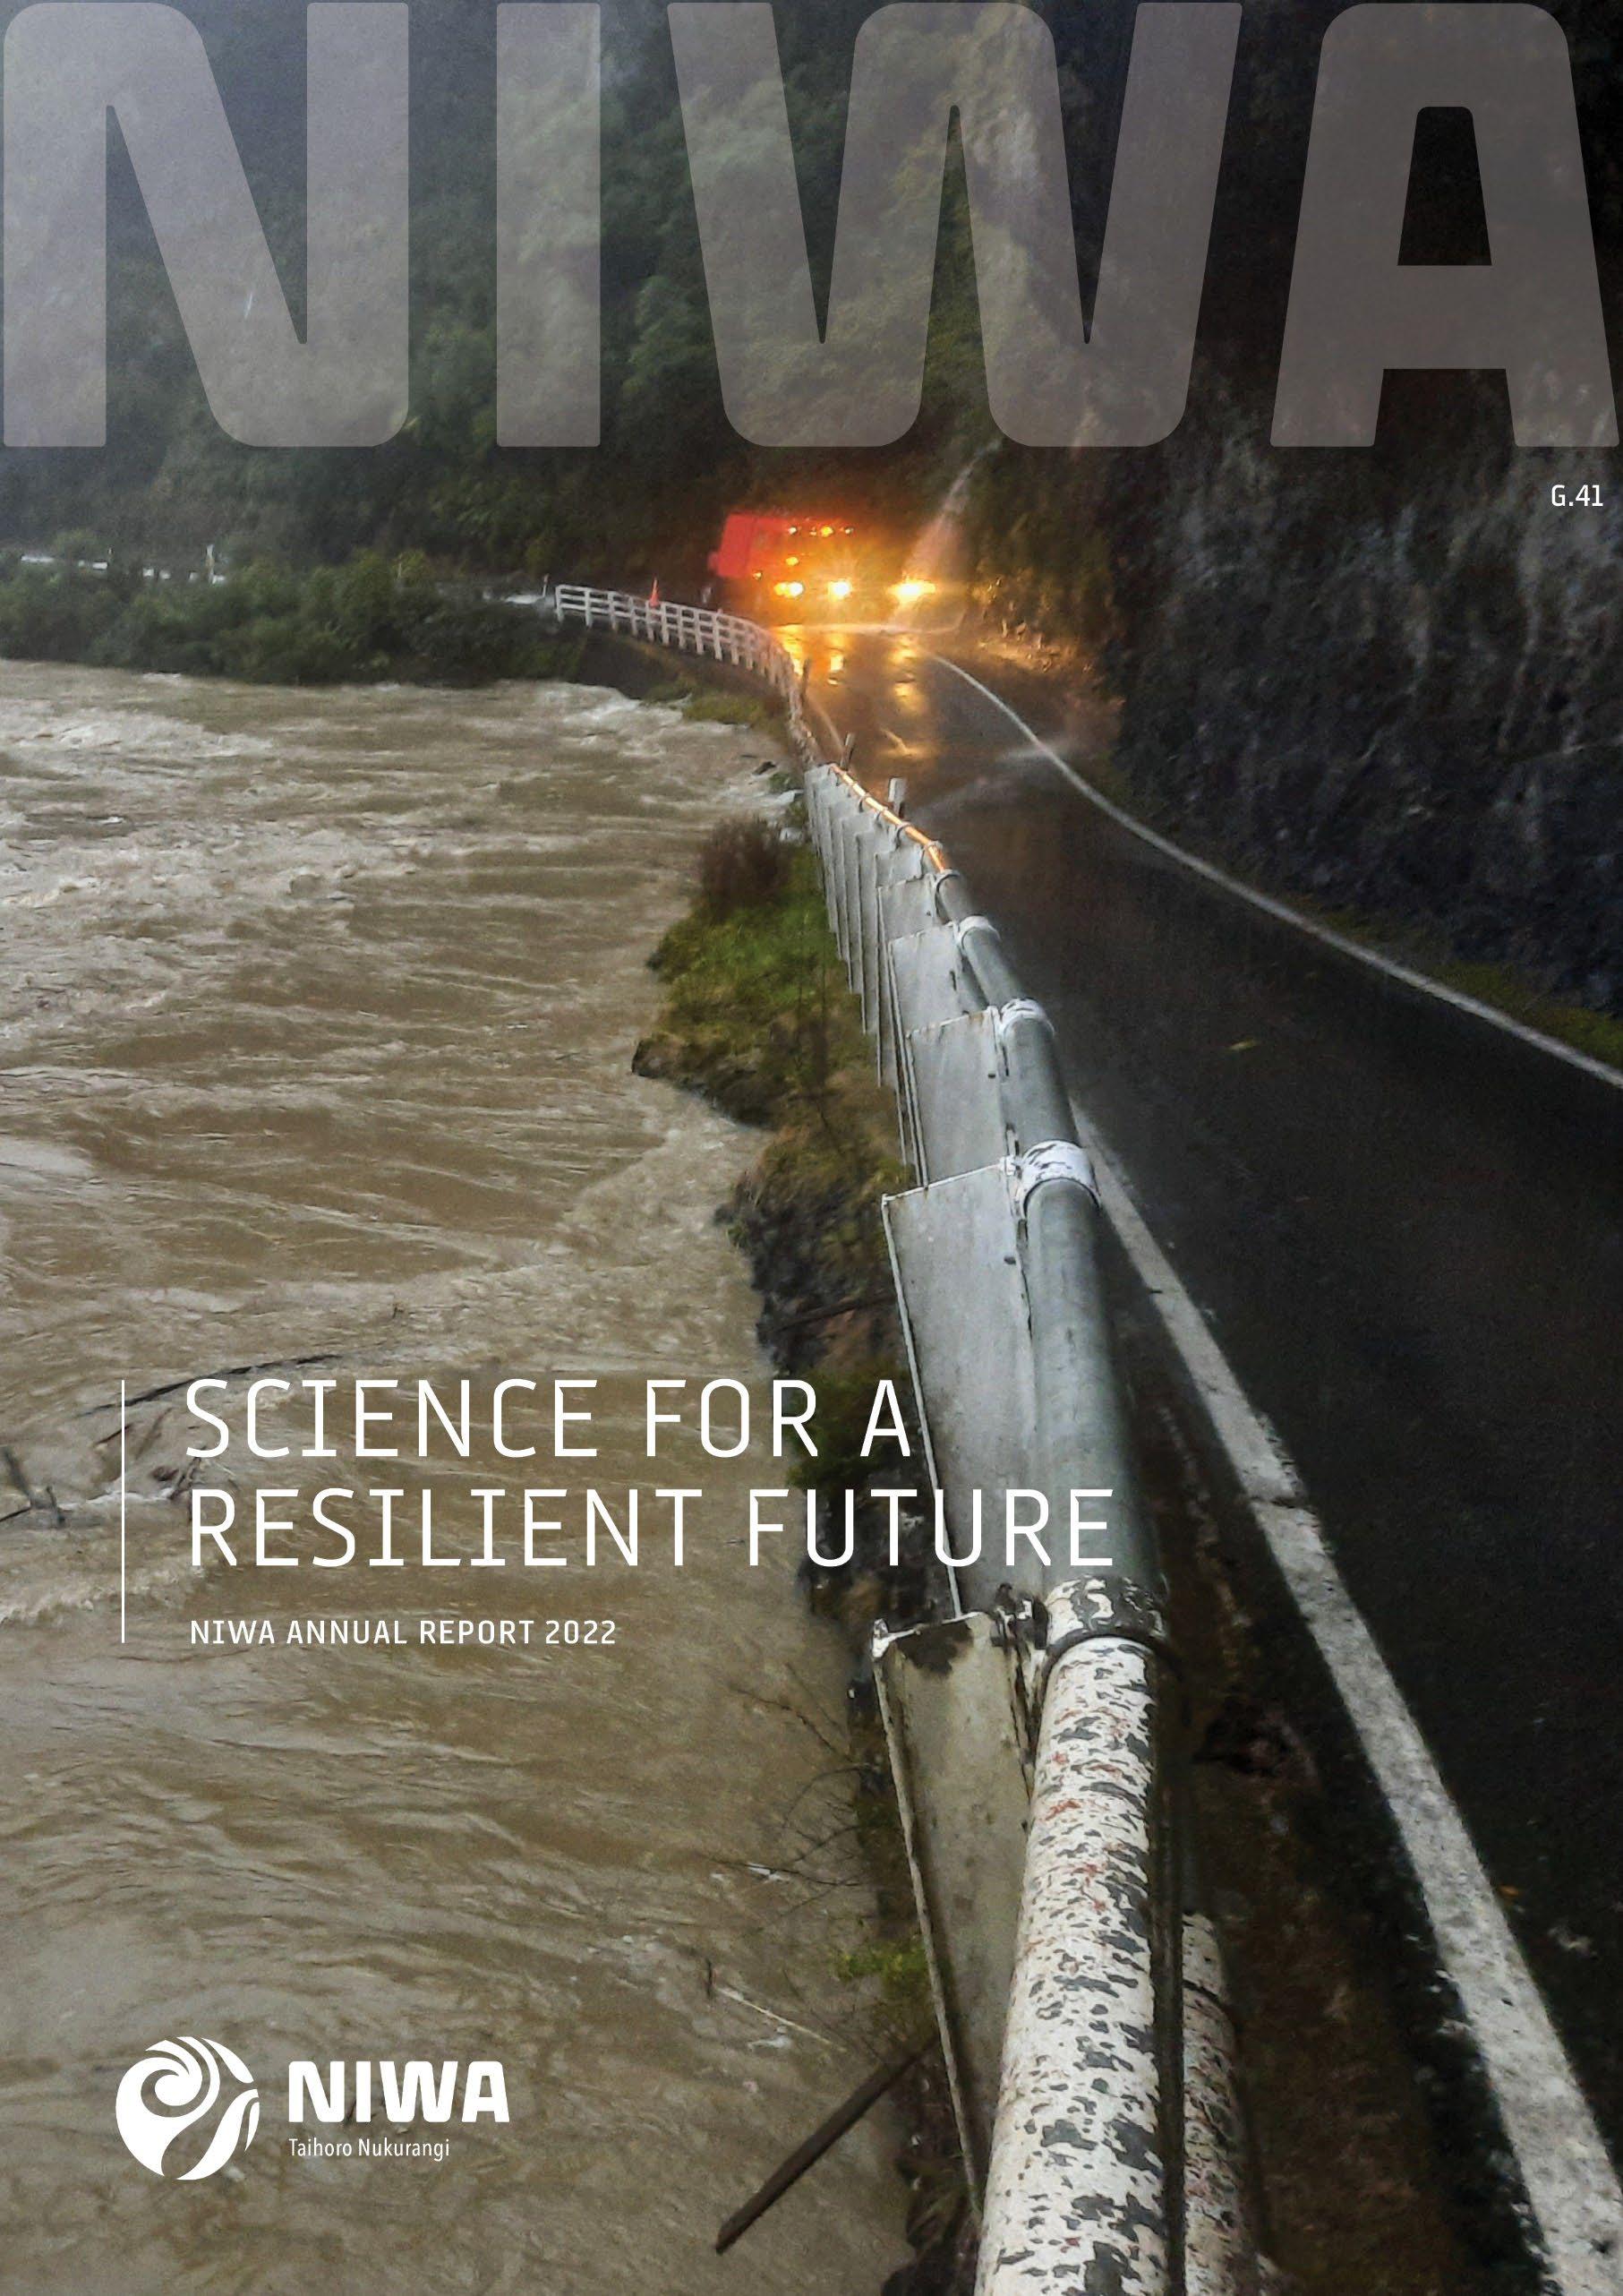
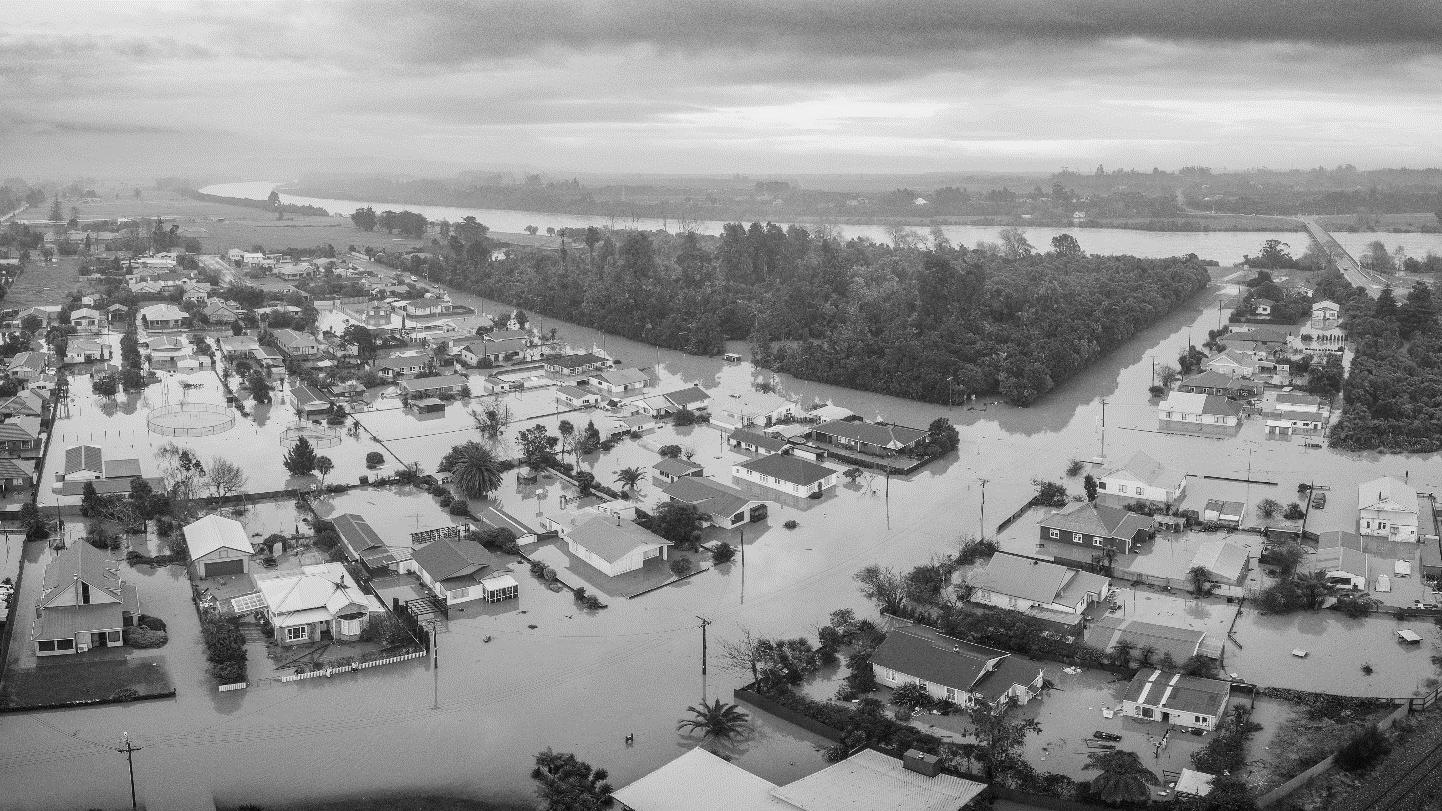
Cover: In July 2021, NIWA recorded the highest river flow ever measured in New Zealand – 7,640 cubic metres per second in the Buller River. Flood waters surged toward Westport, devastating the community and leaving more than 120 homes uninhabitable. NIWA’s national flood awareness system played a key role, providing emergency managers up to 48 hours’ warning of trouble ahead.
Mackley]
[Geoff
41
Auckland
September 2022 ISSN
ISSN
CONTENTS NIWA Science 2 National Outcomes 3 Statement of Core Purpose Outcomes 4 Performance Targets 2021/22 12 Financial Summary 13 Financial Statements 18 Directory 36
Annual Report
for a resilient future
2021/22 Science
Forecasting is central to NIWA’s role with our continually improving processing power and precise modelling, we can more accurately predict when and where heavy rain will fall, where it will go once it hits the ground, and what may happen when it gets there. [NZ Defence Force]
NIWA SCIENCE
OUR MISSION
To support the wellbeing of Aotearoa New Zealand’s people and business through
• improved management of the environment
• sustainable use of natural resources
• effective responses to global change
OUR AIM
To deliver the science that will enable Aotearoa New Zealand to meet its environmental challenges and thrive in a rapidly changing world
We will innovate, generate new knowledge, and apply our science to
• provide industry opportunities
• transition to a low carbon economy
• adapt to a changing climate
• improve the health of our waterways and oceans
• care for our unique biodiversity
OUR SCIENCE
Will support the realisation of these national outcomes by applying innovative technology across multidisciplinary teams.
CLIMATE
New Zealand’s pre eminent provider of atmospheric and climate science
• Climate change and variability
• High precision weather forecasting
• Weather related hazard forecasting
• Adaptation and mitigation
230 Science staff
New Zealand’s largest team of climate scientists
$42M Annual investment
In weather and climate research
7,500 Climate stations
The National Climate Database with information from 7,500 climate stations covering New Zealand, South West Pacific and Antarctica
$18M Supercomputer
Enabling precise, highly localised forecasts
FRESHWATER
Supporting the sustainable management of our freshwater resources
• Freshwater quality and quantity
• Biodiversity and biosecurity
• Sustainable use
• Flood forecasting
240 Science staff
New Zealand’s largest team of freshwater scientists
$40M Annual investment
Increasing knowledge of water quantity and quality
A national flood forecasting service
Providing river flow forecasts for more than 50,000 catchments nationwide
500 Hydrological monitoring stations
A nationwide network of water and soil moisture monitoring stations
OUR AIM
To achieve these advancements
• we will partner with Māori
• embrace new technologies
• support major science infrastructure
• collaborate with other science organisations and the sectors that apply our science products and services
OCEAN
Understanding, managing and maximising the benefits of our marine estate
• New Zealand’s Marine Estate
• Fisheries stock assessment
• Sustainable use of marine resources
• Biodiversity and biosecurity
• High value finfish aquaculture
260 Science staff
New Zealand’s largest team of ocean scientists
$67M Annual investment
In coast and ocean, fisheries and aquaculture science
Northland Aquaculture Centre
New Zealand’s leading science facility for finfish aquaculture
State of the art research vessels
Supporting the New Zealand science community
NIWA Annual Report 2021/22 2
NATIONAL OUTCOMES
We will innovate, generate new knowledge, and apply our science to address five key areas of Government priority. These National Outcomes are:
Adapting to a changing climate.
Transitioning to a low carbon economy.

Caring for our biodiversity.
A more productive sustainable economy.
Improving the health of our waterways and oceans.
NIWA’S SCIENCE STRATEGY, 2022 26
NIWA Annual Report 2021/22 3
1.
2.
3.
4.
5.
STATEMENT OF CORE PURPOSE OUTCOMES
The information in this section of the Annual Report demonstrates how NIWA is delivering on its expected outcomes.
Our purpose, set out in our Statement of Core Purpose, is to:
• enhance the economic value and sustainable management of Aotearoa New Zealand’s aquatic resources and environments
• provide understanding of climate and the atmosphere
• increase resilience to weather and climate hazards to improve the safety and wellbeing of New Zealanders.
We are expected to fulfil our purpose through the provision of research and transfer of technology and knowledge in partnership with key stakeholders and partners, including industry, government and Māori, to achieve six key outcomes:
1. Increase economic growth through the sustainable management and use of aquatic resources
2. Grow renewable energy production through developing a greater understanding of renewable aquatic and atmospheric energy resources
3. Increase the resilience of New Zealand and South West Pacific islands to tsunami and weather and climate hazards, including drought, floods and sea level change
4. Enable New Zealand to adapt to the impacts and exploit the opportunities of climate variability and change and mitigate changes in atmospheric composition from greenhouse gases and air pollutants
5. Enhance the stewardship of New Zealand’s freshwater and marine ecosystems and biodiversity
6. Increase understanding of the Antarctic and Southern Ocean climate, cryosphere, oceans and ecosystems and their longer term impact on New Zealand.

NIWA Annual Report 2021/22 4
RV Tangaroa with the peaks of the Hunga Tonga Hunga Ha’apai (HT HH) volcano in the background. NIWA is part of a global effort to understand what happened the day the HT HH volcano violently erupted and to investigate the consequences of the massive eruption. [NIWA Nippon Foundation TESMaP/Rebekah Parsons King]
Increase economic growth through the sustainable management and use of aquatic resources
PROJECT KEY ACHIEVEMENTS
Providingreal timehydrometric information
NIWA’s Environmental Monitoring Field Teams manage and operate a vast array of hydrometric data collection stations (more than 300 sites of water level, water flow or rainfall) across all regions and sectors of New Zealand, providing near real time, high quality information to commercial clients.
For almost 20 years NIWA has been managing Christchurch City Council’s hydrometric network of more than 90 monitoring stations, supplying near real time data for flood management, planning and consent requirements. Data platforms like Aquarius Webportal provide easier client access for quicker informed decision making.

SECTOR IMPACT
Water users across the primary, irrigation, electricity and local authority sectors are provided with accurate data forecasting products and data visualisation tools to enable them to make informed decisions on water use, efficient management of their water resources and sustainable use and allocation.
Growingtheaquacultureindustry
Optimisingpowergenerationin thePacific
The experimental commercial scale, land based recirculating aquaculture system for the production of high value finfish at the Northland Aquaculture Centre is under construction.

Detailed design and infrastructure works included upgraded electrical supply, water supply and discharge pipelines, drum filter discharge reservoir and pipeline to the anaerobic digester. Fish culture tanks and water treatment basins are complete and water tightness testing is underway.
Samoa has a new operational tool to help it achieve its goal of having 100% renewable energy sources by 2025.

The system helps the Samoa Electric Power Company (EPC) optimise hydropower generation at its largest renewable power scheme. The tool uses data from weather and climate forecasts, rainfall observations, dam level measurements and power generation outflow rates, and updates forecasts twice daily.
Samoan Meteorology Division staff check the model outputs, add any necessary commentary and send the reservoir storage outlook report to the EPC.
The plant is expected to be operational in early 2023. At full capacity, it will demonstrate the practical use of this technology for the commercial, whole of cycle production of premium kingfish, and will sustainably produce about 600 tonnes of kingfish annually.
The unit is central to sector growth, both within New Zealand and globally and will contribute to the sector achieving its revenue target of $3 billion annually by 2035.
The system’s outputs enable the EPC to consider options for water use for power generation, and to optimise water use while maintaining a guaranteed electricity supply, reducing the reliance on fossil fuels.
OUTCOME ONE NIWA Annual Report 2021/22 5
Grow renewable energy production through developing a greater understanding of renewable aquatic and atmospheric energy resources
PROJECT KEY ACHIEVEMENTS SECTOR IMPACT
Investigatingalternativeenergy sources
NIWA informed Phase I of MBIE’s NZ Battery Project feasibility study at Lake Onslow in Central Otago.

Outputs included an environmental baseline study which included a bathymetry survey, monitoring the effects of weather and climate on the lake, hydrodynamic modelling, a fish food web study, examining the impacts of pumped hydroelectric energy storage on lake ecology, assessing macrophytes and potential biosecurity issues, and a review of potential greenhouse gas emissions.
In addition to the baseline study, NIWA led a nationwide GIS scan of potential sites for pumped storage systems and assessed the variability and correlation between the potential for hydro, wind and solar energy under future climate scenarios.
Modellingrenewableenergy production
A high resolution weather re analysis is creating a dataset for modelling renewable energy production that more closely mirrors Aotearoa New Zealand’s complex terrain and the intricate atmospheric processes that drive our local weather and climate. The reanalysis will be used to simulate likely energy yields at different times of the year in different locations.
The study aims to help solve New Zealand’s dry year electricity issues by supporting hydroelectricity generation when there is insufficient water storage in existing hydropower lakes.

renewableelectricitygeneration
NIWA has supplied Mercury Energy with rainfall outlooks for New Zealand's main hydro catchments (Manapouri, Clutha, Waitaki and Tongariro) every week since 2017. Mercury is one of several companies to benefit from bespoke NIWA forecasting. In mid-2022, Mercuria Energy approached NIWA for forecasting services, signing a contract for short , medium , and long range catchment level predictions.
Improved long term averages of wind, better information about expected cloud cover, and more accurate rain and snowfall data will help quantify capacity for producing wind, solar and hydroelectric power.
Bespoke forecasts are used by energy companies to make operational and long term planning decisions that can help them maximise their renewable energy output. This is especially important as demand for renewable energy grows in the face of our changing climate and increasing pressure to cut our greenhouse gas emissions.

OUTCOME TWO NIWA Annual Report 2021/22 6
Forecastingtomaximise
Increase the resilience of New Zealand and South West Pacific islands to tsunami and weather and climate hazards, including drought, floods and sea level change
PROJECT KEY ACHIEVEMENTS
High resolutiondrought forecasting

NIWA and the Ministry for Primary Industries are working together to develop a new drought forecasting tool which uses innovative climate modelling, the latest in machine learning and other data driven techniques.
The tool updates daily to provide forecasts at a much higher spatial resolution than previously available. This will enable the provision of district level predictions of dryness and drought.
SECTOR IMPACT
It will help farmers and growers better prepare for periods of dryness and drought, contributing not just to their bottom lines, but also to their own wellbeing and animal welfare.
Newforecastingtoolforthe Pacific
This first of its kind drought monitoring and forecasting system for the Pacific region uses near real time satellite rainfall monitoring and combines it with a state of the art multi model ensemble seasonal forecast system.
Satellite rainfall data is downloaded daily and processed on NIWA’s High Performance Computer. Regional and country level maps are generated for several drought monitoring indices and products, and interpretive products showing what is changing across the region are also produced to help inform decision making.

The forecast information will help many Pacific island meteorological services and regional non governmental institutions improve their forecasting capabilities, helping them anticipate and more proactively respond to areas at risk of potential water stress.
Upgradingglobalforecasting systems

A major update to Cylc, the software that orchestrates the scientific workflows behind EcoConnect, is the result of a significant three year re engineering effort. EcoConnect is NIWA's specialist environmental forecasting and information service. It specialises in the creation and delivery of past, present and future environmental information.
Cylc was designed more than a decade ago for use in weather, climate and environmental forecasting systems. The open source software is used throughout the Unified Model partnership, an international collaboration led by the UK Met Office to improve global atmospheric models and forecasting. The new version, Cylc 8, is built on modern web technologies and has a range of new, efficient features that make it perform much better than its predecessor.
OUTCOME THREE NIWA Annual Report 2021/22 7
PROJECT KEY ACHIEVEMENTS
MinimisingCOVID 19transmission throughimprovedventilation
As COVID 19 transmission became widespread in the community in 2021, NIWA air quality researchers responded to an urgent need across government to understand and improve indoor air quality to reduce virus transmission. The team worked with the Ministry of Education to investigate and advise on the best ways to ventilate classrooms and other shared spaces to minimise the transmission of COVID-19.
SECTOR IMPACT
This work directly informed Ministry of Education ventilation guidance to schools and has led to a contract with the Ministry of Health to provide guidance across other sectors, including early childhood education, healthcare settings and aged care.

InformingNewZealand’sclimate changeprojections
Predictingfuturemarine heatwaves
NIWA was part of a multi agency and science community collaboration to extract and interpret information relevant to New Zealand from the Working Group 1 contribution to the Intergovernmental Panel on Climate Change (IPCC) Sixth Assessment Report, ‘The Physical Science Basis’, published in August 2021.


The report distilled the New Zealand relevant information from the IPCC report to update what we know about the effects of climate change on New Zealand, ahead of the production of updated regional climate projections for New Zealand due in 2024.
New research shows New Zealand could experience very long and very severe marine heatwaves by the end of this century. Analysis indicates an 80–100% increase in marine heatwave intensity by the end of the century for all analysed coastal regions under the high emission scenario, which could become permanent year round by the end of the century.
The research gives locally relevant and coastal insights into climate impacts on our oceans and informs planning on adapting to our changing world.
OUTCOME FOUR NIWA Annual Report 2021/22 8
E
nable New Zealand to adapt to the impacts and exploit the opportunities of climate variability and change and mitigate changes in atmospheric composition from greenhouse gases and air pollutants
Enhance the stewardship of New Zealand’s freshwater and marine ecosystems and biodiversity
PROJECT KEY ACHIEVEMENTS
Mitigatingagriculturalrun off The ambitious five year MBIE funded project to develop a comprehensive set of performance and design guidelines for constructed wetlands intercepting diffuse run off from pastoral farms was completed in May 2022. The Interceptor project produced the Constructed Wetlands Guide, endorsed by regulating agencies to encourage more uptake of wetlands and riparian buffers.
Co managementandrestoration ofourfreshwatertaongaspecies
Cultural Keystone Species (CKS) was a four year (2016 21) MBIE funded research programme that scaled up and built on the freshwater taonga species research that NIWA has been undertaking with whānau, hapū and iwi around the country over the previous decades.


It has co developed research methods, tools and products with whānau, hapū and iwi that inform new and innovative management approaches for the protection, restoration and economic development of CKS.
SECTOR IMPACT
The primary sector is under pressure to meet new water quality regulations and improved methods to manage agricultural runoff. Wetlands and riparian buffers are two tools which can help land users meet those expectations. The Interceptor Project provides case studies of constructed wetlands from around the country which stand as good examples for land users to follow.
The programme supported at least 30 researchers working in partnership with 20 hapū/tribal entities, seven consultancies, two power companies and 15 regional and central government agencies.
Milestones from the CKS programme include significant advances in understanding the water quality and habitat needs of juvenile tuna, kōura and kākahi; new methods for understanding state and trend analyses that are directed by mātauranga Māori and informed by hapū driven datasets; and research that enables improved tuna, kōura and kākahi restoration and management actions.
Sustainablymanagingscallop fisheries

Beyond the commercial value, tipa (scallops) also play an important ecological role in helping keep the water clean. Following concerns raised by iwi and communities in northern New Zealand, NIWA experts contributed to a significant management decision made in 2021.
Using results from NIWA led surveys, which revealed the critical condition of some scallop populations, the Minister decided to fully close the fisheries in Northland, as well as much of the Hauraki Gulf and Coromandel.
Although limited areas remain open to commercial and recreational fishing, the closures will hopefully allow the northern tipa populations to recover. In an effort to reduce some of the known impacts of dredging for tipa, NIWA is also exploring and developing new technologies based on cameras and machine learning, with the aim of finding alternatives to dredging methods, allowing more sustainable scallop fishing.
OUTCOME FIVE NIWA Annual Report 2021/22 9
Increase understanding of the Antarctic and Southern Ocean climate, cryosphere, oceans and ecosystems and their longer term impact on New Zealand
PROJECT KEY ACHIEVEMENTS
SafeguardingAntarctic ecosystems
NIWA Antarctic research balancing environmental protection, sustainable fishing and science interests has contributed significantly to protection of the Ross Sea, the world’s largest Marine Protected Area (MPA).
Led by a NIWA research programme called Ross RAMP, the first five year compilation of New Zealand research associated with the MPA was delivered in February 2022 to the Commission for the Conservation of Marine Living Resources (CCAMLR).
New Zealand provided the highest number of projects from all CCAMLR members, with much research funded or co funded by NIWA’s Ross RAMP. This included more than 13 scientific publications and over 30 presentations.
SECTOR IMPACT
The Ross Sea MPA sets out to conserve the area’s ecology, mitigate threats to ecosystems from fishing, and provide a reference area to better gauge the effects of fishing and climate change over time. The MPA will cease in 2052, and proof of its effectiveness is needed for it to continue beyond this period.
Drillingbeneaththeiceto understandclimate changeimpacts
Every winter in Antarctica, two metre thick sea ice forms. The layer of ice crystals directly beneath the sea ice, called the sub ice platelet layer, provides a habitat for algae, eggs and larvae of fish.

Scientists from NIWA, the University of Otago and Victoria University of Wellington, funded by the Antarctic Science Platform, are investigating the distribution of the platelet layer under the ice, and how this varies with time. In 2021–22 the team developed and tested a bespoke engineered device called the Sympagic Sampler to take platelet samples. This huge drill collects core samples of the delicate platelet structure.
The samples allow the team of scientists to study the platelet ice habitats and the conditions necessary for them to form. Any small shift in the environment could change where, when and even if, the platelet ice forms. Such impacts could have major implications for the animals that need the ice to survive, with knock on effects for the wider Ross Sea marine ecosystem.

Increasingourseabird knowledge

Seabirds are a key and poorly understood part of our marine ecosystems, with many species threatened or data deficient. NIWA research has significantly contributed to our better understanding of habitat use and foraging habits of many iconic New Zealand species that can be found along our coastlines, and our Sub Antarctic and Polar frontal zones.
Celebrating its 30 year anniversary in 2022, one long term study of Buller’s albatross has allowed better understanding of the significance of accidental bycatch of seabirds by commercial fishing vessels. This has been achieved by building an impressive database of encounter histories for breeding birds, and deploying and retrieving tracking devices.
NIWA’s contribution to seabird research, particularly on long lived species with low reproductive outputs, is far ranging and high impact, and has significantly advanced our knowledge of seabird ecology and links to climate change in the last few decades.
OUTCOME SIX NIWA Annual Report 2021/22 10

NIWA Annual Report 2021/22 11
Recirculating Aquaculture Systems (RAS) answer the call for a more sustainable aquaculture industry and to help the industry meet its goal of $3 billion by 2035. NIWA’s experimental, commercial scale RAS at the Northland Aquaculture Centre is on track to produce 600 tonnes of kingfish annually in 2023. [CB Civil]
PERFORMANCE TARGETS 2021/22
NIWA will measure its performance against the outcomes and operating principles in its Statement of Core Purpose using the following set of indicators.
Financial Indicators
Measure Calculation
Operating margin
Earnings Before Interest, Tax, Depreciation, Amortisation and Fair value (EBITDAF)/Revenue
Profit per FTE EBITDAF/FTEs
Quick ratio
Current assets less inventory less prepayments/Current liabilities less revenue received in advance
Interest coverage EBITDAF/Interest paid
Profit volatility
Standard deviation of EBITDAF for the past five years/Average EBITDAF for the past five years
Reporting frequency Target 2021/22 Actual 2021/22
Annual 18.1% 16.3%
Annual $45,000 $40,000
Quarterly 2.04 2.4
Quarterly 15.8 17.9
Annual 12 8% 24.3%
Forecasting risk Five year average of return on equity less forecast return on equity Annual 2.1% 2.2%
Adjusted return on equity NPAT excluding fair value movements (net of tax)/Average of share capital plus retained earnings Quarterly 5.0% 5.0%
Revenue growth % change in revenue
Annual 1.3% 3.8%
Capital renewal Capital expenditure/Depreciation expense plus amortisation expense Quarterly 251.2% 227%
Organisational Performance Indicators 2021/22 at a glance
Measure Calculation
End user collaboration* Revenue per FTE from commercial sources
Reporting frequency Target 2021/22 Actual 2021/22
Quarterly $99,000 $109,000
Research collaboration* Publications with collaborators Quarterly 85% 93%
Technology & knowledge transfer* Commercial reports per scientist FTE
Science quality* Impact of scientific publications
Operational efficiency* Revenue per FTE
Operational delivery % projects delivered on time
Strategic progress % annual KPIs achieved
*Ministry of Business, Innovation & Employment generic indicators
Quarterly 1.0 1.52
Annually 2.5 4.7
Quarterly $247,000 $248,500
Annually >90% 98%
Annually >90% 100%
NIWA Annual Report 2021/22 12
FINANCIAL SUMMARY
NIWA Group Financial Summary
in thousands of New Zealand dollars 2022 2021 2020 2019 2018 Revenue and other gains 170,233 176,887* 158,860* 161,292 151,416
Research 95,614 109,111 93,800 94,901 91,516
Commercial science 74,618 67,775 65,059 66,390 59,899
Other income 1 1 1 1 1
Profit before income tax 8,958 22,594 9,982 8,708 9,074
Profit for the year 6,470 16,263 7,370 6,247 6,472
Capital expenditure 40,817 23,080 14,757 21,460 33,573
Adjusted return on average equity (%)** 5.0 13.9 6.9 6.2 6.9
Return on average equity (%) 4.3 11.6 5.7 5.1 5.5
* Includes $8.27 million from the Government’s COVID 19 Response and Recovery Fund (CRRF).
** The ‘adjusted return on average equity’ uses a valuation basis comparable to that used by other Crown Research Institutes. This valuation basis arose from the transition to New Zealand Equivalents to International Financial Reporting Standards in 2006/07 and reverses the effect of the revaluation of certain land and buildings.
Group actual performance versus Statement of Corporate Intent (SCI)
For the year ended 30 June 2022
2022 Actual 2022 SCI 2021 Actual Revenue and other gains 170,233 171,255 176,887
in thousands of New Zealand dollars
Operating expenses, depreciation and amortisation 161,331 161,728 154,397
Profit before income tax 8,958 9,305 22,594
Profit for the year 6,470 6,030 16,263
Average total assets 225,998 205,102 205,741
Average shareholders’ funds 151,225 143,604 139,841
Profitability
Operating profit margin (%) (EBITDA/revenue) 16.3 18.1 24.3
Adjusted return on average equity after tax (%) (net surplus/adjusted average equity) 5.0 5.0 13.9
Return on average equity after tax (%) (net surplus/average equity) 4.3 4.2 11.6
Return on assets (%) (EBIT/average total assets) 3.9 4.6 10.9
Profit volatility (%) (non adjusted ROE) 24.3 18.7 29.5
Forecasting risk (%) 2.2 1.9 2.9
Liquidity and efficiency
Current ratio 1.3 1.2 1.6
Quick ratio 2.4 2.1 3.1
Financial leverage
Debt to average equity (%)
Gearing (%)
Proprietorship (%) (average shareholders’ funds/total assets) 65 69 64
NIWA Annual Report 2021/22 13
Despite the difficult operating environment, NIWA delivered a strong revenue and profit result by pursuing all possible revenue opportunities, careful management
and maximising operational productivity, while continuing to deliver high quality science.
Revenue
NIWA achieved revenue of $170.2 million for the year. Compared with the budget set out in NIWA’s Statement of Corporate Intent, revenue was down by $1.0 million. This was a pleasing result in what was a challenging year. Year on year, revenue was $6.7 million below the previous year. (Note: revenue in the previous year included $8.3 million from the Government’s COVID 19 Response and Recovery Fund).
NIWA’s revenue from the MBIE National Science Challenges during the year was $3.6 million higher than the prior year, mainly due to the effect of phase 2 of the National Science Challenges being well underway. Revenue associated with NIWA’s ocean going research vessels was $2.4 million less than the prior year, largely due to the biennial voyage to Antarctica in 2020/21.
Total revenue ($ in thousands)
The share of NIWA’s revenue arising from contracts with MBIE was 56%, composed of $50.6 million SSIF funding and $45.1 million contestable contracts. Revenue from the Ministry of Primary Industries at $20.6 million accounted for 12%. Combined, revenue from these two agencies was 4% lower than the position in 2020/21.
Revenue by source
Expenditure
Operating expenses (including depreciation and amortisation), whilst slightly lower than budget, increased by $6.9 million compared with the previous year.
Personnel costs accounted for $3.5 million of the increase in operating expenses over the previous year, driven by salary increases and intense competition for skills. Research collaboration accounted for a further $3.3 million of the year on year increase, due to increased subcontractor activity as phase 2 of the National Science Challenges is well underway.
Operating costs as a percentage of revenue remain carefully managed. This year has seen a return to normal levels not seen in the past two financial years where the COVID 19 Response and Recovery Fund was received.
Total expenditure ($ in thousands)
NIWA Annual Report 2021/22 14 31% 26% 9% 12% 18% 4%
of costs
MBIE Strategic Science Investment Fund MBIE Contestable Funds
Central
government agencies
Ministry
for Primary Industries Private sector Local government agencies 135,000 140,000 145,000 150,000 155,000 160,000 165,000 170,000 175,000 180,000 2018 2019 2020 2021 2022 82.0% 84.0% 86.0% 88.0% 90.0% 92.0% 94.0% 96.0%20,000 40,000 60,000 80,000 100,000 120,000 140,000 160,000 180,000 2018 2019 2020 2021 2022 Personnel costs Total costs Total costs % of revenue 0
Profitability
NIWA delivered a profit before tax of $9.0 million and an after tax profit of $6.5 million during 2021/22. Compared with the previous year, these results reflect a decrease of $13.6 million and $9.8 million respectively, primarily because the $8.27 million COVID Response and Recovery Fund contribution received in each of the last two years was not provided this year. Compared with budget, the result was $0.34 million lower before tax and $0.44 million higher after tax.
Net profit after tax ($ in thousands)
2,000 4,000 6,000 8,000 10,000 12,000 14,000 16,000 18,000
NIWA also closely monitors its Earnings before Interest, Tax, Depreciation and Amortisation (EBITDA), as this measure assists in understanding the Company’s capacity to fund future investments and carry debt. NIWA achieved EBITDA of $27.7 million for the year against a budget of $31.0 million. We continue to manage this measure carefully to ensure that we remain in a position to finance our planned major facility investments over the coming several years.
EBITDA ($ in thousands)
5,000 10,000 15,000 20,000 25,000 30,000 35,000 40,000 45,000 50,000
NIWA’s fundamental financial performance metric is adjusted return on equity, which enables comparison between CRIs on an equivalent basis. The Company delivered an adjusted ROE of 5.0% this year, which aligned with the budget objective of 5.0% and was lower than the 13.9% achieved in the previous year.
Capital management and cash
Cash flows
The following table summarises NIWA’s cash flows this year and last year:
($ in millions)
2022 2021 Change
Net cash flows from operating activities 30.167 38.979 (8.812)
Net cash flows from investing activities (19.106) (38.397) 19.291
Net cash flows from financing activities (2.082) (1.769) (0.313)
Net increase/(decrease) in cash 8.979 (1.187) 10.166
The above presentation is consistent with New Zealand Equivalents to International Financial Reporting Standards and therefore treats cash flows relating to short term deposits with maturities greater than three months as investing activities. In order to provide more useful and relevant information concerning the Company’s cash flows, the table below restates the summary of cash flows, treating all short term investments as equivalent to cash:
($ in millions)
2022 2021 Change
Net cash flows from operating activities 30.167 38.979 (8.812)
Net cash flows from investing activities (39.106) (23.397) (15.709)
Net cash flows from financing activities (2.082) (1.769) (0.313)
Net increase/(decrease) in cash including other term deposits (11.021) 13.813 (24.834)
Net cash flows from operating activities
Net cash inflows from operating activities decreased by $8.8 million to $30.2 million in 2022. This year on year change reflected additional personnel and subcontractor costs.
Net cash flows from investing activities
Net cash outflows from investing activities (excluding the impact of cash flows associated with term deposits with maturities in excess of three months) increased by $15.7 million to $39.1 million. This year on year variance was related to the costs associated with the new Hamilton property and the recirculating aquaculture system at NIWA’s Northland Aquaculture Centre.
Net cash flows from financing activities
Net cash outflows from financing activities increased by $0.3 million to $2.1 million. These costs relate to the treatment of long term lease costs under the accounting standard, NZ IFRS 16 Leases. The Company paid no dividend during the year. This was signalled in the
NIWA Annual Report 2021/22 15 0
2018 2019 2020 2021 2022 0
2018 2019 2020 2021 2022
previous year’s Statement of Corporate Intent and reflects upcoming essential and material investments designed to ensure that our science facilities remain fit for purpose for the coming decades.
Capital spending
The following table summarises NIWA’s capital expenditure this year and last year:
$ in millions 2022 2021 Change
Land, buildings & improvements 23.686 9.766 13.920
Equipment 9.598 6.363 3.235
ICT equipment 2.884 1.984 0.900
Vessel equipment 2.972 3.164 (0.192)
Other 1.677 1.803 (0.126)
Total capital spending 40.817 23.080 17.737
Total capital expenditure was $40.8 million during the year, up from $23.1 million during the prior year. This was due to the phasing of certain major capital projects.
Capital expenditure ($ in thousands)
0 5,000 10,000 15,000 20,000 25,000 30,000 35,000 40,000 45,000
2018 2019 2020 2021 2022
Capital structure and liquidity
Shareholders’ equity at 30 June 2022 was $154.5 million (2021: $148.0 million) which was $7.9 million above the level forecast in the SCI budget. Total assets at year end were $234.2 million (2021: $217.8 million). As at 30 June 2022, the Company’s net debt balance was zero, equal to that at the prior year end.
NIWA’s liquidity is mainly provided by operating cash flows. In addition, the Company has access to financing facilities of $10.5 million provided by its bank, although this facility was not required to be called upon during the year.
Dividends
As foreshadowed in the Company’s Statement of Corporate Intent, the Directors of NIWA have once again decided not to declare a dividend in respect of the 2022 year. This is in the light of a series of significant capital investments which will be required to maintain and build the Company’s capability and financial sustainability for the future. These investments include renovating or replacing the physical infrastructure and facilities at three of the Company’s main sites
NIWA Annual Report 2021/22 16
NIWA Annual Report 2021/22 17
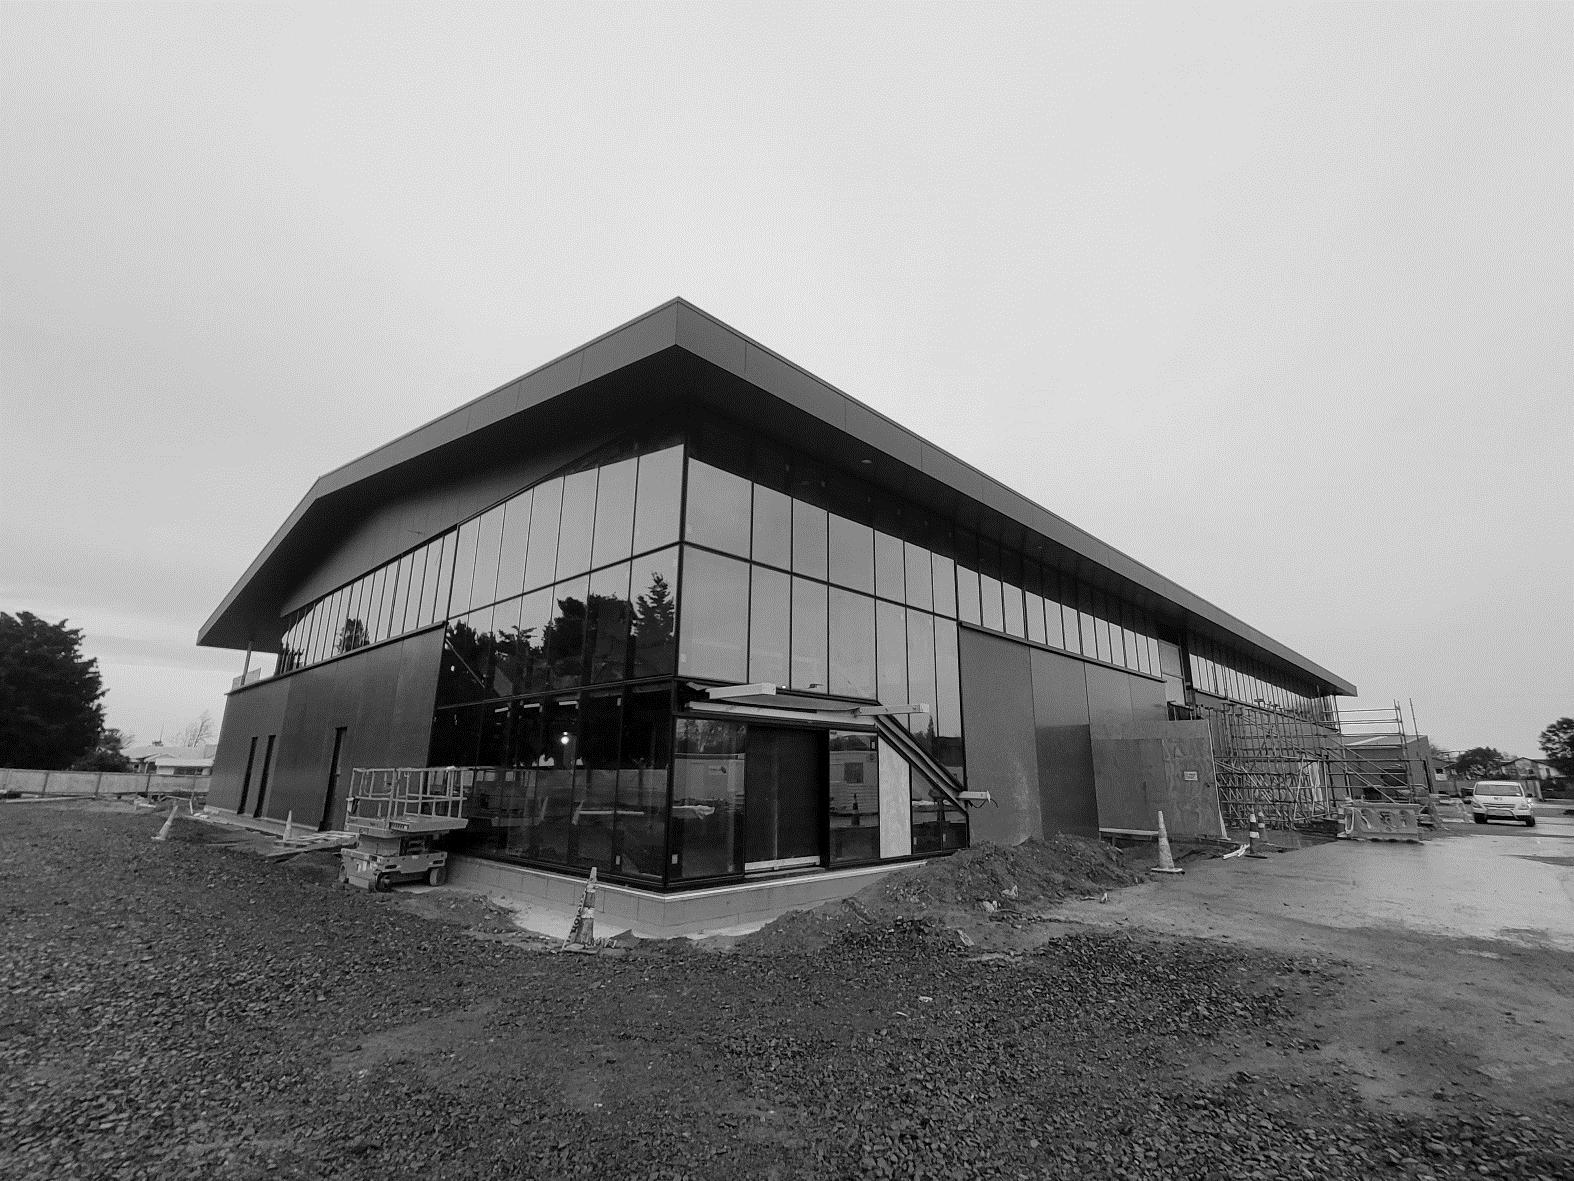
NIWA’s new Hamilton facility on the University of Waikato campus is scheduled for completion in mid 2023. [Blanton Benjamin, Fosters Construction]
FINANCIAL STATEMENTS
NIWA GROUP STATEMENT OF COMPREHENSIVE INCOME
For the year ended 30 June 2022 in thousands of New Zealand dollars Notes 2022 Actual
Revenue and other gains 1
2022 SCI Budget (unaudited) 2021 Actual
Revenue 170,232 171,253 176,886
Other gains 1 2 1 Total income 170,233 171,255 176,887
Operating expenses 2
Employee benefits expense (82,178) (80,534) (78,127) Other expenses (60,347) (59,689) (55,775) (142,525) (140,223) (133,902)
Profit before interest, income tax, depreciation, and amortisation (EBITDA) 27,708 31,032 42,985
Depreciation 4, 5 (17,978) (20,809) (19,813) Amortisation 7 (828) (696) (682)
Profit before interest and income tax (EBIT) 8,902 9,527 22,490
Interest income 553 382 502 Finance expense 5 (497) (604) (398) Net interest and other financing income 56 (222) 104
Profit before income tax 8,958 9,305 22,594 Income tax expense 11 (2,488) (3,275) (6,331) Profit for the year 6,470 6,030 16,263
Other comprehensive (loss)/income Items that may be reclassified to profit or loss Foreign currency translation differences of foreign operations 40 (4)
Total comprehensive income for the year 6,510 6,030 16,259
Profit attributable to:
Owners of the Parent 6,415 6,030 16,214 Non controlling interest 55 49 Profit for the year 6,470 6,030 16,263
Total comprehensive income attributable to: Owners of the Parent 6,455 6,030 16,210 Non controlling interest 55 49
Total comprehensive income for the year 6,510 6,030 16,259
The accompanying ‘Notes to the financial statements’ are an integral part of, and should be read in conjunction with, these financial statements
NIWA Annual Report 2021/22 18
NIWA GROUP STATEMENT OF CHANGES IN EQUITY
For the year ended 30 June 2022
in thousands of New Zealand dollars Note Share capital
Retained earnings
Non controlling interest
Foreign currency translation reserve Total equity
Balance at 1 July 2020 24,799 106,913 284 (285) 131,711
Profit for the year
Other comprehensive income
Total comprehensive income
16,214 49 – 16,263
(4) (4)
16,214 49 (4) 16,259
Balance at 30 June 2021 24,799 123,127 333 (289) 147,970
Balance at 1 July 2021 24,799 123,127 333 (289) 147,970
Profit for the year
Other comprehensive (loss)/income
Total comprehensive income/(loss)
6,415 55 – 6,470
40 40
6,415 55 40 6,510
Balance at 30 June 2022 24,799 129,542 388 (249) 154,480
The accompanying ‘Notes to the financial statements’
an integral part of, and should be read in conjunction with, these financial statements.
Share capital
The Group has authorised issued and fully paid capital of 24,798,700 ordinary shares (2021: 24,798,700 ordinary shares). All shares carry equal voting and distribution rights and have no par value.
NIWA Annual Report 2021/22 19
–
– – –
–
–
– – –
–
are
NIWA GROUP STATEMENT OF FINANCIAL POSITION
As at 30 June 2022

in thousands of New Zealand dollars Notes 2022 Actual 2022 SCI Budget (unaudited) 2021 Actual
Equity and liabilities
Equity
Share capital 24,799 24,799 24,799
Equity reserves 129,293 121,699 122,838
Shareholders’ interest 154,092 146,498 147,637
Non controlling interest 388 121 333
Total equity 154,480 146,619 147,970
Non current liabilities
Provision for employee entitlements 3 966 944 879
Lease liabilities 5 12,250 14,919 9,026
Deferred tax liability 12 1,057 2,766 2,352
Total non current liabilities 14,273 18,629 12,257
Current liabilities
Payables and accruals 18,477 12,240 12,879
Revenue in advance 33,339 22,327 29,155
Provision for employee entitlements 3 11,042 9,618 9,934
Taxation payable 396 881 3,635
Lease liabilities 5 2,162 1,996
Forward exchange derivatives 16
Total current liabilities 65,416 45,082 57,599
Total equity and liabilities 234,169 210,330 217,826
Assets
Non current assets
Property, plant and equipment 4 136,204 112,924 113,072

Identifiable intangibles 7 1,744 30,583 1,837
Deferred tax asset 12 122 114
Right of use asset 5 12,537 13,082 8,819
Prepayments 269 96 51
Total non current assets 150,876 156,685 123,893
Current assets
Cash and cash equivalents 32,019 10,054 22,988
Other short term investments 20,000 19,000 40,000
Forward exchange derivatives 570 8
Receivables 9 17,107 12,585 19,060
Prepayments 3,419 2,535 2,526
Assets held for sale 8 245 245 245
Uninvoiced receivables 5,690 6,436 6,614
Inventory 10 4,243 2,790 2,492
Total current assets 83,293 53,645 93,933
Total assets 234,169 210,330 217,826
The accompanying ‘Notes to the financial statements’ are an integral part of, and should be read in conjunction with, these financial statements.
For and on behalf of the Board:
Barry Harris Nicholas Main Chairman DeputyChairman
The financial statements were authorised for issue by the directors on 30 August 2022.
NIWA Annual Report 2021/22 20
NIWA GROUP CASH FLOW STATEMENT
For the year ended 30 June 2022
in thousands of New Zealand dollars
Cash flows from operating activities
Cash was provided from:
Notes 2022 Actual
2022 SCI Budget (unaudited) 2021 Actual
Receipts from customers and grants 176,275 177,001 175,112
Dividends received 1 – 1
Interest received 553 382 502
Cash was disbursed to:
Payments to employees and suppliers (139,135) (139,797) (130,177)
Interest paid 5 (497) (604) (398)
Taxation paid (7,030) (4,735) (6,061)
Net cash inflow from operating activities 13 30,167 32,247 38,979
Cash flows from investing activities
Cash was provided from:
Sale of property, plant and equipment 1,693 26 Term deposits maturing 44,000 – 22,000
Cash was applied to:
Purchase of property, plant and equipment (40,064) (46,761) (22,480)
Purchase of intangible assets (735) (696) (943) Investments in other term deposits (24,000) (19,000) (37,000)
Net cash outflow from investing activities (19,106) (66,457) (38,397)
Cash flows from financing activities
Cash was applied to:
Payment for lease principal (2,082) (2,983) (1,769)
Net cash outflow from financing activities (2,082) (2,983) (1,769)
Increase/(decrease) in cash and cash equivalents 8,979 (37,193) (1,187)
Effects of exchange rate changes on the balance of cash held in foreign currency 52 2
Opening balance of cash and cash equivalents 22,988 47,247 24,173
Closing cash and cash equivalents balance 32,019 10,054 22,988
Made up of:
Cash at bank and on hand 2,057 2,707 1,669
Short term deposits 29,962 7,347 21,319
Closing cash and cash equivalents balance 32,019 10,054 22,988
The accompanying ‘Notes to the financial statements’ are an integral part of, and should be read in conjunction with, these financial statements.
NIWA Annual Report 2021/22 21
NIWA GROUP NOTES TO THE FINANCIAL STATEMENTS
For the year ended 30 June 2022
1. Revenue and other gains
Rendering of services
The Group uses the ‘percentage of completion method’ to determine the appropriate amount of revenue to recognise in a given period. The stage of completion is measured by reference to the labour and non labour costs incurred up to the end of the year as a percentage of total estimated costs for each contract.
Contract duration is typically 1 5 years and revenue is recognised over time as service is rendered. The customer pays a fixed amount over the contract term in accordance with the payment frequency specified in the contract.
Goods sold
The Group recognises revenue from the sale of goods when control of the goods has passed to the customer, the associated costs and possible return of goods can be estimated reliably, there is no continuing management involvement with the goods, and there is a high probability that a significant reversal in the revenue recognised will not occur. Revenue from the sale of goods is measured at the fair value of the consideration received or receivable, net of returns and allowances. The timing of the transfer of control varies depending on the individual terms of the sales agreement.
Government grants
Government grants are recognised under NZ IAS 20 when there is a reasonable assurance that the Group will comply with the conditions attached to the grant, and that the grant will be received.
Government grants related to costs are deferred and recognised in profit or loss over the period in which the Group incurs the costs for which the grant is intended to compensate.
Government grants relating to the purchase of property, plant and equipment are included in non current liabilities as revenue in advance and they are credited to profit or loss on a straight line basis over the expected lives of the related assets.
A government grant that becomes receivable as compensation for expenses or losses already incurred, or for the purpose of giving immediate financial support to the Group with no future related costs, is recognised in profit or loss in the period in which the grant becomes receivable.
Strategic funding
NIWA and the Crown are parties to a Strategic Science Investment Fund –Programmes Investment Contract (SSIF Contract) under which the Crown contracts NIWA to perform research activities that support NIWA’s Statement of Core Purpose (SCP). Specific SCP outcomes, and their associated delivery programmes, are agreed annually with Shareholding Ministers and documented in NIWA’s Statement of Corporate Intent.
For financial reporting purposes this Strategic Funding is treated as a Government Grant in terms of NZ IAS 20. Strategic Funding received and recognised during the year was $50.552 million exclusive of GST (2021: $50.552 million). All Strategic Funded projects were completed during the year.
COVID 19 response and recovery fund
NIWA received $8.27 million from the Crown’s COVID 19 Response and Recovery Fund in 2021. No further funding was received in 2022. This funding was intended to partially offset the revenue impact of COVID 19. For financial reporting purposes in 2021, this contribution was treated as a Government Grant under NZ IAS 20 and recognised as revenue during the year.
Financing components
The Group does not expect to have any significant contracts where the period between the transfer of the promised goods or services to the customer and payment by the customer exceeds one year. As a consequence, the Group does not adjust any of the transaction prices for the time value of money as this is considered to not have a material impact.
Contract balances
Contract assets
A contract asset is the right to consideration in exchange for goods or services transferred to the customer, conditional on something other than the passage of time. If the Group performs under a contract by transferring goods or services to a customer before the customer pays consideration or before payment is due, a contract asset is recognised for the earned consideration that is conditional.
Contract assets are classified as ‘Uninvoiced receivables’ in the Statement of Financial Position.
Contract liabilities
A contract liability is the obligation to transfer goods or services to a customer for which the Group has received consideration (or an amount of consideration is due) from the customer. If a customer pays consideration before the Group transfers goods or services, a contract liability is recognised. Contract liabilities are recognised as revenue when the Group performs under the contract.
Contract liabilities are classified as ‘Revenue in advance’ in the Statement of Financial Position.
Revenue and other gains
in thousands of New Zealand dollars 2022 2021 Research
Strategic Funding 50,552 50,552
Rendering of services 45,062 50,289
COVID 19 Response and Recovery Funding 8,270 Commercial Science
Rendering of services 69,189 61,862 Sale of goods 5,429 5,913
Dividends 1 1
Total revenue and other gains 170,233 176,887
Revenue recognised in relation to contract liabilities (revenue in advance)
in thousands of New Zealand dollars 2022 2021 Revenue recognised that was included in the contract liability balance at the beginning of the year
Rendering of services 20,464 13,653
NIWA Annual Report 2021/22 22
2. Operating expenses
Employee benefits
in thousands of New Zealand dollars 2022 2021
Defined contribution plans 3,024 2,846
Defined contribution benefits 356 400
Termination benefits 191 124
Other employee benefits 78,607 74,757
Employee benefits expense 82,178 78,127
Termination benefits were paid out in respect of five employees.
Other expenses
in thousands of New Zealand dollars 2022 2021
Materials and supplies 8,914 10,067
Research collaboration 22,244 17,236
Property occupancy costs 4,283 4,383
Information technology 11,066 9,389
Remuneration of directors 234 261
Foreign currency (gain)/loss (833) (2)
Movement within loss allowance provision (457)
Change in the fair value of derivatives (562) (16)
Other expenses 14,804 14,742
Total other expenses 60,150 55,603
Auditor’s remuneration
in thousands of New Zealand dollars 2022 2021
Auditor’s remuneration comprises: Audit of the financial statements (Group) 168 146 Audit of the financial statements (Subsidiary) 29 26
Total auditor’s remuneration 197 172
3. Employee entitlements
Liabilities for wages and salaries, including non monetary benefits and annual leave, long service leave, retirement leave, and training leave are recognised when it is probable that settlement will be required, and they are capable of being measured reliably. Provisions, in respect of employee benefits, are measured using the remuneration rate expected to apply at settlement. Employee benefits are separated into current and non current liabilities. Current liabilities are those benefits that are expected to be settled within 12 months from balance date.
Provisions made in respect of employee benefits which are not expected to be settled within 12 months are measured at the present value of the estimated future cash outflows to be made by the Group in respect of services provided by employees up to the reporting date.
in thousands of New Zealand dollars 2022 2021
Remuneration
Salary accrual 2,845 2,414
Annual leave 7,545 6,696
Training leave 200 385
Long service leave 940 867
Retirement leave 478 451
Total employee entitlements 12,008 10,813
Comprising:
current
The provisions for long service leave, retirement leave, and training leave are dependent upon several factors that are determined by the expected employment period of employees, current remuneration, and the timing of employees’ use of the benefits. Any changes in these assumptions will impact on the carrying amount of the liability. The employment period used to determine the appropriate long service leave liability is based upon historical average length of service. The training leave liability is based upon typical historical usage of the benefit.
4. Property, plant and equipment
Property, plant and equipment is stated at cost less accumulated depreciation to date, less any impairment losses.
Expenditure incurred on property, plant and equipment is capitalised where such expenditure will increase or enhance the future economic benefits provided by an asset’s existing service potential. Expenditure incurred to maintain future economic benefits is classified as repairs and maintenance.
The gain or loss arising on the disposal or retirement of an item of property, plant and equipment is determined as the difference between the sale proceeds and the carrying amount of the asset and is recognised in the Statement of Comprehensive Income.
Property, plant and equipment items, except for freehold land and work in progress, are depreciated on a straight line basis at rates estimated to write off their cost over their estimated useful lives, which are as follows:
Category Useful life
Buildings and leasehold improvements 5 40 years
Vessels 20 31 years
Plant and equipment 8 10 years
IT equipment 3 8 years
Office equipment 5 years
Furniture and fittings 10 years
Motor vehicles 6 years
Small boats 10 years
Assumptions underlying the estimated useful life of assets include timing of technological obsolescence and future utilisation plans.
Major source of uncertainty
The useful lives of items of property, plant and equipment are key assumptions concerning the future that have a significant risk of resulting in a material adjustment to the carrying amounts of assets and liabilities within the next financial year.
The Group reviews the estimated useful lives of property, plant and equipment items during each annual reporting period.
NIWA Annual Report 2021/22 23
Current 11,042 9,934 Non
966 879
in thousands of New Zealand dollars Land
Buildings & leasehold improvements Vessels Plant & equipment IT equipment Office equipment
Furniture & fittings Motor vehicles Small boats Work in progress Total Cost
Balance at
1 July 2021 15,768 63,818 41,813 111,803 36,628 7,840 2,193 4,557 3,635 20,601 308,656
Additions (134) (641) 3,568 1,657 263 80 119 5 35,165 40,082
Transfers 2,344 800 3,101 1,021 5 59 (7,330) Disposals (615) (247) (1) (342) (134) (218) (1,557)
Foreign currency adjustment 11 3 1 15
Balance at
30 June 2022 15,153 65,781 41,972 118,482 38,967 7,969 2,279 4,517 3,640 48,436 347,196
Accumulated depreciation and impairment losses
Balance at
1 July 2021 44,932 27,297 85,820 22,979 6,926 1,347 3,914 2,369 195,584
Depreciation 2,839 1,466 6,567 4,382 372 119 295 184 16,224 Disposals (146) (1) (338) (133) (211) (829)
Foreign currency adjustment 4 8 1 13
Balance as at
30 June 2022 47,625 28,763 92,390 27,031 7,165 1,467 3,998 2,553 210,992 Net book value at 30 June 2022 15,153 18,156 13,209 26,092 11,936 804 812 519 1,087 48,436 136,204
in thousands of New Zealand dollars Land
Buildings & leasehold improvements Vessels Plant & equipment IT equipment Office equipment Furniture & fittings Motor vehicles Small boats Work in progress Total Cost
Balance at 1 July 2020 15,768 54,832 40,718 106,112 34,694 7,477 1,970 4,491 3,637 19,106 288,805
Additions 14 2,329 3,158 1,641 459 264 133 14,139 22,137
Transfers 8,972 2,912 745 6 11 (2) (12,644)
Disposals (1,234) (379) (453) (96) (47) (78) (2,287)
Foreign currency adjustment 1 1 Balance at
30 June 2021 15,768 63,818 41,813 111,803 36,628 7,840 2,193 4,557 3,635 20,601 308,656
Accumulated depreciation and impairment losses
Balance at 1 July 2020 40,520 26,435 79,560 19,166 6,575 1,291 3,670 2,183 179,400 Depreciation 4,412 1,994 6,601 4,263 444 103 316 186 18,319 Disposals (1,132) (342) (450) (93) (47) (72) (2,136)
Foreign currency adjustment 1 1
Balance as at
30 June 2021 44,932 27,297 85,820 22,979 6,926 1,347 3,914 2,369 195,584
Net book value at 30 June 2021 15,768 18,886 14,516 25,983 13,649 914 846 643 1,266 20,601 113,072
NIWA Annual Report 2021/22 24
5. Right of use asset and lease liability
Reconciliation of right of use asset balance
in thousands of New Zealand dollars 2022 2021
Right of use asset net book value opening balance
8,819 8,861
Lease modifications and additions 5,465 1,451
Disposals
Depreciation (1,754) (1,494)
Foreign currency adjustment 7 1
Right of use asset net book value closing balance 12,537 8,819
Represented by:
Cost 16,985 11,513
Accumulated depreciation (4,448) (2,694)
Right of use asset net book value closing balance 12,537 8,819
The Group’s leases relate to buildings and land. These leases are recognised as a right of use asset and a corresponding liability. Each lease payment is allocated between the lease liability and the finance cost. The finance cost is charged to profit or loss over the lease period so as to produce a constant periodic rate of interest on the remaining balance of the liability for each period. The right of use asset is depreciated over the shorter of the asset’s useful life and the lease term on a straight line basis.
Assets and liabilities arising from a lease are initially measured on a present value basis. Lease liabilities include the net present value of fixed payments.
The lease payments are discounted using the interest rate implicit in the lease. If that rate cannot be determined, the Group’s incremental borrowing rate is used, being the rate that the Group would have to pay to borrow the funds necessary to obtain an asset of similar value in a similar economic environment, with similar terms and conditions.
Right of use assets are measured at cost, comprising the amount of the initial measurement of lease liability. These assets are subsequently depreciated using the straight line method from the commencement date to the end of the lease term.
Payments associated with short term leases and leases of low value assets are recognised on a straight line basis as an expense in profit or loss. Short term leases are leases with a lease term of 12 months or less. Low value assets comprise small storage spaces.
Reconciliation of lease liabilities
in thousands of New Zealand dollars 2022 2021
Net present value of future lease liability opening balance 11,022 11,339
Additions and modifications 5,465 1,450
Interest for the year* 502 392
Lease payments made (2,584) (2,161)
FX impact 7 2
Net present value of future lease liability closing balance 14,412 11,022
Current lease liability 2,162 1,996
Non current lease liability 12,250 9,026
Total lease liabilities closing balance 14,412 11,022
* The total finance expense of $497k shown in the statement of comprehensive income for 2022 comprises the lease interest of $502k shown in the table above, together with other minor interest payments of $(5)k.
Lease liabilities maturity analysis
in thousands of New Zealand dollars
Minimum lease payments Interest Present value
Within one year 2,621 (459) 2,162
One to five years 8,189 (1,066) 7,123
Beyond five years 16,118 (10,991) 5,127
Lease liabilities at 30 June 2022 26,928 (12,516) 14,412
in thousands of New Zealand dollars
Minimum lease payments Interest Present value
Within one year 2,338 (342) 1,996
One to five years 8,278 (817) 7,461
Beyond five years 1,734 (169) 1,565
Lease liabilities at 30 June 2021 12,350 (1,328) 11,022
Lease related expenses included in the statement of comprehensive income
in thousands of New Zealand dollars 2022 2021
Depreciation 1,754 1,494
Short term and low value leases 298 507
Interest on leases 502 392
Total 2,554 2,393
6. Heritage assets
NIWA has one collection and three databases that have been defined as heritage assets. Heritage collection assets are those assets held for the duration of their physical lives because of their unique scientific importance, and heritage databases are maintained as an incidental part of existing business operations.
NIWA has the following heritage assets:
Type Description
Marine Benthic Biology Collection A national reference collection of marine invertebrates.
National Climate Database A national electronic database of high quality climate information, including temperatures, rainfall, wind and other climate elements.
Water Resources Archive Database A national electronic database of river and lake locations throughout New Zealand, including levels, quality and flows.
New Zealand Freshwater Fish Database
A national electronic database of the occurrence of fish in the fresh waters of New Zealand, including major offshore islands.
The nature of these heritage assets, and their significance to the science NIWA undertakes, makes it necessary to disclose them. In the directors’ view, the cost of these heritage assets cannot be assessed with any reliability, and accordingly these assets have not been recognised for financial reporting purposes.
7. Identifiable intangibles
Purchased identifiable intangible assets, comprising copyrights and software, are recorded at cost less amortisation and impairment. Amortisation is charged on a straight-line basis over the assets’ estimated useful lives. The estimated useful life and amortisation method are reviewed each balance date.
Category Useful life
Copyrights 5 years
Development costs 5 years Software 3 years
NIWA Annual Report 2021/22 25
Intangible assets which arise from development costs that meet the recognition criteria are recognised as an asset in the statement of financial position.
Capitalisation is limited to the amount which, taken together with any further related costs, is likely to be recovered from future economic benefits. Any excess is recognised as an expense.
All other development and research costs are expensed as incurred.
Subsequent to initial recognition, internally generated intangible assets are reported at cost, less accumulated amortisation and accumulated impairment losses, on the same basis as purchased identifiable intangible assets.
in thousands of New Zealand dollars Software Copyrights Development costs Work in progress Total Cost
Balance as at
1 July 2021 11,302 215 374 114 12,005
Additions 593 8 134 735 Disposals
Transfers 183 (183)
Foreign Currency
Adjustment (5) (5)
Balance as at
30 June 2022 12,078 215 377 65 12,735
Accumulated amortisation and impairment losses
Balance as at
1 July 2021 9,813 215 140 10,168
Amortisation 785 43 828 Disposals
Foreign Currency Adjustment (5) (5)
Balance as at
30 June 2022 10,598 215 178 10,991 Net book value at 30 June 2022 1,480 199 65 1,744
in thousands of New Zealand dollars Software Copyrights Development costs Work in progress Total Cost
Balance as at 1
July 2020 10,135 215 352 363 11,065
Additions 736 22 185 943
Disposals (3) (3)
Transfers 434 (434)
Balance as at
30 June 2021 11,302 215 374 114 12,005
Accumulated amortisation and impairment losses
Balance as at 1
July 2020 9,172 215 102 9,489
Amortisation 644 38 682 Disposals (3) (3)
Foreign Currency Adjustment
Balance as at
30 June 2021 9,813 215 140 10,168
Net book value at 30 June 2021 1,489 234 114 1,837
8. Assets held for sale
Assets held for sale are stated at the lower of their carrying amount and fair value less costs to sell.
No new assets were reclassified as held for sale in 2022 (2021: nil). The site at Mahanga Bay is in the process of being sold. This is expected to be finalised within the next 12 months, following delays in the past three years.
in thousands of New Zealand dollars 2022 2021
Land 245 245
Total 245 245
9. Receivables
Receivables are stated at amortised cost using the effective interest rate, less an allowance for expected losses.
A loss allowance provision is established when the assessment under NZ IFRS 9 deems a provision is required. Changes in the carrying amount of the provision are recognised in the Statement of Comprehensive Income. Debts which are known to be uncollectable are written off against the provision, once approved by the Board of Directors.
in thousands of New Zealand dollars 2022 2021 Trade receivables 17,048 18,952
Sundry receivables 59 108
Loss allowance provision
Total 17,107 19,060
Classified as: Non current Current 17,107 19,060
Total 17,107 19,060
Included in the Group’s trade receivables balance at the end of the year is one Crown debtor’s balance which equates to 32% of the Group’s total receivables balance (2021: 37%). 94% of that debtor’s balance is less than 60 days overdue and is deemed to be low credit risk (2021: 100%).
The Group considers that a large proportion of its customers have a low credit risk associated with them. Before providing any service or goods to a new customer on credit terms, a check is undertaken when deemed appropriate to verify the creditworthiness of the customer.
The Group reserves the right to charge interest at a rate of 2% per month, calculated daily, on all invoices remaining unpaid at the due date.
Included in the Group’s trade receivable balance are debtors with a carrying amount of $935k (2021: $211k) which are more than 60 days past due at the reporting date. The Group has not created a provision for this balance because the amounts are still considered recoverable. The Group does not hold any collateral over past due or impaired balances.
The Group has applied the simplified approach to providing for expected credit losses, which requires the recognition of a lifetime expected loss provision for trade receivables. To measure the expected credit losses, trade receivables have been grouped based on days past due. The expected loss rates are based on the payment profiles of customers on a lifetime basis and the corresponding historical credit losses over a period of five years, adjusted for any significant known amounts that are not receivable. In addition, an expected credit loss allowance provision has been separately calculated in respect of the second debtor identified above as management assessed the risk of not collecting the debt as high. The total expected credit loss allowance provision has been determined as nil (2021: nil) for the Group.
NIWA Annual Report 2021/22 26
in thousands of New Zealand dollars
As at 30 June 2022 Expected Loss Rate
Gross Carrying Amount
Current 0.0% 14,242
Loss Allowance Provision
Past due 1 – 30 days 0.0% 1,540 –
Past due 31 60 days 0.0% 331
Past due 61 90 days 0.0% 444
Past due > 90 days 0.0% 491
Total 17,048
10. Inventory
Inventory is stated at the lower of cost and net realisable value. The basis on which cost is calculated is first in first out (FIFO) for consumables, finished goods and work in progress; and weighted average for raw materials.
in thousands of New Zealand dollars 2022 2021
Consumables 1,138 461
Raw materials 145 273
Finished goods 2,960 1,758
Total 4,243 2,492
11. Income tax
The income tax expense for the year is the tax payable on the current year’s taxable income, based on the income tax rate for each jurisdiction. This is then adjusted by changes in deferred tax assets and liabilities attributable to temporary differences between the tax bases of assets and liabilities and their carrying amounts in the financial statements, and changes in unused tax losses.
The income tax expense is determined as follows:
in thousands of New Zealand dollars 2022 2021 Income tax expense
Current tax 3,791 6,774
Deferred tax relating to temporary differences (1,303) (443) Income tax expense 2,488 6,331
Reconciliation of income tax expense in thousands of New Zealand dollars 2022 2021 Profit before income tax 8,958 22,594
Tax at current rate of 28% 2,508 6,326
Adjustments to taxation: Other non deductible expenses 23 30 Australian based subsidiary subject to foreign tax 5 6 (Over)/under provision in previous year (48) (31) Income tax expense 2,488 6,331
12. Deferred tax liability and assets
Deferred tax is accounted for using the balance sheet liability method in respect of temporary differences arising from the carrying amount of assets and liabilities in the financial statements and the corresponding tax base of those items. Deferred tax liabilities are generally recognised for all taxable temporary differences. Deferred tax assets are generally recognised for all deductible temporary differences to the extent that it is probable that sufficient taxable amount will be available against which those deductible temporary differences can be utilised.
Deferred tax assets and liabilities are measured at the tax rates that are expected to apply to the period when the asset and liability giving rise to them are realised or settled, based on the tax laws that have been enacted or substantively enacted at balance date.
Current and deferred tax is recognised in profit or loss, except when it relates to items recognised in other comprehensive income or directly in equity, in which case the deferred or current tax is also recognised in other comprehensive income or directly in equity, or where it arises from the initial accounting for a business combination.
in thousands of New Zealand dollars
As at 30 June 2022 Opening balance
Temporarydifferences
Credited/ (charged) to profit or loss Closing balance
Property, plant and equipment (3,135) 1,121 (2,014)
Library books 1 (1) –
Uninvoiced receivables (1,852) 259 (1,593)
Employee benefits 2,166 175 2,341
Unrealised forex gains/losses on creditors/debtors (27) (158) (185)
Doubtful debts
Leases 609 (93) 516
R&D Tax credit (Australian based subsidiary)
Total (2,238) 1,303 (935)
in thousands of New Zealand dollars
As at 30 June 2021 Opening balance
Temporarydifferences
Credited/ (charged) to profit or loss Closing balance
Property, plant and equipment (4,263) 1,128 (3,135)
Library books 3 (2) 1
Uninvoiced receivables (1,913) 61 (1,852)
Employee benefits 2,308 (142) 2,166
Unrealised forex gains/losses on creditors/debtors (5) (22) (27)
Doubtful debts 459 (459)
Leases 687 (78) 609
R&D Tax credit (Australian based subsidiary) 43 (43)
Total (2,681) 443 (2,238)
In accordance with the Income Tax Act 2007 the Group is not required to establish or maintain an imputation credit account by virtue of its classification as a Crown Research Institute.
13. Cash and cash flows
13a Cash and cash equivalents and other short term investments Cash and cash equivalents includes cash on hand, deposits held at call with financial institutions, and other short term, highly liquid investments with original maturities of three months or less that are readily convertible to known amounts of cash and which are subject to an insignificant risk of changes in value.
Other short term investments consists of deposits with financial institutions with maturities over three months which are presented as a separate line item in the statement of financial position.
NIWA Annual Report 2021/22 27
13b Reconciliation of the profit for the year to net cash from operating activities
in thousands of New Zealand dollars 2022 2021
Profit for the year 6,470 16,263
Add/(less) non cash items
Net (gain)/loss on disposal of property, plant and equipment (966) 126
Depreciation and impairment 17,978 19,813 Amortisation of identifiable intangibles 828 682
Net foreign currency (gain) (12) (6) Increase/(decrease) in deferred tax (1,303) (443) 16,525 20,172
Add/(less) movements in working capital
Increase/(decrease) in payables and accruals and revenue in advance 9,764 7,950 Increase/(decrease) in employee entitlements 1,195 388
Decrease/(increase) in receivables and prepayments 842 (6,794) Decrease/(increase) in inventory and uninvoiced receivables (827) 303 Increase/(decrease) in taxation payable and receivable (3,239) 713 Increase/(decrease) in forward exchange derivatives (563) (16) 7,172 2,544
Net cash flows from operating activities 30,167 38,979
14. Subsidiaries
The Group financial statements incorporate the financial statements of the Company and entities (including special purpose entities) controlled by the Company. Control is achieved where the Company has the power (including the ability to use the power) to govern the financial and operating policies of an entity so as to obtain benefits from its activities.
All intra group transactions, balances, income, and expenses are eliminated in full on consolidation.
The subsidiaries of the Group and their activities are listed below:
Name Country Principal activities Ownership
NIWA Vessel Management Ltd New Zealand Vessel charters for scientific research 100%
Unidata Pty Ltd Australia Supplier of environmental technology products
80%
EcoConnect Ltd New Zealand Non trading company 100%
NIWA Australia Pty Ltd Australia Non trading company 100%
NIWA Environmental Research Institute
USA Non trading company 100%
NIWA Natural Solutions Ltd New Zealand Non trading company 100%
All subsidiaries have a balance date of 30 June. No stake in any subsidiary was acquired or disposed of during the year.
15. Related party transactions
The Government of New Zealand (the Crown) is the ultimate shareholder of the NIWA Group. No transactions with other New
Zealand Government owned entities are considered related party transactions in terms of NZ IAS 24. No related party debts have been written off or forgiven during the year. Any business the NIWA Group has transacted in which a director or an employee has an interest has been carried out on a commercial basis. Any potential conflict is recorded in the minutes of Board meetings for directors and a separate interest register for employees. The interests register containing all relevant interests is updated on a regular and timely basis.
Key management personnel compensation
in thousands of New Zealand dollars 2022 2021 Short term benefits 3,484 3,655
The table above includes the remuneration of the Chief Executive, Executive Team and the Board of Directors.
16. Financial Instruments and Risk Management
The classification of financial assets and liabilities depends on the purpose for which the financial assets and liabilities were incurred. Management determines the classification of the Group’s financial assets and liabilities at initial recognition.
Financial assets
Classification
The Group classifies its financial assets in the following measurement categories: those to be measured at amortised costs, and those to be measured subsequently at fair value (either through other comprehensive income, or through profit or loss). The classification depends on the Group’s business model for managing the financial assets and the contractual terms of the cash flow.
For assets measured at fair value, gains and losses will be recorded in either profit or loss, or other comprehensive income. For investments in debt instruments, this will depend on the business model in which the investment is held. For investments in equity instruments, this will depend on whether the Group has made an irrevocable election at the time of initial recognition to account for the equity investment at fair value through other comprehensive income.
The Group reclassifies debt investments when, and only when, its business model for managing those assets changes.
Measurement
At initial recognition, the Group measures a financial asset at its fair value plus, in the case of a financial asset not at fair value through profit or loss (FVPL), transaction costs that are directly attributable to the acquisition of the financial asset. Transaction costs of financial assets carried at FVPL are expensed in profit or loss.
Financial assets and liabilities at fair value through profit or loss –
Derivative financial instruments
This category has two sub categories: financial assets held for trading, and those designated at fair value through profit or loss at inception. A financial asset is classified in this category if acquired principally for the purpose of selling in the short term, or if so designated by management.
Derivatives are also categorised as held for trading, unless they are designated as hedges. Assets in this category are classified as current assets if they are either held for trading or are expected to be realised within 12 months of the balance sheet date. After initial recognition, they are measured at their fair values. Gains or losses on re measurement are recognised in the Statement of Comprehensive Income.
Financial Assets at Amortised Cost
The Group classifies its financial assets at amortised cost only if both of the following criteria are met:
• The asset is held to collect the contractual cash flows, and
• The contractual terms give rise to cash flows that are solely payments of principal and interest.
NIWA Annual Report 2021/22 28
Impairment of financial assets
The Group assesses, on a forward looking basis, the expected credit losses associated with its assets carried at amortised cost and fair value through other comprehensive income. The impairment methodology applied depends on whether there has been a significant increase in credit risk. Note 9 details how the Group determines whether there has been a significant increase in credit risk.
For trade receivables only, the Group applies the simplified approach permitted by NZ IFRS 9, which requires expected lifetime losses to be recognised from initial recognition of the receivables.
Capital management
The Group has the following requirements imposed upon it under the Crown Research Institutes Act 1992:
• to operate in a financially responsible manner so that sufficient operating funds are generated to maintain financial viability;
• to provide an adequate rate of return on shareholders’ funds; and
• to operate as a going concern.
The Group’s policy is to maintain a strong capital base to maintain shareholder and creditor confidence and to sustain future development of the business.
The Group’s policies in respect of capital management and allocation are reviewed regularly by the Board of Directors.
The advance facility available from ANZ Bank (refer note 16 subsection financing facilities) is subject to two covenants:
1. That the value of the Group’s net tangible assets is greater than $50 million; and
2. That ANZ reserves the right to review the facility in the event of a change in the shareholding structure.
The Group was compliant with these covenants throughout the year. Capital refers to the equity and borrowings of the Group.
There have been no material changes in the Group’s management of capital during the year.
Fair value of financial instruments
The carrying value of all financial instruments is considered to approximate fair value.
All the Group’s financial instruments are classified as being within level 2 of the fair value hierarchy as defined by NZ IFRS 13 Fair Value Measurement (2021: the same). Their fair value is determined with reference to quoted rates for identical instruments on active markets.
Credit risk
Credit risk is the risk that a third party will default on its obligations to NIWA and the Group, causing a loss.
In the normal course of business, the Group incurs credit risk from trade receivables, uninvoiced receivables, and transactions with financial institutions (cash and short term deposits and derivatives).
The Group has a credit policy that is used to manage this risk. As part of this policy, limits are placed on the amounts of credit extended to third parties, and care is taken to ensure the creditworthiness of third parties dealt with. All credit risk exposures are monitored regularly.
The Group does not require any collateral or security to support financial instruments, because of the quality of financial institutions and counterparties it deals with. There are no significant concentrations of credit risk, other than with the New Zealand Government, which the Group does not consider represents a material credit risk.
The exposure of the Group to credit risk as at 30 June 2022 was $74,816k (total exposure to credit risk, comprising cash and cash equivalents $32,019k, other short term investments $20,000k, uninvoiced receivables $5,690k, and receivables net of provisions $17,107k) (2021: $88,686k).
Further analysis on the receivables balance can be found in note 9.
The Group has not renegotiated the terms of any financial assets which would result in the carrying amount no longer being past due or avoid a possible past due status.
The Group’s maximum exposure to credit risk by geographic region is as follows:
in thousands of New Zealand dollars 2022 2021
New Zealand 72,198 86,294
Australia 1,536 1,424
USA 370 506
Other Asia Pacific countries 452 317
Other regions 260 145
Provision for doubtful debts
Total credit risk 74,816 88,686
Interest rate risk
Interest rate risk is the risk that cashflows will fluctuate because of changes in market interest rates. This could particularly affect the return on investments.
The interest rates on the Group investments as at 30 June:
2022 2021
Cash (on call) 0.10% 2.00% 0.15% 0.25%
Other short term investments 0.05% 3.70% 0.63% 2.40%
The directors do not consider there is any significant exposure to interest rate risk.
Currency risk
The Group undertakes transactions in foreign currencies from time to time, and, resulting from these activities, exposures in foreign currency arise. It is the Group’s policy to hedge foreign currency trading transaction risks economically as they arise. To manage these exposures, the Group may use financial instruments such as forward foreign exchange contracts. At balance date, the Group had forward foreign exchange arrangements in place with a New Zealand dollar (NZD) fair value of $570k (2021: $8k).
The Group’s exposure to foreign currency denominated non derivative financial instruments was as follows, based on notional amounts:
in thousands of New Zealand dollars
30 June 2022 AUD EUR USD FJD GBP CAD SGD
Cash balances 1,138 75 174 4 29 2 2
Trade receivables 390 155 117 36
Trade payables (229) (33) (38) (4)
Statement of financial position exposure 1,299 42 291 4 142 2 38
in thousands of New Zealand dollars
30 June 2021 AUD EUR USD FJD GBP CAD SGD
Cash balances 1,170 11 15 4 10 2 13
Trade receivables 453 6 33 Trade payables (92) (27) (41) (7) (5)
Statement of financial position exposure 1,531 (16) (20) 4 3 2 41
NIWA has a regularly reviewed treasury management policy in place which ensures the appropriate management of currency risk.
NIWA Annual Report 2021/22 29
Liquidity risks
Liquidity risk represents the Group’s ability to meet its contractual obligations. The Group evaluates its liquidity requirements on an ongoing basis. In general, the Group generates sufficient cash flows from its operating activities to meet its obligations arising from its financial liabilities and has credit lines in place to cover potential shortfalls.
Payables and accruals of $13.083 million (2021: $9.040 million) have a contractual maturity of less than one year. This is based upon the earliest date on which the Group can be required to pay.
Financing facilities
The Group has access to financing facilities made available by ANZ Bank with a total value of $10.5 million (2021: $10.5 million). This was undrawn at 30 June 2022 (2021: also undrawn). The total facility of $10.5 million relates to an overdraft facility of $0.5 million (on call) and an overnight placement and short term advance facility of $10 million.
17. Capital commitments
in thousands of New Zealand dollars 2022 2021 Commitments for future capital expenditure
Contracted, but not provided for 46,759 34,357
The majority of the 2022 balance relates to contracts that have been awarded for the construction of the NIWA Hamilton office and the replacement of the RV Kaharoa. It also relates to ongoing work on the construction of the Recirculating Aquaculture System (RAS) at the Northland Aquaculture Centre in partnership with Northland Regional Council.
18. Subsequent events
There are no material events occurring subsequent to 30 June 2022 which require adjustment or disclosure in the financial statements.
NIWA Annual Report 2021/22 30
DISCLOSURES
Reporting entity
National Institute of Water and Atmospheric Research Limited (‘NIWA’ or ‘the Company’) and its subsidiaries form the consolidated Group (‘the NIWA Group’ or ‘the Group’). NIWA is a profit oriented company registered in New Zealand under the Companies Act 1993.
The financial statements for the NIWA Group are presented in accordance with the requirements of the Crown Research Institutes Act 1992, the Crown Entities Act 2004, the Public Finance Act 1989, the Companies Act 1993, and the Financial Reporting Act 2013.
Nature of activities
The NIWA Group conducts research and commercial science in water and atmospheric sciences in New Zealand and internationally.
Basis of preparation
The measurement basis adopted in the preparation of these financial statements is historical cost, except for financial instruments as identified in specific accounting policies above.
The presentation currency of the Group and functional currency used in the preparation of these financial statements is New Zealand dollars.
All amounts disclosed in the financial statements and notes have been rounded to the nearest thousand New Zealand dollars unless otherwise stated.
Accounting policies are selected and applied in a manner that ensures that the resulting financial information meets the concepts of relevance and reliability, ensuring that the substance of the underlying transaction or event is reported.
The accounting policies have been applied in preparing the financial statements for the year ended 30 June 2022 and the comparative information for the year ended 30 June 2021.
The 2022 Statement of Corporate Intent (SCI) Budget that is used for comparative information is not audited.
Statement of compliance
The financial statements have been prepared in accordance with New Zealand generally accepted accounting practice (NZ GAAP). They comply with New Zealand Equivalents to International Financial Reporting Standards (NZ IFRS) and other applicable financial reporting standards appropriate for profit oriented entities.
The financial statements comply with International Financial Reporting Standards (IFRS).
Goods and services tax (GST)
The financial statements are prepared on a GST exclusive basis, except for receivables and payables, which are stated GST inclusive.
Foreign currencies
Transactions
Transactions in foreign currencies are converted to the functional currency of the Group, being New Zealand dollars, by applying the spot exchange rate between the functional currency and the foreign currency at the date of the transaction. At the end of each year, monetary assets and liabilities are translated to New Zealand dollars using the closing rate of exchange at balance date, and any exchange gains or losses are recognised in the statement of comprehensive income.
Translation of foreign operations
On consolidation, revenues and expenses of foreign operations are translated to New Zealand dollars at the average exchange rates for the year. Assets and liabilities are converted to New Zealand dollars at the rates of exchange ruling at balance date. Exchange rate differences arising from the translation of the foreign operations are recognised in other comprehensive income and accumulated as a separate component of equity in the Group’s foreign currency translation reserve. Such exchange differences are reclassified from equity to profit or loss (as a reclassification adjustment) when the foreign operation is disposed of.
Adoption of new and revised standards
There are no standards that are not yet effective and that would be expected to have a material impact on the Group
NIWA Annual Report 2021/22 31 PREPARATION
AUDITOR’S REPORT
Independent auditor’s report
To the readers of National Institute of Water and Atmospheric Research Limited’s financial statements for the year ended 30 June 2022
The Auditor General is the auditor of National Institute of Water and Atmospheric Research Limited (the Group). The Auditor General has appointed me, Troy Florence, using the staff and resources of PricewaterhouseCoopers, to carry out the audit of the financial statements of the Group on his behalf.
Opinion
We have audited the financial statements of the Group on pages 18 to 30, that comprise the statement of financial position as at 30 June 2022, the statement of comprehensive income, statement of changes in equity and cash flow statement for the year ended on that date and the notes to the financial statements that include accounting policies and other explanatory information
In our opinion, the financial statements of the Group: • present fairly, in all material respects: its financial position as at 30 June 2022; and its financial performance and cash flows for the year then ended; and • comply with generally accepted accounting practice in New Zealand in accordance with New Zealand Equivalents to International Financial Reporting Standards (NZ IFRS) and International Financial Reporting Standards (IFRS).
Our audit was completed on 30 August 2022. This is the date at which our opinion is expressed.
The basis for our opinion is explained below. In addition, we outline the responsibilities of the Board of Directors and our responsibilities relating to the financial statements, we comment on other information, and we explain our independence.
Basis for our opinion
We carried out our audit in accordance with the Auditor General’s Auditing Standards, which incorporate the Professional and Ethical Standards and the International Standards on Auditing (New Zealand) issued by the New Zealand Auditing and Assurance Standards Board. Our responsibilities under those standards are further described in the Responsibilities of the auditor section of our report.
We have fulfilled our responsibilities in accordance with the Auditor General’s Auditing Standards.
We believe that the audit evidence we have obtained is sufficient and appropriate to provide a basis for our audit opinion.
Responsibilities of the Board of Directors for the financial statements
The Board of Directors is responsible on behalf of the Group for preparing financial statements that are fairly presented and that comply with generally accepted accounting practice in New Zealand.
The Board of Directors is responsible for such internal control as it determines is necessary to enable it to prepare financial statements that are free from material misstatement, whether due to fraud or error.
In preparing the financial statements, the Board of Directors is responsible on behalf of the Group for assessing the Group’s ability to continue as a going concern. The Board of Directors is also responsible for disclosing, as applicable, matters related to going concern and using the going concern basis of accounting, unless the Board of Directors has to cease operations, or has no realistic alternative but to do so.
The Board of Directors’ responsibilities arise from the Crown Research Institutes Act 1992.
Responsibilities of the auditor for the audit of the financial statements
Our objectives are to obtain reasonable assurance about whether the financial statements, as a whole, are free from material misstatement, whether due to fraud or error, and to issue an auditor’s report that includes our opinion.
Reasonable assurance is a high level of assurance, but it is not a guarantee that an audit carried out in accordance with the Auditor General’s Auditing Standards will always detect a material misstatement when it exists. Misstatements are differences or omissions of amounts or disclosures and can arise from fraud or error. Misstatements are considered material if, individually or in the aggregate, they could reasonably be expected to influence the decisions of readers taken on the basis of these financial statements.
For the budget information reported in the financial statements, our procedures were limited to checking that the information agreed to the Group’s statement of corporate intent
We did not evaluate the security and controls over the electronic publication of the financial statements.
As part of an audit in accordance with the Auditor General’s Auditing Standards, we exercise professional judgement and maintain professional scepticism throughout the audit. Also:
• We identify and assess the risks of material misstatement of the financial statements, whether due to fraud or error, design and perform audit procedures responsive to those risks, and obtain audit evidence that is sufficient and appropriate to provide a basis for our opinion. The risk of not detecting a material misstatement resulting from fraud is higher than for one resulting from error, as fraud may involve collusion, forgery, intentional omissions, misrepresentations, or the override of internal control.
• We obtain an understanding of internal control relevant to the audit in order to design audit procedures that are appropriate in the circumstances but not for the purpose of expressing an opinion on the effectiveness of the Group’s internal control.
• We evaluate the appropriateness of accounting policies used and the reasonableness of accounting estimates and related disclosures made by the Board of Directors.
• We conclude on the appropriateness of the use of the going concern basis of accounting by the Board of Directors and, based on the audit evidence obtained, whether a material uncertainty exists related to events or conditions that may cast significant doubt on the Group’s ability to continue as a going concern. If we conclude that a material uncertainty exists, we are required to draw attention in our auditor’s report to the related disclosures in the financial statements or, if such disclosures are inadequate, to modify our opinion. Our conclusions are based on the audit evidence obtained up to the date of our auditor’s report. However, future events or conditions may cause the Group to cease to continue as a going concern.

• We evaluate the overall presentation, structure and content of the financial statements, including the disclosures and whether the financial statements represent the underlying transactions and events in a manner that achieves fair presentation.
• We obtain sufficient appropriate audit evidence regarding the financial statements of the entities or business activities within the Group to express an opinion on the consolidated financial statements. We are responsible for the direction, supervision and performance of the Group audit. We remain solely responsible for our audit opinion.
We communicate with the Board of Directors regarding, among other matters, the planned scope and timing of the audit and significant audit findings, including any significant deficiencies in internal control that we identify during our audit.
Our responsibilities arise from the Public Audit Act 2001.
Other Information
The Board of Directors is responsible for the other information. The other information obtained at the date of our report is the Financial Summary and Group actual performance versus Statement of Corporate Intent on pages 13 to 16, and the Corporate governance and disclosures, Statement of responsibility and Directory on pages 33 to 36, but does not include the financial statements, and our auditor’s report thereon.
Our opinion on the financial statements does not cover the other information and we do not express any form of audit opinion or assurance conclusion thereon.
In connection with our audit of the financial statements, our responsibility is to read the other information. In doing so, we consider whether the other information is materially inconsistent with the financial statements or our knowledge obtained in the audit, or otherwise appears to be materially misstated. If, based on our work, we conclude that there is a material misstatement of this other information, we are required to report that fact. We have nothing to report in this regard.
Independence
We are independent of the Group in accordance with the independence requirements of the Auditor General’s Auditing Standards, which incorporate the independence requirements of Professional and Ethical Standard 1: International Code of Ethics for Assurance Practitioners issued by the New Zealand Auditing and Assurance Standards Board.
In addition to the audit, and subsequent to 30 June 2022, we will carry out an engagement in the area of agreed upon procedures regarding payment received in accordance with a research agreement, which are compatible with those independence requirements. Other than the audit and this engagement, we have no relationship with or interests in the Group.
Troy Florence PricewaterhouseCoopers

On behalf of the Auditor General
Auckland, New Zealand 30 August 2022
NIWA Annual Report 2021/22 32
GOVERNANCE AND DISCLOSURES
Board and committee meeting attendance
The table below shows director attendance at these Board meetings and committee member attendance at committee meetings. In addition, any director may attend any committee meeting.
Director Board meetings ALCR Committee*
Barry Harris (Chairman)
Nicholas Main (Deputy Chairman)
2**
People & Culture Committee*
Subsidiary company directors
The following people held office as directors of NIWA’s subsidiary companies at 30 June 2022:
Subsidiary Company Directors
Future Property Programme Governance Committee*
NIWA Vessel Management Ltd B Harris, N Main, T Batten, J Fredric, M Hyland, M A Macleod, D Moana
Unidata Pty Ltd W Johnston1, C Pearson1, D Saunders2
EcoConnect Ltd J Morgan1, P Baker1
NIWA Australia Pty Ltd B Harris, N Main, T Batten, J Fredric, M Hyland, M A Macleod, D Moana
NIWA Environmental Research Institute B Harris, N Main, T Batten, J Fredric, M Hyland, M A Macleod, D Moana
4 2 Dr Tracey Batten
1***
Janice Fredric (from 1 February 2022)
Prof Margaret Hyland (from 1 February 2022)
NIWA Natural Solutions Ltd J Morgan1, P Baker1
1. Employee of the Group’s parent company
2. Appointed by the minority ownership interest in Unidata Pty Ltd
No fees were paid in respect of membership of subsidiary boards.
Insurance for directors and employees
2***
2*** Mary Anne MacLeod
Dean Moana (from 1 February 2022)
Total meetings held 10 4 1 2
Only attendances by Committee members and Chairman are recorded.
**Barry Harris attends Committee meetings in an ex officio capacity. *** Committee memberships changed during the year following the appointment of the three new directors in February 2022. Only meeting attendances while a member of the Committee are recorded.
Directors’ remuneration
The total remuneration received or receivable by directors of NIWA during the year was:
in thousands of New Zealand dollars 2022 2021
Barry Harris (Chairman)
Nicholas Main (Deputy Chairman)
Dr Helen Anderson (until 30 June 2021)
Dr Tracey Batten
Janice Fredric (from 1 February 2022)
Prof. Margaret Hyland (from 1 February 2022)
Prof. Gillian Lewis (until 30 June 2021)
Mary Anne Macleod
Dean Moana (from 1 February 2022)
The NIWA Group has arranged insurance policies for directors and employees which, with a deed of indemnity, ensure that they will generally incur no monetary loss as a result of lawful actions undertaken by them as directors or employees. These include, among others, directors and officers and professional indemnity policies. Certain risks are specifically excluded from the cover provided, including the imposition of penalties and fines in respect of breaches of the law.
Auditors
In accordance with Section 21(1) of the Crown Research Institutes Act 1992, the Group’s auditor is the Auditor General. The Auditor General has appointed Troy Florence of PricewaterhouseCoopers to conduct the audit on his behalf. The audit remuneration and fees paid for other services are detailed in note 2.
Interests register
The following are transaction types recorded in the interests register for the year.
Interested transactions
Any business the NIWA Group has transacted in which a director has an interest has been carried out on a commercial basis. Any potential conflict is recorded in the minutes of Board meetings. A register containing all relevant interests is updated on a monthly basis.
Directors’ remuneration
Details of the directors’ remuneration are provided in the ‘Directors’ remuneration’ section above.
Use of company information by directors
Pursuant to section 145 of the Companies Act 1993 there were no recorded notices from directors requesting to use company information received in their capacity as directors that would not otherwise have been available to them.
Share dealings
During the year no director purchased, disposed of, or had recorded dealings of any equity securities of the NIWA Group.
Directors’ loans
No loans by the NIWA Group to any director were made or were outstanding during the year.
NIWA Annual Report 2021/22 33 CORPORATE
10
1**
10
9
1*** 2
4 2***
4
10
1 2
4
*
72 72
45 45
36
36 36
15 –
15
– 36
36 36
15 –
Disclosure of directors’ interests
Directors disclosed, under section 140(2) of the New Zealand Companies Act 1993, the following interests as at 30 June 2022:
Director and company Position
Barry Harris
McFall Fuel Ltd Chair
Rural Fuels Ltd Chair
OSPRI New Zealand Limited Chair
TB Free Ltd Chair
National Animal Identification and Tracing (NAIT) Ltd
Chair
New Zealand Food Innovation (Waikato) Ltd Chair
Waikato Regional Airport Ltd Chair
WEL Networks Ltd Director
Nicholas Main
Middlemore Foundation Director
Padstow Properties Ltd Director and shareholder Main Investment Trust Trustee
Sadhna Valabh Trust Trustee Manjula and Adhurji
Valabh Trust Trustee
Sir Peter Blake Trust Trustee
Deloitte New Zealand Ltd Consultant
Tracey Batten
EBOS Group Ltd Director Medibank Private Limited (Australia) Director
Accident Compensation Corporation Director
Janice Fredric Mainpower Ltd Director Green Power New Zealand Ltd Director
Mt Cass Wind Farm Ltd Director
Lincoln University Council Member Unity Credit Union Director Civil Aviation Authority Chair Aviation Security Service Chair NZ Shipwreck Welfare Trust Trustee
Tregynon Charitable Trust Trustee
Timaru District Council Audit & Risk Committee
Independent Member
Prof. Margaret Hyland Cirrus Materials Science Director
Te Herenga Waka University of Wellington Vice Provost (Research) Research Trust of Victoria University of Wellington Chair Wellington UniVentures Deputy Chair
Karori Sanctuary Trust (trading as Zealandia Te Māra a Tāne)
Mary Anne Macleod
Trustee
MacMacleod Limited Director and shareholder
DairyNZ Limited Director
University of Waikato University Council (from April 2022)
Environmental Protection Authority Director AgResearch Director (from February 2022)
Ministry for the Environment Strategic Advice
Various Regional Councils Occasional consultancy Araneacattus Family Trust Trustee
Fire and Emergency New Zealand Director (from August 2021)
Dean Moana
Whangaokena ki
Onepoto Takutai Trust Trustee
NZ Food & Beverage Group Ltd Director & Shareholder
Te Runanganui o Ngati Porou Director & Shareholder
The NZ Institute for Plant & Food Research Ltd Director
Climate Change Commission Nominating Member (until March 2022) Ngati Porou Holding Company Director
Tohetaka Ltd Director/Chair Ngati Porou Manuka Ltd Director
Ngati Porou Seafoods Ltd, NP Fisheries Ltd, Real Fresh Ltd
Director
ICP General Partner Ltd Director
Port Nicholson GP Ltd, Director
Koura Inc GP Ltd Director
Ahi Mokopuna GP Ltd Director
Akaroa Salmon NZ Ltd Director
AsureQuality Ltd Director
BV AQ (Singapore) Holdings Pte Ltd Director
Employees’ remuneration
The number of employees (not including directors) whose remuneration exceeded $100,000 during the year, stated in brackets of $10,000, was: 2022
100,000 109,999 73 110,000 119,999 83 120,000 129,999 40 130,000 139,999 27 140,000 149,999 22 150,000 159,999 12 160,000 169,999 7 170,000 179,999 7 180,000 189,999 14 190,000 199,999 6 200,000 209,999 7 210,000 219,999 3 230,000 239,999 1 250,000 259,999 2 290,000 299,999 2 320,000 329,999 1 340,000 349,999 1 360,000 369,999 1 370,000 379,999 1 650,000 659,999 1
The remuneration reflected in the above table comprises base salary only. This excludes payments in respect of superannuation or in respect of the cessation of employment of employees. In 2022, the Group made payments of $191k for compensation or other benefits in respect of the cessation of employment of employees (2021: $124k).
Executive Remuneration
Remuneration Components
The Group’s Executive Team (ET), including the Chief Executive, receive fixed remuneration only. This consists of base salary and benefits, including KiwiSaver and insurance.
NIWA Annual Report 2021/22 34
Chief Executive’s remuneration
The Chief Executive’s remuneration package that applied for 2022, together with the comparative information for the prior year, is as follows:
in New Zealand dollars 2022 2021
Base salary1 658,714 659,064
Benefits2 56,692 59,606
Total Remuneration 715,406 718,670
1: Actual salary paid includes holiday pay paid consistent with New Zealand legislation. The base salary for 2022 was $658,711 (2021: $658,711).
2: Benefits include KiwiSaver, insurance and vehicle fuel expenses.
The Chief Executive is a member of KiwiSaver. As a member of this scheme, all Group staff, including the Chief Executive, are eligible to contribute and receive a matching company contribution up to a maximum of 5% of gross taxable earnings. In 2022, the Group’s contribution was $32,936 (2021: $32,953).
A summary of the Chief Executive’s total remuneration during the past five years is as follows:
Total remuneration
2022 715,406 2021 718,670 2020 714,996
2019 706,512 2018 687,978
Executive Team remuneration
In addition to the Chief Executive, NIWA’s Executive Team consists of eight members. The remuneration package for all Executive Team members combined (excluding the Chief Executive) that applied for 2022, together with the comparative information for the prior year, is as follows:
in New Zealand dollars 2022 2021
Base salary1 2,347,497 2,478,652 Benefits2 186,475 197,114
Total Remuneration 2,533,972 2,675,766
1: Actual salary paid includes holiday pay paid consistent with New Zealand legislation. The base salaries for 2022 totalled $2,348,790 (2021: $2,414,970).
2: Benefits include employer contributions to superannuation schemes (KiwiSaver or legacy government superannuation schemes, as applicable), insurance and wellness allowances.
Donations
Donations of $1,000 were made during the year (2021: $1,000).
STATEMENT OF RESPONSIBILITY
The following statement is made in accordance with section 155 of the Crown Entities Act 2004.
1. The Board of the Company is responsible for the preparation of these financial statements and the judgements used therein.
2. The Board of the Company is responsible for establishing and maintaining a system of internal controls designed to provide reasonable assurance as to the integrity and reliability of financial reporting.
3. In the opinion of the Board, these financial statements reflect a true and fair view of the financial position and operations of the Group for the year ended 30 June 2022.
Barry Harris Nicholas Main Chairman DeputyChairman
30 August 2022
NIWA Annual Report 2021/22 35
DIRECTORY
DIRECTORS
Barry Harris, Chairman
Nicholas Main, Deputy Chairman
Dr Tracey Batten
Janice Fredric (from 1 February 2022)
Prof Margaret Hyland (from 1 February 2022)
Mary Anne Macleod
Dean Moana (from 1 February 2022)
EXECUTIVE TEAM
John Morgan, Chief Executive
Dr Rob Murdoch, Deputy Chief Executive and General Manager, Science
Geoff Baird, General Manager, Communications & Marketing
Patrick Baker, Chief Financial Officer
Dr Mary Anne Dehar, General Manager, People & Capability
Warrick Johnston, General Manager, Technology & Innovation
Dr Helen Neil, General Manager, Operations
Marino Tahi, General Manager, Māori & Pacific Partnerships
Dr Alex Thompson, General Manager, Research Strategy
REGISTERED OFFICE AND ADDRESS FOR SERVICE
41 Market Place
Auckland Central 1010 New Zealand
AUDITOR
Troy Florence with the assistance of PricewaterhouseCoopers on behalf of the Auditor General
BANKERS
ANZ Bank New Zealand Ltd
ASB Bank Ltd
Westpac New Zealand Ltd
SOLICITORS
Meredith Connell
Atkins Holm Majurey
INSURANCE BROKER Marsh Ltd
HEAD OFFICE
41 Market Place
Auckland Central 1010
Private Bag 99 940
Newmarket 1149, Auckland New Zealand
Tel +64 9 375 2050
Fax +64 9 375 2051
WEBSITE AND SOCIAL MEDIA
www.niwa.co.nz weather.niwa.co.nz facebook.com/nzniwa twitter.com/niwa_nz twitter.com/niwaweather instagram.com/niwa_science linkedin.com/company/niwa youtube.com/NZNIWA
NIWA Annual Report 2021/22 36

