SALESFORCE EINSTEIN
With
great
we
are
welcoming the Winter ‘20 release for Einstein Analytics because besides supporting
the
analytics
process
further, it also shows a more strategic direction to grow more towards Industry Standards in the Data & Analytics,
Our 3 favorite Einstein Analytics trends in Winter ‘20!
enthusiasm
Data
Engineering
and
Business Intelligence space. And all that while staying close to the unique Salesforce proposition of Embedded & Applied Intelligence.
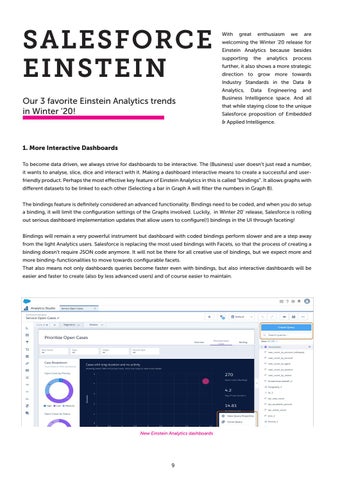
1. More Interactive Dashboards To become data driven, we always strive for dashboards to be interactive. The (Business) user doesn’t just read a number, it wants to analyse, slice, dice and interact with it. Making a dashboard interactive means to create a successful and userfriendly product. Perhaps the most effective key feature of Einstein Analytics in this is called “bindings”. It allows graphs with different datasets to be linked to each other (Selecting a bar in Graph A will filter the numbers in Graph B). The bindings feature is definitely considered an advanced functionality. Bindings need to be coded, and when you do setup a binding, it will limit the configuration settings of the Graphs involved. Luckily, in Winter 20’ release, Salesforce is rolling out serious dashboard implementation updates that allow users to configure(!) bindings in the UI through faceting! Bindings will remain a very powerful instrument but dashboard with coded bindings perform slower and are a step away from the light Analytics users. Salesforce is replacing the most used bindings with Facets, so that the process of creating a binding doesn’t require JSON code anymore. It will not be there for all creative use of bindings, but we expect more and more binding-functionalities to move towards configurable facets. That also means not only dashboards queries become faster even with bindings, but also interactive dashboards will be easier and faster to create (also by less advanced users) and of course easier to maintain.
New Einstein Analytics dashboards
9