5 minute read
Salesforce Einstein
Our 3 favorite Einstein Analytics trends in Winter ‘20!
With great enthusiasm we are welcoming the Winter ‘20 release for Einstein Analytics because besides supporting the analytics process further, it also shows a more strategic direction to grow more towards Industry Standards in the Data & Analytics, Data Engineering and Business Intelligence space. And all that while staying close to the unique Salesforce proposition of Embedded & Applied Intelligence.
Advertisement
1. More Interactive Dashboards
To become data driven, we always strive for dashboards to be interactive. The (Business) user doesn’t just read a number, it wants to analyse, slice, dice and interact with it. Making a dashboard interactive means to create a successful and userfriendly product. Perhaps the most effective key feature of Einstein Analytics in this is called “bindings”. It allows graphs with different datasets to be linked to each other (Selecting a bar in Graph A will filter the numbers in Graph B).
The bindings feature is definitely considered an advanced functionality. Bindings need to be coded, and when you do setup a binding, it will limit the configuration settings of the Graphs involved. Luckily, in Winter 20’ release, Salesforce is rolling out serious dashboard implementation updates that allow users to configure(!) bindings in the UI through faceting!
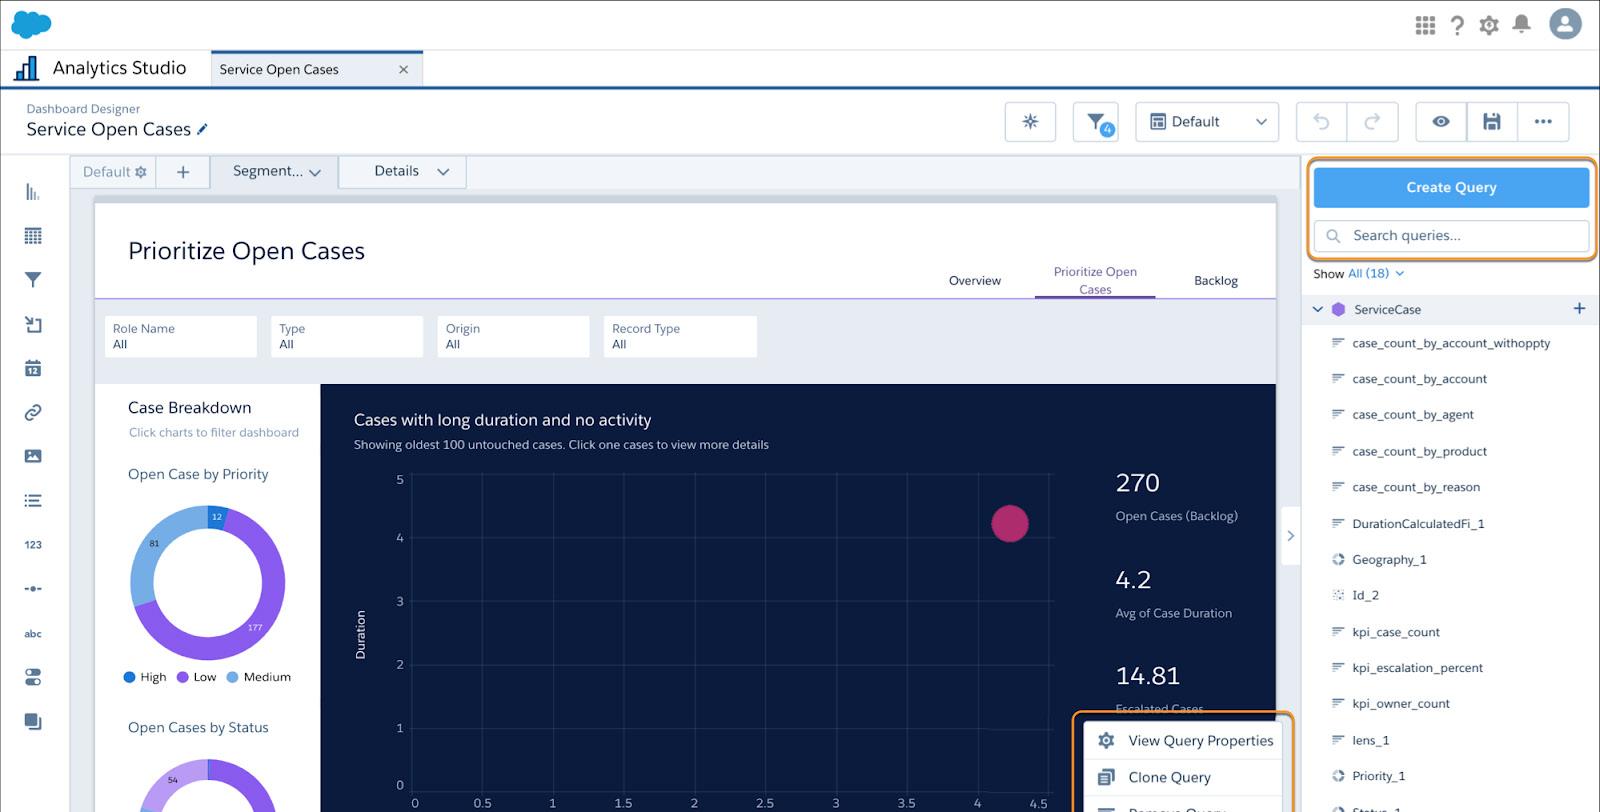
Bindings will remain a very powerful instrument but dashboard with coded bindings perform slower and are a step away from the light Analytics users. Salesforce is replacing the most used bindings with Facets, so that the process of creating a binding doesn’t require JSON code anymore. It will not be there for all creative use of bindings, but we expect more and more binding-functionalities to move towards configurable facets. That also means not only dashboards queries become faster even with bindings, but also interactive dashboards will be easier and faster to create (also by less advanced users) and of course easier to maintain.
New Einstein Analytics dashboards
”With this new Einstein Analytics feature, dashboard implementation becomes more accessible for everyone: the design process is not only about functionality and design itself but also about time-consuming and processes speed”
Tatiana Mashliak, Analytics Consultant
2. Industry focus
Worldwide, Salesforce is rolling out to so many different businesses, and everywhere Salesforce and their Platinum Partners like us are getting questions to finetune the Standard setup to better fit their way of working. Part of that is business specific, but mostly this is due to Industry Processes and Best Practices. Salesforce is letting you profit from all these requirements and is offering more specialised Industry Clouds and in Einstein Analytics this translates to new Analytical Dashboard App Templates!
With these (wizard driven) out of the box Dashboard sets, you could already quickly deliver a first version of a Dashboard set for specific areas like Sales and Service, but now also Manufacturing, Finance and soon CPG will have their Dashboard Templates.
We use these quick templates in our implementations to have a quick basis from which you can build further. This way you have the opportunity not to spend days (or even weeks) creating datasets and dashboard-elements that everyone in the Industry wants, but focus on the things that really are specific to your business. The Analytics Industry Templates for different industries in the upcoming Release:
Manufacturing
Analytics for Manufacturing helps visualize all sales and orders. You can find out which products perform better or worse and calculate sales impact on the revenue.
Financial Services
The Wealth Management App allows users to add fees, commissions and quotas to the dashboards, add trends to define account characteristics and even set up security settings. The Insurance App allows agents to segment their customer-base and identify up/cross-sell opportunities. Managers will be able to track the team performance and get insight in what the top/bottom performers are doing differently to coach and share best practices. The Retail Banking App allows users to calculate balance amounts for different types of accounts and include external charges and fees data. You can also spot trends by snapshotting datasets and see how accounts are changing.
Healthcare:
The Healthcare app allows users to quickly monitor patients/clients progress in care plans and identify those who are falling behind. Furthermore it contains dashboards for the Care Request process, Payment behavior and Referral sources.
”With the evolving of Wave, and more recently the acquisition of Tableau, Salesforce is more strongly securing their place in the top right Gartner Quadrant, It is great to see how Salesforce is delivering product value in line with their vision every single release..”
A frequently heard Data Quality quote: “Garbage in, Garbage out!” Your Dashboards can be pretty, but if the data under it is incorrect or of bad quality, your Dashboards are not as effective as they should be. Data preparation/engineering is one of the most important processes for a successful implementation of an Analytics App or Discovery Story. Salesforce has a lot of great data management layer updates that will certainly help to get closer to the right and clean data.
To list a few of our favorite highlights:
Recipe is now called Data Prep and Steps are now called Queries, coming closer to the standard data terminology Dashboards can be refreshed multiple times per hour, every 15 minutes, keeping your Dashboards and Data even more up-to-date. Data Sync is enabled by default for all new orgs In Data Prep, Einstein can help you predict your missing values Support for Date format standardization
By improved connections and automated cleaning, we can rely and scale these created datasets, avoiding data drift and use the data that we/viewers/customers trust. All of this is connected to getting trusted insights as quick as possible to the Business and that is what really matters.
Predict missing values within Data Prep

Dashboard refresh settings


The Insurance Cloud Dashboard


