DAIRY MARKET REPORT
7/24/2025
OVERVIEW
Overall domestic use of dairy has shown good growth in recent months, while dairy exports continue to face headwinds, with bright spots for butter and cheese.
Domestic commercial use of total milk solids grew by 2.2% from a year ago during March-May. U.S. exports of cheddar cheese and total American-types grew by 19% during the period. Butter exports were up by 127%. U.S. milk production is fully in an expansion phase this year, following an unusual four-year period of stable production. Milk solids composition of raw milk continues to grow, together providing adequate supplies for the rapidly expanding cheddar cheese production, which increased by almost 10% from a year earlier in May.
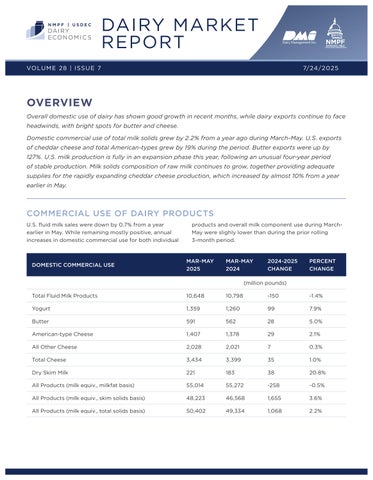
COMMERCIAL USE OF DAIRY PRODUCTS
U.S. fluid milk sales were down by 0.7% from a year earlier in May. While remaining mostly positive, annual increases in domestic commercial use for both individual
products and overall milk component use during MarchMay were slighly lower than during the prior rolling 3-month period.
U.S. DAIRY TRADE
U.S. dairy exports have encountered stiffening headwinds in recent years, as total volumes have eased down to 15.7% of domestic solids production during the first five months of 2025, from a high of 17.9% during 2022. Challenges include moves by major dairy importing countries, including China and some Middle Eastern and North African counties, to expand their domestic milk production to become less dependent on imports. Future growth may well hinge more on the industry gaining market share from other exporting countries rather than on continued rapid import demand growth. Expanding exports of other than
dry skim ingredient products, which have represented roughly 80% of U.S. milk solids exports during much of this period, will also be important. So far in 2025, this percentage has dropped to 75%, as cheese and butter exports have grown.
U.S. dairy imports equaled 3.7% of U.S. milk solids production during first five months of 2025. Almost half of this volume consisted of cheese and concentrated milk proteins (milk protein concentrate and isolate, and caseins), with butter contributing another 7%.
MILK PRODUCTION
USDA’s milk production report for May included an upward revision to the preliminary dairy cow and milk production estimates for April, as previously happened for March, a sure sign that both cows and production are growing somewhat faster than the department’s estimating procedures can keep up with. U.S. milk production was
1.6% higher than the year before during both April and May. May preliminary U.S. cow numbers are reported as 114,000 more than a year ago. March-May total milk solids production gained 2.4% over a year ago, and milkfat production during the period was up 3.3% year-over-year.
DAIRY PRODUCTS
Cheddar cheese production in the Uniteld States rose by 9.6% from a year earlier in May, and by 8.1% during the March-May period, as new cheese processing capacity in the country comes increasingly on line. Production of dry skim milk and, interestingly, whey products all dropped during the period.
PRODUCTS PRODUCTION
DAIRY PRODUCTS PRODUCTION
DAIRY PRODUCT INVENTORIES
While U.S. butter and cheese production is increasing annually, stocks of those products remain lower than a year ago, a sure sign that total commercial use, both domestic and exports, is growing. Dry skim milk stocks have also
declined over the year, likely reflecting increased domestic use of condensed skim milk in the current rapid increase in American-type cheese production.
DAIRY PRODUCT AND FEDERAL ORDER CLASS PRICES
The USDA’s announcements of federal order prices now fully reflect the new Federal Milk Marketing Order pricing formulas specified in the final rule published last January. The most immediately visible of those changes in the Class and Component Prices announcement is the absence of an NDPSR-reported price for barrel cheese, which is now dropped from the protein component formula and makes the NDPSR cheddar cheese price equal to the NDPSR block cheese price. Less visible is the fact that the NDPSR can no longer even report a barrel cheese price. The federal statute on Mandatory Reporting for Dairy Products specifies that “The Secretary shall … require each manufacturer to report to the Secretary information concerning the price, quantity, and moisture content of dairy products sold by the manufacturer … only to the extent that the information is actually used to establish minimum prices for Class III or Class IV milk under a Federal milk marketing order.”
The effective Base Class I Price for ESL milk can be calculated using the standard method for calculating
federal order prices for milk at 3.5% fat test, with the skim price equal to the Base Skim Milk Price for Class I plus the Class I ESL Adjustment. This calculation simplifies further to the Base Class I Price plus .965 times the Class I ESL Adjustment.
Retail price inflation has been generally declining since the second half of 2022, using the widely-reported measure of year-over-year change in the Consumer Price Index (CPI) for all items. An increase of 2.7% in June, up from 2.3% in April, has given rise to widespread speculation that inflation might be heating up again. The more specific CPIs for all food and beverages, and even more so the CPI for all dairy products, have both followed the same general pattern, with the food and beverage CPI bottoming out at 2% yearover-year last August and subsequently ticking up to 2.9% in June. The all dairy CPI, driven more strongly by the price of raw milk, bottomed out at -1.9% YOY in March 2024, then rose gradually to 2.2% this past March, following which it has declined again, to 0.9% in June.
DAIRY
Dairy Product Prices (per
Federal Order Class Prices for Milk (per hundredweight)
MILK AND FEED PRICES
The May DMC margin lost $0.02/cwt from a month earlier to $10.40/cwt, according to the DMC Decision Tool on the USDA Farm Service Agency website. The tool had previously predicted the April margin to be the year’s lowest, but an increase in the price of premium alfalfa hay equivalent
to $0.34/cwt of milk in the DMC feed cost formula more than offset a $0.30/cwt increase in the May all-milk price, to $21.30/cwt. Much smaller, offsetting prices of corn and soybean meal could only bring the feed cost down by another $0.02/cwt.
*DMC calculations are not revised
LOOKING AHEAD
USDA’s monthly World Agricultural Supply and Demand Estimates (WASDE) milk production forecasts and its monthly NASS-reported milk production numbers have been feeding on each other in recent months as they reflect the current expansion of U.S. milk production. The July WASDE report again raised its production forecasts for both this year and next as the latest NASS report showed greater cow inventories and faster growth in milk per cow.
Despite this, July’s WASDE again raised most of its product, Class and all-milk price estimates for both years. The one exception is cheese, for which the 2025 estimate, as well as that for the Class III price, was lowered, and the
2026 cheese price forecast was unchanged from June. This doubtless reflects the strong growth in cheddar and American-type cheese production that NASS has been reporting in recent months.
WASDE currently expects milk production to grow this year by 1.1% from 2024 and by another 0.4% next year. Its current all-milk price estimates are $22/cwt for 2025 and $21.65/cwt for 2026. NASS reports the 2024 all-milk price at $22.55/cwt. The Decision Tool on the USDA Farm Service Agency website currently shows the DMC margin increasing steadily from May, topping out at $13.63/cwt in November and averaging $12.31/cwt for the year.
Peter Vitaliano, National Milk Producers Federation pvitaliano@nmpf.org www.nmpf.org
Dairy Management Inc.™ and state, regional, and international organizations work together to drive demand for dairy products on behalf of America’s dairy farmers, through the programs of the American Dairy Association®, the National Dairy Council ® , and the U.S. Dairy Export Council ®
The National Milk Producers Federation (NMPF) develops and carries out policies that advance dairy producers and the cooperatives they own. NMPF’s member cooperatives produce more than two-thirds of U.S. milk, making NMPF dairy’s voice on Capitol Hill and with government agencies.