known as
Annual report 2022 Formerly
What’s Cooking? Annual report 2022 1
2 What’s Cooking? Annual report 2022
Contents Introduction 1 Contents 3 Ter Beke - What’s Cooking? - in brief 4 - 5 Our core values 6 - 7 Headlines and key figures in 2022 - Prospects for 2023 8 - 10 Strategic objectives 10 1. Business overview ..................................................................... 13 Message from the Chairman 14 - 15 Piet Sanders, Chief Executive Officer 16 - 19 Yves Regniers, Chief Financial Officer 20 - 23 Eric Kamp, Chief Operations Officer 24 - 25 Christophe Bolsius, SBU Director Ready Meals 26 - 29 Else Verstraete, Chief People Officer 30 - 31 Peter Bal, Chief Information Officer 32 - 33 Brecht Vanlerberghe, Chief Research & Development Officer 34 - 35 Ann De Jaeger, General Counsel & Corporate Affairs 36 - 39 Safety above all in Poland and abroad 40 - 41 Health and safety also in France 42 - 43 Engagement is the ultimate ingredient for a top organization 44 - 45 Customer trust is our greatest source of energy 46 - 47 A year of steady recovery for our UK branch 48 - 49 Italian ready meals: new seeds 50 - 51 NPD joins the table faster 52 - 53 Innovating every day for consumers and our customers 54 - 55 2. Non-financial information 56 3. Corporate governance............................................................... 74 4. Stock and shareholder information ........................................... 94 5. Consolidated financial statements 97 Contact information 146 What’s Cooking? Annual report 2022 3
Sales offices
Ready meals sites
10.
Savoury Sites
Centre for slicing and packaging
Centre for slicing and packaging
11.
12.
Centre for slicing and packaging
What’s Cooking? Annual report
1. Deeside, GB Production site
2. Opole, PL Production site
3. Mézidon-Vallée d’Auge, FR Production site
4. Wanze, BE Production site
5. Marche-en-Famenne, BE Production site
6. Veurne, BE Centre for slicing and packaging
7. Lievegem, BE Head office Head office Production site Centre for slicing and packaging
8. Wommelgem, BE Production site Centre for slicing and packaging
9. Ridderkerk, NL
Aalsmeer, NL
Borculo, NL Production site
Wijchen, NL
7 9 12 8 10 6 5
11 1 4 3 2 Sites 4
2022
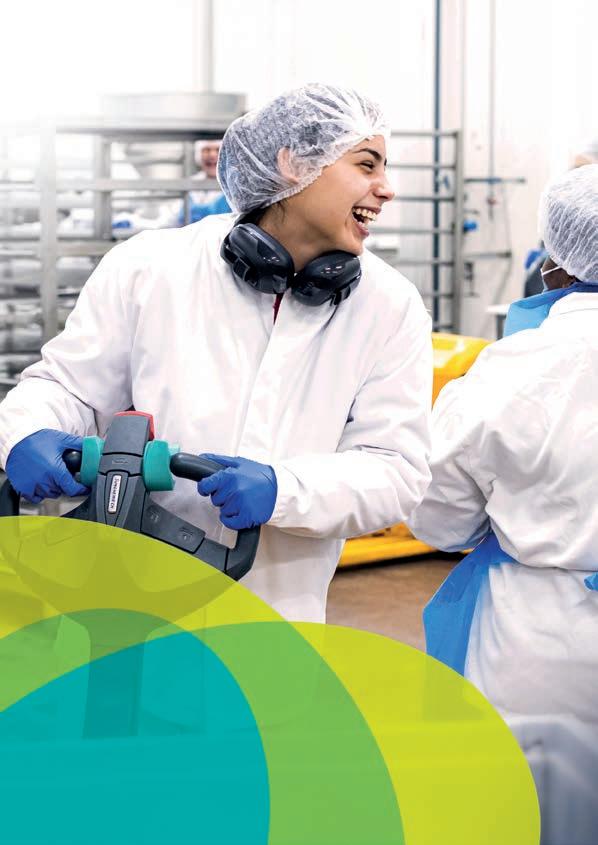
With savoury cold cuts and ready meals as our two focal points, What’s Cooking? has twelve production sites in Belgium, the Netherlands, France, Poland and the United Kingdom, seven commercial offices in Europe and a head office in Belgium. We employ about 3,000 people, around fifty of whom work at our headquarters. In 2022, our group achieved a turnover of 781 million euros.
*As of March 2023, Ter Beke Group is called What’s Cooking Group. Our companies will be renamed later in 2023, but will retain their legal entities, VAT and registration numbers. Following approval by the extraordinary general meeting on 21 April 2023, Ter Beke NV will become What’s Cooking Group NV. Our other subsidiaries will have their names changed around the same date.
Savoury strategic business unit
• is a producer and packer of savoury snacks, slices & spreads for the Benelux, the United Kingdom, Germany and for export
• has production sites in Belgium (Wommelgem and Lievegem) and the Netherlands (Borculo)
• has six centres for cutting and packaging meat products, three of which are in Belgium (Wommelgem, Lievegem and Veurne) and three in the Netherlands (Wijchen, Ridderkerk and Aalsmeer)
• is an innovator in the pre-packaged savoury products segment
• Sells products under distribution brands and own brand names such as Pluma®, Daniël Coopman® and Limco®
• employs about 1,475 people
Ready meals strategic business unit
• makes freshly prepared meals for the European market
• is the European market leader in fresh lasagne
• has specialised production sites in Belgium (Wanze and Marche-en-Famenne), France (Mézidon-Vallée d’Auge), Poland (Opole) and the United Kingdom (Deeside)
• sold under the Come a casa®, Vamos® and Stefano Toselli® brand names, and numerous distribution brands
• employs about 1,475 people
What’s
Annual report 2022 5 What’s Cooking Group in het kort
Cooking?
What’s Cooking?* is an innovative European group in fresh and savoury food that is tasty, nutritious and convenient, with happy customers in no less than 37 countries.
What’s Cooking? Annual report 2022 6
Stronger together thanks to our core values
1.
Crafting with care, care by crafting
The care we put into our products is our contribution to the world. Quality is always on our hungry minds, as is the well-being and safety of our colleagues and consumers. We set new standards for taste and convenience, and we are mindful about sustainability.
2. Confident & courageous
We know we are pretty good at what we do, because we believe in our people and the skills they bring to the table. We encourage them to be just as ambitious as we are, never minding the honest mistakes they may make on the way.
3. Day by day, side by side
Big changes don’t happen overnight. That’s why we work towards our goals one day at a time, rolling up our sleeves together, as the team we are. We treat everyone equally while respecting their individuality, whether they’re our colleagues, customers, suppliers, or consumers.
What’s Cooking? Annual report 2022 7 Our core values
781
million euros in turnover
38.1
Highlights and key figures in 2022 looking ahead to 2023
Consolidated results in 2022
12% sales growth
The UEBITDA is under pressure due to high infl ation and the delayed charging of costs
Investment in start-up Davai (plant-based dumplings)
Solid net cash flow per share
Focus on long-term sustainable and profitable growth
What’s Cooking? Annual report 2022 8 Highlights and key figures in 2022 - looking ahead to 2023
* Ratio based on the average weighted number of shares in the financial year. The net cash flow per share consists of the result of the financial year excluding the contribution in the changes in equity plus (minus) non-cash expenses (revenues).
Gross
euros
million
About Net cash generation of
dividend of people million euros in investments (cash flow 2022)
per share* euros per share (optional dividend) 3,000 25.6
euros UEBITDA
18.16 4.0
Highlights and key figures
Our strengths and key events
2022 was a challenging year. Raw materials were less readily available and high infl ation put pressure on the purchasing power. Despite these difficult market conditions, the group succeeded in increasing its consolidated turnover by 12 percent (from 697 million to 781 million euros) following our responsible charging of price increases in the second half of last year.
The EBITDA shows a gradual recovery of the results for ready meals in the second half of 2022, thanks to our responsible charging of price increases and improved operating results.
Results for savoury slices & spreads fell slightly in the second half of 2022, mainly due to high infl ation and a decrease in demand. The non-underlying costs (2.3 million euros in 2022) in the current financial year consist entirely of costs related to the intention of acquiring Imperial-Stegeman. We are still awaiting approval from the Belgian and Dutch competition authorities for this merger. Should there be any further updates in respect of this transaction, the Group will communicate on this via a separate press release.
In the previous financial year, the non-underlying costs at the end of the fiscal year amounted to 6.9 million euros, which is significantly higher. The sum consists of costs related to, among other things, the sale of the reinsurance company in Luxembourg and the change of CEO as well as the Imperial-Stegeman transaction related expenses.
The war in Ukraine, rising energy prices and extreme weather conditions in much of Europe made some of our main ingredients less available: tomatoes, among other things, became scarce and durum wheat (for our pasta) became much more expensive. What’s Cooking? believes it is important to sustainably incorporate those cost increases within the chain, and to limit price changes for consumers as much as possible.
To incorporate infl ation and defl ation in a timely and correct manner, we entered into limited-term contracts with new clients or used automatic indexation mechanisms for the main commodities, where possible.
The war in Ukraine had little direct impact on What’s Cooking? because we barely buy and sell directly from and to Ukraine or Russia. When the conflict started, we immediately put our expansion plans to Russia on hold though.
Evidently, we have felt an indirect impact of the war in the form of rising energy costs and infl ation, which made the prices of our ingredients and packaging more expensive.
Savoury strategic business unit
Our new strategy focuses on a broader range of products. In this context, we renamed our former meat division “savoury”. The new name better reflects the extensive range in which the group wants to invest further. Hybrid (meat and vegetables), vegetarian and plant-based products will gradually become more important.
The turnover of the business unit rose by five percent (from 422.9 million to 442.5 million euros), mainly due to the delayed charging of cost increases. Sales within this business unit declined, mostly because of the drop in consumption and a number of expiring contracts. As already mentioned, complete charging happened with some delay following the first half of the year.
These situations combined caused the EBITDA of this segment to decrease by 27 percent (from 28.9 million euros in 2021 to 21.0 million euros in 2022).
Net financial debts further decreased by 6 million (from 73.8 million to 67.8 million euros).
Impact of inflation – war in Ukraine – energy
As expected, infl ation had a major impact on our results in both the first and second half of 2022. The cost price of animal products rose as a result of high feed and energy prices, bird flu, and outbreaks of African swine flu. Beef, pork and poultry, as well as derivative products such as milk and cheese, became more expensive. In addition, we saw strong price increases for some main ingredients of our ready meals. Finally, energy costs had an effect on the prices of our packaging as well.
The intended acquisition of Imperial - Stegeman will be an accelerator to the sale of branded products, snacks, hybrid & vegetarian products in this segment. At the end of 2022, the transaction was still pending approval by the Dutch and Belgian competition authorities. As soon as there is more news around this transaction, the group will communicate about this via a separate press release.
What’s Cooking? Annual report 2022 9
to 2023
Highlights and key figures in 2022 - looking ahead
In million euros 2021 2022 Difference in %l Net sales 696.9 781.4 + 12.1 UEBITDA 52.8 38.1 - 27.8 EBITDA 45.9 35.9 - 21.8 U-EBIT 24.0 9.9 - 58.8 EBIT 17.1 7.6 - 55.6 Result of the financial year after tax 7.3 4.5 - 38.4
Highlights and key figures in 2022 - looking ahead to 2023
Ready meals strategic business unit
The turnover of the ready meals business unit rose by 24 percent (from 274.09 million to 338.9 million euros). This increase is mainly due to the charging of cost increases and the further recovery of the food sector after the Covid crisis.
Our new products successfully entering the British market helped recovery as well. In retail, volumes held up nicely and inflation in retail prices did not lead to a drop in consumption as our product portfolio caters to every budget. The impact of temporary non-delivery to our customers was limited and our logistics teams continued to work very efficiently in these difficult circumstances.
The steep cost increases and the delayed charging led to a decrease in the EBITDA of the segment by 22 percent (from 28.4 million euros in 2021 to 22 million euros in 2022).
Despite some challenging situations, the group continued to invest in new products and the innovation of existing products. Furthermore, the roll-out of the Come a casa® brand in Eastern Europe is on schedule. In accordance with the new strategy, we will also further expand the share of vegetarian and plant-based meals within this business unit, our current successful meals serving as a basis.
Dividend proposal
The board of directors will propose to the general meeting to keep the gross dividend per share (in 2022) at 4 euros in the form of an optional dividend.
Events after the balance date
See page 137, point 35.
Outlook for 2023 New strategy
In addition to high quality and good service, our new strategic multi-year plan focuses on sustainable growth, the innovation of existing products, and the creation of new products.
Our investment in start-up Davai (producer of plant-based dumplings) and the development of an R&D team for the entire group fit into this picture. Furthermore, What’s Cooking? strives for excellence, and streamlined and digitised processes, and we want to focus more on our brands. We expect to reap the first fruits of this new group strategy in 2023.
2022 already saw us take a few steps towards more sustainable products and processes. Under the guidance of our sustainability manager, we developed a double materiality matrix and set KPIs and targets which we monitor via a sustainability platform.
We also appointed ambassadors at all sites and launched numerous ESG activities (Environment, Social and Governance), next to calculating the ecological footprint of the group and our main products. Together with our suppliers, we want to respond better to the demands of our clients and consumers, and contribute to more sustainable food production.
Savoury
Due to the non-renewal of several contracts, What’s Cooking? expects a slight decline in the sale of savoury slices & spreads in 2023. The group is adapting its operations accordingly and is actively looking for new customers to cover overhead costs. In addition, we continue to invest in chain optimisations to offer our clients a high-quality and affordable product, and in innovations that help them make better choices. Barring unforeseen circumstances, we forecast that the unit’s UEBITDA will lie somewhere between the UEBITDA of 2021 and 2022.
Ready meals
What’s Cooking? expects results for ready meals to improve significantly. Our contracts contain an automatic indexation mechanism for the main ingredients, or they are short-term, which allows us offset additional infl ation, where possible. Due to our high degree of automation, What’s Cooking? is already benefiting from the investments we made in recent years. Bar unforeseen circumstances, the segment’s UEBITDA will gradually return to the 2021 UEBITDA.
Group - expenses
What’s Cooking? expects operating costs to increase as a result of the new strategy that focuses on sustainability, R&D, digitisation and a further professionalisation of the human resources management. Those extra costs will contribute to the results of the coming years.
General
Infl ation peaks and the availability of raw materials are difficult to predict. An overall scarcity of certain raw materials and packaging materials can lead to delivery problems. Gained and lost contracts will have a faster impact on the group’s results compared to the past, given the shorter contract duration.
Strategic objectives
What’s Cooking? wants to create growth and added value for all stakeholders. To conclude this introduction, we present some of our targets for 2023, with a view to 2030.
Must-do’s
• Prioritise safety and food safety
• Sustainable profitable growth
Strategic beliefs
• Engaged employees
• Re-build innovation
• Refocus our portfolio
• Strive for excellence
• Accelerate digitisation
• Be a sustainability pioneer within our sector
What’s Cooking? Annual report 2022 10
EAT (Earnings After Tax)

What’s Cooking? Annual report 2022 11 Turnover 680,5 2018 728,1 2019 717,4 2020 696,9 2021 781,4 2022 EBITDA 44 2018 37,2 2019 37,1 2020 45,9 2021 35,9 2022
7,2 2018 4,4 2019 7,3 2021 4,5 2022 -2,5 2020

business overview
What’s Cooking? Annual report 2022 13
Foreword by the Chairman
don’t live in an era of change but in a change of eras.”

Dear shareholder, stakeholder
Covid could be classified as a ‘crisis’. The best description for the 2022 experience, in turn, is ‘chaos’ – and chaos of a type that only increased as the year progressed, making it more difficult to know which buttons to push.

At What’s Cooking?, in 2022 still known as Ter Beke, we tried to embrace that chaos, reminding ourselves that every remedy has to be stress-tested and that even the most widespread transformation programs benefit from being challenged. Moreover, we realised that, if managed well, this turbulent period could reinforce our deepest values and drivers – and I use the term ‘value’ in the broadest possible sense.
Take the ESG criteria which we want to apply to our decision-making processes. A great source of pride among our employees, serving the market with (more) healthy, safe, and delicious food remains a purposeful activity – as does intensifying our relationships with both our suppliers and customers. The latter was not self-evident given the reduced profitability in the food value chain. But great listening skills, as well as making maximum use of the Group and Shareholder structure and the strong sponsorship of our Board Members, have made our customer centricity become more apparent.
Since there is no single recipe for improving our performance, we are determined to follow two converging paths. On the one hand,
we aspire to world-class execution. Therefore, we are structurally rebuilding our company, continually reviewing and harmonising our processes. On the other hand, a more focused strategy forward has been accepted at Board level. In line with market expectations, we will further strengthen our innovation potential, develop multi-channel access, and speed up the introduction of plant-based options in both the savoury and ready-meal portfolios, offering consumers more choice.
The paths we have chosen may take some time to pursue, but we are strongly supported by all internal and external stakeholders. Moreover, the rebranding of our corporate brand and identity underlines our determination to strengthen our leadership position in the industry which we are so proud to serve, by growing our business both organically and through potential acquisitions.
As the newly appointed Chairman of What’s Cooking?, I have met a company that is not short of challenges but that has a strong soul and dedicated teams of professionals at all levels. I want to seize this opportunity to express my sincere gratitude for your perseverance. What an asset you are.
Thank you.
Paul Van Oyen Chairman of the Board of Directors
What’s Cooking? Annual report 2022 14 Chairman
“We
Prof. Jan Rotmans


What’s Cooking? Annual report 2022 15 Chairman


What’s Cooking? Annual report 2022 16
Chief Executive Officer
Q&A with Piet Sanders, CEO


On an eventful 2022 and an exciting Strategy 2030
How do you look back on your first full year as our CEO, Piet?
Well, it has been a very demanding yet interesting year, in which we faced quite a few challenges. My main takeaway is that we have a strong and experienced team that dealt well with the bumps in the road and that is ready for the hurdles we will have to overcome in the future. Whatever came our way, we were united as colleagues, we showed resilience and made the best of this turbulent period. Looking back on my first full year, that’s what makes me really proud.
Can you tell us a bit about the challenges we faced?
For starters, the post-COVID supply issues were of course followed by the conflict in Ukraine. The war has upset both the raw materials and packaging materials markets, as well as leading to the current energy crisis that has caused such a dramatic increase in the cost of virtually everything we purchase. Secondly, yields of tomatoes and other crops hit a record low due to last summer’s drought, while the extra feed-costs went up, and meat protein costs with it. Then there were the fl are-ups of diseases like bird flu and African swine fever, which further disturbed the meat markets.
The general rise in salaries in 2022 and the exceptionally steep increase due to the automatic salary indexation in Belgium in January 2023 inevitably put pressure on our cost structures. Yet I am very happy and proud to see that, throughout all of this, our people continued to bring an impressive degree of passion to their jobs and the products we make. Their commitment to getting the most out of every day is nothing short of inspirational.
What are your thoughts on the results of 2022?
We had an ebitda of 46 million euro in 2021, and our overall increase in costs in 2022 added up to nearly twice that amount (about 85 million euro). I believe that, while we should not be satisfied with these results, they are in line with the huge challenges we had to overcome and the circumstances we found ourselves in. As a predominantly private label producer, it would not be fair to compare ourselves to the power brands out there.
How did What’s Cooking? deal with these exceptional circumstances?

We saw our people excel and act as one team. Cross-disciplinary units were a great help in assessing our continuously changing procurement situation, and in renegotiating fair prices with our customers in all openness, even if delays prevented us from sharing all the cost increases. We used the situation as an opportunity to eliminate some risks from our business model, replacing the system of fixed annual pricing with prices linked to key material indexes – again in transparency with our customers.
We subsequently developed our cost-saving approach into an overall program called “Drive”, which serves as an umbrella project for our various efforts to economise, for our customer-focused value-optimisation initiatives as well as our improvements in process-efficiency, all governed by cross-disciplinary teams. Thanks to the resulting rise in productivity, we managed to arrive at an acceptable price increase for our customers.

What’s Cooking? Annual report 2022 17 Chief Executive Officer
The exceptional circumstances also made us reflect on how we could improve some of our categories and create more value for our customers. The MaLaGA project – Make Lasagne Great Again – is a case in point. We dug into the 3,000-year-old history of this beloved dish, which spans from its invention by the ancient Greeks to its popularisation by the Italians, rekindling everyone’s fascination with its superb taste and fantastic ingredients, the craftsmanship we put into cooking our lasagnes, and the great care with which we package them.
Finally, last year’s challenges encouraged us to tackle our Strategy 2030 exercise with an open mind and no fixed preconceptions about the future.
Can you walk us through the main points of this Strategy?
Our targets for customer-value creation can be summed up as, on the one hand, providing sustainable, profitable growth and thereby delivering on our financial commitments. On the other hand, we aim for – and will never compromise on – world-class (food) safety. This ties in with six strategic beliefs, namely: our belief in engaging employees, rebuilding innovation, refocusing our portfolio, encouraging excellence, pushing for digital acceleration, and taking industry-leading sustainability initiatives.
In other words: our overall goals are to keep food safety and the safety of our people at the top of our priority list, and to create a steady and sustainable profit growth for What’s Cooking? that is aligned to our shareholders’ interests. These are not “strategic choices”, but rather the fundamentals of everything we do.
I would like to take a moment here to zoom in on our portfolio refocus. The key priority is to develop great-tasting and affordable plant-based products. We want to lead our categories in these more sustainable and nutritious foods, in both What’s Cooking? divisions, which we are now calling Strategic Business Units (SBU). We have renamed “Processed Meats” to “Savoury” to underscore that it’s no longer about meat, but rather about providing consumers with slices, spreads and snacks that will increasingly contain proteins other than meat-based proteins. Our “Ready Meals” Strategic Business Unit, in turn, will focus on what we call “local heroes”: meals that are popular in the countries where we
operate, prepared with love and care for people and planet. To come up with differentiating value propositions for our customers, we will accelerate our investments in innovation. “Products”, “Packaging” and “Processes” will be the main focus of our R&D activities. Considering all this, I strongly believe that we can lead our industry in sustainability.
As you can read throughout this report, we will walk the talk, focusing on a few ambitious yet achievable goals, not just preparing for the rules and regulations that are coming our way, but collaborating with all our partners in the value chain – farmers, suppliers, and customers – to do the right thing for both people and planet, and to make our industry more future-proof. For example, by 2030, we aim to reduce our food waste by 50% and our carbon footprint by 50%. By 2030, we want 15% of our products sold to be plant-based and to cut the number of workplace accidents by half.
It is more important than ever that we are united as a group. This idea underlies our preference for the term “Strategic Business Units” to refer to what were previously called “divisions”. We focus on our customers together, across all departments, and we ensure that our team members are motivated to go the extra mile. Indeed, employees who feel engaged are the key to creating sustainable results.
What is the story behind the new name for our company?
Together with our Board, we wanted to underline the real changes that will follow from our Strategy 2030. These call for a very visible shift: a new name for our company. The question “What’s Cooking?” illustrates that we are eager to know what is happening in the world around us and to regard changes as opportunities. It shows that we will always take great care to create exceptional recipes – not just products – for our customers and the end consumer. Lastly, we ask all our stakeholders “What’s Cooking?” This open question encourages discussion and triggers new solutions.
Thank you, Piet, for your inspiring answers and for giving us a look into the exciting future of What’s Cooking?
What’s Cooking? Annual report 2022 18 Chief Executive Officer
What’s Cooking? Annual report 2022

19
What’s Cooking? Annual report


Chief Financial Officer
2022 20
Yves Regniers, CFO

Continuous improvement thanks to our team spirit and focus on sustainability.”
2022, an eventful year

We thought that 2022 would be a more ‘normal’ year, until it became clear how big the impact of the conflict in Ukraine actually was. Infl ation skyrocketed. Add to that the failed harvests of some of our main ingredients and the price increase of animal proteins, and there is no denying that 2022 was marked by numerous macroeconomic challenges.
The pass-through of infl ation took a lot of took a lot of time and energy from our teams, but will make our business model and the entire chain more sustainable in the long term. ‘Let’s turn the challenge into an opportunity to strengthen our future’ became our slogan. More flexible than ever, we reinvented ourselves. For What’s Cooking? as a company, but also for our clients and consumers.

To enable us to respond more internally recruited our sustainability manager, enabling to changing circumstances, our contracts are often short-term. Some also include an infl ation adjustment mechanism for certain key ingredients, triggering a more automated pass-through of infl ation and defl ation of fluctuating input costs infl ation and defl ation of fluctuating input costs. While it didn’t prevent our results from falling back in 2022, it will make them more resilient for the future.
Positive change
A lot of great things also happened at What’s Cooking? last year. We further reduced our debt and financing cost and are taking important steps in our sustainability journey. We are genuinely proud of our achievements, and of the warm reception of our sustainability project within our group.
With sustainability as a central value in our new strategy, an exciting future awaits us. We are striving to take on a leadership role in our sector, specifically with our savoury food and ready meals.
In the first half of 2022, we internally recruited our sustainability manager, enabling us to shift gears quickly and to inspire others for the project. From then on, there was no stopping us. We distilled our double materiality matrix from an extensive stakeholder survey and peer review, taking into account all factors that play a role within the sector.
Chief Financial Officer
report
21
What’s Cooking? Annual
2022
Fighting for ESG, day by day
We quickly gained more insight into our action items, i.e. our ESG criteria (Environmental, Social and Governance). We also aligned our new, more sustainable strategy internally. And we proved that sustainability is a strategic matter to us by having our ExCom meetings focus on sustainability in addition to product quality and employee safety.
E, S and G: we decided to tackle each letter individually. The ‘G’ is also reflected in our establishment of a sustainability committee within the board. As a smaller listed company, we are relatively unique in this respect. But the ‘G’ doesn’t stop with us. Together with our purchasing colleagues and legal department, we looked at how we can assume our role within the chain and extend our ethical code of conduct both internally and externally.
We are also progressing with respect to social issues (S). We continuously focus on employee engagement and have launched multidisciplinary working groups to make our working environment even more enjoyable. We embrace diversity on our sites and support local initiatives. The organic growth of those initiatives is the living proof that our people are the driving force.
We launched a series of initiatives for ‘E’ as well. For example, our ‘YES WE CARE’ project which calls for less energy consumption. But as What’s Cooking, we want to go even further. From 2024, we only want to use energy from renewable sources, reduce food waste in the entire chain, make our recipes more sustainable, ... These are just a few of our goals. We set the bar high but we’re sure that teamwork will help us achieve everything we aim for.
Sustainability on every employee’s plate
At What’s Cooking?, each and every one of our employees is part of the sustainability team. We believe that is the only way in which we can truly make a difference. Sustainability should not be an assignment but a passion. We need that mentality to kickstart the sustainability movement and inspire all our stakeholders. Finance has a connecting role within the company and establishes relationships with and between HR, purchasing, sales, production, engineering, legal services, communications, R&D, sustainability, marketing, quality, safety and ICT. Every team contributes to our sustainability efforts, as do our external stakeholders, which is what makes it so exciting.
Strategy and sustainability, hand in hand
We are strongly committed to the CSRD (Corporate Sustainability Reporting Directive), ESRS (European Sustainable Reporting Standards), EU Taxonomy, CSDDD (Corporate Sustainability Due Diligence Directive) and other reports that are in the making for our company. In the meantime, we are working with a system that facilitates a professional follow-up of those reports and our own targets (which arise from our strategy). This way, we create a win-win situation, namely: a thorough focus on the collected data and a link with and follow-up of our strategic objectives. Our finance team also plays a pivotal role in helping us build a sustainability mindset.
Finance as a connector
The collaboration between our finance department and other teams makes it a lot easier to standardise or make processes more sustainable, and thus to be a real business partner for our internal and external clients, as well as for our suppliers. 2022 was no different: we communicated transparently about our cost structure, actively worked on infl ation simulations, and ensured that the calculation of price increases is now fast and automated – certainly not the easiest challenge in a business with limited margins and a large number of SKUs.
We look back with pride on what we have already achieved in the short term.
In 2023, we will continue to focus on the link between data and information, and we will devise action items to improve the What’s Cooking? sustainable growth strategy. We already look forward to our first sustainability report in 2024!
Yves Regniers CFO
22 What’s Cooking? Annual report 2022 Chief Financial Officer

What’s Cooking? Annual report 2022 23
What’s Cooking? Annual report 2022
 Chief Operations Officer
24
Eric Kamp, COO
Continuous improvement is at the heart of everything we do
At What’s Cooking?, we take great pride in our commitment to employee engagement, safety, quality, sustainability (ESG), efficiency, and to offering our customers excellent services. This is why continuous improvement is part and parcel of our strategy for operational excellence.
Employee engagement
Our employees are the backbone of our company, and we do our very best to ensure that they feel motivated to get to work every day. We foster a positive and inclusive work environment that encourages collaboration, creativity and continuous learning, with a key focus on communication and recognition, operator training and the leadership skills of our team leaders.
Safety is our top priority…
Safe working conditions are a top priority for What’s Cooking? We have intensified our safety training, paying special attention to employee behaviour and encouraging our employees to ‘SEE – SAY – STOP’ whenever they spot a potential hazard. While we, unfortunately, saw a 14% increase of accidents in 2022, the number of severe accidents sharply decreased by 20% in the same timeframe. Additionally, we continued to execute our bestin-class safety system, striving for a safety culture that everyone is on board with.
… as well as quality
Quality is at the core of everything we do. We are making good progress improving our quality system, which ensures that our products and facilities meet the highest standards. In the field of food safety and quality, our continued investments have allowed our factories to grow according to the requirements set by IFS, or the BRC quality standards (International Food Safety – British Retail Consortium). Implementing a food safety and quality culture, finally, requires an agile organisation that continuously adapts to the requirements of its customers. We have strengthened our processes in that department as well, partly by introducing several digital tools.
Sustainability is vital
The sustainability (ESG) of our operations is centred around two pillars: minimising our energy consumption (gas, electricity, water) and decreasing waste across the supply chain. We have multi-disciplinary teams spotting ways to reduce our environmental footprint and executing projects to make this happen.
Efficiency is key
Efficiency is key to our success as a company. Hence our implementation of several process improvements to streamline our operations. Having thoroughly invested in operator trainings, the introduction of a preventive maintenance system, and leadership trainings.
We will continue to invest in continuous improvement to enhance the performance of our factories, especially now that procurement, due to the war in Ukraine, is being challenged. The price of aluminium, plastic and cardboard packaging keeps rising, as do the price of tomatoes, wheat and meat-based raw materials, logistic costs and energy costs. Additionally, we are facing availability and supply problems. We have installed a multi-disciplinary value engineering program, ‘DRIVE’, to explore opportunities to create added value, and to cut costs while safeguarding the quality and innovative character of our products.
At your service
We want to offer our customers the best possible service, and we have seen a year of important improvements in our S&OP process (Sales & Operations). Focusing on the service and quality of our suppliers has become a pillar of the S&OP process as well. To ameliorate our demand forecasting and capacity planning, thereby supporting our S&OP process and service throughout the chain, we have kicked off a major IT project. Finally, we have continued our training of Green and Yellow Belts combined with the recruitment and training of Black Belts.
Continuous improvement is, and will always be, at the heart of our ambition to achieve and maintain operational excellence.
Eric Kamp Chief Operations Officer
What’s Cooking? Annual report 2022 25 Chief Operations Officer
Christophe Bolsius, SBU Director Ready Meals
Long live lasagne, even in times of crisis


Covid was followed by another global crisis, which resulted in an unprecedented price increase of raw materials, energy and packaging materials. In our manufacturing processes, we also faced the challenge of sporadic shortages in the supply chain. But as it turns out, Mediterranean meals – lasagne in particular – are very crisis-proof.

What’s Cooking? Annual report 2022 26 SBU Director Ready Meals

SBU Director Ready Meals What’s Cooking? Annual report 2022 27
Strong brands
Offering people value for money works. We saw our sales increase in all countries on the continent. Our beloved Come a casa® is making more mouths water than ever in Belgium and Central Eastern Europe – as evidenced by the targets we achieved in terms of brand awareness, purchase frequency and market penetration. Our rock-solid professional brand Vamos, in turn, performed extremely well in the Benelux and in the Spanish food service market. And the French food service, too, came out strong again after Covid.
In the United Kingdom, where our focus is on food service and retail with KK Fine Foods, we are seeing a full recovery. Following a dramatic period, the rotation and sales of frozen world cuisine meals are back at pre-covid levels. The future is looking bright.
Projects in the pipeline
In 2022, we consciously concentrated on perpetuating and maintaining our existing product and market combinations. Given the difficult supply situation, we prioritised our strategic partnership with existing customers. We pushed innovation, geographic expansion and channel expansion forward to 2023.
Yet we did not stop working on our growth. Sales, marketing, operations, and R&D collaborated closely to thoroughly prepare our 2023 launch pipeline, with the United Kingdom leading the way. The development and introduction of a new range of world dishes under well-known restaurant brands and chef brands has been an overwhelming success, which we will expand even further in 2023.
Reasonable price increases are a must …
In early 2022, Ready Meals was caught up by the sudden and sharp price increases of raw materials. On a financial level, the first half of the year proved disappointing, to say the least. But What’s Cooking? was quick to grab the bull by the horns. We persistently focused on sales excellence and price management to adjust prices for our customers in all fairness and transparency. It was a year of tough negotiations, but with impressive results.
… but consumer remains king
In 2022, unseen price increases and a continuing scarcity of raw materials made us fully committed to solidifying existing contracts and partnerships at prices that were fair for us and our suppliers. Today, still, our customers, partners and we ourselves are facing challenging times.
If needed, we shortened the duration of new contracts in view of the unprecedented volatility (read: increase) in raw material prices, wage costs, logistics costs and energy prices. But it goes without saying that, in each other’s interest – and that of the consumer – our sellers and customers must continue to look for solutions together to ensure our joint future.
My prediction for 2023? Through hope, perseverance, trust and mutual understanding, we will continue to bring our delicious products to the consumer, day by day.
Christophe Bolsius SBU Director Ready Meals
What’s Cooking? Annual report 2022 28
SBU Director
Meals
Ready

What’s Cooking? Annual report 2022 29
Else Verstraete, CPO
Let’s lead real change
Our purpose and values
Building on the existing values and mission of our group, we announced our new global purpose in March 2023: “Day by day, we make sustainable food consumption second nature by increasing the appetite for delicious, convenient food with care for both people and planet.” Let’s take a moment to reflect on that purpose and on the values that empower every one of us to lead real change..
An introspective journey
As we welcomed new leadership in the course of 2021 and 2022, we reflected on who we want to be, why we exist and where we are headed as we continue to build on our 75-year heritage. As a first step in this journey, we defined the role we want to play and where we want to go, as people increasingly expect more from the companies, products, and brands they love.
Our new purpose represents what our organisation and our colleagues can achieve when we dream big, together. It allows us to unlock, leverage and refocus our existing infrastructure and assets to create more innovation, more sustainability, more opportunities, and more value for all – in everything we do.
The future is bright … and inclusive
We want to help everyone find their way to our delicious products, by making sustainable food consumption second nature. We’re committed to building a future that everyone can celebrate and share. We believe we can make a meaningful impact in our value chain, for all our customers, consumers, and local communities, as well as for our most important stakeholders: our colleagues.
We aim to create a brighter future by promoting sustainability in all its dimensions and by taking category leadership and innovation to the next level to meet customer and consumer needs. We want to drive growth by reaching more consumers with our best-in-class product range and by using data and technology to connect with all stakeholders. Thus, we hope to make a positive and lasting impact.
Empowering, new values
Together with our new purpose, we formulated new values to empower each and every one of our colleagues to lead real change. This is one of the ways in which we want to create a more sustainable, inclusive, and rewarding future for our company.
1. Crafting with care, care by crafting
The main ingredient of everything we create? The love and care we put into our work. We never stop perfecting our products (if we can resist eating them). Quality is always on our hungry minds, as is the well-being and safety of our colleagues and consumers. Through our craftsmanship we also contribute to the world. We set new standards for taste and convenience, for sustainability and animal welfare. That’s how we live up to our responsibility towards the planet and our dear fellow people on it.
2. Confident and courageous
We know we are pretty good at what we do. We don’t feel shy about that, we are openly ambitious and self-assured. At the same time, we realise how we became so confident about our skills: it’s the people we work with. We create a work environment where everybody – accountants, cover your ears – can be creative, courageous and confident about trying new things. Honest mistakes are a part of that. But from our experience: if you give someone the right to fail, they usually don’t.
3. Day by day, side by side
Big changes don’t happen overnight. That’s why we work towards our goals one day at a time. Dreaming big, being wide awake. Rolling up our sleeves, side by side. As one team, beyond country borders or business units, we engage in a mutual partnership with colleagues, suppliers, clients, customers and everyone involved. As equals, respecting each other’s uniqueness, most quirks included.
Proud of our heritage and our shared purpose
Let’s be proud of our culture, building on a rich heritage and creating an inclusive and engaging organisation for all. We aim to give each employee a safe working environment, relying on constructive dialogue as well as encouraging talent development throughout careers. That’s how we enable our people to make an impact on the sustainable growth of our company and on our shared purpose.
Else Verstraete Chief People Officer
What’s Cooking? Annual report 2022 30 Chief People Officer

What’s Cooking? Annual report 2022 31
People Officer
Chief


32 What’s Cooking? Annual report 2022 Chief Information Officer
Chief
Peter Bal, CIO
Accelerating our digital transformation to become fit for the future
Digitalisation is a key enabler for our strategic ambitions. In 2022, we accelerated our digitalisation efforts as a team, reflecting on our vision and roadmap while listening to the needs of our internal and external stakeholders. Today, we continue to work hard on our transformation into a future-proof organization. The digital world offers numerous benefits, and we are eager to reap them all.
Automation and collaboration
In the past year, we further facilitated our production operations through automation, the integration of machine data, and the digitalisation of shop floor information. We also automated our data exchange with customers and suppliers through a variety of interfaces. Moreover, we launched a new hybrid work environment supporting lean collaboration, both internally and externally.
Talents and tools

Special attention goes to our talents, as we are implementing an agile collaboration and governance framework for digitalisation initiatives across the company. To prepare our employees and our company for what lies ahead, we substantially invest in up-skilling and re-skilling. And we want to increasingly engage our collaborators and technology partners by making our tools more effective and easier to use.
Ready for action
In 2023, we will further leverage our innovative technologies to solve business problems and tap into new opportunities. Our aim is to become a process-thinking organisation with modern and performant supporting systems that provide actionable data, open to our internal business clients, customers, and suppliers, as well as to our consumers.

The journey continues
In the coming year, we will continue to gradually assess and modernise our current information systems. Where needed, we will replace them with smarter ones that are adapted to changing requirements, with more automation and advanced analytics capabilities. In 2023, we will already deliver some key building blocks of our digitalisation roadmap, such as an advanced supply chain planning system and an enhanced data integration and business intelligence platform.
The ultimate goal of our digitalisation efforts is to even better serve our partners, customers and consumers, and to offer improved products that match their needs.
Peter Bal Chief Information Officer
Information
Officer
What’s Cooking? Annual report 2022 33
Brecht Vanlerberghe, CR & DO
It is better to be a forerunner than to respond to the market
What do you think is the main challenge for What’s Cooking?
Our most important challenge is, without a doubt, creating value through innovation for all our stakeholders – shareholders, suppliers, customers and, certainly not in the least, the consumer. To do so, we must seize opportunities whether they occur in the market or in society, and tap into the potential and fundamental knowledge of our organisation.
Hence, we need robust processes and stable product quality, good scouting and a feel for customer needs. Those are the keys to achieving disruptive innovations as a market leader, in addition to the buy-in of our customers and close collaborations within our company.
Building relationships and joining forces with other companies, partners, governments and knowledge institutions is and will always be fundamental.
What drives sustainable growth?
I am confident that, in the long term, sustainability is the winning bid. Customers and consumers care about more than just tasty and affordable products: health and sustainability are also high on their list of priorities.
Working sustainably means taking care of current and future generations, but capturing value is an absolute prerequisite for sustainable business operations as well. We need knowledge as well as straightforward communication with customers and partners in the value chain.
Furthermore, consistency is crucial: offering sustainable products in non-sustainable packaging obviously does not make sense. That is why we are organising ourselves around products as well as around processes and packaging. We want to listen to all internal and external stakeholders to remain up to speed, and to optimally address everyone’s interests.
How do we handle this?
In a rapidly changing world, responsiveness is of the essence. To me, that means more than meeting demands. It’s also about being able to react almost instantly.
A good technological understanding of our own products and processes should enable us to shorten the lead time of developments and innovations, and to increase their success rate. From an R&D point of view, we want to see how we can support NPD in the business units. There are challenges ahead, but our organisation has the knowledge and ideas to face them with confidence. We just need to implement and optimise these ideas with an open mind.
We also want to be where new knowledge arises and innovations happen. Collaborations with strategic partners and knowledge institutions should speed up the innovation process and help us approach the associated risks and costs from a different angle. Clear agreements about exploitation and ownership are a must to accelerate growth together.
Where do the opportunities lie?
Consumers are increasingly aware of alternative proteins, among other things. That is a great opportunity for What’s Cooking?, and one which we are happy and eager to seize. After all, it is better to be a forerunner than to respond to the market. That’s what allows you to remain in charge of your own success. We will organise ourselves optimally to take on this pioneering role, using continuous process and product improvement, as well as disruption. The future looks promising.
Brecht Vanlerberghe CR & DO
What’s Cooking? Annual report 2022 34 Chief Research & Development Officer

What’s Cooking? Annual report 2022 35
Chief Research & Development Officer


What’s Cooking? Annual report 2022 36 General Counsel & Corporate Affairs Director
Ann De Jaeger, General Counsel & Corporate Affairs Director
How we interact with our stakeholders


To meet our goals and advance the transformation of the food system, What’s Cooking? relies on collaborations with stakeholders ranging from customers, suppliers, farmers, researchers and opinion leaders to consumers and shareholders. Strengthening our relationships with them is part of our daily responsibility to contribute to a more sustainable future and create value for all our stakeholders in everything we do.

What’s Cooking? Annual report 2022 37 General Counsel & Corporate Affairs Director
General Counsel & Corporate Affairs Director
Farmers
We source our meat from local suppliers close to the plant, and we adhere to the same strategy for cereals, tomatoes, and other ingredients whenever we can. Through our suppliers, and guided by our sustainability principles, we gain insights into the farmers’ operations. We can verify compliance with workers’ rights, as well as promoting sustainable farming and production, and encouraging both plastic waste reduction and the use of recyclable packaging. Over the course of our 75-year history, we have established a long-term cooperation with our suppliers. We want to encourage them to look into animal welfare and sustainability as well as regenerative practices.
Suppliers
We source our meat from suppliers near our factory wherever possible and we pursue that same local sourcing strategy as much as possible for our grains, tomatoes and other ingredients. Recognising that our suppliers have a major role to play in our mission of delivering responsible food products, we are committed to promoting sustainable, inclusive growth with them by fostering long-term partnerships. Transparency, as well as a mindset of continuous improvement, are key in this mutual engagement.

Team
We believe in empowering our 3,000 people to fulfil our company’s purpose. Building on our values, we strive to create a culture where performance and sustainability go hand in hand, and where the best of our local and global presence come together seamlessly. To do so, we valorise our talents and their passions, ensuring that they are at the core of the progress we want to make every day.
Social dialogue with works councils is important for us. Together, we aim to establish an innovative approach to skills development, preparing our employees for today’s jobs and tomorrow’s.
Researchers
Research on strategic topics such as food safety, healthy food, sustainable packaging, and alternative proteins plays a central role in our growth strategy. Aided by science, we seek to improve our understanding of health and nutrition issues and to deploy this knowledge to further optimise our food products and purpose-driven product strategies.
What’s Cooking? Annual report 2022 38
Retailers
We are stepping up collaboration with our retailers and growing our distribution channels to reach more consumers and help them make healthy and sustainable food choices. We make products specifically for our retailers, and activate their brands and our own in-store and across multiple platforms, catering to local tastes, lifestyles and shopping preferences.
Shareholders
As an innovative food group, we are all for sustainable shared value creation, while caring for both people and planet. We are confident that, thanks to our commitment all our stakeholders as well as to the strong Strategy 2030 that we have come up with, we will again create more value for every shareholder, day after day.
Consumers
We listen and respond to the fast-changing expectations of consumers worldwide and minimize our environmental footprint in production. Thus, we cater to their preferences
 General Counsel & Corporate Affairs Director
for tasty responsible food products that are convenient to eat.
Entrepreneurs
We are entrepreneurs ourselves. We partner with food-tech start-ups that share our vision of a sustainable future for food. We invest in promising companies that bring unique products and disruptive models to the market, accelerating their growth by giving them access to our expertise and resources.
Communities
Inspired by NGOs and civil society organizations, we infuse our mission with their key insights and best practices for building a better world. Besides donating to good causes and reducing our energy consumption, food waste and carbon footprint, we will increase our contribution to the development of communities, people and the environment.
Ann De Jaeger General Counsel & Corporate Affairs Director
What’s Cooking? Annual report 2022 39
Safety awareness and preventive measures in our Opole factory


In addition to food safety, workplace safety is a top priority for What’s Cooking? The basis for effective occupational safety management is that each employee is aware of both its importance and of their (co)responsibility for keeping the workplace safe. In our factory in Opole, Poland, the safety culture is built on meetings with employees, a special safety platform where they can submit suggestions for improvements, safety patrols and the so-called “Lucky 13”-checklist. In 2022, we specifically focussed on employee behaviour and building awareness around work safety.

What’s Cooking? Annual report 2022 40 Plant Manager Polska
An important pledge
During meetings with the entire Opole staff, we stressed the importance of the 3S safety principles: See-Say-Stop. We analysed the causes of accidents and discussed possible preventive measures. Each employee explained what they thought they could do to avoid accidents or to protect team members when something does go wrong.
Together, we arrived at two important conclusive statements. First: “I can prevent any accident”. And second: “I am responsible for my safety and that of my colleagues”. The meetings ended with a pledge from the attendees to take those two statements seriously at all times: the statements were written on a board that 170 employees signed and that is now installed at the entrance to the production area to remind everyone of the importance of safety.
Our safety platform

Moreover, HSE Manager Michal Stahlberger successfully launched the idea of a user-friendly tool where Opole employees could submit their suggestions to improve on-site safety. The “HSE Opole Podio Safety Platform” was born. In June 2022, we announced a competition for a new, more attractive name for our platform. We set up a promotional campaign to get everyone interested and involved, and we ended up with 26 names to choose from.
We organised a poll, and 60% of the voters opted for “Apka BeHaPka”, two rhyming words that refer to “application” and “health & safety”. The employee who came up with the new name, as well as those who invented the second and third most popular options, got a reward.
Each employee received a sticker on their batch with the 3S icon and a QR code that provides access Apka BeHaPka, so they can submit their ideas to improve safety at any time. Thanks to the tool (and a series of introductory meetings to further familiarise the team with it), we saw a 65% increase in the submission of safety improvement ideas. Only three months after the launch of Apka BeHaPka, we already had more submissions than in the whole of 2021. We continue to encourage employees to report “near misses” via the platform.
Safety patrols and audits
Thirdly, Managers, Shift Managers and Specialists are involved in building and maintaining a safe working environment through the implementation of safety patrols. These patrols are carried out in thirteen areas of the factory, and each area is audited every three weeks by different people, with different question cards.

The people who perform the safety patrols show an interest in the working conditions and equipment; they encourage employees to share their knowledge with them or via self-reporting; and they are curious, asking questions and writing down topics that are important to the team. From November 2022 onwards, we have been asking a production employee to participate in the patrols.
Safety patrols are an effective means to improve both safety and team integration – it is each department’s daily connection to the topic of safety, and a useful reminder of its importance.
“Lucky 13”

As a final example, the daily checklist called “Lucky 13” that we introduced in July 2022 is worth mentioning. The items on that list were determined by analysing all the accidents that have occurred and all first aid treatments that have been administered since 2014. The resulting document allows us to quickly check the most important points that ensure safe working conditions.
The observations gathered via Lucky 13 are processed, and the HSE Manager discusses them in the Monday morning meetings, where joint actions are taken to eliminate the non-conformities that were spotted. Everyone has access to the Lucky 13 data, which are posted on the safety patrol communication board in the form of charts and an action plan.
Keeping up the good work
For 2023, we obviously want to keep up the good work. The measures we took in 2022 provide the foundation for keeping working conditions in Opole safe, or making them even safer, in the years to come.
Jaroslaw Szarzewicz Plant Manager Polska
What’s Cooking? Annual report 2022 41 Plant Manager Polska
A concern for every day and everyone
We firmly believe that prevention is the key to success. It goes without saying that we insist on the use of personal protective equipment (PPE) and that we do everything in our power to ensure optimal working conditions. In addition, we regularly launch awareness and information campaigns to engage the entire team, including temporary workers, visitors and partners – in short: everyone who is on site.
We want to actively involve all employees in our HSE policy. To motivate them to follow the rules and procedures – and thus to reduce the risk of accidents – we provide internal training sessions and engage in continuous and constructive dialogue.
The daily presence and support of our Operations Managers heightens our employees’ commitment to the HSE policy and allows us to analyse and improve the working conditions.
These on-site observations lead to technical and organisational measures, as well as to actions on the level of individual employees. The 3S principle that the Opole team applies (as you can read elsewhere in this report) also underlies our daily operations at Stefano Toselli. The motto “See-Say-Stop” encourages everyone to take responsibility for their safety and that of their colleagues. We analyse every risk and intervene as soon as an employee reports a dangerous situation.
Safety and health: a top priority also for Stefano Toselli

At What’s Cooking? we do our utmost to make everyone feel safe. Read on to find how we shaped the HSE (Health, Safety and Environment) policy in our Stefano Toselli factory in Mézidon - Vallée d’Auge, France.
Focus on physical and mental health
Leading a team also means taking psychosocial risks into account and reducing them to an absolute minimum. These risks are often less visible than physical dangers, but the consequences can be just as grave, or even graver.
So, we keep our eyes open, and we rely on our employees and managers to do the same. After all, they are the experts when it comes to their work, and they know which situations can cause difficulties, stress or discomfort. By listening to employees and keeping our finger on the pulse, we can more easily identify any problems and – together with the team – eliminate or reduce them.
Well-being and fun at work
In 2023, we want to continue to improve the working conditions of our employees with preventive actions. Well-being and fun at work are, and will remain, a top priority for What’s Cooking?
Thierry Simon Plant Manager Mézidon
What’s Cooking? Annual report 2022 42 Plant Manager Mézidon

What’s Cooking? Annual report 2022 43


What’s Cooking? Annual report 2022 44
Engagement is the ultimate ingredient for a top organisation
The world is changing faster than ever. In addition to, among other challenges, the aging population, shortages in the labour market, digitalisation, and different generations sharing the workplace, HR is now also getting a fair portion of disruptive events on their plate almost every day. The role of human resources is therefore evolving rapidly, and agility is no longer just a buzzword. If we want to become and remain a top organisation, we must be flexible in responding to the needs of our employees. Key ingredients in doing so: strong leadership, high employee involvement and a lot of attention to well-being at work.
Leadership
Today already, trust is at the core of our company culture. We have a getting-things-done mentality, encouraging team spirit, a sense of responsibility and the general involvement of our employees.
From our managers we expect a clear vision, the will and ability to continuously improve themselves, an entrepreneurial mindset, and strong communication skills. We deem all these qualities necessary because we are a team that works hard in order to achieve results, yet one that takes a soft approach to interrelationships as well. Making mistakes, we feel, is a normal part of the learning process. This attitude – coupled with various training programs – gives us a solid foundation to provide a safe working environment day in, day out.
Engagement
We also regularly organise pulse engagement surveys to see how we can keep our employees satisfied and involved in our organisation through global group actions and local initiatives. In that regard, the daily efforts of our motivated local management teams and engagement ambassadors make all the difference.
Well-being

Happy people do their job with passion and are therefore naturally more productive. Today, the well-being of our employees is higher than ever on the list of priorities at What’s Cooking? Of course, we have been implementing a zero-tolerance policy against violence and (sexual) harassment in the workplace for some time now. But we have also noticed a growing need for mental health support. Our range of workshops, digital training, psychological guidance, ... therefore continues to increase every day. We want our employees to feel confident, to be agile, and to maintain a good work-life balance.
Recipe for a high-performance organisation


To become a top organisation at the highest possible level, we must not lose sight of our soft skills as an employer. What’s Cooking? fully embraces strong but empathetic leadership and an open, hands-on culture with a strong focus on the well-being and commitment of our employees. All basic HR ingredients for success are already strongly present in our organisation today, and we are using them well.
Siebren De Schutter HR Manager
What’s Cooking? Annual report 2022

45 HR Manager
Trust is our greatest source of energy

In our company, working together goes far beyond applying operational expertise. It is about solving dilemmas, daring to let go of certainties, and sharing plans and ideas for the future. The basis for our fruitful collaborations: trust. Intangible and hard to measure, but if you manage to earn it from your colleagues and stakeholders, trust is an inexhaustible source of energy – and the key to overcoming many challenges.
Trust within our teams
Some months ago, we started working in customer-centred teams for our largest clients in the Netherlands. The teams meet every week to discuss performance and solve operational issues. During monthly meetings, in turn, they anticipate the needs of our customers and look at opportunities, threats and potential improvements.
Each of our commercial teams is supported by a large group of specialists who think along with them and offer help where necessary, enabling us to serve our customers even better. It is great to see our colleagues trust and empower each other, and come up with the best solutions and smartest innovations together.


In short, because our employees go the extra mile, we continue to create added value for our customers, and we can think strategi-
cally about how to fulfil the wishes of consumers today and tomorrow.
What’s Cooking? Annual report 2022 46 Commercial Director - Savoury The Netherlands
Trust from consumers


What it’s all about at the end of the day is, of course, good food. Food can be a purely practical affair, but it can also be intimate and very personal. The moment when consumers sit down at the table: that’s what provides us with food for thought. At What’s Cooking?, we think about ease of use, but above all about the quality of our products.
More than anything else, food simply has to be good. Since Covid came into our lives, ‘good’ increasingly means ‘good for me and my body’. That is why we will be focusing even more on tasty, healthy products in the coming years, for all our target groups and for every moment – from breakfast to dinner, and everything in between.
Trust from our customers
Ambitious sustainability targets, the war on waste, foil reduction, chain optimisation, the need for even more efficient delivery and category planning, ... We have had an eventful year, which started with a major Covid peak, followed by discussions about raw material prices, production costs and rising energy prices. These setbacks threw a spanner in the works for a while, but we were able to overcome them thanks to trust, transparent communication, and open collaborations with our customers. In the end, 2022 turned out to be a year of progress.
Thinking big and acting on it
Despite its challenging start, the past year has been a good one for our customers and the end consumer. We are bringing less plastic into the market through smarter and smaller packaging, we make better use of raw materials during our production processes, and we have made our products even safer to consume. Thanks to well-thought-out logistics solutions, there are also fewer trucks on the road.
Day after day, our teams deliver top products to our customers, with passion and energy. They succeed in doing so because they have the interests of our customers, consumers, and society at heart, but above all because they trust each other and are trusted by our customers to simply do what they are good at: taking the connection between production and commerce to an even higher level, and thus taking care of our customers in the best ways possible.
Martien van den Boer Commercial Director - Savoury The Netherlands


What’s Cooking? Annual report 2022 47
Adapting and reacting
The whole UK team has consistently pulled together in our shared mission to re-build and grow stronger after the impact of Covid-19. Our buying team worked hard to secure raw materials. We developed a recruitment and retention strategy. We automated as many production processes as possible. We built stronger relationships with our customers. We developed new and innovative products supporting menu changes. And we mitigated infl ation.

Now, we face a cost-of-living crisis. In response, our NPD strategy has become largely rooted in affordable quality without compromising on fl avour or fl air. With our marketing department keeping us updated with current trends, market insight and consumer behaviours, we are able to ensure we develop dishes that are inspirational and relevant.
Food service trends
A first food service trend that we saw in 2022 and that will continue to dominate the industry in 2023 has to do with the sustainability topic, which is of course top of many people’s agenda. Waste reduction plays a big part in that. This means championing under-utilised ingredients like wonky veg, celebrating leftovers and scraps, and using all components of an ingredient – whether this be nose-to-tail or root-to-stem.
A year of steady recovery for our UK division
2021 was about how pent-up postpandemic demand would benefit food services. 2022 was a slightly different story. For what was until recently known as KK Fine Foods – for several years now a very valuable member of the What’s Cooking group – it has been a year of steady recovery, through focused teamwork, proactive NPD, customer relationship building, and of course, infl ation management.
Furthermore, the plant-based revolution isn’t just underway, it has moved into the mainstream and is now taking centre-stage on restaurant menus, from casual pubs to fine dining. Of course, the new Group Strategy ties in perfectly with this trend.
Another 2022-2023 trend that is worth mention is the importance consumers attach to health. They not only hold themselves accountable for their impact on the environment: responsibility for and awareness of self-health is also a key priority.
Moreover, considering the cost-of-living crisis we are facing, the focus is now largely on high-quality food without the formality. Takeaways, fakeaways, food for sharing and street food are proving more affordable versions of finer dining alternatives. The casual style of eating is an interesting alternative to restaurant dining for many. Affordable luxury is what consumers are after, with seasonal, local ingredients prepared in fuss-free ways.
Lastly, the cultural influence of East Asia, and of Korea and Japan in particular, is growing at pace. Both Korean and Japanese cuisines lend themselves well to fusion dishes with bold, now recognisable ingredients like miso, gochujang and kimchi featuring on many menus. The trend of fusion food also enables people to taste fl avours from all over the world.
What’s Cooking? Annual report 2022 48 Head of Sales, KK Fine Foods UK
The changing UK restaurant market
Let’s zoom in briefly on the social event that eating out is now, more than ever. It’s not only about the company you share but the food you share, too. The vibrancy and variety of market-style street food is a particularly popular choice at the moment, whilst “big night in” and “fakeaways” are taking the spotlight as money-saving alternatives to restaurants.
Consumers are looking for exciting retail options to enjoy at home with friends and family when going out isn’t an affordable option; it’s all about championing on-trend styles of eating that enable consumers to take away the take-away, whilst still feeling as though they’re enjoying something special.
The UK restaurant market is set to value £18.1bn in 2022, returning to 94% of its 2019 value, according to the 2022 UK Restaurant Market Report from Lumina Intelligence. Pubs continue to be a cornerstone of UK life, showing signs of resilience and durability; across 2022, almost one in ten UK adults have visited a pub at least once per week amid a difficult economic outlook.

While the market will face recessionary behaviours from consumers across 2023, Lumina Intelligence expects improvement will foster greater spending and increased footfall in 2024 and 2025.
Soaring costs and endlessly grim challenges posed by the cost-of-living crisis have left operators in a critical position. Pubs, restaurants and cafés have needed to balance increasing menu prices with not wanting to alienate already financially stretched customers. In these challenging times, operators have been acting and making clever changes on their menus.
Outlook for 2023
Seeing that food service infl ation will hit a record and that food infl ation is also rising fast in the retail sector, that restaurant spending falls as more consumers cut back, while take-aways and fast-food spending grow, the question becomes: what does this mean for us and our customers?
First, we must ensure that we choose the right playing field as the food service landscape changes: take-aways and quick service restaurants continue to grow. Secondly, we have to be aware that the way to win is by understanding our own strengths and capabilities. Thirdly, innovation is key: redeveloping or replacing dishes on the menu that attract higher infl ation is preferable to upping the price. The group’s renewed focus on innovation will surely help here. And lastly, we have to ensure we don’t become complacent. Let’s keep on challenging ourselves to broaden our reach and create innovative NPD.
Emma Abram Head of Sales, KK Fine Foods UK
What’s Cooking? Annual report 2022
49 Head of Sales, KK Fine Foods UK
Sowing seeds in the fertile soil of our Italian ready-made meals

We’re in the middle of a global crisis, navigating the turbulent sea of the Ukrainian war, climate change, … Facing one disruption after the other, producers, retailers and end consumers are all heavily impacted. Yet this situation is also bound to accelerate innovations and create new trends. The world is changing, but so are we!
Confidence and courage


Difficult times require confidence and courage, and we have those characteristics in abundance. We are proud to say they are in our DNA. We have confidence in our strength, and we are courageous enough to continually question ourselves, so we can better meet consumers’ needs and ensure a sustainable, profitable growth for What’s Cooking?


What’s Cooking? Annual report 2022 50
The fertile soil of our brands
1. Come a casa®: the leading ready-meals brand in Belgium


Sustainable, profitable growth


Building on those solid foundations and on the successes of 2022, we can explore new opportunities and set ambitious goals for our brands. Behind the scenes, the team of What’s Cooking? has been hard at work on big plans that will further ensure our sustainable, profitable growth, day by day.
1. Sustainable, tasty and convenient
Our consumers shouldn’t have to put a lot of effort into finding more sustainable products. With our brands, we are on a path of providing the most delicious and convenient meals in a more sustainable way. The launch of the Come a casa® top seal packaging in Poland decreased our plastic usage by more than 85% without impacting our quality. And this was only the first step we are taking to make sustainable food consumption second nature.
Known by 87% of the Belgian population, considered by threethirds and bought by 23%, the success of Come a casa® is beyond dispute – and it did not come by accident either. Thanks to the brand repositioning we did a few years ago, and thanks to the entire team’s consistency and drive, Come a casa® has become Belgium’s favourite ready-meals brand. (source: SOM = Nielsen YTD P6 2022)
(table: GFK – Feb 2022)
The “‘t Leven is wat je ervan smaakt” campaign further strengthened Come a casa’s leadership, both in terms of pleasure and convenience.
2. A stronger brand in more countries
We are already delighting consumers from twelve different countries with our Come a casa® lasagnes. For now, our brand’s popularity in Belgium remains unparalleled in other countries, but several studies have revealed the potential to build the same leadership elsewhere. We will take on this challenge in 2023 with the help of a dedicated team, ambitious investments, and the launch of new products.
3. Exploring new recipes and sales territories

2. Vamos®: the best lasagne for professionals since 1985
In the professional channel, our passion and craftsmanship paid off, too. Our approach for Vamos® was based on two strong pillars: partnership and quality. We’re not only cooking the best lasagne in the market; we are also teaming up with the butchers to help them grow their business.
The VG Sensory Test in October 2022 confirmed that Vamos® is synonymous with the very best taste.
The world is changing faster than ever, and so are consumer behaviours – even if the need for delicious tastes and convenient solutions remains a constant. Surfing on the trends we see, we are working on new (plant-based) recipes, on even more sustainable packaging, as well as on new and easier ways for our consumers to access our products.
Confidence in our brands and the courage to explore new paths
Our teams have been working side by side on our ambition to develop a sustainable, profitable growth. Building on our expertise in Italian ready meals and on the strength of our brands, we are confident that we will be able to make a difference in terms of sustainability, innovations, and customer loyalty and connection.
Cédric Lemineur Marketing & Development Director Ready Meals
Source: VG Sensory test – October 2022


What’s Cooking? Annual report 2022 51 Marketing & Development Director Ready Meals
Share of Market Come a casa® in Open Market Italian Ready Meals 40% 0% Volume Value 20% 27% 32% Brand Awareness 87% Consideration 74% Penetration 23% First choice in ready meals 14% Vamos Go Re-work No Go Top A Comp. 2 Comp. 3 C D Comp. 1 B 6,89 5,85 4,84 5,66 N=61


Cooking? Annual report 2022 52
What’s
Why NPD gets a seat at the table right from the start
These last few years, we have been focusing on the multidisciplinary collaboration between R&D and Business and New Product Development (NPD). Because there used to be some static on the line between sales and NPD in the past, the latter team now gets a seat at the table right away, to discuss the needs and wishes of customers and consumers. NPD can now move much faster to deliver new products and improvements that meet everyone’s expectations.
Speed to market
Some of our projects have short lead times, which can range £from several months to just a few weeks. By standardising and digitalising the entire NPD process – from the request for a new product or an improvement to the actual launch – we managed to drastically increase our speed to market. Various departments are closely involved in this “lean stage & gate” process, such as FSQR, Engineering and Production. Together with the NPD team, they evaluate quality issues, capabilities, and process opportunities, among other topics.
Only when every aspect has been greenlighted by everyone, we move on to the next stage in the process. In this way, we ensure a great What’s Cooking? experience for our customers, from the brief to a delicious product on the shelves.
Inspired by passion

Every day, we are driven by our passion for delicious and healthy food, for our customers, animal welfare and the planet. We continually improve our products, in every way we can, without compromising on taste.
For instance, we are adding less salt to our dishes, using a potassium-based salt substitute instead. And our beloved Berliner sausage is now wrapped in a healthier jacket, containing only half the fat of the traditional casing made of bacon fat.
Did you know that our poultry products achieve a Nutri-Score B? And that the label is already printed on the packaging of 30% of these products, too?
Customers and collaborations


Many of our process and product optimisations are the result of the close collaboration between R&D and our suppliers, which our NPD team attaches so much importance to. But we also join forces with our customers to make the entire value chain as fair, sustainable, and transparent as possible. For example, our chicken fillet for a Dutch retailer is made with raw materials that adhere to the ‘Beter voor Kip, Natuur & Boer’ standards (‘Better for Chicken, Nature & Farmer’).
Plant-based
Finally, it is full speed ahead for our new plant-based offering, with ingredients that have a much smaller environmental footprint than their animal-based counterparts. A shift to more plant-based foods is in the best interests of consumers as well, who tend to overindulge in animal products while not eating enough plant-based foods like legumes, vegetables, grains, and seeds.
One of our main ambitions for 2023 is, then, to become a pioneer in the transition to more plant-based or alternative proteins. Our NPD team is determined to show that plant-based foods are not only healthy but affordable, easy, and delicious, too.
Elke De Witte Technology Manager


What’s Cooking? Annual report 2022 53 Technology Manager
Innovating every day for consumers and our customers


Balanced and tasty food keeps us all going. That is what makes working in the food sector so fantastic. Every day, we prepare delicious and nutritious products with plenty of variety for everyone. We serve a huge number of consumers, of all ages and backgrounds, whose wishes and needs change from day to day as the world is evolving at record speed.

What’s Cooking? Annual report 2022 54
New Business Development Director
At What’s Cooking? we know it’s vital to keep our finger on the pulse. We monitor trends daily, together with our internal and external stakeholders. We take a close look at the market and listen carefully to our consumers. What interests them? What do they want and need? It goes without saying that we constantly reflect on our own operations as well.
Relevance


As a large producer, we take our responsibility. We want to become more sustainable every day in everything we do. Our New Business Development department takes a proactive look at what’s happening in the market, how eating habits change and, above all, how we can become and remain relevant to consumers through innovation.

Strategic innovation
Our innovation strategy is twofold. We continuously work on new products, while welcoming innovations from outside our company as well.
New products
Our R&D and NPD experts create new products in multidisciplinary teams, because these types of projects naturally transcend our product categories. It gives me great pleasure to see with how much passion and enthusiasm they all try to make a difference – and how they succeed in doing so together, time and time again.
The themes that concern R&D and NPD most today also concern society. Think of the shift to alternative proteins, the sustainability of our raw materials, the fight against food waste, ...
Innovations from the outside
But we also look beyond our own organisation. Perhaps our greatest source of inspiration in that regard are startups and scale-ups – young companies that have the power to respond rapidly to new trends and to enter the market in a very agile manner. They often succeed in what is also our aim: to be relevant to as many consumers as possible.
In 2022, we announced our first investment in startup Davai, which we want to help grow faster at home and abroad.
Finally, we have joined forces with Maybritt and Ruslan, two young and passionate entrepreneurs who enrich our plant-based offering with their dumplings. By growing with them, we make conscious food shopping easier for today’s consumer, and we hope to become even more sustainable in everything we do.
Every day is a new opportunity to learn.
Greet Van Laecke New Business Development Director
What’s Cooking? Annual report 2022

55
non-financial information
What’s Cooking? Annual report 2022
56
See page 4 and following. for a description of the group’s activities and its segments as well as an overview of the group’s various production sites and their activities. In line with its strategic ambitions, the group will continue to focus on R&D and New Product Development in both its savoury and ready meals segments in the coming years, further supporting the group’s brands, new snacking products. The further development of the commercialization of plant-based and vegetarian products will also receive the necessary attention. More information can be found in the activity report. Commitment to and excellence in food safety, a safe working environment and sustainability are central to the group’s policies.
Social & personnel matters
Strong people and the diversity of teams make us stronger. Engaged people make the difference. What’s Cooking complies with legislation on diversity and ensures that the principle of diversity is consistently applied across all sites and to all teams and employees at all levels.
(See also the “Board of Directors” section on page 76 and following.) Our plants employ people from diverse origins & backgrounds and it is this that makes us strong as a group. Small initiatives such as language and other training courses, sessions on mental and physical well-being at work and team activities should make everyone feel ‘at home’ at What’s Cooking. The group also established a ‘whistle blowing’ procedure to ensure that employees can not only go to their manager or local/group HR department but also speak to an independent party if they have concerns around social & personnel matters. For further information: see also the Activity Report and the description under ‘Key features of internal control and risk management systems’ on page 87 and following.
In total, the Group employs about 3,000 people in its various locations: some 50 in the Group team & about 1,475 in each segment (in each case including the average number of people employed via temp agencies). The table below summarizes staff numbers and full-time equivalents (excluding temps) by country and plant:
Respect for human rights
Respect for human rights - including among our partners & suppliers - is a must. This is part of our core values. Every employee receives a briefing at the start of employment that includes a description of how we expect them to treat others and what they can expect from us. We also ask suppliers to endorse our policy on this.
Fight against corruption
More explanation can be found under “Main features of internal control and risk management systems” on page 87 and following. As a food company, the integrity of our products is also extremely important. To ensure this, we have the necessary internal procedures as well as a product integrity officer to whom employees and third parties can turn for comments regarding the integrity of our ingredients and products.
What’s Cooking? Annual report 2022 57 Non-financial information
Activities Number of employees per 31/12/2022 Number of Full Time Equivalents Groep 54 52.30 België Group functions 54 52.30 Ready meals 1318 1272.91 Belgium 488 458.16 Marche-en-famenne Production 311 287.91 Wanze Production 140 135.35 Sales units Sales & Marketing 37 34.90 France 239 226.00 Mezidon Production, Sales & Marketing 237 224.00 Sales units Sales & Marketing 2 2.00 The Netherlands 3 3.00 Sales units Sales & Marketing 3 3.00 Poland 146 145.75 Opole Production, Sales & Marketing 146 145.75 Spain 6 6.00 Sales units Sales & Marketing 6 6.00 United Kingdom 436 434.00 Deeside Production, Sales & Marketing 436 434.00 Savoury 1182 1117.23 Belgium 672 634.83 Lievegem Production, Slicing & Packaging 159 148.64 Veurne Slicing & Packaging 115 108.60 Wommelgem Production, Slicing & Packaging 360 341.69 Sales units Sales & Marketing 38 35.90 The Netherlands 509 481.40 Aalsmeer Slicing & Packaging 52 49.50 Borculo Production 94 89.80 Ridderkerk Slicing & Packaging 122 114.60 Wijchen Slicing & Packaging 168 158.60 Sales units Sales & Marketing 73 68.90 United Kingdom 1 1.00 Sales units Sales & Marketing 1 1.00 Grand Total 2554 2442.44
Our sustainability strategy
“Yes we care”- Our sustainability strategy

Lore Muylle, sustainability manager: “At What’s Cooking? we want to infuse sustainability into everything we do. The “CARE” in our slogan “YES WE CARE” stands for “Change and Act Responsibly, Everyone.” It is a call to all our stakeholders: we must include sustainability in all our activities and in every collaboration we enter into. It therefore concerns everyone in the entire value chain. And together we make a difference! “
What’s Cooking? Annual
report 2022 58
“Together, we make a difference every day - through our ‘good food for all’ focus, our attention to people and planet.”
Lore Muylle Group Sustainability Manager
good food for all
Protect our planet
• De klimaatverandering aanpakken
• De afvaloorlog winnen Verantwoord inkopen

The three pillars of our sustainability strategy
The sustainability strategy of What’s Cooking? Is built around three pillars:
1. good food for all
By changing the name of our ‘processed meats’ segment to ‘savoury’ (NL: ‘savory’), we are emphasizing how eager we are to add more vegetarian and plant-based products to our range. More specifically, we aim to make 15% of our volume plant-based or vegetarian by 2030. We believe that with a wide range of affordable products and the right information, we can help consumers eat healthily and in a balanced way.
As a food company, we care very much about food safety and quality. It is our reason for existence. In addition to being safe and quality, we want our products to be as nutritious as possible. At What’s Cooking? we strive to improve every day in that area as well.
2. Protect our planet
To combat climate change, we want to significantly reduce our carbon footprint by 2030. Therefore, from 2024 we will only use 100% green electricity. Because global warming also affects water scarcity, we want to use 30% less water per ton of finished product as of 2030 (compared to 2022). In addition, we want to reduce our food product waste by 20% from 2024 (also compared to 2022). The waste we cannot avoid will be recycled as much as possible.
The below figures show the importance of reducing food waste:
• Globally, about 14% of produced food is lost between harvest and sale. Waste accounts for 38% of the total energy consumption in the global food system.
Another important weapon in our fight against waste is sustainable packaging. Several research projects on “greener” options are currently underway. Our ambition: 100% recyclable packaging by 2025 and 30% recycled packaging by 2030. We also want to use as little plastic and packaging material as possible in general, without sacrificing hygiene and shelf life, and without increasing food waste. To be continued!
• Consumentenwelzijn verzekeren
• Beter eten promoten Meer plantaardige producten aanbieden
Help people flourish
• Waken over werknemersveiligheid
• Werknemersengagement stimuleren Mensenrechten respecteren
Whenever possible, What’s Cooking? chooses local suppliers. We buy most of our ingredients in Europe and use 100% RSPO-certified palm oil. In addition, we have an eye for animal welfare. We work closely with our suppliers to implement better farming practices, we only use free-range eggs in our dishes and prefer sustainably caught or farmed fish with an ASC or MSC label.
3. Help people flourish
The safety of our staff is our priority: at executive committee meetings, safety scores are always the first item on the agenda. Our Environment, Health & Safety (SHE) system assesses how our various sites score and helps them improve in this regard. In addition, the engagement index measures the commitment of our staff and examines where there is room for improvement. As of 2028, we aim for an average engagement rate of no less than 80%.
At What’s Cooking? we are committed to the overall well-being and mental health of our employees. Hence our various initiatives across our various sites, such as the Employee Assistance Program, Mental Health Awareness Week and our partnership with Mindlab. That organization offers our employees individualized support for mental health issues and the physical consequences that can result.
We have a code of conduct for our suppliers. This ensures that the human rights of everyone in the value chain are respected. Our Supplier Sustainability Rating Program focuses on both social and environmental criteria.
We also do our utmost to make a difference to local communities in our various locations. Think of collecting toys for underprivileged children and supporting local charities. And of course, the situation in Ukraine did not leave us unmoved. We organized fundraisers and donated some of our products to those affected.
What’s Cooking? Annual report 2022 59 Our sustainability strategy
for all
Fight climate change
Guard employee safety Boost employee engagement Respect human rights Ensure consumer wellbeing Promote enhanced nutrition Grow portfolio plant-based products
Win the war on waste Source responsibly
Our sustainability strategy
Defining our Focus Points
Impact materiality
Very high
High
Moderate
Reducing litter
Air and water emissions
Stakeholder engagement & transparency
Diversity & inclusion
Animal welfare
Financial materiality
Safe working environment
Training & development
Employee engagement
Nutritious products
Water management
Sustainable packaging
With the entire sustainability landscape and our current priorities in mind, we chose our focus areas. Peer reviews gave us insight into key concerns within the food sector. In addition, we acquired valuable information through surveys of our stakeholders. This allowed us to measure our impact materiality (the real or potential impact of our business on people or the environment) in a well-informed way.
With this inside-out view in mind, we looked at the financial impact of social and environmental issues on our business, or our financial materiality. The executive committee identified risks and opportunities based on their likelihood of occurrence and the magnitude of the financial impact. (More details can be found under “Key features of
Human rights & ethics
Employee health & wellbeing
Cybersecurity
Traceablility raw materials (food) waste management
Product innovation
Energy efficiency
Sustainable procurement
Climate change
Food safety & quality
internal control and risk management systems” on page 87.) From the results of impact materiality (stakeholder surveys) on the vertical axis and that of financial materiality on the horizontal, a dual materiality matrix emerged. This allowed us to identify the most important topics at a glance.
The analyses and various sessions on our sustainability strategy with the various working groups within the company on the one hand and our Sustainability Manager on the other resulted in our “ESG wheel. This comprises nine topics related to the Sustainable Development Goals of the United Nations. We will develop these in line with our governance structure.
What’s Cooking? Annual report 2022 60
Figure: dual materiality matrix 2022
ESG-wheel & UNSDG (United Nations Sustainable Development Goals)

Employee health, safety & wellbeing
Climate change & energy management
Nutritious products & consumer wellbeing
Stakeholder engagement
Goveranance
Sustainable procurement Business ethics
Sustainability Board Committee
Executive committee
Sustainability Steering Group
Eco-friendly products & packaging
Waste management
Water management
Progress overlock of sustainability program, resource definition, deliverables and timelines.
Lead: sustainability manager / Members: CFO, COO, Chief R&D Officers, Sales & Marketing Manager, Head of Procurement, Chief People Officer, General Secretary – General Counsel & Corporate Affairs Director
Workstreams
Monthly updates
Workstream
Sustainable Supply Chain
Workstream
Sustainable Operations
Workstream
Sustainable Products
Workstream
Social Responsibility
Workstream
Business Ethics
Workstream
Stakeholders & Outreach
What’s Cooking? Annual report 2022 61
Our sustainability strategy
Our sustainability strategy
Strong governance is essential to achieving our sustainability goals. This is why we set up six work streams.
• The sustainable supply chain work stream focuses on responsible purchasing
• The sustainable operations workflow consists of three subcategories: utilities, safety and the fight against waste.
• The sustainable products and packaging workflow explores how to make our products more nutritious and environmentally friendly, with consumer welfare at its core.
The work stream social responsibility focuses on the social part of sustainability: the well-being of our employees and local communities.
• The fifth workflow business ethics emphasizes ethics.
• The sixth work stream focuses on stakeholders & outreach and has a focus on our relationships with stakeholders and our communication externally.

A steering committee drives the sustainability program and aligns all work streams with the group’s strategy. The progress of work streams and the sustainability program is discussed during a monthly update. On a regular basis, progress is reported to the Sustainability Manager.
The ESG Ambassador team also plays a crucial role in our sustainability journey. Read more about this team in the “sustainability culture” section.
KPI-management
Based on the various work streams and input from the Sustainability Manager, we established the KPIs that we will measure and monitor, approved by the Sustainability Steering Committee and the Board of Directors.
We determined the strategic KPIs based on our focal points. In addition, we measure other KPIs set by Europe, specifically the CSRD (Corporate Sustainability Reporting Directive). This directive focuses on the disclosure of detailed sustainability information. The CSRD goes into effect in 2025 and will start working with the 2024 data. In this way, Europe aims to make sustainability reporting more consistent, as is already the case with financial information. The European Sustainability Reporting Standards (ESRS) describe the requirements and KPIs (currently still partly in draft form).
We already included the ESRS requirements, and along with the KPIs, there are many indicators to consider. Managing and vetting that data in Excel would be difficult and lead to errors. Therefore, we chose a KPI management tool for sustainability that the entire group will use. The tool makes it easy to collect data from each division, entity and site in a consistent and centralized way.
The ability to link evidence to the data increases accuracy and auditability. Our local auditors enter the data into the system. Monitoring the KPIs, in turn, requires a multidisciplinary effort from all departments. Fortunately, the management system makes it easy for us and we can visually generate reports in different formats.

What’s Cooking? Annual report 2022 62
Figure: What’s Cooking? sofitware for tracking & monitoring KPI’s (dummy data)
Greenhouse gas emissions


Climate change is one of the biggest challenges today. We too want to do our part to slow down global warming by reducing our carbon footprint. Scope 1, 2 and 3 emissions were calculated according to the standard values of the Greenhouse Gas Protocol (GHG).
Scope 1 includes direct emissions from sources we own or operate, such as our fixed and mobile combustion plants, as well as process and fugitive emissions. Scope 2 includes indirect emissions released from the generation of purchased electricity. These are two emission groups that What’s Cooking? can directly affect.
Finally, there is Scope 3. This includes all emissions in our value chain for which we as an organization are indirectly responsible. Consider emissions from purchased goods and services, upstream and downstream transportation, corporate waste, employee commuting, business travel, the use and end-of-life of our products, ...
What’s Cooking? aims to reduce scope 1 and 2 emissions by 50% by the end of 2030 compared to 2021. Therefore, from 2023 we will use 50% green energy and from 2024 it will be 100%. A handful of energy effici-


ency projects are already underway or planned for the coming years. The “Master Plan Cooling” will significantly reduce fugitive emissions as harmful refrigerants are replaced. From the end of 2023, about 30% of our company vehicle fleet will be electric, which means far fewer emissions.
We also recognize the importance of reducing scope 3 emissions, even though we have no direct influence on them. As with most companies, more than 90% (between 94 and 95% to be exact) of our total emissions are due to scope 3. Most of it comes from the products we buy (meat, ingredients and packaging), which account for 82% of our carbon footprint. In 2023, we are committed to an engagement program for our suppliers. With this, we encourage them to share information about their own footprint and then set reduction targets.
In addition to our company’s carbon footprint, we also began measuring the footprint of our products. Our finance and IT teams developed a tool to calculate this transparently and efficiently for all recipes. R&D and NPD take this into account when developing and improving recipes. This allows us to address emission reductions, product by product.
What’s Cooking? Annual report 2022 63 Our sustainability strategy
Scope 1 Direct Scope 3 Indirect Scope 3 Indirect Scope 2 Indirect Fixed combustion sources Employee commuting Business travels Purchased goods/ services Operational waste Transport & distribution Capital goods Fuel/energy related End of life for products Transport & distribution Mobile combustion sources Purchased electricity, steam, heat & cooling Process & Fugitive emissions Use of sold products
Figure: Green House Gas Protocol categories - What’s Cooking?
Scope 3: 94% Scope 2: 3% Scope 1: 3%
Figure: Scope 1, 2 and 3 What’s Cooking? 2022.
Our sustainability strategy
A sustainability culture
Our employees are our most important ambassadors. That’s why we also think it’s important to develop a culture of sustainability within What’s Cooking? We put out a call internally for ESG ambassadors, and a group of twenty-five enthusiasts signed up. Every month they meet with the Sustainability Manager. They brainstorm new ways to ignite sustainability culture, and highlight existing initiatives so that other sites can learn from them.
Many initiatives have already taken place at the various sites.

Inspired by World Cleanup Day (Sept. 17), What’s Cooking? organized a cleanup week at its various locations from Sept. 12 to 16. World Cleanup Day brings together millions of volunteers, governments and organizations from 191 countries to tackle the global waste problem and build a better sustainable world.
We also held an Energy Efficiency Week. The heating was turned down a few degrees in all of our offices and a handful of initiatives were organized across the branches: a fat sweater contest, a sports session to warm up during the lunch break and a webinar full of tips to save energy at work and at home.
More fun sustainability initiatives and events will follow in 2023!

Creating awareness is important and can sometimes start very small. We distributed stickers with our ESG slogan “YES WE CARE” throughout all What’s Cooking locations so that our employees could take control. For example, by putting such a sticker on a light switch, they urge others to turn off the light when no one is in the room.
To make sustainability top of mind within our organization, we launched the Sustainability Initiative of the Quarter. Every four months, the colleague with the most outstanding sustainability initiative (social or environmental) is awarded a prize and an honorable mention in the ESG newsletter.

 Lore Muylle Group Sustainability Manager
What’s Cooking? Annual
report 2022 64

What’s Cooking? Annual report 2022 65
•
EU-taxonomy
General
In 2019, the European Commission announced the Green Deal for the European Union. This Green Deal aims to increase sustainable investments to achieve climate neutrality by 2050. This economy with net-zero GHG (Greenhouse Gas) emissions by 2050 should already achieve a 55% emissions reduction by 2030. The EU taxonomy regulation should provide a mandatory and harmonized framework to determine which economic activities can be considered environmentally sustainable.
Legal Framework
Article 9 of Regulation 2020/852 (the European Taxonomy Regulation) covers the following six environmental objectives:
1. the mitigation of climate change
2. the adaptation to climate change
3. the sustainable use and protection of water and marine resources
4. the transition to a circular economy
5. the prevention and control of pollution
6. the protection and restoration of biodiversity and ecosystems
The European Union published a list of economic activities that must meet the first two environmental objectives. These are the energy sector, certain manufacturing activities, transportation and construction - but not (yet) the food sector.
First adoption
We only discuss the types of revenue relevant within the EU taxonomy, namely CapEx (capital expenditure) and OpEx (operating expenditure). As our core activities are not yet covered by the EU taxonomy regulation, the annual revenues eligible for the taxonomy are 0% of our total revenues both in 2021 and 2022. (We refer to note 4 to the financials for more information around revenues.) The group’s activities may appear later in the list of eligible activities for Objectives 3 to 6 above. Once more details are available for the other economic activities that may qualify, the group will schedule an analysis around this.
The following OpEx and CapEx are relevant to the group in the context of EU taxonomy & ‘climate mitigation’:
4.17 – Cogeneration of heat/Cool and power from solar energy
4.19 - Cogeneration of heat/cool and power from renewable non-fossil gaseous and liquid fuels
Given the focus on environmental investments that also contribute to keeping our energy costs manageable - also encouraged by (government) energy policy agreements and similar measures - our ratio for CapEx eligible under the taxonomy is 10% to our total capex for 2021 and 5% for 2022. (numerator = eligible CapEx under the taxonomy & denominator is the total acquisition value of tangible and intangible assets for the relevant fiscal year as included in notes 15 & 16 of the 2022 Annual Financial Report). (For 2021, the total acquisition values for tangible and intangible non-current assets amounted to EUR 18.763 thousand and for 2022 they amounted to EUR 23.379)
The above topics are not part of our revenue generating core business, therefore our OpEx ratio is immaterial for both 2021 and 2022. (OpEx includes operating costs eligible under the taxonomy as a percentage of total operating costs for maintenance, repair, transportation and energy). The total OpEx eligible under the taxonomy was EUR 24,210 thousand in 2021 and EUR 28,201 thousand in 2022
Where various activities could overlap in terms of revenue, CapEx or OpEx for reporting the EU taxonomy data, we only include the figure in the numerator where it is most relevant, to avoid double counting. In 2022, this was not applicable given the nature of the CapEx projects included.
Climate Change mitigation
Climate change mitigation means the process of keeping the global average temperature increase to below 2°C and making efforts to limit it to 1.5°C as defined in the ‘Paris Agreement’. Below we describe further details about our ‘Taxonomy eligible & aligned’ economic activities.
To assess whether the activities below are “aligned,” 3 alignment criteria were applied:
Substantial contribution to climate change mitigation
Not significantly impeding climate change adaptation or the transition to a circular economy and/or pollution prevention & control
Meet ‘minimum safeguards’
Cogeneration of heat/cool and power from solar energy (# 4.17 above)
The group has solar energy installations at several sites. It uses this solar energy in its production facilities. These are either owned by the group or leased or are part of a ground lease granted to a third party that sells the energy from the installation to the group.
•
5.2 – Renewal of water collection, treatment and supply systems
5.4 – Renewal of waste water collection and treatment
6.5 – Transport by motorbikes, passenger cars and light commercial vehicles
• 7.2 – Renovation of existing buildings
7.4 – Installation, maintenance and repair of charging stations for electric vehicles in buildings (and parking spaces attached to buildings)
Given that no CapEx amounts were spent on new solar installations in 2022 nor OpEx costs incurred that qualify, the group has no reportable qualifying amounts for this activity even though it has such solar installations in operation. The group only had costs for the purchase of the solar energy and further paid for CapEx which in previous years was recognized as an acquisition under the guidance of IFRS 16.
Consequently, no testing is to be performed based on the “screening criteria” for this activity.
What’s Cooking? Annual report 2022 66 Non-financial information
Cogeneration of heat/cool and power from renewable non-fossil gaseous and liquid fuels (# 4.19 above)
The group has such installations at various sites. It uses cogeneration of heat / cool in its own production process.
Given that no CapEx amounts were spent on new installations in 2022 nor OpEx costs were incurred that qualify, the group has no reportable qualifying amounts for this activity even though it has such installations in operation. The group only had costs to purchase the such plants in previous fiscal years.
Consequently, no testing should also be performed based on the “screening criteria” for this activity.
Renewal of water collection, treatment and supply systems (# 5.2
above)
The group has such installations at various sites. It uses this water (after treatment) in its production process.
Since no CapEx amounts were spent in 2022 on new installations nor OpEx costs were incurred that qualify, the group has no reportable qualifying amounts for this activity even though it has such plants in operation. The group only had costs to purchase the such plants in previous fiscal years.
Consequently, no testing should also be performed based on the “screening criteria” for this activity.
However, the group considers it likely that further investments will be made in the future to optimize water consumption / re-use.
Renewal of waste water collection and treatment (#
5.4 above)
The group has such installations at various sites. The systems aim at proper collection and treatment of wastewater generated during the production process.
As no CapEx amounts were spent on new installations in 2022 nor OpEx costs were incurred that qualify, the group has no reportable qualifying amounts for this activity, even though it has such installations in operation. The group only had costs to purchase the such plants in previous fiscal years.
Consequently, no testing should also be performed based on the “screening criteria” for this activity.
However, the group considers it likely that further investments will be made in the future to optimize water consumption / re-use.
Electric cars (# 6.5 above)
The group began leasing electric cars in 2021. In 2022, further electric cars were purchased for a CapEx amount of EUR 276 thousand. Through a change in its “car policy,” the group made entering into a lease for electric cars more attractive to employees compared to fossil-fueled cars. The group therefore expects a further increase in the number of electric cars in the future.
1st check : substantial contribution to climate change mitigation
The group’s electric vehicles meet this requirement as electric cars have lower emissions than the limit in the technical screening criteria. The group’s lease contracts include maintenance and also repair.
The activity meets the following criteria: for M1 and N1 category vehicles, both of which fall under the scope of Regulation (EC) No. 715/2007: until December 31, 2025, the specific CO2 emissions, as defined in Article 3(1)(h) of Regulation (EU) 2019/631, are lower than 50gCO2/km (low- or zero-emission light commercial vehicles); from January 1, 2026, the specific CO2 emissions, as defined in Article 3(1)(h) of Regulation (EU) 2019/631, are zero. for L category vehicles, the tailpipe CO2 emissions are equal to 0g CO2e/km, calculated in accordance with the emissions test of Regulation (EU) 168/2013.
2nd check : Do not significantly harm climate change adaptation or the transition to a circular economy and/or prevention of & control of pollution
At the end of the lease, the cars are returned to the leasing company and sold by the latter on the second-hand market. This shows that the activity does not violate the above criterion and a circular economy. Pollution control and prevention: electric cars have lower emissions versus other cars.
Circular Economy: M1 and N1 category vehicles are both: reusable or recyclable to a minimum of 85% by weight; reusable or recoverable to a minimum of 95% by weight. Measures have been taken to manage waste both in the use (maintenance) and end-of-life phases of the vehicle fleet, including through reuse and recycling of batteries and electronics (especially critical raw materials therein), in accordance with the waste hierarchy.
Pollution Prevention and Control: The vehicles meet the requirements of the latest applicable stage of Euro 6 type-approval for light vehicles, as established in accordance with Regulation (EC) No 715/2007. The vehicles comply with the emission thresholds for clean light vehicles in Table 2 of the Annex to Directive 2009/33/EC of the European Parliament and of the Council. However, for road
What’s Cooking? Annual report 2022 67
Non-financial information
vehicles of categories M and N, the tires do not all meet the rolling noise requirements in the highest class and the rolling resistance coefficient (which affects the energy efficiency of the vehicle) in the two highest classes, as set in Regulation (EU) 2020/740 and as can be verified in the European Product Register for Energy Labeling (EPREL). The vehicles comply with Regulation (EU) No 540/2014 of the European Parliament and of the Council.
3rd check : Complies with the minimum safeguards.
According to our analysis, this activity meets the minimum safeguard requirements.
The group considers it likely that further investments will be made in the future to further electrify the commercial vehicles and light commercial vehicles fleet.
Renovation of existing buildings (# 7.2 above)
As a fresh food producer, we mainly use chilled rooms and freezers. Investing in the renovation of roofs - walls & partitions and the general insulation of buildings not only provides increased energy efficiency that is significant in the areas where they are applied but also reduces costs. There were EUR 916 thousand of CapEx investments in 2022 in renovations of existing buildings covered by the scope.
1st check : substantial contribution to climate change mitigation
The renovations included meet the applicable requirements for major renovations or the renovations result in at least a 30% reduction in primary energy demand.
2nd check : Do not significantly harm climate change adaptation or the transition to a circular economy and/or prevention of & control of pollution
The activity meets the criteria set forth in Appendix A of the Annex to the relevant regulation.
3rd check : Meets minimum safeguard standards
Water: If installed as part of renovation work, excluding renovation work in residential buildings, the specified water consumption for the following water appliances shall be demonstrated by product data sheets, a building certificate or an existing product label in the Union, in accordance with the technical specifications in Appendix E of the relevant Appendix to the Regulation: sink taps and kitchen faucets have a maximum water flow of 6 liters/min; showers have
a maximum water flow of 8 liters/min; toilets, including suites, wash bowls and flush cisterns, have a full flush volume of no more than 6 liters and a maximum average flush volume of 3.5 liters; urinals use no more than 2 liters/bowl/hour. Flush urinals have a maximum full flush volume of 1 liter.
Circular Economy: At least 70% (by weight) of non-hazardous construction and demolition waste (excluding naturally occurring materials referred to in category 17 05 04 of the European List of Waste established by Decision 2000/532/EC) generated at the construction site shall be prepared for reuse, recycling and other forms of material recovery, including backfilling operations where waste is used to replace other materials, in accordance with the waste hierarchy and the EU Protocol on Construction and Demolition Waste Management. Operators shall reduce waste generation in processes related to construction and demolition, in accordance with the EU Protocol on Construction and Demolition Waste Management, taking into account best available techniques and by selective demolition to enable the removal and safe handling of hazardous substances and facilitate reuse and high-quality recycling through selective disposal of materials, using available sorting systems for construction and demolition waste. Building designs and construction techniques support circularity and, in particular, demonstrate, with reference to ISO 20887 or other standards for assessing the disassembly or adaptability of buildings, how they are designed to be more resource-efficient and to be adaptable, flexible and dismantleable to enable reuse and recycling.
Given the strict criteria around circularity, the group cannot guarantee compliance in all its projects by 2022. Consequently, for this component, we cannot confirm compliance with this requirement.
Pollution Prevention & Control: Building components and materials used in construction comply with the criteria of Appendix C of the Annex to the Appendix to the Regulation. Building components and materials used in the renovation of buildings that may come into contact with occupants emit less than 0.06 mg of formaldehyde per m3 of material or component and less than 0.001 mg of other category 1A and 1B carcinogenic volatile organic compounds per m3 of material or component, when tested in accordance with CEN/EN 16516 or ISO 16000-3:2011 or other equivalent standardized test conditions and determination methods. Measures are taken to reduce noise, dust and pollutant emissions during construction or maintenance activities and also to reduce the impact on food safety to zero.
What’s Cooking? Annual report 2022 68
Non-financial information

What’s Cooking? Annual report 2022 69
Installation, maintenance and repair of charging stations for electric vehicles in buildings (and parking spaces attached to buildings) (# 7.4 above)
The group began leasing electric cars and gradually installing charging infrastructure at its buildings in Belgium and the Netherlands in 2021. Further charging points were purchased in 2022 for a CapEx amount of EUR 8 thousand.
1st check : substantial contribution to climate change mitigation
The installation of electric vehicle charging stations is consistent with the above contribution as explained under #6.5 above.
2nd check : Do not significantly harm climate change adaptation or the transition to a circular economy and/or prevention of & control of pollution
The activity meets the criteria set forth in Appendix A of the Annex to the relevant regulation.
3rd check : Complies with the minimum safeguards.
The group deems it likely that further investments will be made in the future given the fairly sharp rise in the number of electric cars. Additional charging points have already been commissioned in 2023.
Appendices: Schematic overviews Turnover, CapEx and OpEx: see appendix at the end of this chapter (Pages 71 to 73).
Other
The group has performed an initial analysis around the applicability of IAS 36 in the context of assets that may be subject to the effects of climate change and changing legislation in the context of the broader sustainability initiatives from the EU. The group has no indications that impairment indications are present for the group in 2022.
To be continued…
Because the EU taxonomy will soon expand to include “food and beverage production,” we expect an increase in the KPIs tracked in the future. We anticipated this as best we could so that in 2024 we can report on progress both for the sector agnostic (sector-independent) KPIs, the sector-specific KPIs (if disclosed by then) and our companyspecific KPIs. Meanwhile, we remain committed to sustainability as a core element of our strategy. We set concrete targets as described earlier in this report and systematically monitor all indicators related to ESG. As What’s Cooking? we are convinced that we can have a real impact within our industry in the future and have the ambition to become a leader in sustainability.
What’s Cooking? Annual report 2022 70
Non-financial information
Proportion of turnover from products or services associated with Taxonomy-aligned economic activitiesdisclosure covering year 2022
Substantial contribution criteria
DNSH criteria (‘does not significantly harm’)
What’s Cooking? Annual report 2022 71 Non-financial information
Economic activities Codes Absolute Turnover EUR'000 Proportion of turnover % Climate change mitigation % Climate change adaptation % Water and marine resources % Circular Economy % Pollution % Biodiversit and ecosystems % Climate change mitigation Y/N Climate change adaptation Y/N Water and marine resources Y/N Circular Economy Y/N Pollution Y/N Biodiversit and ecosystems Y/N Minimum safeguards Y/N Taxonomy aligned proportion of turnover, year 2022 % Taxonomy aligned proportion of turnover, year 2021 % Category (enabling activity) Category (transitional activity) A/ TAXONOMY ELIGIBLE ACTIVITIES A1 Environmentally sustainable activities (taxonomy aligned) None N/A - 0% 0% 0% 0% 0% 0% 0% 0% 0% Turnover of environmentally sustainable activities (Taxonomy aligned) (A1) N/A - 0% 0% 0% 0% 0% 0% 0% 0% 0% A2 Taxonomy-eligible but not environmentally sustainable activities (not Taxonomy-aligned activities) None N/A - 0% Turnover of Taxonomy -eligible but not environmentally sustainable activities (not Taxonomy aligned) (A2) N/A - 0% 0% 0% Total (A1+A2) - 0% 0% 0% B/ TAXONOMY-NON-ELIGIBLE ACTIVITIES Turnover of Taxonomy-non-eligible activities (B) 781,385 100% Total (A+B) 781,385 100%
Proportion of CapEx from products or services associated with Taxonomy-aligned economic activitiesdisclosure covering year 2022
Substantial contribution criteria
DNSH criteria (‘does not significantly harm’)
What’s Cooking? Annual report 2022 72 Non-financial information
Economic activities Codes Absolute CapEx EUR'000 Proportion of CapEx % Climate change mitigation % Climate change adaptation % Water and marine resources % Circular Economy % Pollution % Biodiversit and ecosystems % Climate change mitigation Y/N Climate change adaptation Y/N Water and marine resources Y/N Circular Economy Y/N Pollution Y/N Biodiversit and ecosystems Y/N Minimum safeguards Y/N Taxonomy aligned proportion of CapEx, year 2022 % Taxonomy aligned proportion of CapEx, year 2021 % Category (enabling activity) Category (transitional activity) A/ TAXONOMY ELIGIBLE ACTIVITIES A1 Environmentally sustainable activities (taxonomy aligned) Installation, maintenance and repair of charging stations for electric vehicles in buildings (and parking spaces attached to buildings) 7,4 8 0.03% 100% 0% Y Y Y Y 0.03% Y CapEx of environmentally sustainable activities (Taxonomy aligned) (A1) N/A 8 0.03% 0% 0% 0.03% A2 Taxonomy-eligible but not environmentally sustainable activities (not Taxonomy-aligned activities) Transport by motorbikes, passenger cars and light commercial vehicles 6,5 276 1.18% 100% 0% Y Y N Y 1.18% Y Renovation of existing buildings 7,2 916 3.92% 100% 0% Y Y N Y Y 3.92% Y CapEx of Taxonomy -eligible but not environmentally sustainable activities (not Taxonomy aligned) (A2) 1,192 5.10% 100% 0% 5.10% Total (A1+A2) 1,200 5.13% 5.13% B/ TAXONOMY-NON-ELIGIBLE ACTIVITIES CapEx of Taxonomy-non-eligible activities (B) 22,179 94.87% Total (A+B) 23,379 100.00%
Proportion of OpEx from products or services associated with Taxonomy-aligned economic activitiesdisclosure covering year 2022
Substantial contribution criteria
DNSH criteria (‘does not significantly harm’)
What’s Cooking? Annual report 2022 73 Non-financial information
Economic activities Codes Absolute OpEx EUR'000 Proportion of OpEx % Climate change mitigation % Climate change adaptation % Water and marine resources % Circular Economy % Pollution % Biodiversit and ecosystems % Climate change mitigation Y/N Climate change adaptation Y/N Water and marine resources Y/N Circular Economy Y/N Pollution Y/N Biodiversit and ecosystems Y/N Minimum safeguards Y/N Taxonomy aligned proportion of OpEx, year 2022 % Taxonomy aligned proportion of OpEx, year 2021 % Category (enabling activity) Category (transitional activity) A/ TAXONOMY ELIGIBLE ACTIVITIES A1 Environmentally sustainable activities (taxonomy aligned) None N/A - 0% 0% 0% 0% 0% 0% 0% 0% 0% OpEx of environmentally sustainable activities (Taxonomy aligned) (A1) N/A - 0% 0% 0% 0% 0% 0% 0% 0% 0% A2 Taxonomy-eligible but not environmentally sustainable activities (not Taxonomy-aligned activities) None N/A - 0% OpEx of Taxonomy -eligible but not environmentally sustainable activities (not Taxonomy aligned) (A2) N/A - 0% 0% 0% Total (A1+A2) - 0% 0% 0% B/ TAXONOMY-NON-ELIGIBLE ACTIVITIES OpEx of Taxonomy-non-eligible activities (B) 28,201 100% Total (A+B) 28,201 100%
corporate governance
Cooking? Annual report 2022 74
What’s
Corporate Governance
The Corporate Governance Statement is based on articles 3:6§2 and 3:32 of the BCAC (Company and Associations Code in Belgium) and on the Corporate Governance Code 2020. It contains factual information on Ter Beke’s Corporate Governance policy in 2022, including:
a description of the most important characteristics of the internal control and risk management systems
• the required legal information
• the composition of the governing bodies
• the operation of the governing bodies their committees
• the remuneration report
The statement also contains a number of elements of non-financial information as referred to in Article 3:6 BCAC. For the 2022 financial year, we are still using the Belgian Corporate Governance Code 2020 as a reference. This code is publicly available at www.corporategovernancecommittee.be.
Our Corporate Governance Charter is published on www.whatscooking.group. In the charter, we clarify our position with regard to the provisions of the Corporate Governance Code 2020 and we describe other Corporate Governance practices which we apply in addition to the Corporate Governance Code 2020. Where necessary, the Corporate Governance Charter of the Group and the Articles of Association of Ter Beke NV were amended during 2020 in line with the Corporate Governance Code 2020 and the new Belgian Company and Associations Code.
We comply with the statutory provisions on Corporate Governance as set out in the Belgian Company and Associations Code of 2020 and the other specifi c legislation in this regard.
The Group follows the 10 principles of the Corporate Governance Code. The following recommendations of the Corporate Governance Code 2020 have not (yet) been implemented by the group in 2022:
• Recommendation 7.6: The Board of Directors has decided not to pay any share-related remuneration to its non-executive members for the time being and
• Recommendation 7.9: As there is no share-based compensation, no threshold was set for the holding of shares by the executive management.
Ter Beke does not provide share based compensation. This is valid for both non-executive directors and executive management. In view of the limited nature of the remuneration, the Board of Directors does not consider it appropriate to incur the cost of setting up a share plan. If a plan were to be considered in the future, the Board of Directors will also consider a lock-up of the shares for a su_iciently long period.
• Recommendation 7.12: The claw-back of paid variable remuneration or the withholding of variable remuneration. Given the limited variable pay and its short-term nature - as well as the fact that the payment of variable remuneration only takes place after the audit of the financial figures and internal controls has been fully completed - the board of directors decided not to introduce a claw-back clause to date.
Corporate governance What’s Cooking? Annual report 2022 75
Board of Directors

VAN OYEN (°1961)
Paul Van Oyen holds a master’s degree in geology/mineralogy and studied management at KU Leuven. After a few years of teaching and field work in Morocco, he became a researcher for European studies on strategic raw materials. Paul started his industrial career at what is now Steinzeug Keramo. He moved to Etex Group in 1990, where he held several staff and management positions over a period of 31 years. After 7 years as the CEO of Etex, Paul decided to become self-employed in order to share his experience. In 2022, he was appointed as a director and chairman of the board of Ter Beke NV for a period of four years. He is also a member of our Remuneration and Nomination Committee and, as from 2023, the chair of our Sustainability Committee.
Frank COOPMAN (°1965) Holbigenetics NV
Frank Coopman, who graduated in veterinary sciences in 1990, began his career inspecting animal-based foodstuffs and working in molecular medical biotechnology. He obtained a PhD in veterinary sciences and was an animal production and genetics lecturer for many years. Frank is the co-founder and director of BCC bv, Biomics and Chemics Consultancy, where he further develops the biological-genetic section. In 2020, Frank was appointed as a director at Ter Beke NV for a period of four years. In 2023, he also became a member of our Remuneration and Nomination Committee.


What’s Cooking? Annual report 2022 76 Corporate governance
Paul
Dominique COOPMAN (°1967) Famcoo
Invest NV
Dominique Coopman studied bioscience engineering and engineering management, as well as environmental remediation. She also holds a master’s degree in food culture. Dominique works in Italy as a freelance consultant, and has been a director at Ter Beke NV since 2008. Her latest reappointment, in 2022, extended her directorship with another four years. In addition, Dominique became a member of the Sustainability Committee in 2023.
Eddy VAN DER PLUYM (°1957)
Eddy Van Der Pluym supplemented his economics studies with an MBA at INSEAD. After a brief stint at Deloitte Haskins & Sells, he joined the family business Pluma NV, which became a part of Ter Beke NV in 2006. In 2019, Eddy was appointed as a director for a four-year period, and the proposal is to re-appoint him for a period of four years in 2023. In 2023, he joined our Audit Committee.


Piet SANDERS (°1966), CEO Leading for Growth BV

Piet Sanders holds a master’s degree in law and in management. He has spent nearly all 30 years of his career in the food ingredient industry. From 1999 to 2002, Piet was the Global Sales Director of Food at Amylum / Tate & Lyle, a world-leading producer of starch, cereal derived sweetener and wheat proteins. After two years as Chief Sales & Marketing Officer at Reynaers Aluminium, he returned to the food ingredients business in 2004, when he joined Puratos as Managing Director for Central & Eastern Europe. In this international group offering innovative food ingredients and services for the bakery, patisserie and chocolate sectors, Piet held different positions such as Managing Director for Northern & Eastern Europe, and Global Sales & Channels Director. In 2021, he joined Ter Beke NV as our CEO. In 2022, Piet was appointed as a director for a period of four years. He joined our Sustainability Committee in 2023.

Ann VEREECKE (°1963)
Ann Vereecke BV


Ann Vereecke is a civil engineer and doctor in management. She is a professor of operations and supply chain management at Vlerick Business School and Ghent University, and has been a board member and president of EurOMA (European Operations Management Association) and a board member of POMS (Production and Operations Management Society in the US). Currently, Ann is a member of the board of Picanol Group and North Sea Port. In 2014, she joined the Board of Directors at Ter Beke NV as an independent director. She chairs the Remuneration and Nomination Committee and became a member of the Sustainability Committee in 2023. At the General Meeting of May 2022 Ann was reappointed as an independent director for a period of four years. verlengd.
Dominique EEMAN (°1957)
Deemanco BV
Dominique Eeman obtained a degree in applied economics, a master’s degree at Vlerick Business School, and the INSEAD International Directors Programme certificate. He has extensive experience as a CFO, being an all-round financial and strategic expert with extensive knowledge of the food sector thanks to his positions as the CFO at Vandemoortele and as a director at Leonidas. Until 2021, Dominique was the general manager of the listed holding company Solvac. Today, he is the chairman of Akkanto, a member of the Board of Directors of NMP-Funds For Good and Sofindev IV, and a member of the Supervisory Board of Van de Put & Co. Dominique has been an independent director of Ter Beke NV since 2017, his current mandate extending until 2025. He is also chairman of our Audit Committee.
Kurt COFFYN (°1968)
C:Solutio BV
Kurt Coffyn has a degree in industrial engineering, specialising in automation and electronics. He has 30 years of experience in operations and supply chain, from working as a labour analyst at Vynckier (General Electric) to taking up the role of COO at various companies such as Ontex, Provimi, Cargill and Unilabs Switzerland. Since 2019, Kurt has been the COO of Belgium-based Lineas, the largest private rail freight operator in Europe. In 2020 he became a permanent representative of C:Solutio, his current mandate extending until 2024. Kurt has been an independent director at Ter Beke NV since 2017. He is also a member of our Audit Committee.
Inge PLOCHAET (°1968)
Tower Consulting BV
Inge Plochaet holds a master’s degree in industrial sciences/chemistry. She studied innovation management at IMD and obtained an in-company MBA at INSEAD & Wharton. Inge has 26 years of operational experience, starting her career at Procter & Gamble as a packaging engineer. She held various positions at AB-Inbev until 2015, from Innovation Director Western Europe to President of AB Inbev UK & Ireland. Today, she advises companies on strategy and operational excellence, next to being chairman of the Board of B-Steel BV and VBSC NV, and a director at Groven+ NV, CSM NV, Colmar NV, Sligro Food Group NV and the Faber group NV. Inge has held a four-year mandate as an independent director of Ter Beke NV since 2020, and became a member of the Sustainability committee in 2023.

Corporate governance What’s Cooking? Annual report 2022 77
Composition and functioning of the management bodies and committees
Board of directors
Composition
The table below shows the composition of the Board of Directors on 31 December 2022, with an overview of the meetings and attendances in 2022.
As permanent representative for:
(1) NV Fidigo, till 25 June 2022, (2) BV Ann Vereecke, (3) BV Deemanco, (4) NV Holbigenetics, (5) BV C:Solutio, (6) BV Tower Consulting,
(7) BV Leading for Growth, (8) NV Famcoo Invest, as of 25 May 2022 (previously in own name), (9) as of 25 May 2022
* **
E = Executive AC = Audit Committee
NE = Non-executive RNC = Remuneration and I = Independent Nomination Committee
To the extent necessary, we confirm that the Group complies with provision 5.5 of the Corporate Governance Code. This sets the maximum number of mandates in listed companies for non-executive directors.
The internal regulations of the board of directors describe the detailed operation of that board. These rules are an integral part of the Group’s Corporate Governance Charter.
The board decides among other things on the half-yearly and annual results, the budget and the group’s strategy.
Corporate governance
report 2022 78
What’s Cooking? Annual
Name Type* End of mandate Committees** Meetings 2022 (x = present) 9/2 24/2 21/4 25/5 16/6 25/8 24/11 Dirk Goeminne (1) NE 2022 AC/RNC X X X Dominique Coopman (8) NE 2026 X X X X X X X Frank Coopman (4) NE 2024 X X X X X X X Eddy Van Der Pluym NE 2023 X X X X X X X Paul Van Oyen (9) I 2026 AC/RNC X X X X Ann Vereecke (2) I 2026 AC/RNC X X X X X X X Dominique Eeman (3) I 2025 AC/RNC X X X X X X Kurt Coffyn (5) I 2024 AC/RNC X X X X X X X Inge Plochaet (6) E 2024 AC/RNC X X X X X X X Piet Sanders (7) E 2026 X X X X X X X
Diversity
In the composition of the Board of Directors, we take into account the necessary complementarity of skills, experience, knowledge and diversity (including gender). See also Article 1.2 of the Internal Regulations (Annex 1 to the Corporate Governance Charter). The overview of the members of the Board of Directors shows that we will meet this as of December 31, 2022.
Evaluation
The chairman of the board regularly organizes a formal evaluation of the board and its operation, including its interaction with executive management. The results of this evaluation are discussed in the council and improvement actions are prepared. A formal evaluation was completed (with the help of a consultant) in 2022.
Appointments/Reappointments in 2022
The May 25, 2023 general meeting will be asked to:
Reappoint Eddy Van der Pluym as a director for a period of 4 years ending at the general meeting of 2027.
• Appoint Johan Pauwels, (if applicable as permanent representative of his management company) with address at Legevoorde 8, 9950 Lievegem, as a director for a period of 4 years ending at the general meeting of 2027.
Committees within the board of directors
The board of directors had two active committees in 2022: the audit committee and the remuneration and nomination committee. The committees are composed in accordance with legislation and the requirements of the Corporate Governance Code. The committees work within a mandate from the board of directors. A description of that mandate can be found in the detailed terms of reference appended to the Corporate Governance Charter.
Audit committee
The table below shows the composition of the audit committee on Dec. 31, 2022, with a summary of meetings and attendance in 2022.
* Chair
** Chair ad interim on 24/11/2022
All members of the committee are non-executive directors and have in-depth knowledge of financial management. The majority of committee members are independent. The committee has the necessary collective expertise on the company’s activities. The committee met regularly in the presence of the auditor and always in the presence of the internal auditor. The audit committee advised the board of directors on, among other things:
the annual results 2021
• the half-year results 2022
• internal control
• the risk management of the group the independence and remuneration of the statutory auditor and companies associated with the statutory auditorde
2021
The audit committee monitors the internal audit function it has established. It regularly reviews its own regulations and operation.
Corporate governance What’s Cooking? Annual report 2022 79
Name Meetings 2022 (x = present) 21/2 21/4 25/5 25/8 24/11 NV Fidigo (Dirk Goeminne) X X BV Deemanco (Dominique Eeman)* X X X X BV Ann Vereecke (Ann Vereecke) X X X X BV C:Solutio (Kurt Coffyn) X X X X X BV Tower Consulting (Inge Plochaet) X X X X X Paul Van Oyen ** X X X
jaarresultaten
Remuneration and nomination committee
The table below shows the composition of the Remuneration and Nomination Committee on December 31, 2022, with a summary of meetings and attendance in 2022.
Executive committee
Following the introduction of the Companies and Associations Code, Ter Beke opted for a one tier governance model in 2020, with a board of directors, a managing director for day-to-day management and an executive committee.
Executive committee composition in 2022:
Leading For Growth BV, permanently represented by Piet Sanders, group Chief Executive Officer and Chairman of the Executive Committee / Managing Director.
Sagau Consulting BV, permanently represented by Christophe Bolsius, SBU Director Ready Meals
Eric Kamp, group Chief Operating Officer
Esroh BV, permanently represented by Yves Regniers, group Chief Financial Officer
Leading Edge HR BV, permanently represented by Else Verstraete, group Chief People Officer (from May 2022)
Creating digital value SRL, permanently represented by Peter Bal, group Chief Information Officer (from November 2022)
All members are non-executive directors and have in-depth knowledge of human resources management. The majority of the committee members are independent. The remuneration and nomination committee advises the board of directors on, among other things:
• the remuneration of the executives and the CEO
• the remuneration of the directors and the chairman the general remuneration policy for the directors and executive management
• the principles of the variable compensation system
• the appointment and reappointment of directors
• the composition of committees within the board of directors the members and the chairman of the executive committee
• the managing director
The committee prepares the remuneration report, submits it to the board of directors and explains it at the general meeting. The committee regularly evaluates its own regulations and operation.
Secretary
An ad hoc secretary was appointed for each meeting through the end of March 2022. From April 2022 our General Secretary - General Counsel & Corporate Affairs Director, Ms. Ann De Jaeger will also be the Secretary of the Board of Directors.
Broersbank Advies & Management BV, permanently represented by Brecht Vanlerberghe, group Chief Research & Development Officer (from December 2022)
From April 2022, as General Secretary - General Counsel & Corporate Affairs Director, Ms. Ann De Jaeger is also the secretary of the executive committee.
Operation
The executive committee met twice a month in 2022 and whenever necessary for operational reasons. The executive committee is responsible for management reporting to the board of directors. The detailed operation of the executive committee is described in the executive committee’s internal regulations. These are an integral part of the group’s Corporate Governance Charter.
Evaluation
The board evaluates once a year the performance of the CEO (without the CEO) and once a year the other members of the executive committee (together with the CEO). The board does so at the suggestion of the remuneration and nomination committee. This evaluation also took place in 2022. The board uses both quantitative and qualitative parameters for this purpose. There is no direct link between this evaluation and the annual variable remuneration.
Corporate governance What’s Cooking? Annual report 2022 80
Name Meetings 2022 (x = present) 24/1 4/2 15/2 24/2 22/3 21/4 21/11 BV Ann Vereecke (Ann Vereecke)* X X X X X X X BV Deemanco (Dominique Eeman) X X X X BV C:Solutio (Kurt Coffyn) X X X X X X NV Fidigo (Dirk Goeminne) X X X X X BV Tower Consulting (Inge Plochaet) X X X X X X Paul Van Oyen X * Chair
Piet SANDERS (°1966) – Leading for Growth BV
CEO What’s Cooking Group / Managing Director of the Board of Directors
Piet Sanders holds a master’s degree in law and in management. He has spent nearly all 30 years of his career in the food ingredient industry. From 1999 to 2002, Piet was the Global Sales Director of Food at Amylum / Tate & Lyle, a world-leading producer of starch, cereal derived sweetener and wheat proteins. After two years as Chief Sales & Marketing Officer at Reynaers Aluminium, he returned to the food ingredients business in 2004, when he joined Puratos as Managing Director for Central & Eastern Europe. In this international group offering innovative food ingredients and services for the bakery, patisserie and chocolate sectors, Piet held different positions such as Managing Director for Northern & Eastern Europe, and Global Sales & Channels Director. In 2021, he joined Ter Beke NV as our CEO. In 2022, Piet was appointed as a director for a period of four years. He joined our Sustainability Committee in 2023.
Yves REGNIERS (°1978) – ESROH BV
CFO What’s Cooking Group
Yves Regniers studied law at Ghent University and obtained an international executive MBA at Warwick Business School. After a stint in financial auditing at PwC, he worked for thirteen years at what is now WestRock, holding various financial positions both in Belgium and abroad. In the beginning of 2017, he came on board at Ter Beke NV. Yves has been a member of the Executive Committee since January 2019, and was appointed Group CFO in March 2020.
Eric KAMP (°1963)
COO What’s Cooking Group
Eric Kamp studied public administration at the University of Twente. He built an international career working for Mars, United Biscuits and Provimi, among other leading companies, and has lived and worked in Germany, Hungary and South Africa. Before joining What’s Cooking?, Eric was the Operations and Supply Chain Director of the Aquafeed division at Cargill. He has been group COO since 2020 and a member of the Executive Committee. Until the until of end 2022, Eric was Managing Director Processed Meats.
Christophe BOLSIUS (°1969) – Sagau Consulting BV
SBU Director Ready Meals What’s Cooking Group
Christophe Bolsius obtained a degree in applied economics and specialised in international business at the University of Antwerp. He has spent his entire career in the food industry, working in various sales and marketing positions in Belgium and abroad for organisations such as Dr. Oetker, Sara Lee Deli and Campina, and holding management positions at FrieslandCampina and Douwe Egberts. Christophe joined our commercial management team in December 2014. From November 2015, he has been leading the Ready Meals business as Group SBU Director Ready Meals. Christophe is also a member of the Executive Committee.
Else VERSTRAETE (°1967) – Leading Edge HR BV

CPO What’s Cooking Group
Else Verstraete holds a master’s degree in political and social sciences from the University of Antwerp. She gained extensive experience in HR leadership roles at Imtech Marine (Radio Holland) in Rotterdam and Aleris in Duffel. Else worked at 3M for more than six years, as HR Director for the Benelux and HR Director EMEA for several business units. She became our Chief People Officer in May 2022 and is a member of the Executive Committee of What’s Cooking Group.
Brecht VANLERBERGHE (°1973) – Broersbank Advies & Management BV
Chief R&D Officer What’s Cooking Group
Brecht Vanlerberghe obtained a master’s degree in applied bioengineering and in industrial management from Ghent University. He was responsible for research, development and innovation at several international agri-food companies such as AVEVE, Campina, FrieslandCampina, and Tereos Syral. After working for seven years as Chief R&D Officer at Bio Base Europe Pilot Plant, Brecht became a Business Development & Relation Manager at the Sustainable Chemistry unit of VITO. He has been Group CRDO at Ter Beke NV since December 2022, and is also a member of the Executive Committee.
Peter BAL (°1964) – Creating Digital Value BV
CIO What’s Cooking Group
Peter Bal’s master’s degree in industrial engineering was followed by a postgraduate in Business Administration. He also obtained a Digital Transformation Certificate from the Massachusetts Institute of Technology. Peter acquired extensive experience in global, publicly listed companies such as Nokia, Proximus and Swift. He spent fifteen years at what is now ZF, where he started out as Chief Information Officer and Vice President Process Optimisation. Next, he took up the role of Managing Director for Transics, a digital services provider in a new business unit he founded within ZF. Peter started as Group Chief Information Officer for Ter Beke NV in November 2022 and is a member of the Executive Committee.
Ann DE JAEGER (°1971) (verbonden met het executief comité)
General Counsel & Corporate Affairs Director / General Secretary
What’s Cooking Group
Ann De Jaeger obtained a master’s degree in commercial & corporate law at Ghent University as well as a master’s degree in business law at University of Antwerp. She also became a Certified Board Director. Ann started out as a lawyer in a business law firm and built her career as General Counsel and Head of Corporate Affairs in leading international B2B and FMCG food companies such as Tate & Lyle, Tereos Syral, Alpro and Danone. She has been our General Counsel & Corporate Affairs Director since April 2022. In her role, she is attached to the Executive Committee and General Secretary of the Board of Directors.
What’s Cooking? Annual report 2022 81
Conflicts of interest
Board of Directors
In 2022, the board of directors received no notification of a conflict of interest within the meaning of the Companies and Associations Code. No other reports of related party transactions were received, as described in Annex 2 to the Group’s Corporate Governance Charter.
External control
The general meeting of May 27th 2021 appointed KPMG Bedrijfsrevisoren, represented by Filip De Bock, as statutory auditor of NV Ter Beke. The appointment was for three years. We consulted regularly with the auditor. For the semi-annual and annual reporting we invited him to the meeting of the audit committee. The statutory auditor is also invited to discuss the internal audit plan and internal controls. The statutory auditor does not maintain any relationships with Ter Beke that could
Executive Committee
No conflicts of interest presented themselves in the executive committee in 2022. There were also no related party transactions reported within the meaning of Appendix 2 of the group’s Corporate Governance Charter.
influence his judgment. Moreover, he confirmed his independence from the group. In 2022 we paid EUR 283 thousand for audit services to KPMG Bedrijfsrevisoren and to the persons with whom KPMG Bedrijfsrevisoren is associated (2021: EUR 318 thousand). Non-audit services for 10 thousand EUR were provided in 2022 (2021: 5 thousand EUR). The companies with which the auditor has a partnership did not invoice additional fees to the group in 2021 and 2022.
Ter Beke Dealing Code for transactions in securities
Ter Beke’s Dealing Code defines the rules for transactions in Ter Beke securities (annex 3 of the group’s Corporate Governance Charter).
• The Dealing Code states that price-sensitive information must be communicated immediately.
• Directors, executives and insiders must submit stock transactions to the compliance officer. If the advice is negative, the person must cancel the transaction or submit it to the board of directors.
• The Dealing Code contains guidelines to preserve the confidentiality of privileged information. For example, the Dealing Code provides for
blackout periods. Directors and other relevant persons of Ter Beke are not allowed to conduct transactions in Ter Beke securities then.
• New board members, the executive committee and other persons who regularly have access to privileged information are always informed about the Dealing Code.
• The company also keeps a list of the persons who have access to privileged information
Corporate governance What’s Cooking? Annual report 2022 82
Remuneration report
Procedure used in 2022 to develop remuneration policy and determine remuneration and applied remuneration policy.
Remuneration procedure
The Remuneration and Nomination Committee prepared the remuneration policy. It did so for the members of the board of directors, the CEO and the members of the executive committee. The board of directors approved the remuneration policy. The remuneration policy is made available separately on the group’s website (www.terbeke.com) and will be submitted for approval at the General Meeting on May 25th , 2023.
The remuneration policy for the members of the Board of Directors, the CEO and the members of the Executive Committee is further an integral part of the Corporate Governance Charter. It was appended to the terms of reference of the remuneration and nomination committee. The remuneration and nomination committee monitors the application of the policy and advises the board of directors in this regard.
The general meeting of May 25th, 2022 approved the remuneration level for members of the board of directors in fiscal year 2022.
On the advice of the remuneration and nomination committee, the board of directors confirmed the remuneration level for the CEO and executive committee members in fiscal year 2022.
Remuneration
Board and committee members were entitled to the following annual fixed fees (in EUR) in 2022:
as well as a Long Term Incentive (LTI - see below for details). The remuneration of the members of the executive management who are salaried employees of the group consists of: a basic remuneration, an annual variable remuneration, a Long Term Incentive (LTI), a company car, a fuel card and other remuneration components such as pensions and insurance, according to the applicable guidelines for employees of the company.
The CEO and members of executive management receive annual variable compensation. Such compensation depends on the achievement of annually set targets for the fiscal year to which the variable compensation applies.
Objectives are based on objective parameters. They are closely linked to the group’s results, and to the role played by the CEO and members of executive management in achieving them. The main parameters for 2022 are (U)-EBITDA, EAT and ROCE. Annually, the Remuneration and Nomination Committee evaluates which parameters apply in a given year and what the targets are for that year, with a view to implementing the group’s long-term strategy. This is submitted to the board of directors for approval. The achievement of individual objectives determines 25% of the variable compensation for members of executive management in 2022.
Variable compensation always amounts to less than one-fourth of annual remuneration.
If the CEO or management members do not achieve the minimum target to be achieved in a given year, they will forfeit their right to the variable compensation associated with that target for that year. However, if they exceed the target to be achieved, they can receive up to 150% of the variable compensation linked to it.
In addition to variable remuneration, the board of directors may grant the CEO and/or (some of) the members of the executive management a (supplementary) bonus for specific performance or merit. This is done on the proposal of the remuneration and nomination committee. The condition is that this does not exceed the total budget for the variable remuneration for the CEO and the members of executive management. No additional amounts were granted for 2022. The amounts granted in connection with the potential acquisition of Imperial-Stegeman and the associated financial realization targets after integration were extended through 2023.
If variable compensation is granted on the basis of data that is subsequently found to be incorrect, the company will invoke the possibilities under common law. There are no specific agreements or systems that entitle the company to reclaim the variable compensation paid.
Directors are not entitled to any variable, performance-based or share-based compensation, or to any other compensation, other than fixed compensation, for exercising their directorship.
The remuneration of the CEO and members of the executive management who provide their services through a management company consists of a base remuneration and an annual variable remuneration
During fiscal year 2022, the group proceeded to introduce an LTI (Long Term Incentive) plan for executive committee members. The LTI aims at value creation in the (medium-)long term - with clear focus on making the company stronger for the future and implementing the strategic plan.
Corporate governance What’s Cooking? Annual report 2022 83
Pro rata 2022 Former Chairman of the Board of Directors (01.01.2022 - 25.05.2022) 75,000 31,250 Chairman of the Board of Directors (25.05.2022 - 31.12.2022) 100,000 58,333 Member of the Board of Directors 20,000 Chairman of the Audit Committee 10,000 Member of the Audit Committee 6,000 Chairman of the Remuneration and Nomination Committee 7,000 Member of the Remuneration and Nomination Committee 5,000
The LTI is assigned according to financial objectives (growth in equity value) (approx. 80%) and individual ESG objectives (approx. 20%) over a reference period of at least three years each.
If less than the minimum target to be achieved is achieved in a given year, then the right to the variable remuneration linked to that target for that year lapses. On the other hand, if the target to be achieved is exceeded, a maximum of up to 150% of the associated variable compensation may be awarded.
The Board of Directors decides annually, after proposal by the CEO and the Remuneration and Nomination Committee, who is eligible to participate in an LTI plan.
The potential LTI at 100% payout (at target) is an amount of between 15% and 25% of the total base remuneration, depending on the position and the ranking of the position relative to the relevant benchmark. This share is contractually determined individually and aims at a market-based LTI.
If an LTI fee is awarded based on data that is subsequently found to be inaccurate, the company will invoke the remedies under common law. There are no specific agreements or systems that give the company the right to reclaim the LTI variable fee.
For 2023 - barring changing circumstances - the group plans no major changes to the remuneration policy.
Director remuneration and other remuneration of non-executive directors and executive directors and executive managers in their capacity as members of the board of directors
(in EUR)
We summarize the remuneration of board members (executive, non-executive and independent directors - overview see below) for their directorships in 2022 as follows:
In addition to the above remuneration, NV Fidigo also invoiced an amount of EUR 68 thousand for the provision of services exceeding the mandate of Chairman of the Board of Directors in the first half of the year.
Corporate governance What’s Cooking? Annual report 2022 84
Mandate of director Mandate Remuneration and Nomination Committee Mandate Audit Committee Total Fidigo NV (Dirk Goeminne) 31.250,00 2.083,33 2.500,00 35.822,33 Argalix BV (Francis Kint) 58.333,33 2.916,67 3.500,00 64.750,00 Leading for Growth BV (Piet Sanders) 20.000,00 20.000,00 Tower Consulting BV (Inge Plochaet) 20.000,00 5.000,00 6.000,00 31.000,00 NV Holbigenetics (Frank Coopman) 20.000,00 20.000,00 Dominique Coopman 8.333,33 8.333,33 NV Famcoo Invest (Dominique Coopman) 11.666,67 11.666,67 Eddy van der Pluym 20.000,00 20.000,00 Ann Vereecke BV 20.000,00 7.000,00 6.000,00 33.000,00 Deemanco BV (Dominique Eeman) 20.000,00 5.000,00 10.000,00 35.000,00 C:Solutio BV (Kurt Coffyn) 20.000,00 5.000,00 6.000,00 31.000,00 Total mandates 310.583,33
Remuneration of the ceo and other members of the executive management (in EUR)
The individual remuneration of the managing director/chairman of the executive committee CEO (Leading For Growth BV, permanently represented by Piet Sanders) and the combined gross remuneration of the other members of the executive committee and the executive directors: Esroh BV (permanently represented by Yves Regniers), Sagau Consulting BV (permanently represented by Christophe Bolsius), Eric Kamp, Leading Edge HR BV (permanently represented by Else Verstraete - as of May 2022), Creating Digital Value SRL (permanently represented by Peter Bal - as of November 2022), Broersbank Advies & Management BV (permanently represented by Brecht Vanlerberghe - as of December 2022), are included in the table below.
* The pension scheme relates to fixed contribution contracts
** NA = Not Applicable
*** Mandate of director of Ter Beke NV excluded
All amounts are in line with the remuneration policy, which contributes to the long-term performance of the group.
Share-based remuneration
The members of the board of directors and executive committee do not have stock options, subscription rights or any other rights to acquire shares.
The company did not grant any shares, share options or any other rights to acquire Ter Beke shares in 2022. Not to the members of the group’s board of directors and not to the members of the executive committee.
The board of directors has decided for the time being not to pay any share-related remuneration to its non-executive members, as recommended by the Corporate Governance Code 2020.
Given the limited nature of compensation, the Board of Directors does not consider it appropriate to incur the cost of establishing a share plan. Should a plan be considered in the future, the Board of Directors will also consider a lock-up of shares for a sufficiently long period of time.
Corporate governance What’s Cooking? Annual report 2022 85
New CEO*** Other members of the executive management Base pay 529,692 1,280,645 Variable pay (cash - on a yearly basis) 50,000 187,206 Pensions* NA** 20,012 Other insurance (hospitalisation insurance, medical insurance etc.) NA** 10,686 Other benefits (company car) NA** 15,828 Long Term Incentive provision 2021 66,666 108,001
Historical information and ratio
Board and CEO compensation and key performance indicators evolved as follows during the period 2018-2022:
The evolution of the average remuneration of employees in the group can be presented as follows:
The ratio between the fixed remuneration of the CEO (excluding his remuneration as a member of the Board of Directors) and the lowest gross remuneration of an employee of the Group in Belgium is 18 for the month of December 2021.
Contractual provisions related to recruitment and severance payments
No appointment arrangements were agreed upon with either the members of the Executive Committee or the executive directors that would entitle them to a severance payment of more than 12 months’ remuneration or that would otherwise be in conflict with the statutory provisions, of the Corporate Governance Code 2020 or common market practices.
The remuneration paid to Argalix BV upon departure was equivalent to the remuneration for 6 months supplemented by the pro rata variable remuneration and a settlement for the Long Term Incentive.
The contractual notice periods for Sagau Consulting BV (Christophe Bolsius), Esroh BV (Yves Regniers) and Leading For Growth BV (Piet Sanders) is always 12 months, while the notice period for Eric Kamp will, in principle, be calculated in accordance with the statutory provisions applicable to his employment contract.
Corporate governance What’s Cooking? Annual report 2022 86
2018 2019 2020 2021 2022 Former Chairman of the Board of Directors € 75,000 € 75,000 € 75,000 € 75,000 € 31,250 Chairman of the Board of Directors € 58,333 Member of the Board of Directors € 20,000 € 20,000 € 20,000 € 20,000 € 20,000 Chairman of the Audit Committee € 10,000 € 10,000 € 10,000 € 10,000 € 10,000 Member of the Audit Committee € 6,000 € 6,000 € 6,000 € 6,000 € 6,000 Chairman of the Remuneration and Nomination Committee € 7,000 € 7,000 € 7,000 € 7,000 € 7,000 Member of the Remuneration and Nomination Committee € 5,000 € 5,000 € 5,000 € 5,000 € 5,000 CEO - fixed remuneration - excl, board mandate remuneration € 482,000 € 484,725 €466,194 €500,000* €529,692 Sales (in million EUR) 680.5 728.1 717.4 696.9 781.4 EBITDA (in million EUR) 44 37.2 37.1 45.9 35.9 Result after taxes (in million EUR) 7.2 4.4 -2.5 7.3 4.5
2018 2019 2020 2021 2022 Average gross salary for a full time equivalent in the group 100% 103.04% 105.56% 109.30% 111.19%
Key features of internal control and risk management systems
We attach great importance to high-performance internal control and risk management. We integrate these into our structure and operations as much as possible. To this end, we have implemented numerous internal controls according to the integrated COSO II or Enterprise Risk Management Framework®. The most important elements are summarized here.
On the proposal of the executive committee, the board of directors annually determines or confirms our mission, values and strategy, and thus the group’s risk profile. We actively and repeatedly promote our values to all our employees. We do this at least at every semi-annual information meeting. Integrity is the most important value in risk management. We communicate to all our employees at the same time the outlines of the strategy and objectives for the Group and the segments / SBUs (Strategic Business Units Ready Meals and Savoury).
We describe the governance structure of our Group in detail in our Articles of Association, our Corporate Governance Charter and in the Corporate Governance Statement. This structure defines the distinct roles and responsibilities of each of our governing bodies. These are the board of directors, the audit committee, the remuneration and nomination committee, the executive committee and the managing director/CEO. The duties and responsibilities of these bodies are in line with the legal provisions and the provisions of the Corporate Governance Code 2020. We drew up coherent regulations for each of them. We evaluate them regularly. If necessary, we adapt it. In this way, powers and responsibilities are always clearly defined and verifiable.
We organize (and monitor) our human resources through a job classification system in which all group employees are classified. Detailed job descriptions have been drawn up for each position. These describe not only the study and skill requirements, but also the tasks, responsibilities and reporting lines. We adapt these job descriptions as the content of certain positions changes due to internal or external circumstances.
We ensure that we can evaluate all of our non-production employees annually through an elaborated evaluation tool. In this regard, we attach particular importance to values-compliant behavior. We also try to set concrete objectives together for our production employees and organize feedback interviews. We also measure our employees’ commitment at regular intervals at all sites in order to respond even better to the needs of our people.
We have established clear policies for training and compensating our employees. We rigorously apply the legal provisions on conflicts of interest (see above). We introduced regulations for transactions with related parties that do not constitute a legal conflict of interest (Annex 2 to the Corporate Governance Charter). The internal auditor periodically conducts risk audits and audits of internal controls in all Group departments. The audit committee receives a report on these. Based on the findings of the internal auditor, and in consultation with the audit committee, we adjust the internal control environment.
The audit committee devotes two meetings a year to evaluating the risks we face (see above). Internal controls and risk management are also discussed. The discussion is based on a formal and detailed risk assessment prepared by executive management. This reflects how we deal with identified risks. The audit committee reports on its work at the next board meeting.
We have a dealing code to prevent market abuse (Annex 3 to the Corporate Governance Charter). We have also appointed a compliance officer. He oversees proper compliance with the rules on market abuse (see above). We take out adequate insurance contracts for our main risks.
We apply a hedging policy to manage foreign exchange risks.
In describing the main risks, we mention a number of other risk management practices. These include our sustainability risks in terms of both impact materiality (our impact on the environment) and financial materiality (the impact of the changing environment on our business). See also the chapter ‘non-financial information’ for more information on this.
For the process of financial reporting, we have set up the following control and risk management systems:
The internal regulations of the board of directors, audit committee and executive committee clearly describe who is responsible for what in preparing and approving our group’s financial statements.
The finance department reports monthly the financial results of the group and divisions to the executive committee. The committee discusses these results and makes them available to the members of the board of directors.
Quarterly, the executive committee reports the results of the group and divisions to the board of directors. The executive committee first explains the first-half and annual results to the audit committee, which discusses them with the internal and external auditor. Then these results go to the board of directors for approval. They are published in the form required by law. We publish internally and externally a schedule of our periodic reporting obligations to the financial market.
Quarterly, the executive committee also reports the results around the ESG initiatives (Environment, Social, Governance) to the board of directors (and the sustainability committee from 2023 onwards). In order to ensure the auditability of the sustainability information in the future, a software package was purchased that allows both KPIs (Key Performance Indicators) to be consulted per site and per period, as well as a good follow-up of the objectives and the inclusion of the audit information, in order to have a complete and traceable system for the entire company, both internally and externally.
We introduce clear timetables for financial and non-financial reporting at all levels in the company. This enables us to meet all legal obligations in a timely and correct manner. We have a clear policy for securing and providing access to financial data. There is also a high-performance system for backup and preservation of this data.
Corporate governance What’s Cooking? Annual report 2022 87
The finance department uses a comprehensive manual. This describes applicable accounting principles and procedures. The riskiest internal controls from the COSO II framework for financial matters apply. These
controls and systems must help ensure that the published financial results give a true and fair view of the group’s financial position.
Other Legal Information
company’s purpose requires a majority of four-fifths of the votes present. On December 31, 2022, Ter Beke NV did not hold any of its own shares (nor did it on December 31, 2021).
The procedure for the appointment/reappointment of directors (see reappointments above) is described in Article 4 of the regulations of the remuneration and appointment committee (annex to the group’s Corporate Governance Charter).
The extraordinary general meeting of shareholders of May 27, 2021 authorized the board of directors of Ter Beke NV to increase the company’s share capital within the authorized capital. This must be done under the conditions of the Companies and Associations Code. This authorization is valid for a period of three years.
The extraordinary general meeting of shareholders of May 27, 2021 authorized the board of directors, in accordance with the Companies and Associations Code, to purchase shares of the company for the account of the company. Such a purchase of shares is authorized only to prevent an imminent serious detriment to the company. This authorization is valid for three years.
Based on the most recent information obtained by the entity Transparency
We received no transparency statements in 2022.
Notifications pursuant article 34 of the Royal decree of november 14, 2007
There are no security holders with special control rights. The voting rights of the group’s own shares are suspended following the applicable legal provisions. The extraordinary general meeting may amend the company’s bylaws. This requires a majority of three-fourths of the votes present. Those present must represent at least half of the share capital, as provided by the Companies and Associations Code. A change in the
We received a transparency declaration from STAK COOVAN in 2017 regarding their participation in the share capital of Ter Beke NV. We included this declaration in the company’s website. We disclosed the content according to the applicable rules. See also above. To the best of the group’s knowledge, there are no other significant elements that could have an effect in the event of a public takeover offer, nor any legal or statutory restrictions on the transfer of shares.
Main business risks
Ter Beke takes precautions in its internal operations to limit any risks. As a food producer, however, we are also dependent on risks that lie outside our control. Nevertheless, there too we act proactively to minimize any impact.
Corporate governance What’s Cooking? Annual report 2022 88
Shareholding structure as of december 31 2022 Free float STAK COOVAN 34% 66%
Main risks to our operating activities
Operational risks
Food safety and product liability
Every day, thousands of people eat our processed meats and ready meals. These products must be fresh and safe. The end consumer is also entitled to clear information about the composition of the product and its nutritional value.
Competitive environment
The processed meats market is extremely mature and is dominated by the private labels of large discount and retail customers. The ready meals market is growing, but here competition is very fierce.
Technological developments
Product and production technologies evolve rapidly.
What can happen if we don’t make the right decisions?
How do we limit the risks in general and in 2022 in particular?
The safety and the confidence of consumers are vitally important to us. Anything that can damage this confidence - either concerning our own products or the sector - will have a negative impact on our sales, our prospects and our reputation.
We have constant high demands for product safety and quality. All our raw materials are traceable. Our packaging clearly states product composition and nutritional values per 100 grammes and per serving. We go further than the statutory requirements with regards to the safety of our packaging. We have insurance to cover our product liability.
The competition enables customers to increase pressure on our margins. This may have an impact on our profits.
We distinguish ourselves from our competitors in terms of concepts and products. We work continuously on improving efficiency and cost control.
Not being abreast with the latest production technologies can have a negative impact on efficiency and cost control. Competitors may have access to alternative product technology that at some point may win over consumers.
Electronics and information systems
For efficient business operations we are becoming increasingly dependent on information systems and integrated control systems which are managed by a complex set of software applications.
War for talent
An organisation is only as strong as its employees. The knowledge and expertise is to be found in a group of employees who contribute to building the company and its brands.
If these systems do not work well, or if they were to become unavailable, this would have a negative impact on the production volume and on our reputation.
Each year we invest considerable sums in tangible non-current assets to maintain and improve our level of technology. We maintain good contact with our suppliers so that we are always well informed of the most recent developments. We sound out consumer preferences. We work together with research institutes such as Flanders’ FOOD.
All systems are maintained appropriately. All systems are upgraded when necessary. Regular back-ups are made of all information. A new ERP system has been implemented to structure and simplify our business processes.
If too many good employees are lured away by the competition and there is too little influx of young people, we run the risk that we will be unable to achieve our growth scenario.
In 2015, we established a Young Potential programme: newly graduated young people receive an attractive training programme. They experience four different positions within the company during two years.
Corporate governance What’s Cooking? Annual report 2022 89
Main risks to our operating activities
Marktrisico’s
What can happen if we don’t make the right decisions?
Price fluctuations for raw materials and packaging
We work with natural raw materials. We must therefore take into account possible fluctuations in the quality and the price of our raw materials and packaging materials.
Relationships with suppliers
For specific raw materials we are obliged to work with a limited number of suppliers.
Relationships with customers
We market our products via a network of discount and retail customers throughout Europe. The number of large customer groups is limited.
Customer and consumer behaviour
Our sales are related to the eating habits and trends of the ultimate consumers, just as their spending habits.
Price increases for raw materials and packaging can have a negative influence on the margins.
How do we limit the risks in general and in 2022 in particular?
We enter into long-term contracts whenever possible. We work with volume arrangements on an annual basis.
If one or more of these suppliers cannot fulfil its contractual commitments and we are unable to secure alternative supplies in time, this could have a negative impact on our business operations.
We enter into long-term contracts whenever possible. We work with volume arrangements on an annual basis. We offer our suppliers fair payment for their added value. We work with preferential suppliers for sustainability.
The number or larger retail customers is small. If one of them terminates a contract, this may have a significant negative impact on our turnover and profit.
We diversify turnover in different products and contracts with other lead times; both with respect to our own brands as well as private labels of customers and in different countries.
If consumers no longer selected our products or their eating habits were to change, this would have a significant impact on our business activities. General economic conditions such as cyclical fluctuations, unemployment and interest rates can also affect the consumer spending patterns.
In 2015, we conducted a major market research survey on trends in dietary habits in various markets. We surveyed the satisfaction of our consumers to anticipate and minimise this risk. We ensure that our prices are in line with those of the market.
Corporate governance
Cooking? Annual report 2022 90
What’s
Main risks to our operating activities
What can happen if we don’t make the right decisions?
Risks related to climate change & broader ESG risks
Climate Change
Climate changes such as prolonged periods of drought, abundant rainfall and other changes in climatic conditions may cause supply problems for certain of the essential ingredients for our dishes and preparations. These may affect both the availability and price of these ingredients and raw materials.
Availability of (renewable) energy
As a result of the transition to renewable and more sustainable energy sources, experts say power shortages and gas shortages may occur in the future. Our companies depend on electricity and gas in the production of our products.
Price increases and availability issues may have a short-term negative impact on the supply and/or price of our products.
How do we limit the risks in general and in 2022 in particular?
We try to engage in risk - diversification by sourcing our ingredients from various regions. This reduces the impact of regional climatic changes or natural disasters such as persistent drought or abundant rainfall that can impact the harvest of tomatoes, wheat and other vegetables.
Price increases and availability issues could negatively impact the supply and/or price of our products. The availability of energy is also essential for cooling our facilities and for cooling products further down the chain.
Availability of water & other natural resources
The group uses water and other natural resources in the preparation of its products and also in cleaning the lines after production. Availability of ground water & tap water in sufficient quantities and of sufficiently high quality is essential for us as a food company.
Price increases and availability issues may have a short-term negative impact on the supply and/or price of our products.
We already invested in the past in solar panels, heat recovery systems and other energy-reducing techniques to reduce our dependence on energy. We are also renewing our refrigerators, investing in insulation of our buildings and the like. However, for the time being, we remain dependent on thirdparty supplies. The group always considers alternative (but less sustainable) sources of power & steam when shortages threaten. However, this is an ad hoc decision and not a structural backup.
We do a monitoring of our water supply and try to maintain a small buffer on the site to cover short-term shortages. We also try to maximize water reuse and will increase our commitment to this in the future. For sites that use groundwater, we also provide a backup with tap water where possible.
* in addition to the risks already included in the other sections of this report as indicated in the non-financial information & also the other risks already listed in the tables under this corporate governance section
Corporate governance What’s Cooking? Annual report 2022 91
Main risks to our operating activities
What can happen if we don’t make the right decisions?
Financial risks (see also explanatory note 26 in the annual accounts)
Credit risks
We have receivables outstanding from our clients and retail customers.
Receivables not collected on time have a negative impact on the cash flow.
Exchange rate risks
As Ter Beke operates in an international environment, we are exposed to an exchange rate risk on the sales, purchases and interest-bearing loans expressed in a currency other than the company’s local currency.
Interest risk
The forms of financing with variable interest rates mainly arise from Ter Beke’s Revolving Credit Facility Agreement.
Liquidity and cash flow risks
As with any business, Ter Beke monitors liquidities and cash flow.
Fluctuations in exchange rates can cause fluctuations in the value of financial instruments.
How do we limit the risks in general and in 2022 in particular?
We monitor customers and outstanding receivables in order to limit these potential risks. Most receivables relate to large European customers which limits the risk.
The fair value or future cash flows of a financial instrument will fluctuate as a result of changes in the market interest rates.
We adhere to a consistent hedging policy. We do not use financial instruments for trading and we do not speculate.
A shortage of cash and cash equivalents could put pressure on the relationships with certain parties.
Legal risks (see also explanatory note 28 in the annual accounts)
Changes to legislation
Now and then the government changes and tightens legislation on the production and sale of foods.
Legal disputes
Occasionally we are involved in legal proceedings or disputes with customers, suppliers, consumers or the government.
Not meeting these conditions can expose us to the risk of fines or sanctions.
We adhere to a consistent hedging policy. We do not use financial instruments for trading and we do not speculate.
We have a significant net cash flow with respect to the net financial debt position. We have centralised our treasury policy and we hedge against interest rate risks.
We invest significant amounts annually to satisfy new legislation, likewise relating to sustainability and the environment. Each year we organise training programmes to keep our employees up-to-date on new legislation and its impact.
Such litigation could have a negative impact on our financial situation.
We anticipate the potential impact of these disputes in our accounts as soon as a risk is judged as realistic under the applicable accounting rules.
Corporate governance What’s Cooking? Annual report 2022 92

What’s Cooking? Annual report 2022 93 Corporate governance
stock and shareholder information
What’s Cooking? Annual report 2022
94
Share quotation
On December 31, 2022, 1,821,006 shares represented Ter Beke’s share capital. The shares are quoted on the spot market (continuous market) of Euronext Brussels. As a result of the scrip dividend granted over the 2021 financial year, a total of 26,789 new shares were issued and listed on July 1, 2022.
In order to promote share liquidity, we entered into a liquidity provider agreement with Bank Degroof Petercam NV in 2020. This means that the bank acts as a counterparty should there be too few buyers or sellers. The liquidity provider also ensures that the difference narrows between the bid and ask prices - the prices at which one can buy and sell.
The shareholder structure is described in the Corporate Governance Statement (see above).
Share-related instruments
No equity-related instruments, such as stock options or warrants, are outstanding at December 31, 2022.
Dividend
With the annual payment of a dividend, Ter Beke NV wishes to offer its shareholders a market-competitive return. To the general meeting of May 25, 2023, the board of directors proposes to approve, for 2022, a gross dividend of 4 euros per share in the form of a scrip dividend.
Stock price evolution
You can check the Ter Beke share price at any time on the websites www.whatscooking.group and www.euronext.com.
What’s Cooking? Annual report 2022 95
Stock and shareholder information Stock price evolution in € 0 20 40 60 80 100 12 0 14 0 16 0 18 0 200 January M arch Ma y July September November January M arch Ma y July September November January M arch Ma y July September November January January M arch Ma y July September November 2019 2020 2021 2022 2023 TERB LISTED EURONEXT
Monitoring by financial analysts
Analysts at Degroof Petercam and KBC Securities tracked the Ter Beke stock in 2022.
Proposals towards the general shareholders meeting
To approve the financial statements as of December 31, 2022, and to agree with the appropriation of results. The unconsolidated result for the fiscal year is a loss of 1,941,392.17 euros.
• To distribute a gross dividend of 4 euros per share in the form of an optional dividend.
To grant discharge to the members of the board of directors and the auditor for the performance of their duties in 2022.
• To decide by separate vote on the remuneration policy.
• To decide on the remuneration report by separate vote.
To reappoint Eddy Van der Pluym as director for a period of 4 years, expiring at the general meeting of 2027.
• To nominate Johan Pauwels, as permanent representative of his management company, with address at Legevoorde 8, 9950 Lievegem, to be appointed as a director for a period of 4 years, expiring at the general meeting of 2027.
• To appoint a director to be determined at a later date as a director for a period of 4 years, expiring at the general meeting of 2027. (Name not yet known when this annual report went to press).
Director’s fees
The general meeting proposes, in accordance with the remuneration policy, to grant the following fixed annual remunerations to the directors, according to their directorship, their possible membership in the committees of the board of directors and their possible chairmanship:
Financial calendar
Extraordinary Shareholders meeting April 21 2023 at 10.30 AM
Shareholders meeting May 25 2023 at 11.00 AM
Results First semester 2023 August 25 2023
For the actual agenda and proposed resolutions, please refer to the notice of general meeting.
For the actual agenda and proposed resolutions, please refer to the notice of general meeting.
What’s Cooking? Annual report 2022 96 Stock and shareholder information
Chairman of the Board of Directors 100,000 euro Boardmember 30,000 euro Chair audit committee 10,000 euro Member audit committee 6,000 euro Chair Remuneration & Nomination committee 7,000 euro Member Remuneration & Nomination committee 5,000 euro Chair Sustainability committee 7,000 euro Member Sustainability committee 5,000 euro
consolidated financial statements
What’s Cooking? Annual report 2022 97

What’s Cooking? Annual report 2022 98

Consolidated income statement 100 Consolidated overview of the comprehensive income 101 Consolidated balance sheet 102 Consolidated statement of changes in equity 103 Consolidated cash flow statement 104 Accounting policies for financial reporting and explanatory notes 105 Abbreviated financial statements of Ter Beke nv 138 Consolidated key figures 2018-2022 140 Declaration by the responsible persons 141 Report from the Statutory Auditor on the consolidated annual accounts 142 All amounts in EUR x 1000, unless stated otherwise. What’s Cooking? Annual report 2022 99 Index
Consolidated income statement
as at 31 December 2022 and 2021
What’s Cooking? Annual report 2022 100 Consolidated financial statements
Note 2022 2021 Revenue 4 781,385 696,906 Trade goods, raw and auxiliary items 5 -495,220 -415,414 Services and miscellaneous goods 6 -120,664 -110,131 Employee expenses 7 -130,826 -122,696 Depreciation costs 15 +16 -27,833 -28,468 Impairments, write-downs, and provisions 8 -381 -322 Other operating income 9 3,617 3,892 Other operating expenses 9 -2,431 -6,618 Result of operating activities 10 7,647 17,149 Financial income 11 1,305 717 Financial expenses 12 -2,754 -4,369 Results of operating activities after net financing expenses 6,198 13,497 Taxes 13 -1,589 -6,164 Result for the financial year before result from businesses accounted for using the equity method 4,609 7,333 Share in the result of enterprises accounted for using the equity method -89 0 Result in the financial year 4,520 7,333 Result in the financial year: share third parties 299 -13 Result in the financial year: share group 4,221 7,346 Basic earnings per share 32 2,33 4,12 Diluted earnings per share 32 2,33 4,12
Consolidated overview of the comprehensive income
* See the foreign currency section under ‘Accounting policies for financial reporting and explanatory notes’
What’s Cooking? Annual report 2022 101 Consolidated financial statements as at 31 December 2022 and 2021 2022 2021 Profit in the financial year 4,520 7,333 Other elements of the result (recognised in the shareholders’ equity) Other elements of the result that may subsequently be reclassified to the results Translation differences * -1,768 1,560 Cash flow hedge 597 129 Other elements of the result that may not subsequently be reclassified to the results Revaluation of the net liabilities regarding defined benefit pension schemes 442 165 Related deferred taxes -111 -41 Comprehensive income 3.680 9.146
Consolidated balance sheet
What’s Cooking? Annual report 2022 102 Consolidated
financial statements
as at 31 December 2022 and 2021 Note 2022 2021 ASSETS Non-current assets 225,726 231,701 Goodwill 14 77,871 78,332 Intangible non-current assets 15 17,306 20,464 Tangible non-current assets 16 121,650 124,978 Participations using equity method 17 431 Deferred tax assets 18 8,392 7,852 Other long-term receivables 19 76 75 Current assets 178,733 150,104 Inventories 20 46,889 38,596 Trade and other receivables 21 112,491 99,964 Cash and cash equivalents 22 19,353 11,544 TOTAL ASSETS 404,459 381,805 LIABILITIES Shareholders’ equity 23 120,573 121,445 Capital and share premiums 62,197 59,572 Reserves 56,494 60,196 Non-controlling interest 1,882 1,677 Deferred tax liabilities 5,615 6,525 Long-term liabilities 87,759 87,993 Provisions 24 3,442 3,878 Long-term interest-bearing liabilities 25 84,317 79,728 Other long-term liabilities 26 0 4,387 Current liabilities 190,512 165,842 Current interest-bearing liabilities 25 2,792 5,579 Trade liabilities and other payables 27 162,156 138,132 Social liabilities 22,567 20,257 Tax liabilities 2,997 1,874 TOTAL LIABILITIES 404,459 381,805
Consolidated statement of changes in equity
as at 31 December 2022 and 2021
What’s Cooking? Annual report 2022 103 Consolidated financial statements
Capital Share premiums Reserved profits Cash flow hedge Pensions and taxes Call/put option on mintority intrests Translation differences Attributable to the shareholders Minority intrests Total Number of shares Balance on 1 January 2021 5,001 51,781 62,327 -250 110 -3,296 -850 114,823 1,755 116,578 1,767,281 Capital increase 76 2,714 2,790 2,790 26,936 Treasury shares reserve 0 0 Minority intrests as result of business combination 0 0 Dividend -7,069 -7,069 -7,069 Decrease of minority intrests as result of call/put option -174 352 -3 175 -175 0 Results in the financial year 7,346 7,346 -13 7,333 Other elements of the comprehensive income for the period 129 124 1,450 1,703 110 1,813 Comprehensive income for the period 7,346 129 124 0 1,450 9,049 97 9,146 Movements via reserves Result from treasury shares Balance on 31 December 2021 5,077 54,495 62,430 -121 234 -2,944 597 119,768 1,677 121,445 1,794,217 Capital increase 76 2,549 2,625 2,625 26,789 Treasury shares reserve 0 0 Minority intrests as result of business combination 0 0 Dividend -7,177 -7,177 -7,177 Decrease of minority intrests as result of call/put option 0 0 Results in the financial year 4,221 4,221 299 4,520 Other elements of the comprehensive income for the period 597 331 -1,674 -746 -94 -840 Comprehensive income for the period 4,221 597 331 0 -1,674 3,475 205 3,680 Movements via reserves Result from treasury shares Balance on 31 December 2022 5,153 57,044 59,474 476 565 -2,944 -1,077 118,691 1,882 120,573 1,821,006
Consolidated cash flow statement
(*) Also includes adjustments that are part of the financial result. This was -337 KEUR in 2022 and 219 KEUR in 2021
(**) Share Capital increase following Scrip Dividend: shareholders choosing for shares rather than cash
(***) Dividend paid in cash by the parent company
See also further details in note 23.
What’s Cooking? Annual report 2022 104 Consolidated financial statements
as at 31 December 2022 and 2021 2022 2021 OPERATING ACTIVITIES Result before taxes 6,198 13,497 Interest 1,322 2,000 Depreciation costs and impairments 27,833 28,468 Write-downs (*) 102 567 Provisions -58 -27 Gains & losses on disposal of fixed assets -64 3,812 Cash flow from operating activities 35,333 48,317 Decrease/(increase) in receivables more than 1 year Decrease/(increase) in inventory -8,888 -687 Decrease/(increase) in receivables less than 1 year -12,662 -334 Decrease/(increase) in operational assets -21,550 -1,021 Increase/(decrease) in trade liabilities 22,759 6,488 Increase/(decrease) in debts relating to remuneration 2,247 2,003 Increase/(decrease) in other liabilities, accruals and deferred income -426 -1,126 Increase/(decrease) in operational debts 24,580 7,365 (Increase)/decrease in the operating capital 3,030 6,344 Taxes paid -1,750 -3,901 NET CASH FLOW FROM OPERATING ACTIVITIES 36,613 50,760 INVESTMENT ACTIVITIES Acquisition of intangible and tangible non-current assets -25,082 -19,279 Acquisition of shares in participations -520 Total increase in investments -25,602 -19,279 Sale of intangible and tangible non-current assets 818 5,112 Sale of shares in associated companies -3,900 Total decrease in investments 818 1,212 CASH FLOW FROM INVESTMENT ACTIVITIES -24,784 -18,067 FINANCING ACTIVITIES Increase/(decrease) in short-term financial debts -1,367 -1,451 Increase in long-term debts 8,996 921 Repayment of long-term debts -5,632 -33,316 Interest paid interest (via income statement) -1,322 -2,000 Acquisition of non-controlling interest 0 -266 Capital increase (decrease) (**) 2,625 2.791 Dividend paid by parent company (***) -7,177 -7,069 CASH FLOW FROM FINANCING ACTIVITIES -3,877 -40,390 NET CHANGE IN CASH AND CASH EQUIVALENTS 7,952 -7,697 Cash funds at the beginning of the financial year 11,544 19,143 Translation differences -143 98 CASH FUNDS AT THE END OF THE FINANCIAL YEAR 19,353 11,544
Accounting policies for financial reporting and explanatory notes
1. Summary of the key accounting principles
Declaration of conformity
Ter Beke NV (‘the Entity’) is an entity domiciled in Belgium. The Entity’s consolidated financial statements cover the Entity Ter Beke NV and its subsidiaries (further referred to as the ‘Group’). The consolidated financial statements were issued for publication by the Board of Directors on April 20th 2023. The consolidated financial statements were drawn up in accordance with the International Financial Reporting Standards (IFRS) as accepted within the European Union.
The consolidated statements are set out in EUR x 1000. The accounting principles are applied uniformly to the entire Group and are consistent with the previous financial year.
Standards and interpretations applicable to the annual period beginning on january 1st 2022
Adjustments to IAS 37 Provisions, contingent liabilities and contingent assets: onerous contracts - cost to honor the contract
The above mentioned standard does not have a material impact on the balance sheet.
Standards and interpretations published, but not yet applicable to the annual period beginning on january 1st 2022
Amendments to IAS 1 Presentation of Financial Statements and IFRS Practice Statement 2: Disclosures about Accounting Policies, issued Feb. 12, 2021, include minor amendments to improve disclosures related to accounting policies to provide more useful information to investors and other primary users of financial statements. The amendments to IAS 1 require companies to disclose their material accounting policies rather than their significant accounting policies. The amendments to IFRS Practice Statement 2 provide guidance on applying the materiality concept to financial statement disclosures. The adjustments are effective for fiscal years beginning on or after Jan. 1, 2023, with early application permitted. These adjustments have been adopted by the EU.
• Amendments to IAS 8 Accounting policies, changes in estimates and errors: definition of estimates, issued Feb. 12, 2021, clarify how companies should distinguish changes in accounting policies from changes in estimates. The distinction is important because changes in estimates are only applied prospectively to future transactions and other future events, while changes in accounting policies are also generally applied retrospectively to past transactions and other past events.
The adjustments are effective for fiscal years beginning on or after Jan. 1, 2023, with early application permitted. These adjustments have been adopted by the EU.
• Amendments to IAS 12 Income taxes: deferred taxes related to assets and liabilities arising from a single transaction, issued May 7, 2021, clarify how companies should account for deferred taxes on transactions such as leases and decommissioning liabilities.
IAS 12 Income Taxes specifies how an enterprise accounts for income taxes, including deferred taxes. Under certain conditions, companies are exempt from recognizing deferred taxes when they first recognize assets or liabilities. Previously, there was some uncertainty about whether this exemption applied to transactions such as leases and decommissioning liabilities, transactions in which companies recognize both an asset and a liability. The adjustments clarify that the exemption does not apply and that companies must recognize deferred taxes on such transactions. The purpose of the adjustments is to reduce diversity in reporting deferred taxes on lease and decommissioning liabilities
The adjustments are effective for fiscal years beginning on or after Jan. 1, 2023, with early application permitted. These adjustments have been adopted by the EU.
• Amendments to IAS 1 Presentation of Financial Statements
Classification of liabilities as current and non-current (issued January 23, 2020) ;
Classification of liabilities as current and non-current - deferral of effective date (issued July 15, 2020) ; and Non-current liabilities with covenants (issued October 31, 2022)
Amendments to IAS 1 Presentation of Financial Statements:
classification of liabilities as current or non-current, issued January 23, 2020, clarifies a criteria in IAS 1 for classifying a debt as non-current:
it requires that an entity has the right to defer settlement of the liability for at least 12 months after the reporting period.
The amendments: specify that an entity’s right to defer settlement must exist at the end of the reporting period; clarify that the classification is not affected by management’s intentions or expectations about whether the entity will exercise its right to defer settlement; clarify how loan terms affect classification; and include clarification of the requirements for classifying debt that an entity will or can settle by issuing its own equity instruments.
On July 15, 2020, the IASB issued Classification of Debt as Current or Non-current - Deferral of Effective Date (Amendments to IAS 1), delaying the effective date of the above amendments by one year. On Oct. 31, 2022, the IASB issued Long-Term Debt with Covenants, which further amends IAS 1 and specifies that covenants (i.e. conditions specified in a loan agreement) to be met after the reporting period do not affect the classification of a debt as current or non-current at the end of the reporting period. Instead, an entity is required to include information about these covenants in the notes to the financial statements.
All adjustments are effective for fiscal years beginning on or after Jan. 1, 2024, with early adoption permitted. These amendments have not yet been adopted by the EU.
What’s Cooking? Annual report 2022 105 Consolidated financial statements
• Amendments to IFRS 16 Leases: Lease Commitment in a Sale-andLeaseback, issued Sept. 22, 2022, introduce a new model that will affect how a seller-lessee accounts for variable lease payments in a “Sale-and-leaseback transaction”.
Under this new model, a seller-lessee will: recognize estimated variable lease payments when initially valuing a lease liability in a “Sale-and-Leaseback transaction”; and then apply the general rules for subsequent accounting for the lease liability so that no gain or loss is recognized with respect to the right of use it retains.
These changes will not change the accounting for other leases. The amendments are retrospectively effective for fiscal years beginning on or after Jan. 1, 2024, with early application permitted. These amendments have not yet been approved by the EU.
The group does not expect these new amendments to the standards to have a material impact.
Consolidation principles
The consolidated financial statements include the financial data of Ter Beke NV and its subsidiaries, joint venture and associate. A list of these entities is included in note 34.
Subsidiaries included in the consolidation in accordance with the integral method
The following factors are also considered in determining control:
• the purpose and design of the investee;
• what the relevant activities are and how decisions on those activities are made; whether the investor’s rights allow him to direct the relevant activities on an ongoing basis;
• Whether the investor is exposed to, or has rights to, variable returns from its involvement in the investee; and whether the investor has the ability to use its power over the investee to influence the extent of the investor’s returns.
The financial statements of subsidiaries are included in the consolidated financial statements from the date control begins to the date control ends. A list of the group’s subsidiaries is included in Note 34.
Joint ventures
A joint venture is a joint arrangement whereby Ter Beke NV and other parties with joint control over the arrangement have rights to the net assets of the arrangement. Joint ventures are accounted for using the equity method. The company eliminates the net results between the joint venture and the Ter Beke group.
On June 1, 2022, Ter Beke became the owner of 50% of start-up Davai BV. This joint venture, named Davai BV - makes plant-based dumpling snacks under the “Davai” brand and currently sells them in Belgium and the Netherlands. Since Davai BV is accounted for using the equity method, only the 50% of the equity in the balance sheet and the 50% of the net result are presented in the consolidated figures of the Ter Beke group.
Joint ventures (under joint control) are accounted for using the equity method and are measured at cost on initial recognition. That cost of the investment includes transaction costs. Subsequent to initial recognition, the consolidated financial statements include the Group’s share of profit or loss and other comprehensive income of equity accounted investees until the date that significant influence or joint control commences.
Unrealized gains arising from transactions with equity accounted investees are eliminated to the extent of the Group’s interest in the investee. Unrealized losses are eliminated in the same way as unrealized gains, but only to the extent that there is no evidence of impairment.
Business combinations
Business combinations are accounted for using the acquisition method. The cost of an acquisition is measured at the sum of the acquisition-date fair value of the consideration transferred and the amount of non-controlling interest in the acquired entity. For any business combination, the acquirer must measure any non-controlling interest in the acquiree at fair value or at the non-controlling interest’s proportionate share of the acquiree’s identifiable net assets. Acquisition-related costs are recognized immediately in profit or loss as they are incurred.
When the group acquires a business, the group determines the classification and designation of the acquired financial assets and liabilities in accordance with the contractual terms, economic conditions and relevant conditions at acquisition date.
When a business combination is achieved in several stages, the group’s previously held interest is remeasured to fair value at the acquisition date and any gain or loss is recognized directly in profit or loss.
What’s Cooking? Annual report 2022 106 Consolidated financial statements
Any contingent consideration agreement to be transferred by the acquirer is measured at its acquisition-date fair value. Future changes to this fair value recognized as an asset or liability will be recognized in accordance with IAS 32 either in profit or loss or in other comprehensive income. Changes in the fair value of contingent consideration classified as equity are not recognized.
Goodwill is initially recognized as the amount by which (i) the aggregate of the consideration transferred, the amount of any non-controlling interest in the acquiree and the fair value of the acquirer’s previously held equity interest in the acquiree, if any; (ii) exceeds the net balance of the acquisition-date amounts of identifiable assets acquired and liabilities assumed. If, after assessment, the group’s interest in the fair value of the identifiable net assets exceeds the aggregate of the consideration transferred, the amount of any non-controlling interest in the acquiree and the fair value of the acquirer’s previously held equity interest in the acquirer, if any, then the excess should be recognized in profit or loss as a gain on bargain purchase.
After initial recognition, goodwill is recognized as an expense less any accumulated impairment losses. For the purpose of impairment testing, goodwill is allocated to the group’s cash-generating units that are expected to benefit from the synergies of the business combination, without regard to whether any assets or liabilities of the acquired entity were assigned to those cash-generating units.
Cash-generating units to which goodwill has been allocated are tested for impairment annually, and also on an interim basis when there are indications that the carrying amount of the unit may exceed its recoverable amount. If the recoverable amount of a cash-generating unit is less than its carrying amount, the impairment is first deducted from the carrying amount of goodwill allocated to the cash-generating unit. Thereafter, the impairment is allocated to the other fixed assets belonging to the unit in proportion to their carrying amounts. Once an impairment for goodwill has been recognized, it is not reversed in a subsequent period.
On disposal of a cash-generating unit or part of a cash-generating unit, the corresponding portion of goodwill shall be taken into account in determining the gain or loss on disposal. The ‘sold’ goodwill is valued at the relative value of the sold activity and the retained part of the cash-generating unit.
In 2021, the Ter Beke group reached an agreement with Sigma to acquire its activities in Belgium (Imperial) and the Netherlands (stegeman). This acquisition was still pending approval from the Belgian and Dutch competition authorities at the close of the 2022 financial year. Consequently, this new business combination has not yet been included in the group figures for 2022. A separate communication will follow as soon as the group has further information around the approval.
No new business combinations took place in 2021 and 2022. In 2021 the captive Ter Beke Luxembourg was sold to a third party - given the reduced usefulness of external reinsurance, the administrative costs linked to running an insurance activity and the changed market conditions.
Foreign currencies
Foreign currency transactions
In the individual entities of the group, foreign currency transactions are recorded at the exchange rate applicable on the transaction date. Monetary assets and liabilities denominated in foreign currencies are translated at the closing rate applicable at the balance sheet date. Gains and losses resulting from foreign currency transactions and from the translation of monetary assets and liabilities denominated in foreign currencies are recognized in the income statement. Gains or losses on a non-monetary item are recognized in equity. For non-monetary items for which the gain or loss was recognized directly in equity, any foreign exchange component of that gain or loss is also recognized in equity.
Exchange differences arising from a monetary item included in the net investment in a foreign operation are recognized in other comprehensive income in the Group’s consolidated financial statements and are reclassified to profit or loss upon disposal of the net investment.
From 1/1/2022, the Group designated as part of its net investment its receivable from its foreign operation in Poland (in the amount of EUR 10 million) for which no repayment is planned in the near future. From this date, the related translation differences are recognized in other comprehensive income on the line ‘’Translation differences’’. (IAS 21.15)
Financial statements of foreign operations
All foreign operations of the group are located in the Euro zone, except KK Fine Foods Ltd and TerBeke-Pluma UK Ltd in British pounds and Pasta Food Company Sp. Z.o.o. in Polish zloty. The assets and liabilities of these foreign entities, are converted to euro at the exchange rate applicable at the balance sheet date. The income statement of these entities is converted monthly into euro at average rates approximating the exchange rate of the transaction date. Any resulting translation differences are recognized directly through equity.
For the financial statements, we used the following exchange rate:
1 euro equals:
Segment information
IFRS 8 defines an operating segment as a component of an entity whose operating results are regularly reviewed by the entity’s chief operating decision maker to make decisions about resources to be allocated to the segment and assess its financial performance, and for which discrete financial information is available.
What’s Cooking? Annual report 2022 107 Consolidated financial statements
2022 2021 British pound Closing rate 0.8869 0.8403 Average rate 0.87128 0.8601 Polish zloty Closing rate 4.6899 4.5994 Average rate 4.686723 4.5657
In view of its mission, its strategic lines of force and its management structure, Ter Beke has opted as its operational segmentation basis to split up the group’s activities into two business activities (business segments): ‘Processed Meats’ and ‘Prepared Meals’. The ‘Processed Meats’ segment is now called ‘Savoury’. This description, also called ‘hartige producten’ in Dutch, better reflects the broader product portfolio in which the group intends to invest further.
In addition, it provides information for the geographic regions in which the group operates.
Segment profit or loss includes revenue and expenses directly generated by a segment, including the portion of attributable revenue and expenses that can reasonably be allocated to the segment.
Segment assets and liabilities include the assets and liabilities that belong directly to a segment, including the assets and liabilities that are reasonably allocable to the segment.
Davai BV, the startup in which Ter Beke took a 50% stake, is not included in the segment information but is included as ‘unallocated’ since it occupies a separate position within the group.
Intangible assets
Intangible assets are initially measured at cost. Intangible assets are recognized if it is probable that the Entity will enjoy the future economic benefits associated with them and if their cost can be measured reliably. After their initial recognition, intangible assets are measured at cost less accumulated amortization and any accumulated impairment losses. Intangible assets are amortized on a straight-line basis over their best estimated useful lives. The amortization period and the amortization method used are reassessed each year at the close of the reporting period.
Research and development
Expenditure on research activities, undertaken with the prospect of gaining new scientific or technological knowledge, is recognized in the income statement as an expense as incurred. Expenditure on development activities, in which research findings are applied to a plan or design for the production of new or substantially improved products and processes, is capitalized if the product or process is technically and commercially feasible and the group has sufficient resources available for its completion. The capitalized expense includes the cost of raw materials, direct labor costs and a proportionate share of overhead costs. Capitalized development expenditure is measured at cost less accumulated amortization and impairment losses.
All other development expenditures are expensed as incurred. As Ter Beke’s development expenses in 2022 and 2021 did not meet the IFRS criteria for capitalization, these expenses were recognized as an expense in the income statement.
Other intangible assets
Other expenses for internally generated intangible assets, e.g. trademarks, are expensed as incurred. Other intangible assets such as trademark patents, computer software, acquired by the group, are measured at cost less accumulated amortization and impairment losses. In 2022 and 2021 Ter Beke’s consolidated other intangible assets consisted mainly of computer software and the capitalized customer portfolios acquired from the acquisitions.
Depreciation
Intangible assets are amortized using the straight-line method over their expected useful lives from the date they are placed in service.
The depreciation percentages applied are:
Goodwill
We speak of goodwill when the cost of a business combination at the acquisition date exceeds the group’s interest in the net fair value of the acquiree’s identifiable assets, liabilities and contingent liabilities. Goodwill is initially recognized as an asset at cost and is subsequently measured at cost less any accumulated impairment losses.
The cash-generating unit to which goodwill has been allocated is tested for impairment annually. This is also done whenever there is an indication that the unit may be impaired by comparing the carrying amount of the unit with its recoverable amount. If the recoverable amount of the unit is less than the carrying amount, the impairment loss is allocated first to the carrying amount of goodwill allocated to the unit and then to the other assets of the unit in proportion to the carrying amount of each asset in the unit. An impairment loss recognized for goodwill cannot be reversed in a subsequent period. On the sale of a subsidiary or joint venture, allocated goodwill is included in the determination of gain or loss on sale.
What’s Cooking? Annual report 2022 108 Consolidated financial statements
Research and development 33.30% Computer software 20% Brand patents 10% Brand names 10%, 20% Client relationships 7%
Tangible non-current assets
Tangible non-current assets are recognized if it is probable that future economic benefits associated with the asset will flow to the Entity and the cost of the asset can be measured reliably.
Owned tangible non-current assets are stated at cost or manufacturing cost less accumulated depreciation and any accumulated impairment losses. Cost includes, in addition to the purchase price, non-refundable taxes, if applicable, and any directly attributable costs to make the asset ready for use. The manufacturing cost of self-produced property, plant and equipment includes the direct cost of materials, direct manufacturing costs, a proportionate share of the fixed costs of materials and manufacturing, and a proportionate share of the depreciation and write-downs of assets used in manufacture.
Subsequent costs are recognized in the balance sheet in the carrying amount of an asset, or as a separate asset, only when it is probable that future economic benefits associated with it will flow to the group and the cost can be measured reliably. Improvement works are capitalized and depreciated over 4 years. Other repair and maintenance costs are recognized in the income statement in the period in which they are incurred.
Tangible non-current assets are depreciated using the straight-line method from the date of commissioning over their expected useful lives.
The main depreciation rates currently applied are:
rate reflects the present time value of money and the specific risks associated with the asset.
If the recoverable amount of an asset (or cash-generating unit) is estimated to be less than its carrying amount, the carrying amount is reduced to its recoverable amount. An impairment loss is recognized immediately as an expense in the income statement. A previously recognized impairment loss is reversed if there has been a change in the estimates used to determine the recoverable amount, but not to an amount greater than the net carrying amount that would have been determined had no impairment loss been recognized in prior years.
Government subsidies
Government subsidies may only be recognized if there is reasonable assurance that:
• the Group will meet the conditions pertaining to the subsidy; and
• the subsidies will be received.
Government subsidies are systematically recognized as revenues over the periods necessary to attribute these subsidies to the related costs which they are intended to compensate. A government subsidy that is received in compensation for expenses or losses already incurred or for the purpose of providing immediate financial support to the Group without future related costs, is recognized as income in the period in which it is received.
Investment subsidies are deducted from the book value of the asset concerned.
Operating subsidies are recognized if they are received and reported under ‘Other Operating Income’.
Leasing
Land is not depreciated as it is assumed to have an indefinite useful life.
Impairment losses on intangible and tangible assets (other than goodwill): at each reporting date, the Group reviews its carrying amounts of tangible and intangible assets to determine whether there is any indication that an asset may be impaired. If any such indication exists, the recoverable amount of the asset is estimated in order to determine the impairment loss (if any). However, if it is not possible to determine the recoverable amount of an individual asset, the group estimates the recoverable amount for the cash-generating unit to which the asset belongs.
The recoverable amount is the higher of the fair value less costs to sell and its value in use. The value in use is determined by discounting expected future cash flows using a pre-tax discount rate. This discount
IFRS 16 requires lessees since January 1st 2019 to capitalize all lease and rental obligations on the balance sheet. The liability reflects all future lease payments associated with the lease agreement valued at current value. The asset reflects the right to use the asset during the agreed lease term.
The user rights (consisting mainly of the amount of the initial valuation of the lease debt) are valued at cost price and depreciated linearly over their estimated useful life. The user rights are shown on the balance sheet together with the tangible non-current assets under own management and the lease liabilities are shown as short and long term lease liabilities.
Each lease payment is allocated to the lease liability and the financial expenses on the other hand.
What’s Cooking? Annual report 2022 109 Consolidated financial statements
Buildings 2; 3.33; 4 & 5% Installations 5 & 10 % Machines and equipment 14.3; 20 & 33.3 % Furniture and rolling equipment 14.3; 20 & 33.3 % Other tangible non-current assets 10 & 20 %
We use the following practical exemptions, as permitted under IFRS 16:
Use of the previous definition of a lease (as designated by IAS 17) for all contracts existing at the date of first application.
• Use of one ‘incremental borrowing rate’ for a group of leases with the same characteristics.
Use of previous estimates of loss-making lease contracts, rather than testing for impairments.
• All leases with a term of less than 12 months are recognized in the income statement as lease expenses for the financial year. Recognizing all operating lease contracts with a low value as short-term leases.
Lease liabilities are measured as the discounted value of future lease payments over a specified lease term. This calculation takes into account our ‘weighted average incremental borrowing rate’ if the implicit interest rate in the contract cannot be determined. For 2021, our weighted average ‘marginal interest rate’ was 3.35%. (2021: 3,35%)
Inventories
Inventories are valued at the lowest value of the cost or the net realizable value. The cost is calculated based on the average inventory valuation method and the FIFO method. The cost for work in progress and finished products encompasses all conversion costs and other costs incurred to get the inventories to their current location and in their current state. The conversion costs include the production costs and the attributed fixed and variable production over-head costs (including depreciation). The net realizable value is the estimated sales price that the Group believes it will realize when selling inventory in normal business, less the estimated costs of finishing the product and the estimated costs of sales.
Financial assets at amortised cost
Financial assets are classified at amortized cost when the contract has the characteristics of a basic lending arrangement and they are held with the intention of collecting the contractual cash flows until their maturity. Ter Beke’s financial assets at amortized cost comprise trade and other receivables, short-term deposits and cash and cash equivalents in the balance sheet. They are valued at amortized cost using the effective interest method, less any impairments.
Financial assets at fair value
Ter Beke has a call option and the former shareholder of KK Fine Foods has a put option on the remaining 9% of the shares in KK Fine Foods. The option is valued at fair value and is recognized in the financial costs of the income statement.
Impairment of financial assets
At each reporting date, for the financial assets valued at amortized cost (such as trade receivables), Ter Beke assesses whether there are indications for impairment at individual and/or collective level. Receivables deemed uncollectible are written off at each balance sheet date against the corresponding provision. When assessing a collective impairment, the Group uses historical information regarding the loss incurred and adjusts the results if the economic and credit conditions are such that it is probable that the actual losses will be higher or lower than historical trends suggest. Additions to and reversals of the provision for bad debts relating to trade receivables are recognized in the income statement under ‘Write-downs and provisions’.
Bank loans
Interest-bearing bank borrowings and credit excesses are initially valued at fair value and are then valued at the amortized cost price calculated on the basis of the effective interest method. Any difference between the receipts (after transaction costs) and the repayment of a loan is recognized over the loan period, in accordance with the policies for financial reporting regarding financing costs, which are applied by the Group.
Trade liabilities
Trade liabilities are initially booked at fair value and are then valued at the amortized cost price calculated based on the effective interest method. Considering the short-term nature of the trade liabilities in the Group, the trade liabilities are in fact booked at fair value.
Derivatives
The Group uses derivatives to limit risks with regard to unfavorable swings in exchange rates and interest rates arising from operational, financial and investment activities.
The Group does not use these instruments for speculative purposes, does not hold any derivatives and does not issue derivatives for trading purposes. Derivatives are initially valued at cost price and after initial recognition are valued at fair value.
There are three types of hedging relationships:
1. Cash flow hedges: changes in the fair value of derivatives indicated as cash flow hedges are recognized in the shareholders’ equity. The non-effective part is recognized in the income statement. If the cash flow hedges of a firm commitment or an expected future transaction leads to the recognition of a non-financial asset or a non-financial liability at the time the asset or liability is booked, the profits or losses on the derivative financial instrument previously incorporated in the shareholders’ equity are recognized in the initial
What’s Cooking? Annual report 2022 110 Consolidated financial statements
valuation of the asset or liability when it is booked. If the hedge of an expected future transaction leads to the inclusion of a financial asset or a financial liability, the related profits or losses on the derivative financial instrument recognized directly in the shareholders’ equity are transferred to the income statement in the same period or periods in which the acquired asset or the commitment affects the income statement. If it is expected that (part of) the loss incorporated directly into the shareholders’ equity will not be realizable in one or more future periods, the expected non-realizable part is transferred to the income statement. For hedges that do not lead to the recognition of an asset or a liability, the amounts directly included in the shareholders’ equity are transferred to the income statement in the same period or periods in which the hedged expected future transaction affects the profit or loss.
2. Fair value hedges: changes in the fair value of derivatives which were indicated and qualify as fair value hedges are recognized in the income statement, together with any change in the fair value of the hedged asset or the hedged liability which is to be attributed to the hedged risk.
3. Hedges of net investments in foreign entities: hedges of net investments in foreign entities are processed in a similar manner as cash flow hedges. The part of the profit or loss on the hedging instrument, which is deter-mined to be an effective hedging instrument, is recognized immediately in the shareholders’ equity; the profit or loss on the non-effective part is recognized immediately in the income statement. The profit or loss on the hedging instrument regarding the effective part of the hedge, which is directly recognized in the shareholders’ equity, is recognized in the income statement when the foreign entity is divested. The changes in the fair value of derivatives that are not classified can be recognized immediately in the income statement as cash flow hedging.
Dividends
Dividends are recognized as a liability in the period in which they are formally allocated.
Provisions
A provision will be recognized if:
a. The Group has an existing obligation (legally enforceable or effective) as the result of an event in the past;
b. It is likely that an outflow of funds embodying economic benefits will be required to settle the obligation; and
c. The amount of the obligation can be reliably estimated
The amount recognized as a provision must be the best estimate of the expenses required to settle the existing obligation on the balance sheet date.
If the impact is important, provisions are determined by discounting the expected future cash flows, using a discount rate ‘before tax’.
This discount rate reflects the present time value of the money and the specific risks pertaining to the obligation.
A provision for restructuring is made when the Group has approved a detailed and formalized plan for the restructuring and when the restructuring has either commenced or has been announced publicly. No provisions are made for costs relating to the Group’s normal activities. A provision for loss-making contracts will be made when the receivable economic benefits for the Group are lower than the unavoidable cost related to the obligatory quid pro quo.
Employee benefits
Employee benefits comprise all forms of remuneration granted by the Entity in exchange for the services provided by employees. Employee benefits include:
• short-term employee benefits, such as wages, salaries and social security contributions, holiday pay, paid sick leave, profit-sharing and bonuses, and benefits in kind for the current employees; post-employment benefits, such as pensions and life insurance;
• other long-term employee benefits;
• termination benefits.
Retirement benefit plans
The Group provides retirement benefit plans for its employees mainly via defined contribution schemes and has a limited number of defined benefit pension schemes.
Defined contribution schemes
Contributions paid to these defined contribution schemes are recognized immediately in the income statement.
Contributions paid to these defined contribution schemes are recognized immediately in the income statement. By law, defined contribution pension plans in Belgium are subject to minimum guaranteed rates of return. Hence, strictly speaking, those plans classify as defined benefit plans which would require that the ‘projected unit credit’ (PUC) method is applied in measuring the liabilities. However, the IASB recognizes that the accounting for such so-called ‘contribution-based plans’ in accordance with the currently applicable defined benefit methodology is problematic (see also the IFRS Staff Paper ‘Research project: Post-employment benefits’ dated September 2014). Also considering the uncertainty with respect to the future evolution of the mini-mum guaranteed rates of return in Belgium, the Company adopted a retro-spective approach whereby the net liability recognized in the statement of financial position is based on the sum of the positive differences, determined by individual plan participant, between the minimum guaranteed reserves and the accumulated contributions based on the actual rates of return at the closing date (i.e. the net liability is based on the deficit measured at intrinsic value, if any). The main difference between this retrospective approach and the prospective PUC method, is that benefit obligations are calculated as the discounted value of the projected benefits, assuming the minimum guaranteed rates of return currently applicable continue to apply.
What’s Cooking? Annual report 2022 111 Consolidated financial statements
Defined benefit pension schemes
The book value of the defined benefit pension scheme is determined by the present value of the pension payment liabilities, less the past service pension costs not yet recognized and with the fair value of the investments in investment funds. All actuarial gains and losses are recognized in the comprehensive income, so that the full value of the deficit or surplus of the plan is recognized in the consolidated statements. The interest costs and projected revenue of the assets in the plan are shown as net interest.
The present value of the liabilities of the defined benefit plan and the related pension costs are calculated by a qualified actuary in accordance with the PUC method. The discount rate used is equal to the yield on the balance sheet date from corporate bonds of high creditworthiness with a remaining term that is comparable to the term of the Group’s liabilities. The amount recognized in the income statement consists of the pension costs allocated to the year of service, the financing cost, the expected yield from the pension fund investments and the actuarial gains and losses.
Termination benefits
Termination benefits are recognized as a liability and a cost if a Group Entity demonstrably commits itself to either:
• the termination of employment of an employee or group of employees before the normal retirement date;
• the allocation of termination benefits as a result of an offer to encourage voluntary retirement (early retirement scheme).
If termination benefits are due after twelve months following the balance sheet date, then they are discounted at a discount rate equal to the yield on balance sheet date from corporate bonds of high creditworthiness with a remaining term that is comparable to the term of the Group’s liabilities.
Variable pay
The variable pay of clerical staff and management is calculated based on key financial figures and the balanced scorecards. The expected amount of the variable pay is recognized as a cost in the reporting period concerned.
Tax on profits
The tax on profits includes the tax on profits and deferred taxes. Both taxes are recognized in the income statement, except in those cases where it concerns components that are part of the shareholders’ equity. In this latter case, this is recognized via the shareholders’ equity. The term ‘tax on profits’ is taken to mean that which is levied on the taxable income for the reporting period, calculated at the tax assessment rates applicable at the balance sheet date, as well as the adjustments to the tax due over previous reporting periods. Deferred taxes are calculated according to the balance sheet method and arise mainly from the differences between the book value of assets and liabilities in the balance sheet and the tax basis of those assets and liabilities. The amount of deferred tax is based on the expectations regarding the realization of the book value of the assets and liabilities, whereby use is made of the tax assessment rates known on the balance sheet date.
A deferred tax liability is only recognized if it is sufficiently certain that the tax credit and the unused fiscal losses can be set off against taxable profits in the future. Deferred tax assets are reduced as and when it is no longer likely that the tax saving can be realized. Deferred taxes are also calculated on temporary differences arising from participations in subsidiaries, unless the Group can decide on the time when the temporary difference is reversed and it is unlikely that the temporary difference will be reversed in the near future.
As group sales exceed 750 million euros in 2022, country by country reporting formalities will become applicable from fiscal year 2023 onwards. Further GloBE rules (Pilar 2) will also become applicable, from fiscal year 2024 at the earliest.
Revenue
Revenue is recognized if it is likely that the future economic benefits relating to the transaction will accrue to the Entity and the amount of the income can be determined reliably.
Turnover is reported after deduction of turnover taxes and discounts.
Sale of goods
Ter Beke recognizes revenue from the following sources: the supply of products and services. Ter Beke considers the supply of products to be its most important performance obligation. Revenue is recognized at the point in time when control of a product is transferred to a customer. Customers acquire control when the products are supplied (in accordance with the applicable Incoterms). The revenue amount recognized is adjusted for volume discounts. No adjustment is made for returns or for guarantees of any kind, as, based on historical information, their effect is considered immaterial. Breaking down revenue according to the timing of recognition, i.e. at a point in time or over a period, provides little added value as service contracts are immaterial compared to total product sales.
In order to encourage clients to pay immediately, the Group grants discounts for payments in cash. Such discounts are recognized as a reduction in the revenue.
What’s Cooking? Annual report 2022 112 Consolidated financial statements
Financial income
Financial income consists of interest received, dividends received, the exchange rate revenues and the revenues from hedging instruments that are recognized in the income statement.
Interest income
Interest is recognized on a proportional basis that takes account of the effective duration of the asset to which it relates (the effective interest method).
Dividends
Dividends are recognized at the time when the shareholder has been given the right to receive the payment thereof. Exchange rate differences from non-company activities and profits from hedging instruments for non-company activities are also presented under financial income.
Expenses
Expenses per type of cost are shown in the income statement. Expenses that relate to the reporting period or to previous reporting periods are recognized in the income statement, regardless of when the expenses are paid. Expenses can only be transferred to a subsequent period if they comply with the definition of an asset.
Purchases
Purchases of trade goods, raw and auxiliary items, and purchased services are recognized at cost price, after deduction of the permitted trading discounts.
Research and development, advertising and promotional costs and system development costs
Research, advertising and promotional costs are recognized in the income statement in the period in which they were incurred. Development costs and system development costs are recognized in the income statement in the period in which they were incurred if they do not meet the criteria for capitalization.
Financing expenses
Financing expenses include such things as the interest on loans, exchange rate losses and losses on hedging instruments that are recognized in the income statement. Exchange rate differences from non-operating activities and losses from hedging instruments for non-operating activities are also presented under financing costs.
Financial terminology
EBIT
Operating result (earnings before interest and taxation)
EBITDA Operating cash flow
Operating result (EBIT) + depreciation, write-downs and impairments of assets and negative goodwill
UEBIT Operating result (EBIT) before non-underlying expenses and revenues
UEBITDA Operating cash flow before non-underlying expenses and revenues
Operating result before non-underlying costs and revenues (UEBIT) + depreciation, write-downs and impairments of assets and negative goodwill
Non-underlying income and expenses
Operating revenues and expenses related to restructuring, impairments, discontinued operations and other activities, and transactions with a one-off impact
Management assessments and estimates
By applying the Group’s accounting policies, management must make assess-ments, estimates and assumptions regarding the book value of assets and liabilities that are not readily apparent from other sources. These assessments, estimates and assumptions are continually reviewed:
• Critical accounting assessments when applying the entity’s accounting policies:
Key sources of estimation uncertainty: below are the key assumptions regarding the future and other key sources of estimation uncertainty at the end of the reporting period that pose a risk of causing a material adjustment to the book value of assets and liabilities within the next financial year:
Key sources of estimation uncertainty: below are the key assumptions regarding the future and other key sources of estimation uncertainty at the end of the reporting period that pose a risk of causing a material adjustment to the book value of assets and liabilities within the next financial year:
• Management performed an annual impairment test on goodwill relating to ‘processed meats’ and ‘ready meals’ based on the Group’s budget. The Group’s budget will be drawn up for the coming year. A number of assumptions are applied to determine the next 4 years in the total 5-year plan. Sensitivity analyses for reason-able changes in assumptions, such as growth rate, EBITDA margin and discount rate are set out in Note 14 - Goodwill. Deferred tax assets are recognized for the carry-forward of unused tax losses and temporary differences to the extent that it is probable that taxable profit will be available in the foreseeable future. In its assessment, management account of elements such as the budget and tax planning opportunities (see Notes 13 and 18). Provisions for employee benefits: the defined benefit pension liabilities are based on actuarial assumptions such as the discount rate and the expected return on investments in investment funds. For further information, see Note 24 – Employee benefits.
What’s Cooking? Annual report 2022 113
Consolidated financial statements
• The MAP (Mutual Agreement Procedure) filed by Ter Beke with the Dutch and Belgian tax authorities regarding a double taxation that occurred following a tax audit for the 2016 fiscal year has been finalized. Both tax authorities have confirmed that the new transfer pricing model could be effectively applied as of January 1, 2017. The agreement reached by both tax authorities corresponds to the tax position taken by Ter Beke as of December 31, 2021. The uncertainty surrounding the MAP procedure has thus been completely removed. The tax assessment for 0.9 million euros received from the Dutch tax authorities at the beginning of 2022, in the context of the audit of the transfer pricing model for the 2017 fiscal year was also cancelled in the meantime as a consequence of the positive termination of the MAP procedure. As no provision was accrued for it as of December 31, 2021, this remains without accounting impact.
On December 10, 2020, HMRC (the tax authority in the UK) initiated an audit into the processing of remuneration and working hours of employees at KK Fine Foods. The audit was finally settled in the results in 2022 and the provision made as of December 31, 2021 was found to be adequate.
On 23 April 2021 Ter Beke received a request for information from the FSMA regarding the timely notification of the market in the Listeria case. On September 23, 2021, the Group received an additional request for information. On February 25, 2022, the Group received a further request for information. The Group submitted responses to all requests. Meanwhile, on March 8, 2023, the Group received the FSMA auditor’s preliminary determinations. Management retains the provision it had previously made for the costs the Group expects to incur as a result of this investigation. At one of the group’s subsidiaries in Belgium, a social inspection is still ongoing. Although a technical discussion is still ongoing with the authorities, management considers it unlikely that material costs will result from this.
2. Group consolidation
The group’s consolidated financial statements for 2022 include Ter Beke NV and consolidated subsidiaries wholly controlled by Ter Beke (note 34) and one participation over which the group does not exercise full control: KK Fine Foods Limited. In 2021, the group acquired an additional 1% in KK Fine Foods Limited to bring the total to 91%. There is also a participation in a joint venture since 2022, namely Davai BV for 50%.
On June 1, 2021, Ter Beke sold its 100% stake in Ter Beke Luxembourg SA to ITM Enterprises. On this the group recorded a loss of EUR 3,977 thousand. The sale resulted in a cash outflow of EUR 3.9 million in 2021.
On October 7th 2021, Ter Beke reached an agreement with Sigma to acquire its activities in Belgium (Imperial) and in the Netherlands (Stegeman). The proposed transaction has already been approved by the Works Councils. Approval by the Belgian and Dutch competition authorities is still pending at the time of drafting this report. Therefore, the figures for 2022 and 2021 only include the expenses for due diligence and advisory services related to the acquisition: EUR 1.8 million in 2021
and EUR 2.3 million in 2022. As soon as there is more news regarding this proposed transaction, the group will report it through a press release.
On June 1, 2022, the group acquired a 50% stake in the joint venture Davai BV, a startup specializing in making plant-based dumplings.
3. Reporting per segment and geographical region
Ter Beke is a food group. We are a specialist in Europe for the development, production and sale of savoury products and freshly prepared meals. The Ter Beke group employed approximately 3,000 people at the end of 2022. These are the full-time equivalents on December 31, 2022 and the average number of interim employees over 2022. In 2021, there were about 2,750 employees.
The group’s management structure corresponds to its business activities. We are also aligning the internal and external reporting systems with the two existing business segments:
• We have renamed the SBU (strategic business unit) Savoury, which makes savory toppings, “Savoury” (previously: processed meats) because it better reflects our new strategy - in which we wish to offer a wider range of products. The savoury SBU develops, produces and markets a range of fine meats (salami, cooked ham, poultry, cooked meats, pâté, salted meats, tongue and liver cold cuts) and vegetarian and plant-based products.
SBU prepared meals develops, produces and sells freshly prepared meals: lasagna, pizza, pasta dishes and various other dishes and sauces.
Segment results include revenues and expenses directly generated by the segment. This includes revenues and expenses that we can allocate to the segment. We do not allocate financial expenses and taxes to segments.
Segment assets and liabilities include those assets and liabilities that belong directly to a segment, including those that are reasonably allocable to the segment. Segment assets and liabilities are both shown net of tax.
Segment non-current assets are intangible assets, goodwill, property, plant and equipment and financial assets. Segment liabilities are trade, personnel, tax and other liabilities that we can directly allocate to the business segment. We have not allocated all other assets and liabilities to the business segments. They are listed as “unallocated. Assets and liabilities by segment are presented before elimination of inter-segment positions. Market conditions are the basis for ‘inter-segment transfer pricing’. Segment capital expenditure is equal to the cost of assets acquired with an expected useful life of more than one year. In segment reporting, we use the same accounting policies as in the consolidated financial statements.
What’s Cooking? Annual report 2022 114 Consolidated financial statements
In both our SBUs, savoury and prepared meals, we sell our products to a broad customer base. This includes most major European discount and retail customers. The ten largest customer groups represent 67.5% of sales (2021: 69%). We realize sales to these customers through various contracts and products with various maturities. We do this in several countries, both for our own brands and for the customers’ own brands. The group’s customer portfolio is diverse. Nevertheless, it could have an impact on our operations if the relationship with a large customer group came to an end. In 2022 and 2021, three external customers each reached more than 10% (in 2022: 11.5% each / in 2021: 13, 12 and 11% respectively) of consolidated sales. We realized the sales of these customers in both segments.
Consolidated financial statements
(*) Investments including new capital grants
The turnover between the two segments is immaterial. Therefore, we chose to report only the external group turnover.
The Ter Beke group operates in six geographical regions: Belgium, the Netherlands, Great Britain, Germany, France and the rest of Europe. The rest of Europe mainly includes Luxembourg, Denmark, Ireland, Poland, Portugal, Romania, Spain, Sweden and Switzerland.
The breakdown of net sales by region is based on the geographical location of external customers. The breakdown of total assets and investment expenses by region is related to the geographical location of the assets. The investment cost by region is the cost of assets acquired with an expected useful life of more than one year. The customer place of residence, determines the geographic region.
What’s Cooking? Annual report 2022 115
Key data per business segment 2022 2021 Savoury Ready Meals Total Savoury Ready Meals Total SEGMENT INCOME STATEMENT Segment net turnover 442,518 338,867 781,385 422,863 274,043 696,906 Segment results 2,325 11,456 13,781 11,985 17,691 29,676 Non-allocated results -6,134 -12,527 Net financing cost -1,449 -3,652 Taxes -1,589 -6,164 Share in businesses accounted for using the equity method -89 Consolidated result 4,520 7,333 SEGMENT BALANCE SHEET Segment non-current assets 110,575 109,985 220,560 113,790 113,718 227,508 Non-allocated non-current assets 5,166 4,193 Total consolidated non-current assets 225,726 231,701 Segment liabilities 112,785 73,122 185,907 101,039 64,056 165,095 Non-allocated liabilities 218,552 216,710 Total consolidated liabilities 404,459 381,805 OTHER SEGMENT INFORMATION Segment investments (*) 13,732 8,756 22,488 10,988 6,688 17,676 Non-allocated investments 886 1,027 Total investments 23,374 18,703 Segment depreciation and non-cash costs 16,281 10,539 26,820 16,922 10,682 27,604 Non-allocated depreciation and non-cash costs 1,394 1,186 Total depreciation and non-cash costs 28,214 28,790
4. Revenue from sale of goods
Despite difficult market conditions with high inflation putting pressure on purchasing power and the sometimes problematic availability of raw materials, the group realized sales of EUR 781.4 million in 2022 compared to 696.9 in 2021. The 12% increase in sales is the result of a 5% increase in Savoury and 24% in Ready Meals. In the Ready Meals SBU, we are again achieving pre-Covid 19 volumes in our catering business in the UK. Savoury is a slightly declining market in terms of meat products while vegetarian alternatives are still experiencing market growth. The group is making progress with respect to the development of vegetarian and plant-based products.
In the previous fiscal year, 2021 - COVID-19 had an impact on sales. Our catering sales were more volatile in 2021.
5. Trade goods, raw and auxiliary materials
The cost of purchasing raw materials, consumables and trade goods will rise 19% in 2022 from EUR 415.4 million to EUR 495.2 million due to sharply higher raw material prices and general inflation.
In 2021, we reaped the benefits of better purchasing conditions despite rising purchase prices in the market for packaging and ingredients, among others.
In both the first and second halves of 2022, the impact of inflation was very significant. The purchase prices of meat as well as other raw materials such as cheese, milk, durum wheat and vegetables, among others, rose sharply in 2022. Furthermore, we faced strong price increases in packaging due mainly to high energy costs. Drought in certain parts of Europe and crop failures pushed vegetable prices sharply higher, such as those of tomatoes.
6. Services and miscellaneous goods
What’s Cooking? Annual report 2022 116
Key data per geographic region Third party turnover 2022 2021 Belgium 199,972 192,632 Netherlands 330,566 302,610 UK 87,282 63,183 Germany 16,410 17,407 France 65,729 50,686 Other 81,426 70,388 Total 781,385 696,906 Liabilities per region 2022 2021 Belgium 146,111 130,832 Netherlands 106,821 106,962 France 74,296 71,361 UK 41,022 39,311 Other 36,209 33,339 Total 404,459 381,805 Investments per region (*) 2022 2021 Belgium 12,912 10,933 Netherlands 6,479 4,175 France 2,149 1,988 UK 588 521 Other 1,246 1,086 Total 23,374 18,703 Non-current assets 2022 2021 Belgium 82,994 81,660 Netherlands 53,175 55,435 France 36,527 36,247 UK 23,195 26,399 Other 29,835 31,960 Total 225,726 231,701
Consolidated financial statements
(*) Investments including new capital grants
2022 2021 Purchases 504,110 416,058 Change in inventory -8,890 -644 Total 495,220 415,414
2022 2021 Interim staff and consultants to the organisation 24,414 22,925 Maintenance and repairs 23,516 19,523 Cost of marketing and sales 3,102 3,978 Transport costs 30,439 27,910 Gas and electricity 14,620 13,597 Rent 4,685 4,687 Advisory expenses and consultants 13,735 10,206 Other 6,153 7,305 Total 120,664 110,131
Costs increased by 9.6% from EUR 110 million to EUR 121 million. The increase in gas and electricity costs is limited to 7.5% due to the partial hedging of these costs. Transportation costs rose by 9% due to increased fuel and labor costs as well as maintenance and repair costs which increased by 20.5% . Consulting and advisory costs include EUR 2.3 million of costs related to the proposed acquisition of Imperial-Stegeman versus EUR 1.8 million in 2021.
The “Other” account includes office expenses and insurance.
7. Employee expenses
In 2022, personnel costs amounted to EUR 130,826 thousand. In 2021, they were EUR 122,696 thousand. Personnel costs show an increase in 2022, reflecting the increased average number of FTEs employed and slightly increased labor costs in 2022. The number of employees expressed in full-time equivalents exceeds 2,442 FTEs at year-end in 2022 compared to 2,407 FTEs in 2021. Also this year, the group continued to focus on retention, recruitment and selection of employees.
For further details around employee benefits, we refer to note 24. Personnel expenses can be broken down as follows:
9. Other operating income and expenses
Other operating expenses decrease from EUR 6.6 million in 2021 to EUR 2.4 million in 2022. In 2021, these costs were impacted by the one-off EUR 3.9 million capital loss on the sale of the (captive) reinsurance company Ter Beke Luxembourg.
Other operating income stagnated at around EUR 3.6 to 3.8 million. This EUR 3.6 million (in 2022) is mainly composed of one-off income including subsidies and claims received following quality complaints. This is in line with last year.
What’s Cooking? Annual report 2022 117
2022 2021 Wages and salaries 94,986 88,632 Social security contributions 21,725 20,549 Other employee expenses 14,115 13,515 Total 130,826 122,696 Number of employees expressed in FTEs (excl. temporary employees) at year end 2,442 2,407 8. Write-downs and provisions 2022 2021 Write-downs 439 349 on inventories 309 236 on trade receivables 130 113 Provisions -58 -27 Total 381 322
2022 2021 OTHER OPERATING INCOME Recovery of wage-related costs 587 758 Recovery of logistics costs 81 205 Grants 548 812 Profits from the disposal of assets 166 222 Insurance recoveries 130 188 Claims 927 295 Rent 5 78 Recovery local taxes 62 638 Others 1,111 696 Total 3,617 3,892 OTHER OPERATING EXPENSES Local taxes 1,977 2,265 Realised loss on disposal of assets 102 4,034 Claims 29 190 Others 323 129 Total 2,431 6,618 Other operating income and expenses 1,186 -2,726
Result of operating activities 2022 2021 EBITDA 35,861 45,939 Depreciations costs and impairments -27,833 -28,468 Impairments, write offs and provisions -381 -322 Result of operating activities (EBIT) 7,647 17,149 Costs of acquisitions 2,259 1,754 Costs due to change in CEO 875 Impacte sale captive TB Luxemburg 4,238 Underlying operating result (UEBIT) 9,906 24,016 Consolidated
statements
10.
financial
EBITDA declined from EUR 45,939 thousand in 2021 to EUR 35,861 thousand in 2022. Underlying EBITDA decreased by 28% from EUR 52,806 thousand in 2021 to EUR 38,120 thousand in 2022. This reflects the high inflation we faced in 2022 and the indirect impact of the war in Ukraine. The group was able to pass on certain cost inflation to its customers, but with a delay. The group experienced no direct impact from the Russian invasion of Ukraine and stopped its very limited deliveries to Russia. The group was not yet supplying Ukraine while purchases coming indirectly from Ukraine were extremely limited.
Non-underlying expenses of EUR 2,259 thousand in the current year are linked to the proposed acquisition of Imperial - Stegeman. They are 67% lower versus last year (EUR 6,867 thousand in 2021, also linked to the planned acquisition but equally linked to the change in CEO and the sale of the captive reinsurance company Ter Beke Luxembourg).
The group has reviewed, renewed and made more transparent many of its contracts with its customers. Price movements of the main commodities were implemented wherever possible such that future inflation or deflation provide for faster adjustment of sales prices. Contracts without a mutation mechanism are generally of shorter duration, to reduce the risk of cost inflation. Indeed, in 2022, negotiations with key customers resulted in delayed and sometimes incomplete pass-through of increased costs. In certain cases, customer deliveries were temporarily halted due to stiff contract negotiations. However, the impact of this remained limited. The group has also always been mindful of the affordability of its products and remains critical of its cost structure.
In the Ready Meals SBU, sales increased by 24% from EUR 274.0 million to EUR 338.9 million mainly due to the transparent pass-through, albeit delayed, of cost increases and the continued recovery of the foodservice business. Our sales to UK foodservice customers reached pre-covid volumes.
High inflation in the prices of raw materials, consumables, packaging, logistics and energy costs caused a very large and continuous increase in the cost of our products. The continuous pass-through of inflation has been and remains an ongoing concern of the Group, as described above.
The high cost increases and their delayed pass-through, caused a 22% decline in the segment’s underlying EBITDA result, from EUR 28.4 million in 2021 to 22.0 million in 2022. The group continued to invest in new products and the expansion of existing products. Furthermore, the
rollout of the Come a Casa ® brand in Eastern Europe is also on track, thanks in part to the earlier expansion of our facility in Opole, Poland.
The turnover of the Savoury SBU increased from EUR 422.8 million to EUR 442.5 million (+5%), mainly due to the transparent (but delayed) pass-through of cost increases. Volumes in the business unit decreased, mainly as a result of the decline in consumption and the non-renewal of a number of certain contracts.
The total pass-through of cost increases was as already indicated, delayed, after the first half of the year. The confluence of the cost increases - which could only be passed on with a delay - the additional operational efforts to continue serving customers in very difficult market circumstances and the loss of volume resulted in a 27% decline in the segment’s underlying EBITDA result, from EUR 28.9 million in 2021 to EUR 21.0 million in 2022.
The proposed acquisition of Imperial-Stegeman (subject to approval) should enable the Strategic Business Unit to market branded products in addition to its private label products. In addition, Ter Beke also intends to focus increasingly on the production and sale of vegetarian, hybrid (meat and vegetables) and plant-based products, as well as the sale of snacking products in the Benelux and beyond. The planned acquisition would also give these strategic axes an extra push and benefit innovation within the category.
12. Financing expenses
What’s Cooking? Annual report 2022 118 Consolidated financial statements 2022 2021 EBITDA 35,861 45,939 Costs of acquisitions 2,259 1,754 Costs due to change in CEO 0 875 Impacte sale captive TB Luxemburg 0 4,238 Underlying EBITDA 38,120 52,806
2022 2021 Interest income 12 5 Positive exchange rate differences 908 685 Other 385 27 Total 1,305 717
2022 2021 Interest cost on loans 1,099 1,727 Interest cost on leasing 223 273 Negative exchange rate differences 584 1,042 Bank charges 726 841 Revaluation of financial instruments 0 285 Other 122 201 Total 2,754 4,369
11. Financial income
Financial expenses decreased by 37% due, on the one hand, to a decrease in interest expenses by EUR 0.6 million as a result of a further decrease in our financial debt and a decrease in the leverage ratio (net debt to UEBITDA) which allowed us to have a better interest rate for most of the year. The increased EURIBOR and SONIA had only a limited impact towards the end of FY2022. In addition, we recorded a positive foreign exchange result on both the pound and the Polish Zloty and there was a small positive adjustment on the amount yet to be paid for the purchase of the remaining 9% of the shares of KK Fine Foods Ltd.
13. Taxes
Taxes booked in income statement
Taxes in the current fiscal year are 25.6% compared to 45.7% in 2021. In 2021, the group was confronted with high disallowed expenses due to the realized capital loss on the sale of the captive reinsurance company Ter Beke Luxembourg.
The MAP (Mutual Agreement Procedure) filed by Ter Beke with the Dutch and Belgian tax authorities regarding a double taxation that occurred following a tax audit for the 2016 fiscal year was finalized in early 2022. The two authorities confirmed that the new transfer pricing model could effectively be applied as of January 1, 2017. The agreement reached by both authorities corresponds to the tax position held by Ter Beke on December 31, 2021. The assessment for 0.9 million euros received from the Dutch tax authorities at the beginning of 2022 in the context of the audit of the transfer pricing model for the 2017 fiscal year was also cancelled in the meantime as a result of the positive termination of the MAP procedure. As no provision was accrued for this in 2021, this remains without accounting impact.
As of January 2022, the transfer pricing model was also applied to Stefano Toselli and Pasta Food Company. Except for KK Fine Foods, the new transfer pricing model is now applied to all group companies.
Goodwill arises when the cost of a business combination at the acquisition date exceeds the group’s interest in the net fair value of the acquiree’s contingent liabilities, identifiable assets and liabilities.
What’s Cooking? Annual report 2022 119 Consolidated financial statements
2022 2021 Tax on profits Financial year 3,176 3,608 Previous financial years 265 53 Deferred tax liabilities Effect of temporary differences -1,852 2,503 Total tax in the income statement 1,589 6,164
Relationship between tax burden and the accounting profit 2022 2021 Accounting profit before tax 6,198 13,497 Tax at Belgian tax rate (2022: 25% and 2021: 25%) 1,550 3,374 Effect of the different tax rates of the foreign companies -510 872 Effect of not recognising DTA during the financial year 529 1,161 Impacte sale captive TB Luxemburg 0 994 Effect timing differences -485 -435 Effect of the expenses not deductible for tax purposes 524 -4 Other effects: minimum tax -19 202 Actual tax burden 1,589 6,164 Effective tax percentage 25.6% 45.7% 14. Goodwill 2022 2021 GOODWILL Start of the financial year 80,072 79,499 Acquisitions 0 0 Transfers and decommissioning 0 0 Translation differences -461 573 End of the financial year 79,611 80,072 IMPAIRMENTS Start of the financial year 1,740 1,740 Impairment losses 0 0 Transfers and decommissioning 0 0 End of the financial year 1,740 1,740 Net book value 77,871 78,332
The group chose to allocate goodwill to segments. The risk profile of the acquired business combinations to date was almost identical to the existing business, and/or the cash flows were fully connected. What’s more, these business combinations were fully absorbed into the segment from acquisition. This makes it impossible for us to recognize, let alone track, any separate cash flows at a lower level. Management reporting is therefore done at segment level.
The Group performs an annual “impairment analysis” on goodwill. This is done using the discounted cash flow method. If the segment’s recoverable amount is lower than its carrying amount, we first allocate the impairment loss to the carrying amount of goodwill. Then the other assets of the unit come into play, in proportion to the carrying value of each asset in the segment.
In 2022, the goodwill is EUR 33,714 thousand (2021: EUR 33,714 thousand) for Savoury. For ready meals, it is EUR 44,157 thousand (2021: EUR 44,618 thousand). The decrease in SBU ready meals is a translation difference.
The basis for the above “impairment analysis” consists of:
• The budget estimate for the following year of its own operating cash flows. For each segment separately. This budget estimate is the result of a detailed analysis of all known and estimated changes in sales, margins and costs. Both with adaptation to the commercial environment of each segment. Here we strive for a balance between challenge and realism.
Cash flows for the 4 subsequent years were applied as follows: An estimated sales growth of between -3% and 9.2% for SBU savoury and -7.3% and 12.1% for SBU ready meals. The negative evolution in the short term results from a decrease in expected volumes for the coming years given a decrease in consumption of savoury products and the non-renewal of certain contracts (in both segments). The group is confident of a recovery in the years to follow in both segments due to the new strategic emphases that should trigger volume growth.
Inflation expectations were kept low and stable in the simulations because the group assumes that it will pass on inflation or deflation of costs to customers. The same is valid for energy prices. For 2023 and partly for 2024, energy prices are already fixed at admittedly higher prices compared to the past but this was also factored into the expected sales prices and margins. Except for salary and interest rate expectations, no public indices for the future are available for most cost drivers. The estimates involve a “management best estimate” in this regard.
• The estimated EBITDA margin. This margin corresponds to the projections for the coming year and to the long-term targets of each segment.
• We adjust the calculated cash flows for each year with the replacement investments we think we will need to keep the existing production equipment operational. And with the movements in working capital. These differ for each segment.
• We apply a growth rate of 2.1% to calculate residual valuesa value that is also equal to the risk-free rate used in determining the weighted average cost of capital after taxes (WACC).
We discount these cash flows at an estimated average (WACC) of 8.35% (2021: 7.60%). The basis for this calculation is based on the average between the short-term and long-term WACC after tax. The basis for this takes into account a capital cost for equity on the one hand and a cost for debt on the other.
The capital cost of equity considers the following elements
• The risk free rate.
• The Equity Risk Premium based on various market studies.
• A risk premium calculated based on the ‘Guide to Cost of Capital’. The cost of debt capital considers the following elements: A basic interest cost.
• A corporate spread based on the 5-year Euro AAA and BB consumer staples interest rate.
• A tax rate of 27%.
The recoverable amount significantly exceeds the carrying amount in both SBUs.
Therefore, the impairment analysis does not result in any impairment losses in any segment. Overall, we may say that the risk of impairment is higher in the Savoury SBU than in the Ready Meals SBU.
Even when the parameters are estimated more conservatively, the recoverable amount exceeds the carrying amount, so no impairment applies in these scenarios either. Following sensitivity analyses were performed:
Increasing WACC by 170 basis points and reducing long-term growth by 100 basis points;
• Increasing WACC by 170 basis points and reducing EBITDA residual values by 200 basis points.
What’s Cooking? Annual report 2022 120 Consolidated financial statements
What’s Cooking? Annual report 2022 121 Consolidated financial statements
2022 2021 Software Brands, licences and patents Customer relationships R&D Total Software Brands, licences and patents Customer relationships R&D Total ACQUISITION VALUE Start of the financial year 25,555 2,236 24,620 193 52,604 24,679 2,165 23,868 156 50,868 Group consolidation extension 0 0 Acquisitions 261 58 319 883 37 920 Transfers and decommissioning -278 -278 -7 -7 Transfer from / to other entries -6 -6 0 Translation differences -15 -57 -606 -678 0 71 752 823 End of the financial year 25,517 2,179 24,014 251 51,961 25,555 2,236 24,620 193 52,604 DEPRECIATION Start of the financial year 22,621 1,975 7,387 157 32,140 21,305 1,735 5,448 156 28,644 Group consolidation extension 0 0 Depreciation* 1,158 151 1,729 18 3,056 1,314 188 1,740 1 3,243 Transfers and decommissioning -278 -278 -2 -2 Transfer from / to other entries 0 0 Translation differences -10 -52 -201 -263 4 52 199 255 End of the financial year 23,491 2,074 8,915 175 34,655 22,621 1,975 7,387 157 32,140 Net book value 2,026 105 15,099 76 17,306 2,934 261 17,233 36 20,464 The group invested EUR 0.3 million in intangible non-current assets in 2022. In 2021, this was EUR 0.9 million.
15. Intangible non-current assets
Consolidated financial statements
16. Tangible non-current assets
report 2022 122
What’s Cooking? Annual
2022 Land and buildings Installations, machines, and equipment Furniture and rolling equipment Leasing Other Assets under construction Total ACQUISITION VALUE Start of the financial year 126,117 355,520 5,556 17,055 115 163 504,526 Group consolidation extension 0 Acquisitions 3,328 15,639 577 1,387 2,129 23,060 Transfers and decommissioning -48 -4,497 -25 -3,521 -8,091 Transfer from / to other entries 93 7 -94 6 Translation differences -559 -1,247 -66 -3 -4 -1,879 End of the financial year 128,838 365,508 6,049 14,918 115 2,194 517,622 DEPRECIATION Start of the financial year 83,107 280,190 4,283 9,068 103 44 376,795 Group consolidation extension 0 Depreciation * 3,890 18,054 456 2,730 7 0 25,137 Transfers and decommissioning -48 -4,116 -25 -3,149 -7,338 Translation differences -216 -760 -42 -2 -1,020 End of the financial year 86,733 293,368 4,672 8,647 110 44 393,574 IMPAIRMENT Start of the financial year 600 0 0 0 0 0 600 Group consolidation extension 0 Addition* 0 Reduction* -53 -53 Transfers and decommissioning 0 End of the financial year 547 0 0 0 0 0 547 NET CAPITAL GRANTS Start of the financial year 201 1,944 8 0 0 0 2,153 Group consolidation extension 0 New allocations 5 5 Other 0 Depreciation * -47 -256 -4 -307 End of the financial year 159 1,688 4 0 0 0 1,851 Net book value as per 31 December 2022 41,399 70,452 1,373 6,271 5 2,150 121,650
The lines with an * in notes 15 and 16 we include in the income statement, in the amount of depreciation and impairments on non-current assets.
In 2022, the group invested EUR 23.4 million (2021: EUR 18.7 million), of which EUR 23.1 million in tangible non-current assets and EUR 0.3 million in intangible non-current assets. The investments consist mainly of efficiency investments, infrastructure adjustments and sustainability projects at the group’s various sites. The sustainability projects mainly
concern the improvement of our water treatment plants, new refrigeration units and roof insulation that should mainly reduce our energy consumption, new packaging lines that generate less and better recyclable waste.
What’s Cooking? Annual report 2022 123 Consolidated financial statements 2021 Land and buildings Installations, machines, and equipment Furniture and rolling equipment Leasing Other Assets under construction Total ACQUISITION VALUE Start of the financial year 131,777 352,287 5,030 17,403 115 335 506,947 Group consolidation extension 0 Acquisitions 2,965 12,958 601 1,235 84 17,843 Transfers and decommissioning -9,233 -11,084 -179 -1,585 -22,081 Transfer from / to other entries 210 48 -258 Translation differences 608 1,149 56 2 2 1,817 End of the financial year 126,117 355,520 5,556 17,055 115 163 504,526 DEPRECIATION Start of the financial year 83,133 272,229 4,036 7,470 96 0 366,964 Group consolidation extension 0 Depreciation * 3,703 18,069 381 3,009 7 44 25,213 Transfers and decommissioning -3,913 -10,799 -179 -1,411 -16,302 Translation differences 184 691 45 920 End of the financial year 83,107 280,190 4,283 9,068 103 44 376,795 IMPAIRMENT Start of the financial year 1,150 0 0 0 0 0 1,150 Group consolidation extension 0 Addition* 289 289 Reduction* -839 -839 Transfers and decommissioning 0 End of the financial year 600 0 0 0 0 0 600 NET CAPITAL GRANTS Start of the financial year 229 2,133 8 0 0 0 2,370 Group consolidation extension 0 New allocations 60 60 Other 0 Depreciation * -28 -249 -277 End of the financial year 201 1.944 8 0 0 0 2.153 Net book value as per 31 December 2021 42,209 73,386 1,265 7,987 12 119 124,978
Consolidated financial statements
The group is also committed to electrifying its vehicle fleet. 15% of newly commissioned leased cars will be fully electric cars (and 3 hybrid cars) by 2022.
EUR 13.7 million was invested in the Savoury SBU in 2022. Concerns mainly investments in new cooling systems (master cooling plan) to meet the new ecological and legal requirements and reduce our carbon footprint, adjustments to the infrastructure in Veurne and Wommelgem and a new packaging line in Aalsmeer...
In the Ready Meals SBU, EUR 8.8 million was invested in 2022. These include investment in the new “topseal” line at the factory in Poland (a sustainable method of packaging due to the high reduction in plastic) , the implementation of a new method of gratins at our site in France, and replacement investments as well as sustainability projects at the 2 Belgian production sites.
17. Equity method participations
On 1 june, 2022, the Group became a 50% owner of start-up Davai BV. Davai makes plant-based dumpling snacks under the brand “Davai” and currently sells them in Belgium and the Netherlands. Davai also realized an initial retail listing in the first half of 2022.
18. Deferred tax assets and liabilities
The deferred tax assets and liabilities are attributable to the following categories:
In 2022, the group did not recognize EUR 10,949 thousand deferred tax assets on tax loss carryforwards (2021: EUR 9,987 thousand). The group is not sufficiently certain that these will be realized soon. The tax loss carry forward amounts are indefinitely transferable over time.
From 2019, a deferred tax benefit was expressed in relation to Poland for EUR 5 million because Pasta Food Company is located in a reconversion zone. From 2020, a portion of the expressed tax benefit will be reversed annually because Pasta Food Company 2020 closed its fiscal year with a profit. The unexpressed tax benefit is still 2.9 million at the end of 2022 because we are not sure we can realize it. This benefit is limited in time, to 2026.
What’s Cooking? Annual report 2022 124
2022 2021 Joint venture 431 0 Associates Total 431 0 1/6/2022 31/12/2022 Summary financial information Non-current assets 10,665 Current assets 30,827 Debts -63,901 Operating income 32,415 Operating expenses -61,815 Financial result -60 Result before taxes -29,460 Net result -29,460 Reconciliation of the above mentioned financial information regarding the net book value of the net book value of the participating interest. Net assets of the joint venture -22,409 Capital increase 440,000 Group participation percentage in the joint venture 50.00% 208,796 Acquisition price 520,000 520,000 Goodwill 311,204 Share in the result after the acquisition -89,397 Value joint venture 430,603
2022 2021 Tangible non-current assets 4,917 5,631 Receivables
Provisions -92 -146 Debts 790 1,040 Transferred losses 0 Deferred tax liabilities 5,615 6,525 2022 2021 Tangible non-current assets 2,331 2,011 Receivables 0 Provisions 484 611 Debts -157 132 Tax losses carried forward 5,734 5,098 Deferred tax assets 8,392 7,852
0
19. Other long-term receivables
The percentage of trade receivables already due for more than 60 days was 0.1% in 2022 and 0.2% in 2021 (see also Note 25).
To cope with future inflation (deflation) of costs, most new contracts were concluded for a limited time period or contain an automatic indexation for the cost of the main commodities.
22. Cash and cash equivalents
For write-downs on inventories, we refer to note 8.
Inventories are, as expected, higher than last year. They increased by 21.49% to EUR 46.9 million mainly as a result of sharply higher inflation but also as a result of a strategic decision to build larger buffer stocks where possible, given the still reduced rigidity of the supply chain.
21. Trade and other receivables
Cash is held at reputable banks. Cash investments relate to an overnight deposit at a reputable bank.
23. Shareholders’ equity
Dividends
The General Shareholders Meeting of May 25, 2022 approved the Board of Directors’ proposal of a scrip dividend (gross EUR 4.00/share). The shareholders of the group opted for the contribution of their dividend rights in exchange for new shares instead of the payment in cash for 52.26% of their shares entitled to a dividend.
This results for Ter Beke in a strengthening of the equity of EUR 2,625,322 (capital and share premium) through the creation of 26,789 new shares. As a result, the total number of Ter Beke shares as of July 1st 2022 is: 1,821,006. The creation of new shares will also increase the denominator in the calculation of earnings per share for the entire financial year. The remaining dividends were paid out in cash on July 4, 2022. Including total withholding tax, this represents a total cash distribution of EUR 4,551,546. This capital increase reduces the debt ratio by approximately 0.7% compared to a 100% cash dividend payment.
Our trade receivables are non-interest bearing.
The average number of days of customer credit for the group is 46 days (2021: 45 days).
In 2022, we recognized EUR 130 thousand of write-downs on trade receivables as expense in the income statement (EUR 113 thousand in 2021).
The scrip dividend avoids (in proportion to the contribution of dividend rights to Ter Beke’s capital) a cash-out to the company.
What’s Cooking? Annual report 2022 125 Consolidated financial statements
2022 2021 Receivables and securities in cash 76 75 Total 76 75 20. Inventories 2022 2021 Raw and auxiliary items 29,510 22,417 Work in process 6,341 5,794 Finished products 10,619 10,120 Goods for resale 419 265 Total 46,889 38,596
2022 2021 Trade receivables 99,350 86,784 VAT to be reclaimed 3,474 2,762 Taxes to be reclaimed 556 1,004 Adjustment accounts 3,287 3,698 Empties 4,960 5,466 Other 864 250 Total 112,491 99,964
2022 2021 Cash investments 2,733 450 Current accounts 16,609 11,076 Cash 11 18 Total 19,353 11,544
Consolidated financial statements
24. Employee benefits Provisions for pensions and similar liabilities
The group and its subsidiaries provide for pension plans and other employee benefits. At December 31, 2022, the total net liability for pension plans and similar obligations was EUR 3,442 thousand for the group’s Belgian and French companies. At December 31, 2021, this was EUR 3,878 thousand.
On 31 December 2020, this was EUR 3,897 thousand.
126
obligations under IAS 19 Defined benefit plan Other provisions Total provisions 1 January 2021 2,805 1,092 3,897 Group consolidation extension Service costs 1,414 1,414 Interest costs and income 9 9 Actuarial effect by OCI -165 -165 Payments 0 Allocations and redemptions -241 -241 Other -1,036 -1,036 31 December 2021 3,027 851 3,878 Group consolidation extension 0 Service costs 1,178 1,178 Interest costs and income 8 8 Actuarial effect by OCI -441 -441 Payments 0 Allocations and redemptions -22 -22 Other -1,159 -1,159 31 December 2022 2,613 829 3,442 What’s Cooking? Annual report 2022
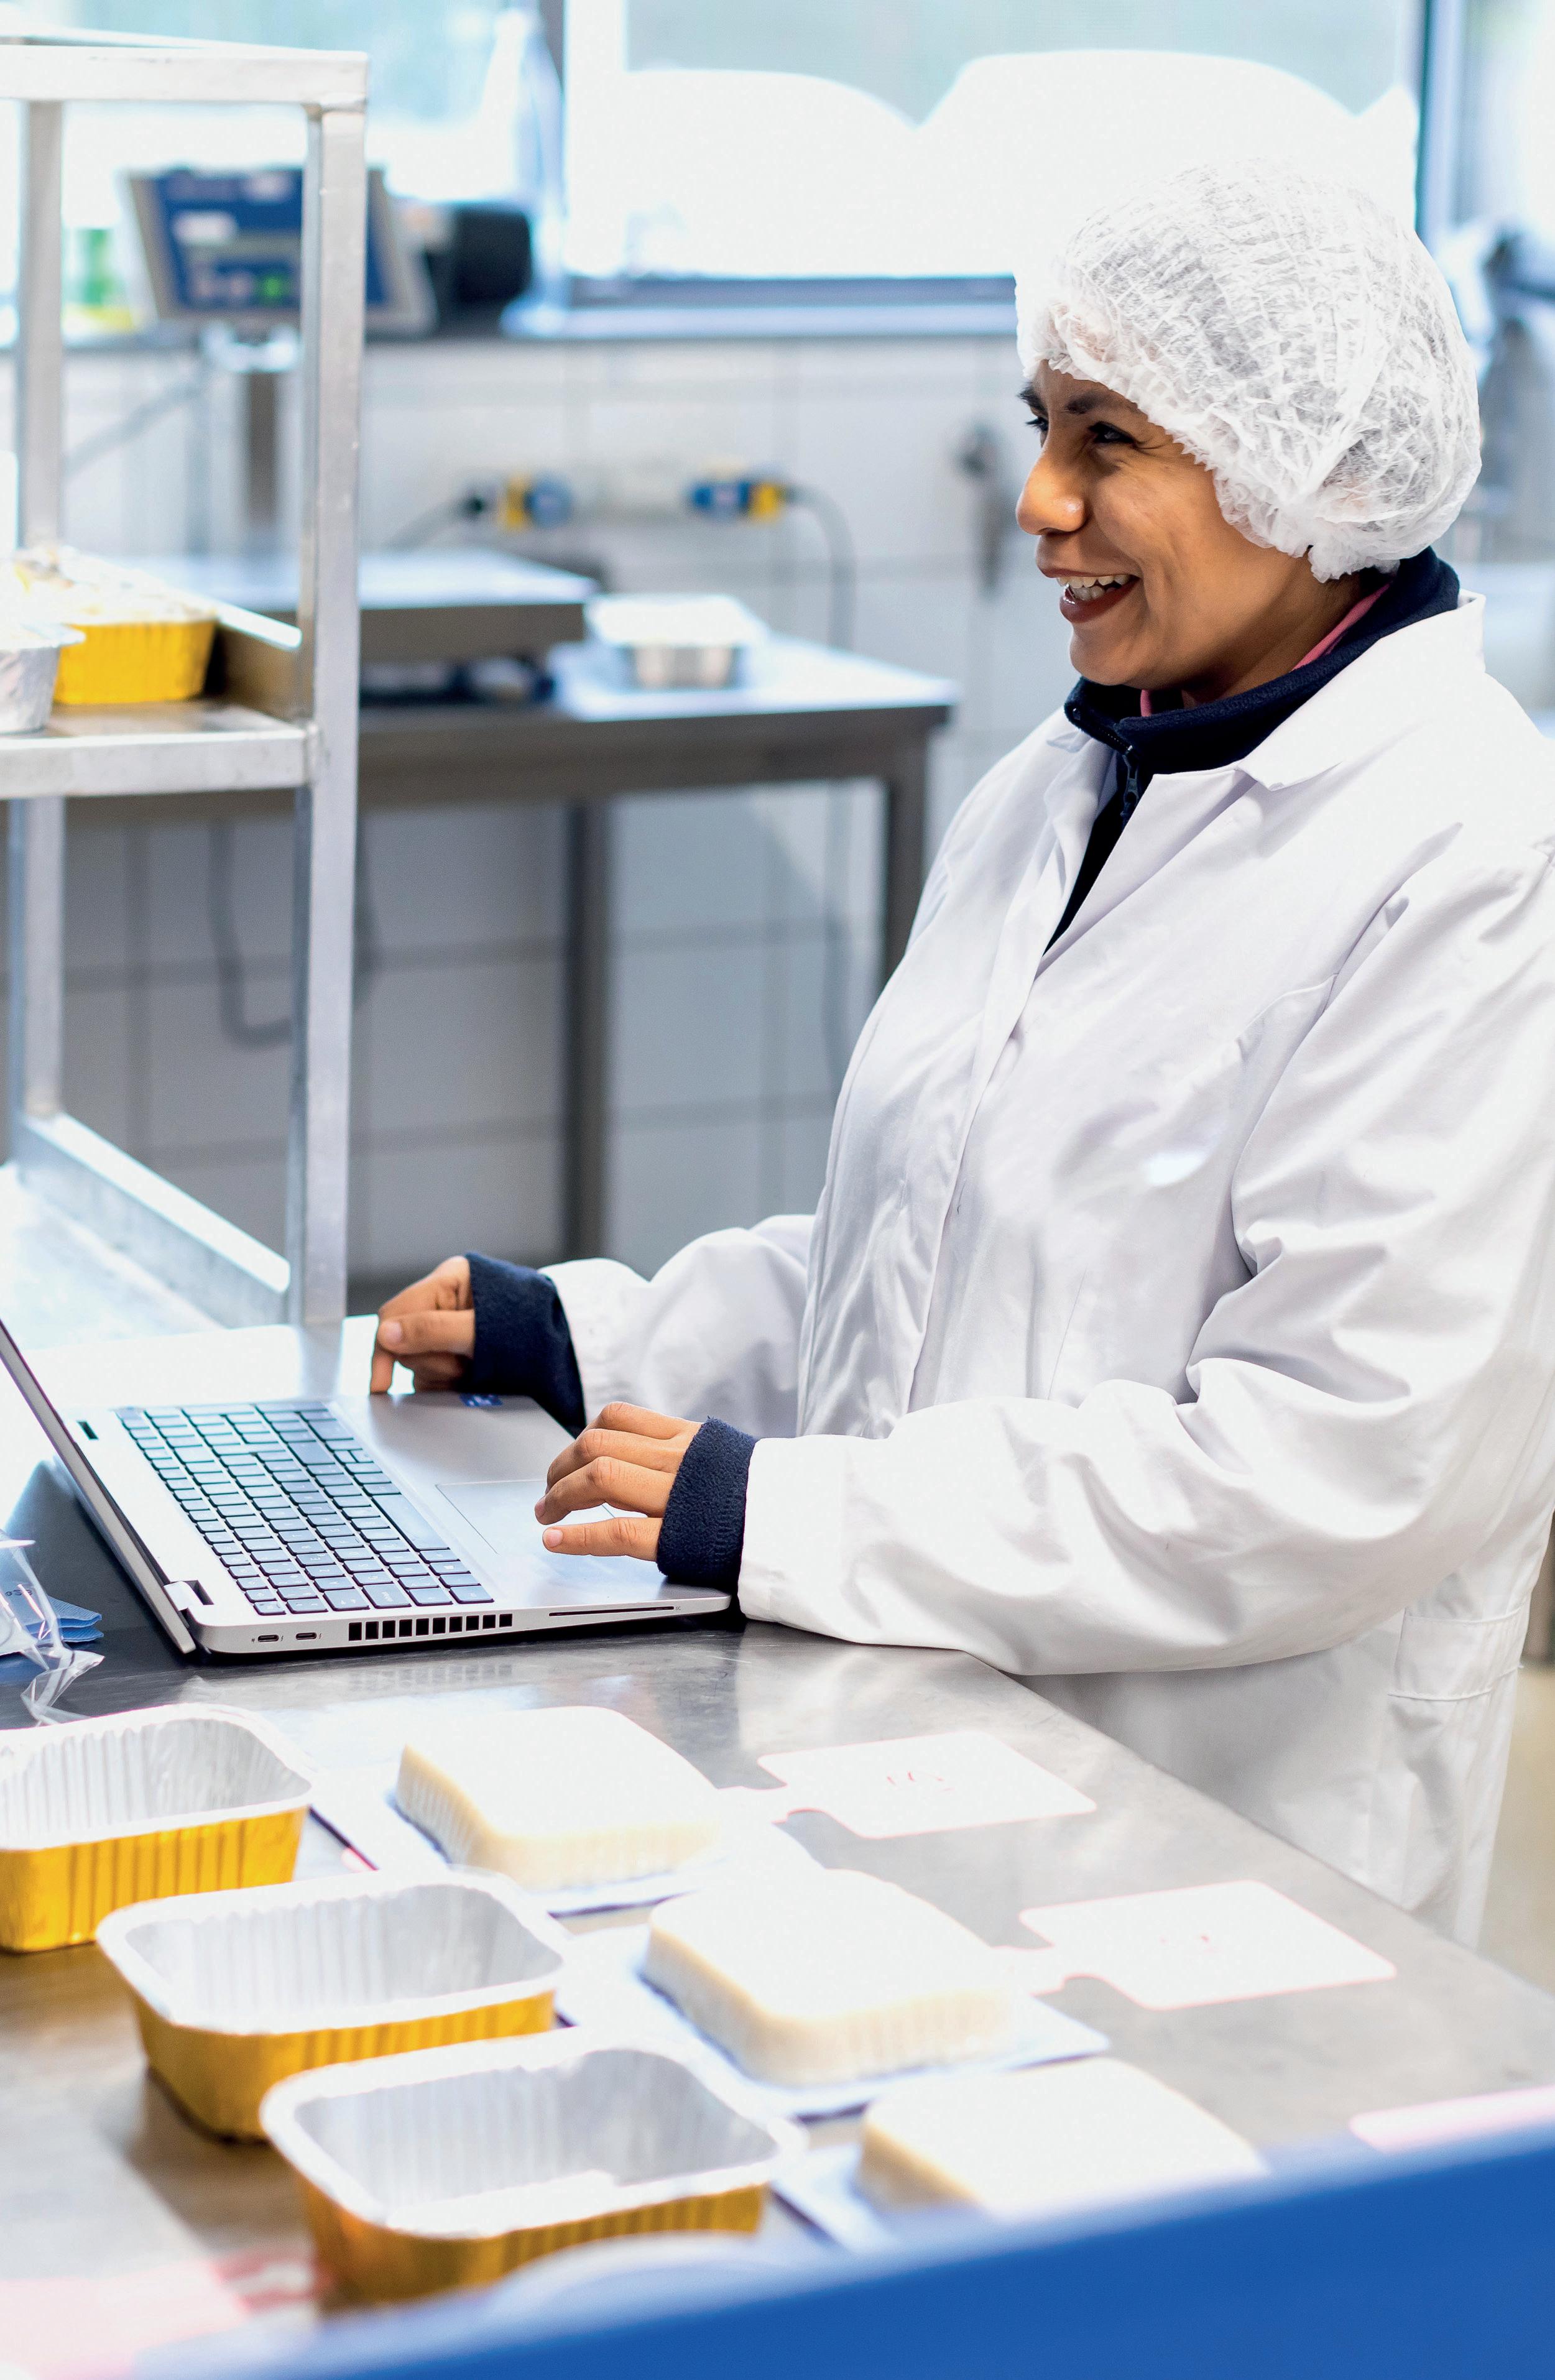
Consolidated financial statements
What’s Cooking? Annual report 2022 128
Employee benefits and provisions for pension and similar obligations 2022 2021 Defined benefit pension schemes Net liability / (asset) 2,613 3,011 Of which liabilities 17,814 24,156 Of which investments in investment funds -15,201 -21,145 Amounts recognised in the income statement: Pension costs allocated to the year of employment 1,178 1,414 Interest cost 8 9 Expected return on investments in investment funds Recognised actuarial (profits)/losses Past service pension costs Losses/ (profits) from curtailments or settlements -10 Administrative expenses 26 24 Cost recognised in the income statement regarding defined benefit pension schemes 1,202 1,447 Amounts allocated to the shareholders' equity via the comprehensive result (OCI) -780 -339 Recognised actuarial (profits)/losses -441 -165 Cumulative of via OCI recognised actuarial results at the beginning of the period -339 -174 Present value of the gross liability at the beginning of the year 24,164 23,280 Impact of PUC method on the Belgian fixed contribution plans Employer's contributions Interest cost 144 115 Pension costs allocated to the year of employment 1,057 1,091 DBO (profit) loss for the period -5,983 143 Other -1,568 -465 Present value of the gross liability at the end of the year 17,814 24,164 Fair value of the investments in investment funds at the beginning of the year -21,145 -20,474 Expected employer's contributions -1,104 -1,131 Expected employee's contributions -39 -38 Expected benefits paid (excl. interest) 1,989 1,429 Expected return on investments in investment funds Expected taxes on contributions paid 119 122 Expected administrative expenses 24 24 Expected value of the investments in investment funds at the end of the year -20,156 -20,068 Fair value of the investments in investment funds to the beginning of the year -21,145 -20,474 Impact of PUC method on the Belgian fixed contribution plans Actual employer's contributions -1,157 -1,072 Actual employees contributions -37 -36 Actual benefits paid 1,589 705 Interest revenue -135 -106 Actual taxes on contributions paid 127 119 Actual administrative expenses 26 23 Actuarial profit (losses) on the investments in investment funds 5,533 -366 Fair value of the investments in investment funds at the end of the year -15,199 -21,207 Plan assets gain (loss) due to experience adjustments -2 62 Fair value of the investments in investment funds at the end of the year -15,201 -21,145
The primary actuarial assumptions are:
25. Interest-bearing liabilities
Defined contribution schemes
Ter Beke companies pay contributions to publicly or privately managed pension or insurance funds. Subject to the application of the law of December 18, 2015, the group companies have no further payment obligations once the contribution has been paid. Indeed, the minimum guaranteed reserves are covered by the value of plan assets.
The minimum guaranteed returns obtained (cf. Law Dec. 18, 2015):
• For contributions paid after January 1, 2016: here the OLO interest rate determines the variable minimum yield. This ranges from 1.75% to 3.75%.
For contributions paid at the end of 2015: here the statutory rate of return continues to apply until employees retire, i.e. 3.25%, and 3.75%.
These pension plans guarantee a minimum rate of return. We therefore consider them to be defined benefit plans.
Every year, Ter Beke has a full actuarial calculation performed. This is done according to the PUC method. The analysis of the pension plans shows a limited difference between the legally guaranteed minimum return and the interest guaranteed by the insurance institution. At the end of 2022, this net liability amounts to EUR 36 thousand (2021: EUR 93 thousand).
The periodic contributions represent a cost of the year in which the related rights are acquired. In 2022, this cost amounts to EUR 4,075 thousand (2021: EUR 2,892 thousand).
We recognize costs for IAS 19 under personnel expenses. We recognize the interest component in the financial result.
Other provisions
Other provisions in 2022 and 2021 consisted mainly of severance payments and a provision in favor of employees in the Netherlands to meet additional costs due to changes in place of employment and the provision for additional remuneration of the CEO and other members of the executive committee.
What’s Cooking? Annual report 2022 129 Consolidated financial statements
2022 2021 Belgium France Belgium France Discount rate 3.60% 3.80% 0.16% 0.65% Future salary increases including inflation 2.60% 3.35% 2.10% 2.10% Inflation 2.20% 2.95% 1.70% 1.70%
2022 Maturity period Within the year Between 1 and 5 years After 5 years Total Interest-bearing liabilities Credit institutions 340 80,086 0 80,426 Lease liabilities 2,452 4,231 6,683 Total 2,792 84,317 0 87,109 2022 Maturity period Within the year Between 1 and 5 years After 5 years Total Other liabilities 0 0 0 2021 Maturity period Within the year Between 1 and 5 years After 5 years Total Interest-bearing liabilities Credit institutions 2,725 74,156 0 76,881 Lease liabilities 2,854 5,572 8,426 Total 5,579 79,728 0 85,307 2021 Maturity period Within the year Between 1 and 5 years After 5 years Total Other liabilities 0 4,387 4,387
25.1. Loans from credit institutions
The loans from credit institutions in 2022 include:
• At present, the group has no current loans with a fixed interest rate.
• EUR 80,426 thousand long-term credits, where the interest rate is regularly revised for agreed periods of less than one year
• The costs of setting up the RCF (Revolving Credit Facility) amounted to EUR 0.7 million, were amortized over the term of the RCF (5 years).
• The Revolving Credit Facility with a consortium of three banks was extended during 2022 for a period of 2 years, until June 30, 2025. The limited interest rate hedges on the RCF expire mid-2023.
The loans from credit institutions in 2021 include:
Long-term term loans with a fixed interest rate amounting to EUR 1,357 thousand
• Long-term loans amounting to EUR 74,156 thousand for which interest rates are regularly reviewed for agreed periods of less than one year Short-term loans for agreed periods of less than one a year amounting to EUR 1,368 thousand
• The costs of setting up the RCF (Revolving Credit Facility- amounted to EUR 0.7 million and were amortized over the duration of the RCF (5 years).
At the end of 2022, the group has EUR 6,683 thousand in leasing debts compared with EUR 8,426 thousand in 2021. For the renewals for rolling stock used in production since 2019, the group is moving to purchasing rather than leasing equipment.
Interest on loans from credit institutions - level at the end of the fiscal year:
The group has sufficient short-term credit lines to meet its short-term needs. The group has not pledged any assets to meet its obligations to credit institutions. It has also not received any guarantees from third parties.
On June 26, 2018, Ter Beke completed a long-term financing with a consortium of 3 banks in the form of a Revolving Credit Facility (RCF) with a term of 5 years and the option to extend by 2 years. This extension option has since been exercised in 2022. As a result, the group has EUR 175 million in guaranteed credit lines. The RCF is conditional on respecting a net financial debt/adjusted EBITDA ratio of 3.0. In case of
new acquisitions, a temporary excess to 3.5 will be accepted.
Ter Beke has extended its RCF for a period of 2 years, at the same conditions as the existing agreement. The new end date of the RCF is now June 27, 2025.
In 2020, to ensure the group’s continued liquidity during the Covid 19 crisis, the group had proactively adjusted its covenants under the EUR 175 million RCF. Hereby, the net debt/adjusted EBITDA leverage covenant ratio (all excluding IFRS 16) was adjusted to 4.25 for 30/6/2021 and 3.75 for 31/12/2021. Furthermore, a temporary liquidity covenant was agreed under which the group must maintain a liquidity headroom of at least EUR 20 million each for the period to 31/12/2021. The liquidity headroom is calculated by comparing the net debt, excluding leasing debts, with the total available credit on the balance sheet date, excluding leases. At 31/12/2022, the liquidity headroom amounts to EUR 138 million.
The Group met its covenants in both 2022 and 2021.
What’s Cooking? Annual report 2022 130
Consolidated financial statements
2022 2021 outstanding loan amount on 31/12/2022 Interest % outstanding loan amount on 31/12/2021 Interest % loans with fixed interest rate Leningen in EURO 0.00 K EUR 1,357.00 K EUR 1.26% Loans with variable interest rate Loans in EURO 70,000 K EUR 3.35% 70,000 K EUR 0.55% Loans in EURO 8,000 K EUR 2.50% loans in pounds 1,635 K EUR 4.07% 2,975 K EUR 0.55% Loan KK Fine Foods in Pounds 791 K EUR 5.65% 1,181 K EUR 6.65% Minimum payments to credit institutions (including interest) are: 2022 2021 Less than 1 year 2,989 1,808 More than 1 year and less than 5 years 85,348 74,631 More than 5 years 0 0
25.2. Lease liabilities:
The group leases its cars and some trucks under a number of operating leases. At the end of 2010, the group entered into an operating lease agreement for a new state-of-the-art ‘value added logistics platform’ in Wijchen. There, Ter Beke centralizes the slicing activities of Langeveld-Sleegers and the Dutch logistics activities.
The new standard IFRS 16 (cf. standards and interpretations applicable from January 1, 2019) requires the lessee to capitalize all lease and rental obligations on the balance sheet. The liability reflects all future lease payments associated with the lease agreement valued at present value. The asset reflects the right to use the asset during the agreed lease term.
Ter Beke has applied IFRS 16 effective January 1, 2019, in accordance with the transitional provisions, using the modified retrospective method. Specifically, this means that the cumulative effect of the application of IFRS 16 is included as an adjustment to the opening balance of the retained earnings as of 1 January 2019, without adjustment of comparative figures.
As a result of the adoption of IFRS 16, we recognized leasing liabilities for leases previously classified as operating leases in accordance with IAS 17. These lease payables were measured at the present value of the remaining lease obligations, and discounted at our “marginal interest rate” applicable at January 1, 2019. Our weighted average “marginal interest rate” used to measure the lease payables as of January 1, 2019 was 3.35%.
What’s Cooking? Annual report 2022 131 Consolidated financial statements 31/12/21 Cash Flow non-cash adjustments 31/12/22 Acquisitions opening balance IFRS 16 Exchange rate adjustment fair value adjustment Long term interest-bearing liabilities Credit institutions 74,156 6,121 -191 80,086 Lease liabilities 5,572 -1,340 -1 4,231 Short term Interest-bearing liabilities Credit institutions 2,725 -2,385 340 Lease liabilities 2,854 -402 2,452 other long term non-interest bearing liabilities Other short non-interest bearing liabilities 4,387 -4,052 -156 -179 0 Total 0 4,052 -71 3,981 89,694 1,994 0 0 -419 -179 91,090 31/12/20 Cash Flow non-cash adjustments 31/12/21 Acquisitions opening balance IFRS 16 Exchange rate adjustment Fair value adjustments Long term interest-bearing liabilities Credit institutions 99,803 -25,739 92 74,156 Lease liabilities 7,070 -1,502 4 5,572 Short term Interest-bearing liabilities Credit institutions 8,529 -6,065 261 2,725 Lease liabilities 3,384 -540 10 2,854 Other long non-interst bearing liabilities 3,861 276 250 4,387 Other short non-interest bearing liabilities 266 -278 12 0 Total 122,913 -33,846 -278 0 655 250 89,694
26. Other long-term liabilities
In 2021, the heading other long-term liabilities still included the put/call option entitling the minority shareholder to sell its interests in KK Fine Foods for EUR 4,387 thousand. On the other hand, Ter Beke can also exercise the option to purchase. This liability has been transferred to other current liabilities (see item 27.) because the option can be exercised from 2023 to 31 December 2026 and the group expects that the option will actually be exercised in 2023. See also the section ‘important events after balance sheet date’.
The option contract with the Ter Beke group stipulates the conditions. These data are not based on public market figures. Therefore this liability classifies according to level 3, in accordance with IFRS 13.
27. Trade liabilities and other debts
which GBP 2.5 million. Ter Beke wishes to limit its interest risk by hedging if the Board of Directors considers hedging advantageous. To this end, on November 30, 2018, it entered into a floored IRS with maturities at the end of each quarter for a notional amount of EUR 10 million, and an option for the same notional amount with a strike of 1% at the same maturities. On January 11 and 14, 2019 respectively, the group entered into 2 additional floored IRS contracts with the other 2 participating banks of the club deal with maturities at the end of each quarter amounting to a notional amount of EUR 10 million each, and an option for the same notional amount with a strike of 1% at the same maturities. This interest hedging expires on June 27 and June 30, 2023, respectively. No interest hedges have been taken for the time being for the period after June 30, 2023.
Most trade payables have a maturity date of 60 or 45 days from invoice date.
As explained in note 26, the EUR 3,981 thousand call/put option related to the 9% non-controlling interest in KK Fine Foods has been transferred to short-term debt as it can be exercised annually as from 2023 with ultimate maturity December 31, 2026. See also the section ‘significant events after the balance sheet date’.
28. Risks arising from financial instruments
Interest rates and exchange rates involve risks. This exposure is a normal consequence of the Group’s activities. We use derivative financial instruments to reduce these risks. Group policies prohibit the use of derivative financial instruments for speculative purposes.
Interest risk
Interest rate risk is the risk of fluctuations in the value of a financial instrument due to changes in market interest rates.
Ter Beke is exposed to the risk of interest rate fluctuations on its entire external financing under the RCF. On December 31, 2022, the amount drawn down under the RCF is EUR 79.6 million of which GBP 1.6 million. On December 31, 2021, the amount drawn down was EUR 73 million, of
Exchange rate risk
Foreign exchange risk lies in the potential fluctuations in value of financial instruments due to exchange rate fluctuations. The group incurs foreign exchange risk on sales, purchases and interest-bearing loans expressed in a currency other than the company’s local currency. At December 31, 2022, the group had a net position in GBP of 6,409 thousand. At December 31, 2021, it was GBP 4,353 thousand. An overview of our hedging can be found in the table below. In Poland, at December 31, 2022, we had a net position in Polish Zloty of PLN 9,506 thousand . At December 31, 2021, this was a net debt position of PLN 2,747 thousand.
Credit risk
Credit risk is the risk that one of the contracting parties will default on its financial obligations, which may cause the other party to incur a loss. In our SBUs savoury and ready meals, we sell our products to a broad customer base. This includes most major European discount and retail customers. We achieve sales to these customers through various
What’s Cooking? Annual report 2022 132 Consolidated financial statements
2022 2021 Trade liabilities 153,143 132,341 Dividends 87 87 Put/call option 3,981 0 Other 4,945 5,704 Total 162,156 138,132 Of which empties 4,354 4,354
Hedging interest rate risk on RCF Trade date Maturity date Initial notional Interest Rate Swap 14/01/19 27/06/23 10,000,000.00 Interest Rate Cap 14/01/19 27/06/23 10,000,000.00 Cap 30/11/18 30/06/23 10,000,000.00 Floor 30/11/18 30/06/23 10,000,000.00 Interest Rate Swap 30/11/18 30/06/23 10,000,000.00 Cap 11/01/19 27/06/23 10,000,000.00 Floor 11/01/19 27/06/23 10,000,000.00 Interest Rate Swap 11/01/19 27/06/23 10,000,000.00
Contract date Maturity date Contract type Initial notional 22/11/2022 28/04/2023 Flexiterm £2,000,000.00 12/12/2022 12/06/2023 Flexiterm £1,000,000.00 7/07/2022 5/04/2023 Accumulateur protégé £1,000,700.00
contracts and products with various maturities. We do this in several countries, both for our own brands and for customers’ own brands. The ten largest customer groups represent 67% of sales (2021: 69%). In both 2022 and 2021, 3 external customers exceeded the 10% mark of consolidated sales, each with sales of 11.5% (13, 12 and 11%, respectively). We realized the sales of these customers in both segments. Management worked out a credit policy. We continuously monitor exposure to credit risk.
• Credit risk on trade receivables: we continuously monitor credit risk on all customers.
Credit risk on cash and short-term investments: short-term investments are made in readily marketable securities or in fixed-term deposits with reputable banks.
• Transactions with derivative financial instruments: transactions with derivative financial instruments are only permitted with counterparties that have high credit ratings.
For all these exposures except some of the customers at KK Fine Foods Limited, the balance sheet total is the maximum credit risk.
Trade receivables are subject to normal payment terms.
At closing date, there are no significant outstanding past due amounts.
Level 1: market prices in active markets for identical assets or liabilities
Level 2: inputs other than Level 1 that are observable for the asset or liability, directly (via prices) or indirectly (derived from prices)
Level 3: inputs that are not based on observable market prices The value of the put/call option is based on the estimated discounted future value of the company on the date we estimate that the option will be exercised.
The value of the put/call option is based on the estimated discounted future value of the company on date we estimated the option will be lifted.
What’s Cooking? Annual report 2022 133 Consolidated financial statements
2022 2021 Total outstanding client receivables 99,350 86,784 Overdue < 30 days 4,457 4,662 Overdue between 30 and 60 days 833 1,105 Overdue > 60 days 46 178 Consolidated balance sheet Note 2022 2021 as at 31 December 2022 and 2021 Book value Fair value Book value Fair value Current assets Trade and other receivables 21 112,491 112,491 99,484 99,484 Cash and cash equivalents 22 19,353 19,353 11 ,544 11 ,544 Long-term liabilities Long-term interestbearing liabilities 25 84,317 84,317 79,728 79,728 Other long-term liabilities 0 0 4,387 4,387 Consolidated balance sheet Note 2022 2021 as at 31 December 2022 and 2021 Book value Fair value Book value Fair value Current liabilities Current interestbearing liabilities 25 2,792 2,792 5,579 5,579 Trade liabilities and other payables 27 162,156 162,156 138,132 138,132 Assets and liabilities measured at fair value: hierarchy 2022 Level 1 Level 2 Level 3 Fair value Trade and other receivables 711 711 Other long-term liabilities 4,008 27 3981 Assets and liabilities measured at fair value: hierarchy 2021 Level 1 Level 2 Level 3 as at 31 December 2020 Fair value Trade and other receivables 68 68 Other long-term liabilities 4,387 4,387 Other short-term liabilities 282 282
Liquidity risk
Liquidity risk is the risk that the group cannot meet its financial obligations. The group mitigates this risk by permanently monitoring cash flows. We also ensure that sufficient credit facilities are available. See also note 25.
On June 26, 2018, Ter Beke completed a long-term financing with a consortium of 3 banks in the form of a Revolving Credit Facility (RCF). The term of the RCF is 5 years, with a possible extension of 2 times 1 year. As a result, the group has EUR 175 million in guaranteed credit lines, potentially extendable to EUR 250 million. No guarantees were provided for this RCF. The RCF is conditional on respecting a net financial debt for application of IFRS16/adjusted UEBITDA ratio of 3. In case of new acquisitions, a temporary excess up to 3.5 is accepted.
Ter Beke extended its RCF in 2022 for a period of 2 years, at the same conditions as the existing agreement. The new end date of the RCF is now June 27, 2025.
As of December 31, 2022, a total amount of EUR 79.6 million was drawn down of which 1.6 million in GBP at a variable interest rate. This covenant is tested each time on the 30/06 and 31/12 figures. In 2022 and 2021, the group has met its covenants.
29. Leasing
The group leases its passenger vehicles under a number of operating leases. At the end of 2010, the group entered into an operating lease agreement for a new state-of-the-art ‘value added logistics platform’ in Wijchen. There, Ter Beke centralizes the slicing activities of LangeveldSleegers and the Dutch logistics activities.
IFRS 16 requires the lessee to capitalize all lease and rental obligations on the balance sheet. The liability reflects all future lease payments associated with the lease agreement valued at current value. The asset reflects the right to use the asset during the agreed lease term.
As a result of the adoption of IFRS 16, we recognized lease payables for leases previously classified as operating leases in accordance with IAS 17. These lease payables were measured at the present value of the remaining lease obligations, and discounted at our “marginal interest rate” applicable at January 1, 2019. Our weighted average “marginal interest rate” used to measure the lease payables as of January 1, 2019 was 3.35%.
30. Off-balance sheet rights and obligations
At December 31, 2022, total purchase commitments for major investment projects amounted to EUR 4,742 thousand (2021: EUR 16,397 thousand). For these, we already awarded contracts or placed orders.
At December 31, 2022, the group had no significant outstanding purchase commitments with other suppliers (2021: EUR 3,600 thousand).
To limit the impact of increased energy prices, the group set up a hedging strategy whereby parts of energy requirements are hedged as the period approaches The group purchases its energy by country. Thus, 2023 is now fully hedged for all production sites, albeit at significantly higher prices compared to the past.
31. Transacties met verwante partijen
Transactions with directors and members of the executive committee
The Remuneration and Nomination Committee prepared Ter Beke’s compensation policy. The board of directors approved it. The remuneration of the executive directors and members of the executive committee is structured in a fixed and a variable part. The variable part is subject to an evaluation by the remuneration and nomination committee and to long-term incentives such as a pension plan. Since January 1, 2006, we have included the remuneration policy as an integral part of the Corporate Governance Charter.
The remuneration of the members of the board of directors and executive management for the financial year 2022, we summarize in the table below.
For details, we refer to the remuneration report in the Corporate Governance Statement (see above).
Transactions with other parties
Transactions with related parties are primarily commercial transactions. They are based on the “at arm’s length” principle. The costs and revenues of these transactions are immaterial in the consolidated financial statements.
In 2022, we received no reports from directors or management on related transactions, as stipulated in the Corporate Governance Charter.
What’s Cooking? Annual report 2022 134 Consolidated financial statements
Transactions with Directors of Ter Beke NV: in EUR million 2022 2021 Remuneration to Board of Directors Ter Beke NV for the execution of their mandate 0.31 0.29 Transactions with members of the Executive Committee of Ter Beke NV: in EUR million 2022 2021 Short-term employee benefits 2.1 2.21 Post-employment benefits Other long-term employee benefits 0.17 Termination benefit 0.78 Share-based payments
32. Result per share
Basic earnings per share
The calculation of basic earnings per share is based on:
the net income attributable to ordinary shareholders of EUR 4,221 thousand (2021: EUR 7,346 thousand)
• a weighted average number of ordinary shares outstanding during the year of 1,807,722 (2021: 1,780,860)
We calculated the weighted average number of ordinary shares outstanding as follows:
33. Impact of business combinations
In 2021, an agreement was reached on October 7 with Sigma to acquire its operations in the Netherlands (Stegeman) and its operations in Belgium (Imperial). As of 31/12/2022, we are still awaiting approval from the relevant competition authorities.
In 2022, the Group did not make any new acquisitions falling within the definition of “business combination.
At December 31, 2022, the capital is represented by 1,821,006 shares. On July 1, 2022, the capital was increased by incorporation of 36.6% of dividend rights (EUR 2,625 thousand) instead of a cash payment.
Diluted earnings per share
In calculating diluted earnings per share, we adjust the weighted average number of shares. We take into account all dilutive potential common shares. There are none in 2022 and 2021.
What’s Cooking? Annual report 2022 135 Consolidated financial statements
2022 2021 Number of outstanding ordinary shares on 1 January financial year 1.794.217 1,767,281 Effect of ordinary shares issued Weighted average number of outstanding ordinary shares on 31 December financial year 1.807.722 1,780,860 Group share in net profit of financial year 4.221 7,346 Average number of shares 1.807.722 1,780,860 Earnings per share 2.33 4.12
2022 2021 Net group earnings 4,221 7,346 Average number of shares 1,807,722 1,780,860 Dilution effect warrant plans 0 0 Adjusted number of shares 1,807,722 1,780,860 Diluted earnings per share 2.33 4.12 2022 2021 Average number of shares 1,821,006 1,794,217 Dividend per share 4 4 Total dividend 7,284,024 7,176,868
Consolidated financial statements
34. Group companies
In 2022, the group purchased a 50% stake in start-up Davai BV. This participation was accounted for using the equity method given that it involves joint control.
In 2021, the group sold its reinsurance company Ter Beke Luxembourg.
The parent company of the group, Ter Beke NV- Beke 1 - 9950 Lievegem in Belgium, is at December 31, 2022 directly or indirectly the parent company of the following
There are no significant restrictions on the ability of the Company or subsidiaries to have access to the use of the assets and meet the obligations of the Group.
See also note 35 ‘events after the balance sheet date’ regarding the participation in KK Fine Foods Ltd and the merger of Terbeke-pluma
What’s Cooking? Annual report 2022 136
Name and full address of the company Effective holding in % TerBeke-Pluma NV - Antoon Van der Pluymstraat 1, 2160 Wommelgem - België 100 Pluma NV - Antoon Van der Pluymstraat 1, 2160 Wommelgem - België 100 Ter Beke Vleeswarenproduktie NV - Beke 1, 9950 Lievegem - België 100 Heku NV - Ondernemingenstraat 1, 8630 Veurne - België 100 TerBeke-Pluma UK Ltd - Addlestone Road, Bourne Business Park, Addlestone, Surrey KT15 2LE – UK 100 Pluma Fleischwarenvertrieb GmbH - Krefelder Strasse 249 - 41066 Mönchengladbach - Duitsland 100 TerBeke-Pluma Nederland BV - Bijsterhuizen 24/04, 6604 LL Wijchen - Nederland 100 Berkhout Langeveld BV - Bijsterhuizen 24/04, 6604 LL Wijchen - Nederland 100 Langeveld/Sleegers BV - Bijsterhuizen 24/04, 6604 LL Wijchen - Nederland 100 H.J. Berkhout Verssnijlijn BV - Scheepmakerstraat 5 , 2984 BE Ridderkerk – Nederland 100 Offerman Borculo B.V. - Parallelweg 21, 7271 VB Borculo 100 Offerman Aalsmeer B.V. - Turfstekerstraat 47, 1431 GD Aalsmeer 100 Ter Beke Immo NV - Beke 1, 9950 Lievegem - België 100 FreshMeals NV - Beke 1, 9950 Lievegem - België 100 Les Nutons SA - Chaussée de Wavre 259 A, 4520 Wanze - België 100 Come a Casa SA - Chaussée de Wavre 259 A , 4520 Wanze - België 100 FreshMeals Nederland BV - Bijsterhuizen 24/04, 6604 LL Wijchen - Nederland 100 FreshMeals Ibérica SL - Vía de las Dos Castillas , 33 - Complejo Empresarial Ática, Edificio 6, Planta 3a - Officina B1, 28224 Pozuelo de Alarcón, Madrid - Spanje 100 Ter Beke France SA - ZI Espace Zuckermann - BP56 - 14270 Mézidon-Canon - Frankrijk 100 Pasta Food Company Sp. z.o.o. - Ul. Północna 12 - 45-805 Opole - Polen 100 Stefano Toselli SAS - ZI Espace Zuckermann - BP56 - 14270 Mézidon-Canon – Frankrijk 100 KK Fine Foods LTD - Estuary House 10th Avenue - Zone 3 Deeside Industrial Park – Deeside – Flintshire - CH5 2UA - United Kingdom 91 FreshMeals Deutschland GmbH -Krefelder Strasse 249 - 41066 Mönchengladbach - Deutschland 100 Davai BV Stationstraat 114 - 9260 Wichelen (Schellebelle)- België 50
companies:
Nederland BV.
35. Important events after balance sheet date
The minority shareholders of KK Fine Foods Ltd exercised their put option in March 2023. The Group acquired the 9% remaining shares in KK Fine Foods Ltd and became a 100% shareholder of KK Fine Foods Ltd in 2023. The value of the option at December 31, 2022 matches the acquisition price. (cfr. Notes 26 and 27).
• The group announced the intention to change the name of the parent company and its subsidiaries on March 7, 2023. This name change of the parent company will be submitted to the extraordinary general meeting in April 2023. If approved, the name but also the ticker of the parent company will change.
• The acquisition of Imperial-Steegeman was still pending approval from competition authorities at the end of 2022. If there are further updates in the approval process in the Netherlands or Belgium, the group will communicate this through a press release.
• In early 2023, the group decided to proceed with a merger of its commercial Savoury operations in the Netherlands. In this context, the company Terbeke-Pluma Nederland BV merged with the company Berkhout-Langeveld BV.
36. Statutory auditor’s fees
For the audit of the Ter Beke Group in 2022, the statutory auditor charged EUR 283 thousand in fees and EUR 10 thousand for non-audit services. The companies with which the statutory auditor has a partnership did not invoice any additional fees to the Group in 2022.
What’s Cooking? Annual report 2022 137
Consolidated financial statements
Abbreviated financial statements of Ter Beke NV
What’s Cooking? Annual report 2022 138
1. Balance sheet 2022 2021 Non-current assets 170,721 188,826 I. Formation Expenses 0 II. Intangible non-current assets 0 III. Tangible non-current assets 2,314 2,612 IV. Financial non-current assets 168,407 186,214 Current assets 132,899 94,789 V. Amounts receivable after 1 year 0 VI. Inventories 0 VII. Amounts receivable within one year 120,060 90,264 VIII. Cash investments 0 0 IX. Cash and cash equivalents 11,688 3,168 X. Accrued income and deferred charges 1,151 1,357 TOTAL ASSETS 303,620 283,615 Shareholders’ equity 95,056 101,656 I. Capital 5,153 5,077 II. Share premiums 57,044 54,495 IV. Reserves 3,360 3,360 Statutory reserves 649 649 Reserves not available for distribution 1,457 1,457 Untaxed reserves 679 679 Reserves available for distribution 575 575 V. Transferred result 29,499 38,724 Provisions and deferred taxes 125 0 Provisions for risks and costs 125 0 Deferred taxes Debts 208,439 181,959 X. Debts payable after 1 year 79,635 72,975 XI. Debts payable within 1 year 128,804 108,977 XII. Accrued charges and deferred income 0 7 TOTAL LIABILITIES 303,620 283,615
Consolidated financial statements
The valuation and translation rules for the statutory financial statements of the parent company comply with Belgian standards (BE GAAP). The consolidated financial statements were prepared in accordance with IFRS. Both valuation rules differ significantly from each other.
The statutory auditor has issued an unqualified opinion on the statutory financial statements of Ter Beke NV.
The following documents are published in accordance with the statutory provisions and can be obtained free of charge: the integral version of the statutory financial statements, the unqualified auditor’s report and the non-consolidated annual report, which is not included in the integral version.
What’s Cooking? Annual report 2022 139 Consolidated financial statements
Income statement 2022 2021 Operating income Turnover 16,724 20,300 Change in inventory Produced non-current assets Other operating income 16,724 20,300 Operating costs 22,265 16,838 Trade goods, raw and auxiliary items Services and miscellaneous goods 15,592 10,431 Remuneration, social security costs and pensions 5,473 5,173 Depreciation and write-downs on intangible and tangible noncurrent assets 1,067 1,269 Write-downs on inventory and trade receivables 0 Provisions for risks and costs 125 -293 Other operating costs 8 258 Operating result -5,541 3,462 Financial income 6,472 7,742 Financial charges -2,857 -2,592 Result from ordinary business operations before tax -1,926 8,612 Profit before tax -1,926 8,612 Tax on profits -15 -337 Result for the financial year after tax -1,941 8,275
2.
Consolidated financial statements
Consolidated key figures 2018-2022
report 2022 140
What’s Cooking? Annual
2022 2021 2020 2019 2018 Consolidated income statement Revenue (net revenue) 781,385 696,906 717,422 728,132 680,460 EBITDA 35,861 45,939 37,140 37,243 44,036 Result of operating activities (EBIT) 7,647 17,149 4,839 6,205 16,218 Result after taxes before share in the result of enterprises is accounted for using the equity method 4,609 7,333 -2,463 4,415 7,241 Earnings after taxes (EAT) 4,520 7,333 -2,463 4,415 7,241 Net cash flow 32,823 36,123 29,838 35,453 35,059 Consolidated balance sheet and financial structure Non-current assets 225,726 231,701 245,108 252,148 243,591 Current assets 178,733 150,104 156,492 186,874 181,387 Equity 120,573 121,445 116,578 124,176 125,028 Total of balance sheet 404,459 381,805 401,600 439,022 424,978 Net financial debts 67,756 73,763 99,909 124,434 122,679 Net financial debts / Equity 56.2% 60.7% 85.7% 100.2% 98.1% Equity/Total of balance sheet 29.8% 31.8% 29.0% 28.3% 29.4% Stock and dividend information Number of shares 1,821,006 1,794,217 1,767,281 1,732,621 1,732,621 Average number of shares 1,807,722 1,780,860 1,749,951 1,732,621 1,732,621 Average stock price (December) 87.82 118.24 112.59 104.45 120.60 Basic profit per share 2.33 4.09 1.41 2.55 4.15 Diluted profit per share 2.50 4.09 1.41 2.55 4.15 EBITDA per share 19.84 25.80 21.22 21.50 25.42 Net cash flow per share 18.16 20.28 17.01 20.57 20.27 Dividend per share 4.00 4.00 4.00 4.00 4.00 Payout ratio 172.57% 97.70% -296.28% 164.04% 96.50% Dividend return (December) 4.60% 3.40% 3.60% 3.80% 3.30% Valuation Market capitalisation (December) 159,921 212,148 198,978 180,972 208,867 Net financial debt 67,756 73,763 99,909 124,434 122,679 Market value of the company 227,677 285,911 298,887 305,406 331,546 Market value / Result 50.4 39.0 -121.4 69.2 46.0 Market value / EBITDA 6.3 6.2 8.0 8.2 7.5 Market value / Net cash flow 6.9 7.9 10.0 8.6 9.5
Declaration by the responsible persons
The undersigned, Piet Sanders°, managing director, and Yves Regniers*, chief financial officer (CFO), declare that, to the best of their knowledge:
The financial statements for fiscal year 2022 and 2021, prepared in accordance with the International Financial Accounting Standards (IFRS) as applied by the European Union, provide a reliable view of the assets, financial situation and results of Ter Beke NV and of the companies included in the consolidation.
• The annual report provides a reliable overview of the development, the results and the position of Ter Beke NV and of the companies included in the consolidation. The annual report also provides a fair description of the main risks and uncertainties with which they are confronted.
Yves Regniers*
Piet Sanders° Chief Financial Officer Managing Director
* Permanent representative BV Esroh ° Permanent representative BV Leading For Growth
What’s Cooking? Annual report 2022 141 Consolidated financial statements
Report from the Statutory Auditor on the consolidated annual accounts
Ter Beke NV on the consolidated financial
31 December 2022
Basis for our unqualified opinion
In the context of the statutory audit of the consolidated financial statements of Ter Beke NV (“the Company”) and its subsidiaries (jointly “the Group”), we provide you with our statutory auditor’s report. This includes our report on the consolidated financial statements for the year ended 31 December 2022, as well as other legal and regulatory requirements. Our report is one and indivisible.
We were appointed as statutory auditor by the general meeting of 27 May 2021, in accordance with the proposal of the board of directors issued on the recommendation of the audit committee and as presented by the workers’ council. Our mandate will expire on the date of the general meeting deliberating on the annual accounts for the year ended 31 December 2023. We have performed the statutory audit of the consolidated financial statements of the Group for 2 consecutive financial years.
Report on the consolidated financial statements
Unqualified opinion
We have audited the consolidated financial statements of the Group as of and for the year ended 31 December 2022, prepared in accordance with IFRS Standards as issued by the International Accounting Standards Board and as adopted by the European Union, and with the legal and regulatory requirements applicable in Belgium. These consolidated financial statements comprise the consolidated balance sheet as at as at 31 December 2022, the consolidated income statement and the consolidated overview of the comprehensive income, consolidated statement of changes in equity and the consolidated cash flow statement for the year then ended and notes, comprising a summary of significant accounting policies and other explanatory information. The total of the consolidated balance sheet amounts to EUR 404.459 (000) and the consolidated income statement shows a profit for the year of EUR 4.520 (000).
In our opinion, the consolidated financial statements give a true and fair view of the Group’s equity and financial position as at 31 December 2022 and of its consolidated financial performance and its consolidated cash flows for the year then ended in accordance with IFRS Standards as issued by the International Accounting Standards Board and as adopted by the European Union, and with the legal and regulatory requirements applicable in Belgium.
We conducted our audit in accordance with International Standards on Auditing (“ISAs”) as adopted in Belgium. In addition, we have applied the ISAs as issued by the IAASB and applicable for the current accounting year while these have not been adopted in Belgium yet. Our responsibilities under those standards are further described in the “Statutory auditors’ responsibility for the audit of the consolidated financial statements” section of our report. We have complied with the ethical requirements that are relevant to our audit of the consolidated financial statements in Belgium, including the independence requirements.
We have obtained from the board of directors and the Company’s officials the explanations and information necessary for performing our audit.
We believe that the audit evidence we have obtained is sufficient and appropriate to provide a basis for our opinion.
Key audit matters
Key audit matters are those matters that, in our professional judgement, were of most significance in our audit of the consolidated financial statements of the current period. These matters were addressed in the context of our audit of the consolidated financial statements as a whole, and in forming our opinion thereon, and we do not provide a separate opinion on these matters.
Impairment of goodwill
We refer to Note 14 ‘Goodwill’ of the consolidated financial statements.
Description
As described in Note 14 – ‘Goodwill’ of the consolidated financial statements, the Company has recorded a goodwill for an amount of 77.871 (000) EUR as per 31 December 2022. Goodwill is assessed for impairment on an annual basis in accordance with IAS 36 “Impairment of Assets”. Management prepares an analysis in which the recoverable amount is assessed by discounting future cashflow projections at the level of the cash generating units. This recoverable amount is compared to the carrying amount at balance sheet date in order to determine if goodwill is impaired as well as the level of impairment charge to be recognized, if any.
What’s Cooking? Annual report 2022 142
financial statements
Consolidated
Statutory auditor’s report to the general meeting of
statements as of and for the year ended
Due to its significance to the balance sheet total and the significant degree of judgement required by management in developing the estimate, which mainly relates to the inputs used in forecasting as well as discounting the future cash flows in order to determine the recoverable amount, we determined impairment of goodwill as a key audit matter.
Our audit procedures
We have performed the following audit procedures:
We assessed the process of cash flow forecasting by management, including testing the underlying calculations and reconciling them to financial targets and plans approved by the board of directors;
• We analysed management’s ability to forecast cash flows accurately and challenged the reasonableness of current forecasts by comparing the key assumptions to historical results;
• We evaluated the Group’s valuation methodology and its determination of discount rates and terminal growth rates by involving valuation specialists in our audit team;
We challenged the appropriateness of the sensitivity analysis around the key assumptions used in determining and discounting cash flow expectations, in particular discount rates and growth rates; and
• We evaluated the completeness and appropriateness of the Group’s disclosures in respect of impairment, as included in note 14 to the consolidated financial statements.
Board of directors’ responsibilities for the preparation of the consolidated financial statements
The board of directors is responsible for the preparation of these consolidated financial statements that give a true and fair view in accordance with IFRS Standards as issued by the International Accounting Standards Board and as adopted by the European Union, and with the legal and regulatory requirements applicable in Belgium, and for such internal control as board of directors determines, is necessary to enable the preparation of consolidated financial statements that are free from material misstatement, whether due to fraud or error.
In preparing the consolidated financial statements, the board of directors is responsible for assessing the Group’s ability to continue as a going concern, disclosing, as applicable, matters related to going concern and using the going concern basis of accounting unless the board of directors either intends to liquidate the Group or to cease operations, or has no realistic alternative but to do so.
Statutory auditor’s responsibilities for the audit of the consolidated financial statements
Our objectives are to obtain reasonable assurance as to whether the consolidated financial statements as a whole are free from material misstatement, whether due to fraud or error, and to issue an auditor’s report that includes our opinion. Reasonable assurance is a high level of assurance, but is not a guarantee that an audit conducted in accordance with ISAs will always detect a material misstatement when it exists. Misstatements can arise from fraud or error and are considered material if, individually or in the aggregate, they could reasonably be expected to influence the economic decisions of the users taken on the basis of these consolidated financial statements.
When performing our audit we comply with the legal, regulatory and professional requirements applicable to audits of the consolidated financial statements in Belgium. The scope of the statutory audit of the consolidated financial statements does not extend to providing assurance on the future viability of the Group nor on the efficiency or effectivity of how the board of directors has conducted or will conduct the business of the Group. Our responsibilities regarding the going concern basis of accounting applied by the board of directors are described below.
As part of an audit in accordance with ISAs, we exercise professional judgement and maintain professional skepticism throughout the audit. We also perform the following procedures:
• Identify and assess the risks of material misstatement of the consolidated financial statements, whether due to fraud or error, design and perform audit procedures responsive to those risks, and obtain audit evidence that is sufficient and appropriate to provide a basis for our opinion. The risk of not detecting a material misstatement resulting from fraud is higher than for one resulting from error, as fraud may involve collusion, forgery, intentional omissions, misrepresentations, or the override of internal control;
• Obtain an understanding of internal controls relevant to the audit in order to design audit procedures that are appropriate in the circumstances, but not for the purpose of expressing an opinion on the effectiveness of the Group’s internal control;
• Evaluate the appropriateness of accounting policies used and the reasonableness of accounting estimates and related disclosures made by board of directors;
Conclude on the appropriateness of board of directors’ use of the going concern basis of accounting and, based on the audit evidence obtained, whether a material uncertainty exists related to events or conditions that may cast significant doubt on the Group’s ability to continue as a going concern. If we conclude that a material uncertainty exists, we are required to draw attention in our auditors’ report to the related disclosures in the consolidated financial statements or, if such disclosures are inadequate, to modify our opinion. Our conclusions are based on the audit evidence obtained up to the date of our auditors’ report. However, future events or conditions may cause the Group to cease to continue as a going concern;
What’s Cooking? Annual report 2022 143 Consolidated financial statements
• Evaluate the overall presentation, structure and content of the consolidated financial statements, including the disclosures, and whether the consolidated financial statements represent the underlying transactions and events in a manner that achieves fair presentation;
• Obtain sufficient appropriate audit evidence regarding the financial information of the entities or business activities within the Group to express an opinion on the consolidated financial statements. We are responsible for the direction, supervision and performance of the group audit. We remain solely responsible for our audit opinion.
We communicate with the audit committee regarding, among other matters, the planned scope and timing of the audit and significant audit findings, including any significant deficiencies in internal control that we identify during our audit.
We also provide the audit committee with a statement that we have complied with relevant ethical requirements regarding independence, and to communicate with them all relationships and other matters that may reasonably be thought to bear on our independence, and where applicable, related safeguards.
For the matters communicated with the audit committee, we determine those matters that were of most significance in the audit of the consolidated financial statements of the current period and are therefore the key audit matters. We describe these matters in our auditor’s report unless law or regulation precludes public disclosure about the matter.
Other legal and regulatory requirements
Responsibilities of the Board of directors
The board of directors is responsible for the preparation and the content of the board of directors’ annual report on the consolidated financial statements.
Statutory auditor’s responsibilities
In the context of our engagement and in accordance with the Belgian standard which is complementary to the International Standards on Auditing as applicable in Belgium, our responsibility is to verify, in all material respects, the board of directors’ annual report on the consolidated financial statements, and to report on these matters.
Aspects concerning the board of directors’ annual report on the consolidated financial statements
Based on specific work performed on the board of directors’ annual report on the consolidated financial statements, we are of the opinion that this report is consistent with the consolidated financial statements for the same period and has been prepared in accordance with article 3:32 of the Companies’ and Associations’ Code.
In the context of our audit of the consolidated financial statements, we are also responsible for considering, in particular based on the knowledge gained throughout the audit, whether the board of directors’ annual report on the consolidated financial statements contains material misstatements, that is information incorrectly stated or misleading. In the context of the procedures carried out, we did not identify any material misstatements that we have to report to you.
The non-financial information required by article 3:32 §2 of the Companies’ and Associations’ Code has been included in the board of directors’ annual report on the consolidated financial statements. The Company has prepared this non-financial information based on UN Sustainable Development Goals. In accordance with art 3:80 §1, 1st paragraph, 5° of the Companies’ and Associations’ Code, we do not comment on whether this non-financial information has been prepared in accordance with the mentioned UN Sustainable Development Goals.
Information about the independence
• Our audit firm and our network have not performed any engagement which is incompatible with the statutory audit of the consolidated accounts and our audit firm remained independent of the Group during the term of our mandate.
• The fees for the additional engagements which are compatible with the statutory audit referred to in article 3:65 of the Companies’ and Associations’ Code were correctly stated and disclosed in the notes to the consolidated financial statements.
European Single Electronic Format (ESEF)
In accordance with the draft standard on the audit of compliance of the Financial Statements with the European Single Electronic Format (hereafter “ESEF”), we have audited as well whether the ESEF-format is in accordance with the regulatory technical standards as laid down in the EU Delegated Regulation nr. 2019/815 of 17 December 2018 (hereafter “Delegated Regulation”).
What’s Cooking? Annual report 2022 144 Consolidated financial statements
The Board of Directors is responsible for the preparation, in accordance with the ESEF requirements, of the consolidated financial statements in the form of an electronic file in ESEF format (hereafter “digital consolidated financial statements”) included in the annual financial report.
It is our responsibility to obtain sufficient and appropriate information to conclude whether the format and the tagging of the digital consolidated financial statements comply, in all material respects, with the ESEF requirements under the Delegated Regulation.
In our opinion, based on our work performed, the format of and the tagging of information in the English version of the digital consolidated financial statements as per 31 December 2022, included in the annual financial report of Ter Beke NV, are, in all material respects, prepared in compliance with the ESEF requirements under the Delegated Regulation.
Other aspect
• This report is consistent with our additional report to the audit committee on the basis of Article 11 of Regulation (EU) No 537/2014.
Zaventem, 20 April 2023
KPMG Bedrijfsrevisoren - Réviseurs d’Entreprises
Statutory Auditor represented by
Filip De Bock Bedrijfsrevisor / Réviseur d’Entreprises
What’s Cooking? Annual report 2022 145 Consolidated financial statements
Contact information
Ter Beke NV
Beke 1 - B-9950 Lievegem
RPR Gent 0421.364.139
+32 9 370 12 11
E-mail: info@terbeke.be
Website: www.whatscooking.group
Davai BV
Stationstraat 114 – 9260 Wichelen
RPR Gent 0735.338.390
Ready meals
Freshmeals NV
Beke 1 - B-9950 Lievegem RPR Gent 0884.649.304
Les Nutons SA
Chaussée de Wavre 259a - B-4520 Wanze
RPM Huy 0442.475.396
Operating office : 5 Chemin Saint-Antoine, 6900 Marche-en-Famenne
Come a Casa SA
Chaussée de Wavre 259a - B-4520 Wanze
RPM Huy 0446.434.778
Ter Beke France SA
ZI Espace Zuckermann BP 56
F-14270 Mézidon-Vallée d’Auge
Registre de commerce Lisieux 322 304 197
FreshMeals Ibérica S.L.
Vía de las Dos Castillas 33
Complejo Empresarial Ática
Edificio 6, planta 3a, Officina B1
E-28224 Pozuelo de Alarcón (Madrid) ES B 82656521
FreshMeals Nederland BV
Bijsterhuizen 24/04 - NL-6604 LL Wijchen kvk Utrecht 200.53.817
Pasta Food Company Sp. z.o.o.
Ul. Północna 12 PL - 45-805 Opole KRS 0000403908
Stefano Toselli SAS
ZI Espace Zuckermann BP 56
F-14270 Mézidon-Vallée d’Auge
Registre de commerce Lisieux 322 304 197
KK Fine Foods Ltd
Estuary House 10th Avenue Zone 3 Deeside Industrial Park Deeside Flintshire CH5 2UA United Kingdom Company House 02077911
FreshMeals Deutschland GmbH
Krefelder Strasse 24941066 Mönchengladbach Deutschland HRB Krefeld 16709
Savoury
Terbeke-Pluma NV
Antoon Van der Pluymstraat 1 - B-2160 Wommelgem RPR Antwerpen 0475.089.271
Pluma NV
Antoon Van der Pluymstraat 1 - B-2160 Wommelgem RPR Antwerpen 0404.057.854
Terbeke-Pluma Nederland BV
Bijsterhuizen 24/04 - NL-6604 LL Wijchen kvk Amsterdam 18024675
Ter Beke Vleeswarenproduktie NV
Beke 1 - B-9950 Lievegem RPR Gent 0406.175.424
Cooking? Annual report 2022 146
What’s
Contact information
Heku NV
Ondernemingenstraat 1 - B-8630 Veurne RPR Veurne 0436.749.725
Ter Beke Immo NV
Beke 1 - B-9950 Lievegem RPR Gent 0413.756.072
Berkhout Langeveld BV
Bijsterhuizen 24/04 - NL-6604 LL Wijchen kvk Limburg Noord 12032497
Langeveld/Sleegers BV
Bijsterhuizen 24/04 - NL-6604 LL Wijchen kvk Limburg Noord 12036519
H.J. Berkhout Verssnijlijn BV
Scheepmakerstraat 5 - NL-2984 BE Ridderkerk kvk Rotterdam 24140598
Terbeke-Pluma UK Ltd
Dixcart House Addlestone Road - Bourne Business Park Addlestone KT15 2LE - Surrey - United Kingdom
Pluma Fleischwarenvertrieb GmbH Krefelder Strasse 249 – D-41006 Mönchengladbach
Offerman Borculo BV
Parallelweg 21 - NL-7271 VB Borculo kvk 06039901
Offerman Aalsmeer BV
Turfstekerstraat 47 - NL-1431 GD Aalsmeer kvk 34053874
What’s Cooking? Annual report 2022 147
117
5830
1047
DE 123 114 501
/
/
-
Contact information
Copywriting: Ter Beke NV
Translation: Ter Beke NV
Concept and Layout: Ter Beke NV
Responsible Editor: Ter Beke NV
Photography Portraits: Bas Bogaerts
Other images: Ter Beke NV
The Dutch-language IXBRL version of this annual report is the official version.
We thank all our employees for their commitment and dynamism. We achieve these results thanks to them. They also give us full confidence in the future.
What’s Cooking? Annual report 2022 148
Colofon
